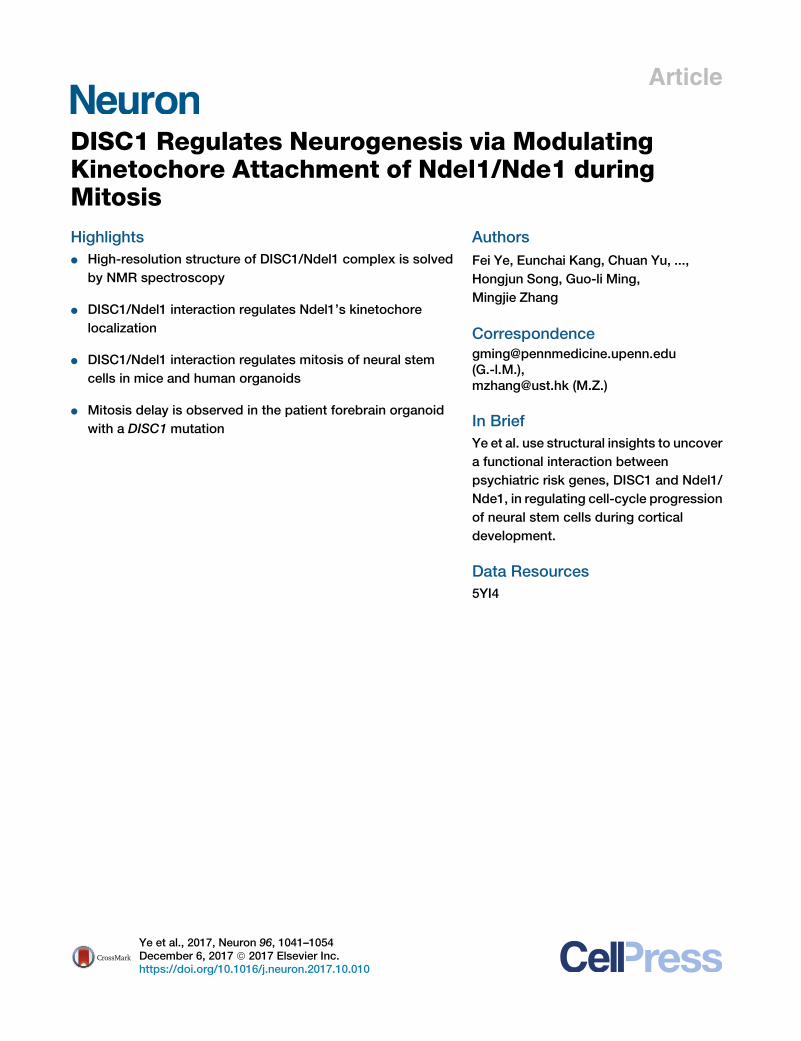
Article DISC1 Regulates Neurogenesis via Modulating Kinetochore Attachment of Ndel1/Nde1 during Mitosis Highlights d High-resolution structure of DISC1/Ndel1 complex is solved by NMR spectroscopy d DISC1/Ndel1 interaction regulates Ndel1’s kinetochore localization d DISC1/Ndel1 interaction regulates mitosis of neural stem cells in mice and human organoids d Mitosis delay is observed in the patient forebrain organoid with a DISC1 mutation Authors Fei Ye, Eunchai Kang, Chuan Yu, ..., Hongjun Song, Guo-li Ming, Mingjie Zhang Correspondence [email protected] (G.-l.M.), [email protected] (M.Z.) In Brief Ye et al. use structural insights to uncover a functional interaction between psychiatric risk genes, DISC1 and Ndel1/ Nde1, in regulating cell-cycle progression of neural stem cells during cortical development. Data Resources 5YI4 Ye et al., 2017, Neuron 96, 1041–1054 December 6, 2017 ª 2017 Elsevier Inc. https://doi.org/10.1016/j.neuron.2017.10.010

Welcome message from author
This document is posted to help you gain knowledge. Please leave a comment to let me know what you think about it! Share it to your friends and learn new things together.
Transcript
Article
DISC1 Regulates Neuroge
nesis via ModulatingKinetochore Attachment of Ndel1/Nde1 duringMitosisHighlights
d High-resolution structure of DISC1/Ndel1 complex is solved
by NMR spectroscopy
d DISC1/Ndel1 interaction regulates Ndel1’s kinetochore
localization
d DISC1/Ndel1 interaction regulates mitosis of neural stem
cells in mice and human organoids
d Mitosis delay is observed in the patient forebrain organoid
with a DISC1 mutation
Ye et al., 2017, Neuron 96, 1041–1054December 6, 2017 ª 2017 Elsevier Inc.https://doi.org/10.1016/j.neuron.2017.10.010
Authors
Fei Ye, Eunchai Kang, Chuan Yu, ...,
Hongjun Song, Guo-li Ming,
Mingjie Zhang
Correspondence
[email protected](G.-l.M.),[email protected] (M.Z.)In Brief
Ye et al. use structural insights to uncover
a functional interaction between
psychiatric risk genes, DISC1 and Ndel1/
Nde1, in regulating cell-cycle progression
of neural stem cells during cortical
development.
Data Resources
5YI4
Neuron
Article
DISC1 Regulates Neurogenesisvia Modulating Kinetochore Attachmentof Ndel1/Nde1 during MitosisFei Ye,1,2,9 Eunchai Kang,3,6,9 Chuan Yu,1 Xuyu Qian,4,6 Fadi Jacob,5,6 Cong Yu,1,10 Mao Mao,1 Randy Y.C. Poon,1
Jieun Kim,3 Hongjun Song,3,4,5,6,7,8 Guo-li Ming,3,5,6,7,* and Mingjie Zhang1,2,11,*1Division of Life Science, State Key Laboratory of Molecular Neuroscience2Center of Systems Biology and Human HealthHong Kong University of Science and Technology, Clear Water Bay, Kowloon, Hong Kong, China3Institute for Cell Engineering4Biomedical Engineering Graduate Program5The Solomon H. Snyder Department of NeuroscienceJohns Hopkins University School of Medicine, Baltimore, MD 21205, USA6Department of Neuroscience and Mahoney Institute for Neurosciences7Institute for Regenerative Medicine8The Epigenetics InstitutePerelman School for Medicine, University of Pennsylvania, Philadelphia, PA 19104, USA9These authors contributed equally10Present address: Department of Biology, Southern University of Science and Technology, Shenzhen, China11Lead Contact*Correspondence: [email protected] (G.-l.M.), [email protected] (M.Z.)
https://doi.org/10.1016/j.neuron.2017.10.010
SUMMARY
Mutations of DISC1 (disrupted-in-schizophrenia 1)have been associated with major psychiatric disor-ders.Despite thehundredsofDISC1-bindingproteinsreported, almost nothing is known about how DISC1interactswith other proteins structurally to impact hu-manbrain development. Herewe solved the high-res-olution structure of DISC1 C-terminal tail in complexwith its binding domain of Ndel1. Mechanistically,DISC1 regulates Ndel1’s kinetochore attachment,but not its centrosome localization, during mitosis.Functionally, disrupting DISC1/Ndel1 complex for-mation prolongs mitotic length and interferes withcell-cycle progression in human cells, and it causescell-cycle deficits of radial glial cells in the embryonicmouse cortex and human forebrain organoids. Wealso observed similar deficits in organoids derivedfrom schizophrenia patient induced pluripotent stemcells (iPSCs) with a DISC1 mutation that disrupts itsinteraction with Ndel1. Our study uncovers a newmechanismof action forDISC1basedon its structure,and it has implications for how genetic insults maycontribute to psychiatric disorders.
INTRODUCTION
DISC1 (disrupted-in-schizophrenia 1), originally identified in a
large Scottish family suffering from multiple psychiatric disor-
Ne
ders due to a chromosomal translocation-induced disruption
(Blackwood et al., 2001), has been established as a genetic
risk factor for a wide array of psychiatric disorders, including
schizophrenia, bipolar disorder, major depression, and autism
spectrum disorders (Thomson et al., 2013). Over 200 different
proteins with very diverse functions have been reported to
interact with DISC1 (Camargo et al., 2007; Soares et al.,
2011), although the physiological relevance of most of these
protein interactions remains to be verified. Proteins including
Ndel1/Nde1, GSK3b, PDE4, FEZ1, ATF4, Kal-7, and Girdin/
KIAA1212 are among several functionally well-characterized
DISC1-binding partners that are known to play critical roles in
neurodevelopment and neuronal signaling in rodent systems
(Duan et al., 2007; Enomoto et al., 2009; Hayashi-Takagi et al.,
2010; Kang et al., 2011; Kim et al., 2009; Mao et al., 2009;
Millar et al., 2005; Soda et al., 2013; Wang et al., 2011).
Interestingly, Ndel1/Nde1, PDE4, and GSK3b have been inde-
pendently identified as genetic risk factors of mental disorders
(Blasi et al., 2013; Fatemi et al., 2008; Nicodemus et al.,
2010). Thus, DISC1 is hypothesized to function as a major
hub protein at the crossroads of neurodevelopment, neuronal
signaling, and neurological disorders (Brandon and Sawa,
2011; Ming and Song, 2009; Porteous et al., 2011; Thomson
et al., 2013).
Unmatched to the wealth of functional and pathological data
on DISC1, biochemical and structural characterizations of
DISC1 and its interactions with target proteins are very scarce.
No single atomic structure of DISC1 or any of its fragments,
either alone or in complex with target proteins, is available.
Accordingly, action mechanisms underlying DISC1’s function
in brain development and DISC1 mutation-related psychiatric
disorders are poorly understood. The reported number of
uron 96, 1041–1054, December 6, 2017 ª 2017 Elsevier Inc. 1041
A
D
B
E
C
1 345
Ndel1
DISC1
NLS SF-rich
C-terminal helical regionN-terminal disordered region
CC
(1; 11) (q42; q14.3) translocation
284238
t he conservationscale 1 2 3 4 5 6 7 8 9
Variable Average Conserved
K =40±6nMd
0.0 1.0 2.0-24.00
-16.00
-8.00
0.00-1.60
-1.20
-0.80
-0.40
0.00
0 10 20 30 40 50 60Time (min)
μcal
/sec
Molar Ratio
-1kc
al m
ol
of i
njec
tant
DISC1
Nde1CC CC
CCCCCCCCCCCCCCCCCCCCCCCCCCCCCCCCCCCCCCCCCCCCCCCCCCCCCCCCCCCCCCCCCCCCCCC
CC
60DISC1 765-835Ndel1 CT-CC1:1 mixture
22.6kDa
17.6kDa
28.9kDa
9 10 11 12 13 14 15
0.0
0.2
0.4
0.6
0.8
1.0
10
20
30
40
50
UV
Rel
ativ
e S
cale
Volume(ml)
3M
olar mass (1 0
g/mol)
80kDa58kDa
GFP-Ndel1
input
trx-F
lag
trx-F
lag-DIS
C1 322-722
trx-F
lag-DIS
C1 322-852
IB: GFP
trx-D
ISC1 3
22-852-Flag
CC
F
DISC1 Nde1 /Ndel1 K (nM)d
CCCCCCCCCCCCCCCCCCCCCCCCCCCCCCCCCCCCCCCC
protein TheoreticalMW (kDa)
MeasuredMW (kDa)
DISC1 10.0 17.6 dimer
Ndel1 19.4 22.6 monomer
mixture 28.9
CCCCCCCCCCCCCCCCCCCCCCCCCCCCCCCCCCCC CCCCCCCCCCCCCCCCCCCCCCCCCCCCCCCCCCCCC
CC
CCCCCCCCCCCCCCCCCCCCCCCCCCCCCCCCCCCCCC CC
K =17±3nMd
0.0 1.0 2.0
-16.00
-12.00
-8.00
-4.00
0.00-1.60
-1.20
-0.80
-0.40
0.000 10 20 30 40 50 60
Time (min)
Molar Ratio
DISC1
Nde1CC
CCCCCCCCCCCCCCCCCCCCCCCCCCCCCCCCCCCCCCCCCCCCCC
D1
D2
D3
D4
1 322 722 765 852
CC CC
CC
CC
322 852 1CCCCCCCCCCCCCCCCCCCCCCCCCCCCCCCCCCCCCCCCCCCCCCCCCCCCCCCCCCCCCC 335* 40 ± 6
CCCCCCCCCCCCCCCCCCCCCCCCCCCCCCCCCCCCCCCCCCCCCCCCCCCCCCCCCC322 852 238 284
238 284765 835 35 ± 6
CC CC
CC CCCCCCCCCCCCCCCCCCCCCCCCCCCCCCCCCCCCCCCCCCC765 835
322 722 1 335*
1 335* 38 ± 6
15 ± 2
CCCCCCCCCCCCCCCCCCCCCCCCCCCCCCCCCCCCCCCCCCCCCCCCCCCCCCCCCCCCC322 852 CC239 286* 18 ± 2
n.d.
CCCCCCCCCCCCCCCCCCCCCCCCCCCCCCCCCCCCCCCCCCCCCCCCCCCCCCCCCCCC322 852 1 193 n.d.
CC239 286*CCCCCCCCCCCCCCCCCCCCCCCCCCCCCCCCCCCCCCCC765 835 17 ± 3
193
CC CC
4 bp deletion
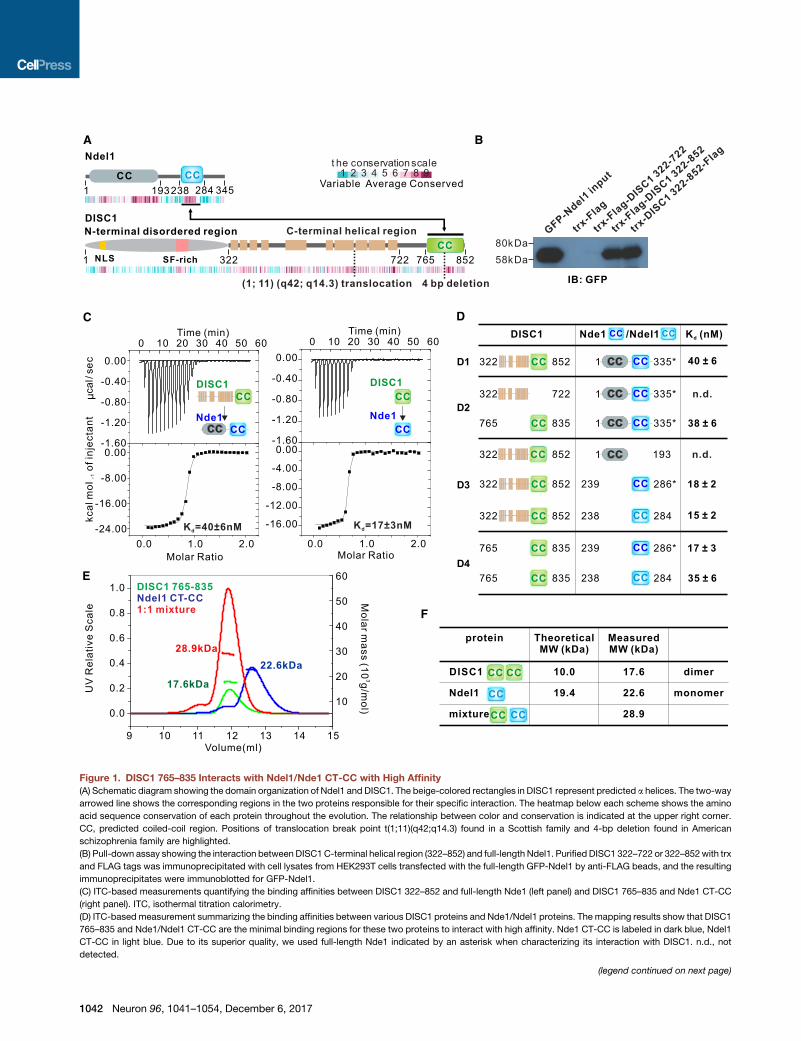
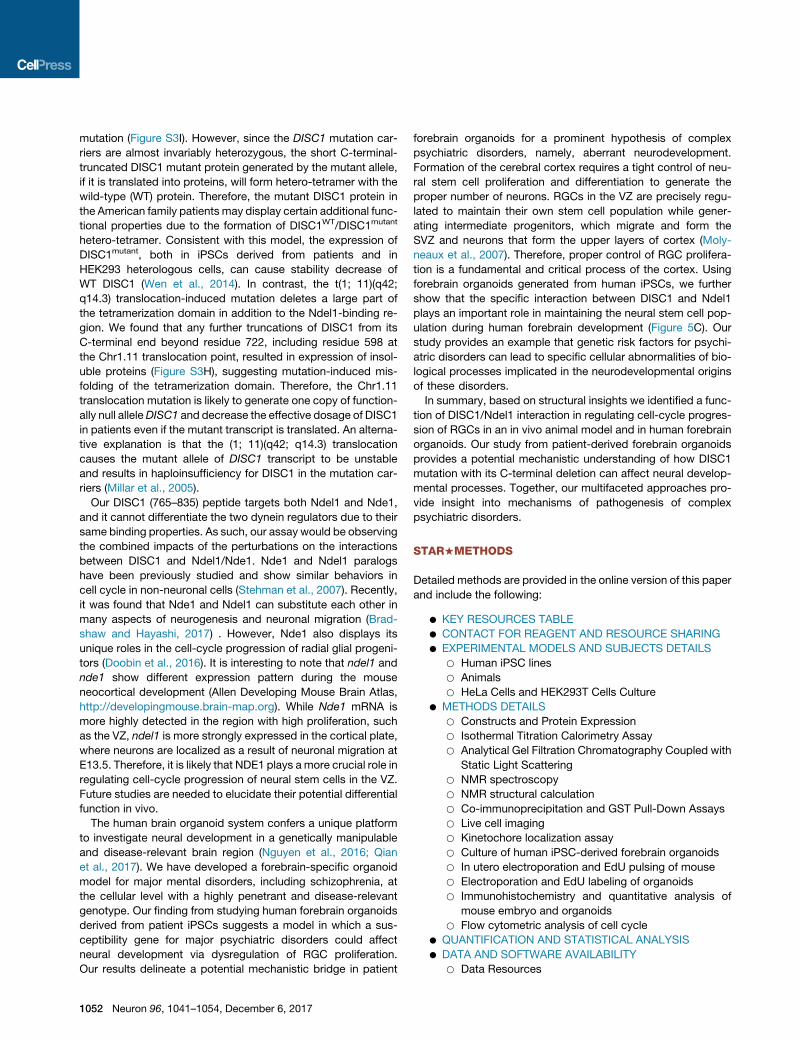
Figure 1. DISC1 765–835 Interacts with Ndel1/Nde1 CT-CC with High Affinity
(A) Schematic diagram showing the domain organization of Ndel1 and DISC1. The beige-colored rectangles in DISC1 represent predicted a helices. The two-way
arrowed line shows the corresponding regions in the two proteins responsible for their specific interaction. The heatmap below each scheme shows the amino
acid sequence conservation of each protein throughout the evolution. The relationship between color and conservation is indicated at the upper right corner.
CC, predicted coiled-coil region. Positions of translocation break point t(1;11)(q42;q14.3) found in a Scottish family and 4-bp deletion found in American
schizophrenia family are highlighted.
(B) Pull-down assay showing the interaction between DISC1C-terminal helical region (322–852) and full-length Ndel1. Purified DISC1 322–722 or 322–852with trx
and FLAG tags was immunoprecipitated with cell lysates from HEK293T cells transfected with the full-length GFP-Ndel1 by anti-FLAG beads, and the resulting
immunoprecipitates were immunoblotted for GFP-Ndel1.
(C) ITC-based measurements quantifying the binding affinities between DISC1 322–852 and full-length Nde1 (left panel) and DISC1 765–835 and Nde1 CT-CC
(right panel). ITC, isothermal titration calorimetry.
(D) ITC-based measurement summarizing the binding affinities between various DISC1 proteins and Nde1/Ndel1 proteins. The mapping results show that DISC1
765–835 and Nde1/Ndel1 CT-CC are the minimal binding regions for these two proteins to interact with high affinity. Nde1 CT-CC is labeled in dark blue, Ndel1
CT-CC in light blue. Due to its superior quality, we used full-length Nde1 indicated by an asterisk when characterizing its interaction with DISC1. n.d., not
detected.
(legend continued on next page)
1042 Neuron 96, 1041–1054, December 6, 2017
DISC1-binding proteins is very large, and many of these proteins
co-exist in the same cellular compartments in high abundance.
Therefore, it is difficult to understand how the limited amount
of DISC1 can possibly be distributed among such an enormous
array of reported binding proteins and impact their functions in
the cell.
Ndel1/Nde1, a modulatory component of the dynein complex
(Vallee et al., 2012), is one of numerous reported DISC1-binding
targets (Brandon et al., 2004). A short C-terminal fragment of
DISC1 was identified to be required for Ndel1 binding (Kamiya
et al., 2006). The t(1; 11)(q42; q14.3) translocation mutation of
DISC1, which causes DISC1 C-terminal truncation (deletion of
residues 598–854 in humans and residues 595–852 in mice; Fig-
ures 1A and S1), disrupts its binding to Ndel1/Nde1 (Brandon
et al., 2004). Mutations of Nde1 are known to cause micro-
cephaly both in mice and in humans (Alkuraya et al., 2011;
Bakircioglu et al., 2011; Feng and Walsh, 2004). Ndel1 has
been shown to epistatically associate with DISC1 in psychiatric
disorders (Burdick et al., 2008; Nicodemus et al., 2010). Com-
plete removal of Ndel1 is embryonically lethal in mice (Sasaki
et al., 2005), although how it may regulate human brain develop-
ment remains to be determined. Elucidation of cellular functions
of the interaction between DISC1 and Ndel1/Nde1 in brain
development has been difficult, as DISC1 may interact with
numerous target proteins other than Ndel1/Nde1. Similarly,
Ndel1 and Nde1 are also scaffold proteins that can interact
with several subunits of the cytoplasmic dynein complex,
including the dynein heavy chain and Lis1 (Niethammer et al.,
2000; Sasaki et al., 2000; Shu et al., 2004). Thus, results derived
from loss-of-function approaches on either of DISC1 or Ndel1/
Nde1 can be difficult to interpret due to potential compound
effects.
Here we demonstrate that Ndel1/Nde1 binds to a short,
extreme C-terminal fragment of DISC1 with very high specificity
and affinity. We reveal themolecular basis governing the specific
interaction via solving the atomic structure of this DISC1C-termi-
nal fragment in complex with its binding sequence of Ndel1/
Nde1. The structure of the complex between DISC1 and
Ndel1/Nde1 allowed us to design a method to specifically inves-
tigate functions of the interaction between DISC1 and Ndel1/
Nde1 in vivo without interfering with Ndel1/Nde1-mediated
dynein complex functions and with minimal obstructing of
DISC1 binding to other partners. Using this new method, we
investigated the role of the interaction between DISC1 and
Ndel1/Nde1 in regulating cell cycle in human cells in vitro, in
radial glial neural stem cells in the embryonic mouse cortex
in vivo, and in human forebrain organoids (Qian et al., 2016). In
addition, we explored the potential role of this interaction in the
context of human psychiatric disorders using patient-derived
brain organoids with a specific DISC1 mutation (Chiang et al.,
2011). Together, these multifaceted approaches unravel a novel
mechanism of action by DISC1, and they provide insight into the
pathogenesis of psychiatric disorders.
(E and F) Analytical gel filtration chromatography analysis coupled with static ligh
line), and DISC1 765–835/trx-Ndel1 CT-CC complex (red line). The theoretical an
765–835 and Ndel1 CT-CC form a stable 1:1 complex in solution.
See also Figures S1 and S2.
RESULTS
Ndel1/Nde1 Binds to a Short C-terminal Tail of DISC1with a High AffinityTo characterize the property of the interaction between DISC1
and Ndel1/Nde1, we first performed a series of detailed
biochemical studies. Using pull-down assay and isothermal
titration calorimetry (ITC) analysis, we found that a conforma-
tional-homogeneous DISC1 fragment lacking the predicted un-
structured N-terminal region (amino acid [aa] 1–321; Figure 1A)
binds to the full-length Nde1 (FL-Nde1) at a 1:1 stoichiometry
and with a very high affinity (Kd �40 nM; Figures 1B–1D1).
Further mappings by ITC analyses revealed that a short, pre-
dicted coiled-coil region of Nde1 (aa 239–286, termed ‘‘Nde1
CT-CC’’) is both necessary and sufficient for DISC1 binding (Fig-
ures 1C, 1D3, and S1C3). The DISC1 C-terminal helical region is
predicted to contain a separate coiled-coil region (residue 765–
835) that is connected to the upstream helical region with a
flexible and variable linker (Figure 1A). Notably, this DISC1 C-ter-
minal region (aa 765–835) was sufficient for binding to both FL-
Nde1 and Nde1 CT-CC (Figures 1C, 1D2, and S1C2; we used
Nde1 here because FL-Nde1 behaves better for quantitative
biochemical studies than Ndel1 does). Additionally, the middle
helical region of DISC1 (aa 322–722) had no detectable binding
to Nde1 (Figures 1B, 1D2, and S1C2). These ITC data indicated
that DISC1 765–835 is solely responsible for binding toNde1.We
also characterized DISC1’s interaction with Ndel1, a paralog of
Nde1. We found that Ndel1 CT-CC (aa 238–284) and Nde1 CT-
CC share similar DISC1 affinities (Figures 1D3 and 4 and S1C3
and 4), a result that is consistent with the very high amino acid
sequence identity of the two proteins (Figure S1B). Given that
Ndel1 and Nde1 share essentially the identical DISC1-binding
property, we refer to Ndel1/Nde1 as Ndel1 from here on for
simplicity, unless specified otherwise. Gel filtration chromatog-
raphy analysis revealed that DISC1 765–835 itself can form a
weak homodimer and Ndel1 CT-CC is a monomer. When mixed,
DISC1 765–835 and Ndel1 CT-CC could interact with each other
and formed a stable heterodimer (Figures 1E, 1F, S2A, and S2B).
Our mapping data also indicated that both DISC1 765–835
and Ndel1 CT-CC function as independent structural units in
the context of their respective full-length proteins (Figure 1D).
We performed additional biochemical experiments to further
support this conclusion, which is important for our functional
studies of the DISC1/Ndel1 complex via targeting these specific
regions. The purified DISC1 322–852 adopted a highly homoge-
neous tetramer (Figures S3A and S3D). Deletion of the fragment
comprising 723–852, which includes the entire Ndel1-binding re-
gion of the protein, did not alter the tetramer structure as well as
the stability of DISC1 (Figures S3A and S3D), indicating that the
C-terminal fragment containing residues 723–852 of DISC1 is
not structurally coupled with the central tetramerization region
of DISC1. The circular dichroism spectrum-based urea denatur-
ation profiles of DISC1 322–852 and 322–722 were highly similar
t scattering analysis (E) of DISC1 765–835 (green line), trx-Ndel1 CT-CC (blue
d measured molecular weights are listed in (F). The results indicate that DISC1
Neuron 96, 1041–1054, December 6, 2017 1043
F276
DISC1765-835
Ndel1CT-CC K (μM)d
WT WT 0.035 ± 0.006L822Q WT not detectedL789Q WT 4.9 ± 0.3
WT L266Q 0.86 0.05±WT L259Q & L266Q 13 ± 4
N’C’
V774
V778C782I785L789
L792E793L796
M800A799
L829
M825I826
L822V818L815
L811F808L807
A252V256
A248
I255L259 L260
K262
K269C273
V263L266
L270R274
N’
C’
N C
N’
DISC1
Ndel1
C’
Ndel1
DISC1
N C
N’
C’
Ndel1
DISC1
N’
C’
N CA
F
CB
E
G
I
D
the
cons
erva
tion
scal
e 1
2 3
4 5
6 7
8 9
Va
ria b
l e
Ave
rage
C
o ns e
rve d
N’
C’
N’
C’
N’
C’
A784H791G798
DISC1α1
cg
d
ae
b
fDISC1α2
cg
d
a e
b
f
Ndel1
ad
g
cf
b
e
E780V787D794Y801
E783L790L797
G779G786E793M800
I255K262K269F276
D258A265A272 N254
R261S268
G257G264A271
L253L260E267R274
A252L259L266C273
V778I785L792A799
M825V818L811
V256V263L270
C782L789L796
K781K788Q795
Q828T821E814L807
P831A824T817S810 L827
E820G813
Q830Q823Q816Q809
I826K819Q812
L829L822L815F808
J
5% input IP: Flag
195100584632
IB: GFP
IB: Flag*
GFP-DISC1
Flag-Ndel1
GFP-DISC1 GFP-DISC1 L822Q
Flag-Ndel1 - - + + - - + + - - + +
- - + + - - + + - - + +
FP
ag
kDa
DISC1 Ndel1
0.0 0.5 1.0 1.5 2.0
-0.50
-0.40
-0.30
-1.20
-0.80
-0.40
0.00
0 10 20 30 40 50 60Time (min)
Molar Ratio
L822Q
not detectable0.0 0.5 1.0 1.5 2.0
-16.00-12.00-8.00-4.000.00
-1.20
-0.80
-0.40
0.00
0 10 20 30 40 50 60Time (min)
Molar Ratio
Kd=35±6nM
-1kc
al m
ol
of i
njec
tant
μcal
/ se c
DISC1
Ndel1CC
CCCCCCCCCCCCCCCCCCCCCCCCCCCCCCCCCCCCCCCCCCCCCCCCCDISC1
Ndel1CC
CCCCCCCCCCCCCCCCCCCCCCCCCCCCCCCCCCCCCCCCCCCCCCC
H
(legend on next page)
1044 Neuron 96, 1041–1054, December 6, 2017
(Figures S3E and S3F), indicating similar structure for these two
fragments. The nuclear magnetic resonance (NMR) spectra of15N-labeled DISC1 728–852 also revealed that this fragment is
largely unstructured in solution (Figure S3G). The full-length
Ndel1 formed a stable dimer in solution, and truncation of the
C-terminal half of the protein (aa 194–345) did not alter the dimer-
ization property of Ndel1 (Figures S3B–S3D), supporting an
earlier structural study showing that the N-terminal half of
Ndel1 forms a coiled-coil dimer and the C-terminal half of the
protein is largely unstructured (Derewenda et al., 2007).
Together, these results demonstrate that both interacting re-
gions of DISC1 (aa 765–852) andNdel1 (CT-CC) are independent
structural units in each proteins, and they interact with each
other to form a highly specific and stoichiometric complex
(Figure S3I).
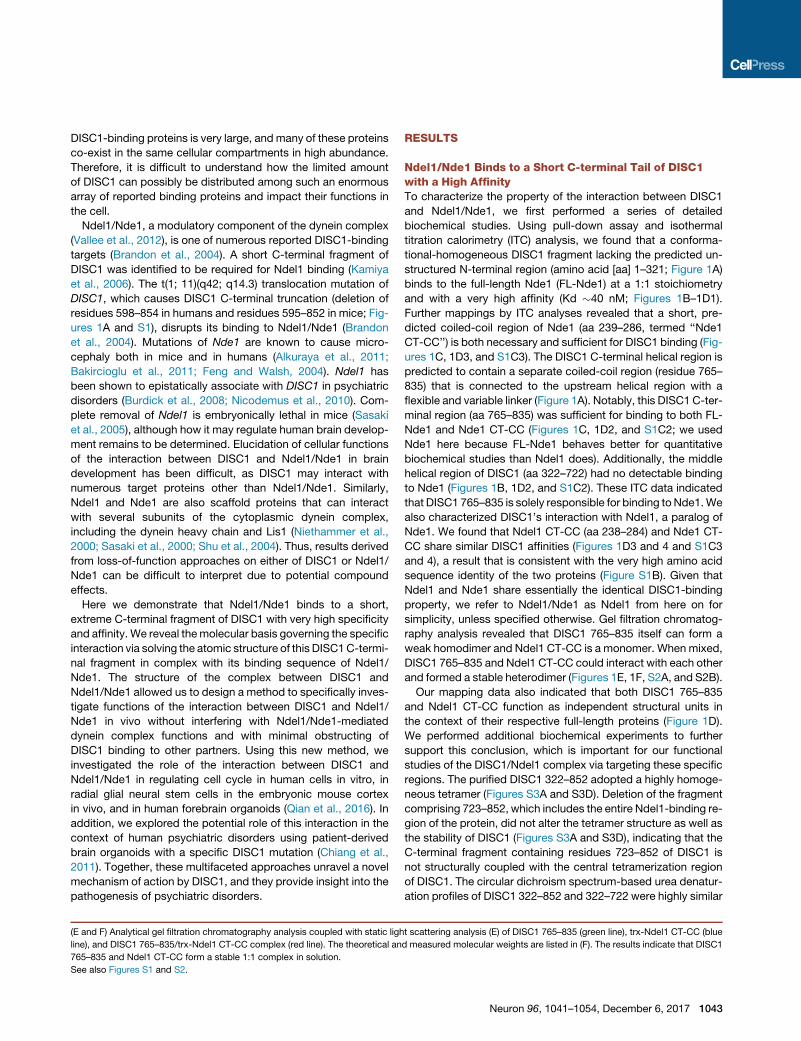
High-Resolution Solution Structure of the DISC1/Ndel1ComplexWe next determined the high-resolution complex structure of
DISC1 765–852/Ndel1 CT-CC by NMR spectroscopy (Figures
S2C and S2E; Table S1). Structural determination of the DISC1
765–835/Ndel1 CT-CC was aided by fusing Ndel1 CT-CC to
the C-terminal end of DISC1 765–852 with a thrombin cleavable
linker. The use of the single-chain fusion protein allowed us
to skip isotope-filtered experiments for identifying inter-molecu-
lar nuclear Overhauser enhancement (nOe) signals between
DISC1 and Ndel1 and, thus, simplified the structural determina-
tion. The structure of the single-chain protein was determined to
a high precision due to very high qualities of NMR spectra and,
thus, a large number of structural restraints obtained (�25 re-
straints/residue in the structured regions; Table S1). The cova-
lent fusion of DISC1 with Ndel1 CT-CC did not alter the structure
of the complex, as the NMR spectra of the fusion protein with
andwithout thrombin cleavage overlapped almost perfectly (Fig-
ure S2D). In the complex, DISC1 765–835 contained two helices
that formed an antiparallel hairpin, and Ndel1 CT-CC adopted a
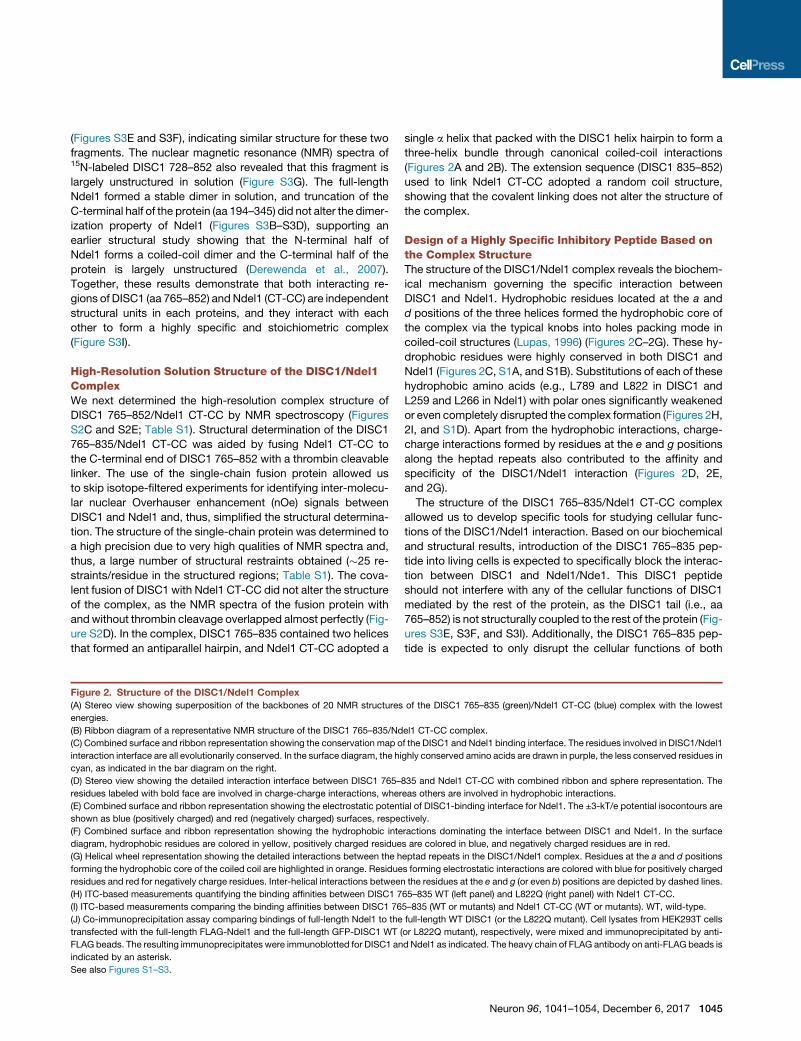
Figure 2. Structure of the DISC1/Ndel1 Complex
(A) Stereo view showing superposition of the backbones of 20 NMR structures
energies.
(B) Ribbon diagram of a representative NMR structure of the DISC1 765–835/Nd
(C) Combined surface and ribbon representation showing the conservation map o
interaction interface are all evolutionarily conserved. In the surface diagram, the hi
cyan, as indicated in the bar diagram on the right.
(D) Stereo view showing the detailed interaction interface between DISC1 765–
residues labeled with bold face are involved in charge-charge interactions, wher
(E) Combined surface and ribbon representation showing the electrostatic potent
shown as blue (positively charged) and red (negatively charged) surfaces, respe
(F) Combined surface and ribbon representation showing the hydrophobic inte
diagram, hydrophobic residues are colored in yellow, positively charged residue
(G) Helical wheel representation showing the detailed interactions between the h
forming the hydrophobic core of the coiled coil are highlighted in orange. Residue
residues and red for negatively charge residues. Inter-helical interactions betwee
(H) ITC-based measurements quantifying the binding affinities between DISC1 7
(I) ITC-based measurements comparing the binding affinities between DISC1 76
(J) Co-immunoprecipitation assay comparing bindings of full-length Ndel1 to the
transfected with the full-length FLAG-Ndel1 and the full-length GFP-DISC1 WT (
FLAG beads. The resulting immunoprecipitates were immunoblotted for DISC1 an
indicated by an asterisk.
See also Figures S1–S3.
single a helix that packed with the DISC1 helix hairpin to form a
three-helix bundle through canonical coiled-coil interactions
(Figures 2A and 2B). The extension sequence (DISC1 835–852)
used to link Ndel1 CT-CC adopted a random coil structure,
showing that the covalent linking does not alter the structure of
the complex.
Design of a Highly Specific Inhibitory Peptide Based onthe Complex StructureThe structure of the DISC1/Ndel1 complex reveals the biochem-
ical mechanism governing the specific interaction between
DISC1 and Ndel1. Hydrophobic residues located at the a and
d positions of the three helices formed the hydrophobic core of
the complex via the typical knobs into holes packing mode in
coiled-coil structures (Lupas, 1996) (Figures 2C–2G). These hy-
drophobic residues were highly conserved in both DISC1 and
Ndel1 (Figures 2C, S1A, and S1B). Substitutions of each of these
hydrophobic amino acids (e.g., L789 and L822 in DISC1 and
L259 and L266 in Ndel1) with polar ones significantly weakened
or even completely disrupted the complex formation (Figures 2H,
2I, and S1D). Apart from the hydrophobic interactions, charge-
charge interactions formed by residues at the e and g positions
along the heptad repeats also contributed to the affinity and
specificity of the DISC1/Ndel1 interaction (Figures 2D, 2E,
and 2G).
The structure of the DISC1 765–835/Ndel1 CT-CC complex
allowed us to develop specific tools for studying cellular func-
tions of the DISC1/Ndel1 interaction. Based on our biochemical
and structural results, introduction of the DISC1 765–835 pep-
tide into living cells is expected to specifically block the interac-
tion between DISC1 and Ndel1/Nde1. This DISC1 peptide
should not interfere with any of the cellular functions of DISC1
mediated by the rest of the protein, as the DISC1 tail (i.e., aa
765–852) is not structurally coupled to the rest of the protein (Fig-
ures S3E, S3F, and S3I). Additionally, the DISC1 765–835 pep-
tide is expected to only disrupt the cellular functions of both
of the DISC1 765–835 (green)/Ndel1 CT-CC (blue) complex with the lowest
el1 CT-CC complex.
f the DISC1 and Ndel1 binding interface. The residues involved in DISC1/Ndel1
ghly conserved amino acids are drawn in purple, the less conserved residues in
835 and Ndel1 CT-CC with combined ribbon and sphere representation. The
eas others are involved in hydrophobic interactions.
ial of DISC1-binding interface for Ndel1. The ±3-kT/e potential isocontours are
ctively.
ractions dominating the interface between DISC1 and Ndel1. In the surface
s are colored in blue, and negatively charged residues are in red.
eptad repeats in the DISC1/Ndel1 complex. Residues at the a and d positions
s forming electrostatic interactions are colored with blue for positively charged
n the residues at the e and g (or even b) positions are depicted by dashed lines.
65–835 WT (left panel) and L822Q (right panel) with Ndel1 CT-CC.
5–835 (WT or mutants) and Ndel1 CT-CC (WT or mutants). WT, wild-type.
full-length WT DISC1 (or the L822Q mutant). Cell lysates from HEK293T cells
or L822Q mutant), respectively, were mixed and immunoprecipitated by anti-
d Ndel1 as indicated. The heavy chain of FLAG antibody on anti-FLAG beads is
Neuron 96, 1041–1054, December 6, 2017 1045
GFP GSK3β FL
Trx Flag Trx Flag DISC1
203-321His DISC1
765-835
+ + ++ - -- +- - +
+
+ + ++ - -- +- - +
+
GFP GSK3beta FL IB: GFP
Trx Flag
Trx Flag DISC1203-321
His DISC1765-835
1/10 input IP: Flag8058
E F GFP Lis1 FLGFP DISC1
765-835Flag Ndel1
1/35 input IP: Flag
+ + +- - +- + +
+ + +- - +- + +
IB: G
FP
IB: Flag
GFP Lis1 FL
Flag Ndel1 FL
GFP DISC1765-835
80
32
46
kDakDa
32
17
11
A B
Interphase Mitosis
mitosis durationpro to ana pro to meta meta to ana
C DGFP-DISC1
GFP-DISC1-L822QGFP
0 700 1400
0
25
50
75
100
0 200 400 600 8000
25
50
75
100
0
25
50
75
100
0 20 40 60 0 200 400 600
ns
GFP-DISC1L822Q (n=133)
****
****GFP(n=177)GFP-DISC1(n=128) ns
GFP-DISC1L822Q (n=133)
****
****GFP(n=177)GFP-DISC1(n=128)ns
GFP-DISC1L822Q (n=133)
ns
nsGFP(n=177)GFP-DISC1(n=128)
RF
P
RFP BubR1 GFP-Ndel1 DAPI Merge
RF
P-
DIS
C1-
L822
QR
FP
-D
ISC
1
G
RF
P
RFP Hec1 DAPI Merge
RF
P-
DIS
C1
RF
P-
DIS
C1-
L822
Q
H
RFP RFP- DISC1
RFP-DISC1- L822Q
0
50
100
0
50
100
RFP RFP- DISC1
RFP-DISC1- L822Q
26 3747
31 3536
endo. Ndel1
Cum
ulat
ive
dist
ribut
ion
(%)
Cum
ulat
ive
dist
ribut
ion
(%)
Cum
ulat
ive
dist
ribut
ion
(%)
Time (min) Time (min) Time (min)
GFP
-Nde
l1
kine
toch
ore
loca
lizat
ion
(%)
End
ogen
ous
Nde
l1
kine
toch
ore
loca
lizat
ion
(%)
0 700 1400 0 700 1400
Interphase after normal mitosisMultiploar division
Time (min)
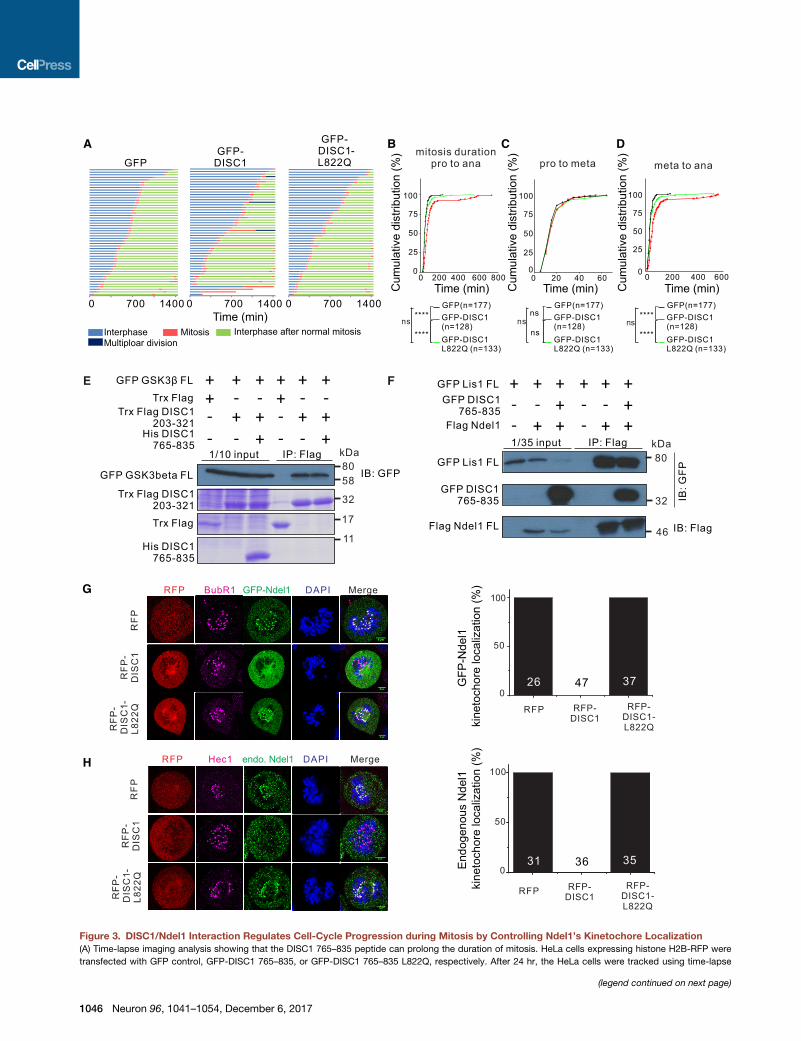
Figure 3. DISC1/Ndel1 Interaction Regulates Cell-Cycle Progression during Mitosis by Controlling Ndel1’s Kinetochore Localization
(A) Time-lapse imaging analysis showing that the DISC1 765–835 peptide can prolong the duration of mitosis. HeLa cells expressing histone H2B-RFP were
transfected with GFP control, GFP-DISC1 765–835, or GFP-DISC1 765–835 L822Q, respectively. After 24 hr, the HeLa cells were tracked using time-lapse
(legend continued on next page)
1046 Neuron 96, 1041–1054, December 6, 2017
Ndel1 and Nde1mediated by their short DISC1-binding segment
(i.e., the 47-residue Ndel1 CT-CC) and leave the rest of Ndel1/
Nde1’s functions, for example, as a dynein regulatory subunit,
intact. This strategy is particularly advantageous for studying
specific functions of the interaction between DISC1 and Ndel1,
twomulti-domain scaffold proteins with very broad cellular func-
tions and diverse binding partners. To ensure the specificity of
our experimental approach used below for investigating func-
tions of the DISC1/Ndel1 interaction, we used a single-point mu-
tation of the DISC1 765–835 peptide (DISC1 765–835 L822Q),
which has no detectable binding to Ndel1 and thus should not
interfere with cellular functions of the DISC1/Ndel1 interaction,
as the control (Figures 2H–2J).
Disrupting the DISC1/Ndel1 Interaction Causes MitoticDelay in Heterologous CellsSince Ndel1 is known to play critical roles in cell-cycle control,
presumably by recruiting the dynein complex to various cell-
cycle apparatuses, including centrosomes and kinetochores
(Bakircioglu et al., 2011; Liang et al., 2007; Raaijmakers et al.,
2013; Vallee et al., 2012), we first asked whether the DISC1/
Ndel1 interaction regulates cell-cycle progression in general, us-
ing HeLa cells as a model. Time-lapse live-imaging analysis re-
vealed that overexpression of the GFP-DISC1 765–835 peptide,
but not control GFP-DISC1 765–835 L822Qpeptide, significantly
prolonged the duration of the mitotic phase of cell cycle
(Figure 3A). Further analysis revealed that the DISC1 peptide-
induced mitotic delay is mainly due to lengthening metaphase-
to-anaphase duration, whereas the duration of prophase-to-
metaphase transition was not altered (Figures 3B–3D, S4A,
and S4B). In cells expressing GFP-DISC1 765–835, the sister
chromatids appeared to exhibit difficulty to separate after onset
of the metaphase, and the cell cycle was trapped at the meta-
phase-to-anaphase stage for a prolonged duration (Figure S4B).
Previous studies have shown that both DISC1 and Ndel1 can
regulate cell cycle by interacting with GSK3b (Mao et al., 2009)
and Lis1/dynein, respectively (Derewenda et al., 2007; Moon
et al., 2014; Niethammer et al., 2000; Shu et al., 2004; Tarricone
et al., 2004; Zy1kiewicz et al., 2011). To ensure that the cell-cycle
progression deficit caused by overexpression of DISC1 765–835
peptide is not due to the disruption of the DISC1/GSK3b com-
microscopy for 24 hr. Each horizontal bar represents one cell (n = 50). Various c
diagram.
(B) Cumulative distributions of the entire mitosis duration time from prophase (pr
(C) Cumulative distributions of time durations from prophase to metaphase (met
(D) Cumulative distributions of time durations frommetaphase to anaphase of mit
The total number ‘‘n’’ is indicated for each group. The statistical analysis in (B)–(D) w
(E) Pull-down-based competition experiment showing the interaction between DIS
purified Trx-FLAG-taggedDISC1 (203–321) for the binding assay, and the purified
cell lysates expressing corresponding proteins and also stained with Coomassie
(F) Pull-down-based competition experiment showing the interaction between N
(G and H) Representative images showing that the DISC1 peptide can disrupt t
localization in HeLa cells. Cells were synchronized at early S phase by double-thy
were transfected with RFP control, RFP DISC1 765–835, RFP DISC1 765–835
chosen for the Ndel1 kinetochore localization analysis. Anti-BubR1 and Anti-Hec1
the impact of DISC1 765–835 on exogenously expressed Ndel1 (derived from 6
experiments) kinetochore localization during mitosis are shown. ‘‘n’’ stands for t
See also Figure S4.
plex or the Ndel1/Lis1 complex, we assayed the potential impact
of the DISC1 765–835 peptide on DISC1’s binding to GSK3b as
well as Ndel1’s binding to Lis1. We confirmed that the N-terminal
fragment preceding the tetramerization domain of DISC1
(i.e., residue 1–321) is responsible for binding to GSK3b (Fig-
ure S3I) (Mao et al., 2009). We further mapped the GSK3b-bind-
ing region to residues 203–321 of DISC1 (Figure 3E). As
expected, the DISC1/GSK3b interaction was not affected by
the presence of an excess amount of the DISC1 765–835 pep-
tide, as the GSK3b-binding region on DISC1 is far away from
the DISC1 C-terminal tail (Figure 3E). Similarly, the interaction
between Ndel1 and Lis1 was not affected by the DISC1 765–
835 peptide (Figure 3F). This result is also expected as the
Lis1-binding region is in the N-terminal dimerization domain of
Ndel1 and is away from the Ndel1 CT-CC (Derewenda et al.,
2007; Tarricone et al., 2004). Together, our results indicate that
specific interaction between DISC1 and Ndel1 regulates cell-
cycle progression, particularly at the metaphase-to-anaphase
transition of mitosis, in the heterologous cell culture model.
DISC1 Regulates the Kinetochore Localization of Ndel1during MitosisTo understand the mechanism underlying the mitotic delay
caused by disrupting the interaction between DISC1 and
Ndel1, we examined the dynamics of cellular localizations of
Ndel1 during cell cycle. Ndel1 mainly localizes at three regions,
namely, centrosomes, kinetochores, and the nuclear envelope,
in dividing cells (Figure S4C) (Alkuraya et al., 2011; Hebbar
et al., 2008; Hu et al., 2013; Liang et al., 2007). Ndel1 persistently
co-localized to centrosomes throughout the entire cell cycle.
When cells entered the prophase, Ndel1 became concentrated
on the nuclear envelope to regulate its breakdown process. After
the nuclear envelope broke down, Ndel1 became concentrated
at kinetochores and centrosomes (Figure S4C), a process
believed to be important for dynein-mediated separation of sister
chromatids during mitosis (Liang et al., 2007; Vergnolle and Tay-
lor, 2007). Nde1 showed a similar cellular localization pattern as
Ndel1 did during cell cycle (Figure S4D).
Consistent with the observation that the DISC1 peptide did not
alter the onset of and the prophase of mitosis, Ndel1’s nuclear
envelope localization during the prophase was not perturbed
olors corresponding to different periods in cell cycle are indicated below the
o) to anaphase (ana) of cells tracked in (A).
a).
osis. Three independent experiment results were pooled for statistical analysis.
as carried out by Kolmogorov-Smirnov test (****p < 0.0001; ns, not significant).
C1 and GSK3b is not affected by DISC1 C-terminal 765–835 peptide. We used
proteins are shown usingCoomassie blue staining. The input lanes are bacterial
blue.
del1 and LIS1 is not affected by DISC1 C-terminal 765–835 peptide.
he exogenously expressed Ndel1 (G) and endogenous Ndel1 (H) kinetochore
midine-block procedure. During the interval of two thymidine treatments, cells
L822Q, and GFP-full-length Ndel1. Cells in prometaphase to metaphase are
(magenta) are used to mark kinetochore. Scale bar, 10 mm. Quantifications of
independent experiments) or endogenous Ndel1 (derived from 3 independent
he number of cells analyzed.
Neuron 96, 1041–1054, December 6, 2017 1047
by DISC1 binding (Figure S4E). We also found that the DISC1
peptide does not alter the centrosome localization of the endog-
enous Ndel1 throughout the cell cycle (Figure S4E), indicating
that DISC1 binding does not alter Ndel1’s function on centro-
somes. This observation is consistent with our biochemical
finding that the DISC1 peptide does not affect the Ndel1/Lis1
interaction, which is known to be critical for Ndel1-mediated
dynein complex assembly and functions (Moon et al., 2014; Niet-
hammer et al., 2000; Sasaki et al., 2000; Shu et al., 2004; Zy1kie-wicz et al., 2011). Notably, the DISC1 peptide, but not the control
peptide, completely disrupted the kinetochore localization of
overexpressed as well as endogenous Ndel1 (Figures 3G and
3H). Likewise, overexpression of the DISC1 peptide, but not
the L822Q control peptide, completely disrupted kinetochore
localization of Nde1 (Figure S4F). Taken together, our results
suggest that interaction between DISC1 and Ndel1 regulates
the cell-cycle progression by specifically controlling the Ndel1’s
kinetochore localization.
DISC1/Ndel1 Interaction Regulates Proliferation ofRadial Glial Cells during Embryonic Mouse NeocorticalDevelopmentThe neocortex is responsible for higher brain functions, such as
cognitive and emotional processing, which are impaired in
patients with psychiatric disorders. Radial glial cells (RGCs) in
the ventricular zone (VZ) function as neural stem cells in the em-
bryonic cortex (Taverna et al., 2014). To investigate the function
of the DISC1/Ndel1 interaction in regulating RGCs in vivo, we
performed in utero electroporations, with vectors expressing
GFP (GFP) or co-expressing GFP and the DISC1 765–835 pep-
tide (GFP-DISC1) or the DISC1 L822Q control peptide (GFP-
DISC1-L822Q), into the embryonic day (E)13.5 neocortex (Yoon
et al., 2014). To label the RGCs during the S phase of cell cycle,
we injected EdU into the pregnant dams 6 hr prior to collection
(Figure S5A). We first examined the interkinetic nuclear migration
(INM) of GFP+EdU+ RGCs in the VZ. During INM, the nucleus of
each RGC migrates away from the ventricular surface through
the basal process of the cell in G1, progresses through the
S phase, and then returns to the ventricular surface during G2
for the mitotic division (Taverna et al., 2014). Consistent with
our results from the heterologous system, we did not observe
any difference in the distribution of GFP+EdU+ cells in the VZ
upon expression of the DISC1 765–835 peptide, indicating that
phase progressions from S to G2 and G2 to M are not affected
by the disruption of the DISC1/Ndel1 interaction (Figure S5B).
Next, we examined cell-cycle progression during mitosis by
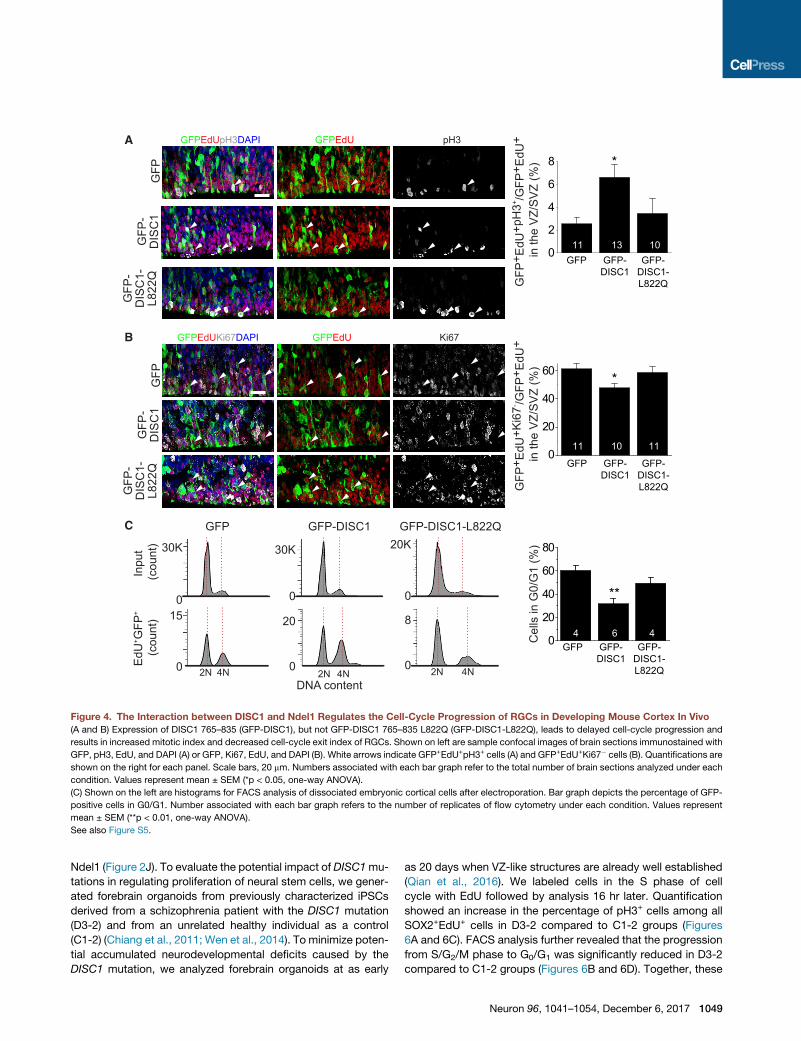
analyzing the percentage of cells with the mitotic marker, pH3,
among all GFP+EdU+ cells in the VZ and the subventricular
zone (SVZ). We observed an increased percentage of pH3+ cells
upon expression of the DISC1 765–835 peptide compared to the
empty vector control, while the DISC1 L822Q control peptide
had no effect (Figure 4A). We further assessed cell-cycle exit
by measuring the percentage of GFP+ cells labeled in the
S phase (GFP+EdU+) that exited the cell cycle (Ki67�) 24 hr later.
We found that expression of DISC1 765–835 peptide, but not
DISC1 L822Q control peptide, caused substantially decreased
cell-cycle exit (Figure 4B). We next performed fluorescence-acti-
vated cell sorting (FACS) analysis with dissociated cortex after in
1048 Neuron 96, 1041–1054, December 6, 2017
utero electroporation and EdU treatment as described above
(Yoon et al., 2017a) (Figure S5C). The FACS analysis revealed
that progression fromS/G2/M toG0/G1was significantly reduced
by the expression of the DISC1 765–835 peptide, but not by the
DISC1 L822Q control peptide (Figure 4C). Together, these re-
sults indicate that the DISC1/Ndel1 interaction is important for
proper cell-cycle progression of RGCs in the developing mouse
cortex in vivo.
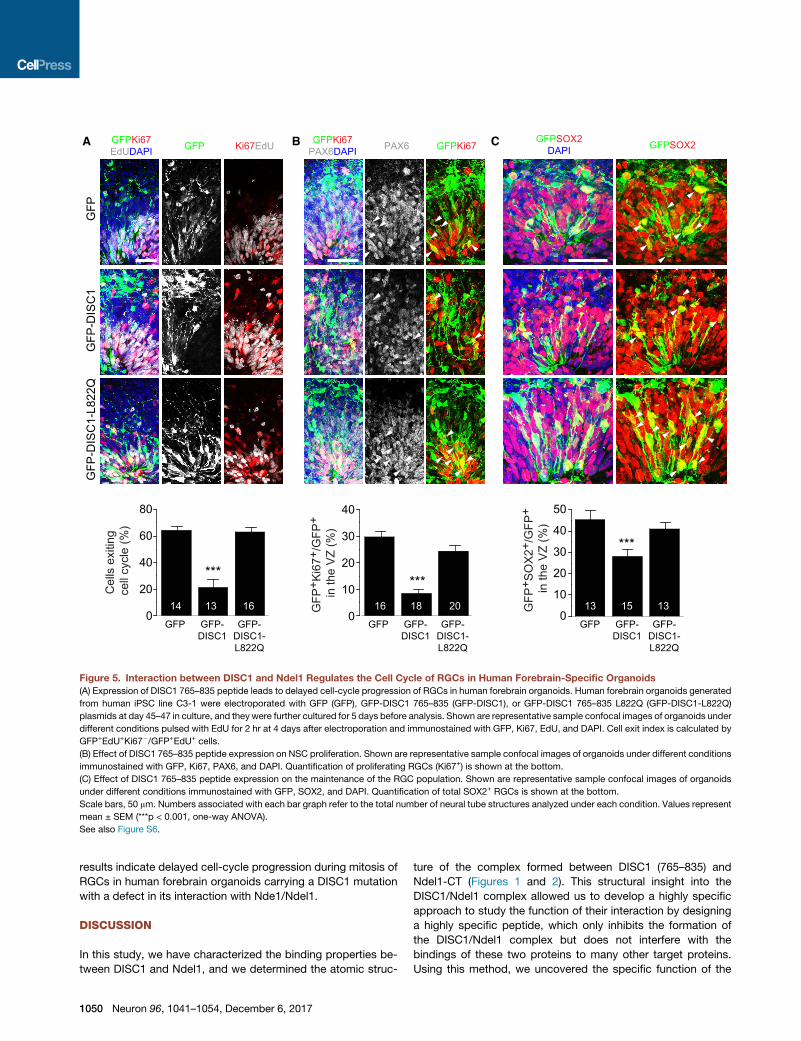
DISC1/Ndel1 Interaction Is Critical for Neurogenesis inHuman Forebrain OrganoidsTo determine the potential functional impact of disrupting the
DISC1 and Ndel1 complex during human brain development,
we used forebrain-specific organoids derived from human
induced pluripotent stem cells (iPSCs) (Qian et al., 2016; Xu
et al., 2016). At day 45–47, NESTIN+ RGCs in forebrain organoids
proliferate robustly as revealed by mitotic neural stem cell (NSC)
marker p-VIMENTINE (Figure S6A). To genetically manipulate
and label RGCs in organoids, we delivered plasmids expressing
GFP, GFP-DISC1 765–835, or GFP-DISC1 765–835 L822Q into
organoids by electroporation (Figure S6B) (Yoon et al., 2017b).
At 5 days post-electroporation (dpe), we observed GFP-labeled
Ki67+PAX6+ proliferating RGCs in the VZ-like structure (defined
by PAX6 labeling; Figure S6C). We pulsed organoids with EdU
for 2 hr at 4 dpe, followed by analysis 24 hr later (Figure S6B).
We found that the cell-cycle index was significantly decreased
upon expression of GFP-DISC1 765–835, but not control pep-
tide, when compared to the GFP control (Figure 5A). An increase
in the percentage of EdU-labeled cells in the cell cycle can be
due to either delayed cell-cycle progression or accelerated re-
entrance to the next cell cycle. We therefore examined the num-
ber of proliferating RGCs in the VZ. The portion of Ki67+GFP+
proliferating cells among total GFP+ RGCs in the VZwas dramat-
ically reduced in the organoids expressing GFP-DISC1 765–835
peptide, but not the control peptide (Figure 5B). Moreover, the
number of SOX2+ GFP+ RGCs in the VZ was significantly
decreased in the organoids expressing GFP-DISC1 765–835
peptide (Figure 5C). Together, these sets of experiments suggest
that specific disruption of DISC1 and Ndel1 interaction results in
reduced proliferation of neural stem cells in the VZ due to a de-
layed cell-cycle progression.
Defective Neurogenesis in Human Brain OrganoidsDerived from a Schizophrenia Patient with a DISC1
MutationThe characterization of the structure of the DISC1/Ndel1 com-
plex prompted us to examine the potential impact of DISC1
mutations founds in patients with major psychiatric disorders.
A t(1; 11)(q42; q14.3) translocation found in the Scottish family
leads to a truncation of DISC1 with a large part of the C-terminal
tail (aa 598–854) removed (Blackwood et al., 2001). Thismutation
would cause a total loss of DISC1’s binding to Ndel1. A 4-bp
deletion of DISC1 discovered in an American family with psychi-
atric disorders leads to truncation of DISC1 at I808 (Figures 1A
and S1A) (Sachs et al., 2005). This frameshift mutation
completely eliminates the DISC1 a2 helix and, therefore, it abol-
ishes its interaction with Ndel1, in view that single-residue
substitution in the same helix can disrupt DISC1’s binding to
GFP
GFP
-D
ISC
1
GFP
-D
ISC
1-L8
22Q
GFPEdUpH3DAPI
0
2
4
6
8 *
11 13 10
0
20
40
60
11 10 11
*
0
20
40
60
80
**
2N 4N 2N 4N 2N 4NDNA content
GFP GFP-DISC1 GFP-DISC1-L822Q
30K
015
0EdU
+ GFP
+
(cou
nt)
Inpu
t (c
ount
)
C
A
B
GFPEdU
GFP GFP-DISC1
GFP-DISC1-L822Q
GFP GFP-DISC1
GFP-DISC1-L822Q
GFP
+ EdU
+pH
3+ /GFP
+ EdU
+in
the
VZ/
SV
Z (%
)G
FP+ E
dU+K
i67- /G
FP+ E
dU+
in th
e V
Z/S
VZ
(%)
GFP
GFP
-D
ISC
1
GFP
-D
ISC
1-L8
22Q
pH3
GFPEdUKi67DAPI GFPEdU Ki67
30K
0
20
0
20K
0
8
0
4 6 4GFP GFP-
DISC1GFP-
DISC1-L822Q
Cel
ls in
G0/
G1
(%)
Figure 4. The Interaction between DISC1 and Ndel1 Regulates the Cell-Cycle Progression of RGCs in Developing Mouse Cortex In Vivo
(A and B) Expression of DISC1 765–835 (GFP-DISC1), but not GFP-DISC1 765–835 L822Q (GFP-DISC1-L822Q), leads to delayed cell-cycle progression and
results in increased mitotic index and decreased cell-cycle exit index of RGCs. Shown on left are sample confocal images of brain sections immunostained with
GFP, pH3, EdU, and DAPI (A) or GFP, Ki67, EdU, and DAPI (B). White arrows indicate GFP+EdU+pH3+ cells (A) and GFP+EdU+Ki67� cells (B). Quantifications are
shown on the right for each panel. Scale bars, 20 mm. Numbers associated with each bar graph refer to the total number of brain sections analyzed under each
condition. Values represent mean ± SEM (*p < 0.05, one-way ANOVA).
(C) Shown on the left are histograms for FACS analysis of dissociated embryonic cortical cells after electroporation. Bar graph depicts the percentage of GFP-
positive cells in G0/G1. Number associated with each bar graph refers to the number of replicates of flow cytometry under each condition. Values represent
mean ± SEM (**p < 0.01, one-way ANOVA).
See also Figure S5.
Ndel1 (Figure 2J). To evaluate the potential impact of DISC1mu-
tations in regulating proliferation of neural stem cells, we gener-
ated forebrain organoids from previously characterized iPSCs
derived from a schizophrenia patient with the DISC1 mutation
(D3-2) and from an unrelated healthy individual as a control
(C1-2) (Chiang et al., 2011; Wen et al., 2014). To minimize poten-
tial accumulated neurodevelopmental deficits caused by the
DISC1 mutation, we analyzed forebrain organoids at as early
as 20 days when VZ-like structures are already well established
(Qian et al., 2016). We labeled cells in the S phase of cell
cycle with EdU followed by analysis 16 hr later. Quantification
showed an increase in the percentage of pH3+ cells among all
SOX2+EdU+ cells in D3-2 compared to C1-2 groups (Figures
6A and 6C). FACS analysis further revealed that the progression
from S/G2/M phase to G0/G1 was significantly reduced in D3-2
compared to C1-2 groups (Figures 6B and 6D). Together, these
Neuron 96, 1041–1054, December 6, 2017 1049
GFPKi67EdUDAPI GFP GFPKi67
PAX6DAPI PAX6 GFPKi67Ki67EdU
GFP GFP-DISC1
GFP-DISC1-L822Q
***
14 13 16
Cel
ls e
xitin
g ce
ll cy
cle
(%)
13 15 13GFP
+ SO
X2+
/GFP
+ in
the
VZ
(%)
16 18 20GFP
+ Ki6
7+/G
FP+
in th
e V
Z (%
)
A B C GFPSOX2DAPI GFPSOX2
80
60
40
20
0
40
30
20
10
0
50
40
30
20
0
10***
***
GFP GFP-DISC1
GFP-DISC1-L822Q
GFP GFP-DISC1
GFP-DISC1-L822Q
GFP
GFP
-DIS
C1
GFP
-DIS
C1-
L822
Q
Figure 5. Interaction between DISC1 and Ndel1 Regulates the Cell Cycle of RGCs in Human Forebrain-Specific Organoids
(A) Expression of DISC1 765–835 peptide leads to delayed cell-cycle progression of RGCs in human forebrain organoids. Human forebrain organoids generated
from human iPSC line C3-1 were electroporated with GFP (GFP), GFP-DISC1 765–835 (GFP-DISC1), or GFP-DISC1 765–835 L822Q (GFP-DISC1-L822Q)
plasmids at day 45–47 in culture, and they were further cultured for 5 days before analysis. Shown are representative sample confocal images of organoids under
different conditions pulsed with EdU for 2 hr at 4 days after electroporation and immunostained with GFP, Ki67, EdU, and DAPI. Cell exit index is calculated by
GFP+EdU+Ki67�/GFP+EdU+ cells.
(B) Effect of DISC1 765–835 peptide expression on NSC proliferation. Shown are representative sample confocal images of organoids under different conditions
immunostained with GFP, Ki67, PAX6, and DAPI. Quantification of proliferating RGCs (Ki67+) is shown at the bottom.
(C) Effect of DISC1 765–835 peptide expression on the maintenance of the RGC population. Shown are representative sample confocal images of organoids
under different conditions immunostained with GFP, SOX2, and DAPI. Quantification of total SOX2+ RGCs is shown at the bottom.
Scale bars, 50 mm. Numbers associated with each bar graph refer to the total number of neural tube structures analyzed under each condition. Values represent
mean ± SEM (***p < 0.001, one-way ANOVA).
See also Figure S6.
results indicate delayed cell-cycle progression during mitosis of
RGCs in human forebrain organoids carrying a DISC1 mutation
with a defect in its interaction with Nde1/Ndel1.
DISCUSSION
In this study, we have characterized the binding properties be-
tween DISC1 and Ndel1, and we determined the atomic struc-
1050 Neuron 96, 1041–1054, December 6, 2017
ture of the complex formed between DISC1 (765–835) and
Ndel1-CT (Figures 1 and 2). This structural insight into the
DISC1/Ndel1 complex allowed us to develop a highly specific
approach to study the function of their interaction by designing
a highly specific peptide, which only inhibits the formation of
the DISC1/Ndel1 complex but does not interfere with the
bindings of these two proteins to many other target proteins.
Using this method, we uncovered the specific function of the
0
2
4
6
8
10 **
14 16
0
10
20
30
40
50
2K
0
300
0EdU
+ GFP
+ (c
ount
)In
put (
coun
t)
B
1.5K
0
300
0
0 100 200 0 100 200
0 100 200 0 100 200
G1-G043.4
G1-G032.7
C
D
DNA content
2N 4N 2N 4N
2N 4N 2N 4N
C1-2 D3-2
6 6Cel
ls in
G0/
G1
(%)
EdU
+pH
3+ /EdU
+in
the
VZ/
SV
Z (%
)
**
C1-2 D3-2
C1-2 D3-2
A C1-2 D3-2
EdU
PH
3SO
X2
EdU
PH
3S
OX
2
Figure 6. Disrupted Cell Cycle Progression of RGCs during Mitosis in Forebrain Organoids Derived from a Schizophrenia Patient with a
DISC1 Mutation
(A) Cell-cycle progression is delayed and results in increased mitotic index of RGCs in D3-2 forebrain organoids. Shown on top are sample confocal images of
organoid sections immunostained with, pH3, EdU, Sox2, and DAPI. Scale bars, 20 mm.
(B) Shown are histograms for FACS analysis of dissociated forebrain organoids at day 20.
(C) Quantification of (A). Numbers associated with each bar graph refer to the total number of neural tube structures analyzed under each condition. Values
represent mean ± SEM (**p < 0.01, t test).
(D) Bar graph depicting the percentage of EdU-positive cells in G0/G1. Number associated with each bar graph refers to the number of replicates of flow
cytometry under each condition. Values represent mean ± SEM (**p < 0.01, t test).
See also Figure S6.
DISC1/Ndel1 interaction in regulating cell-cycle progression dur-
ing mitosis by controlling kinetochore localization of Ndel1 and
Nde1 in a heterologous system (Figure 3). We further demon-
strated a critical role of the DISC1/Ndel1 interaction in regulating
mitosis of RGCs, both in the developingmouse cortex in vivo and
in a human forebrain organoid system (Figures 4 and 5). Finally,
based on the structural and mechanistic findings, we tested a
potential impact of the DISC1 mutation found in an American
family with a 4-bp deletion mutation in the C-terminal tail of the
DISC1-coding region on brain development using human fore-
brain organoids derived from the patient iPSCs, and we found
cell-cycle progression deficits during mitosis of theDISC1muta-
tion bearing neural stem cells (Figure 6). Our study provides an
example of how interaction of two genetic risk factors for com-
plex human disorders can be effectively investigated by inte-
grating biochemical and structural studies with different model
systems, from heterologous cells tomousemodel in vivo and hu-
man brain organoids from normal subjects and from patients.
Both DISC1 and Ndel1 are genetic risk factors for psychiatric
disorders and have attracted extensive attention in the past.
Since both DISC1 and Ndel1 are multi-functional scaffold pro-
teins, removal or overexpression of either of the proteins is
undoubtedly going to cause pleotropic impacts on brain devel-
opment and functions. Additionally, it is often difficult to dissect
and trace the mechanistic origins of functional alterations
caused by manipulations of either of the full-length proteins.
For example, alterations of Ndel1 will undoubtedly impact the
cellular functions of the dynein complex and, therefore, they
cause perturbations to many cellular processes in developing
neurons. Similarly, manipulation of the full-length DISC1 will
change the interaction landscape of many DISC1 targets,
including GSK3b and PDE4, which are master signaling mole-
cules in brain development and functions (Mao et al., 2009; Millar
et al., 2005; Soda et al., 2013). In this study, we present the first
atomic-level structural description of DISC1/Ndel1 interaction.
The DISC1/Ndel1 complex structure allowed us to design a
very specific tool to investigate the functional role of DISC1
and Ndel1 interaction, while leaving the rest of the protein inter-
actions of these two scaffold proteins intact. Therefore, our
study provides an example of an effective strategy to investigate
the functional interaction in a specific manner based on the
structure.
Our structure and biochemical studies also provide a model
for future testing of mechanistic differences of psychiatric dis-
eases caused by the two DISC1 mutations. Based on our data
(Figures 1 and 2), the DISC1 mutation in the American family
patients is predicted to selectively disrupt the DISC1/Ndel1 inter-
action and spares the rest of the interaction mediated by DISC1
regions, other than short C-terminal. As such, the majority of the
DISC1 interactions (e.g., the interactions mediated by the central
tetramerization domain of the protein and the N-terminal
GSK3b-binding region) are predicted not to be affected by the
Neuron 96, 1041–1054, December 6, 2017 1051
mutation (Figure S3I). However, since the DISC1 mutation car-
riers are almost invariably heterozygous, the short C-terminal-
truncated DISC1 mutant protein generated by the mutant allele,
if it is translated into proteins, will form hetero-tetramer with the
wild-type (WT) protein. Therefore, the mutant DISC1 protein in
the American family patients may display certain additional func-
tional properties due to the formation of DISC1WT/DISC1mutant
hetero-tetramer. Consistent with this model, the expression of
DISC1mutant, both in iPSCs derived from patients and in
HEK293 heterologous cells, can cause stability decrease of
WT DISC1 (Wen et al., 2014). In contrast, the t(1; 11)(q42;
q14.3) translocation-induced mutation deletes a large part of
the tetramerization domain in addition to the Ndel1-binding re-
gion. We found that any further truncations of DISC1 from its
C-terminal end beyond residue 722, including residue 598 at
the Chr1.11 translocation point, resulted in expression of insol-
uble proteins (Figure S3H), suggesting mutation-induced mis-
folding of the tetramerization domain. Therefore, the Chr1.11
translocation mutation is likely to generate one copy of function-
ally null alleleDISC1 and decrease the effective dosage of DISC1
in patients even if the mutant transcript is translated. An alterna-
tive explanation is that the (1; 11)(q42; q14.3) translocation
causes the mutant allele of DISC1 transcript to be unstable
and results in haploinsufficiency for DISC1 in the mutation car-
riers (Millar et al., 2005).
Our DISC1 (765–835) peptide targets both Ndel1 and Nde1,
and it cannot differentiate the two dynein regulators due to their
same binding properties. As such, our assay would be observing
the combined impacts of the perturbations on the interactions
between DISC1 and Ndel1/Nde1. Nde1 and Ndel1 paralogs
have been previously studied and show similar behaviors in
cell cycle in non-neuronal cells (Stehman et al., 2007). Recently,
it was found that Nde1 and Ndel1 can substitute each other in
many aspects of neurogenesis and neuronal migration (Brad-
shaw and Hayashi, 2017) . However, Nde1 also displays its
unique roles in the cell-cycle progression of radial glial progeni-
tors (Doobin et al., 2016). It is interesting to note that ndel1 and
nde1 show different expression pattern during the mouse
neocortical development (Allen Developing Mouse Brain Atlas,
http://developingmouse.brain-map.org). While Nde1 mRNA is
more highly detected in the region with high proliferation, such
as the VZ, ndel1 is more strongly expressed in the cortical plate,
where neurons are localized as a result of neuronal migration at
E13.5. Therefore, it is likely that NDE1 plays amore crucial role in
regulating cell-cycle progression of neural stem cells in the VZ.
Future studies are needed to elucidate their potential differential
function in vivo.
The human brain organoid system confers a unique platform
to investigate neural development in a genetically manipulable
and disease-relevant brain region (Nguyen et al., 2016; Qian
et al., 2017). We have developed a forebrain-specific organoid
model for major mental disorders, including schizophrenia, at
the cellular level with a highly penetrant and disease-relevant
genotype. Our finding from studying human forebrain organoids
derived from patient iPSCs suggests a model in which a sus-
ceptibility gene for major psychiatric disorders could affect
neural development via dysregulation of RGC proliferation.
Our results delineate a potential mechanistic bridge in patient
1052 Neuron 96, 1041–1054, December 6, 2017
forebrain organoids for a prominent hypothesis of complex
psychiatric disorders, namely, aberrant neurodevelopment.
Formation of the cerebral cortex requires a tight control of neu-
ral stem cell proliferation and differentiation to generate the
proper number of neurons. RGCs in the VZ are precisely regu-
lated to maintain their own stem cell population while gener-
ating intermediate progenitors, which migrate and form the
SVZ and neurons that form the upper layers of cortex (Moly-
neaux et al., 2007). Therefore, proper control of RGC prolifera-
tion is a fundamental and critical process of the cortex. Using
forebrain organoids generated from human iPSCs, we further
show that the specific interaction between DISC1 and Ndel1
plays an important role in maintaining the neural stem cell pop-
ulation during human forebrain development (Figure 5C). Our
study provides an example that genetic risk factors for psychi-
atric disorders can lead to specific cellular abnormalities of bio-
logical processes implicated in the neurodevelopmental origins
of these disorders.
In summary, based on structural insights we identified a func-
tion of DISC1/Ndel1 interaction in regulating cell-cycle progres-
sion of RGCs in an in vivo animal model and in human forebrain
organoids. Our study from patient-derived forebrain organoids
provides a potential mechanistic understanding of how DISC1
mutation with its C-terminal deletion can affect neural develop-
mental processes. Together, our multifaceted approaches pro-
vide insight into mechanisms of pathogenesis of complex
psychiatric disorders.
STAR+METHODS
Detailed methods are provided in the online version of this paper
and include the following:
d KEY RESOURCES TABLE
d CONTACT FOR REAGENT AND RESOURCE SHARING
d EXPERIMENTAL MODELS AND SUBJECTS DETAILS
B Human iPSC lines
B Animals
B HeLa Cells and HEK293T Cells Culture
d METHODS DETAILS
B Constructs and Protein Expression
B Isothermal Titration Calorimetry Assay
B Analytical Gel Filtration Chromatography Coupled with
Static Light Scattering
B NMR spectroscopy
B NMR structural calculation
B Co-immunoprecipitation and GST Pull-Down Assays
B Live cell imaging
B Kinetochore localization assay
B Culture of human iPSC-derived forebrain organoids
B In utero electroporation and EdU pulsing of mouse
B Electroporation and EdU labeling of organoids
B Immunohistochemistry and quantitative analysis of
mouse embryo and organoids
B Flow cytometric analysis of cell cycle
d QUANTIFICATION AND STATISTICAL ANALYSIS
d DATA AND SOFTWARE AVAILABILITY
B Data Resources
SUPPLEMENTAL INFORMATION
Supplemental Information includes six figures and one table and can be found
with this article online at https://doi.org/10.1016/j.neuron.2017.10.010.
AUTHOR CONTRIBUTIONS
F.Y., Chuan Yu, Cong Yu, M.M., and R.Y.C.P. contributed to structural anal-
ysis. E.K. performed functional analysis of mouse and organoid development.
X.Q. and F.J. helped with organoid analyses. J.K. contributed to data collec-
tion. F.Y., E.K., H.S., G.M., and M.Z. conceived the project and wrote the
manuscript.
ACKNOWLEDGMENTS
We thankS.Hirotsune for anti-Ndel1 antibody andmembers of theMing, Song,
andZhang laboratories for comments. Thisworkwas supported by grants from
RGCof HongKong (664113, 16103614, AoE-M09-12, and T13-607/12R) and a
973 program grant from the Minister of Science and Technology of China
(2014CB910204 to M.Z.), the NIH (R35NS097370, R01MH105128, and
U19AI131130 toG.M.; R37NS047344 andU19MH106434 to H.S.), the Simons
Foundation (SFARI grant 308988 to H.S. and SFARI grant 401625 toG.M.), and
the NARSAD young investigator award (119228 to E.K.). M.Z. is a Kerry Hold-
ings Professor in Science and a Senior Fellow of IAS at HKUST.
Received: March 25, 2017
Revised: September 18, 2017
Accepted: October 5, 2017
Published: November 2, 2017; corrected online December 6, 2017
REFERENCES
Alkuraya, F.S., Cai, X., Emery, C., Mochida, G.H., Al-Dosari, M.S., Felie, J.M.,
Hill, R.S., Barry, B.J., Partlow, J.N., Gascon, G.G., et al. (2011). Human muta-
tions in NDE1 cause extrememicrocephalywith lissencephaly [corrected]. Am.
J. Hum. Genet. 88, 536–547.
Bakircioglu, M., Carvalho, O.P., Khurshid, M., Cox, J.J., Tuysuz, B., Barak, T.,
Yilmaz, S., Caglayan, O., Dincer, A., Nicholas, A.K., et al. (2011). The essential
role of centrosomal NDE1 in human cerebral cortex neurogenesis. Am. J. Hum.
Genet. 88, 523–535.
Blackwood, D.H., Fordyce, A., Walker, M.T., St Clair, D.M., Porteous, D.J., and
Muir, W.J. (2001). Schizophrenia and affective disorders–cosegregation with a
translocation at chromosome 1q42 that directly disrupts brain-expressed
genes: clinical and P300 findings in a family. Am. J. Hum. Genet. 69, 428–433.
Blasi, G., Napolitano, F., Ursini, G., Di Giorgio, A., Caforio, G., Taurisano, P.,
Fazio, L., Gelao, B., Attrotto, M.T., Colagiorgio, L., et al. (2013). Association
of GSK-3b genetic variation with GSK-3b expression, prefrontal cortical thick-
ness, prefrontal physiology, and schizophrenia. Am. J. Psychiatry 170,
868–876.
Bradshaw, N.J., and Hayashi, M.A. (2017). NDE1 and NDEL1 from genes to
(mal)functions: parallel but distinct roles impacting on neurodevelopmental
disorders and psychiatric illness. Cell. Mol. Life Sci. 74, 1191–1210.
Brandon, N.J., and Sawa, A. (2011). Linking neurodevelopmental and synaptic
theories of mental illness through DISC1. Nat. Rev. Neurosci. 12, 707–722.
Brandon, N.J., Handford, E.J., Schurov, I., Rain, J.C., Pelling, M., Duran-
Jimeniz, B., Camargo, L.M., Oliver, K.R., Beher, D., Shearman, M.S., and
Whiting, P.J. (2004). Disrupted in Schizophrenia 1 and Nudel form a neurode-
velopmentally regulated protein complex: implications for schizophrenia and
other major neurological disorders. Mol. Cell. Neurosci. 25, 42–55.
Burdick, K.E., Kamiya, A., Hodgkinson, C.A., Lencz, T., DeRosse, P., Ishizuka,
K., Elashvili, S., Arai, H., Goldman, D., Sawa, A., and Malhotra, A.K. (2008).
Elucidating the relationship between DISC1, NDEL1 and NDE1 and the risk
for schizophrenia: evidence of epistasis and competitive binding. Hum. Mol.
Genet. 17, 2462–2473.
Brunger, A.T., Adams, P.D., Clore, G.M., DeLano, W.L., Gros, P., Grosse-
Kunstleve, R.W., Jiang, J.S., Kuszewski, J., Nilges, M., Pannu, N.S., et al.
(1998). Crystallography & NMR system: a new software suite for macromolec-
ular structure determination. Acta. Crystallogr. D. Biol. Crystallogr. 54,
905–921.
Camargo, L.M., Collura, V., Rain, J.C., Mizuguchi, K., Hermjakob, H., Kerrien,
S., Bonnert, T.P., Whiting, P.J., and Brandon, N.J. (2007). Disrupted in
Schizophrenia 1 Interactome: evidence for the close connectivity of risk genes
and a potential synaptic basis for schizophrenia. Mol. Psychiatry 12, 74–86.
Chiang, C.H., Su, Y., Wen, Z., Yoritomo, N., Ross, C.A., Margolis, R.L., Song,
H., and Ming, G.L. (2011). Integration-free induced pluripotent stem cells
derived from schizophrenia patients with a DISC1 mutation. Mol. Psychiatry
16, 358–360.
Delaglio, F., Grzesiek, S., Vuister, G.W., Zhu, G., Pfeifer, J., and Bax, A. (1995).
NMRPipe: a multidimensional spectral processing system based on UNIX
pipes. Journal of Biomolecular NMR 6, 277–293.
Derewenda, U., Tarricone, C., Choi, W.C., Cooper, D.R., Lukasik, S., Perrina,
F., Tripathy, A., Kim, M.H., Cafiso, D.S., Musacchio, A., and Derewenda, Z.S.
(2007). The structure of the coiled-coil domain of Ndel1 and the basis of its
interaction with Lis1, the causal protein of Miller-Dieker lissencephaly.
Structure 15, 1467–1481.
Doobin, D.J., Kemal, S., Dantas, T.J., and Vallee, R.B. (2016). Severe NDE1-
mediatedmicrocephaly results from neural progenitor cell cycle arrests atmul-
tiple specific stages. Nat. Commun. 7, 12551.
Duan, X., Chang, J.H., Ge, S., Faulkner, R.L., Kim, J.Y., Kitabatake, Y., Liu,
X.B., Yang, C.H., Jordan, J.D., Ma, D.K., et al. (2007). Disrupted-In-
Schizophrenia 1 regulates integration of newly generated neurons in the adult
brain. Cell 130, 1146–1158.
Enomoto, A., Asai, N., Namba, T., Wang, Y., Kato, T., Tanaka, M., Tatsumi, H.,
Taya, S., Tsuboi, D., Kuroda, K., et al. (2009). Roles of disrupted-in-schizo-
phrenia 1-interacting protein girdin in postnatal development of the dentate
gyrus. Neuron 63, 774–787.
Fatemi, S.H., King, D.P., Reutiman, T.J., Folsom, T.D., Laurence, J.A., Lee, S.,
Fan, Y.T., Paciga, S.A., Conti, M., and Menniti, F.S. (2008). PDE4B polymor-
phisms and decreased PDE4B expression are associated with schizophrenia.
Schizophr. Res. 101, 36–49.
Feng, Y., and Walsh, C.A. (2004). Mitotic spindle regulation by Nde1 controls
cerebral cortical size. Neuron 44, 279–293.
Hayashi-Takagi, A., Takaki, M., Graziane, N., Seshadri, S., Murdoch, H.,
Dunlop, A.J., Makino, Y., Seshadri, A.J., Ishizuka, K., Srivastava, D.P., et al.
(2010). Disrupted-in-Schizophrenia 1 (DISC1) regulates spines of the gluta-
mate synapse via Rac1. Nat. Neurosci. 13, 327–332.
Hebbar, S., Mesngon, M.T., Guillotte, A.M., Desai, B., Ayala, R., and Smith,
D.S. (2008). Lis1 and Ndel1 influence the timing of nuclear envelope break-
down in neural stem cells. J. Cell Biol. 182, 1063–1071.
Hu, D.J., Baffet, A.D., Nayak, T., Akhmanova, A., Doye, V., and Vallee, R.B.
(2013). Dynein recruitment to nuclear pores activates apical nuclear migration
and mitotic entry in brain progenitor cells. Cell 154, 1300–1313.
Kamiya, A., Tomoda, T., Chang, J., Takaki, M., Zhan, C., Morita, M., Cascio,
M.B., Elashvili, S., Koizumi, H., Takanezawa, Y., et al. (2006). DISC1-NDEL1/
NUDEL protein interaction, an essential component for neurite outgrowth, is
modulated by genetic variations of DISC1. Hum. Mol. Genet. 15, 3313–3323.
Kang, E., Burdick, K.E., Kim, J.Y., Duan, X., Guo, J.U., Sailor, K.A., Jung, D.E.,
Ganesan, S., Choi, S., Pradhan, D., et al. (2011). Interaction between FEZ1 and
DISC1 in regulation of neuronal development and risk for schizophrenia.
Neuron 72, 559–571.
Kim, J.Y., Duan, X., Liu, C.Y., Jang,M.H., Guo, J.U., Pow-anpongkul, N., Kang,
E., Song, H., and Ming, G.L. (2009). DISC1 regulates new neuron development
in the adult brain via modulation of AKT-mTOR signaling through KIAA1212.
Neuron 63, 761–773.
Laskowski, R.A., Rullmannn, J.A., MacArthur, M.W., Kaptein, R., and
Thornton, J.M. (1996). AQUA and PROCHECK-NMR: programs for checking
the quality of protein structures solved by NMR. J. Biomol. NMR 8, 477–486.
Neuron 96, 1041–1054, December 6, 2017 1053
Liang, Y., Yu,W., Li, Y., Yu, L., Zhang, Q.,Wang, F., Yang, Z., Du, J., Huang, Q.,
Yao, X., and Zhu, X. (2007). Nudel modulates kinetochore association and
function of cytoplasmic dynein in M phase. Mol. Biol. Cell 18, 2656–2666.
Lupas, A. (1996). Coiled coils: new structures and new functions. Trends
Biochem. Sci. 21, 375–382.
Mao, Y., Ge, X., Frank, C.L., Madison, J.M., Koehler, A.N., Doud, M.K., Tassa,
C., Berry, E.M., Soda, T., Singh, K.K., et al. (2009). Disrupted in schizophrenia 1
regulates neuronal progenitor proliferation via modulation of GSK3beta/beta-
catenin signaling. Cell 136, 1017–1031.
Millar, J.K., Pickard, B.S., Mackie, S., James, R., Christie, S., Buchanan, S.R.,
Malloy, M.P., Chubb, J.E., Huston, E., Baillie, G.S., et al. (2005). DISC1 and
PDE4B are interacting genetic factors in schizophrenia that regulate cAMP
signaling. Science 310, 1187–1191.
Ming, G.L., and Song, H. (2009). DISC1 partners with GSK3beta in neurogen-
esis. Cell 136, 990–992.
Molyneaux, B.J., Arlotta, P., Menezes, J.R., andMacklis, J.D. (2007). Neuronal
subtype specification in the cerebral cortex. Nat. Rev. Neurosci. 8, 427–437.
Moon, H.M., Youn, Y.H., Pemble, H., Yingling, J., Wittmann, T., andWynshaw-
Boris, A. (2014). LIS1 controls mitosis and mitotic spindle organization via the
LIS1-NDEL1-dynein complex. Hum. Mol. Genet. 23, 449–466.
Nguyen, H.N., Song, H., and Ming, G. (2016). Engineering human pluripotent
stem cell-derived 3D brain tissues for drug discovery. J. Transl. Neurosci.
1, 38–48.
Nicodemus, K.K., Callicott, J.H., Higier, R.G., Luna, A., Nixon, D.C., Lipska,
B.K., Vakkalanka, R., Giegling, I., Rujescu, D., St Clair, D., et al. (2010).
Evidence of statistical epistasis between DISC1, CIT and NDEL1 impacting
risk for schizophrenia: biological validation with functional neuroimaging.
Hum. Genet. 127, 441–452.
Niethammer, M., Smith, D.S., Ayala, R., Peng, J., Ko, J., Lee, M.S., Morabito,
M., and Tsai, L.H. (2000). NUDEL is a novel Cdk5 substrate that associates
with LIS1 and cytoplasmic dynein. Neuron 28, 697–711.
Porteous, D.J., Millar, J.K., Brandon, N.J., and Sawa, A. (2011). DISC1 at 10:
connecting psychiatric genetics and neuroscience. Trends Mol. Med. 17,
699–706.
Qian, X., Nguyen, H.N., Song, M.M., Hadiono, C., Ogden, S.C., Hammack, C.,
Yao, B., Hamersky, G.R., Jacob, F., Zhong, C., et al. (2016). Brain-Region-
Specific Organoids Using Mini-bioreactors for Modeling ZIKV Exposure. Cell
165, 1238–1254.
Qian, X., Nguyen, H.N., Jacob, F., Song, H., and Ming, G.L. (2017). Using brain
organoids to understand Zika virus-induced microcephaly. Development 144,
952–957.
Raaijmakers, J.A., Tanenbaum, M.E., and Medema, R.H. (2013). Systematic
dissection of dynein regulators in mitosis. J. Cell Biol. 201, 201–215.
Sachs, N.A., Sawa, A., Holmes, S.E., Ross, C.A., DeLisi, L.E., and Margolis,
R.L. (2005). A frameshift mutation in Disrupted in Schizophrenia 1 in an
American family with schizophrenia and schizoaffective disorder. Mol.
Psychiatry 10, 758–764.
Sasaki, S., Shionoya, A., Ishida, M., Gambello, M.J., Yingling, J., Wynshaw-
Boris, A., and Hirotsune, S. (2000). A LIS1/NUDEL/cytoplasmic dynein heavy
chain complex in the developing and adult nervous system. Neuron 28,
681–696.
Sasaki, S., Mori, D., Toyo-oka, K., Chen, A., Garrett-Beal, L., Muramatsu, M.,
Miyagawa, S., Hiraiwa, N., Yoshiki, A., Wynshaw-Boris, A., and Hirotsune, S.
(2005). Complete loss of Ndel1 results in neuronal migration defects and early
embryonic lethality. Mol. Cell. Biol. 25, 7812–7827.
1054 Neuron 96, 1041–1054, December 6, 2017
Shu, T., Ayala, R., Nguyen, M.D., Xie, Z., Gleeson, J.G., and Tsai, L.H. (2004).
Ndel1 operates in a common pathway with LIS1 and cytoplasmic dynein to
regulate cortical neuronal positioning. Neuron 44, 263–277.
Soares, D.C., Carlyle, B.C., Bradshaw, N.J., and Porteous, D.J. (2011). DISC1:
Structure, Function, and Therapeutic Potential for Major Mental Illness. ACS
Chem. Neurosci. 2, 609–632.
Soda, T., Frank, C., Ishizuka, K., Baccarella, A., Park, Y.U., Flood, Z., Park,
S.K., Sawa, A., and Tsai, L.H. (2013). DISC1-ATF4 transcriptional repression
complex: dual regulation of the cAMP-PDE4 cascade by DISC1. Mol.
Psychiatry 18, 898–908.
Stehman, S.A., Chen, Y., McKenney, R.J., and Vallee, R.B. (2007). NudE and
NudEL are required for mitotic progression and are involved in dynein recruit-
ment to kinetochores. J. Cell Biol. 178, 583–594.
Tarricone, C., Perrina, F., Monzani, S., Massimiliano, L., Kim, M.H.,
Derewenda, Z.S., Knapp, S., Tsai, L.H., and Musacchio, A. (2004). Coupling
PAF signaling to dynein regulation: structure of LIS1 in complex with PAF-ace-
tylhydrolase. Neuron 44, 809–821.
Taverna, E., Gotz, M., and Huttner, W.B. (2014). The cell biology of neurogen-
esis: toward an understanding of the development and evolution of the
neocortex. Annu. Rev. Cell Dev. Biol. 30, 465–502.
Thomson, P.A., Malavasi, E.L., Gr€unewald, E., Soares, D.C., Borkowska, M.,
and Millar, J.K. (2013). DISC1 genetics, biology and psychiatric illness.
Front. Biol. (Beijing) 8, 1–31.
Vallee, R.B., McKenney, R.J., and Ori-McKenney, K.M. (2012). Multiple modes
of cytoplasmic dynein regulation. Nat. Cell Biol. 14, 224–230.
Vergnolle, M.A., and Taylor, S.S. (2007). Cenp-F links kinetochores to Ndel1/
Nde1/Lis1/dynein microtubule motor complexes. Curr. Biol. 17, 1173–1179.
Wang, Q., Charych, E.I., Pulito, V.L., Lee, J.B., Graziane, N.M., Crozier, R.A.,
Revilla-Sanchez, R., Kelly, M.P., Dunlop, A.J., Murdoch, H., et al. (2011). The
psychiatric disease risk factors DISC1 and TNIK interact to regulate synapse
composition and function. Mol. Psychiatry 16, 1006–1023.
Wen, Z., Nguyen, H.N., Guo, Z., Lalli, M.A., Wang, X., Su, Y., Kim, N.S., Yoon,
K.J., Shin, J., Zhang, C., et al. (2014). Synaptic dysregulation in a human iPS
cell model of mental disorders. Nature 515, 414–418.
Xu, M., Lee, E.M., Wen, Z., Cheng, Y., Huang, W.K., Qian, X., Tcw, J.,
Kouznetsova, J., Ogden, S.C., Hammack, C., et al. (2016). Identification of
small-molecule inhibitors of Zika virus infection and induced neural cell death
via a drug repurposing screen. Nat. Med. 22, 1101–1107.
Yoon, K.J., Nguyen, H.N., Ursini, G., Zhang, F., Kim, N.S., Wen, Z., Makri, G.,
Nauen, D., Shin, J.H., Park, Y., et al. (2014). Modeling a genetic risk for schizo-
phrenia in iPSCs and mice reveals neural stem cell deficits associated with
adherens junctions and polarity. Cell Stem Cell 15, 79–91.
Yoon, K.J., Ringeling, F.R., Vissers, C., Jacob, F., Pokrass, M., Jimenez-
Cyrus, D., Su, Y., Kim, N.S., Zhu, Y., Zheng, L., et al. (2017a). Temporal
Control of Mammalian Cortical Neurogenesis by m6A Methylation. Cell.
Published online September 28, 2017. https://doi.org/10.1016/j.cell.2017.
09.003.
Yoon, K.J., Song, G., Qian, X., Pan, J., Xu, D., Rho, H.S., Kim, N.S.,
Habela, C., Zheng, L., Jacob, F., et al. (2017b). Zika-Virus-Encoded
NS2A Disrupts Mammalian Cortical Neurogenesis by Degrading Adherens
Junction Proteins. Cell Stem Cell 21, 349–358.e6.
Zy1kiewicz, E., Kija�nska,M., Choi, W.C., Derewenda, U., Derewenda, Z.S., and
Stukenberg, P.T. (2011). The N-terminal coiled-coil of Ndel1 is a regulated
scaffold that recruits LIS1 to dynein. J. Cell Biol. 192, 433–445.
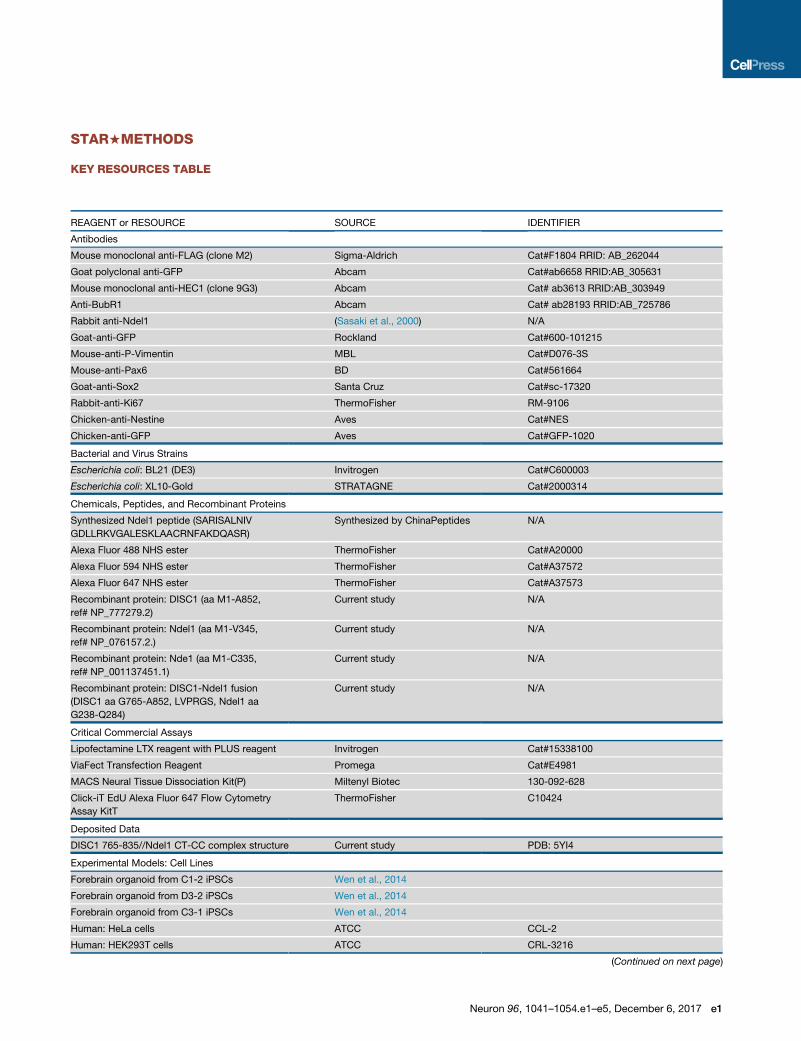
STAR+METHODS
KEY RESOURCES TABLE
REAGENT or RESOURCE SOURCE IDENTIFIER
Antibodies
Mouse monoclonal anti-FLAG (clone M2) Sigma-Aldrich Cat#F1804 RRID: AB_262044
Goat polyclonal anti-GFP Abcam Cat#ab6658 RRID:AB_305631
Mouse monoclonal anti-HEC1 (clone 9G3) Abcam Cat# ab3613 RRID:AB_303949
Anti-BubR1 Abcam Cat# ab28193 RRID:AB_725786
Rabbit anti-Ndel1 (Sasaki et al., 2000) N/A
Goat-anti-GFP Rockland Cat#600-101215
Mouse-anti-P-Vimentin MBL Cat#D076-3S
Mouse-anti-Pax6 BD Cat#561664
Goat-anti-Sox2 Santa Cruz Cat#sc-17320
Rabbit-anti-Ki67 ThermoFisher RM-9106
Chicken-anti-Nestine Aves Cat#NES
Chicken-anti-GFP Aves Cat#GFP-1020
Bacterial and Virus Strains
Escherichia coli: BL21 (DE3) Invitrogen Cat#C600003
Escherichia coli: XL10-Gold STRATAGNE Cat#2000314
Chemicals, Peptides, and Recombinant Proteins
Synthesized Ndel1 peptide (SARISALNIV
GDLLRKVGALESKLAACRNFAKDQASR)
Synthesized by ChinaPeptides N/A
Alexa Fluor 488 NHS ester ThermoFisher Cat#A20000
Alexa Fluor 594 NHS ester ThermoFisher Cat#A37572
Alexa Fluor 647 NHS ester ThermoFisher Cat#A37573
Recombinant protein: DISC1 (aa M1-A852,
ref# NP_777279.2)
Current study N/A
Recombinant protein: Ndel1 (aa M1-V345,
ref# NP_076157.2.)
Current study N/A
Recombinant protein: Nde1 (aa M1-C335,
ref# NP_001137451.1)
Current study N/A
Recombinant protein: DISC1-Ndel1 fusion
(DISC1 aa G765-A852, LVPRGS, Ndel1 aa
G238-Q284)
Current study N/A
Critical Commercial Assays
Lipofectamine LTX reagent with PLUS reagent Invitrogen Cat#15338100
ViaFect Transfection Reagent Promega Cat#E4981
MACS Neural Tissue Dissociation Kit(P) Miltenyl Biotec 130-092-628
Click-iT EdU Alexa Fluor 647 Flow Cytometry
Assay KitT
ThermoFisher C10424
Deposited Data
DISC1 765-835//Ndel1 CT-CC complex structure Current study PDB: 5YI4
Experimental Models: Cell Lines
Forebrain organoid from C1-2 iPSCs Wen et al., 2014
Forebrain organoid from D3-2 iPSCs Wen et al., 2014
Forebrain organoid from C3-1 iPSCs Wen et al., 2014
Human: HeLa cells ATCC CCL-2
Human: HEK293T cells ATCC CRL-3216
(Continued on next page)
Neuron 96, 1041–1054.e1–e5, December 6, 2017 e1
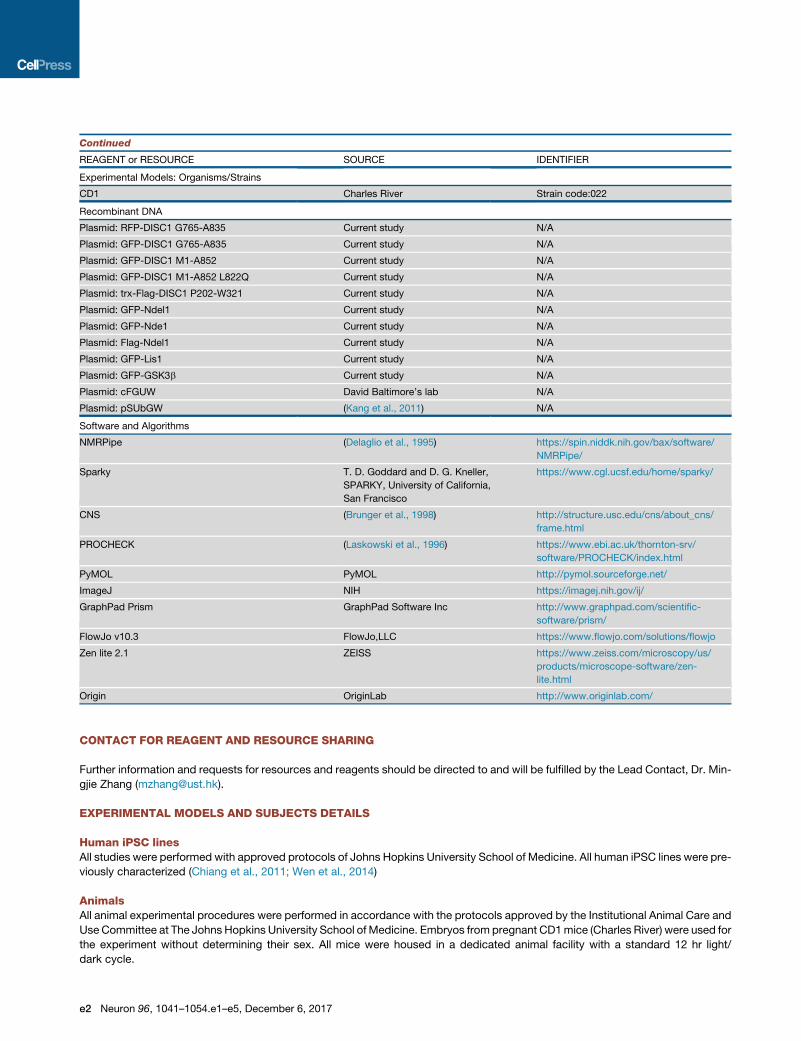
Continued
REAGENT or RESOURCE SOURCE IDENTIFIER
Experimental Models: Organisms/Strains
CD1 Charles River Strain code:022
Recombinant DNA
Plasmid: RFP-DISC1 G765-A835 Current study N/A
Plasmid: GFP-DISC1 G765-A835 Current study N/A
Plasmid: GFP-DISC1 M1-A852 Current study N/A
Plasmid: GFP-DISC1 M1-A852 L822Q Current study N/A
Plasmid: trx-Flag-DISC1 P202-W321 Current study N/A
Plasmid: GFP-Ndel1 Current study N/A
Plasmid: GFP-Nde1 Current study N/A
Plasmid: Flag-Ndel1 Current study N/A
Plasmid: GFP-Lis1 Current study N/A
Plasmid: GFP-GSK3b Current study N/A
Plasmid: cFGUW David Baltimore’s lab N/A
Plasmid: pSUbGW (Kang et al., 2011) N/A
Software and Algorithms
NMRPipe (Delaglio et al., 1995) https://spin.niddk.nih.gov/bax/software/
NMRPipe/
Sparky T. D. Goddard and D. G. Kneller,
SPARKY, University of California,
San Francisco
https://www.cgl.ucsf.edu/home/sparky/
CNS (Brunger et al., 1998) http://structure.usc.edu/cns/about_cns/
frame.html
PROCHECK (Laskowski et al., 1996) https://www.ebi.ac.uk/thornton-srv/
software/PROCHECK/index.html
PyMOL PyMOL http://pymol.sourceforge.net/
ImageJ NIH https://imagej.nih.gov/ij/
GraphPad Prism GraphPad Software Inc http://www.graphpad.com/scientific-
software/prism/
FlowJo v10.3 FlowJo,LLC https://www.flowjo.com/solutions/flowjo
Zen lite 2.1 ZEISS https://www.zeiss.com/microscopy/us/
products/microscope-software/zen-
lite.html
Origin OriginLab http://www.originlab.com/
CONTACT FOR REAGENT AND RESOURCE SHARING
Further information and requests for resources and reagents should be directed to and will be fulfilled by the Lead Contact, Dr. Min-
gjie Zhang ([email protected]).
EXPERIMENTAL MODELS AND SUBJECTS DETAILS
Human iPSC linesAll studies were performed with approved protocols of Johns Hopkins University School of Medicine. All human iPSC lines were pre-
viously characterized (Chiang et al., 2011; Wen et al., 2014)
AnimalsAll animal experimental procedures were performed in accordance with the protocols approved by the Institutional Animal Care and
Use Committee at The Johns Hopkins University School of Medicine. Embryos from pregnant CD1mice (Charles River) were used for
the experiment without determining their sex. All mice were housed in a dedicated animal facility with a standard 12 hr light/
dark cycle.
e2 Neuron 96, 1041–1054.e1–e5, December 6, 2017
HeLa Cells and HEK293T Cells CultureHeLa and HEK293T cells (both from ATCC) were cultured in DMEMmedia supported by fetal bovine serum. The cell lines used in this
study were not further authenticated and not found to be on the list of commonly misidentified cell lines (International Cell Line
Authentication Committee). Cells were tested negative for mycoplasma contamination by cytoplasmic DAPI staining.
METHODS DETAILS
Constructs and Protein ExpressionGenes encoding various lengths of mouse DISC1, Ndel1 and human Nde1 were amplified by PCR and cloned into amodified pET32a
vector. Residue numbers indicated in the study refer to the full-length DISC1 (NP_777279.2; 852 residues), Ndel1 (NP_076157.2; 345
residues) and Nde1 (NP_001137451.1; 335 residues). Recombinant proteins were expressed in BL21-Codon Plus (DE3) Escherichia
coli cells. The N-terminal His6-tagged proteins were purified using an Ni2+-nitrilotriacetic acid agarose column followed by a step of
size-exclusion chromatography (Superdex 200 column from GE Healthcare) in the final buffer of 50 mM Tris-HCl (pH 7.8), 100 mM
NaCl, 1 mMDTT and 1mM EDTA. GST-fused proteins were purified by GSH-Sepharose affinity chromatography, followed by a step
of size-exclusion chromatography. For NMR structure determination, Ndel1 238-284 was fused to the C terminus of DISC1 (765-852)
with a 6-residue thrombin cleavable linker (‘‘LVPRGS’’).
Isothermal Titration Calorimetry AssayITC measurements were carried out on a MicroCal VP-ITC calorimeter at 25�C. Titration buffer contained 50 mM Tris-HCl pH 7.8,
100 mM NaCl, 1 mM EDTA and 1 mM DTT. Each titration point was performed by injecting a 10 mL aliquot of a protein sample
from a syringe into a protein sample in the cell at a time interval of 120 s to ensure that the titration peak returned to the baseline.
The titration data were analyzed by Origin7.0 and fitted by a one-site binding model.
Analytical Gel Filtration Chromatography Coupled with Static Light ScatteringThis analysis was performed on a fast protein liquid chromatography (FPLC) system coupled with a static light-scattering detector
(miniDAWN; Wyatt) and a differential refractive index detector (Optilab; Wyatt). Protein samples (100 ml, concentration of 200 mM)
were loaded to a Superose 12 10/300 GL column (GE Healthcare) pre-equilibrated with an assay buffer containing 50 mM Tris-
HCl pH 7.8, 100 mM NaCl, 1 mM EDTA and 1 mM DTT on an AKTA FPLC system (GE Healthcare). Data were analyzed with Astra 6
(Wyatt).
NMR spectroscopyNMR samples contained 0.8mMof the DISC1 (765-852) fusedwith Ndel1 (CT-CC) protein in 100mMpotassium phosphate at pH6.5.
NMR spectra were acquired at 30�C on Varian Inova 750- and 800-MHz spectrometers each equipped with an actively z-gradient
shielded triple resonance probe. Backbone and side-chain resonance assignments were achieved by the standard heteronuclear
correlation experiments.
NMR structural calculationStructural determination of the DISC1 765-835/Ndel1 CT-CC was aided by fusing Ndel1 CT-CC to the C-terminal end of DISC1 765-
852 with a thrombin cleavable linker. Single chain fusion protein has simplified the NOE assignments, as we can treat the complex as
a single chain protein. The use of the single chain fusion protein is validated by the near identical backbone HSQC spectra of the
protein before and after thrombin cleavage (Figure S2D). Inter-proton distance restraints were obtained from three-dimensional,13C-and 15N-separated NOESY experiments using a mixing time of 80 ms. Hydrogen bonding restraints were generated from the
standard secondary structure of the protein based on the NOE patterns (f and c angles) were derived from the chemical shift analysis
program TALOS. A total of 2098 NOE structural restrains are obtained and classified as short, medium, and long range (Table S1).
Structures were calculated using the programCNS. The 20 lowest energy conformations were obtained. The program Procheck was
used to assess the overall quality of the structures. Figures were generated using PYMOL (http://pymol.sourceforge.net/) and
MOLMOL. Ramachandran statistics for the final ensemble of structures for residues containing secondary structure (residue 773-
801, 805-830 for DISC1 and residue 247-281 for Ndel1) show that 96.5% of residues are in the most favored region, 2.7% of the
residues are in the additionally allowed region, and 0.8% of the residues are in the generally allowed region. None of the structures
exhibit distance violations greater than 0.3 A or dihedral angle violations greater than 4�.
Co-immunoprecipitation and GST Pull-Down AssaysFor the co-immunoprecipitation (Co-IP) assay, cell lysates from HEK293T cells transfected with the full-length Flag-Ndel1, the full-
length GFP-Lis1 and GFP DISC1 765-835 respectively were mixed for 1 hr at 4�C. Then the cell lysate mixtures were incubated with
30 mL of Anti-Flag M2 magnetic beads (Sigma-Aldrich, M8823) for another 30 min at 4�C. The captured proteins were eluted by
boiling, resolved by 15% SDS-PAGE, and immunoblotted with the anti-Flag antibody or with anti-GFP antibody (abcam, ab6658).
For Flag pull-down assay, purified trx-Flag (2 nmol), trx-Flag-tagged DISC1 203-321 (2 nmol) or his-tagged DISC1 765-835
(10 nmol) was incubated with 100 mL of HEK293 cell lysate expressing full-length GFP-GSK3b for 1 hr at 4�C. The mixtures were
Neuron 96, 1041–1054.e1–e5, December 6, 2017 e3
incubated with 60 mL of Anti-Flag M2magnetic beads (Sigma-Aldrich, M8823) for 30 min at 4�C. After three times washing with TBST
buffer, the captured proteins were eluted by boiling, resolved by 15% SDS-PAGE, and detected by immunoblotting with anti-GFP
antibody (abcam, ab6658).
Live cell imagingHeLa cells stably expressing H2B-RFP were seeded onto 24-well culture plates and imaged using a Ti-E inverted fluorescent micro-
scope (Nikon, Tokyo, Japan) equipped with a 10X objective lens, a SPOT BOOST EMCCD camera (Diagnostic Instrument, Sterling
Heights, MI, USA) and an INU-NI-F1 temperature, humidity, andCO2 control system (Tokai Hit, Shizuoka, Japan). Data were acquired
with MetaMorph software (Molecular Devices) for up to 24 hr at 5 min/frame. Images were processed with ImageJ software (NIH).
Kinetochore localization assayHeLa cells were cultured in DMEM containing 10% fetal bovine serum in 10%CO2. Cells were synchronized at early S phase by dou-
ble thymidine (at 2 mM) blocks. During the interval of two thymidine treatments, cells were transiently transfected with 1 mg of each
plasmid per dish with a Lipofectamine PLUS Kit (Invitrogen) in 35-mm dishes. At 9 hr after second release from thymidine, cells were
fixed by 4% paraformaldehyde with 4% sucrose and 0.5% triton in PBS at room temperature for 15 min. After permeabilization with
0.2%Triton X-100 in PBS, cells were stained with primary antibodies at 4�Covernight. After extensive washing with 0.05%Tween-20
in PBS, secondary antibodies coupled with Alexa 488 or Alexa-594 or Alexa-647 (Invitrogen) were used for staining for another 1 hr at
room temperature. Nuclear DNAwas stainedwith 10 mg/ml DAPI. Fluorescent imageswere acquiredwith a Leica sp8 confocal micro-
copy. Mouse Hec1 primary antibody is from Abcam (ab3613). Rabbit Ndel1 primary antibody was provided by Shinji Hirotsune at
Osaka City University (Sasaki et al., 2000).
Culture of human iPSC-derived forebrain organoidsHuman iPSC lines (C3-1; female), C1-2 (male), D3-2 (male) used in the current study were previously fully characterized (Chiang et al.,
2011;Wen et al., 2014). Forebrain-specific organoids were generated as previously described (Qian et al., 2016). Briefly, human iPSC
colonies were detached 7 days after passage with Collagenase Type IV, washed with fresh stem cell medium in a 15ml conical tube.
On day 1, detached iPSC colonies were transferred to an Ultra-Low attachment 6-well plate (Corning Costar), containing 3 mL of
stem cell medium (without FGF-2), plus 2 mM Dorsomorphine (Sigma) and 2 mM A83-01 (Tocris). On days 5-6, half of the medium
was replaced with induction medium consisting of DMEM:F12, 1X N2 Supplement (Invitrogen), 1X Penicillin/Streptomycin,
1X Non-essential Amino Acids, 1X Glutamax, 4 ng/ml WNT-3A (R&D Systems), 1 mM CHIR99021 (Cellagentech), and 1 mM SB-
431542 (Cellagentech). On day 7, organoids were embedded in Matrigel (Corning) and continued to grow in induction medium for
6 more days. On day 14, embedded organoids were mechanically dissociated fromMatrigel by pipetting up and down onto the plate
with a 5 mL pipette tip. Typically, 10 – 20 organoids were transferred to each well of a 12-well spinning bioreactor (SpinU) containing
differentiation medium, consisting of DMEM:F12, 1X N2 and B27 Supplements (Invitrogen), 1X Penicillin/Streptomycin, 1X 2-Mer-
captoenthanol, 1X Non-essential Amino Acids, 2.5 mg/ml Insulin (Sigma).
In utero electroporation and EdU pulsing of mousePlasmids expressing GFP, or the DISC1 765-835 peptide or the DISC1 765-835 L822Q peptide mixed with EGFP expressing plasmid
pSUbGW) (�2mg/ml) were delivered to ventricular zone of embryo brain by in utero electroporation at E13.5 as previously described
(Yoon et al., 2014; Yoon et al., 2017b). Briefly, DNA was injected using a beveled and calibrated micropipette with a�10 mm opening
at 15 psi, then five pulses (43 V, 50 ms in duration with a 950 ms interval) were delivered with tweezer electrodes (CUY650-5, Nepa
Gene) by a CUY21SC electroporator (Nepa Gene). 50 mg/kg of EdU was injected to a mom 24 hr after electroporation and embryos
were sacrificed and fixedwith 4%PFA 6 hr after EdU injection. All animal procedures were performed in accordancewith the protocol
approved by the Institutional Animal Care and Use Committee.
Electroporation and EdU labeling of organoidsAt day 45�47, organoids were transferred into Petri dishes containing 37�CPBS, and 3 ml of plasmids expressing GFP, orDISC1 765-
835 peptide or DISC1 765-835 L822Q peptide in cFUGW vector mixed with EGFP expressing plasmid (pSUbGW) and 0.01% fast
green diluted in sterile PBS was injected into 4-5 ventricle-like cavities of neural tube structures in forebrain organoids at 5 psi, using
a beveled and calibrated micropipette with a �20 mm diameter opening. Five pulses (43 V, 50 ms in duration with a 950 ms interval)
were delivered with tweezer electrodes (CUY650-5, Nepa Gene) by a CUY21SC electroporator (Nepa Gene) as previously described
(Yoon et al., 2017a; Yoon et al., 2017b). Electroporated organoids were transferred back to SpinU bioreactor and cultured until fix-
ation. 4 days after electroporation, organoids were pulsed with 10 mMEdU for 2 hr. Themedia was then replaced and organoids were
washed 3 times with fresh media.
Immunohistochemistry and quantitative analysis of mouse embryo and organoidsAt 5-day post electroporation, organoids were fixed and sectioned at 30 mmusing a cryostat for immunohistochemistry as previously
described (Qian et al., 2016). Brains were sectioned at 20 mm using a cryostat. The following primary antibodies were used: GFP
(goat, 1:250, Rockland), GFP (chicken, 1:250, Aves), PAX6 (mouse, 1:250, BD), KI67 (rabbit, 1:250, ThermoFisher), and SOX2
e4 Neuron 96, 1041–1054.e1–e5, December 6, 2017
(goat, 1:250, Santa Cruz), p-VIMENTINE (mouse, 1:1000, MBL) and NESTIN (Chick, 1:300; Aves). EdU detection was done using
Click-iT� EdU Alexa Fluor� 594/647 Imaging Kit (ThermoFisher C10339) according to the manufacturer’s manual, followed by im-
munostaining for GFP and Ki67. Images were acquired on a Zeiss LSM 710 confocal system (Carl Zeiss, Thornwood, NY, USA) using
a multi-track configuration at 40x magnification. All quantification was performed by counting the number of GFP+ cells within the
Pax6+ layer (defined as VZ) using Zeiss LSM Image browser (Version 4.2.0.121, Carl Zeiss). Quantification was conducted by inves-
tigators blind to manipulation conditions. Cell-cycle exit index was calculated as percentage of GFP+EdU+Ki67- cells/GFP+EdU+
cells in the VZ.
Flow cytometric analysis of cell cycleCortex of electroporated brain were dissociated using MACS� Neural Tissue Dissociation Kit (P) (Miltenyl Biotec) and fixed with 4%
PFA for 20 min. For EdU detection, Click-iT EdU Alexa Fluor 647 Flow Cytometry Assay Kit (ThermoFisher C10424) was used, fol-
lowed by GFP and Vybrant DyeCycle Violet (ThermoFisher V35003) staining. For sorting, 50,000 cells were sorted with Vybrant
DyeCycle Violet (405nm), EdU (640 nm), and GFP (488nm) using FACSJazz Cell Sorter (BD). Each sample from cortex from
2�3mice and sorting was repeated four to six times. Analyses were done using FlowJo_v10.3 (FlowJo, LLC) (Yoon et al., 2017a).
QUANTIFICATION AND STATISTICAL ANALYSIS
All data representMean ± SEM. For two independent data comparisons, unpaired t test and Kolmogorov–Smirnov tests were used to
determine statistical significance. For multiple comparisons, ANOVAs were used as indicated in the text. *p < 0.05, **p < 0.01,
***p < 0.001. n,s; not significant. The ‘‘n’’ are indicated in the summary quantification plots of each experiments. All statistical analyses
were performed using Origin software (OriginLab). All experiments related to cell cultures and imaging studies were performed in
blinded fashion.
DATA AND SOFTWARE AVAILABILITY
Data ResourcesThe atomic coordinates of the DISC1/Ndel1 complex are deposited to the Protein Data Bank under the accession codes PDB: 5YI4.
Neuron 96, 1041–1054.e1–e5, December 6, 2017 e5
Related Documents