Poverty Solutions at the University of Michigan Working Paper Series #4-19 December 2018 Disaster Lending: “Fair Prices, but “Unfair” Access* Taylor A. Begley, Umit G. Gurun, Amiyatosh Purnanandam, Daniel Weagley This paper is available online at the Poverty Solutions Research Publications index at: poverty.umich.edu/publications/working_papers Any opinions, findings, or recommendations expressed in this material are those of the author(s) and do not necessarily reflect the view of Poverty Solutions or any sponsoring agency.

Welcome message from author
This document is posted to help you gain knowledge. Please leave a comment to let me know what you think about it! Share it to your friends and learn new things together.
Transcript
Poverty Solutions at the University of Michigan Working Paper Series
#4-19
December 2018
Disaster Lending: “Fair Prices, but “Unfair” Access*
Taylor A. Begley, Umit G. Gurun, Amiyatosh Purnanandam, Daniel Weagley
This paper is available online at the Poverty Solutions Research Publications index at: poverty.umich.edu/publications/working_papers
Any opinions, findings, or recommendations expressed in this material are those of the author(s) and do not necessarily reflect the view of Poverty Solutions or any sponsoring agency.
Disaster Lending: “Fair” Prices, but “Unfair” Access∗
Taylor A. Begleya
Umit G. Gurunb
Amiyatosh Purnanandamc
Daniel Weagleyd
First Draft: March 21, 2018
This Draft: December 3, 2018
Abstract
The use of risk-insensitive loan pricing by the Small Business Administration’sdisaster loan program leads to significantly higher loan denials in areas with greaterneed for price discrimination: high minority share, high subprime share, and highincome inequality areas. Even though these borrowers are often the intended targetsof government programs such as disaster lending, they end up with lower availabilityof credit in this program compared to private markets. Our findings highlight theimportance of using market prices as a mechanism to allocate credit across borrowers,a feature that is often absent from government lending programs around the world.Applicants that would likely receive a loan at a higher interest rate under a risk-sensitivepricing mechanism are instead denied credit altogether. Programs that limit the use ofthis mechanism to ensure a “fair” price of credit across borrowers may have unintended“unfair” consequences on the quantity of credit to marginal borrowers.
Keywords: credit access, discrimination, income inequality, government lending,unintended consequences
JEL Classification: G21, G28, H81, H84
∗We are grateful to Sugato Bhattacharyya, Geoffrey Booth, Bill Cready, Rohan Ganduri, John Griffin,Peter Haslag, Uday Rajan, and seminar and conference participants at Emory, Georgia Tech, Johns Hopkins,Koc University, Washington University in St. Louis, and the 2018 Red Rock Finance Conference for helpfulcomments on the paper. A previous version of this paper was entitled “Disaster Lending: The DistributionalConsequences of Government Lending Programs.”
aOlin Business School, Washington University in St. Louis; email: [email protected] of Texas at Dallas; email: [email protected] School of Business, University of Michigan; email: [email protected] Institute of Technology; email: [email protected].
1 Introduction
Prices play a central role in the efficient allocation of resources in market-based economies.
Credit markets are no different. Nearly all theoretical and empirical work in banking is
grounded on the basic idea that lending rates should reflect the credit risk of borrowers, with
riskier borrowers paying higher interest rates on their loans. However, a number of lending
programs conducted by government agencies and development banks around the world violate
this principle and charge rates that do not vary according to credit risk. That is, these
lending programs typically offer borrowers a subsidized interest rate without (or with limited)
risk-based pricing. In many cases, the price is fixed: all borrowers who receive credit do so at
the same interest rate. While such risk-insensitive lending programs seem “fair” in the sense
that they treat all borrowers equally in terms of pricing, they may end up being “unfair”
to lower quality borrowers who would only be deemed creditworthy under a risk-sensitive
pricing mechanism. In this paper, we study the consequences of these fixed-price government
lending programs on the allocation of credit using an important U.S. government lending
program: disaster-relief loans provided by the Small Business Administration (SBA).1
The typical goal of many government lending programs, including the disaster lending
program that we study, is to alleviate frictions in access to credit for marginal borrowers by
providing them credit in the time of crisis. Given this focus, it is reasonable to expect that
marginal borrowers are better served by government lending programs compared to private
markets. However, there is an opposing force at work here. Governments face pressure to
minimize taxpayer losses while conducting these programs. Indeed, the SBA’s mandate is to
break-even on the loans it makes under the disaster lending scheme. Therefore it extends
credit to only those borrowers who are expected to provide nonnegative rate of return at the
1We focus on the disaster-relief loan program because of data availability. The application of our work ismuch broader. The U.S. government alone currently has over 50 loan programs covering a wide range ofborrowers: farmers, veterans, students, small business owners and homeowners and there are vast numbers ofprograms with similar features around the world. See https://www.govloans.gov/loans/browse-by-categoryfor further details.
1
SBA’s fixed interest rate. Some high risk borrowers are likely to be creditworthy only at a
higher interest rate. By fixing the price of credit, these borrowers are now likely to be denied
credit altogether. Thus marginal borrowers may face greater loan denial rates relative to a
risk-sensitive pricing mechanism, which would provide them access to credit at higher interest
rates.2 Which of these two forces dominate? Are marginal borrowers getting better or worse
outcomes in terms of access to credit in these programs compared to private markets? This
is the central question we study in this paper.
The objective of the SBA Disaster loan program is to provide access to credit for households
and businesses that are victims of natural disasters such as hurricanes, fires, and earthquakes.
The loans are given at a highly-subsidized fixed-rate to all borrowers who qualify. Similar to
a typical mortgage application, SBA loan officers screen loan applications for creditworthiness
using a variety of documentation for income, employment, and assets. Despite the subsidized
nature of the program, the SBA are vigilant to avoid fraud and to generally be good stewards
of taxpayer dollars. This includes denying applicants whose credit profile cannot justify the
risk-insenstive, subsidized program borrowing rate. For higher-risk borrowers, their lower
expected future payments cannot be offset by charging a higher interest rate. Thus, borrowers
who may be sufficiently creditworthy at a higher interest rate are simply denied credit. Since
these loans provide aid and access to credit for borrowers at a time of acute need – after
natural disasters – denial is likely particularly costly to these higher-risk borrowers.
We obtained data on the credit allocation decisions for the SBA disaster-relief loan
program for a large set of natural disasters using a Freedom of Information Act request.
The data cover over a million loan applications across the United States between 1991 and
2015 and allow us to conduct our empirical analysis at a granular level. In contrast to most
publicly available databases of government lending programs, our data contain both approved
2Just as in a market setting with a price ceiling, it naturally follows that there is likely to be excess, unmetdemand. At a broad level, our work relates to one of the oldest debates in economics about the trade-offsinvolved in a fixed price system versus a market price system. In labor economics, for example, dating backat least to Stigler (1946), there have been numerous studies evaluating the costs and benefits of minimumwage legislation. A related issue arises in health insurance policy (e.g., Bundorf, Levin, and Mahoney, 2012).
2
and denied applications for these government loans.
We test for the effect of risk-insensitive loan pricing by comparing the loan denial rates of
applicants from areas with a higher need for price discrimination (NPD) to loan denial rates
of applicants from areas with lower NPD. Areas with greater dispersion in credit quality, and
those with greater mass in the “marginal” portion of the credit quality distribution have a
higher need for risk-based pricing to receive credit. We use three proxies for NPD in our tests:
areas with higher share of minority population, areas with a large share of subprime borrowers
based on FICO scores, and areas with higher income inequality. Our hypothesis is that the
combination of borrower screening for credit quality and the inflexibility of prices may lead
to higher denial rates for applicants from these marginal areas. Alternatively, government
program’s–which often have explicit goals to reach and support such populations–may be
better equipped to provide credit in these areas, which would lead to a relatively lower denial
rate in these areas.
To credibly evaluate these questions and hypotheses, we need a reasonable benchmark. In
particular, our goal is to compare outcomes of the government-run, fixed-price (SBA) scheme
to potential private-market or government-insured lending where the price is flexible. When
examining the denial rates in the SBA’s scheme, it is important to account for a baseline
level of denials that occur as a result of credit rationing. That is, in lending markets where
there is asymmetric information, we expect there will be a baseline level of rationing (Stiglitz
and Weiss, 1981) even with risk-sensitive pricing.3 Also, prior work has shown lower access
to credit for minorities even in private markets (see, e.g., Munnell, Tootell, Browne, and
McEneaney, 1996). We examine whether there is excess credit rationing of these groups in
the SBA’s risk-insensitive pricing program compared to lending with risk-based loan pricing.
We use the denial rate in the private home mortgage market as our baseline risk-sensitive
pricing counterfactual. This comparison group captures the baseline rationing including any
3The core idea behind this channel is that raising the interest rate beyond a point can result in adverseselection in the borrower pool: as interest rates reach high levels, the quality of the willing borrowers at thatrate deteriorates.
3
potential biases that persist in those markets. Specifically, the private-market denial rate,
obtained from the Home Mortgage Disclosure Act (HMDA) database, captures variation in
denial rates due to observable and, importantly, unobservable differences in the credit quality
distribution across counties.
We focus particularly on HMDA refinancing loans because this is the private market
lending category that is closest to SBA home loans: both these loans are geared toward
borrowers who are already home owners. We also use Federal Housing Administration (FHA)
loans as another counterfactual. FHA loans are issued by private banks, but insured by
the government. Despite government insurance, FHA loans do not follow a fixed-price, risk-
insensitive pricing regime. The borrower pool in the FHA loan program is of lower average
credit quality than the pool of conventional borrowers and so makes a natural comparison
group for our SBA applicants who reside in areas with high NPD. Because FHA and SBA
exhibit similarities with respect to incentives, constraints, and target borrower population,
comparing the denial rates across these two programs allows us to tease out the difference in
credit access that arises due to lack of risk-based pricing.
We primarily focus on the minority share of the applicant’s county as our key NPD
measure. Minority share captures both hard and soft information about the borrower pool
in ways beyond what is captured by subprime share and income inequality. For example,
Bayer, Ferreira, and Ross (2016) show that minority borrowers default at a higher rate
even conditional on observables like credit score. This can be potentially due to unobserved
credit risk factors such as lower levels of wealth, higher employment volatility, or weaker
access to informal financing networks like friends and family, among other things. Thus, we
would expect higher interest rates in high-minority-share areas in private markets since the
interest rate can be adjusted based on the borrower’s “true” credit quality. It is precisely
these borrowers that are most likely to be denied credit under the SBA’s program since, by
construction, its rates are inflexible. Additionally, the use of minority share allows us to
document the disparate impact (i.e., heterogeneity in consequences) of the risk-insensitive
4
interest rates across demographic groups. Fair access to credit for minority borrowers has
been one of the central themes of U.S. banking regulation over the past fifty years with
regulations such as the Fair Housing Act (1968) and the Equal Credit Opportunity Act (1974).
These are intended to ensure private lenders provide fair access to credit across borrowers of
different race, religion, gender, etc. In contrast to steering private market behavior to serve
government objectives, we are able to examine how the government’s own direct lending to
its citizens fares on this dimension.
We find that the SBA program denies loan applications at a significantly higher rate in
counties with a greater need for price discrimination, and this differential exists even after
controlling for the HMDA private-market denial rate. The result holds for each of the three
proxies of NPD we use: subprime share, minority share, and income inequality of the county,
but the results are strongest for counties with higher minority population share. The result
is not explained by the per capita income of borrowers, or the extent of losses incurred in
the disaster. A one-standard-deviation increase in minority population is associated with
a 3.3 percentage points higher denial rate. With the average denial rate in our sample at
46%, these results are economically significant. These relationships are robust across different
sample periods, they are not driven only by certain natural disasters (e.g., hurricane versus
flooding), and they hold for both large and small disasters. In sum, these results provide
evidence that the loans in this scheme are not reaching borrowers in high minority areas at
the same rate as low minority areas even after accounting for baseline differences in denial
rates using the HMDA data.
We next collapse our loan-level data to county-year denial rates. Using these data and
the HMDA denial rates for the same county (one year prior to the disaster), we estimate
the difference in denial rate across the different programs (SBA vs. risk-sensitive pricing
programs) for counties with different NPD. We find that a one-s.d. increase in minority
share corresponds to a 2.7 pps higher denial rate under the SBA program relative to the
risk sensitive HMDA loans. Similar results hold when we compare denial rates in the SBA
5
program to FHA loans that are government insured, but with flexible pricing. Interestingly,
in these tests, we find no evidence that the FHA loan applicants are denied at a higher rate in
areas with greater need for price discrimination. For counties in the top quartile of minority
share, the within-county estimates indicate a denial rate that is 8pps higher than the denial
rate in the low minority share counties after controlling for the corresponding FHA loan
denial rate.
These results paint a clear picture. Despite some concerns and issues surrounding the
behavior of private markets in providing “fair” access to credit, risk-sensitive private market
and government insured loan programs grant loans to a significantly larger fraction of
borrowers in higher minority areas as compared with the SBA’s risk-insensitive lending
program. To the extent a key goal of the government is to provide equal access to credit for
all demographic groups, the SBA’s risk-insensitive pricing program fares worse in achieving
this goal compared to its flexible pricing counterparts.
An alternative explanation of our result is the possibility of taste-based discrimination. If
the SBA program’s loan officers are prejudiced against minorities (beyond any potential bias
in the private market), we would expect relatively higher denial rates in higher-minority-share
areas. Becker (1957) argues that profit motivations can eliminate such discrimination in the
marketplace. While there is a clear mandate that the SBA is to strive to be faithful stewards
of tax dollars, their incentives to do so may be weaker than the profit motive in private
markets. We investigate whether taste-based discrimination could be driving the results by
examining the default performance of approved disaster loans. In the context of the labor
market, Becker (1957) argues that if minorities are discriminated against due to employer
taste (i.e., distaste for minorities), then minority performance should be relatively better
conditional on getting the job. We apply the same idea to the lending market. If there exists
taste-based discrimination in the SBA program against applicants from high minority areas,
then the marginal approved borrower in these areas should be of relatively higher quality.
Hence, lower ex-post default rates for high minority areas would support active taste-based
6
discrimination. We do not find such evidence.
We provide some context on the economic importance of our results by estimating the
additional loans that would have been approved in areas with a higher minority population
had these areas experienced similar denial rates as the lower minority population areas. If
applicants, conditional on similar income, in all quartiles of minority population were to
receive loans at the same approval rate as the first quartile (i.e., lowest minority population),
our estimates show that about 44,000 additional homeowners (about 4% of the size of the
program) would have received loans, which adds up to a grand total of about $1.5 billion.
The economic importance of this number is amplified in light of the setting, post-natural
disaster, when the marginal value of credit is especially high.
Overall, our paper documents important disparities in access to government-provided
credit across areas with different racial composition. Further, our results highlight important
unintended consequences of the risk-insensitive pricing schemes that are typically employed
by government lending programs. Clearly, there are some benefits of risk-insensitive pricing
including the perception of fairness. However, these benefits come at a significant cost in
terms of a higher denial rate than would be observed under a risk-sensitive pricing scheme.
The excess denial rates are especially severe for the populations that are often the intended
target of government assistance such as areas with higher minority populations.
Our work relates to government intervention in setting prices in a number of contexts,
such as the labor market, health insurance market, or rental markets, to name a few (see
Stigler (1946) and Bundorf et al. (2012) for example). Rose (2014) provides a recent synthesis
of the literature on the consequences of price and entry controls on a broad spectrum of
industries. Closer to our paper is recent work on the mortgage market, where risk-insensitive
products are usually associated with government-sponsored enterprises (GSEs): the Federal
National Mortgage Association and the Federal Home Loan Mortgage Corporation. These
GSEs can affect borrower access to credit through their role in the secondary market for
7
residential mortgages. Specifically, GSEs can discourage regional risk-sensitive pricing. Hurst,
Keys, Seru, and Vavra (2016) show that the GSEs charge uniform prices across different
areas even though there is significant variation in predictable default risk across regions.
Kulkarni (2016) explores the interactions between the GSEs uniform pricing policies and how
they affect credit availability to borrowers in regions with borrower-friendly laws. Adelino,
Schoar, and Severino (2016) argue that the credit expansion before the 2008 crisis was driven
by inflated optimism about home prices, making lenders insensitive to borrower and loan
characteristics. Our paper contributes to the underlying research theme of this literature.
2 SBA Disaster Loan Program
The Small Business Administration (SBA) Disaster Loan Program provides loans to
individuals and businesses who are victims of disasters declared by the President or the SBA.
Since program inception, over 1.9 million loans totaling over $47 billion have been approved
by the SBA (Lindsay, 2010). Our study focuses on loans to individuals, where borrowers use
loans to repair or replace real estate and personal property beyond what is covered by home
insurance.
In the wake of a disaster, the SBA must process loan applications, perform inspections,
make lending decisions, contract with borrowers, and disburse funds. Loan officers from the
SBA assess applicants’ creditworthiness when determining whether or not to approve the loan.
The lending decision is based on a number of factors that largely mirror the typical mortgage
application process: an acceptable credit history, an ability to repay loans, and collateral
(if available). Documentation includes items such as prior tax filings and documentation of
employment. The application approval decision cannot be explicitly driven by an applicant’s
race, color, national origin, or gender. During the loan review process, an appraiser will verify
the applicant’s loss, and the size of the loan will be capped by the amount of approved loss.
8
Although projecting loan performance is a driving influence in the screening process, the
SBA does not price loans differentially according to applicant risk. The loan interest rate
is determined by a statutory formula based on the government’s cost of borrowing. For
individuals seeking home loans, there are only two possible interest rates: a lower rate for
borrowers who do not have “credit available elsewhere” (as determined by the SBA) and
a higher rate for borrowers who do have credit available elsewhere. The interest rates are
calculated for each disaster given the government’s current cost of borrowing. For individuals
determined to have credit available elsewhere, the statutory rate is the government’s cost
of borrowing on similar maturity debt obligations plus an additional charge not to exceed
one percent, with an overall maximum interest rate of 8%. For individuals without credit
available elsewhere, the statutory rate is one-half the government’s cost of borrowing plus an
additional charge not to exceed one percent, with a maximum rate of 4%.4 For both types of
borrowers, the rate is typically lower than the current interest rate on a 30-year mortgage,
which minimizes concerns of selection bias in the applicant pool. The determination of credit
available elsewhere is made by the SBA based on the applicant’s credit score, cash flow, and
assets (SBA Standard Operating Procedure (2015)). The vast majority of borrowers in our
sample receive the lower rate. Importantly, there is no variation in the interest rate across
borrowers based on credit risk (conditional on the credit-available-elsewhere designation).
For illustrative purposes, we provide the interest rate menu for Texas counties affected by
Hurricane Harvey (Disaster TX-00487) in Figure A.1. Table A.1 provides details on the
interest rate caps, repayment terms, and eligible borrowers for each type of loan.
The SBA is not a profit-maximizing institution, as evidenced by the subsidized interest
rates on the disaster loans. The SBA does, however, balance the objective of lending to
borrowers in need (and any accompanying externalities) against the budgetary costs incurred
by increasing capital availability at subsidized rates. Said differently, there is a strong
emphasis on being a good steward of taxpayer dollars as shown by the fact that the SBA
4The formula for statutory rates is provided in Section 7 of the Small Business Act.
9
screens applicants based on their creditworthiness. Anecdotal evidence indicates there is
significant scrutiny of the SBA disaster loan program’s performance in both its efficiency in
allocating capital and overall budgetary costs. For example, a 1997 congressional budget office
report raised concerns about the SBA disaster loan program’s budgetary costs and suggested
increasing the interest rate on loans to reduce the overall budgetary costs (Congressional
Budget Office (1997)). This focus on screening combined with the inflexibility in interest
rates may lead to greater denials of borrowers of marginal credit worthiness than if the SBA
were allowed to adjust interest rates based on borrower credit quality. We discuss this idea
further in the next section.
3 Research Design
The role of price in allocating resources is a central concept in economic theory. Credit
markets are no different. When lenders are able to charge interest rates based on the risk
profile of the borrowers (i.e., price discriminate), more borrowers will have access to credit.
Fixed-price lending programs (with screening), on the other hand, ration some borrowers
from the market: once the expected loss rate on the loan exceeds the rate the lender can
charge, the borrower is simply denied credit rather than charged a higher rate commensurate
with their risk.5 The importance of risk-sensitive pricing in allocating credit to high-risk
borrowers motivates our key hypothesis: areas with a higher fraction of applicants with
marginal credit quality have higher denial rates due to risk-insensitive pricing.
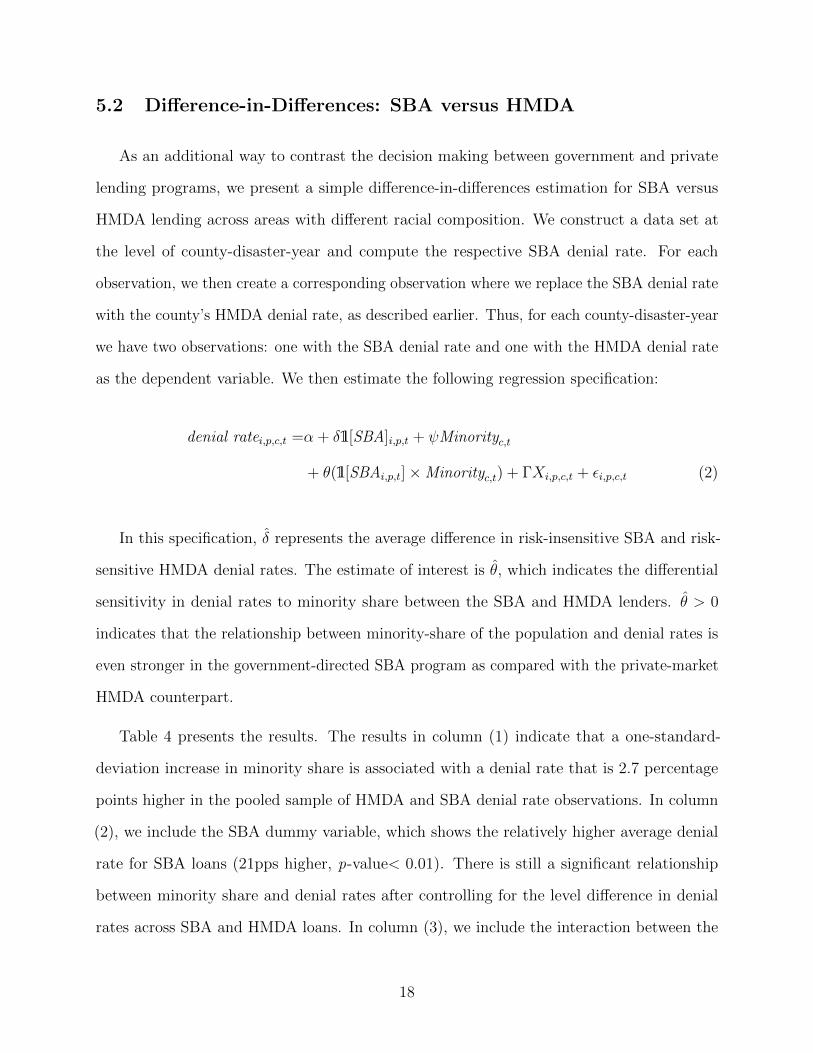
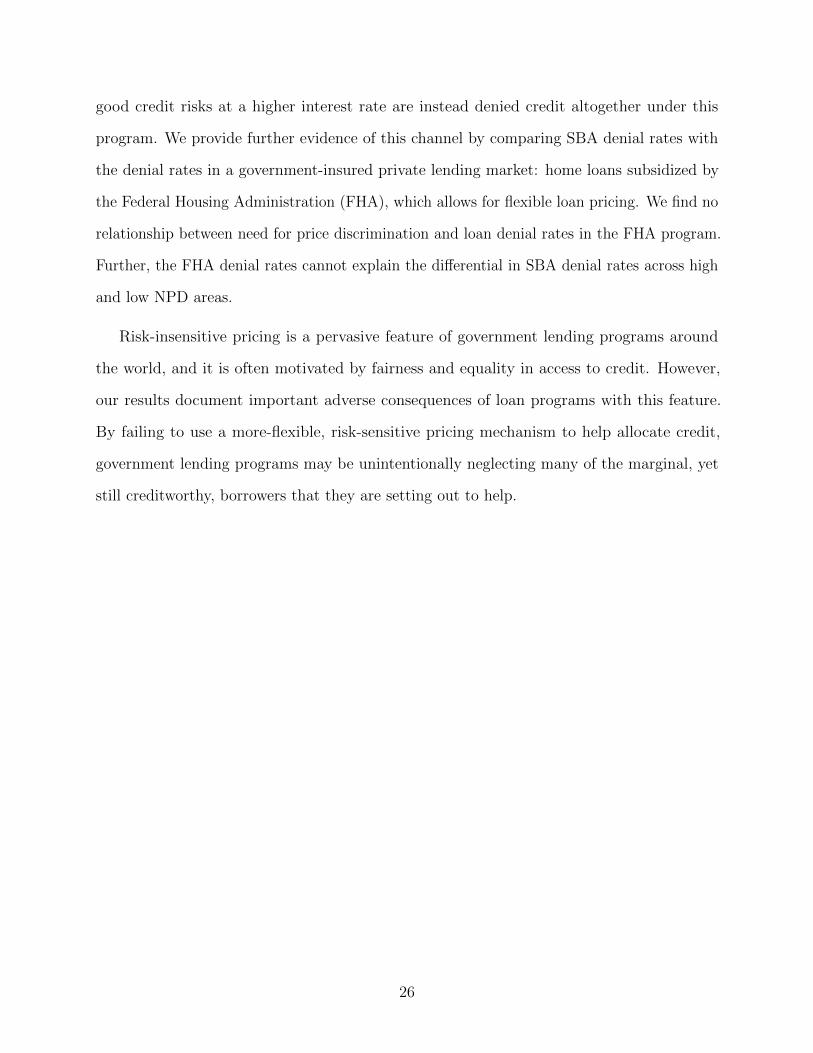
Our core idea is summarized in Figure 1. The graph plots the market-determined interest
rate as a function of borrower credit risk. All borrowers below the credit threshold denoted
by Market Threshold are denied credit even with a risk-sensitive pricing mechanism. This
happens because lenders even in the private market are unable to observe the true credit
5In our setting it is when the fixed rate the SBA charges plus the subsidy of the program exceeds theexpected loss rate on the disaster loans.
10
quality of borrowers, and hence deny credit to borrowers with sufficiently high observed credit
risk. We also plot the SBA’s interest rate as a function of credit risk. The SBA function is a
flat line below the market interest rate since the SBA prices its loans at a subsidized rate
that is below the market rate for all borrowers.6 The SBA makes all loans that are above
the threshold denoted by SBA Threshold. This threshold is determined by the maximum
subsidy SBA is willing to pass on to borrowers. For borrowers that fall below this threshold,
SBA simply refuses credit instead of adjusting its price. Thus, there are excess denials in
SBA lending compared with the private-market benchmark. Our empirical tests are aimed
at teasing out this excess denial by exploiting variation across areas that differ in terms of
the fraction of the population that falls between the private-market and SBA threshold (i.e.,
variation in the share of applicants with marginal credit quality).
This discussion also underscores the empirical difficulty in estimating the effect of risk-
insensitive pricing on the SBA’s credit allocation decision. The goal of an ideal research
design is to estimate the proportion of borrowers that fall between the market threshold
and the SBA threshold. We do not observe these thresholds. A positive correlation between
areas with higher NPD and SBA loan denial rate could simply be capturing the fact that
private lenders also ration credit at higher rates in such markets. We need to account for this
effect. Our setting is attractive because we are able to observe the credit allocation decision
in the private lending market for the same areas. Specifically, we observe the approval/denial
decision of applications for home mortgage loans made to nearly all a private lenders in the
U.S. For every county, we are able to obtain data on denial rates for all borrowers in the
HMDA data set for non-disaster years. Our primary analysis controls for the denial rate
in the HMDA database for all refinancing loans made in that county in the most recent
non-disaster year. The idea behind this test is simple: if the HMDA denial rate is a sufficient
statistic of private market rationing, then we should be able to isolate the effect of the NPD
variable using the following regression model estimated with all SBA loans:
6Our main idea remains the same if the SBA rate is above the market determined rate for the best riskborrowers, however this is not the case.
11
denyi,c,t = α + ψNPDc,t + ρ(HMDA Denial)c,t + ΓXi,c,t + δd,t + ζs + εi,c,t (1)
denyi,c,t is an indicator variable equal to one if loan application i, originated from county
c in year t, was denied. NPDc,t is the need for price discrimination in county c at time t.
We use three proxies for need for price discrimination: the minority share, the subprime
share, and the income inequality (Gini coefficient) of the application county. These three
proxies should capture the relative mass of applicants in the county credit quality distribution
between the private-market risk-sensitive threshold and the SBA risk-insensitive threshold.
For most of our analysis, we focus on minority share because it is empirically the strongest
predictor of loan denial. HMDA Denialc,t is the private-market denial rate for county c in the
most recent non-disaster year for a disaster in year t. This variable will capture the baseline
credit rationing in the home mortgage market. Xi,c,t includes county- and loan-level control
variables, which we discuss in greater detail in Section 4.
We include state fixed effects (ζs) to separate out the effect of any state-by-state differences
in the implementation of SBA disaster loans. As noted earlier, these loans come under the
federal program, and therefore they have the same terms for all borrowers irrespective of where
the disaster strikes. However, there may be a concern about differences in the implementation
at the state level, which we absorb with state fixed effects. We also include a fixed effect that
is disaster-type× year specific (denoted δd,t). This fixed effect, by construction, soaks away
variations that are specific to a certain type of disaster in a given year (e.g., hurricanes in
2005). Inclusion of disaster-type fixed effects in the model allows us to control for differences
in lending policies or borrower needs or characteristics across different types of disasters. By
interacting this with year of disaster, we are able to remove the effect of macroeconomic
trends, including issues such as budgetary constraints of the government or variation in
national policies concerning these programs. In the end, this specification allows us to exploit
the cross-sectional variation in the need for price discrimination across different counties,
12
holding fixed statewide differences and time-varying disaster-type differences in SBA’s lending
policies.
In addition to including HMDA Denialc,t as a control variable, we also use it as an outcome
variable in a difference-in-differences research design. For those tests we compare the relative
sensitivity of county-level denial rates to NPD for private-market loan applications versus
SBA applications. We discuss this test more fully in the results section.
In some tests, we use the denial rate of Federal Housing Administration (FHA) program
loans as our counterfactual measure of loan denial instead of the broader HMDA denial rate.
The FHA denial rate is a good counterfactual for our study for a number of reasons. First,
FHA loans are also insured by the government, so the FHA program will have some similar
incentives and constraints as the SBA. Second, FHA loans are priced by the private-market
lenders that issue them, so we are comparing a risk-insensitive loan program to a risk-sensitive
loan program. Third, the borrower pool in the FHA loan program is typically composed of
more marginal-quality borrowers.
We also perform tests that examine differences in ex-post loan performance across groups.
As we will describe more in the results section, taste-based discrimination has implications
for the relative performance of approved loans. Specifically, better default performance (i.e.,
lower default rates) in high-NPD (e.g., high-minority) areas would be evidence consistent
with taste-based discrimination.
4 Data and Sample
We obtained the data on SBA Disaster individual loans through a Freedom of Information
Act request. A key feature that distinguishes our data from the publicly available disaster
data is that we have loans that were denied in addition to those that were approved. Our
final data set includes around 1.2 million loan applications from 1991 to 2015. These data
13
include the state and county of the applicant, the applicant’s verified loss as a result of the
disaster (e.g., property damage), the disaster description (e.g., Hurricane Andrew), the loan
approval or denial decision (SBA Denial), and default (i.e., chargeoff) data on approved
loans.
Table 1, Panel A, presents the number of applications and denial rates across different
types of disasters. Nearly half of the applications in our sample are from hurricanes. The
broad category of “severe weather” has nearly one-third of our applications. These loan
applications are in response to disasters including tornadoes, severe thunderstorms, hail, and
flooding. There are also a substantial number of applications following earthquakes, with
the majority of those coming in response to the 1994 Northridge earthquake in Los Angeles,
California. As we can see from the table, there is variation in the denial rate across different
types of disasters, but it is broadly in the range of 40-50%.
In Panel B of Table 1, we list the top ten disasters in terms of number of loan applications
in our sample. Hurricane Katrina, is the largest disaster, with over 200,000 applications.
While some of the largest disasters cluster around 2004-2005, there is clearly variation in
the timing of disasters over time. This variation allows us to separate out the effect of
macroeconomic trends from the main effect we are interested in.
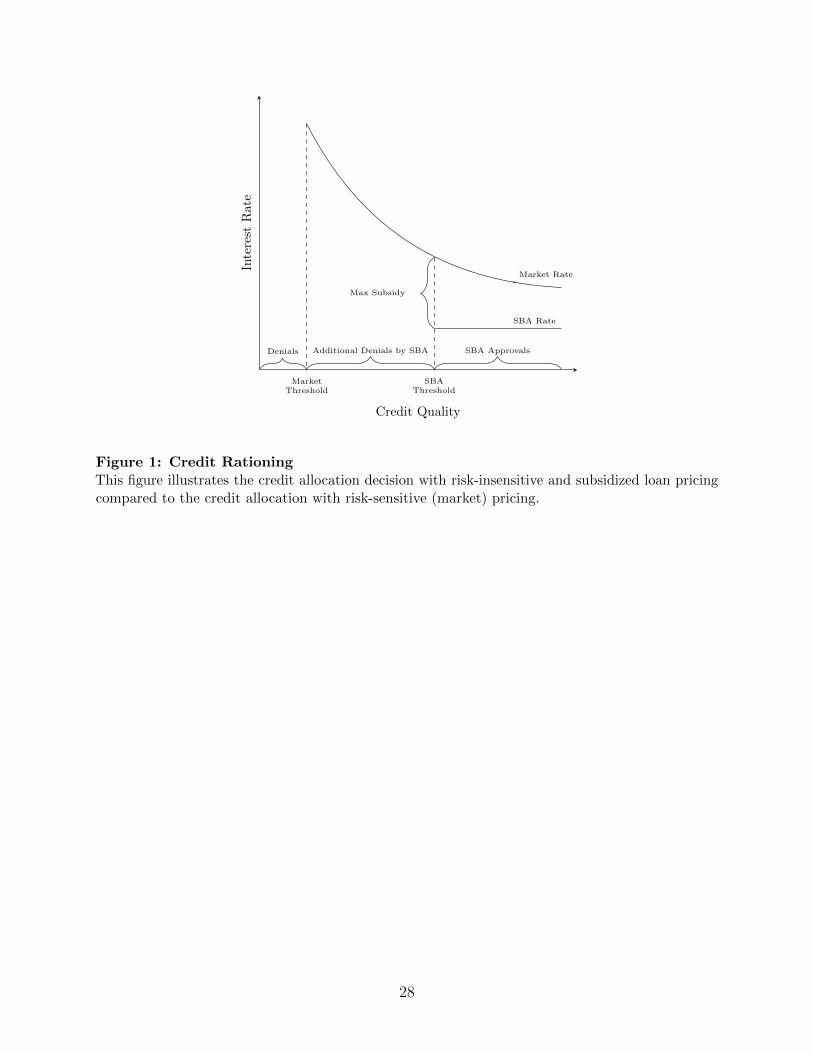
Figure 2 shows the geographical variation in the number of applications during our sample
period, with the largest number of applications coming from the Gulf Coast and California.
Figure 3 presents the time series of applications and denial rates during the sample. The
denial rate varies in the range of 30-60% over the sample period.
We obtain data on private-market lending from the the Home Mortgage Disclosure Act
(HMDA) data for the years 1991-2015. These data include the vast majority of home purchase
and refinancing loan applications and lending decisions in the U.S. for that time period. To
most closely mirror the SBA applicants (most of whom already own their home), we focus on
the HMDA refinancing applications. From these applications, we compute the county-level
14
denial rate for refinancing loans during the most recent year in which the county did not
experience a disaster and match this to the relevant SBA loan applications in that county.
The HMDA denial rate at the county level (HMDA denial) serves as our control for the
baseline variation in denial rates in private markets.7 We also use the denial rate for the
subsample of HMDA that are made through the FHA program.
We use three key explanatory variables in our tests. We refer to them broadly as the
Need for Price Discrimination or NPD measure. Our first measure is the fraction of the
minority population in the county from the Census. The use of this variable as a proxy for
NPD is motivated by a large literature on racial differences in lending markets, which has
shown evidence of observable and unobservable differences in credit quality across groups.
The second NPD measure is the percentage of individuals with Equifax subprime credit
scores (<660) in a county, which is only available from 1999 onwards. This data is from
the St. Louis Federal Reserve (FRED) database. The third NPD measure is the level of
income inequality in the area. Such areas have borrowers on both extremes of the income
distribution, and thus the underlying credit dispersion is likely to be higher. We use the
county-level Gini index from the U.S. Census and American Community Survey data to
measure income inequality. We obtain this measure for 1990, 2000, and 2010. We assign the
1990 Gini measure for disasters during 1991-1999, the 2000 Gini measure for disasters during
2000-2009, and the 2010 Gini measure for disasters during 2010-2015.
The U.S. Census data also provides county population, and the St. Louis Federal Reserve
(FRED) database provides the county-level per capita income data. In addition, we obtain
data on verified losses incurred by the borrower as assessed by SBA appraisers from the SBA
database.
Table 2 presents summary statistics for the variables used in our regression analysis.
All dollar amounts are adjusted to year 2000 dollars. There is substantial variation in the
subprime share, minority share, Gini, income, and population of the counties in the sample.
7The results are similar using contemporaneous year or averages of two or three prior years.
15
The SBA denial rate of 46% is considerably higher than the average HMDA denial rate of
21% and FHA denial rate of 12%.
5 Results
5.1 SBA Denial Rate Across Areas
We begin our analysis by documenting the relationship between the approval/denial
decision by the SBA and the need for price discrimination (NPD) in the disaster-struck
county. Our initial tests examine two measures of NPD: the subprime share of the county
and the minority share of the county. We estimate regression equation (1). We standardize
all continuous independent variables to have mean zero and unit standard deviation, and we
cluster the standard errors at the county level.
Table 3 presents the results. Columns (1)-(3) present the results using subprime share as
the NPD proxy, and columns (4)-(6) present the results using minority share.8 In columns (1)
and (4), we present results for the base specification controlling only for state and disaster-year
fixed effects. We find that a one-standard-deviation higher subprime share is associated
with an increase of 3.8 percentage points (p-value<0.01) in the loan denial rate. Similarly,
a one-standard-deviation higher minority share is associated with a denial rate that is 4.6
percentage points higher. These results suggest that areas with greater NPD experience
significantly higher loan denial rates.
We next include controls for per capita income, population, verified loss, and the HMDA
denial rate. The HMDA denial rate is the denial rate in the most recent year without a
disaster as described in Section 4. The underlying identifying assumption is that conditional
on the HMDA denial rate, there is no remaining unobserved credit rationing that would occur
8The number of observations is smaller when subprime share is included because we only have subprimeshare data from 1999 onwards.
16
with risk-sensitive pricing that correlates with subprime (or minority) share and the denial
rate in disaster loans. The comprehensive nature of the HMDA data set and the comparability
of lending products in the HMDA loan market and SBA disaster loans provide support for
this assumption. In columns (2) and (5), we report the results for the main regression
specification that includes other county- and loan-level control variables. As expected, areas
with higher private market denial rate experience higher denial rates in the SBA program, but
the inclusion of the HMDA denial rate and other control variables does not explain away the
relationship between NPD and loan denial. The point estimates on the NPD proxy slightly
decrease to 2.3 and 3.3 percentage points (p-value<0.01) for subprime and minority share,
respectively. These coefficients estimates are highly significant and economically important.
In columns (3) and (6), we examine the effect across NPD quartiles. The effect increases
monotonically as one moves from the lowest to highest quartile of NPD. We find counties
in the highest subprime share quartile have a denial rate that is 4.3 percentage points
(p-value=0.02) higher than the lowest quartile. We find larger effects when using minority
share as the measure of NPD: top-quartile minority counties have a denial rate that is 8.3
percentage points (p-value<0.01) higher than the bottom-quartile minority share counties.
Compared with the sample average denial rate of around 46%, applicants from counties with
the highest minority share have close to an 18% higher chance of being denied.
We include both the subprime share of the county and the minority share of the county
in the regression presented in column (7). We find that the minority share of the county
remains economically and statistically highly significant, while subprime share is insignificant.
This suggests that the minority share of population may capture both the measured credit
quality of the area as well as other unmeasured credit quality factors (with respect to credit
score) such as lower wealth, lower income, and more volatile employment that are known to
characterize higher-minority areas. Minority share may, therefore, better capture the size of
the mass of borrowers in an area that have marginal credit quality. For this reason, we use
minority share as our main proxy of NPD throughout the remainder of the paper.
17
5.2 Difference-in-Differences: SBA versus HMDA
As an additional way to contrast the decision making between government and private
lending programs, we present a simple difference-in-differences estimation for SBA versus
HMDA lending across areas with different racial composition. We construct a data set at
the level of county-disaster-year and compute the respective SBA denial rate. For each
observation, we then create a corresponding observation where we replace the SBA denial rate
with the county’s HMDA denial rate, as described earlier. Thus, for each county-disaster-year
we have two observations: one with the SBA denial rate and one with the HMDA denial rate
as the dependent variable. We then estimate the following regression specification:
denial ratei,p,c,t =α + δ1[SBA]i,p,t + ψMinorityc,t
+ θ(1[SBAi,p,t] ×Minorityc,t) + ΓXi,p,c,t + εi,p,c,t (2)
In this specification, δ̂ represents the average difference in risk-insensitive SBA and risk-
sensitive HMDA denial rates. The estimate of interest is θ̂, which indicates the differential
sensitivity in denial rates to minority share between the SBA and HMDA lenders. θ̂ > 0
indicates that the relationship between minority-share of the population and denial rates is
even stronger in the government-directed SBA program as compared with the private-market
HMDA counterpart.
Table 4 presents the results. The results in column (1) indicate that a one-standard-
deviation increase in minority share is associated with a denial rate that is 2.7 percentage
points higher in the pooled sample of HMDA and SBA denial rate observations. In column
(2), we include the SBA dummy variable, which shows the relatively higher average denial
rate for SBA loans (21pps higher, p-value< 0.01). There is still a significant relationship
between minority share and denial rates after controlling for the level difference in denial
rates across SBA and HMDA loans. In column (3), we include the interaction between the
18
SBA dummy variable and minority share. The coefficient on minority share, which now
captures the relationship between minority share and loan denials in the private market, is
only 0.013 (p-value< 0.01). The private market does deny loans to higher minority areas
at a greater rate. Of particular interest is the coefficient on the interaction between SBA
status and minority share, which is θ̂ = 0.027 (p-value<0.01). Thus, a one-standard-deviation
increase in minority share increases the likelihood of denial by about three times as much for
risk-insensitive SBA loans as compared with private-market loans.
The difference between the SBA and private market is even more stark when examining
the quartiles of minority share. Results are presented in columns (4)-(6). In column (6), we
see that for the private market, the difference in denial rate between the highest quartile and
lowest quartile minority share areas is not significant. The coefficient on the highest quartile
dummy is only 0.012 (p-value=0.12). For the SBA, on the other hand, the relationship between
minority share and relative denial rates is monotonically increasing. The highest quartile
minority share areas have a relative denial rate that is 6.5 (p-value< 0.01) percentage points
higher than the low minority quartile areas. In sum, a higher minority share corresponds to
higher denials in both government-directed and private markets, but the effect is much larger
in the risk-insensitive, government-directed lending program.
5.2.1 Federal Home Administration Program
We next compare the denial rates in the SBA disaster loan program to the denial rates in
the Federal Home Administration (FHA) loan program to further tease out the risk-insensitive
loan channel. By comparing SBA loans to FHA loans, we minimize any concerns about
potential differences between the SBA and private market lenders and potential concerns
about differences in the borrower pool between the SBA and HMDA. The U.S. government’s
FHA loan program provides insurance against default risk for private lenders that make loans
that fit the FHA guidelines. This program has similar objectives and constraints as the SBA.
19
The pool of FHA borrowers is likely riskier than the general population and may better
represent the pool of SBA applicants. The important difference between the two programs is
that the FHA loans are not restricted to a particular, risk-insensitive lending rate as are the
SBA loans. We run the same difference-in-differences analysis as in Table 4, but with the
FHA denial rate instead of the HMDA denial rate.
Table 5 presents the results. A similar pattern emerges as in the previous tests, except the
difference between the SBA and the market benchmark are even more striking. Examining
the results in column (3), we see the coefficient estimate on zMinority is not statistically
different from zero. This indicates there is no significant relationship between minority share
and loan denial in the FHA loan program for the times and counties in our analysis. In other
words, this government-sponsored risk-sensitive loan program is providing access to credit
across the spectrum of borrowers. This non-relationship may be expected for a government
program that is not only highly sensitive to the issue of fair credit access, but also has the
flexibility to change prices.
The SBA program displays an even more significant relationship between minority share
and loan denial when compared with the FHA loans. The coefficient on the interaction
between Minority and the SBA dummy in column (3) indicates that SBA’s relative denial
rates increase by 3.5 percentage points with a one-standard-deviation increase in a county’s
minority share. Column (6) shows that the relationship is particularly strong in the highest
quartile of minority-share counties. SBA applications from high-minority-share counties are 8
percentage points more likely to be denied a loan than applications from low minority share
counties relative to the corresponding denial rates in the FHA program.
The difference in denial rates between the SBA and FHA are unlikely to be explained
by differences in incentives across lenders or differences in applicant type. By comparing
two government programs with relatively similar borrower pools, these tests provide further
evidence on the disparity in denial rates across high and low need for price discrimination
20
areas that is due to the SBA’s risk-insensitive pricing mechanism.
5.3 Income Inequality: An Alternative Measure of NPD
The previous results show that the differential denial rate between high- and low-minority
share areas in the risk-insensitive SBA loan program is not explained by the denial rates in
the private market. To provide further evidence on the risk-insensitive pricing channel, we
examine the relationship between the county’s Gini index (i.e., income inequality) and SBA
denial rates by performing similar difference-in difference tests (regression equation 2) to the
minority regressions except with Gini as the NPD cross-sectional variable of interest. By
contruction, higher Gini areas have a greater dispersion in credit quality and, consequently, a
greater need for price discrimination in lending markets. Thus a positive relationship between
Gini and SBA denial rates would further support the risk-insensitive channel of loan denial.
These tests also reduce concerns that minority population is not measuring NPD, but rather
is related to some other unobserved factor that correlates with the denial decision.
Table 6 presents the results. We find that the need for price discrimination, here measured
by Gini, is strongly related to SBA denial rates. A one-standard-deviation increase in income
inequality is associated with a denial rate that is 2.5 percentage points higher for SBA loans
relative to FHA loans. There is no relationship between Gini and FHA denial rates. Column
(3) indicates that Gini and minority share have independent explanatory power for denial
rates in the pooled regression, with the effect of minority being about twice as large. In
column (4) we include both Gini and minority share plus each variable’s interaction with the
SBA dummy. We find that each has an independent relationship with SBA denial rates. The
coefficient on minority share drops from 0.035 (column 3 of Table 5) to 0.03 (p-value< 0.01),
and the coefficient on Gini drops from 0.025 to 0.011 (p-value= 0.02). Taken together with
our main results, these tests provide strong support that borrowers from areas with a greater
need for price discrimination experience much higher denial rates, and this is not being driven
21
by some unique unobserved characteristics related to minority share and denial rates.
5.4 Discrimination and Potential Alternative Explanations
In this section, we first examine whether the results may be driven by taste-based
discrimination, and then discuss potential concerns about violations of a key assumption in
our tests. The key underlying assumption in our main tests is that differences between the
pool of SBA applicants and the pool of private-market applicants does not vary systematically
according to NPD (after controlling for other important covariates).
Taste-Based Discrimination:
We now consider the alternative explanation that taste-based discrimination (i.e., prej-
udice) against minority borrowers is driving the results. While it is hard to empirically
assess this important question with observational data, there are predictions that arise from
taste-based discrimination that can be tested with the ex-post default performance of these
loans. If minority borrowers are denied credit purely because of prejudice, then conditional
on getting a loan, the average minority borrower is likely to be of better credit quality. Said
differently, borrowers in higher minority share areas need to cross a higher hurdle to obtain
credit. Given this higher hurdle, those approved in these areas would have a lower default
rate under this hypothesis. We estimate an OLS default model with minority and income
inequality as the explanatory variables, and Table 7 presents the results. We do not find
any evidence that high-minority-share or high-income-inequality areas default at lower rates.
Thus, these results do not provide support for taste-based discrimination in SBA lending.
Differential Sensitivity:
Is the credit quality of high-minority areas more sensitive to natural disasters relative
to low-minority areas? That is, even for observably identical areas, is the underlying credit
22
quality of high minority areas disproportionately damaged by natural disasters? If the credit
quality distribution shifts more for high-minority areas, then our pre-disaster HMDA and
FHA controls may not pick up this relative change in credit quality. To address this potential
concern, we examine changes in the credit quality distribution from pre- to post-disaster
across high- and low-minority counties. Specifically, we test whether the change in subprime
share (measured in percentage points) from one year before a disaster to one year after a
disaster is related to the share of minorities with the following regression.
Subprimet+1 − Subprimet−1 = ζMinorityc,t + δd,y + Σstate + ΓXi,c,t + εi,c,d,t (3)
If the credit quality of high-minority areas are more-negatively impacted, we should see a
positive and significant coefficient on minority share (ζ̂ > 0). Table 8 presents the results.
We find negative point estimates on the minority share, and they are economically and
statistically insignificant. This test does not support the hypothesis that the credit quality of
high-minority areas has differential sensitivity to natural disasters relative to low-minority
areas.
Alternative sources of funding:
Another concern may be the that low-NPD areas have a greater access to alternative
funding sources besides the SBA (e.g., private market credit access, self-financing, financing
through informal networks, or supplemental insurance proceeds). Additionally, there may be
variation in the level of collateral across low- and high-NPD areas. There are a few reasons
why any differences on these dimensions are unlikely to be driving our results. First, we
control for the private market and FHA denial rates, which should capture most sources of
variation in alternative sources of capital.
Second, if low-NPD areas have greater access to alternative sources of funding, then this
should bias our tests against finding a result. For example, suppose that in the low-NPD
23
areas, a large percentage of the potential SBA applicant pool has greater access to alternative
funding while zero potential applicants in high-NPD areas have alternative sources. For
high-NPD areas, all potential borrowers apply for an SBA loan, so there is no distortion
in the applicant pool and thus the pool should be fairly comparable to the private market
applicant pool. For low-NPD areas, the highest quality borrowers may select out of the
SBA pool, leaving, on average, a worse pool of SBA borrowers.9 Together, this will lead to
a relative decrease in the average applicant credit quality in the low -NPD areas compared
to the counterfactual private market applicant pool. As a result, the relative denials (SBA
compared with the private market) should be higher in the low-NPD areas if this is the case,
which works in the opposite direction of our findings.
Lack of paperwork or banking history:
A related concern may be that applicants from high-minority areas are unable to produce
the necessary paperwork to receive a loan or do not have a banking history. This is also unlikely.
The vast majority of SBA applicants are homeowners, which means they have likely obtained
a mortgage in the past and produced such paperwork. This rules out a number of these
alternatives since having a bank account, producing the necessary employment documentation,
etc. and other SBA requirements are also needed to apply for most mortgages.
5.5 Economic Significance
To further illustrate the economic importance of the results, we provide an estimate of
the credit that would have been extended if all counties were in the lowest minority-share
quartile. To do this, we multiply the number of loan applications in the 2nd, 3rd, and 4th
quartiles of minority share by the difference in approval rates between these counties and
9Additionally, it is unlikely that those in need of funding will opt for a private-market option since theSBA loan financing terms will almost always dominate. The SBA statutory rate for borrowers with “CreditAvailable Elsewhere” (the highest rate) is at most one percentage point above the government’s cost ofborrowing for similar maturities.
24
the lowest quartile counties. We use the estimates in column (6) of Table 5 as the estimated
differences in approval rate. This calculation provides an estimate of the additional loans
that would have been available to borrowers in higher minority counties had they experienced
the same denial rate as the low minority counties. We then multiply these numbers by the
average loan amount for approved loans to get a rough idea of the dollar amount (year 2000
dollars) of “missing” loans. Table 9 shows the computation.
The calculation suggests that about $1.58 billion of additional loans would have been
granted under conditions where the price is flexible and based on the riskiness of the borrower.
In terms of number of loans, our estimates show that about 45,000 more homeowners would
have had access to credit during these critical post-disaster time periods.
6 Discussion & Conclusions
We document a substantially higher denial rate of applications for SBA disaster loans
in counties with a greater need for price discrimination. This relationship persists after
accounting for a benchmark private-market denial rate constructed from HMDA loans, which
takes into account both raw credit quality and equilibrium credit rationing. Despite these
applicants often being the intended recipient of government assistance programs (and also
a focus of government regulation in private-market lending), our results show that those
in high-minority-share areas, areas with higher subprime populations, and more income
inequality are denied access to government-provided credit at a disproportionately higher
rate relative to the private lending market.
We argue that the lack of risk-sensitive pricing is a key factor behind this finding. The
setup of the SBA disaster loan program does not allow for borrowers to be charged an interest
rate based on their credit risk, which is a stark departure from the risk-sensitive pricing seen
in private lending markets. As a result, some creditworthy borrowers who are sufficiently
25
good credit risks at a higher interest rate are instead denied credit altogether under this
program. We provide further evidence of this channel by comparing SBA denial rates with
the denial rates in a government-insured private lending market: home loans subsidized by
the Federal Housing Administration (FHA), which allows for flexible loan pricing. We find no
relationship between need for price discrimination and loan denial rates in the FHA program.
Further, the FHA denial rates cannot explain the differential in SBA denial rates across high
and low NPD areas.
Risk-insensitive pricing is a pervasive feature of government lending programs around
the world, and it is often motivated by fairness and equality in access to credit. However,
our results document important adverse consequences of loan programs with this feature.
By failing to use a more-flexible, risk-sensitive pricing mechanism to help allocate credit,
government lending programs may be unintentionally neglecting many of the marginal, yet
still creditworthy, borrowers that they are setting out to help.
26
References
Adelino, Manuel, Antoinette Schoar, and Felipe Severino, 2016, Loan originations and defaults
in the mortgage crisis: The role of the middle class, The Review of Financial Studies 29,
1635–1670.
Bayer, Patrick, Fernando Ferreira, and Stephen L Ross, 2016, The Vulnerability of Minority
Homeowners in the Housing Boom and Bust, American Economic Journal: Economic
Policy 8, 1–27.
Becker, Gary, 1957, The Economics of Discrimination (The University of Chicago Press).
Bundorf, M Kate, Jonathan Levin, and Neale Mahoney, 2012, Pricing and welfare in health
plan choice, American Economic Review 102, 3214–48.
Hurst, Erik, Benjamin J Keys, Amit Seru, and Joseph Vavra, 2016, Regional redistribution
through the US mortgage market, American Economic Review 106, 2982–3028.
Kulkarni, Nirupama, 2016, Are Uniform Pricing Policies Unfair? Mortgage Rates, Credit
Rationing, and Regional Inequality, Working Paper .
Lindsay, Bruce R, 2010, SBA Disaster Loan Program: Overview and Possible Issues for
Congress (DIANE Publishing).
Munnell, Alicia H, Geoffrey MB Tootell, Lynn E Browne, and James McEneaney, 1996,
Mortgage lending in Boston: Interpreting HMDA data, American Economic Review 25–53.
Rose, Nancy L, 2014, Economic Regulation and Its Reform: What Have We Learned?
(University of Chicago Press).
Stigler, George J, 1946, The economics of minimum wage legislation, American Economic
Review 36, 358–365.
Stiglitz, Joseph E, and Andrew Weiss, 1981, Credit rationing in markets with imperfect
information, American Economic Review 71, 393–410.
27
MarketThreshold
SBAThreshold
SBA Rate
Market Rate
Denials Additional Denials by SBA SBA Approvals
Max Subsidy
Credit Quality
Inte
rest
Rat
e
Figure 1: Credit RationingThis figure illustrates the credit allocation decision with risk-insensitive and subsidized loan pricingcompared to the credit allocation with risk-sensitive (market) pricing.
28
Figure 2: Geographical Distribution of Total ApplicationsThis figure presents the number of disaster loan application during the sample period of 1991-2015for each state.
29
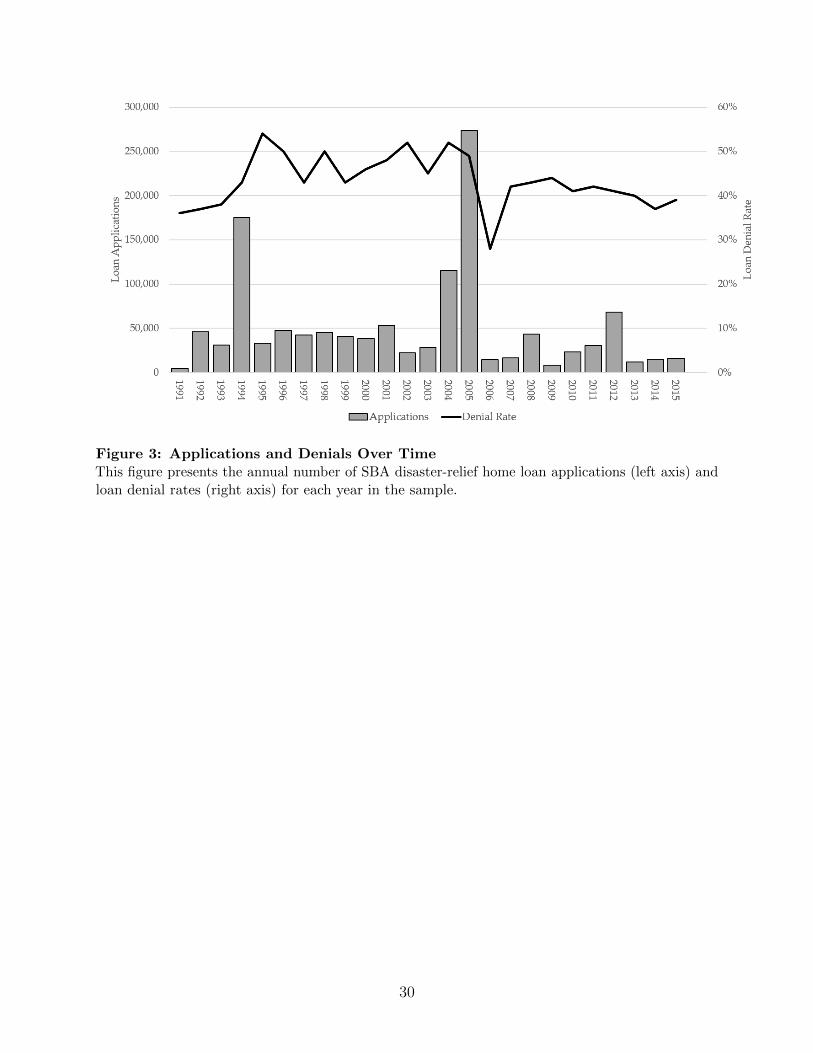
Figure 3: Applications and Denials Over TimeThis figure presents the annual number of SBA disaster-relief home loan applications (left axis) andloan denial rates (right axis) for each year in the sample.
30
Table 1: Disaster Summary StatisticsThis table presents loan application summary statistics by disaster and disaster type. Panel A presents thevolume of applications and denial rates for the different types of disasters in the sample. Panel B presentsstatistics from the ten largest disasters (by loan application count) in the sample.
Panel A: Disaster Types
applications denial rate
Hurricane 571,357 48%Severe Weather 432,938 44%Earthquake 175,986 43%Tropical Storm 55,784 49%Fire 12,603 45%
Panel B: Ten Largest Disasters
Disaster Year applications denial rate
Hurricane Katrina 2005 206,201 48%Northridge Earthquake 1994 159,603 43%Hurricane Sandy 2012 55,267 41%Hurricane Andrew 1992 31,792 38%Hurricane Ivan 2004 30,364 50%Hurricane Rita 2005 33,107 56%Tropical Storm Allison 2001 31,740 51%Hurricane Floyd 1999 24,635 41%Hurricane Wilma 2005 26,864 48%Hurricane Frances 2004 23,645 56%
31
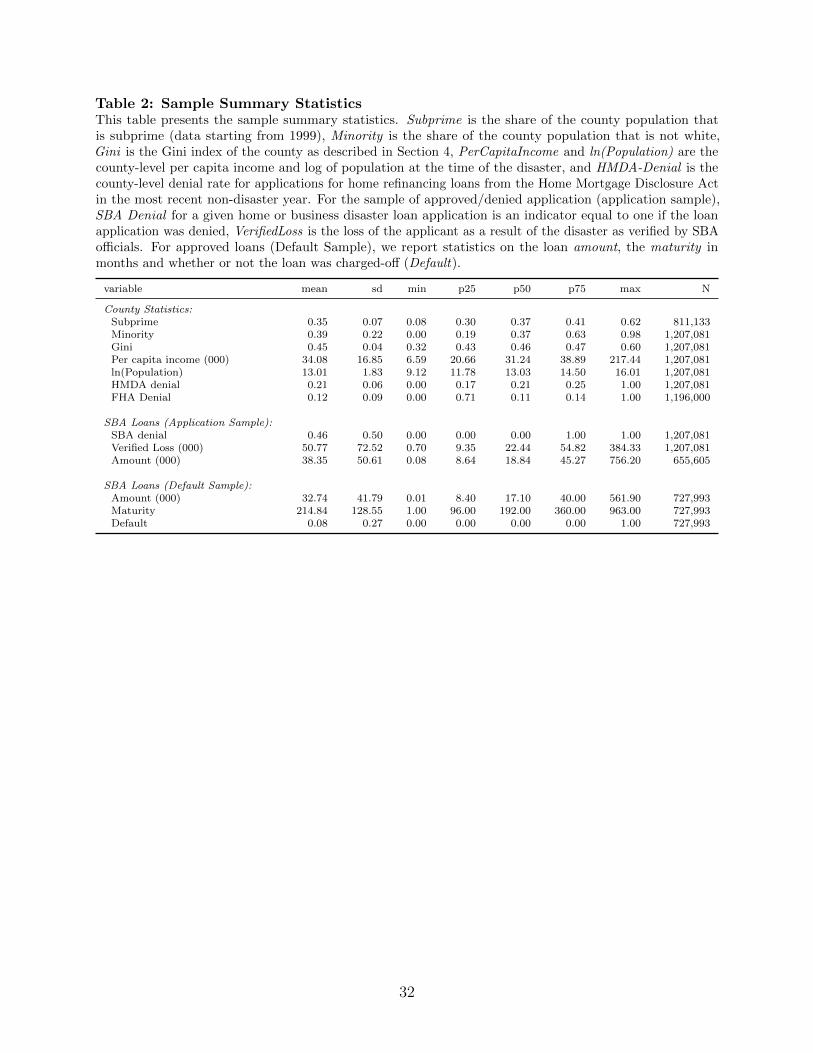
Table 2: Sample Summary StatisticsThis table presents the sample summary statistics. Subprime is the share of the county population thatis subprime (data starting from 1999), Minority is the share of the county population that is not white,Gini is the Gini index of the county as described in Section 4, PerCapitaIncome and ln(Population) are thecounty-level per capita income and log of population at the time of the disaster, and HMDA-Denial is thecounty-level denial rate for applications for home refinancing loans from the Home Mortgage Disclosure Actin the most recent non-disaster year. For the sample of approved/denied application (application sample),SBA Denial for a given home or business disaster loan application is an indicator equal to one if the loanapplication was denied, VerifiedLoss is the loss of the applicant as a result of the disaster as verified by SBAofficials. For approved loans (Default Sample), we report statistics on the loan amount, the maturity inmonths and whether or not the loan was charged-off (Default).
variable mean sd min p25 p50 p75 max N
County Statistics:Subprime 0.35 0.07 0.08 0.30 0.37 0.41 0.62 811,133Minority 0.39 0.22 0.00 0.19 0.37 0.63 0.98 1,207,081Gini 0.45 0.04 0.32 0.43 0.46 0.47 0.60 1,207,081Per capita income (000) 34.08 16.85 6.59 20.66 31.24 38.89 217.44 1,207,081ln(Population) 13.01 1.83 9.12 11.78 13.03 14.50 16.01 1,207,081HMDA denial 0.21 0.06 0.00 0.17 0.21 0.25 1.00 1,207,081FHA Denial 0.12 0.09 0.00 0.71 0.11 0.14 1.00 1,196,000
SBA Loans (Application Sample):SBA denial 0.46 0.50 0.00 0.00 0.00 1.00 1.00 1,207,081Verified Loss (000) 50.77 72.52 0.70 9.35 22.44 54.82 384.33 1,207,081Amount (000) 38.35 50.61 0.08 8.64 18.84 45.27 756.20 655,605
SBA Loans (Default Sample):Amount (000) 32.74 41.79 0.01 8.40 17.10 40.00 561.90 727,993Maturity 214.84 128.55 1.00 96.00 192.00 360.00 963.00 727,993Default 0.08 0.27 0.00 0.00 0.00 0.00 1.00 727,993
32
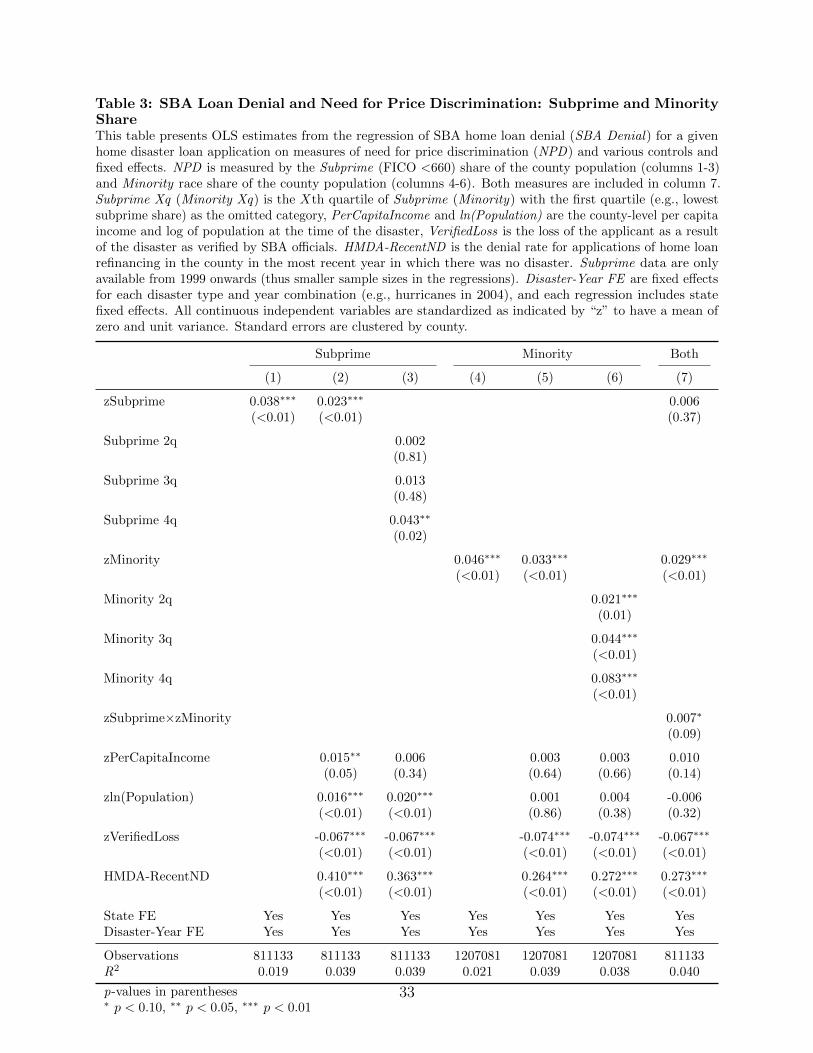
Table 3: SBA Loan Denial and Need for Price Discrimination: Subprime and MinorityShareThis table presents OLS estimates from the regression of SBA home loan denial (SBA Denial) for a givenhome disaster loan application on measures of need for price discrimination (NPD) and various controls andfixed effects. NPD is measured by the Subprime (FICO <660) share of the county population (columns 1-3)and Minority race share of the county population (columns 4-6). Both measures are included in column 7.Subprime Xq (Minority Xq) is the Xth quartile of Subprime (Minority) with the first quartile (e.g., lowestsubprime share) as the omitted category, PerCapitaIncome and ln(Population) are the county-level per capitaincome and log of population at the time of the disaster, VerifiedLoss is the loss of the applicant as a resultof the disaster as verified by SBA officials. HMDA-RecentND is the denial rate for applications of home loanrefinancing in the county in the most recent year in which there was no disaster. Subprime data are onlyavailable from 1999 onwards (thus smaller sample sizes in the regressions). Disaster-Year FE are fixed effectsfor each disaster type and year combination (e.g., hurricanes in 2004), and each regression includes statefixed effects. All continuous independent variables are standardized as indicated by “z” to have a mean ofzero and unit variance. Standard errors are clustered by county.
Subprime Minority Both
(1) (2) (3) (4) (5) (6) (7)
zSubprime 0.038∗∗∗ 0.023∗∗∗ 0.006(<0.01) (<0.01) (0.37)
Subprime 2q 0.002(0.81)
Subprime 3q 0.013(0.48)
Subprime 4q 0.043∗∗
(0.02)
zMinority 0.046∗∗∗ 0.033∗∗∗ 0.029∗∗∗
(<0.01) (<0.01) (<0.01)
Minority 2q 0.021∗∗∗
(0.01)
Minority 3q 0.044∗∗∗
(<0.01)
Minority 4q 0.083∗∗∗
(<0.01)
zSubprime×zMinority 0.007∗
(0.09)
zPerCapitaIncome 0.015∗∗ 0.006 0.003 0.003 0.010(0.05) (0.34) (0.64) (0.66) (0.14)
zln(Population) 0.016∗∗∗ 0.020∗∗∗ 0.001 0.004 -0.006(<0.01) (<0.01) (0.86) (0.38) (0.32)
zVerifiedLoss -0.067∗∗∗ -0.067∗∗∗ -0.074∗∗∗ -0.074∗∗∗ -0.067∗∗∗
(<0.01) (<0.01) (<0.01) (<0.01) (<0.01)
HMDA-RecentND 0.410∗∗∗ 0.363∗∗∗ 0.264∗∗∗ 0.272∗∗∗ 0.273∗∗∗
(<0.01) (<0.01) (<0.01) (<0.01) (<0.01)
State FE Yes Yes Yes Yes Yes Yes YesDisaster-Year FE Yes Yes Yes Yes Yes Yes Yes
Observations 811133 811133 811133 1207081 1207081 1207081 811133R2 0.019 0.039 0.039 0.021 0.039 0.038 0.040
p-values in parentheses∗ p < 0.10, ∗∗ p < 0.05, ∗∗∗ p < 0.01
33
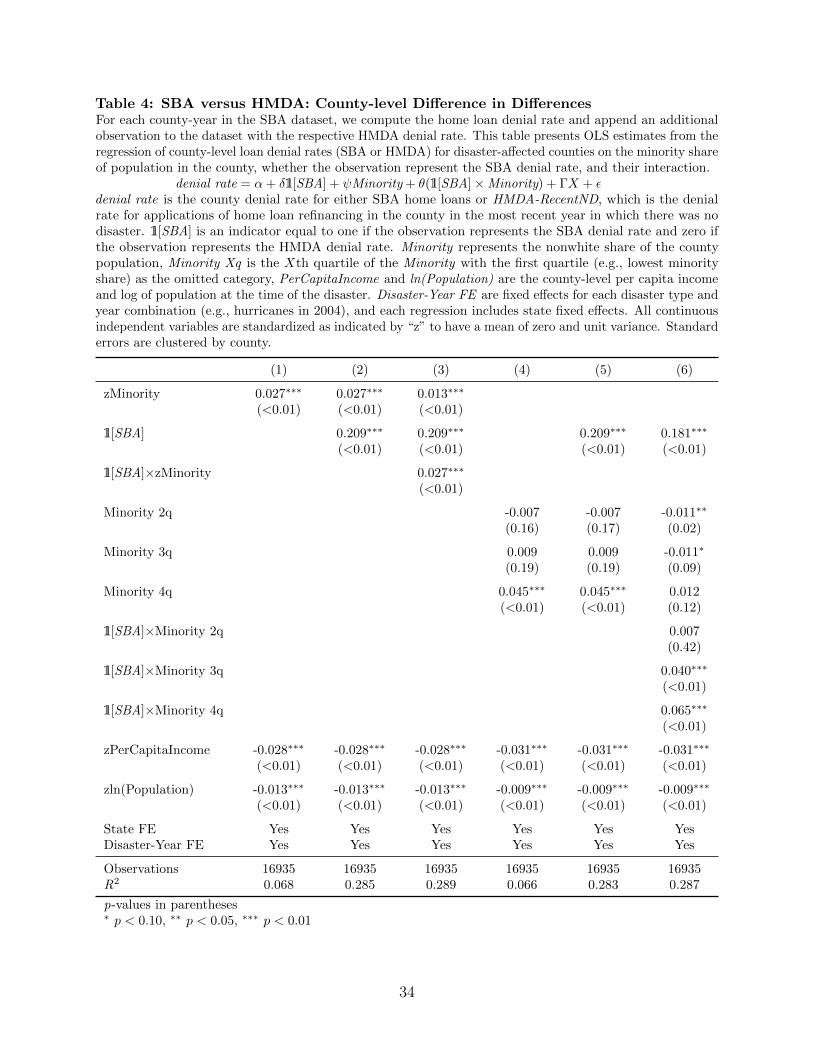
Table 4: SBA versus HMDA: County-level Difference in DifferencesFor each county-year in the SBA dataset, we compute the home loan denial rate and append an additionalobservation to the dataset with the respective HMDA denial rate. This table presents OLS estimates from theregression of county-level loan denial rates (SBA or HMDA) for disaster-affected counties on the minority shareof population in the county, whether the observation represent the SBA denial rate, and their interaction.
denial rate = α+ δ1[SBA] + ψMinority + θ(1[SBA] × Minority) + ΓX + εdenial rate is the county denial rate for either SBA home loans or HMDA-RecentND, which is the denialrate for applications of home loan refinancing in the county in the most recent year in which there was nodisaster. 1[SBA] is an indicator equal to one if the observation represents the SBA denial rate and zero ifthe observation represents the HMDA denial rate. Minority represents the nonwhite share of the countypopulation, Minority Xq is the Xth quartile of the Minority with the first quartile (e.g., lowest minorityshare) as the omitted category, PerCapitaIncome and ln(Population) are the county-level per capita incomeand log of population at the time of the disaster. Disaster-Year FE are fixed effects for each disaster type andyear combination (e.g., hurricanes in 2004), and each regression includes state fixed effects. All continuousindependent variables are standardized as indicated by “z” to have a mean of zero and unit variance. Standarderrors are clustered by county.
(1) (2) (3) (4) (5) (6)
zMinority 0.027∗∗∗ 0.027∗∗∗ 0.013∗∗∗
(<0.01) (<0.01) (<0.01)
1[SBA] 0.209∗∗∗ 0.209∗∗∗ 0.209∗∗∗ 0.181∗∗∗
(<0.01) (<0.01) (<0.01) (<0.01)
1[SBA]×zMinority 0.027∗∗∗
(<0.01)
Minority 2q -0.007 -0.007 -0.011∗∗
(0.16) (0.17) (0.02)
Minority 3q 0.009 0.009 -0.011∗
(0.19) (0.19) (0.09)
Minority 4q 0.045∗∗∗ 0.045∗∗∗ 0.012(<0.01) (<0.01) (0.12)
1[SBA]×Minority 2q 0.007(0.42)
1[SBA]×Minority 3q 0.040∗∗∗
(<0.01)
1[SBA]×Minority 4q 0.065∗∗∗
(<0.01)
zPerCapitaIncome -0.028∗∗∗ -0.028∗∗∗ -0.028∗∗∗ -0.031∗∗∗ -0.031∗∗∗ -0.031∗∗∗
(<0.01) (<0.01) (<0.01) (<0.01) (<0.01) (<0.01)
zln(Population) -0.013∗∗∗ -0.013∗∗∗ -0.013∗∗∗ -0.009∗∗∗ -0.009∗∗∗ -0.009∗∗∗
(<0.01) (<0.01) (<0.01) (<0.01) (<0.01) (<0.01)
State FE Yes Yes Yes Yes Yes YesDisaster-Year FE Yes Yes Yes Yes Yes Yes
Observations 16935 16935 16935 16935 16935 16935R2 0.068 0.285 0.289 0.066 0.283 0.287
p-values in parentheses∗ p < 0.10, ∗∗ p < 0.05, ∗∗∗ p < 0.01
34
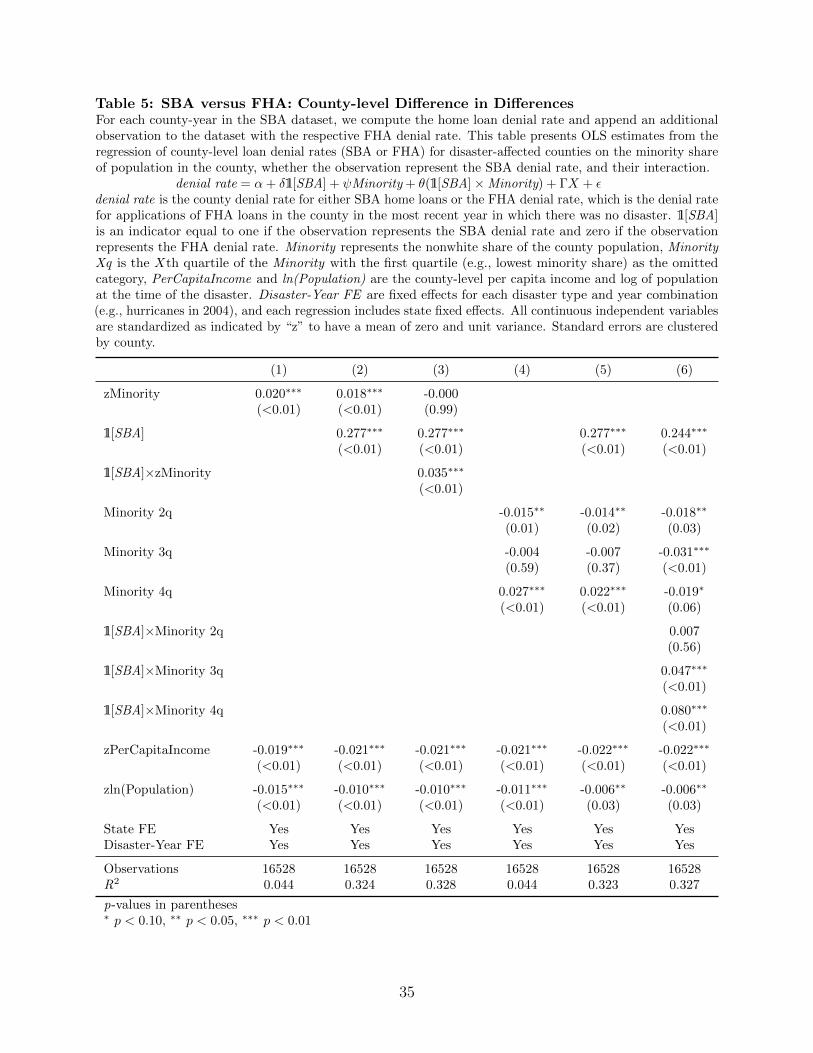
Table 5: SBA versus FHA: County-level Difference in DifferencesFor each county-year in the SBA dataset, we compute the home loan denial rate and append an additionalobservation to the dataset with the respective FHA denial rate. This table presents OLS estimates from theregression of county-level loan denial rates (SBA or FHA) for disaster-affected counties on the minority shareof population in the county, whether the observation represent the SBA denial rate, and their interaction.
denial rate = α+ δ1[SBA] + ψMinority + θ(1[SBA] × Minority) + ΓX + εdenial rate is the county denial rate for either SBA home loans or the FHA denial rate, which is the denial ratefor applications of FHA loans in the county in the most recent year in which there was no disaster. 1[SBA]is an indicator equal to one if the observation represents the SBA denial rate and zero if the observationrepresents the FHA denial rate. Minority represents the nonwhite share of the county population, MinorityXq is the Xth quartile of the Minority with the first quartile (e.g., lowest minority share) as the omittedcategory, PerCapitaIncome and ln(Population) are the county-level per capita income and log of populationat the time of the disaster. Disaster-Year FE are fixed effects for each disaster type and year combination(e.g., hurricanes in 2004), and each regression includes state fixed effects. All continuous independent variablesare standardized as indicated by “z” to have a mean of zero and unit variance. Standard errors are clusteredby county.
(1) (2) (3) (4) (5) (6)
zMinority 0.020∗∗∗ 0.018∗∗∗ -0.000(<0.01) (<0.01) (0.99)
1[SBA] 0.277∗∗∗ 0.277∗∗∗ 0.277∗∗∗ 0.244∗∗∗
(<0.01) (<0.01) (<0.01) (<0.01)
1[SBA]×zMinority 0.035∗∗∗
(<0.01)
Minority 2q -0.015∗∗ -0.014∗∗ -0.018∗∗
(0.01) (0.02) (0.03)
Minority 3q -0.004 -0.007 -0.031∗∗∗
(0.59) (0.37) (<0.01)
Minority 4q 0.027∗∗∗ 0.022∗∗∗ -0.019∗
(<0.01) (<0.01) (0.06)
1[SBA]×Minority 2q 0.007(0.56)
1[SBA]×Minority 3q 0.047∗∗∗
(<0.01)
1[SBA]×Minority 4q 0.080∗∗∗
(<0.01)
zPerCapitaIncome -0.019∗∗∗ -0.021∗∗∗ -0.021∗∗∗ -0.021∗∗∗ -0.022∗∗∗ -0.022∗∗∗
(<0.01) (<0.01) (<0.01) (<0.01) (<0.01) (<0.01)
zln(Population) -0.015∗∗∗ -0.010∗∗∗ -0.010∗∗∗ -0.011∗∗∗ -0.006∗∗ -0.006∗∗
(<0.01) (<0.01) (<0.01) (<0.01) (0.03) (0.03)
State FE Yes Yes Yes Yes Yes YesDisaster-Year FE Yes Yes Yes Yes Yes Yes
Observations 16528 16528 16528 16528 16528 16528R2 0.044 0.324 0.328 0.044 0.323 0.327
p-values in parentheses∗ p < 0.10, ∗∗ p < 0.05, ∗∗∗ p < 0.01
35
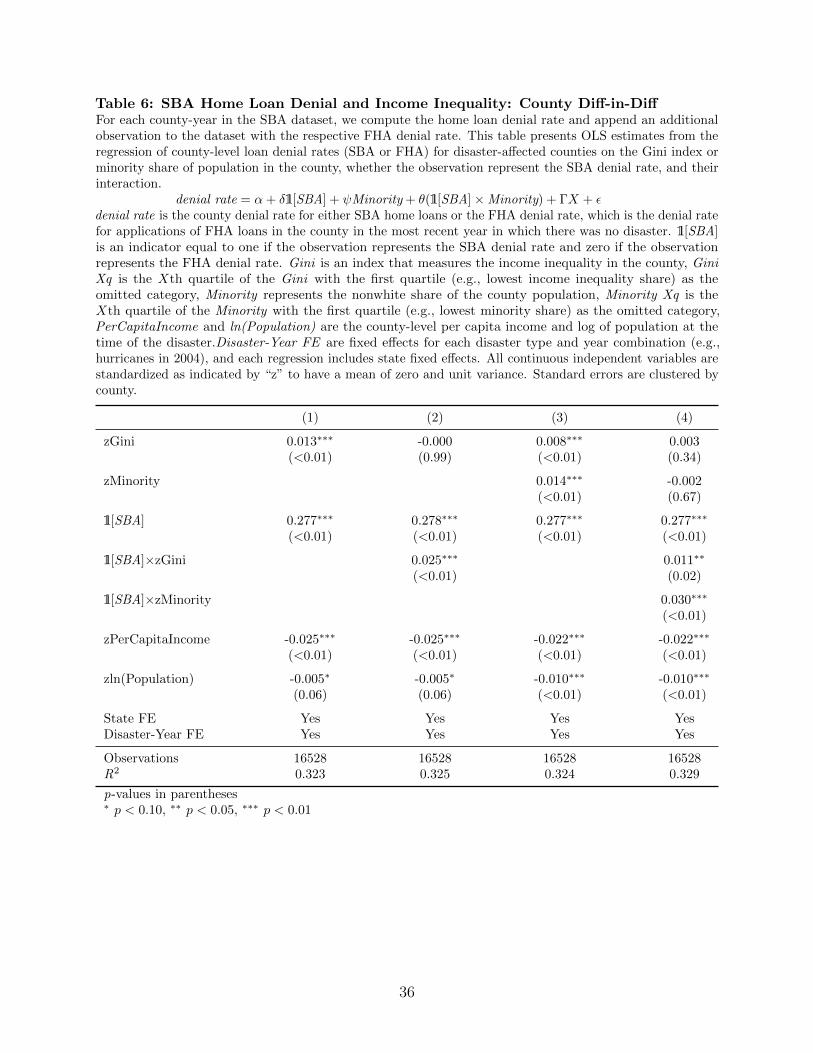
Table 6: SBA Home Loan Denial and Income Inequality: County Diff-in-DiffFor each county-year in the SBA dataset, we compute the home loan denial rate and append an additionalobservation to the dataset with the respective FHA denial rate. This table presents OLS estimates from theregression of county-level loan denial rates (SBA or FHA) for disaster-affected counties on the Gini index orminority share of population in the county, whether the observation represent the SBA denial rate, and theirinteraction.
denial rate = α+ δ1[SBA] + ψMinority + θ(1[SBA] × Minority) + ΓX + εdenial rate is the county denial rate for either SBA home loans or the FHA denial rate, which is the denial ratefor applications of FHA loans in the county in the most recent year in which there was no disaster. 1[SBA]is an indicator equal to one if the observation represents the SBA denial rate and zero if the observationrepresents the FHA denial rate. Gini is an index that measures the income inequality in the county, GiniXq is the Xth quartile of the Gini with the first quartile (e.g., lowest income inequality share) as theomitted category, Minority represents the nonwhite share of the county population, Minority Xq is theXth quartile of the Minority with the first quartile (e.g., lowest minority share) as the omitted category,PerCapitaIncome and ln(Population) are the county-level per capita income and log of population at thetime of the disaster.Disaster-Year FE are fixed effects for each disaster type and year combination (e.g.,hurricanes in 2004), and each regression includes state fixed effects. All continuous independent variables arestandardized as indicated by “z” to have a mean of zero and unit variance. Standard errors are clustered bycounty.
(1) (2) (3) (4)
zGini 0.013∗∗∗ -0.000 0.008∗∗∗ 0.003(<0.01) (0.99) (<0.01) (0.34)
zMinority 0.014∗∗∗ -0.002(<0.01) (0.67)
1[SBA] 0.277∗∗∗ 0.278∗∗∗ 0.277∗∗∗ 0.277∗∗∗
(<0.01) (<0.01) (<0.01) (<0.01)
1[SBA]×zGini 0.025∗∗∗ 0.011∗∗
(<0.01) (0.02)
1[SBA]×zMinority 0.030∗∗∗
(<0.01)
zPerCapitaIncome -0.025∗∗∗ -0.025∗∗∗ -0.022∗∗∗ -0.022∗∗∗
(<0.01) (<0.01) (<0.01) (<0.01)
zln(Population) -0.005∗ -0.005∗ -0.010∗∗∗ -0.010∗∗∗
(0.06) (0.06) (<0.01) (<0.01)
State FE Yes Yes Yes YesDisaster-Year FE Yes Yes Yes Yes
Observations 16528 16528 16528 16528R2 0.323 0.325 0.324 0.329
p-values in parentheses∗ p < 0.10, ∗∗ p < 0.05, ∗∗∗ p < 0.01
36
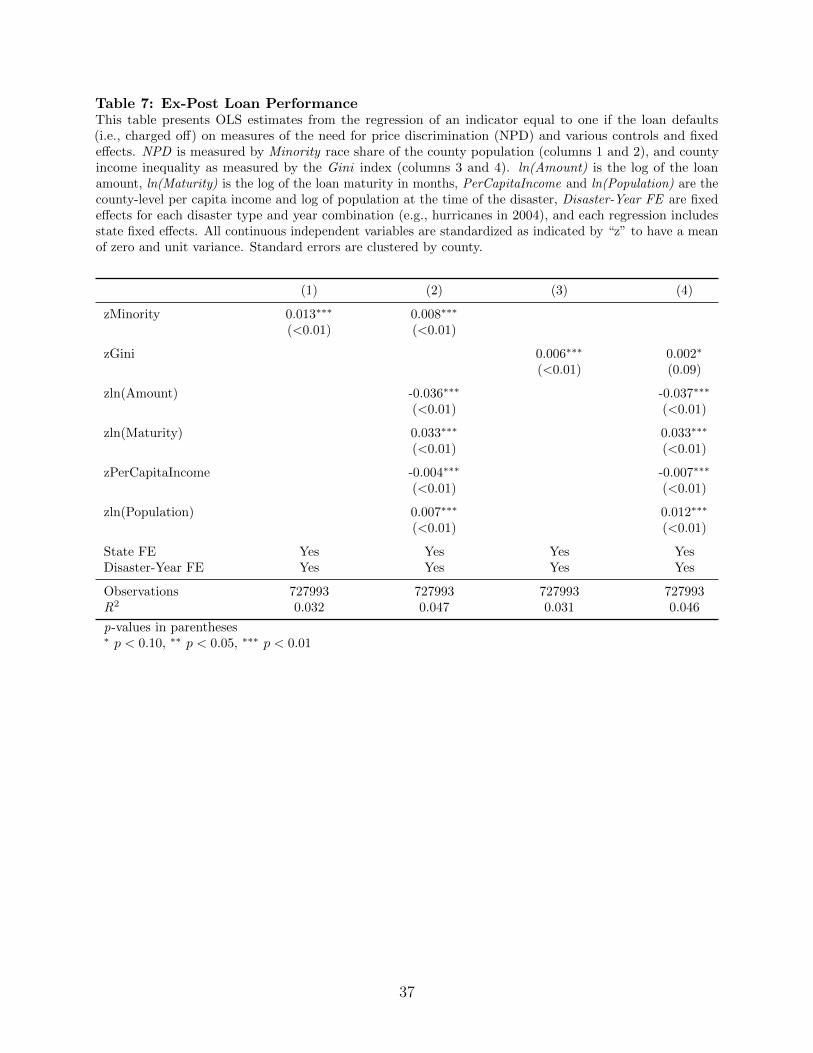
Table 7: Ex-Post Loan PerformanceThis table presents OLS estimates from the regression of an indicator equal to one if the loan defaults(i.e., charged off) on measures of the need for price discrimination (NPD) and various controls and fixedeffects. NPD is measured by Minority race share of the county population (columns 1 and 2), and countyincome inequality as measured by the Gini index (columns 3 and 4). ln(Amount) is the log of the loanamount, ln(Maturity) is the log of the loan maturity in months, PerCapitaIncome and ln(Population) are thecounty-level per capita income and log of population at the time of the disaster, Disaster-Year FE are fixedeffects for each disaster type and year combination (e.g., hurricanes in 2004), and each regression includesstate fixed effects. All continuous independent variables are standardized as indicated by “z” to have a meanof zero and unit variance. Standard errors are clustered by county.
(1) (2) (3) (4)
zMinority 0.013∗∗∗ 0.008∗∗∗
(<0.01) (<0.01)
zGini 0.006∗∗∗ 0.002∗
(<0.01) (0.09)
zln(Amount) -0.036∗∗∗ -0.037∗∗∗
(<0.01) (<0.01)
zln(Maturity) 0.033∗∗∗ 0.033∗∗∗
(<0.01) (<0.01)
zPerCapitaIncome -0.004∗∗∗ -0.007∗∗∗
(<0.01) (<0.01)
zln(Population) 0.007∗∗∗ 0.012∗∗∗
(<0.01) (<0.01)
State FE Yes Yes Yes YesDisaster-Year FE Yes Yes Yes Yes
Observations 727993 727993 727993 727993R2 0.032 0.047 0.031 0.046
p-values in parentheses∗ p < 0.10, ∗∗ p < 0.05, ∗∗∗ p < 0.01
37
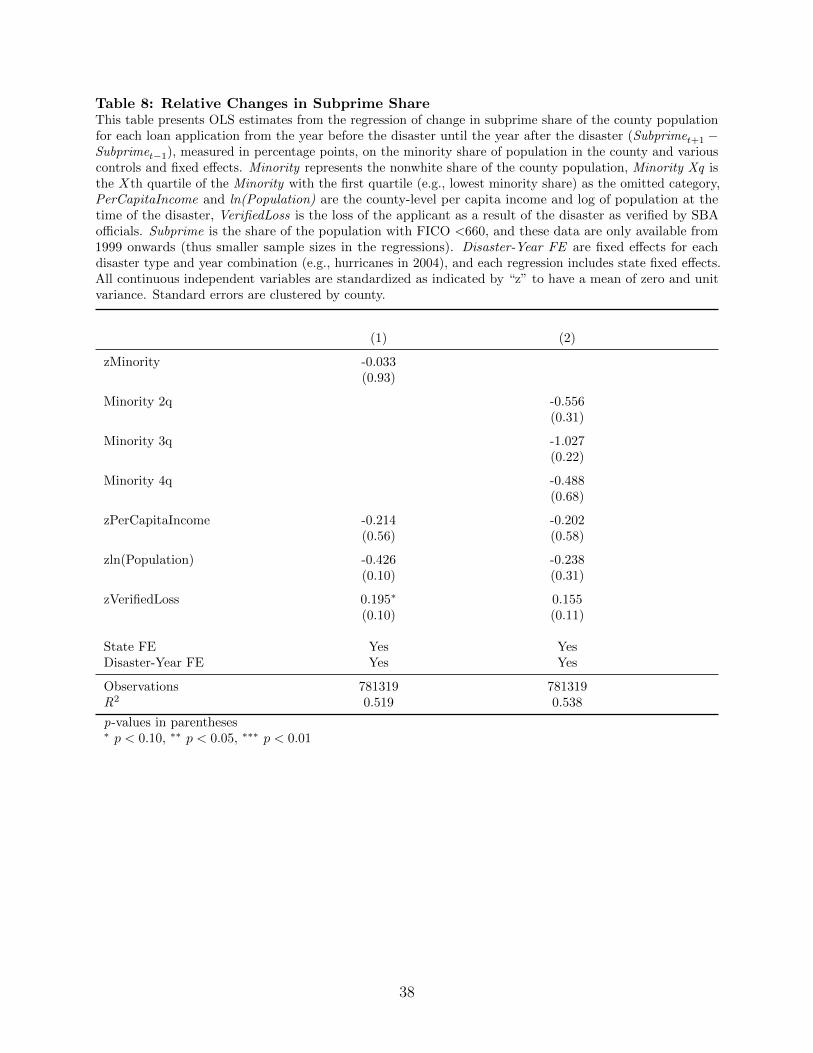
Table 8: Relative Changes in Subprime ShareThis table presents OLS estimates from the regression of change in subprime share of the county populationfor each loan application from the year before the disaster until the year after the disaster (Subprimet+1 −Subprimet−1), measured in percentage points, on the minority share of population in the county and variouscontrols and fixed effects. Minority represents the nonwhite share of the county population, Minority Xq isthe Xth quartile of the Minority with the first quartile (e.g., lowest minority share) as the omitted category,PerCapitaIncome and ln(Population) are the county-level per capita income and log of population at thetime of the disaster, VerifiedLoss is the loss of the applicant as a result of the disaster as verified by SBAofficials. Subprime is the share of the population with FICO <660, and these data are only available from1999 onwards (thus smaller sample sizes in the regressions). Disaster-Year FE are fixed effects for eachdisaster type and year combination (e.g., hurricanes in 2004), and each regression includes state fixed effects.All continuous independent variables are standardized as indicated by “z” to have a mean of zero and unitvariance. Standard errors are clustered by county.
(1) (2)
zMinority -0.033(0.93)
Minority 2q -0.556(0.31)
Minority 3q -1.027(0.22)
Minority 4q -0.488(0.68)
zPerCapitaIncome -0.214 -0.202(0.56) (0.58)
zln(Population) -0.426 -0.238(0.10) (0.31)
zVerifiedLoss 0.195∗ 0.155(0.10) (0.11)
State FE Yes YesDisaster-Year FE Yes Yes
Observations 781319 781319R2 0.519 0.538
p-values in parentheses∗ p < 0.10, ∗∗ p < 0.05, ∗∗∗ p < 0.01
38
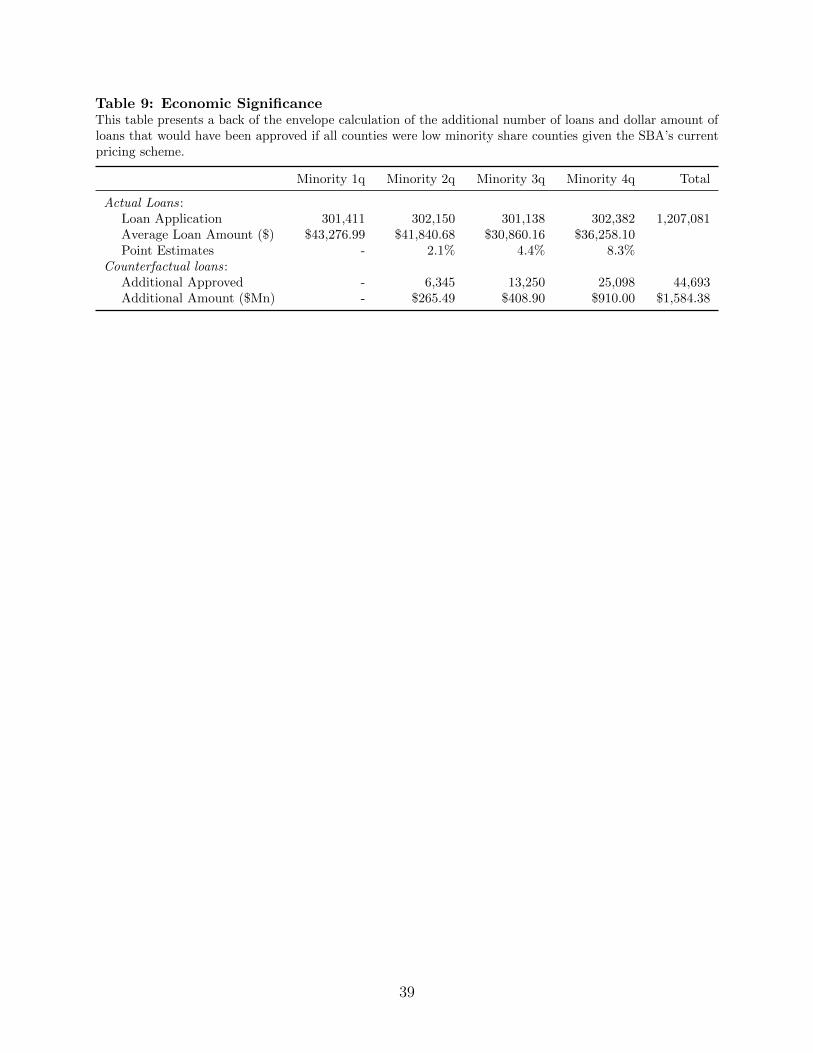
Table 9: Economic SignificanceThis table presents a back of the envelope calculation of the additional number of loans and dollar amount ofloans that would have been approved if all counties were low minority share counties given the SBA’s currentpricing scheme.
Minority 1q Minority 2q Minority 3q Minority 4q Total
Actual Loans:Loan Application 301,411 302,150 301,138 302,382 1,207,081Average Loan Amount ($) $43,276.99 $41,840.68 $30,860.16 $36,258.10Point Estimates - 2.1% 4.4% 8.3%
Counterfactual loans:Additional Approved - 6,345 13,250 25,098 44,693Additional Amount ($Mn) - $265.49 $408.90 $910.00 $1,584.38
39
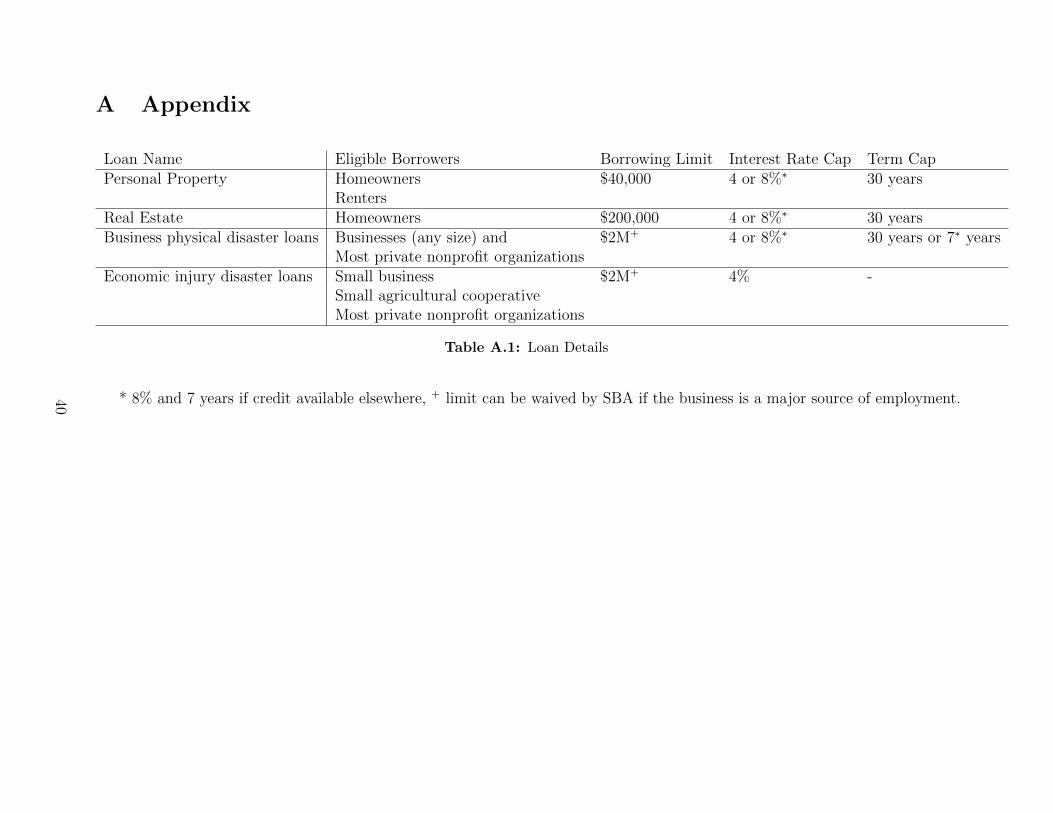
A Appendix
Loan Name Eligible Borrowers Borrowing Limit Interest Rate Cap Term CapPersonal Property Homeowners $40,000 4 or 8%∗ 30 years
RentersReal Estate Homeowners $200,000 4 or 8%∗ 30 yearsBusiness physical disaster loans Businesses (any size) and $2M+ 4 or 8%∗ 30 years or 7∗ years
Most private nonprofit organizationsEconomic injury disaster loans Small business $2M+ 4% -
Small agricultural cooperativeMost private nonprofit organizations
Table A.1: Loan Details
* 8% and 7 years if credit available elsewhere, + limit can be waived by SBA if the business is a major source of employment.40
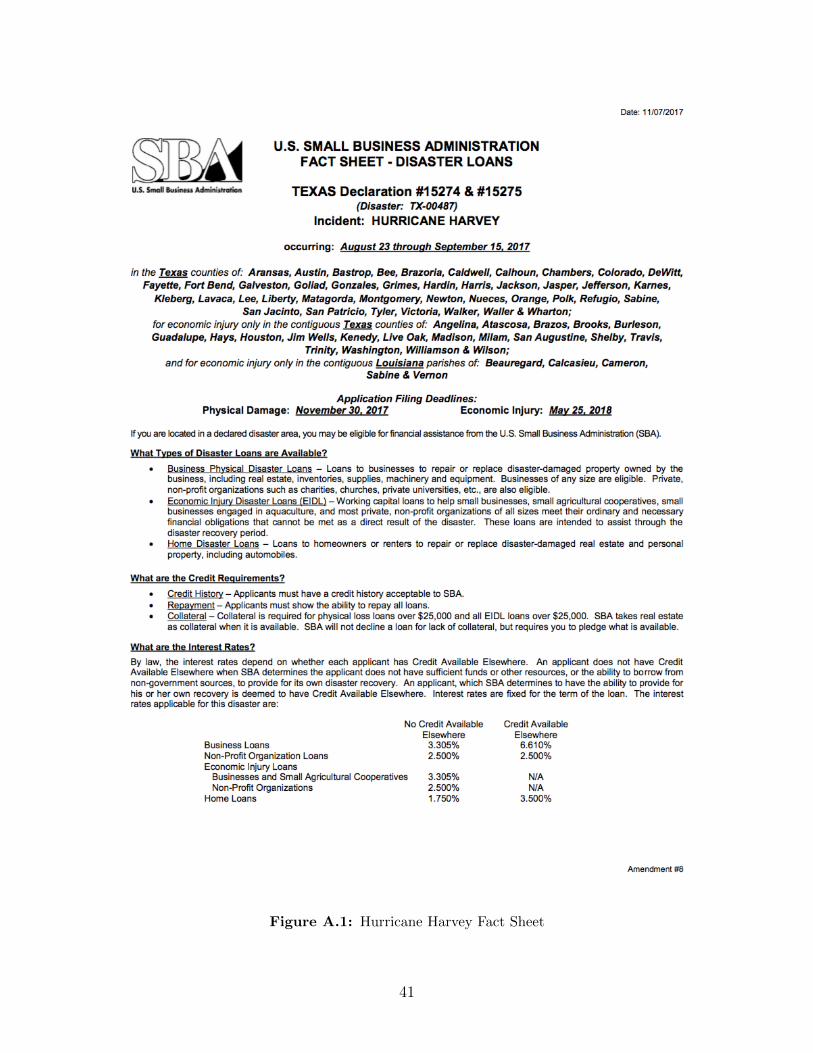
Figure A.1: Hurricane Harvey Fact Sheet
41
Related Documents