“DISADVANTAGE CYCLE” IN THE LESS DEVELOPED STATES: EVIDENCE FROM MALAYSIA ASAN-ALI GOLAM HASSAN Faculty of Economics Universiti Utara Malaysia ABSTRACT The current regional policy has developed two ‘industrial dispersion’ tools to spearhead the restructuring of economic activities across regions. Although the less developed states have comparative advantages in terms of cheap labour and industrial land, and additional investment incentive, most firms were still located in the more developed states mainly due to the high comparative advantages and economies of scale such as the establishment of manufacturing activities in those areas with easy access to infrastructure, service industries, and large labour and consumer markets. This caused slow TFP growth and the convergence process in the less developed states remain problematic. This is generally due to the economic and demographic ‘disadvantages cycle’ that clearly occurs in the less developed regions. In the long term, policy makers need to think of ways and means to distribute these limited resources and increase the comparative advantage of the less developed states. The discussion in this paper will attempt to explore the degree to which differences in regional manufacturing distribution and concentration have contributed to regional inequality. This study has provided a series of recommendation about how this might be done in order to overcome the problem of long-standing regional inequality in Peninsular Malaysia. ABSTRAK Polisi pembangunan ‘kawasan pembangunan, skim insentif lokasi dan koridor pembangunan pantai timur’, melalui Investment Incentive Act 1968, 1971 dan 1986 telah diperkenalkan untuk mengalakkan proses penyerakan industri antara wilayah. Walau bagaimanapun pencapaian polisi penyerakan ini agak perlahan. Secara relatif, walaupun negeri kurang maju mempunyai faedah berbanding dari segi upah buruh dan harga tanah yang murah serta insentif- insentif tambahan oleh kerajaan, namun kebanyakan firma masih memilih IJMS 14 (1), 109-143 (2007)

Welcome message from author
This document is posted to help you gain knowledge. Please leave a comment to let me know what you think about it! Share it to your friends and learn new things together.
Transcript
IJMS 14 (1), 89-108 (2006) 109
“DISADVANTAGE CYCLE” IN THE LESSDEVELOPED STATES: EVIDENCE FROM
MALAYSIA
ASAN-ALI GOLAM HASSANFaculty of Economics
Universiti Utara Malaysia
ABSTRACT
The current regional policy has developed two ‘industrial dispersion’ tools tospearhead the restructuring of economic activities across regions. Althoughthe less developed states have comparative advantages in terms of cheap labourand industrial land, and additional investment incentive, most firms werestill located in the more developed states mainly due to the high comparativeadvantages and economies of scale such as the establishment of manufacturingactivities in those areas with easy access to infrastructure, service industries,and large labour and consumer markets. This caused slow TFP growth andthe convergence process in the less developed states remain problematic. Thisis generally due to the economic and demographic ‘disadvantages cycle’ thatclearly occurs in the less developed regions. In the long term, policy makersneed to think of ways and means to distribute these limited resources andincrease the comparative advantage of the less developed states. The discussionin this paper will attempt to explore the degree to which differences in regionalmanufacturing distribution and concentration have contributed to regionalinequality. This study has provided a series of recommendation about howthis might be done in order to overcome the problem of long-standing regionalinequality in Peninsular Malaysia.
ABSTRAK
Polisi pembangunan ‘kawasan pembangunan, skim insentif lokasi dan koridorpembangunan pantai timur’, melalui Investment Incentive Act 1968, 1971dan 1986 telah diperkenalkan untuk mengalakkan proses penyerakan industriantara wilayah. Walau bagaimanapun pencapaian polisi penyerakan ini agakperlahan. Secara relatif, walaupun negeri kurang maju mempunyai faedahberbanding dari segi upah buruh dan harga tanah yang murah serta insentif-insentif tambahan oleh kerajaan, namun kebanyakan firma masih memilih
IJMS 14 (1), 109-143 (2007)w
ww
.ijm
s.uu
m.e
du.m
y
110 IJMS 14 (1), 109-143 (2006)
untuk beroperasi di negeri maju. Keadaan ini ada kaitannya dengan jenisindustri di negeri kurang maju yang lebih berorientasikan buruh, pelaburdan produk keperluan tempatan, saiz firma yang kecil, kurangnya keanjalanoutput terhadap buruh dan modal serta nilai ditambah yang rendah. Seakan-akan wujud satu ‘kitaran penghalang’ dari segi demografi dan ekonomi dinegeri kurang maju, ini melambatkan proses untuk mengurangkan jurangpembangunan di antara negeri maju dan negeri kurang maju. Artikel inimembincangkan bagaimana tumpuan industri antara wilayah membawakepada masalah ketidakseimbangan pembangunan dan mencadangkanbeberapa polisi pembangunan untuk mengurangkan masalahketidakseimbangan pembangunan yang berlaku.
INTRODUCTION
Since the Independence and especially after 1970, the Malaysiangovernment has tried to promote a balance of economic activitiesthrough major efforts to expand modern sector activities, particularlyin the less developed states, shifting the emphasis from the agriculturalsector to the manufacturing sector. It is hoped that the manufacturingsector will increase economic opportunity as well as monthly income,decrease poverty and unemployment in the less developed areasthrough diversification of economic activities in the less-developedstates to generate higher economic growth, and by dispersing newdevelopment and growth especially to less developed regions. Besidesthis, the manufacturing sector was seen as the main tool to spearheadthe restructuring of economic activities and society. The regionalstrategy that has a direct role to redistribute manufacturing activitiesis ‘industrial dispersal strategy’.
The discussion in this paper will attempt to explore the degree to whichdifferences in regional manufacturing distribution and concentrationhave contributed to regional inequality. The first part of this paperwill clarify the use of the term ‘region’ in this study. The second part ofthis paper will discuss the incentives provided under the InvestmentIncentive Act and developing the industrial estates to promote themanufacturing sector and its effect on the output and labourcontributed by state and region. The third part of this paper will focuson the distribution and concentration of export-oriented industries.Following this, part four of this paper will discuss the investors’distribution and its concentration in Peninsular Malaysia. Part five willexplore the regional convergence factors and finally, in part six, someconclusions and policy recommendations are drawn.w
ww
.ijm
s.uu
m.e
du.m
y

IJMS 14 (1), 109-143 (2006) 111
The Regional Malaysian Context
Since 1981, all states in Peninsular Malaysia have been aggregated intosix regions (Malaysia, 1981). Each region consists of a contiguouslandmass, which is in a more or less uniform stage of developmentand may encompass an entire state or group of states. In general, theseregions share similarities in resources and in terms of economicactivities, and have been dominated by a single metropolitan area(growth centre). Peninsular Malaysia consists of four regions whileEast Malaysia consists of two regions.
Regions in Peninsular Malaysia (West Malaysia):1. Northern region: consists of four states – Perlis, Kedah, Pulau
Pinang, and Perak with Georgetown as the growth centre.
2. Central region: consists of four states – Selangor, Federal Territoryof Kuala Lumpur, Negeri Sembilan, and Melaka with KualaLumpur as the growth centre.
3. Eastern region: consists of three states – Kelantan, Terengganu,and Pahang with Kuantan as the growth centre.
4. Southern region: consists of a single state, Johor with Johor Baharuas the growth centre.
Starting in 2001, the composite development index has been used andstates in Malaysia have been divided into two categories based on levelof development (Malaysia, 2001a:116).
1. More developed states; Johor, Melaka, Negeri Sembilan, Perak,Pulau Pinang, Selangor, and Federal Territory of Kuala Lumpur.
2. Less developed states; Kedah, Kelantan, Pahang, Perlis, Sabah,Sarawak, and Terengganu.
Intensive and Manufacturing Dispersal
The levels of regional income have strong linkages with theestablishment of the manufacturing sector. Since the Independence andsubsequently after the implementation of the New Economic Policy(NEP) (1971), the government has made serious efforts to decentralisethe manufacturing activities. This is because industrial imbalance hasan important relation to the imbalance of household monthly income,poverty, and unemployment.w
ww
.ijm
s.uu
m.e
du.m
y

112 IJMS 14 (1), 109-143 (2006)
Under British colonialism, Peninsular Malaysia was the main supplierof tin and rubber to the world. Economic activities focused more onthe primary sector. However, since the Independence in 1957, thegovernment has started to promote the secondary sector(manufacturing and construction) as a source of growth besides exportcommodities (tin, rubber and oil palm). In 1958, the Pioneer IndustriesOrdinance was introduced to increase private sector investment.
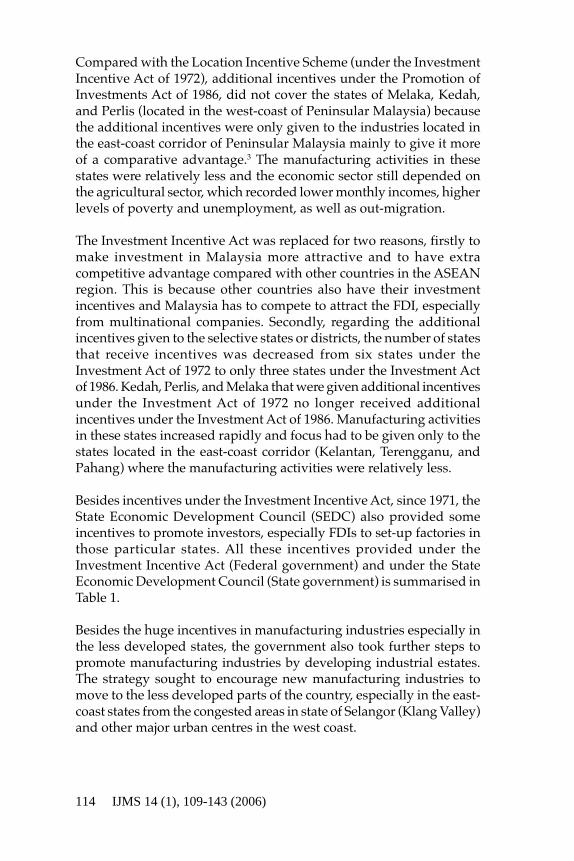
In order to promote industrial activities in the less developed states(or districts), the government introduced the concept of a ‘developmentarea’ under the Investment Incentive Act, 1968. Industries that werelocated in these areas would be granted with additional incentives.The development areas covered the entire states of Perlis, Terengganu,Melaka, Sabah, Sarawak, and the relatively less developed districts ofKedah (excluding Kuala Muda district), Pahang (excluding Kuantandistrict) and southeast of Johor (Figure 1). It also included two industrialestates, which were Kemunting Industrial Estate (in the state of Perak)and Senawang Industrial Estate (in the state of Negeri Sembilan) andtwo Free Trade Zones (FTZ) or industrial areas, which were BayanLepas FTZ (in the state of Pulau Pinang) and Sungei Way FTZ (in thestate of Selangor). These two industrial areas were the pioneerindustrial areas and were isolated from the concentrated industrialareas in the state of Selangor and Pulau Pinang, while the FTZ statusmade them the pioneer FTZs in Malaysia. 1
After the implementation of the NEP, the government introduced theLocation Incentive Scheme (under the Investment Incentive Act of1972). More incentives were given to local and foreign investors tolocate their activities in the less developed states (or districts)2 mainlyto redistribute the industrial activities from more concentrated areasin the more developed states. Compared with the development areaunder the Investment Incentive Act of 1968, the Location IncentiveAct of 1972, only covered the entire states of Perlis, Terengganu, Melaka,Sabah, Sarawak and the relatively less developed districts of Kedah(excluding Kuala Muda district), Pahang (excluding Kuantan district),and southeast of Johor. It did not include Kemunting Industrial Estate,Senawang Industrial Estate, Bayan Lepas FTZ and Sungei Way FTZbecause it referred only to the less developed states (or districts).
Further incentive was given under the Promotion of Investments Actof 1986, which was introduced as a replacement for the InvestmentIncentive Act of 1972. Although industrial development focused moreon the west-coast corridor, additional incentives were given to theindustries located in the east-coast corridor of Peninsular Malaysia. Itw
ww
.ijm
s.uu
m.e
du.m
y

IJMS 14 (1), 109-143 (2006) 113
covered Kelantan, Terengganu, Pahang and the district of Mersing insoutheast of Johor.
Incentiveslocation
Key:
Figure 1Investment incentives location under Act 1968, Act 1972, and 1986.w
ww
.ijm
s.uu
m.e
du.m
y
114 IJMS 14 (1), 109-143 (2006)
Compared with the Location Incentive Scheme (under the InvestmentIncentive Act of 1972), additional incentives under the Promotion ofInvestments Act of 1986, did not cover the states of Melaka, Kedah,and Perlis (located in the west-coast of Peninsular Malaysia) becausethe additional incentives were only given to the industries located inthe east-coast corridor of Peninsular Malaysia mainly to give it moreof a comparative advantage.3 The manufacturing activities in thesestates were relatively less and the economic sector still depended onthe agricultural sector, which recorded lower monthly incomes, higherlevels of poverty and unemployment, as well as out-migration.
The Investment Incentive Act was replaced for two reasons, firstly tomake investment in Malaysia more attractive and to have extracompetitive advantage compared with other countries in the ASEANregion. This is because other countries also have their investmentincentives and Malaysia has to compete to attract the FDI, especiallyfrom multinational companies. Secondly, regarding the additionalincentives given to the selective states or districts, the number of statesthat receive incentives was decreased from six states under theInvestment Act of 1972 to only three states under the Investment Actof 1986. Kedah, Perlis, and Melaka that were given additional incentivesunder the Investment Act of 1972 no longer received additionalincentives under the Investment Act of 1986. Manufacturing activitiesin these states increased rapidly and focus had to be given only to thestates located in the east-coast corridor (Kelantan, Terengganu, andPahang) where the manufacturing activities were relatively less.
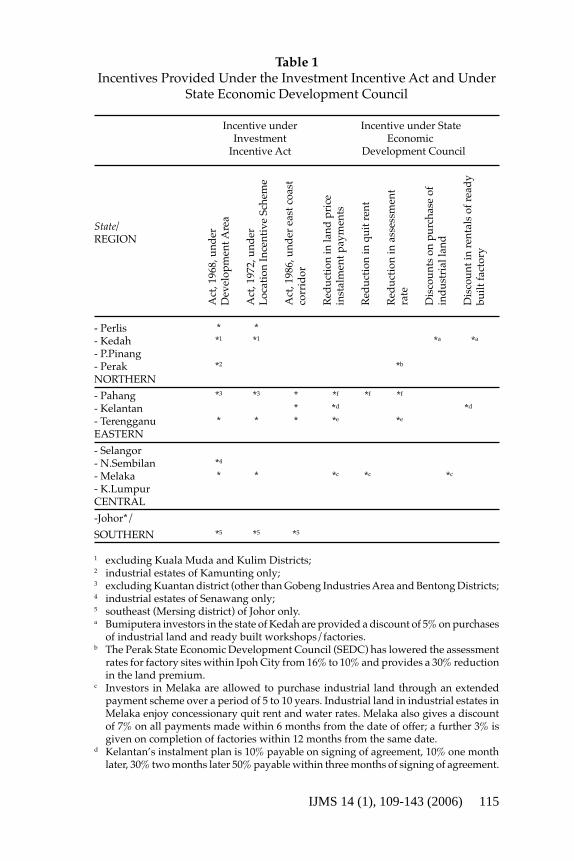
Besides incentives under the Investment Incentive Act, since 1971, theState Economic Development Council (SEDC) also provided someincentives to promote investors, especially FDIs to set-up factories inthose particular states. All these incentives provided under theInvestment Incentive Act (Federal government) and under the StateEconomic Development Council (State government) is summarised inTable 1.
Besides the huge incentives in manufacturing industries especially inthe less developed states, the government also took further steps topromote manufacturing industries by developing industrial estates.The strategy sought to encourage new manufacturing industries tomove to the less developed parts of the country, especially in the east-coast states from the congested areas in state of Selangor (Klang Valley)and other major urban centres in the west coast.w
ww
.ijm
s.uu
m.e
du.m
y
IJMS 14 (1), 109-143 (2006) 115
Table 1Incentives Provided Under the Investment Incentive Act and Under
State Economic Development Council
Incentive under Incentive under StateInvestment Economic
Incentive Act Development Council
State/REGION
Act
, 196
8, u
nder
Dev
elop
men
t Are
a
Act
, 197
2, u
nder
Loc
atio
n In
cent
ive
Sche
me
Act
, 198
6, u
nder
eas
t coa
stco
rrid
or
Red
ucti
on in
land
pri
cein
stal
men
t pay
men
ts
Red
ucti
on in
qui
t ren
t
Red
ucti
on in
ass
essm
ent
rate
Dis
coun
ts o
n pu
rcha
se o
fin
dus
tria
l lan
d
Dis
coun
t in
rent
als
of r
ead
ybu
ilt fa
ctor
y
- Perlis * *- Kedah *1 *1 *a *a
- P.Pinang- Perak *2 *b
NORTHERN
- Pahang *3 *3 * *f *f *f
- Kelantan * *d *d
- Terengganu * * * *e *e
EASTERN
- Selangor- N.Sembilan *4
- Melaka * * *c *c *c
- K.LumpurCENTRAL
-Johor*/
SOUTHERN *5 *5 *5
1 excluding Kuala Muda and Kulim Districts;2 industrial estates of Kamunting only;3 excluding Kuantan district (other than Gobeng Industries Area and Bentong Districts;4 industrial estates of Senawang only;5 southeast (Mersing district) of Johor only.a Bumiputera investors in the state of Kedah are provided a discount of 5% on purchases
of industrial land and ready built workshops/factories.b The Perak State Economic Development Council (SEDC) has lowered the assessment
rates for factory sites within Ipoh City from 16% to 10% and provides a 30% reductionin the land premium.
c Investors in Melaka are allowed to purchase industrial land through an extendedpayment scheme over a period of 5 to 10 years. Industrial land in industrial estates inMelaka enjoy concessionary quit rent and water rates. Melaka also gives a discountof 7% on all payments made within 6 months from the date of offer; a further 3% isgiven on completion of factories within 12 months from the same date.
d Kelantan’s instalment plan is 10% payable on signing of agreement, 10% one monthlater, 30% two months later 50% payable within three months of signing of agreement.w
ww
.ijm
s.uu
m.e
du.m
y

116 IJMS 14 (1), 109-143 (2006)
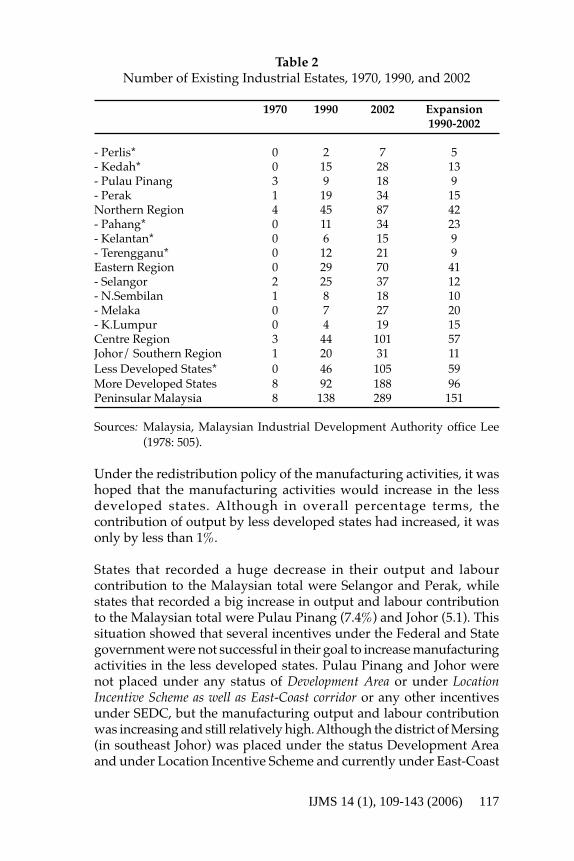
Although the number of existing industrial estates in the less developedstates had increased (Table 2), the size (in hectare units) of the industrialestates was rather small. This is because most of the industries locatedin the less developed states were Small Medium Industry (SMI) andlabour intensive. About 41% of the industrial estates in less developedstates were less than 25 hectares compared with 26% in more developedstates. Only 3% of industrial estates in less developed states were morethan 200 hectares, while 11% industrial estates in more developed stateswere more than 200 hectares.
Furthermore, all of the industrial estates in the less developed stateswere developed by the public or government sector, while in the moredeveloped states, some of the industrial estates were developed bythe private sector. For example, until 2002, from 28 industrial estatesin Perak, 10 of them were developed by the private sector, while inKelantan and Terengganu, all the industrial estates were developedby the public sector. Although the industrial areas developed by theprivate sector was generally 30% higher than the industrial areasdeveloped by the public sector (depending on location), the demandfor the industrial areas in the more developed states was relativelyhigh and the private sector (property sector) took this opportunity tocreate a marginal profit.
Although the manufacturing sector in Peninsular Malaysia, as a whole,experienced rapid average annual output growth rate, its distributionwas still more towards developed states. In fact, although the Federaland State governments have made serious efforts to increasemanufacturing activities in less developed states by introducing severalincentives, the distribution of manufacturing activities in PeninsulaMalaysia did not change much by the end of the NEP from 1970 to1990.
Kelantan’s rental rate for ready built factories allow discount based on number ofworkers and floor space.
e Terengganu SEDC operates a Special Incentives Scheme. Under this scheme, investorscreating total employment for more than 200 staff obtain industrial land prices atM$0.50 per square metre to a maximum of 4 hectares and a 50% lowering in the annualassessment rate. Quit rent is also negotiable.
f Pahang SEDC operates a progressive payment scheme with the 20% down paymentinto two instalments of 10% each with a grace period of 6 months. Investors are givena grace period of 6 and 9 months after the first and second down payment respectivelyand the balance is paid in 4 instalments equally distributed over the next 9 monthperiod. Quit rent for industrial land lowered by 50% to 15% per 100 metres for thefirst two hectares.
Sources: Malaysia, Ministry of International Trade and Industry office Malaysian;Economic Planning Unit (1990: 4-9) Young (1988: 4)
ww
w.ij
ms.
uum
.edu
.my
IJMS 14 (1), 109-143 (2006) 117
Table 2Number of Existing Industrial Estates, 1970, 1990, and 2002
1970 1990 2002 Expansion1990-2002
- Perlis* 0 2 7 5- Kedah* 0 15 28 13- Pulau Pinang 3 9 18 9- Perak 1 19 34 15Northern Region 4 45 87 42- Pahang* 0 11 34 23- Kelantan* 0 6 15 9- Terengganu* 0 12 21 9Eastern Region 0 29 70 41- Selangor 2 25 37 12- N.Sembilan 1 8 18 10- Melaka 0 7 27 20- K.Lumpur 0 4 19 15Centre Region 3 44 101 57Johor/ Southern Region 1 20 31 11Less Developed States* 0 46 105 59More Developed States 8 92 188 96Peninsular Malaysia 8 138 289 151
Sources: Malaysia, Malaysian Industrial Development Authority office Lee(1978: 505).
Under the redistribution policy of the manufacturing activities, it washoped that the manufacturing activities would increase in the lessdeveloped states. Although in overall percentage terms, thecontribution of output by less developed states had increased, it wasonly by less than 1%.
States that recorded a huge decrease in their output and labourcontribution to the Malaysian total were Selangor and Perak, whilestates that recorded a big increase in output and labour contributionto the Malaysian total were Pulau Pinang (7.4%) and Johor (5.1). Thissituation showed that several incentives under the Federal and Stategovernment were not successful in their goal to increase manufacturingactivities in the less developed states. Pulau Pinang and Johor werenot placed under any status of Development Area or under LocationIncentive Scheme as well as East-Coast corridor or any other incentivesunder SEDC, but the manufacturing output and labour contributionwas increasing and still relatively high. Although the district of Mersing(in southeast Johor) was placed under the status Development Areaand under Location Incentive Scheme and currently under East-Coastw
ww
.ijm
s.uu
m.e
du.m
y

118 IJMS 14 (1), 109-143 (2006)
corridor, the Mersing industrial area only contributed less than 2% tothe total manufacturing output and labour4.
Investment incentives play an important role in increasingmanufacturing activities in Malaysia. Investment incentives in Malaysiastarted with the Investment Incentive Act of 1968 which was replacedby the Investment Incentive Act of 1972. Further incentives were givenunder the promotion of the Investments Incentive Act of 1986, whichwas introduced as a replacement for the Investment Incentive Act of1972. The most apparent effect from the government industrialincentive is in terms of the Investment Incentive Act of 1986. Beforethe 1986 Act, about 37% to 47% of approved projects were the result ofinvestment incentives given by the government. This amount increasedrapidly after the 1986 Act, for instance, in 1990, the amount increasedto about 58%. However, it decreased in 1997 due to the economicdownturn. Most of the industries that received this incentive were theexport-oriented industries located in the more developed states,especially in Selangor, Pulau Pinang,, and Johor. Location incentiveswere less effective since projects approved under this incentive weresmall compared to other incentives æ they only account for less than3% of the approved manufacturing projects with incentives.
Export-Oriented and Concentration (3-Digit Classification)
The imbalanced distribution of industrial concentration between stateswas the other main factor that created imbalanced growth betweenstates in Peninsular Malaysia. There are two groups of industriesdistributed in the regions. The first group is the modern technologyindustry, especially for exported products, which can be seen in thewell-developed regions, and the second group is the small industriesfor domestic goods in the less developed regions. Inequality in thisindustry distribution will create problems as it affects the populationas well as the income of the regions.
Industrialisation in Malaysia gradually shifted from an import-substitution industry in the 1960s to an export-orientation in the 1970s,then to heavy industry since early 1980s. Exports of commodities as amain source of growth for both the economy and the agricultural sectorwere no longer important. Agricultural exports declined in share from52.1% in 1970 to only 35.8% in 1980, mainly due to the slow growth inthe production of rubber and the emergence of crude oil andmanufactured goods as important export commodities. After 1980 (thestart of the Fourth Malaysia Plan), the manufacturing sector wasprojected to grow at a rapid rate of 10.9% per annum (Malaysia, 1981).w
ww
.ijm
s.uu
m.e
du.m
y
IJMS 14 (1), 109-143 (2006) 119
The final aim of the industrialisation strategy since 1970 was to meetthe NEP objectives, growth, and equity. This is because manufacturingwas seen as the engine of growth to spearhead the restructuring ofeconomic activity and society besides absorbing the surplus labourfrom the agricultural sector (Rajah & Ishak, 2001). Emphasis was givento the creation of employment, development of small and medium-scale and heavy industries, and participation of Malays in themanufacturing sector especially in the less developed states.
The manufacturing sector contribution to total GDP increased rapidlyfrom only 17.7% in year 1970 to 30.5% in 1990, (leading to a decliningshare of primary commodity exports) and continuously increased to33.4% in year 2000. It is expected to increase to 35.8% in year 2005. Interms of exported manufacturing goods, it has increased from 58.8%in 1990 to 85.2% in 2000 (Malaysia, 2001b).
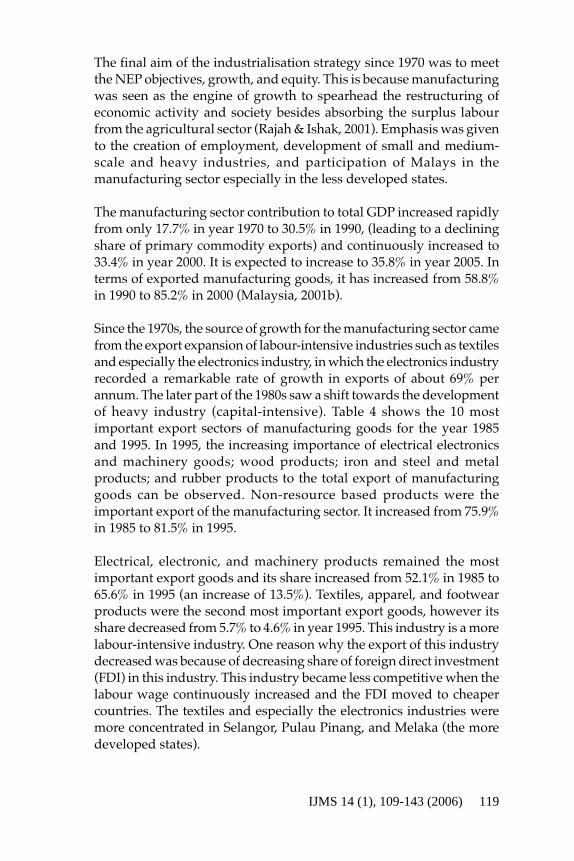
Since the 1970s, the source of growth for the manufacturing sector camefrom the export expansion of labour-intensive industries such as textilesand especially the electronics industry, in which the electronics industryrecorded a remarkable rate of growth in exports of about 69% perannum. The later part of the 1980s saw a shift towards the developmentof heavy industry (capital-intensive). Table 4 shows the 10 mostimportant export sectors of manufacturing goods for the year 1985and 1995. In 1995, the increasing importance of electrical electronicsand machinery goods; wood products; iron and steel and metalproducts; and rubber products to the total export of manufacturinggoods can be observed. Non-resource based products were theimportant export of the manufacturing sector. It increased from 75.9%in 1985 to 81.5% in 1995.
Electrical, electronic, and machinery products remained the mostimportant export goods and its share increased from 52.1% in 1985 to65.6% in 1995 (an increase of 13.5%). Textiles, apparel, and footwearproducts were the second most important export goods, however itsshare decreased from 5.7% to 4.6% in year 1995. This industry is a morelabour-intensive industry. One reason why the export of this industrydecreased was because of decreasing share of foreign direct investment(FDI) in this industry. This industry became less competitive when thelabour wage continuously increased and the FDI moved to cheapercountries. The textiles and especially the electronics industries weremore concentrated in Selangor, Pulau Pinang, and Melaka (the moredeveloped states).w
ww
.ijm
s.uu
m.e
du.m
y
120 IJMS 14 (1), 109-143 (2006)
Table 3Export of Manufacturing Goods, 1985 and 1995 (RM Million).
1985 1995RM % RM %
Million Share Million ShareElectrical, electronics & machinery(382, 383)a (NRB)* 6,493 52.1 96,748 65.6
Textiles, apparel and footwear(321, 322, 323, 324) (NRB) 1,289 10.3 6,712 4.6
Chemicals and plastic products(351, 352, 356) (NRB) 610 4.9 6,702 4.5
Wood products(331, 332) (RB) 365 2.9 6,265 4.2
Transport equipment
(384) (NRB) 566 4.5 5,247 3.6
Iron, steel and metal products(371, 372, 381) (NRB) 357 2.9 4,819 3.3
Food, beverages and tobacco(311-312, 313, 314)a (RB) 781 6.3 3,676 2.5
Rubber products(355) (RB) 113 0.9 3,218 2.2
Petroleum products(353, 354) (RB) 1,041 8.3 3,127 2.1
Non-metallic mineral products(361, 362, 363) (RB) 150 1.2 1,678 1.1
Other manufactured goodsb 706 5.7 9,315 6.3
Total Non-Resources Based 9,315.0 75.9 120,228.0 81.5
Total Resources Based 2,450.0 20.0 17,964.0 12.2
Totalc 12,274 147,507(0.03) 100 (22.9) 100
*NRB = Non-resource Based; RB = Resource Based
a Figures in parentheses refer related to 3 digit industry codeb Includes export of other manufactured goods besides abovec Figures in parentheses are annual percentage change of total export ofmanufacturing goods
Sources: Malaysia (1999: xxx) Malaysia (2001c: xxvii) Malaysia (2001b: 238)ww
w.ij
ms.
uum
.edu
.my
IJMS 14 (1), 109-143 (2006) 121
Structural change in the manufacturing industry from labour-intensiveto capital-intensive (heavy industry) and optimising of resource-basedindustry have somehow relatively increased manufacturing activitiesin the less developed states. As mentioned earlier, the industrialisationera in Malaysia started with the labour-intensive industry and moreof these industries were located in the more developed states. Besidescausing unequal economic growth, it also affected the demographicstructure in the less developed states, especially by out-migration
Growth in the manufacturing sector since the 1980s was a result of thediversification of manufacturing towards a capital-intensive industryespecially export goods, as well as maximisation of the comparativeadvantage of Malaysia’s resource endowment. Specific tax incentiveswere also provided to encourage the growth of export-orientedindustries. Besides this, a substantial proportion of manufacturedexports came from the FTZs.5
FTZs were specially designated for export-oriented industries. Thereare 14 FTZs in Malaysia, eleven of which are located in the moredeveloped states, while the rest are in the less developed states (Kedah,Kelantan, and Pahang). Infrastructure network, which provided easyaccess to the services industry, was the main reason why most of theFTZs were located in the more developed states. The FTZs weredeveloped near to the well-established industrial estates andinfrastructure network mainly to make them generate backward andforward linkages to other industries as well as to make them moreattractive to the FDI.
Overall industrial concentration shows more dispersal for food,beverages and tobacco (31) and basic metals (37), wood and woodproducts (33), chemicals and rubber industries (35), and non-metallicminerals (36) in the year 1995. At the same time, industries such astextiles and clothing (32), paper and printing (34) and metal products,and machinery (38) remain concentrated in the more developed states.Although the concentration of those industries is on an increase in theless developed states, the concentration of capital, labour, value added,and output remained dominant in the more developed states. Thisscenario has a close linkage with the background of the labour marketin that particular state. It is undeniable that an educated andexperienced worker will migrate to more developed states and theinexperienced ones will remain in the less developed state. This createsa lower technological industrial environment in the less developedstates giving rise to such industries as food processing, drinks,w
ww
.ijm
s.uu
m.e
du.m
y

122 IJMS 14 (1), 109-143 (2006)
furniture, paper products, rubber products and non-metal products.These industries are not only providing lower labour product abilitybut also lower wages (Figure 2).
1,600
1,400
1,200
1,000
800
600
400
200
01970 1975 1980 1985 1990 1995
MonthlyWage(RM)
More developed states
Less developed states
Figure 2Average montyly wage per worker (RM) in the more developed
and the less developed states, 1970 - 1999
Investor Distribution and Concentration
Since the 1970s, the public and private sectors have experienced rapidgrowth. Both sectors have played an important role in meeting thedevelopment objectives of the nation as well as achieving the NewEconomic Policy (NEP) objectives of poverty eradication and therestructuring of society. At the beginning of the NEP, the public sectorpaid more attention to increasing public utilities (infrastructure andother social infrastructure) and to improving the quality of life in ruralareas. Private investment expanded rapidly in the industrial sectors,particularly in manufacturing and construction, petroleum explorationand production, and in the export-oriented industries located in theFTZs.
Foreign Direct Investment (FDI) played a significantly important rolein Malaysia’s manufacturing activities. The importance of Britishinvestors before the 1970s had been overtaken by investors from Japan,USA, Singapore, Taiwan, and Switzerland.6 In 1983, about 17% of thetotal capital investment came from Japanese investors and increasedrapidly to about 30% in the mid-1990s.7
The FDI increment was higher in the more developed states. In termsof percentage output share, chemical products were important in Johor,w
ww
.ijm
s.uu
m.e
du.m
y

IJMS 14 (1), 109-143 (2006) 123
while electrical, electronics, and machinery products were importantin Melaka, Negeri Sembilan, Perak, Johor, and especially in Selangorand Pulau Pinang. Kedah was the only less developed state that hadthe advantage of increasing FDI in electrical, electronics and machineryproducts. Kedah experienced the spread effect because it was locatednear to the northern regional growth centre. The state of Kedah alsohad the advantage of external diseconomies of urbanisation in PulauPinang (potential for congestion, and high wages, and high employeeturnover). FDI firms were more geographically dispersed throughoutPeninsular Malaysia as compared with local investment firms. Localinvestors were more concentrated in Selangor, Johor and Terengganu.This situation somehow contradicts the early hypothesis of this studythat FDI will increase the inequality between states in PeninsularMalaysia.
Approved manufacturing projects for the FDI were less associated withthe participation rate of labour, mean monthly income, number ofestablished manufacturing projects, and the education level of labour.Compared with FDI, domestic investors have higher correlation withall the indicators, which are also relatively high in the more developedstates. Generally, most of the domestic investors are involved inresource-based and import substituting industries. In other words, theydepend on the local consumers, while FDI depends on the overseasconsumers (export-oriented industries). High consumer concentrationwas located in the more developed states, in which the number ofestablished manufacturing projects and monthly household income,was also relatively high.
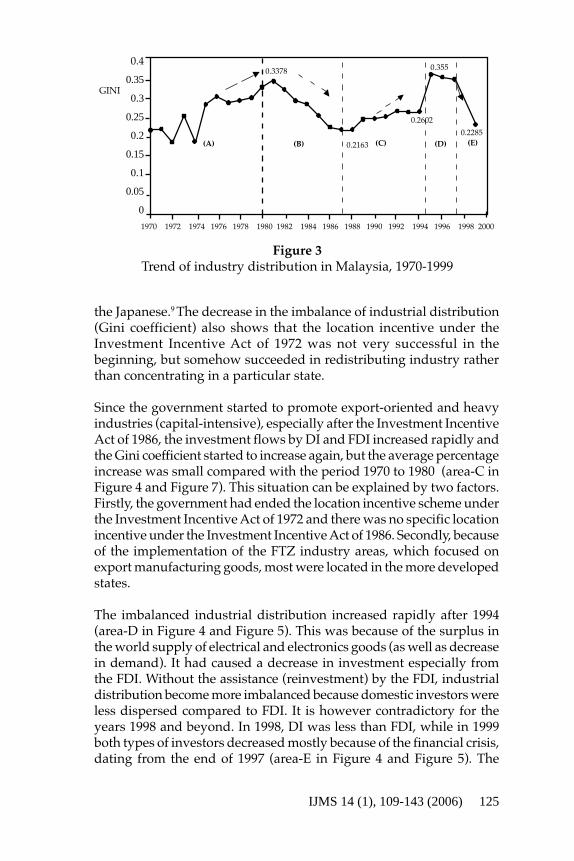
Figure 3 shows the trend of Industries distribution in Malaysia (byusing the Gini coefficient) from 1970 until 1999.8 The Gini coefficientcan be divided into five flows (A to E) and the trend significantlydepends on the states’ economic structure, government policy, andworld economic scenarios.
Since the 1970 NEP, the government has started to promote themanufacturing sector as one of the instruments to diversify theeconomic base and at the same time, to decrease poverty,unemployment, and restructure society. However, the states’ economicstructure shift towards industrialisation did not happen at the sametime for all states. In states that were more urbanised, with theestablishment of the transportation system and public utilities,concentration of the commercial sector (tin and rubber products)enabled them to grow faster compared to states that depended on thetraditional agricultural sector.w
ww
.ijm
s.uu
m.e
du.m
y

124 IJMS 14 (1), 109-143 (2006)
The percentage contribution to GDP by the agriculture industrydecreased rapidly in all states (and regions) especially in the moredeveloped states. Consequently, the importance of the agriculture andmineral sectors as the main contributor to GDP and employment, wasover taken by the manufacturing sector. In these states, the urbanisationprocess and infrastructural amenities have been well developed andattracted a greater share of investment in the manufacturing sector.
At the beginning, especially after the Investment Incentive Act of 1972,the manufacturing sector started with import-substitutes (labour-intensive) industries which were more concentrated in the west coast(more developed states) of Peninsular Malaysia. Most of thecomparative advantages were located in developed regions and thisled to the widening gap between states. Besides, domestic investors(DI), FDI especially from Japan was also widely distributed in the moredeveloped states. Among 330 Japanese firms in Peninsular Malaysia,57.9% were located in Selangor and 22.4% in Pulau Pinang. Overall,95.8% were located in the more developed states and the rest in lessdeveloped states. This matched Chunlai’s (1997:8) study in China whichshowed that location determination of FDI inflow into developingcountries was influenced by a large domestic market (in the case ofPeninsular Malaysia - concentration of population in Selangor andPulau Pinang), faster economic growth and higher per capita income(Selangor, including Kuala Lumpur have recorded per capita GDP ofabout 63% higher than the Malaysian average in 1970) (Malaysia, 1976:200).
Because of the uneven economic growth during the early process ofindustrialisation, the distribution of industries in Peninsular Malaysiabecame more unequal. The Gini coefficient had increased since theearly 1970s, reaching its peak in 1981 or in other words, the distributionhas become more unequal.
However, the Gini coefficient started to decrease since 1982 (area-B inFigure 3), partly because of the important role played by thegovernment since 1971, in order to increase infrastructural amenitiesas well as industrial estates to attract investors to the manufacturingsector in the less developed states. Besides this, the change ofmanufacturing structure from import-substitutes to export-oriented(labour-intensive) manufacturing activities has seen a total decreasein the imbalanced distribution of industries between states.
The export-oriented (labour-intensive) manufacturing activities givea comparative advantage to the less developed states because the costof hired labour is relatively cheap and this attracted the FDI especiallyw
ww
.ijm
s.uu
m.e
du.m
y
IJMS 14 (1), 109-143 (2006) 125
the Japanese.9 The decrease in the imbalance of industrial distribution(Gini coefficient) also shows that the location incentive under theInvestment Incentive Act of 1972 was not very successful in thebeginning, but somehow succeeded in redistributing industry ratherthan concentrating in a particular state.
Since the government started to promote export-oriented and heavyindustries (capital-intensive), especially after the Investment IncentiveAct of 1986, the investment flows by DI and FDI increased rapidly andthe Gini coefficient started to increase again, but the average percentageincrease was small compared with the period 1970 to 1980 (area-C inFigure 4 and Figure 7). This situation can be explained by two factors.Firstly, the government had ended the location incentive scheme underthe Investment Incentive Act of 1972 and there was no specific locationincentive under the Investment Incentive Act of 1986. Secondly, becauseof the implementation of the FTZ industry areas, which focused onexport manufacturing goods, most were located in the more developedstates.
The imbalanced industrial distribution increased rapidly after 1994(area-D in Figure 4 and Figure 5). This was because of the surplus inthe world supply of electrical and electronics goods (as well as decreasein demand). It had caused a decrease in investment especially fromthe FDI. Without the assistance (reinvestment) by the FDI, industrialdistribution become more imbalanced because domestic investors wereless dispersed compared to FDI. It is however contradictory for theyears 1998 and beyond. In 1998, DI was less than FDI, while in 1999both types of investors decreased mostly because of the financial crisis,dating from the end of 1997 (area-E in Figure 4 and Figure 5). The
Figure 3Trend of industry distribution in Malaysia, 1970-1999
0.4
0.35
0.3
0.25
0.2
0.15
0.1
0.05
0
1970 1972 1974 1976 1978 1980 1982 1984 1986 1988 1990 1992 1994 1996 1998 2000
(A) (B) (C) (D) (E)
GINI
0.2163
0.2602
0.2285
0.3550.3378
ww
w.ij
ms.
uum
.edu
.my

126 IJMS 14 (1), 109-143 (2006)
Figure 5Mirror image of the percentage of FDI and domestic investment,
1982 - 1999
financial crisis was more serious in the more developed states wherethe industries were export-orientated and non-resource-based,compared to the less developed states, where the industries were morefor the domestic market and resource-based. In this situation, theimbalance in industrial distribution decreased.
The changes in the distribution of the industries (Gini coefficient) arealso interrelated to the percentages of DI and FDI in the manufacturing
30.0
25.0
20.0
15.0
10.0
5.0
0.0
Figure 4Trend of FDI, DI and Total investment in Malaysia, 1982 - 1999
(C) (D)(B)
Total
1982 1984 1986 1988 1990 1992 1994 1996 1998 2000
(E)R
M B
illio
n
90
80
70
60
50
40
30
20
10
%
Observed curve-DI
Observed curve-FDI
(B) (C)(D) (E)
2328
7772
52
ww
w.ij
ms.
uum
.edu
.my

IJMS 14 (1), 109-143 (2006) 127
activities. In general, when the percentage of FDI increases, the Ginicoefficient will decrease, while when the percentages of domesticinvestment increase, the Gini coefficient will increase. The Ginicoefficient trend shape is relatively similar to the percentage trend ofthe domestic investment. This can be shown clearly in Figure 5.
DI and FDI have a strong correlation with each other.x Both have aboutthe same effect on the domestic and international economic situation.In other words, when FDI increases, the DI will also increase. However,because the FDI has a negative effect on the Gini coefficient, FDI has toincrease more than the DI investment in order to disperse the industries.
Regional Convergence
Since the Independence and especially after 1970, it was hoped thatthe manufacturing sector would increase economic opportunitythrough diversification of economic activities in the less developedstates as well as convergence of manufacturing activities in the moredeveloped states. However until 1999, the concentration, be it capital,labour, or output, continued to be dominated by the more developedstates. In the year 1999, total manufacturing output in the moredeveloped states was about 12 times greater than the less developedstates increase from about RM3 billion in 1970 to about RM303 billionin 1999. Besides this, there are two important indicators towardsconvergence: value added and output per worker, which were alsodominated by the more developed states and could perhaps beexplained by the differences in investment rate, labour force growthrate, and technological progress.
Table 4Value Added, Output and Capital Per Worker (RM)
Region Year Value added Output Total ManufacturingPer worker per worker Output (‘000)
More 1970 7,881 25,814 3,617,357Developed 1980 9,584 67,420 27,964,096States 1990 29,232 118,427 79,615,778
1999 65,942 279,246 303,631,335
Less 1970 4,414 17,803 316,681Developed 1980 5,747 44,254 2,812,780States 1990 20,218 73,901 7,637,396
1999 48,512 193,592 25,627,524
Sources: Malaysia, Industries Surveys, various issuesww
w.ij
ms.
uum
.edu
.my

128 IJMS 14 (1), 109-143 (2006)
Although the manufacturing sector in Peninsular Malaysia, as a whole,has experienced rapid average annual output growth rate, itsdistribution remained unchanged. It can be shown in terms of the firstconvergence or second convergence factors (or indicators). The firstconvergence will occur when the less developed states (low-incomeregion) grow faster than the more developed states (high-incomeregion) (the slope coefficient from regression of the growth ofmanufacturing output on the logarithm of its level). However, the trendof growth of manufacturing output in the more developed states andthe less developed states was parallel (both coefficients were about0.15). In other words, there is no tendency toward convergence betweenthe more developed states and the less developed states (Figure 6).
Meanwhile, the second convergence will take place when the gapbetween the more developed states and the less developed statesdecline (standard deviation of the distribution of the manufacturingoutput across regions decline).xi The first convergence was in line withthe second convergence factor. The distribution of manufacturing outputacross regions continued to increase (Figure 7). The second convergenceincreased rapidly especially after the implementation of the InvestmentIncentive Act of 1986. As was discussed in the previous part, thissituation can be explained by the cessation of the location incentivescheme under the Investment Incentive Act of 1972 and the location ofthe FTZ which focused more on export manufacturing goods and mostof it being located in the more developed states. Although under theInvestment Incentive Act of 1986 the FDI and DI increased rapidly, itwas greater in the more developed states rather than in the lessdeveloped states.
Tota
l Man
ufac
turi
ng o
utpu
t in
RM
(log
)
Figure 6The first convergence factor
22.00
20.00
18.00
16.00
14.00
12.00
10.001970 1975 1980 1985 1990 1995 2000
More Developed State
y=0.147 x -274.19R2 = 0.9793
y=0.1495 x -281.6R2 = 0.9798
Less Developed State
ww
w.ij
ms.
uum
.edu
.my

IJMS 14 (1), 109-143 (2006) 129
The lesser convergence between the more developed states and theless developed states was not only because of less FDI and DI (andless growth of manufacturing output) in the less developed states, butalso because of socio-economic and demographic indicators that weremore dominant the more developed states. This was in line with theconvergence hypothesis (with more rapid convergence in countrieswith higher schooling levels); more schooling (as measured by malesecondary attainment); higher life expectancy, (a proxy for better healthand human capital in general); terms of trade improvement (high FDIflow) posited to generate added employment and income; a lowergovernment share (investment), which is posited to release resourcesfor more productive private investment; and a lower total fertility rate,which attenuates capital-shallowing; and adverse saving-rate impactsof high youth dependency (Kelley & Schmidt, 1998: 23).
Manufacturing activities in the more developed states concentratedmore on export-oriented (mainly electronic and machinery industries)products while, manufacturing activities in the less developed stateswere more concerned with resource-based (wood and rubber) productsand food industries, which were more for the domestic market.Convergence is stronger among countries that have strong tradingrelationships (Ben-David 1996). However, trading of the manufacturingproducts within the more developed and the less developed states wasrelatively low.
Other factors that caused convergence between the more developedstates and the less developed states in Peninsular Malaysia did nothappen because of the diffusion of technological change that was
200
150
100
50
0
Figure 7The second convergence factor
Stan
dar
d d
evia
tion
RM
Mill
ions
1970 1975 1980 1985 1990 1995 2000
ww
w.ij
ms.
uum
.edu
.my

130 IJMS 14 (1), 109-143 (2006)
dominated by the more developed states. Besides the higher secondaryeducation levels, which facilitated the absorption of new technologiesin the more developed states, capital-intensive industries were alsocongested in the more developed states. Technology transfers (mainlyby FDI), large firm size and human resource development (HRD)(education and training), as well as the accumulation of knowledgethrough research and development (R&D)xii drove faster productivitygrowth in the more developed states.
Low R&D and HRD not only caused low TFPxiii but also less outputelasticity of labour and capital in the less developed states. Labourand output in the less developed states were less efficient comparedwith the more developed states. However, government interventionby increasing the capital flow in government subsidiary companies inthe less developed states showed a good response. In the period 1994-1995, the output elasticity of labour in the less developed states (LDS)was greater compared to the more developed states (MDS). In otherwords, more capital needs to flow to the less developed states in theprocess of convergence across regions (Table 5 and 6).
Table 5Growth Account for Terengganu and Kuala Lumpur.a
State Growth rate of TFPmanufacturing Contribution Contribution growth
output from capital from labour rate
Terengganu (LDS) 0.2032 0.1952 0.0081 0.0008
100.0% 95.6% 4.0% 0.4%
Kuala Lumpur (MDS) 0.0532 0.0444 0.0010 0.0077100.0% 83.5% 1.9% 14.6%
a average 1971-1999
Table 6Capital and Labour Efficiency, 1990-91 and 1994-95
Output elasticity of labour Output elasticity of capital
More Less More LessDeveloped Developed Developed Developed
States States States States
1990-91 1.606 1.082 0.972 0.6571994-95 1.702 1.287 1.019 1.119w
ww
.ijm
s.uu
m.e
du.m
y

IJMS 14 (1), 109-143 (2006) 131
Output elasticity of labour = ∂Y/∂L
L/Y
Output elasticity of capital = ∂Y/∂C C/Y
∂ = change in Y or L in that particular yearY = output in M$L = number of labour
Overall the manufacturing sector in Peninsular Malaysia showed notendency towards convergence between the more developed states andthe less developed states. The growth trend of manufacturing outputacross regions (first convergence) remained unchanged while thedistribution of the manufacturing output across regions (secondconvergence) increased continuously. The convergence process inPeninsular Malaysia was limited because of several factors such as adisadvantage in the demographic indicators, less trading relationship(between states), diffusion of technological change, fewer HRD andR&D and low productivity growth (TFP), as well as less efficiency oflabour and capital in the less developed states.
CONCLUSION AND POLICY RECOMMENDATIONS
Since 1956, under the First Malaya Plan and especially after 1970, themanufacturing sector has been seen as the main tool to spearhead therestructuring of economic activities across regions. This is becauseindustrial imbalance has an important relationship to the imbalanceof household monthly income, poverty, and unemployment. Theindustrial dispersal strategy was incorporated in five year MalaysiaPlans. In order to promote industrial activities in the less developedstates, the government introduced the concept of development areasunder the Investment Incentives Act of 1968; location incentive schemesunder the Investment Incentive Act of 1971; and East-Coast corridorunder the Investment Incentive Act of 1986. Industries located in thoseparticular areas would get benefit through tax holidays and investmentallowances that looked attractive to private investors. It was hopedthat these incentives would increase manufacturing activities in theless developed states which recorded less monthly income, highpoverty and unemployment, as well as out-migration.
However, the location incentives were less effective; projects approvedunder these incentives were small compared to other incentives æ itonly accounted for less than 3% of the approved manufacturing projectsw
ww
.ijm
s.uu
m.e
du.m
y
132 IJMS 14 (1), 109-143 (2006)
with incentives. Most industries were still located in the moredeveloped states mainly due to established manufacturing activitiesin those areas with easy access to infrastructure, service industries,and large labour and consumer markets. Although the cost of land(industrial area, especially developed by the private sector) in the moredeveloped states was relatively high, the investors were still willing tolocate their firms in the more developed states after taking intoconsideration the deduction of production cost from the locationincentives if the firm was located in the less developed states. Theadvantage from positioning the firm in the more developed states wasgreater than the advantage from the location incentive.
One disadvantage in the redistribution of manufacturing activities inPeninsular Malaysia was because of the Free Trade Zone (FTZ)industries strategy. Investors in FTZ were mainly FDI, export-orientedand capital-intensive industries. From the beginning (since 1970), FTZswere located in the more developed states mainly due to theinfrastructure network, which provided easy access to the serviceindustries. The FTZs were developed near to the well-establishedindustrial estates and infrastructure network mainly to generatebackward and forward linkages to other industries besides making itmore attractive to the FDI. Because the FTZ were more concerned withexport-oriented products, it was more convenient to locate it near aport. However, the major ports in Peninsular Malaysia were located inthe more developed states - Port Klang in the state of Selangor andPasir Gudang harbour in the state of Johor (beside the Singaporeharbour).
Even though the number of existing industrial estates in the lessdeveloped states have increased, the size (in hectares) was small andthe government developed all of them. The industries located in theless developed states were Small and Medium Industry (SMI) and werelabour incentive. They were based more on resource-based (wood andrubber) and food manufacturing industries, and focused on domesticrather than exported-oriented products, while the more developedstates concentrated more on electronic and machinery goods. Theseindustries were capital-intensive and export-oriented (mainlydominated by the FDIs in the FTZs).
Labour intensive industries showed more dispersal across regions (suchas food, beverages and tobacco, wood and products, rubber industries,and non-metallic minerals), while high technological industries (suchas textiles and clothing, paper and printing, and metal product andw
ww
.ijm
s.uu
m.e
du.m
y

IJMS 14 (1), 109-143 (2006) 133
machinery) remained concentrated in the more developed states. Thisscenario has a close linkage with the background of the labour marketin that particular state which has less educated and experiencedworkers. Although the FDI was more dispersed compared with theDI, its number in the less developed states was still low and was moreon labour-intensive manufacturing activities, mainly because the costof hired labour is relatively cheap.
Even though the total manufacturing output in Peninsular Malaysiaexperienced rapid annual growth, its distribution remained unchanged.In other words, there is no tendency toward convergence between themore developed states and the less developed states. It seems that,there is a economic and demographic disadvantage cycle which occursin the less developed states. This cycle is shown in Figure 8.
Most of the manufacturing activities in the less developed states areresource-based and labour intensive industries (1). It has a close linkagewith the background of the labour supply in that particular state (2).This is because educated and experienced workers have migrated tothe developed states (3), which creats a lower technological industrialenvironment in the less developed state (4).
The resource-based and the labour intensive industries are ownedmainly by the DI and its products are also for the domestic market(compared with FDI, their activities were more on capital intensiveand export oriented products) (5). A Lower technological industrialenvironment, small firm size and less HRD and R&D, as well as lessoutput elasticity of labour and capital and less value added derivedslowed the TFP growth. It is undeniable that all these factors havecaused a low growth rate of manufacturing output (first convergence)in the less developed states (6) and increased the imbalanceddistribution of manufacturing output (second convergence) acrossregions (7).
On the investor side, the low growth rate of manufacturing outputmeans less marginal profit as well as less saving (8). In this scenario,less developed states also face the problem of capital scarcity and theychoose to invest in manufacturing that uses less capital as well as lesstechnological components as the best solution (9). Besides this, lessmarginal profit (because of low growth rate of manufacturing output)was the important factor why there were fewer industrial activities inthe less developed states (10) while on the labour side, less marginalprofit (because of low growth rate of manufacturing output) has aw
ww
.ijm
s.uu
m.e
du.m
y

134 IJMS 14 (1), 109-143 (2006)
strong linkage with the low wage rate (11), low monthly per capitaincome, and low saving rate in the less developed states (12). Lessindustrial activities as well as monthly per capita income (because oflow wage rate) then causes high out-migration to the developed region(3). Only those with less education and experience remained in theless developed states and finally the cycle starts again.
Based on this disadvantages cycle, it is difficult for the government toincrease manufacturing activities in the less developed states especiallyin the capital-intensive industries. Most of the industries are labour-intensive, which record low productivity and output growth rate thatthen slowed the process of convergence in the less developed states.Three strategies have been implemented to overcome the aboveproblems. The strategies are increasing quality of life, includingeducation and infrastructure; giving extra incentive for the capitaloriented industries; and increasing government investment in thesubsidiary companies in the less developed states. However due tothe disadvantages cycle, would the convergence process in the lessdeveloped states remain unchanged.
Increasing education and infrastructure in the scenario in which theindustrial activities in the less developed states remain unchanged (lessnumber of industries and low wage rate) would make the out-migration continue to increase. Further incentive (under the InvestmentIncentive Act) for the capital oriented industries to be located in theless developed states were also unsuccessful mainly because of thebackground of the labour supply that was less educated andexperienced. Finally, even though the government has invested in thesubsidiary companies (capital-intensive industries) in the lessdeveloped states, those industries were more capital driven with lesscontribution from the TFP. It did not help much in the process ofconvergence because of the low growth rate of the manufacturingoutput.
Indeed, three main factors that caused the disadvantages cycle in theless developed states are high out-migration especially by educatedand experienced workers to the developed states, which creates a lowertechnological industrial environment in the less developed states (‘A’in Figure 9), industries that are more resource-based or labour intensive(‘B’), and finally a lower investment rate (‘C’) (less domestic investmentand saving, together with less FDI). By overcoming these problems(A, B and C), the other cycles in part ‘D’ will be overcome.
Further regional policies have to focus on these three main factors inorder to increase manufacturing industries in the less developed states.w
ww
.ijm
s.uu
m.e
du.m
y

IJMS 14 (1), 109-143 (2006) 135
In other words, regional policies have to create more comparativeadvantages in the industrial areas in this region, not only to theinvestors, but also to the workers. Extra incentives need to encouragecapital-oriented and export-based industries in the less developedstates. These types of industries will hopefully overcome the problemof part ‘B’ in the disadvantages cycle in Figure 9. It can be done throughproviding the extra benefit of tax holidays and investment allowances.Although the less developed states (Eastern Corridor) currently havebeen allocated with the extra benefit of tax holidays etc., it is still seen
Figure 8‘Disadvantage Cycle’ in the less developed states
[4] LowerTechnological
industries
[2] Less educatedand skilled workers
[3] High out-migration
[9] Less investmentrate (DI),
Capital scarcity
[8] Less saving rate
[12] Low per capitaincome
[11] Lowwage rate
[10] Less industrialactivities
[17] Increase the imbalanced distributionof manufacturing output (α convergence)
Less convergence
[6] Low growth rate ofmanufacturing output (β
convergence)
Low FDI
[5] Domestic market,Less trading
relationship (export)
Less HRD and R&D
Low productivity(TFP)
Less outputelasticity (labour and
capital)
Less value added
[1] Resources basedindustries (Labour
intensive)
ww
w.ij
ms.
uum
.edu
.my
136 IJMS 14 (1), 109-143 (2006)
as less attractive to the investors. In order to give more comparativeadvantages to these areas, more benefits have to be allocated. Toencourage the export industry, specific tax holidays based on theamount of product exported or labour used can be introduced.
Decreasing out-migration and encouraging in-migration, especially byeducated and experienced workers, are also important regionalinstruments. These types of policies will hopefully overcome theproblem of part ‘A’ in the disadvantages cycle in Figure 9. It can bedone through providing some percentage of income tax deduction tothe worker who works in these areas (less developed states). Currently,the government has already introduced capital and infrastructureallowance under the Investment Incentive Act of 1983. However otherallowances such as professional labour allowance; human resourcesdevelopment allowance; science, technology research allowance, etc.,can also be introduced. It is hoped that, in the long-run, such allowanceswill increase the productivity (TFP) in the less developed states.
Besides extra incentives to encourage capital-oriented and export-basedindustries (private investment), extra public investment (governmentexpenditure) has to be considered. Increasing investment will hopefullyovercome the problem of part ‘C’ in the ‘disadvantages cycle’ in Figure9. It can be done through government investment directly togovernment or semi-government companies (industries) or throughincreasing public utilities. The government is now developing themotorway (highway) to link the west coast of Peninsular Malaysiawith the capital cities on the east coast, which is a good move to developthe less developed states. In addition, developing an internationalairport and port has also to be considered (although there is now aport in Kuantan, Pahang, it is inefficiently used).
As discussed before, easy access to the service industries has a closelink to the development of manufacturing industries. To increase theindustries and the workers, service industries have to be developedeither by the government or by private investors. It can be done throughproviding some percentage of profit tax deduction to the investors.
Currently, almost all the government research institutes related to food,agriculture (rubber and palm oil), and forests are located in KualaLumpur or the state of Selangor. However these institutes are no longerimportant to the economic activities in those particular areas. It is morerelevant that these research institutes be relocated to the east coast ofPeninsular Malaysia, where agriculture, food and timber (includingfurniture) industries are relatively important. Currently also, there areno universities in the east coast region of Peninsular Malaysia. Twow
ww
.ijm
s.uu
m.e
du.m
y

IJMS 14 (1), 109-143 (2006) 137
types of universities suitable to be developed in these areas are petro-chemical and agricultural based. These universities and researchinstitutes should be located in one area (corridor) to make it easy fornetwork connection (collaborative partnership). The private sectorshould also be actively involve with integrity and full responsibility to
Figure 9Polices in developing less developed states
[4] LowerTechnological
industries
[2] Less educatedand skilled workers
[3] High out-migration
[9] Less investmentrate (DI),
Capital scarcity
[8] Less savingrate
[12] Low per capitaincome
[11] Lowwage rate
[10] Less industrialactivities
[17] Increase the imbalanced distributionof manufacturing output (α convergence)
Less convergence
[6] Low growth rate ofmanufacturing output
(β convergence)
[5] Domestic market,Less trading
relationship (export)
Low FDI
Less HRD and R&D
Low productivity(TFP)
Less outputelasticity (labour and
capital)
Less value added
[1] Resources basedindustries (Labour
intensive)
C
A
B
D
ww
w.ij
ms.
uum
.edu
.my
138 IJMS 14 (1), 109-143 (2006)
provide on-the-job training. The involvement of the private sector canreduce dependability on the government in stages.
One of the problems facing the agricultural sector when the nationaleconomy transforms towards a manufacturing base is shortage oflabour (especially in the agricultural sector). Currently, the governmentis using a short-cut instrument through encouraged migration ofunskilled foreign workers. However, because the agricultural sectorremains important in the less developed states, long-term instrumentshave to be considered.
High dependency on foreign workers causes not only a high out-flowof currency (sending income to their home country) but also tends tocreate an excess supply of totally unskilled workers, thus deprivingthem of higher wages, as compared to skilled workers. This wouldinduce a wider income gap in the economy than before. Twoinstruments can be suggested.
1. For the investors, land-per-worker ratio has to decrease, byincreasing capital and technology. To encourage more capitaland technology used, the government can introduce incentivessimilar to the incentive for the manufacturing sector (such asInvestment Tax Allowance, Incentives For Reinvestment andInfrastructure Allowance) that can also be applied to agriculturecompanies. These incentives should also be related to the numberof local workers used (to reduce the use of foreign workers).
2. For the unskilled and semi-skilled workers (local andimmigrant), the minimum wage should be higher than workersin other sectors and monthly income should be free from incometax for the local workers. It means that ‘total useable income’ or‘total net income’ (income after income tax deduction) will behigher for the local worker in the agricultural sector comparedwith the local worker in the other sectors (because of differencein minimum wage). Besides this, total useable income will behigher for the local worker compared to the foreign worker inthe agriculture sector (because income tax exemption will beonly for local workers). This instrument, will hopefully overcomethe problem of competition between local and foreign unskilledor semi-skilled workers.
In conclusion, industrial dispersion has to be seen as the maininstrument for the achievement of development goals. Furtherincentives to develop the less developed states not only have to bew
ww
.ijm
s.uu
m.e
du.m
y

IJMS 14 (1), 109-143 (2006) 139
given to the manufacturing companies (to increase job opportunities)but also have to be given to the workers (to make job opportunitiesmore attractive), and to the services companies (as a complement tothe manufacturing companies and population growth).
If these suggestions are applied, it not only develops the less developedstates (overcomes the problem of rural dwellers – high dependencyratio, gender inequality, abandoned land, relatively high poverty, andshortage of labour in the agricultural sector) but will also overcomethe problem of urban poverty. This is because the increase in the sizeof the urban labour force has so far been mainly due to rural migration.The poverty problem in the cities is the extension of the poverty theyendured in the rural areas. If there are enough job opportunities in theless developed states, it will reduce out-migration and at the sametime reduce the problem of urban poverty.
END NOTES
1 The incentive provided for industries to locate in a developmentarea and was linked to some of the incentives provided underthe Investment Incentives Act, 1968. For pioneer industrieslocating in a development area, an additional year of tax reliefwas granted irrespective of the size of capital investment. Also,should an electronics firm which enjoyed the special incentivefor the electronics industry be located in a development area, itbecame eligible for an additional year of tax relief. For a companythat had been granted the investment tax credit (ITC), anadditional credit of 5% of the approved capital expenditurewould be granted if the company were to be located in adevelopment area (Lee, 1978: 456-458).
2 In addition to the development area in the Investment IncentiveAct, 1968, any industry located in the gazetted location incentivescheme became eligible for five years of tax relief compared withthree year tax relief if the industry was located in thedevelopment area. Areas covered under the Location IncentiveAct were overlapped with the location under development areain the Investment Incentive Act, 1968.
3 It was hoped that these additional incentives would decreasethe cost of production. States in the east-coast of PeninsularMalaysia recorded less comparative advantage in terms ofconcentration of population (consumer), labour force (high out-ww
w.ij
ms.
uum
.edu
.my
140 IJMS 14 (1), 109-143 (2006)
migration especially those who are experienced and educated),and social infrastructure.
4 In 1996 (July), from 4,403.47 total hectares of industrial landdeveloped under Johor State Economic DevelopmentCorporation (SEDC), only 16.59 hectares (0.38%) were locatedat of Mersing Industrial Estates (Mersing I). While, in 1998(January), from 4,443.78 total hectares industrial land developedunder SEDC, only 1,500 hectares (0.33%) were located at MersingIndustrial Estates (Mersing II).
5 In 1995, the Malaysian Industrial Development Authority(MIDA) used the term Free Zone (FZ), in current publications,MIDA used the term Free Industrial Zones (FIZs)’. FIZs enablethese export-oriented companies to enjoy minimal customsformalities and duty free import of raw materials, componentparts, machinery, and equipment required directly in themanufacturing process, as well as minimal formalities inexporting their finished products. Companies can be locatedwithin FIZs when: (a) their entire production or not less than80% of their products are meant for export; and (b) they mainlyimport their raw materials/components. Nevertheless, thegovernment had encouraged FIZ companies to use local rawmaterials/components (MIDA, 2002: 92).
6 Before the 1970s, British investment contributed significantly toMalaysia’s FDIs. Initially British investment was channelled intoagricultural (rubber estates) and mining (tin) sectors, and later(late 1950s) diversified into light industries (end consumer’sproducts). In the 1950s as well, more than 70% of FDI came fromBritain and 90% of its concentration in plantation and miningsectors. However, the percentages decreased in 1970 to about45% and to 16% in 1983 (Mohammad & Chee, 1987:101,104). Inthe early 1980s, under the ‘Look East’ campaign, the governmentwelcomed FDI from Japan and South Korea, to emulate and learnfrom those countries’ economic development experience(Brewer, David, Lim & Corredera, 1986:96). In terms of exportsand imports, in 1957 14.6% of export was to United Kingdomand 17.7% of import was from UK. However in 1985, theMalaysian export to UK decreased to only 2.6% and import fromUK decreased to 4.0%. In 1957, 10.1% of export was to Japanand 6.1% of import was from Japan. However in, 1985, theMalaysian export to Japan increased to 24.3% and import fromJapan increased to 23.0% (Khong, 1987:1096). Malaysia wasrecorded as being in the top 50 countries with the most activeww
w.ij
ms.
uum
.edu
.my

IJMS 14 (1), 109-143 (2006) 141
FDI inflow in the world and among the top 10 developingcountries in this respect (UNCTAD, 2002).
7 Japan is the single most dominant economic power in Malaysia(Khong, 1987: 1095).
8 This Gini coefficient was calculated based on number of industryin that particular state vs. value of output in Malaysian currency(RM).
9 According to Mohammad and Chee (1987:103), most of theJapanese investors were involved in textile and textile products,and the electrical and electronics industry which were and thetwo most important export-oriented manufacturing activitiesand labour-intensive. According to the ‘Kojima hypothesis’,Japanese investment tends to be ‘trade cresting’ as it facilitatesrelocation of the labour intensive industries in which the homecountry (Japan) is losing its comparative advantage. See alsoK.Kojima. (1977). Japan and A New World Economic Order. Tokyo:Charles E. Tuttle & Co.
10 Correlation between Ln DI and Ln FDI was 0.881 and significantat the 0.001 level (2-tailed).
11 For more about convergences, see Nijkamp and Poot (1998: 26).
12 In 1989, the country’s R&D expenditure was 0.8% of GDP. Fromthis total, 20% was contributed by the private sector, which wasmade up of mostly foreign entities (FDI) (Malaysia, 1991:211).
13 In order to determine the contribution of capital, labour andtechnology, the researcher used the Neo-classical productionfunction that has been developed further for spatial perspectivesby Nijkamp and Poot (1998). There are only two types of inputin the production process, labour L(t), and physical capital K(t)that will then determine the flow of output generated at time t,Y(t). The production function can be derived as follows: Y(t) =A(t) . F[K(t), L(t)] or Y = AKa Lb . . . . (1). The equation was in thecontinuous-time form and had been modified for empiricalpurposes to apply to discrete time by using logarithmicdifferences (Barro & Sala-i-Martin 1999:347). log[(A(t+1)/At)/At]= log[(Y(t+1)/Yt)/Yt] – {a(t). log[(K(t+1)/Kt)/Kt] + b(t). log[(L(t+1)/Lt)/Lt]}…. (2).ww
w.ij
ms.
uum
.edu
.my

142 IJMS 14 (1), 109-143 (2006)
REFERENCES
Barro, J. R. & Sala-i-Martin (1995). Economic Growth. New York:McGraw-Hill.
Ben-David, D. (1996). Trade and Convergence Among Countries.Journal of International Economics, 40,279–298.
Brewer, T. L., David, K., Lim L., Y. C. & Corredera, R S. (1986). Investmentin Developing Countries. Lexington: Lexington Books.
Chunlai, C. (1997). The Composition and Location of Foreign DirectInvestment in China’s Manufacturing. Working Paper No.97/13.December. Chinese Economic Research Center. The Universityof Adelaide.
Kelley, A. C. & Schmidt, M. R. (1998). Economic and DemographicChange: A Synthesis of Model, Finding, and Perspective. WorkingPaper Symposium on Population Change and Economic Development.Bellagio Center, Italy, 2-6 November.
Khong K. H. (1987). Malaysia-Japan Relations in the 1980s, Asian Survey,27 (10), 1095-1108.
Kojima, K. (1977). Japan and A New World Economic Order. Tokyo: CharlesE. Turtle & Co.
Lee, H. L. (1978). Public Policies and Economic Diversification in WestMalaysia. Kuala Lumpur: University of Malaya Publication.
Malaysian, Economic Planning Unit (1990). A Study on the Developmentof Industrial Estate in Malaysia. Final Report: Perunding Bersatu.
Malaysia. (1976). Third Malaysia Plan 1976-1980. Kuala Lumpur:Government Press.
Malaysia. (1981). Fourth Malaysia Plan 1980-1985. Kuala Lumpur:Government Press.
Malaysia. (1991). Sixth Malaysia Plan 1991-1995. Kuala Lumpur:Government Press.
Malaysia. (1999). Economic Report 1998/1999. Ministry of Finance. KualaLumpur.
Malaysia. (2001a). Third Outline Perspective Plan 2001-2010. KualaLumpur: National Press.
Malaysia. (2001b). Eighth Malaysia Plan 2001-2005. Kuala Lumpur:National Press.
Malaysia. (2001c). Economic Report 2000/2001. Ministry of Finance. KualaLumpur.
MIDA. (2002). Information Guide for Investor. Malaysian IndustrialDevelopment Authority, Kuala Lumpur.
Mohamad, A. & Chee, P. L. (1987). Foreign Investments in Malaysia, inCable C., and Persaud B., Developing with Foreign Investment.London: Croom Helm. 101-121.
NEP (1971)ww
w.ij
ms.
uum
.edu
.my

IJMS 14 (1), 109-143 (2006) 143
Nijkamp, P. & Poot, J. (1998). Spatial Perspectives on New Theories ofEconomic Growth. The Annals of Regional Sciences, 32: 7-37.
Rajah, R. and Ishak, S. (2001). Market, Government and Malaysia’sNew Economic Policy. Cambridge Journal of Economics, 25, 57-78.
United Nations Conference on Trade and Development (UNCTAD).(2002). The UNCTAD Handbook of Statistics 2002, UNCTAD:Geneva.
Young, P. C. (1988). Latest Malaysian Investment Incentives. Petaling Jaya:Longman.
ww
w.ij
ms.
uum
.edu
.my
Related Documents