http://disabilitycentre.lshtm.ac.uk http://disabilitycentre.lshtm.ac.uk Measuring Disability in Surveys and Programmes A Summary Funded by CBM: www.cbm.org

Disability Measurement Summary
Dec 13, 2015
Disability Measurement Summary
Welcome message from author
This document is posted to help you gain knowledge. Please leave a comment to let me know what you think about it! Share it to your friends and learn new things together.
Transcript

http://disabilitycentre.lshtm.ac.uk
http://disabilitycentre.lshtm.ac.uk
Measuring Disability in Surveys and Programmes
A Summary
Funded by CBM: www.cbm.org
http://disabilitycentre.lshtm.ac.uk
http://disabilitycentre.lshtm.ac.uk
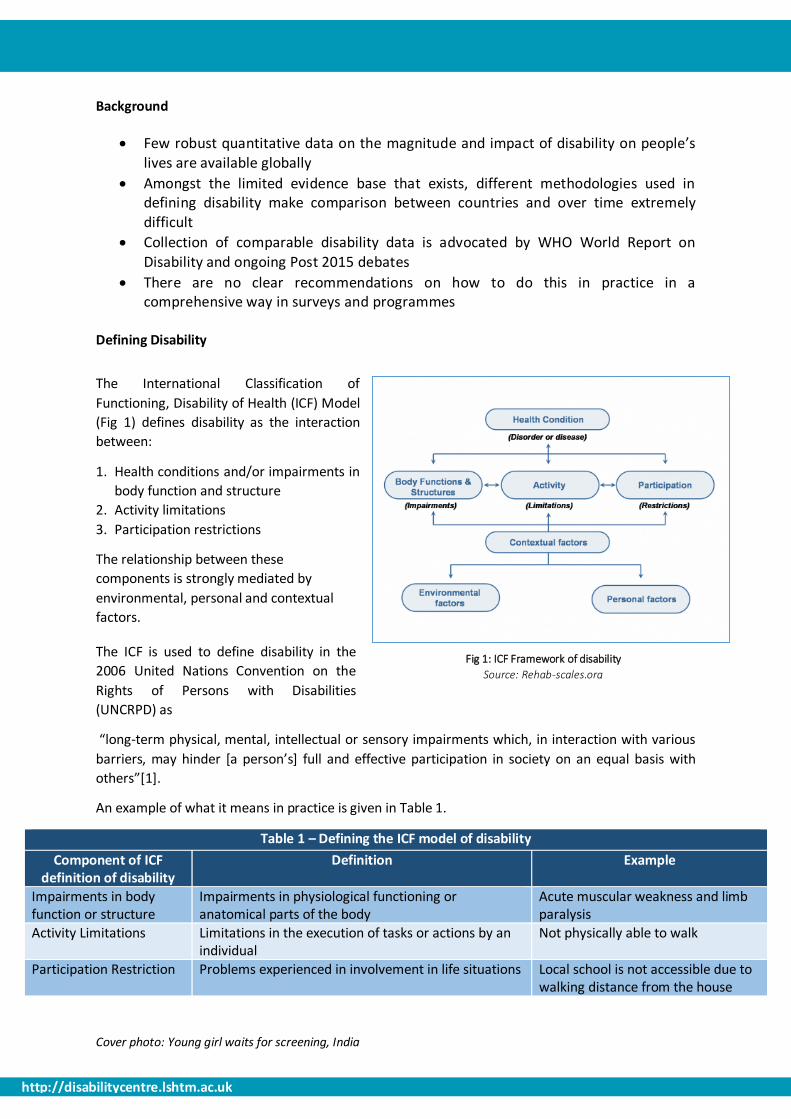
Fig 1: ICF Framework of disability
Source: Rehab-scales.org
Background
Few robust quantitative data on the magnitude and impact of disability on people’s lives are available globally
Amongst the limited evidence base that exists, different methodologies used in defining disability make comparison between countries and over time extremely difficult
Collection of comparable disability data is advocated by WHO World Report on Disability and ongoing Post 2015 debates
There are no clear recommendations on how to do this in practice in a comprehensive way in surveys and programmes
Defining Disability
The International Classification of
Functioning, Disability of Health (ICF) Model
(Fig 1) defines disability as the interaction
between:
1. Health conditions and/or impairments in
body function and structure
2. Activity limitations
3. Participation restrictions
The relationship between these
components is strongly mediated by
environmental, personal and contextual
factors.
The ICF is used to define disability in the
2006 United Nations Convention on the
Rights of Persons with Disabilities
(UNCRPD) as
“long-term physical, mental, intellectual or sensory impairments which, in interaction with various
barriers, may hinder [a person’s] full and effective participation in society on an equal basis with
others”[1].
An example of what it means in practice is given in Table 1.
Table 1 – Defining the ICF model of disability
Component of ICF definition of disability
Definition Example
Impairments in body function or structure
Impairments in physiological functioning or anatomical parts of the body
Acute muscular weakness and limb paralysis
Activity Limitations Limitations in the execution of tasks or actions by an individual
Not physically able to walk
Participation Restriction Problems experienced in involvement in life situations Local school is not accessible due to walking distance from the house
Cover photo: Young girl waits for screening, India

http://disabilitycentre.lshtm.ac.uk
http://disabilitycentre.lshtm.ac.uk
Study Aim:
Develop a comprehensive population-based survey methodology that is compatible with the ICF, and to explore the inter-relationship between the components of this framework.
Study Objectives:
1. Identify and review existing tools for self-reported disability measurement in population based surveys
2. Develop a population-based survey methodology to assess prevalence of impairment and self-reported disability and to undertake this survey in two countries (Cameroon and India).
3. Explore the relationship between objectively-measured impairment and self-reported disability within the context of the ICF
4. Assess the impact of disability on participation
Measuring Disability:
A number of different methods for measuring disability exist (Table 2), each focusing on a specific
component of disability within the overall framework outlined on page 1.
No previous studies have compared how the different approaches to measuring disability outlined
above inter-relate.
Table 2: Methods for measuring disability
Type Example Pros Cons
Direct Questioning “Do you have a
disability?”
- Rapid
- Limited Space
- Underreport (stigma + lack of self-
identification)
Self-reported
activity limitation
“Do you have
difficulty in seeing?”
- Simple to administer
- Info on experience/impact
- Does not assist planning for
services/interventions/needs assessment
Self-reported
participation
restriction
“Do you have
difficulty taking care
of personal objects?”
- Info on what the person is
able to do in their current
environment
- Does not provide any information on
underlying causes of restrictions
Clinical screening
for impairments in
body function and
structure
Visual Acuity
measurement
- Info on impairment type,
severity and causality for
intervention
- Resource intensive
- Impairment only one component of
disability
http://disabilitycentre.lshtm.ac.uk
http://disabilitycentre.lshtm.ac.uk
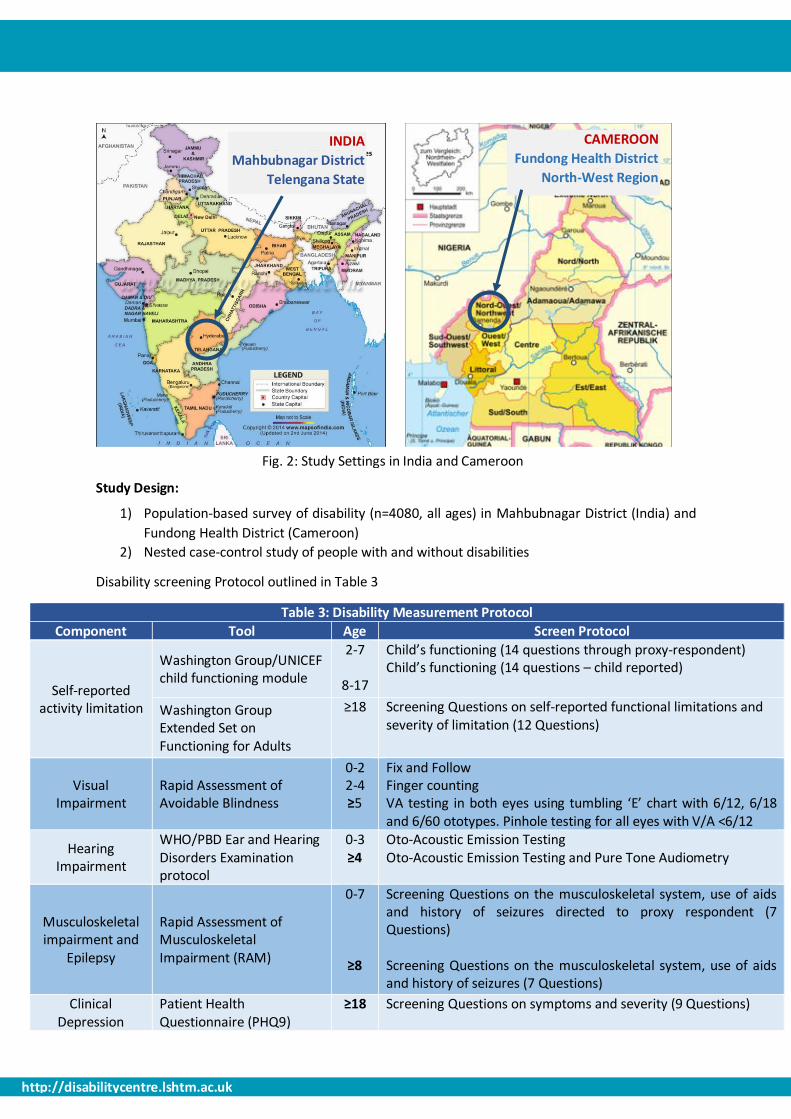
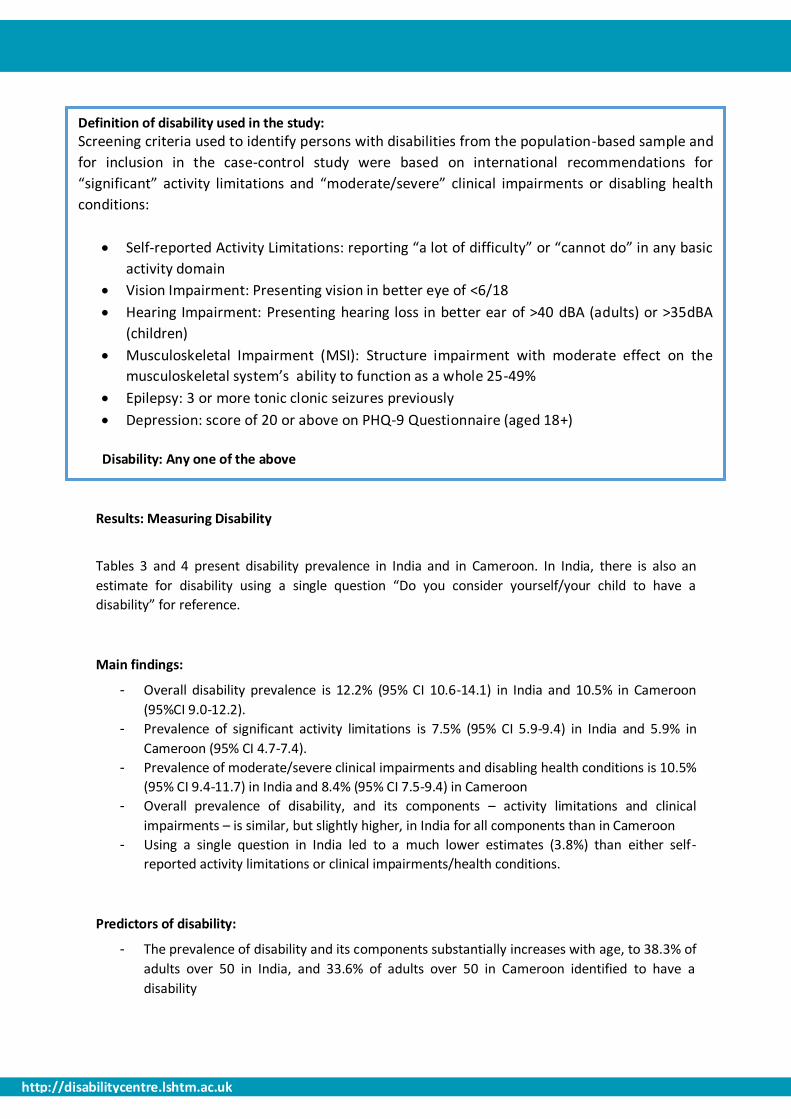
Study Design:
1) Population-based survey of disability (n=4080, all ages) in Mahbubnagar District (India) and
Fundong Health District (Cameroon)
2) Nested case-control study of people with and without disabilities
Disability screening Protocol outlined in Table 3
Table 3: Disability Measurement Protocol
Component Tool Age Screen Protocol
Self-reported activity limitation
Washington Group/UNICEF child functioning module
2-7
8-17
Child’s functioning (14 questions through proxy-respondent) Child’s functioning (14 questions – child reported)
Washington Group Extended Set on Functioning for Adults
≥18 Screening Questions on self-reported functional limitations and severity of limitation (12 Questions)
Visual Impairment
Rapid Assessment of Avoidable Blindness
0-2 2-4 ≥5
Fix and Follow Finger counting VA testing in both eyes using tumbling ‘E’ chart with 6/12, 6/18 and 6/60 ototypes. Pinhole testing for all eyes with V/A <6/12
Hearing Impairment
WHO/PBD Ear and Hearing Disorders Examination protocol
0-3 ≥4
Oto-Acoustic Emission Testing Oto-Acoustic Emission Testing and Pure Tone Audiometry
Musculoskeletal impairment and
Epilepsy
Rapid Assessment of Musculoskeletal Impairment (RAM)
0-7
≥8
Screening Questions on the musculoskeletal system, use of aids and history of seizures directed to proxy respondent (7 Questions) Screening Questions on the musculoskeletal system, use of aids and history of seizures (7 Questions)
Clinical Depression
Patient Health Questionnaire (PHQ9)
≥18 Screening Questions on symptoms and severity (9 Questions)
Fig. 2: Study Settings in India and Cameroon
INDIA
Mahbubnagar District
Telengana State
CAMEROON
Fundong Health District
North-West Region
http://disabilitycentre.lshtm.ac.uk
http://disabilitycentre.lshtm.ac.uk
Definition of disability used in the study:
Screening criteria used to identify persons with disabilities from the population-based sample and
for inclusion in the case-control study were based on international recommendations for
“significant” activity limitations and “moderate/severe” clinical impairments or disabling health
conditions:
Self-reported Activity Limitations: reporting “a lot of difficulty” or “cannot do” in any basic
activity domain
Vision Impairment: Presenting vision in better eye of <6/18
Hearing Impairment: Presenting hearing loss in better ear of >40 dBA (adults) or >35dBA
(children)
Musculoskeletal Impairment (MSI): Structure impairment with moderate effect on the
musculoskeletal system’s ability to function as a whole 25-49%
Epilepsy: 3 or more tonic clonic seizures previously
Depression: score of 20 or above on PHQ-9 Questionnaire (aged 18+)
Disability: Any one of the above
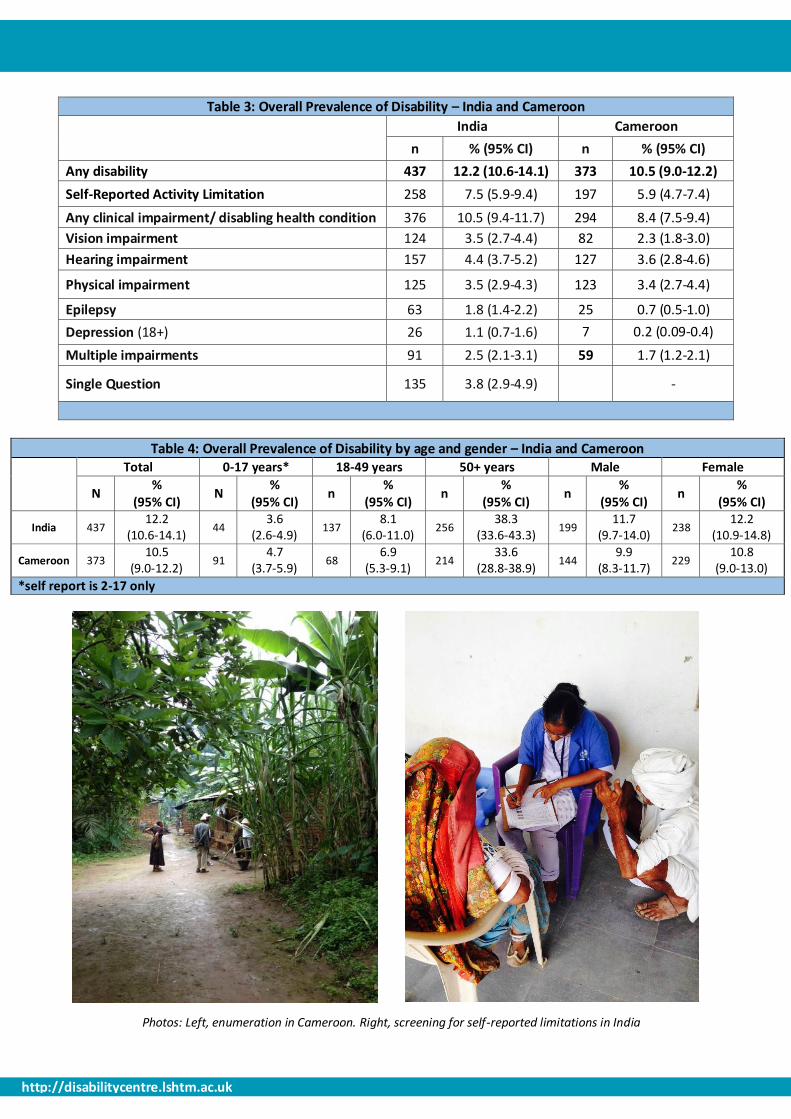
Results: Measuring Disability
Tables 3 and 4 present disability prevalence in India and in Cameroon. In India, there is also an
estimate for disability using a single question “Do you consider yourself/your child to have a
disability” for reference.
Main findings:
- Overall disability prevalence is 12.2% (95% CI 10.6-14.1) in India and 10.5% in Cameroon
(95%CI 9.0-12.2).
- Prevalence of significant activity limitations is 7.5% (95% CI 5.9-9.4) in India and 5.9% in
Cameroon (95% CI 4.7-7.4).
- Prevalence of moderate/severe clinical impairments and disabling health conditions is 10.5%
(95% CI 9.4-11.7) in India and 8.4% (95% CI 7.5-9.4) in Cameroon
- Overall prevalence of disability, and its components – activity limitations and clinical
impairments – is similar, but slightly higher, in India for all components than in Cameroon
- Using a single question in India led to a much lower estimates (3.8%) than either self-
reported activity limitations or clinical impairments/health conditions.
Predictors of disability:
- The prevalence of disability and its components substantially increases with age, to 38.3% of
adults over 50 in India, and 33.6% of adults over 50 in Cameroon identified to have a
disability
http://disabilitycentre.lshtm.ac.uk
http://disabilitycentre.lshtm.ac.uk
Figures 3 and 4 present the relationship between activity limitations and clinical impairments
amongst those identified to have a disability in the study.
- 45% of people identified to have disabilities in India, and 32% of those in Cameroon, both
reported a significant activity limitation and screened positive for a moderate/severe clinical
impairment or disabling health condition
Using self-report only identified 49% people with disabilities in India, and 54% in Cameroon
Using clinical measures only identified 86% of people with disabilities in India, and 78% in
Cameroon
People identified with disabilities on self-report only:
- 14% of people identified to have disabilities in India, and 22% of those in Cameroon,
screened positive for self-reported significant activity limitation but not a moderate/severe
clinical impairment or disabling health condition.
- In India, amongst the group who screened positive via self-report only (n=61), 74% screened
positive for a mild clinical impairment and 26% reported activity limitations that were not
measured clinically (such as learning, understanding, remembering and self-care).
- In Cameroon, amongst those who screened positive via self-report only (n=79), 61%
screened positive for a mild clinical impairment, 27% reported difficulties in domains not
directly screened clinically and 13% reported difficulties in domains that were clinically
evaluated not to be impaired (hearing and walking).
People identified with disabilities on clinical screen only:
- The remaining 41% of people identified to have disabilities in India, and 46% in Cameroon,
screened positive for a moderate/severe clinical impairment or disabling health condition,
but did not self-report as having a significant functional limitation.
- In both countries, participants with impairments were more likely to report activity
limitations if:
- Impairment was severe or profound
- Impairment was MSI rather than hearing or vision.
- Qualitative work related to this study shows that domains of function most related to
livelihood and participation are considered more important by communities.
Tables 5 and 6 present estimates of participation restriction amongst people with and without
disabilities. For each domain in each age group, the mean score is calculated against the maximum
total score possible for that domain (max. score= answering “unable to do” to each question in that
domain). Key findings were that:
- People with disabilities in India and Cameroon experienced 1.4-1.8 times more participation
restrictions than people without disabilities across all domains of participation.
- People who screened positive for clinical impairments reported higher restrictions in
participation if they also self-reported activity limitations.
http://disabilitycentre.lshtm.ac.uk
http://disabilitycentre.lshtm.ac.uk
Table 3: Overall Prevalence of Disability – India and Cameroon
India Cameroon
n % (95% CI) n % (95% CI)
Any disability 437 12.2 (10.6-14.1) 373 10.5 (9.0-12.2)
Self-Reported Activity Limitation 258 7.5 (5.9-9.4) 197 5.9 (4.7-7.4)
Any clinical impairment/ disabling health condition 376 10.5 (9.4-11.7) 294 8.4 (7.5-9.4)
Vision impairment 124 3.5 (2.7-4.4) 82 2.3 (1.8-3.0)
Hearing impairment 157 4.4 (3.7-5.2) 127 3.6 (2.8-4.6)
Physical impairment 125 3.5 (2.9-4.3) 123 3.4 (2.7-4.4)
Epilepsy 63 1.8 (1.4-2.2) 25 0.7 (0.5-1.0)
Depression (18+) 26 1.1 (0.7-1.6) 7 0.2 (0.09-0.4)
Multiple impairments 91 2.5 (2.1-3.1) 59 1.7 (1.2-2.1)
Single Question 135 3.8 (2.9-4.9) -
Table 4: Overall Prevalence of Disability by age and gender – India and Cameroon
Total 0-17 years* 18-49 years 50+ years Male Female
N %
(95% CI) N
% (95% CI)
n %
(95% CI) n
% (95% CI)
n %
(95% CI) n
% (95% CI)
India 437 12.2
(10.6-14.1) 44
3.6 (2.6-4.9)
137 8.1
(6.0-11.0) 256
38.3 (33.6-43.3)
199 11.7
(9.7-14.0) 238
12.2 (10.9-14.8)
Cameroon 373 10.5
(9.0-12.2) 91
4.7 (3.7-5.9)
68 6.9
(5.3-9.1) 214
33.6 (28.8-38.9)
144 9.9
(8.3-11.7) 229
10.8 (9.0-13.0)
*self report is 2-17 only
Photos: Left, enumeration in Cameroon. Right, screening for self-reported limitations in India

http://disabilitycentre.lshtm.ac.uk
http://disabilitycentre.lshtm.ac.uk
Table 5: Participation Restrictions in India and Cameroon
India Cameroon
Max score
Controls (mean)
All Cases (mean)
Clinical with no self report
Clinical plus self report
P* Controls (mean)
All Cases (mean)
Clinical with no self report
Clinical plus self report
P*
Age 5-8 40 12.8 22.0 18.7 22.4 0.59 13 16.5 11 17.7 0.1
Age 9-16 60 17.1 36.44 22.6 39.1 <0.01 17 26.1 19.3 30.7 <0.001
Age 17-33 84 24.5 39.8 28.9 47.2 <0.001 25.3 34.7 29.7 40.8 <0.01
Age 34-49 84 30.8 11.7 32.4 38 0.07 25.4 36 33.5 42.7 0.14
Age 50-65 84 28.3 39.8 35.4 43.9 <0.001 26.4 31.9 32.4 35.8 0.23
Age 66+ 84 34.6 49.7 39.3 53.5 <0.001 28.3 33.8 31 38 <0.001
* Independent-samples t-test conducted to compare means between clinical cases who did/ did not report significant activity limitations. A separate independent-samples test was
conducted to compare means between all cases and all controls, and the difference between means was statistically significant across all age groups in both countries (not shown).
Screen positive via self-reported functional limitations
Screen positive for clinical impairments/ health conditions
22% 32%
46%
n=366
Fig 3. Relationship between disability measures: Cameroon
Screen positive via self-reported functional limitations
Screen positive for clinical impairments/ health conditions
14% 45%
41%
Fig 4: Relationship between disability measures: India
n=437

http://disabilitycentre.lshtm.ac.uk
http://disabilitycentre.lshtm.ac.uk
Referral based on unmet need and important
info. for planning appropriate services Identify and overcome barriers at individual
level and learn for future programmes/policies
Participation restriction measurement Clinical screens for all participants reporting
“some difficulty” in any domain
Population or program level survey of reported activity limitations to understand proportion of disability in
population using Washington Group Questions
KEY FINDINGS:
1. Prevalence estimates for disability (defined as any individual with a significant activity
limitation, moderate/severe clinical impairment or disabling health condition) in Cameroon
and India were similar and increased substantially in both countries with age
2. Using a self-reported activity limitation tool alongside clinical tools to measure specific
impairments and health conditions showed a high proportion of participants screening
positive to moderate/severe clinical impairments and health conditions but not reporting
significant activity limitations
Some moderate impairments and some impairments that have lower impact on
participation in a particular context (eg. hearing impairment in a rural, farming
community) may be missed by self-report tools
Less participation restrictions are reported amongst those who have not reported a
significant activity limitation than those who have, but these restrictions are still higher
than people without any clinical impairments
3. Using a single question on disability leads to significant under-reporting and is not
recommended
PRACTICAL RECOMMENDATIONS ON DISABILITY DATA COLLECTION:
1. Self-Reported tools that measure activity limitation are the most appropriate and resource efficient way to measure disability in a population or within a program or project.
2. Moderate clinical impairments may not be captured using this method, so we recommend that all participants who report even “some” limitation in a particular domain should also undergo a simple clinical screen (this would identify 94% of people with disabilities in Cameroon and 95% in India)
3. Measures of participation should also be included to fully capture disability in programmes and surveys.
Fig. 5 depicts this in practice and the justification for using particular tools in either a population-survey or programme setting
Fig 5: Recommended Disability Measurement Methodology

http://disabilitycentre.lshtm.ac.uk
http://disabilitycentre.lshtm.ac.uk
References:
1. The United Nations. Convention of the Rights of Persons with Disabilities and Optional Protocol. 2008 [cited 2012 01.05.12].
2. World Health Organization, Towards a Common Language for Functioning, Disability and Health ICF. 2002.
Project Investigators: Islay Mactaggart1, Sarah Polack1, Hannah Kuper1, GVS Murthy2, Joseph Oye3, Jayanthi Sagar2, Violet Tamo4
1International Centre for Evidence in Disability, London School of Hygiene and Tropical Medicine 2South Asia Centre for Disability Inclusive Development and Research, Indian Institute of Public Health, Public Health Foundation of India 3Sightsavers Country Office, Cameroon 4National Centre for Good Practices in Research, Cameroon
Corresponding Author: [email protected]
Citing this document: International Centre for Evidence in Disability (ICED), Measuring Disability in Surveys and Programs: A Summary, London School of Hygiene and Tropical Medicine (LSHTM) 2014 [available from http://disabilitycentre.lshtm.ac.uk]
For full and summary country reports for India and Cameroon respectively, and for further resources related
to this study, visit http://disabilitycentre.lshtm.ac.uk
Accessible versions of all tables/figures are available upon request
Opinions expressed are of the authors. Neither the London School of Hygiene and Tropical Medicine, nor
CBM take responsibility of the views expressed herein.
Report design based on original design and artwork by RW Design Ltd. Email: [email protected]
Photo: Mothers wait with their children at village screening sessions
Related Documents


