Direct photons and jet correlations in heavy ion collisions Andrew Adare University of Colorado For the PHENIX Collaboration WWND, February 2007

Direct photons and jet correlations in heavy ion collisions Andrew Adare University of Colorado For the PHENIX Collaboration WWND, February 2007.
Dec 22, 2015
Welcome message from author
This document is posted to help you gain knowledge. Please leave a comment to let me know what you think about it! Share it to your friends and learn new things together.
Transcript
Direct photons and jet correlations in heavy ion
collisions
Andrew AdareUniversity of Colorado
For the PHENIX CollaborationWWND, February 2007

Andrew Adare - WWND 2007
2Outline
• Motivation: how direct photon-jet correlations could improve knowledge of energy loss over RAA
• Expectations• Analysis techniques
– correlations and per-trigger yields– calculating decay-h from 0-h– subtraction method
• cross-checks and refinements• results

Andrew Adare - WWND 2007
3The QGP is opaque to hadrons
RHIC measurements indicate that the quark-gluon plasma
Is strongly interacting and flows like an ideal fluid, not a gas of hadrons.
Suppresses jet yields and modifies their shapes
Suppression/energy loss depends on the path length traversed. Particles produced near the surface have lower energy loss probabilities.

Andrew Adare - WWND 2007
4Measuring suppressed yields
0, from quark and gluon jets
High-pT hadrons are suppressed by a factor of 5 relative to scaled-up p-p collisions.
But photons are unaffected!
Nuclear modification factor RAA:
Yield (nuclear collisions)
Yield (binary scaled pp collisions)
=
Andrew Adare - WWND 2007
5Shortcomings of RAA
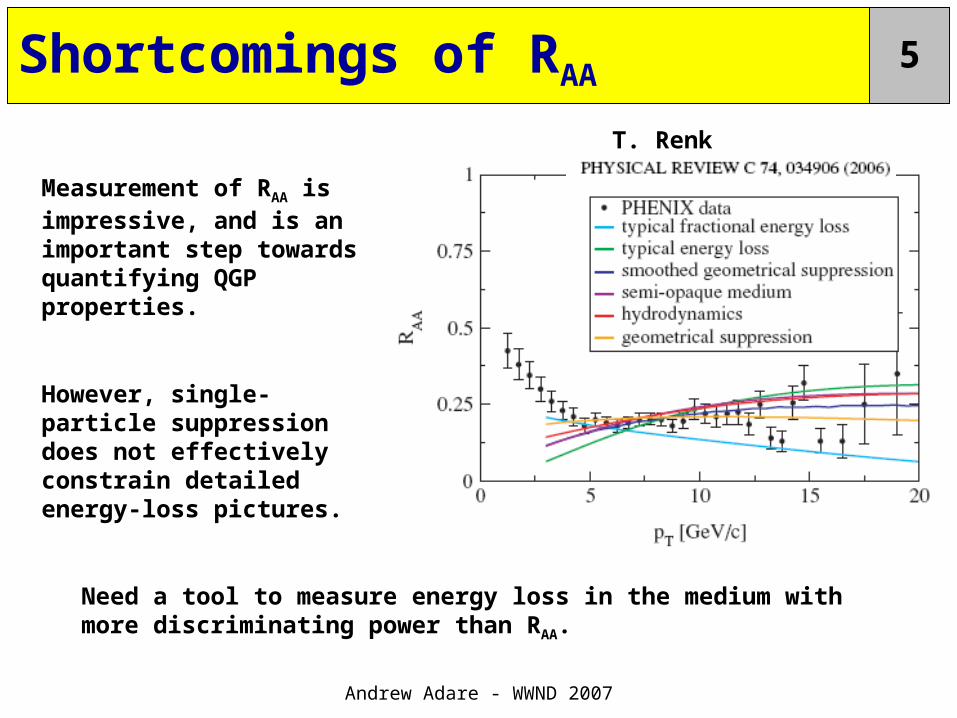
Measurement of RAA is impressive, and is an important step towards quantifying QGP properties.
However, single-particle suppression does not effectively constrain detailed energy-loss pictures.
T. Renk
Need a tool to measure energy loss in the medium with more discriminating power than RAA.

Andrew Adare - WWND 2007
6Promising solution: direct -jets
q g
Calibrated probe of the QGP – at LO, ET, = Pre-quenched ET,jet
No Surface Bias – clearer picture of jet fragmentation modification Hard process – pQCD calcs agree well with data
has no E-loss in medium!
Size of medium
But D(z) is effectively softened in opposing jet

Andrew Adare - WWND 2007
7
Assume two photon sources, ( = # photons in data sample):
directdecayincl
Measuring direct -jet yields (I)
pT=5-7 GeV/c
pT=9-12 GeV/c
decaydirect
decay direct
Direct photons:
-- LO pQCD (compton, annihilation,…)
-- NLO pQCD (bremsstrahlung, fragmentation)
-- Jet-thermal photons
(See Takao’s talk…)
Hadronic decay photons:
2
2
each’decay
0
Cu+Cu:
Andrew Adare - WWND 2007
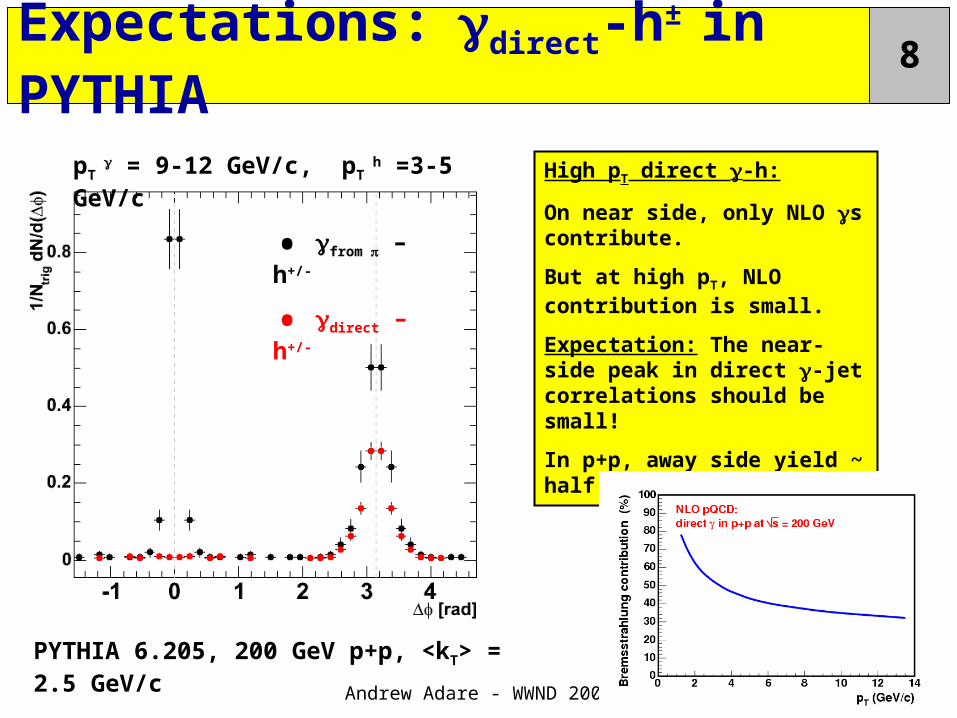
8Expectations:direct-h± in PYTHIA
High pT direct -h:
On near side, only NLO s contribute.
But at high pT, NLO contribution is small.
Expectation: The near-side peak in direct -jet correlations should be small!
In p+p, away side yield ~ half that of -h.
pT = 9-12 GeV/c, pT
h =3-5 GeV/c
• from – h+/-
• direct – h+/-
PYTHIA 6.205, 200 GeV p+p, <kT> = 2.5 GeV/c

Andrew Adare - WWND 2007
9
Assume two photon sources, ( = # photons in data sample):
Let Y = per-trigger conditional jet pair yield (1/Ntrig)dNpairs/d():
Write in terms of R
decaydirectincl
decayincl
decaydir
incl
dirincl YYY
decay
dir
decay
incl
simdecay
measincl
R
1)/(
)/(0
0
Measuring direct -jet yields (II)
)1(
1)
11(
R
YYRYY
RY
RY decayincl
dirdecaydirincl
Requires 3 components

Andrew Adare - WWND 2007
10Component 1 of 3: incl-h+/-
Angular correlation technique:
ID a high-pT “trigger” particle in an event
Measure distribution of angles between trigger and h+/- associated particles in same event
Measure for mixed events. Ratio is C():
)]2cos(21[)(
/
/
22
at
mix
real
vvJ
ddN
ddNC
correlation functions:
Andrew Adare - WWND 2007
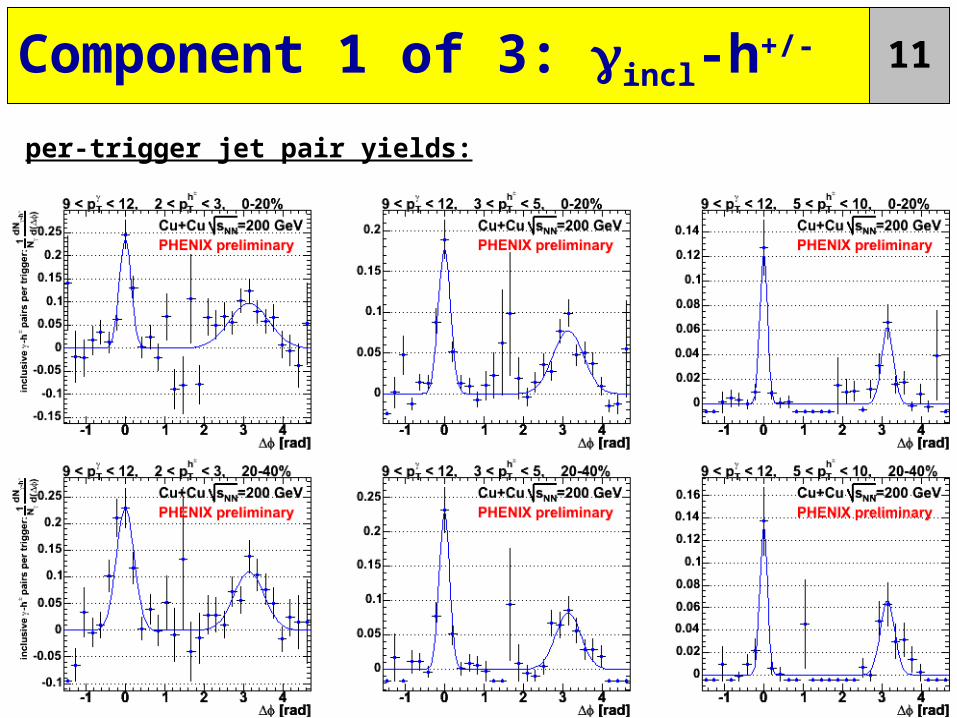
11Component 1 of 3: incl-h+/-
per-trigger jet pair yields:
Andrew Adare - WWND 2007
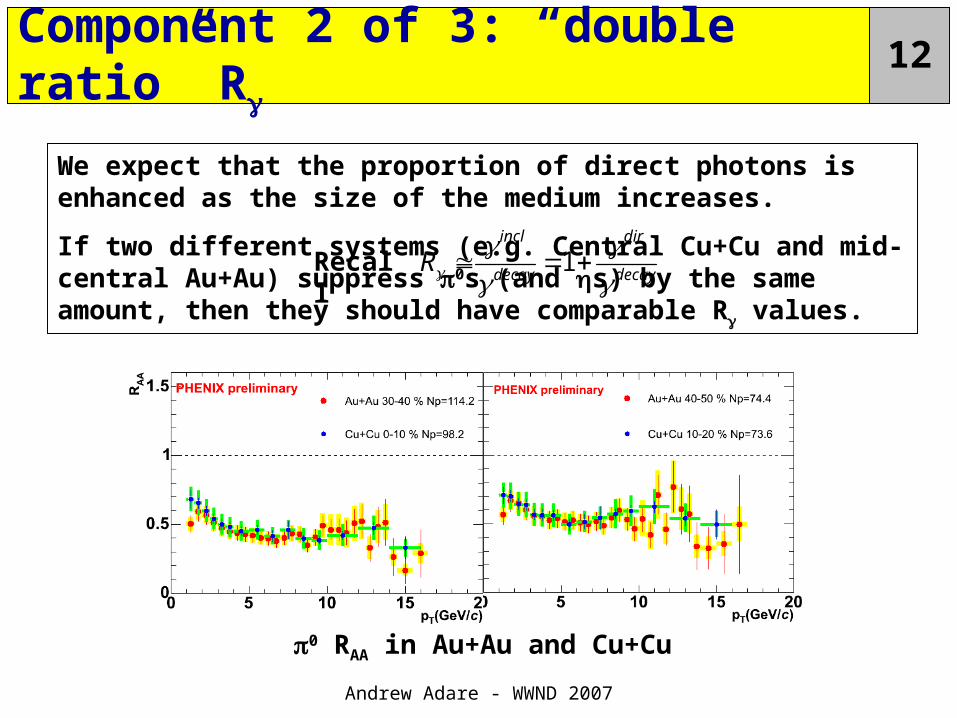
12
We expect that the proportion of direct photons is enhanced as the size of the medium increases.
If two different systems (e.g. Central Cu+Cu and mid-central Au+Au) suppress 0s (and s) by the same amount, then they should have comparable R values.
Component 2 of 3: “double ratio” R
decay
dir
decay
incl
R
1Recall
0 RAA in Au+Au and Cu+Cu

Andrew Adare - WWND 2007
13Component 2 of 3: “double ratio” R
%200%5030 partpart NCuCuNAuAu
Double ratio R measured in AuAu, but not yet in CuCu…
Use <Npart> scaling to map AuAu R CuCu.
We will refer to the quantity “(direct/decay)Au+Au interp.”
%4020%6050 partpart NCuCuNAuAu
Andrew Adare - WWND 2007
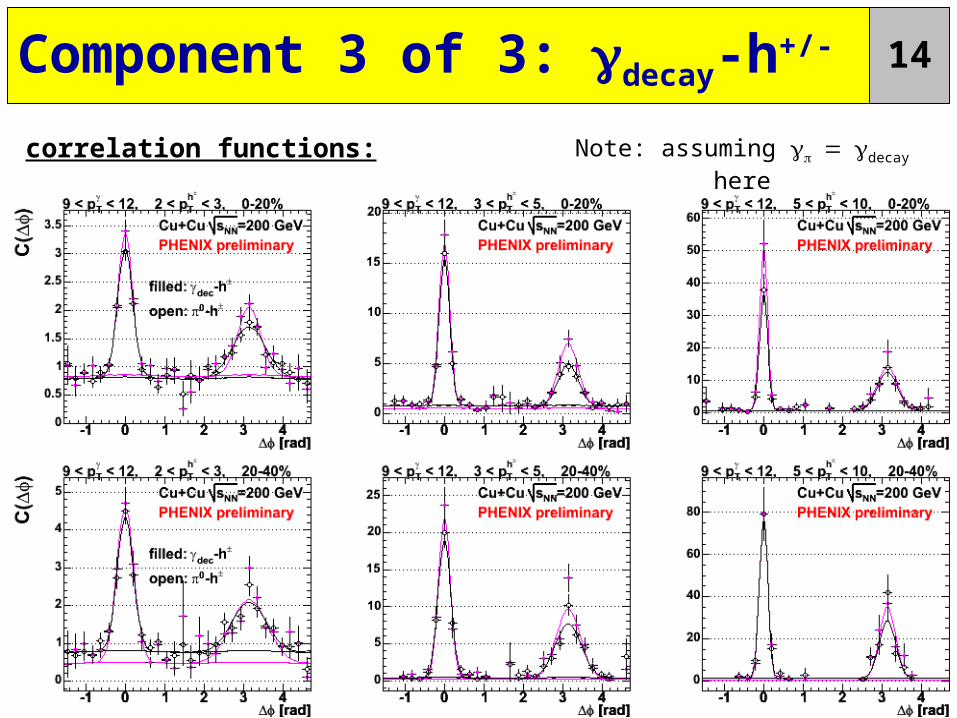
14Component 3 of 3: decay-h+/-
correlation functions: Note: assuming decay here

Andrew Adare - WWND 2007
15Component 3 of 3: decay-h+/-
per-trigger jet pair yields:
Andrew Adare - WWND 2007
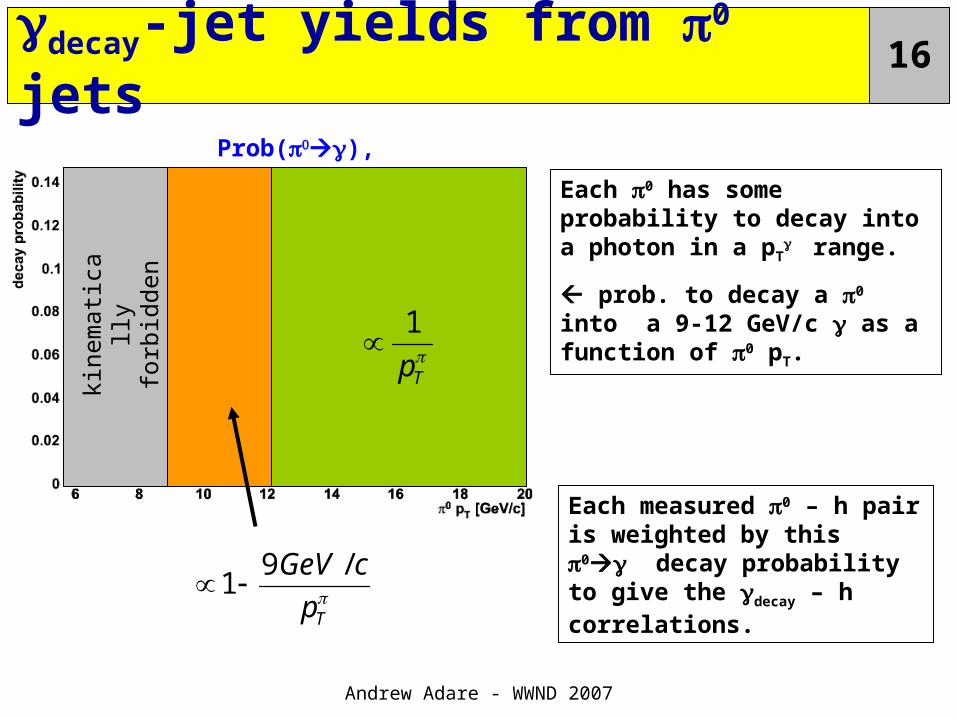
16
Each 0 has some probability to decay into a photon in a pT
range.
prob. to decay a 0 into a 9-12 GeV/c as a function of 0 pT.
decay-jet yields from 0 jets
Prob(), 9<pT<12
kine
mat
ical
ly
forb
idde
n
Tp
1
Tp
cGeV /91
Each measured 0 – h pair is weighted by this 0 decay probability to give the decay – h correlations.

Andrew Adare - WWND 2007
17Weighted 0 vs. from in PYTHIA
Black: PYTHIA “true” decay -h PTY
Red: PYTHIA pair-weighted -h PTY
Trigger pT: 5-7 7-9 9-12
h p
T : 1-2 3-5
The weighting method closely reproduces the true -h+/- correlations:

Andrew Adare - WWND 2007
18
We can test principles of the analysis method with Monte Carlo:
Does the subtraction formula work?
Calculating decay-h jet correlations from 0-h: what effects must be accounted for?
Cross-checking with simulations
)1(
R
YYRY decayincldir
energy smearing
perfect detector
EMCal energy resolution
and other decays decay angle smearing
• from – h+/-
• decay – h+/-
9-12 x 2-5

Andrew Adare - WWND 2007
19Full test of method in PYTHIA
Black: correlations with “true” direct photon triggers (ID’ed in event record)
Blue: direct photon correlations produced by subtraction method
The bias toward a low jet yield is worse for lower pT photon triggers, where R is smaller.
If one increases R by ~10%, the “true” correlation is roughly recovered. We use this 10% to gauge the systematic error from the subtraction method.
Magenta: direct -jet per-trigger yield, subtraction method as above, but with R scaled up by 10%
R = 1.90
R = 1.1*1.90 *Please note: This bias is due to the method, not uncertainty in R!
We are currently working hard to reduce this systematic error.
Dir
ect -
h p
airs
/tri
gg
er

Andrew Adare - WWND 2007
20Preliminary Cu+Cu Results: direct -h+/-
per-trigger jet pair yields: systematic from R
systematic from subtraction method
Andrew Adare - WWND 2007
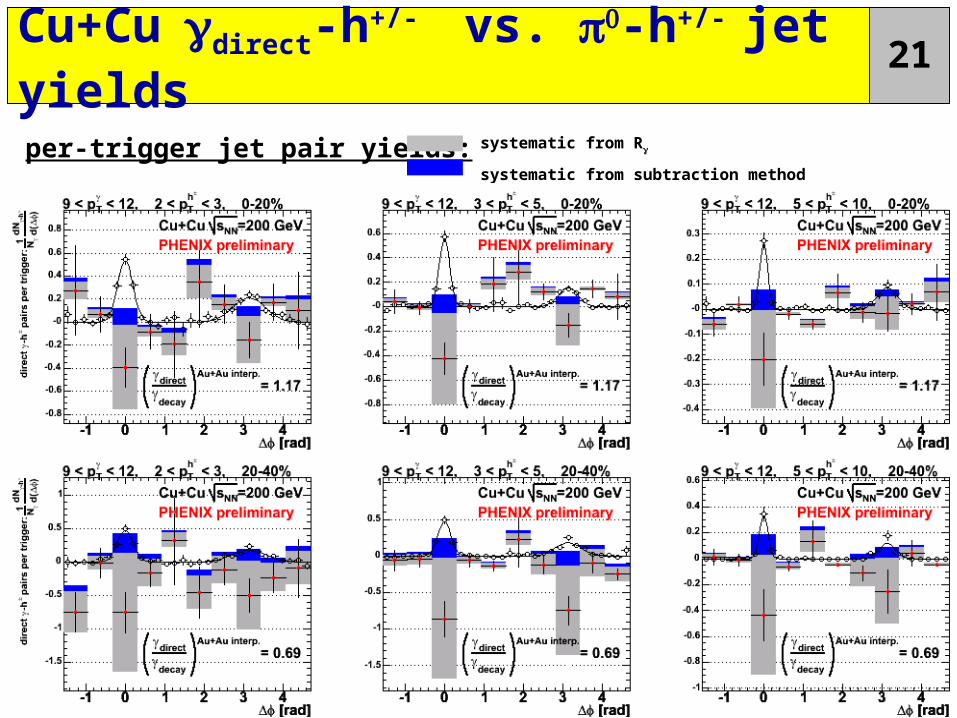
21Cu+Cudirect-h+/- vs. -h+/- jet yields
per-trigger jet pair yields: systematic from R
systematic from subtraction method
Andrew Adare - WWND 2007
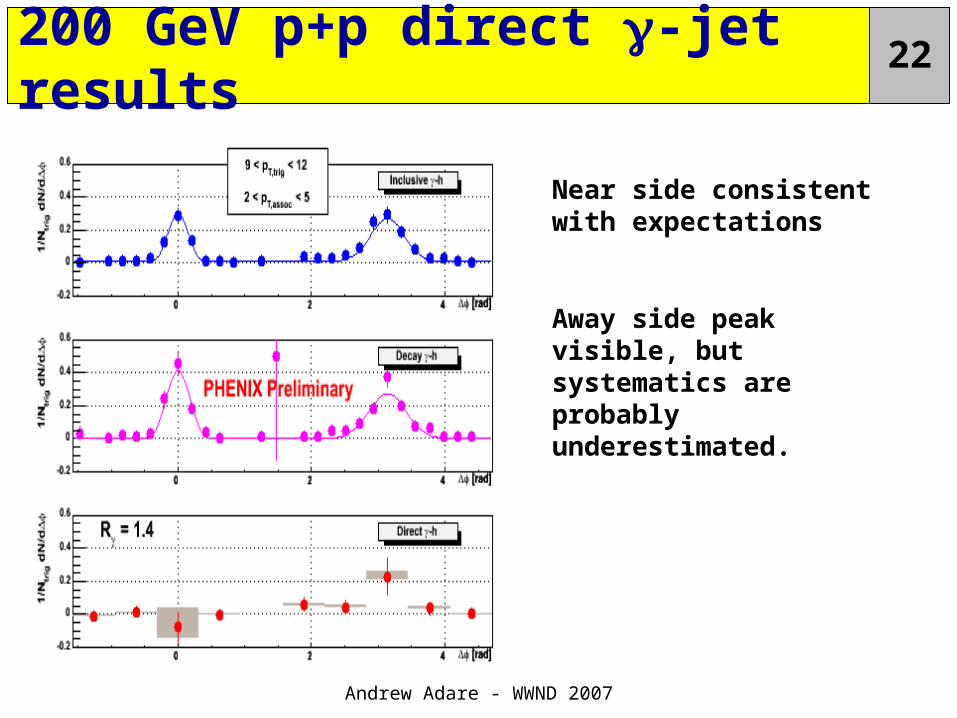
22200 GeV p+p direct -jet results
Near side consistent with expectations
Away side peak visible, but systematics are probably underestimated.
Andrew Adare - WWND 2007
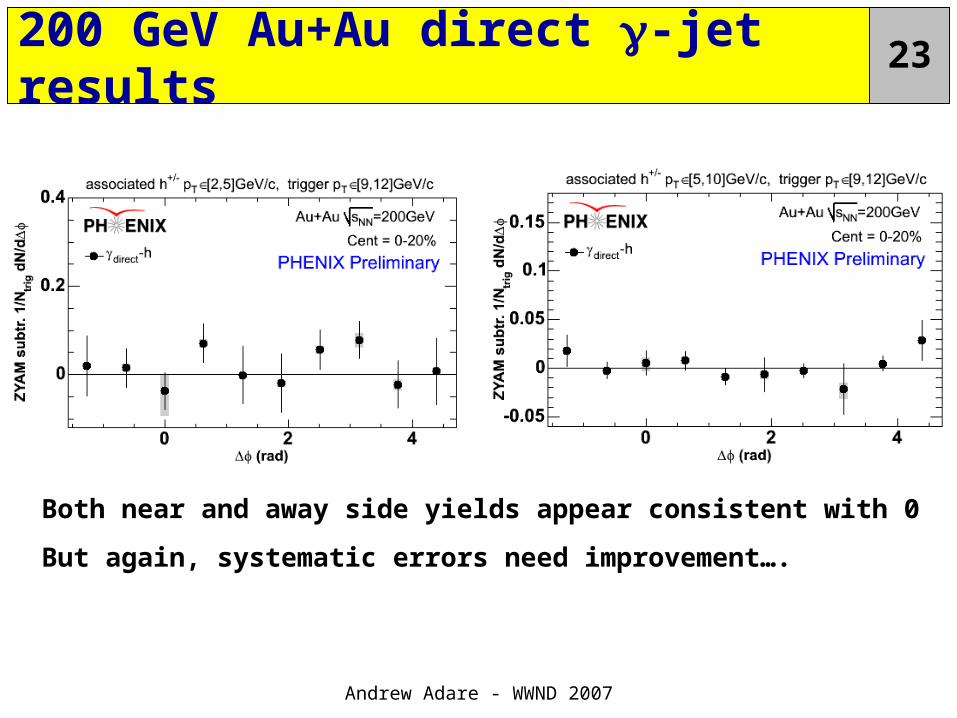
23200 GeV Au+Au direct -jet results
Both near and away side yields appear consistent with 0
But again, systematic errors need improvement….

Andrew Adare - WWND 2007
24Summary
• Correlations involving direct photons are an important probe of energy loss and fragmentation function modification in the QGP.
• Subtraction method shows promise, but current measurements don’t yet deliver good resolution.
• Expectations seem to be matched on the near side, where we see ~no signal compared to 0-h for example.
• These are early results: reduction in systematic errors still needed to make strong statements about away-side jet yields. Stay tuned!
Andrew Adare - WWND 2007
25Backups

Andrew Adare - WWND 2007
2602 phase space is flat
Consider sample of many 0s, all with the same pT:
pT
decay prob.density (proportional to dN/dpT
)
pT
2/pT
Normalization requirement of prob. density fn. means prob. to get a photon at pT drops like 2/pT
as pT increases.
Therefore, dN/dpT= 2/pT
In reality, dN/dEis what is truly flat, but we assume dN/dpT
is also flat at midrapidity.
*A more mathematical way to get dN/dpT
= 2/pT
is to boost isotropic decay into lab frame.
Andrew Adare - WWND 2007
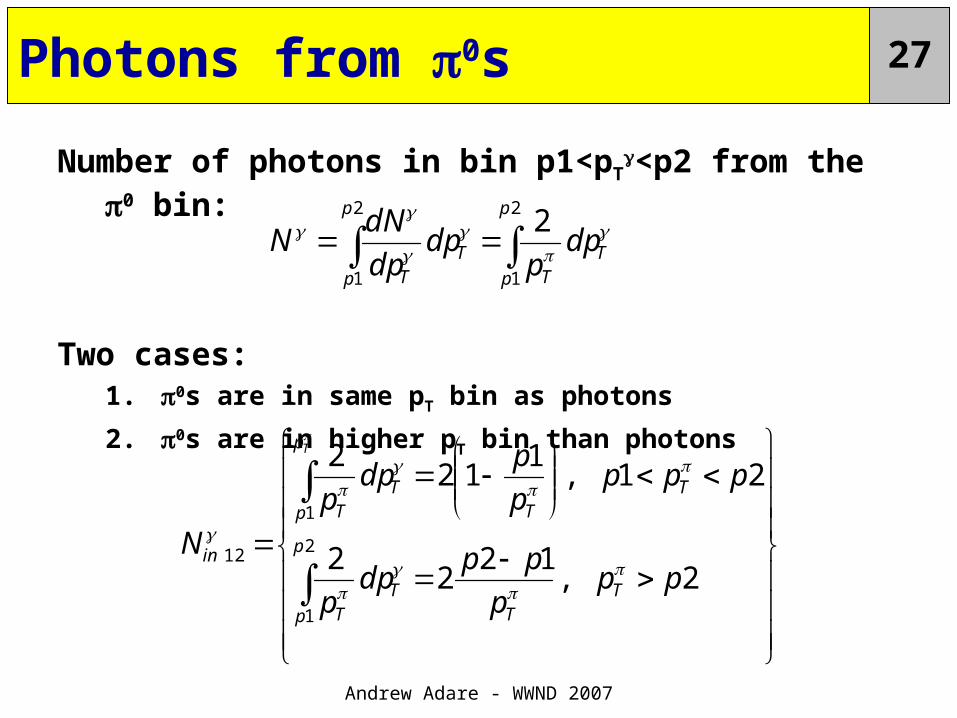
27Photons from 0s
Number of photons in bin p1<pT<p2 from the 0 bin:
Two cases:1. 0s are in same pT bin as photons
2. 0s are in higher pT bin than photons
2
1
2
1
2p
p
TT
p
p
TT
dpp
dpdp
dNN
2
1
1
12
2,12
22
21,1
122
p
p
TT
TT
p
p
TT
TT
in
ppp
ppdp
p
pppp
pdp
p
N
T

Andrew Adare - WWND 2007
28Weighting curves for pi0 decay probability
Using analytic form:
Decay probabilities above are combined with falling pi0 spectrum to give the decay photon “spectra”.
The decay gamma-h PTY is independent of the normalization, since both the pairs and triggers are applied the same weight.
Each pi0-h pair gets weighted by these 3 curves to produce the decay gamma-h correlation for the appropriate photon pT bin.
5<pT<7
7<pT<9
9<pT<12
2
1
1
12
2,12
22
21,1
122
p
p
TT
TT
p
p
TT
TT
in
ppp
ppdp
p
pppp
pdp
p
N
T
measured pi0 spectrum, centrality 0-20%
“spectra”.
Integral = # triggers
Related Documents