Direct Measurements of Polymer Brush Conformation Using Small- Angle Neutron Scattering (SANS) from Highly Grafted Iron Oxide Nanoparticles in Homopolymer Melts Michael J. A. Hore, †, * Jamie Ford, ‡ Kohji Ohno, ⊥ Russell J. Composto, §,∥ and Boualem Hammouda † † Center for Neutron Research, National Institute of Standards and Technology, 100 Bureau Drive, Gaithersburg, MD 20899, United States ‡ Penn Regional Nanotechnology Facility, University of Pennsylvania, Philadelphia, Pennsylvania 19104, United States ⊥ Institute for Chemical Research, Kyoto University, Uji, Kyoto 611-0011, Japan § Department of Materials Science & Engineering, University of Pennsylvania, Philadelphia, Pennsylvania 19104, United States ∥ Laboratory for Research on the Structure of Matter (LRSM), 3231 Walnut Street, Philadelphia, Pennsylvania 19104, United States ABSTRACT: Small-angle neutron scattering (SANS) is a sensitive technique that is able to probe the structure of polymer-grafted nanoparticles and free polymer chains. Here, we combine SANS measurements with self-consistent field theory (SCFT) calculations to study the structure of deuterated poly(methyl methacrylate) (dPMMA) nanocomposites containing PMMA-grafted Fe 3 O 4 nanospheres, with a specific emphasis on the conformation of the PMMA brush chains. We present a new, detailed SANS model which is able to account for the excluded volume of the grafted polymer chains, and compare the experimentally measured brush chain conformations to predictions from SCFT calculations for a polymer-grafted nanosphere, and previous studies by others. The results of the SANS measurements are in qualitative agreement with SCFT calculations and in excellent quantitative agreement with previous studies that indirectly assessed the structure of the polymer chains by measuring the hydrodynamic radius of the nanoparticles. Unlike previous methods, however, SANS provides direct measurements of the polymer brush conformation. ■ INTRODUCTION Nanoparticles are added to polymer materials to enhance properties such as optical absorption, Raman scattering, or electron transport. Their utility in these applications, however, is determined largely by their distribution within the polymer matrix. For instance, uniform dispersion and vertical orientation of CdSe nanorods is key to enhancing electron transport in thin film polymer photovoltaic devices. 1 Because of the prevalence of polymer nanocomposites in a variety of products and technologies, a large amount of research effort is dedicated to understanding fundamental topics related to their fabrication, processing, and structure−property relationships. A key issue related to the fabrication and processing of polymer nanocomposites is the morphology of nanoparticles within the material. Specifically, under what conditions do the nanoparticles disperse or aggregate in the material? To incorporate nanoparticles into a polymer, a polymer brush is often grafted to the particle surface, which in turn makes the particles compatible with the polymer matrix. In the athermal case, where the brush and matrix are chemically similar and the Flory−Huggins parameter χ ≈ 0, nanoparticle dispersion is primarily characterized by the ratio of length (i.e., degree of polymerization) of the matrix chains (P) to that of the brush chains (N), α = P/N. The values of α that dictate nanoparticle dispersion or aggregation have received considerable attention in recent years, and additional details can be found in the recent reviews from Green 2 and Kumar et al. 3 for polymer-grafted nanospheres, and in the work of Hore, Frischknecht, and Composto for the case of gold nanorods. 4−6 Jiao and Akcora 7 recently demonstrated that for polymer-grafted Fe 3 O 4 nano- spheres, a combination of autophobic dewetting and magnetic interactions leads to further control over the aggregation of nanoparticles in polymer nanocomposites. In addition to the influence of brush chain conformation on nanoparticle dispersion, the conformation of brush chains is an important characteristic for predicting the diffusion of polymers within a nanocomposite. Recently, work by Gam et al. 8,9 and Choi et al. 10 has demonstrated that polymer diffusion coefficients in nanocomposites can be collapsed onto a master curve using the confinement variable ID/2R g , where ID is the average interparticle separation in the composite and R g is the radius of gyration of the diffusion tracer polymer. For nanoparticles that have a dense brush of high molecular weight polymer on their surface, Choi et al. showed that the diffusion of a tracer within the nanocomposite network is dependent upon the degree to which the tracer can penetrate the brush. Thus, ID depends not only on nanoparticle volume fraction, but also on the conformation of chains within the brush. A priori, one might also expect the shape of the nanoparticle to influence ID because of changes in particle−particle separation Received: September 24, 2013 Revised: October 31, 2013 Published: November 21, 2013 Article pubs.acs.org/Macromolecules © 2013 American Chemical Society 9341 dx.doi.org/10.1021/ma401975a | Macromolecules 2013, 46, 9341−9348

Welcome message from author
This document is posted to help you gain knowledge. Please leave a comment to let me know what you think about it! Share it to your friends and learn new things together.
Transcript
Direct Measurements of Polymer Brush Conformation Using Small-Angle Neutron Scattering (SANS) from Highly Grafted Iron OxideNanoparticles in Homopolymer MeltsMichael J. A. Hore,†,* Jamie Ford,‡ Kohji Ohno,⊥ Russell J. Composto,§,∥ and Boualem Hammouda†
†Center for Neutron Research, National Institute of Standards and Technology, 100 Bureau Drive, Gaithersburg, MD 20899, UnitedStates‡Penn Regional Nanotechnology Facility, University of Pennsylvania, Philadelphia, Pennsylvania 19104, United States⊥Institute for Chemical Research, Kyoto University, Uji, Kyoto 611-0011, Japan§Department of Materials Science & Engineering, University of Pennsylvania, Philadelphia, Pennsylvania 19104, United States∥Laboratory for Research on the Structure of Matter (LRSM), 3231 Walnut Street, Philadelphia, Pennsylvania 19104, United States
ABSTRACT: Small-angle neutron scattering (SANS) is a sensitive technique that is able toprobe the structure of polymer-grafted nanoparticles and free polymer chains. Here, wecombine SANS measurements with self-consistent field theory (SCFT) calculations tostudy the structure of deuterated poly(methyl methacrylate) (dPMMA) nanocompositescontaining PMMA-grafted Fe3O4 nanospheres, with a specific emphasis on theconformation of the PMMA brush chains. We present a new, detailed SANS modelwhich is able to account for the excluded volume of the grafted polymer chains, andcompare the experimentally measured brush chain conformations to predictions from SCFT calculations for a polymer-graftednanosphere, and previous studies by others. The results of the SANS measurements are in qualitative agreement with SCFTcalculations and in excellent quantitative agreement with previous studies that indirectly assessed the structure of the polymerchains by measuring the hydrodynamic radius of the nanoparticles. Unlike previous methods, however, SANS provides directmeasurements of the polymer brush conformation.
■ INTRODUCTION
Nanoparticles are added to polymer materials to enhanceproperties such as optical absorption, Raman scattering, orelectron transport. Their utility in these applications, however,is determined largely by their distribution within the polymermatrix. For instance, uniform dispersion and vertical orientationof CdSe nanorods is key to enhancing electron transport in thinfilm polymer photovoltaic devices.1 Because of the prevalenceof polymer nanocomposites in a variety of products andtechnologies, a large amount of research effort is dedicated tounderstanding fundamental topics related to their fabrication,processing, and structure−property relationships.A key issue related to the fabrication and processing of
polymer nanocomposites is the morphology of nanoparticleswithin the material. Specifically, under what conditions do thenanoparticles disperse or aggregate in the material? Toincorporate nanoparticles into a polymer, a polymer brush isoften grafted to the particle surface, which in turn makes theparticles compatible with the polymer matrix. In the athermalcase, where the brush and matrix are chemically similar and theFlory−Huggins parameter χ ≈ 0, nanoparticle dispersion isprimarily characterized by the ratio of length (i.e., degree ofpolymerization) of the matrix chains (P) to that of the brushchains (N), α = P/N. The values of α that dictate nanoparticledispersion or aggregation have received considerable attentionin recent years, and additional details can be found in the recentreviews from Green2 and Kumar et al.3 for polymer-grafted
nanospheres, and in the work of Hore, Frischknecht, andComposto for the case of gold nanorods.4−6 Jiao and Akcora7
recently demonstrated that for polymer-grafted Fe3O4 nano-spheres, a combination of autophobic dewetting and magneticinteractions leads to further control over the aggregation ofnanoparticles in polymer nanocomposites.In addition to the influence of brush chain conformation on
nanoparticle dispersion, the conformation of brush chains is animportant characteristic for predicting the diffusion of polymerswithin a nanocomposite. Recently, work by Gam et al.8,9 andChoi et al.10 has demonstrated that polymer diffusioncoefficients in nanocomposites can be collapsed onto a mastercurve using the confinement variable ID/2Rg, where ID is theaverage interparticle separation in the composite and Rg is theradius of gyration of the diffusion tracer polymer. Fornanoparticles that have a dense brush of high molecular weightpolymer on their surface, Choi et al. showed that the diffusionof a tracer within the nanocomposite network is dependentupon the degree to which the tracer can penetrate the brush.Thus, ID depends not only on nanoparticle volume fraction,but also on the conformation of chains within the brush. Apriori, one might also expect the shape of the nanoparticle toinfluence ID because of changes in particle−particle separation
Received: September 24, 2013Revised: October 31, 2013Published: November 21, 2013
Article
pubs.acs.org/Macromolecules
© 2013 American Chemical Society 9341 dx.doi.org/10.1021/ma401975a | Macromolecules 2013, 46, 9341−9348
distances as well as changes in the conformation of the polymerbrush chains when grafted to surfaces of various curvatures.In the work of Alexander11 and de Gennes,12 a polymer chain
grafted to a planar substrate adopts a non-Gaussianconformation due to crowding effects from its neighbors,leading to a brush thickness that scales as h ∼ N. Daoud andCotton13 extended the Alexander-de Gennes brush model tothe case of star polymers, where all chains are sphericallysymmetric about a central grafting point. The crowding ofneighboring chains plays a slightly diminished role in this case,leading to a weaker scaling with N than in the planar case. Thismodel has since been extended to describe polymer chainsgrafted onto curved, convex surfaces14,17,18 and calculations ofbrushes grafted onto convex surfaces have also been performedusing SCFT.21−24 Laradji performed Monte Carlo simulationsof polymers grafted onto curved, fluctuating surfaces, which hasrelevance for biomaterials applications.15,16 Recent work fromOhno et al.17 and Dukes et al.18 has specifically focused on thestructure of polymer chains grafted to spherical nanoparticles athigh grafting densities using dynamic light scattering (DLS)measurements in solution to study the brush height, h. Thefindings of both Ohno et al. as well as Dukes et al. show twoprimary regions of the brush. Near the nanoparticle surface, upto a crossover radius rc, the brush is said to be a concentratedpolymer brush (CPB). Monomers in the CPB regime are highlycrowded, leading to a high degree of stretching in each brushchain. Here, both Ohno et al.17 and Dukes et al.,18 measured h∼ n4/5 in the CPB region, where n is the number of polymersegments within the CPB region. Linear scaling is onlyexpected for dimensionless grafting densities σ* = a2σ → 1,thus a smaller scaling exponent was observed (a is the statisticalsegment length). Near rc, the brush transitions from the CPBregion to a semidilute polymer brush (SDPB) region, in whichthe height scales as h ∼ m3/5 for a degree of polymerization n <m ≤ N in a good solvent. Monomers in the SDPB regime of thebrush are less crowded, and can adopt a more idealconformation. By extending the Daoud−Cotton model, Ohnoet al. obtain the critical radius as
σ ν= * *−r rc core1/2 1
(1)
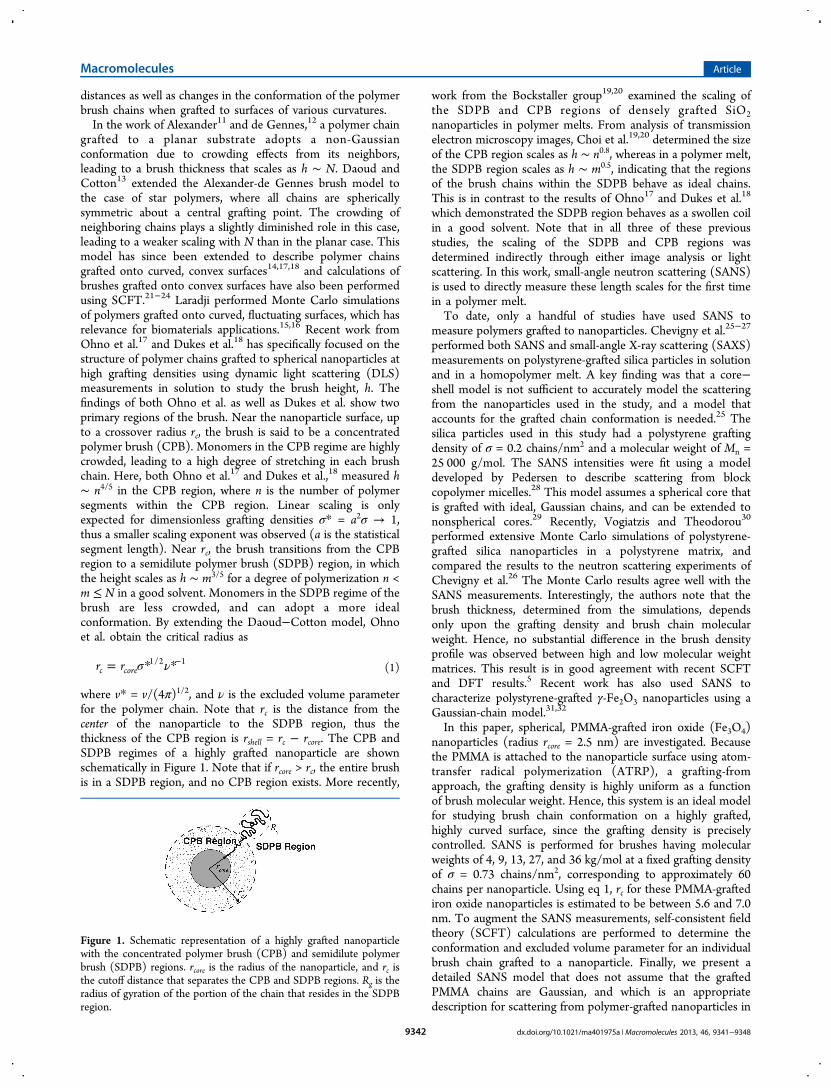
where v* = v/(4π)1/2, and ν is the excluded volume parameterfor the polymer chain. Note that rc is the distance from thecenter of the nanoparticle to the SDPB region, thus thethickness of the CPB region is rshell = rc − rcore. The CPB andSDPB regimes of a highly grafted nanoparticle are shownschematically in Figure 1. Note that if rcore > rc, the entire brushis in a SDPB region, and no CPB region exists. More recently,
work from the Bockstaller group19,20 examined the scaling ofthe SDPB and CPB regions of densely grafted SiO2nanoparticles in polymer melts. From analysis of transmissionelectron microscopy images, Choi et al.19,20 determined the sizeof the CPB region scales as h ∼ n0.8, whereas in a polymer melt,the SDPB region scales as h ∼ m0.5, indicating that the regionsof the brush chains within the SDPB behave as ideal chains.This is in contrast to the results of Ohno17 and Dukes et al.18
which demonstrated the SDPB region behaves as a swollen coilin a good solvent. Note that in all three of these previousstudies, the scaling of the SDPB and CPB regions wasdetermined indirectly through either image analysis or lightscattering. In this work, small-angle neutron scattering (SANS)is used to directly measure these length scales for the first timein a polymer melt.To date, only a handful of studies have used SANS to
measure polymers grafted to nanoparticles. Chevigny et al.25−27
performed both SANS and small-angle X-ray scattering (SAXS)measurements on polystyrene-grafted silica particles in solutionand in a homopolymer melt. A key finding was that a core−shell model is not sufficient to accurately model the scatteringfrom the nanoparticles used in the study, and a model thataccounts for the grafted chain conformation is needed.25 Thesilica particles used in this study had a polystyrene graftingdensity of σ = 0.2 chains/nm2 and a molecular weight of Mn =25 000 g/mol. The SANS intensities were fit using a modeldeveloped by Pedersen to describe scattering from blockcopolymer micelles.28 This model assumes a spherical core thatis grafted with ideal, Gaussian chains, and can be extended tononspherical cores.29 Recently, Vogiatzis and Theodorou30
performed extensive Monte Carlo simulations of polystyrene-grafted silica nanoparticles in a polystyrene matrix, andcompared the results to the neutron scattering experiments ofChevigny et al.26 The Monte Carlo results agree well with theSANS measurements. Interestingly, the authors note that thebrush thickness, determined from the simulations, dependsonly upon the grafting density and brush chain molecularweight. Hence, no substantial difference in the brush densityprofile was observed between high and low molecular weightmatrices. This result is in good agreement with recent SCFTand DFT results.5 Recent work has also used SANS tocharacterize polystyrene-grafted γ-Fe2O3 nanoparticles using aGaussian-chain model.31,32
In this paper, spherical, PMMA-grafted iron oxide (Fe3O4)nanoparticles (radius rcore = 2.5 nm) are investigated. Becausethe PMMA is attached to the nanoparticle surface using atom-transfer radical polymerization (ATRP), a grafting-fromapproach, the grafting density is highly uniform as a functionof brush molecular weight. Hence, this system is an ideal modelfor studying brush chain conformation on a highly grafted,highly curved surface, since the grafting density is preciselycontrolled. SANS is performed for brushes having molecularweights of 4, 9, 13, 27, and 36 kg/mol at a fixed grafting densityof σ = 0.73 chains/nm2, corresponding to approximately 60chains per nanoparticle. Using eq 1, rc for these PMMA-graftediron oxide nanoparticles is estimated to be between 5.6 and 7.0nm. To augment the SANS measurements, self-consistent fieldtheory (SCFT) calculations are performed to determine theconformation and excluded volume parameter for an individualbrush chain grafted to a nanoparticle. Finally, we present adetailed SANS model that does not assume that the graftedPMMA chains are Gaussian, and which is an appropriatedescription for scattering from polymer-grafted nanoparticles in
Figure 1. Schematic representation of a highly grafted nanoparticlewith the concentrated polymer brush (CPB) and semidilute polymerbrush (SDPB) regions. rcore is the radius of the nanoparticle, and rc isthe cutoff distance that separates the CPB and SDPB regions. Rg is theradius of gyration of the portion of the chain that resides in the SDPBregion.
Macromolecules Article
dx.doi.org/10.1021/ma401975a | Macromolecules 2013, 46, 9341−93489342
non-Θ solvents, in homopolymer melts with specificinteractions, or for stretched polymer chains.
■ THEORETICAL METHODSSCFT of Polymer-Grafted Nanoparticles. Self-consistent
field theory (SCFT) is a mean field, statistical path integralframework that has been successful in calculating manyimportant quantities for polymeric systems. For example, thephase diagram for block copolymer melts, the interactionbetween polymer-grafted nanoparticles in homopolymer melts,and the structure of polymer brushes in miscible polymerblends have all been well-described by SCFT.5,21−23,33,34,36 Thepartition function for a system of a single polymer-graftednanoparticle embedded in a chemically identical homopolymermelt, containing nb brush chains and nm matrix chains is givenby
∫ ∫∏ ∏
β β
δ ϕ ϕ ϕ
=
− −
× − − −
= =s s
U s U s
R R
R R
( ) ( )
exp( [ ( )] [ ( )])
[1 ]
i
n
b ij
n
m j
b i m j
b m NP
1,
1,
0 , 0 ,
b m
(2)
The potential U0 corresponds to a harmonic potential betweenmonomers, and for an arbitrary chain m is taken to be
∫=∂
∂U R s
as
R s
s[ ( )]
32
d( )
l m
N l m0 , 2 0
,2
l
(3)
where a is the statistical segment length and Nl is the degree ofpolymerization of a chain of type l. The brush chains are graftedto the nanoparticle surface at a reduced grafting density
σ σρ
* = Na
6
0 (4)
where 1/ρ0 is the volume of a single monomer. Forhydrogenated PMMA, 1/ρ0 ≈ 0.158 nm3.Equation 2 is transformed into a partition function described
by an auxiliary field ω+(r) through integral transformations intoa form
∫ ω ω= −+ +exp( [ ])(5)
with the effective Hamiltonian expressed as
∫ ω ϕ ϕ α= − − −+−
k TC Vi r Q Qr
1( ) d ln lnb b m m
B
1
(6)
where C = ρ0V/N. Qb and Qm are the single chain partitionfunctions of the brush and matrix, respectively.A mean field approximation is imposed, leading to the
common ″self-consistent field theory″ (SCFT) description ofthe nanocomposite system. In this approximation, theHamiltonian is assumed to be described by a singleconfiguration of ω+ at equilibrium, i.e., the functional derivativeδ δω =+/ 0. ω+ is relaxed from its initial randomconfiguration toward the equilibrium value ω+* by way of asemi-implicit Seidel scheme (SIS), which has resolution andstability improvements over a typical explicit Euler scheme.35
The SIS scheme is based upon an expansion of the polymerdensity operators using the random phase approximation to
linear order in ω+, and then subtracting and adding the linearresponse at the future and current iteration, respectively,
ω ωω
ωω
−Δ
= − ∗ − ∂∂
+ ∗++
++
+
++t
g gn n
n n1
1
(7)
The ∗ operator in eq 7 represents a convolution of g and ω+,which is efficiently implemented in Fourier space as amultiplication. The kernel g is given as
ϕ ϕ α α= +g k F k F k( ) ( ) ( )b D m D2 2
(8)
where FD is the Debye function. To aid with convergence, weenforce a requirement that the spatial average of ω+(r) = 0 bysetting ω+(k = 0) ≡ 0. The time step Δt = 0.5.Additional details on the numerical methods employed to
solve the field theory are available in a recent publication36 anda monograph by Fredrickson.34 The SCFT calculations usedthe Compute Unified Device Architecture (CUDA) and wereperformed on NVIDIA Tesla GPUs (M2070-Q) to reducecomputation time.
Obtaining Chain Conformation from SCFT. To bettercompare the SCFT with neutron scattering data, we calculatethe scaling of the mean squared end-to-end distance of a brushchain for the system described above, in a manner similar toSchmid37 and Meth.38 The probability of a polymer chainstarting at position r and ending at r′ after N steps is given bythe Green’s function G(r,r′;N), which satisfies a modifieddiffusion equation,
ω δ δ∂∂
− ∇ + * ′ = ′ −+⎡⎣⎢
⎤⎦⎥s
i G N Nr r r r r( ) ( , ; ) ( ) ( )2
(9)
where ω+*(r) is the equilibrated auxiliary field, i.e., the saddle-point or mean field configuration. In eq 9, the delta functionsenforce the boundary conditions that the chain begins atposition r and that G(r,r′;N) = 0 for N < 0. The mean squaredend-to-end distance of a brush chain anchored at position R0 isgiven by
∫∫
⟨ ⟩ =−
RR R G N
G N
R R R
R R R
d ( ) ( , ; )
d ( , ; )NN N N
N N0
2 02
0
0 (10)
In a similar fashion, the mean squared end-to-end distancebetween the anchored chain end and any segment n can becalculated as
∬∫
⟨ ⟩ =− −
RR R G n G N n
G N
R R R R R R
R R R
d d ( ) ( , ; ) ( , ; )
d ( , ; )nn N n n n N
N N0
2 02
0
0
(11)
and the mean squared end-to-end distance between a segmentn and the free end of the chain as
∬∫
⟨ ⟩ =− −
RR R G n G N n
G N
R R R R R R
R R R
d d ( ) ( , ; ) ( , ; )
d ( , ; )nNn N n N n n N
N N
22
0
0
(12)
Equation 11 can be interpreted as the mean squared distancebetween the anchor point, R0 and segment n for a chain thatbegins at R0 and ends at RN after N steps. Similarly, eq 12represents the mean squared distance between segment n andthe free end of the chain RN subject to the condition that thechain is anchored at a position R0. Note that this procedure is ahighly computationally intensive problem, as it requires that eq
Macromolecules Article
dx.doi.org/10.1021/ma401975a | Macromolecules 2013, 46, 9341−93489343
9 be solved at each point R0 and Rn to obtain the necessaryGreen’s functions.
■ EXPERIMENTAL METHODSPreparation of Nanocomposites. The synthesis of the Fe3O4
nanospheres was previously detailed.39,40 Hydrogenated poly(methylmethacrylate) (hPMMA) was grafted from the nanosphere surfaceusing surface-initiated atom transfer radical polymerization (ATRP).The resulting polymer brushes had a polydispersity index between 1.1and 1.2.17,39 Deuterated PMMA matrix polymers with molecularweight Mn = 29 000 g/mol (Mw/Mn < 1.05) and 88 000 g/mol (Mw/Mn = 1.2) were obtained from Polymer Source, Inc. (Montreal,Canada) and used as received. Bulk nanocomposite pellets for small-angle neutron scattering (SANS) were prepared by combining 50 mgof iron oxide nanospheres with 300 mg of deuterated poly(methylmethacrylate) (dPMMA) in toluene, and stirring the solution forapproximately 24 h. After allowing the nanoparticles to dissolve, thesolution was poured into PDMS molds and the toluene allowed toslowly evaporate over the course of 24 h. Table 1 contains theparameters for all nanocomposites studied. The grafting density σ wasmeasured previously by Xu et al.39
Small-Angle Neutron Scattering (SANS) Measurements.SANS was performed on the NG3 30 m SANS instrument at theNational Institute for Standards and Technology, Center for NeutronResearch (NCNR). Three sample-to-detector distances of 1, 4, and 13m were used to measure the scattered neutron intensity, dΣ(q)/dΩ, asa function of scattering variable q = (4π/λ) sin (θ/2), where θ is thescattering angle and λ is the neutron wavelength (6 Å at 1 and 4 m, 8.4Å at 13 m).SANS Analysis: The Core−Shell−Chain Model. The SANS data
were analyzed using a core−shell−chain model, where the corerepresents scattering from the inorganic nanoparticle, the shellrepresents highly stretched chains in the CPB regime, and the chainportion is due to scattering from the polymer chains in the SDPBregime with an excluded volume parameter ν. In other words, thismodel makes no assumption that the grafted chains adopt Gaussianconformations, and thus, is a more flexible model for determiningbrush conformation in solution, or homopolymer melts with favorableFlory−Huggins parameters, χ. The scattering intensity is given by thesum of four scattering factors. FA(q) is the form factor amplitude of acore−shell nanoparticle. For the spherical Fe3O4 nanoparticles, FA(q)is given by
ρ ρ ρ ρ= − + −
++
+
⎡⎣⎢
⎤⎦⎥
F q Vj qr
qr
V Vj q r r
q r r
( ) ( )3 ( )
( )
( )3 [ ( )]
( )
A core shell corecore
coreshell matrix
shell corecore shell
core shell
1
1
(13)
where j1 is a spherical Bessel function, rcore is the nanoparticle coreradius, rshell is the shell thickness, and ρi is the scattering length density(SLD) of component i. Vcore and Vshell are the volumes of the core andshell regions, respectively.The amplitude of correlations between the core−shell particle and
grafted polymer chains are given by FA(q)FB(q), where
=− −
F qq R
q R( )
1 exp[ ]B
g
g
2 2
2 2(14)
and the radius of gyration squared,
ν ν=
+ +
νR
N a(2 1)(2 2)g
22 2
(15)
Interchain and intrachain correlations are given by FB(q)EA2(q)FB(q)
and PB(q), respectively, where EA(q) = j0[q(rcore + rshell)] is a sphericalBessel function and
∫= − − ν ν⎡⎣⎢
⎤⎦⎥P q x x
q aN x( ) 2 d (1 ) exp
6B0
1 2 22 2
(16)
Hammouda41 performed the integration of eq 16 to obtain
νγ
ν νγ
ν= −ν ν
⎜ ⎟ ⎜ ⎟⎛⎝
⎞⎠
⎛⎝
⎞⎠P q
UU
UU( )
1 12
,1 1
,B 1/2 1/ (17)
In eq 17, γ(d,U) is the lower incomplete γ function with the form
∫γ = − −d U t t( , ) d eU
t d
0
1(18)
and the variable U = q2a2N2ν/6. With these correlation terms defined,the scattering cross section (in units of cm−1) for nanoparticles at anumber density NP/V with Ng grafted polymer chains per particle is
ΣΩ
= + + −
+
q NV
F q N V F q F q N N V F q
E q F q N V P q S q
d ( )d
[ ( ) ( ) ( ) ( 1) ( )
( ) ( ) ( )] ( )
PA g B A B g g B B
A B g B B I
2 2
2 2(19)
For well-dispersed particles, we approximate the interparticlestructure factor term as SI(q) ≈ 1. The polymer chain volume VB =N/ρ0. The excluded volume parameter ν yields information regardingthe brush chain conformation. For ν ≈ 3/5, the conformation isdescribed by a self-avoiding random walk, whereas for ν = 1/3 and ν =1, the conformation is described by a self-attracting walk or a thin rigidrod, respectively. Note, however, that setting ν = 1 in eq 16 does notreproduce the correct rigid rod limit, and that the FB(q)EA
2(q)FB(q)term is approximate. For ν = 1/2, the chain conformation is that of apure random walk, and if rshell → 0, eq 19 reduces to Pedersen’s modelfor grafted Gaussian chains.28 For each set of SANS data, ν, Rg and rshellwere determined from nonlinear least-squares fitting. rcore wasmeasured previously by Xu et al.39 using transmission electronmicroscopy (TEM). Recall that rc = rcore + rshell (cf., eq 1). Thescattering length densities of the nanoparticles, brush, and matrix aresummarized in Table 2.
■ RESULTS AND DISCUSSIONSCFT Chain Conformation. The effect of α = P/N on the
interaction free energy between pairs of nanospheres has beenstudied previously by Xu et al.,24 by Kim and Matsen,21 and,most recently, by Trombly and Ganesan23 using SCFT in thecontext of predicting nanosphere dispersion. Here, only thestructure of the brush chains is considered. Shown in Figure 2are brush density profiles for nanocomposite systems analogousto the Fe3O4-27K1 system (σ* = 6.31, red), and one at a lowerreduced grafting density σ* = 1.00 (black). The bottom axis
Table 1. Parameters for Fe3O4 Nanocompositesa
sample ID N P α = P/N σ [nm−2] σ*
*Fe3O4-4K 39 813 21 0.73 2.38*Fe3O4-9K 90 813 9 0.73 3.62*Fe3O4-13K 133 813 6 0.73 4.40Fe3O4-27K1 274 268 1 0.73 6.31Fe3O4-27K2 274 813 3 0.73 6.31Fe3O4-35K 357 813 2 0.73 7.21
aThe asterisk denotes nanocomposites where nanoparticles aggre-gated.
Table 2. Scattering Length Densities for PolymerNanocomposite Components
material scattering length density, Å−2 ref
Fe3O4 6.97 × 10⁻⁶ 42deuterated PMMA 6.88 × 10⁻⁶ 43hydrogenated PMMA 1.05 × 10⁻⁶ 43
Macromolecules Article
dx.doi.org/10.1021/ma401975a | Macromolecules 2013, 46, 9341−93489344
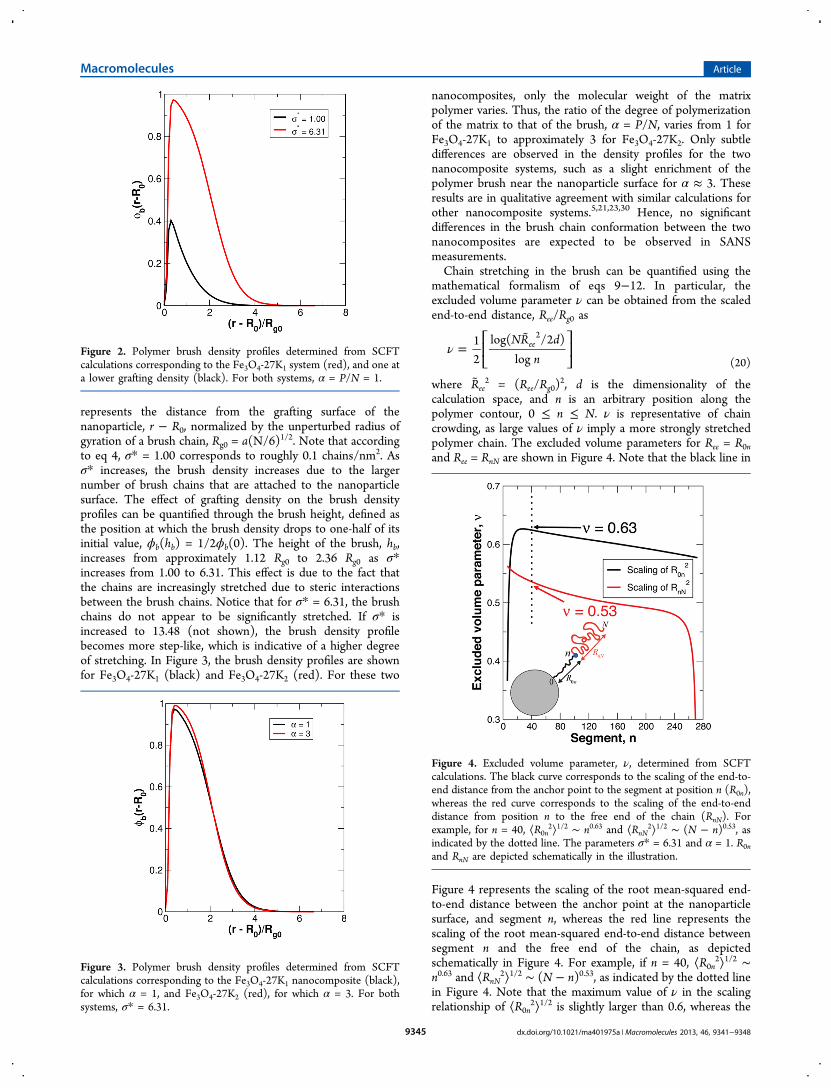
represents the distance from the grafting surface of thenanoparticle, r − R0, normalized by the unperturbed radius ofgyration of a brush chain, Rg0 = a(N/6)1/2. Note that accordingto eq 4, σ* = 1.00 corresponds to roughly 0.1 chains/nm2. Asσ* increases, the brush density increases due to the largernumber of brush chains that are attached to the nanoparticlesurface. The effect of grafting density on the brush densityprofiles can be quantified through the brush height, defined asthe position at which the brush density drops to one-half of itsinitial value, ϕb(hb) = 1/2ϕb(0). The height of the brush, hb,increases from approximately 1.12 Rg0 to 2.36 Rg0 as σ*increases from 1.00 to 6.31. This effect is due to the fact thatthe chains are increasingly stretched due to steric interactionsbetween the brush chains. Notice that for σ* = 6.31, the brushchains do not appear to be significantly stretched. If σ* isincreased to 13.48 (not shown), the brush density profilebecomes more step-like, which is indicative of a higher degreeof stretching. In Figure 3, the brush density profiles are shownfor Fe3O4-27K1 (black) and Fe3O4-27K2 (red). For these two
nanocomposites, only the molecular weight of the matrixpolymer varies. Thus, the ratio of the degree of polymerizationof the matrix to that of the brush, α = P/N, varies from 1 forFe3O4-27K1 to approximately 3 for Fe3O4-27K2. Only subtledifferences are observed in the density profiles for the twonanocomposite systems, such as a slight enrichment of thepolymer brush near the nanoparticle surface for α ≈ 3. Theseresults are in qualitative agreement with similar calculations forother nanocomposite systems.5,21,23,30 Hence, no significantdifferences in the brush chain conformation between the twonanocomposites are expected to be observed in SANSmeasurements.Chain stretching in the brush can be quantified using the
mathematical formalism of eqs 9−12. In particular, theexcluded volume parameter ν can be obtained from the scaledend-to-end distance, Ree/Rg0 as
ν =⎡
⎣⎢⎤⎦⎥
NR dn
12
log( /2 )log
ee2
(20)
where Ree2 = (Ree/Rg0)
2, d is the dimensionality of thecalculation space, and n is an arbitrary position along thepolymer contour, 0 ≤ n ≤ N. ν is representative of chaincrowding, as large values of ν imply a more strongly stretchedpolymer chain. The excluded volume parameters for Ree = R0nand Ree = RnN are shown in Figure 4. Note that the black line in
Figure 4 represents the scaling of the root mean-squared end-to-end distance between the anchor point at the nanoparticlesurface, and segment n, whereas the red line represents thescaling of the root mean-squared end-to-end distance betweensegment n and the free end of the chain, as depictedschematically in Figure 4. For example, if n = 40, ⟨R0n
2⟩1/2 ∼n0.63 and ⟨RnN
2⟩1/2 ∼ (N − n)0.53, as indicated by the dotted linein Figure 4. Note that the maximum value of ν in the scalingrelationship of ⟨R0n
2⟩1/2 is slightly larger than 0.6, whereas the
Figure 2. Polymer brush density profiles determined from SCFTcalculations corresponding to the Fe3O4-27K1 system (red), and one ata lower grafting density (black). For both systems, α = P/N = 1.
Figure 3. Polymer brush density profiles determined from SCFTcalculations corresponding to the Fe3O4-27K1 nanocomposite (black),for which α = 1, and Fe3O4-27K2 (red), for which α = 3. For bothsystems, σ* = 6.31.
Figure 4. Excluded volume parameter, ν, determined from SCFTcalculations. The black curve corresponds to the scaling of the end-to-end distance from the anchor point to the segment at position n (R0n),whereas the red curve corresponds to the scaling of the end-to-enddistance from position n to the free end of the chain (RnN). Forexample, for n = 40, ⟨R0n
2⟩1/2 ∼ n0.63 and ⟨RnN2⟩1/2 ∼ (N − n)0.53, as
indicated by the dotted line. The parameters σ* = 6.31 and α = 1. R0nand RnN are depicted schematically in the illustration.
Macromolecules Article
dx.doi.org/10.1021/ma401975a | Macromolecules 2013, 46, 9341−93489345
value of ν in the scaling relationship of ⟨RnN2⟩1/2 decreases from
approximately 0.57 to 0.50 over the range of n shown in Figure4. These results represent a weaker degree of stretching of thebrush near the nanoparticle surface than is expected from thescaling analysis of Ohno et al.17 and Dukes et al.18 If σ* isincreased beyond 6.31, the chains become more stretched asindicated by a larger maximum value of ν. However, for theparameters relevant to the experimental system, SCFT predictsν ≈ 0.6 in the CPB regime and ν ≈ 0.50 in the SDPB regime.The profiles from SCFT exhibit a small degree of chain
stretching near the nanoparticle surface, and a scaling of theremainder of the chain ⟨RnN
2⟩1/2 ∼ Nv where 0.50 ≤ ν ≤ 0.55. Arecent study by Frischknecht et al.5 that compares classicalDFT calculations to SCFT demonstrates that at the samereduced grafting densities, the density profiles obtained fromSCFT show a lesser degree of stretching as compared to DFT.However, if the reduced grafting density of the DFTcalculations decreases, or correspondingly, the grafting densityof the SCFT calculations increases, the two profiles are inexcellent agreement. This difference may be due to certainassumptions in the SCFT or a lack of parameters, such as theassumption of a very large molecular weight polymer, lack of anexplicit chain length variable, or a poor description of thepolymer chain near the nanoparticle surface, where numericaldivergences in the auxiliary field have been shown to occur.33
Thus, the SCFT results presented in Figures 2−4 likelyunderpredict the degree of stretching in the brush, as will beshown in the following section describing the neutronscattering measurements Additional work is required to betterconnect experimental values of σ with relevant values of σ* inthe SCFT to more accurately model the brush density profileand brush chain conformation.SANS of Iron Oxide Nanocomposites. In contrast to the
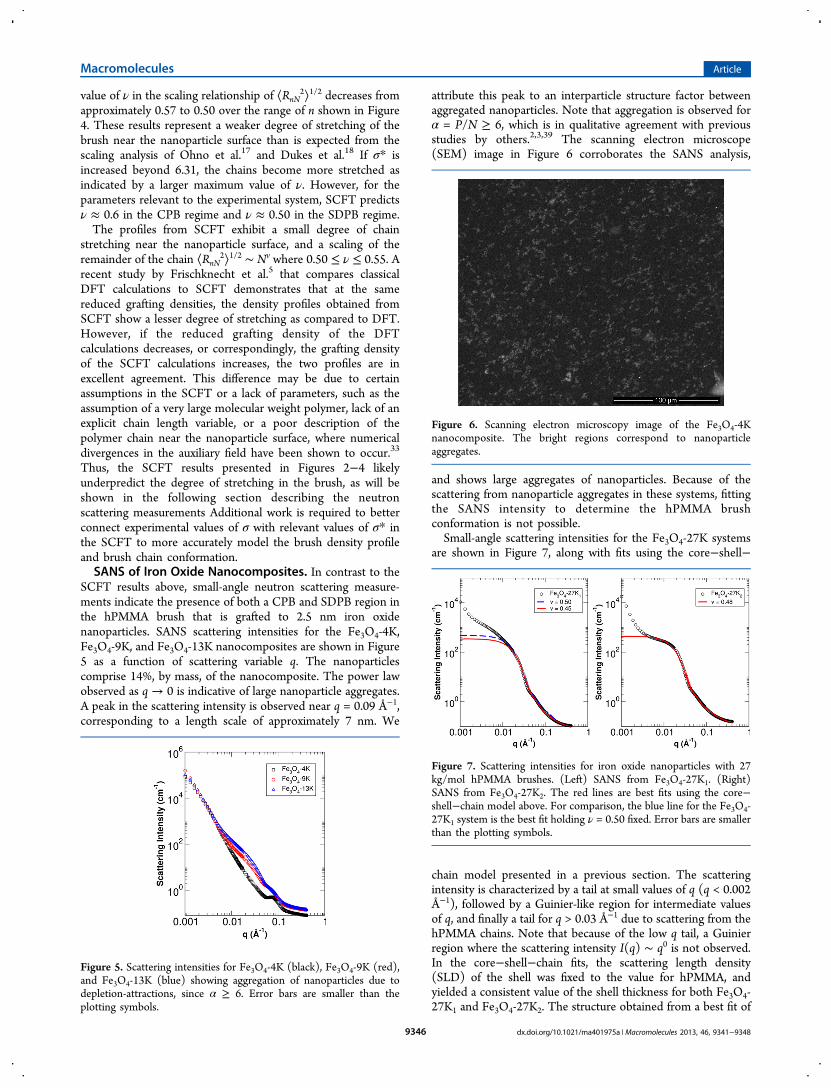
SCFT results above, small-angle neutron scattering measure-ments indicate the presence of both a CPB and SDPB region inthe hPMMA brush that is grafted to 2.5 nm iron oxidenanoparticles. SANS scattering intensities for the Fe3O4-4K,Fe3O4-9K, and Fe3O4-13K nanocomposites are shown in Figure5 as a function of scattering variable q. The nanoparticlescomprise 14%, by mass, of the nanocomposite. The power lawobserved as q → 0 is indicative of large nanoparticle aggregates.A peak in the scattering intensity is observed near q = 0.09 Å−1,corresponding to a length scale of approximately 7 nm. We
attribute this peak to an interparticle structure factor betweenaggregated nanoparticles. Note that aggregation is observed forα = P/N ≥ 6, which is in qualitative agreement with previousstudies by others.2,3,39 The scanning electron microscope(SEM) image in Figure 6 corroborates the SANS analysis,
and shows large aggregates of nanoparticles. Because of thescattering from nanoparticle aggregates in these systems, fittingthe SANS intensity to determine the hPMMA brushconformation is not possible.Small-angle scattering intensities for the Fe3O4-27K systems
are shown in Figure 7, along with fits using the core−shell−
chain model presented in a previous section. The scatteringintensity is characterized by a tail at small values of q (q < 0.002Å−1), followed by a Guinier-like region for intermediate valuesof q, and finally a tail for q > 0.03 Å−1 due to scattering from thehPMMA chains. Note that because of the low q tail, a Guinierregion where the scattering intensity I(q) ∼ q0 is not observed.In the core−shell−chain fits, the scattering length density(SLD) of the shell was fixed to the value for hPMMA, andyielded a consistent value of the shell thickness for both Fe3O4-27K1 and Fe3O4-27K2. The structure obtained from a best fit of
Figure 5. Scattering intensities for Fe3O4-4K (black), Fe3O4-9K (red),and Fe3O4-13K (blue) showing aggregation of nanoparticles due todepletion-attractions, since α ≥ 6. Error bars are smaller than theplotting symbols.
Figure 6. Scanning electron microscopy image of the Fe3O4-4Knanocomposite. The bright regions correspond to nanoparticleaggregates.
Figure 7. Scattering intensities for iron oxide nanoparticles with 27kg/mol hPMMA brushes. (Left) SANS from Fe3O4-27K1. (Right)SANS from Fe3O4-27K2. The red lines are best fits using the core−shell−chain model above. For comparison, the blue line for the Fe3O4-27K1 system is the best fit holding ν = 0.50 fixed. Error bars are smallerthan the plotting symbols.
Macromolecules Article
dx.doi.org/10.1021/ma401975a | Macromolecules 2013, 46, 9341−93489346
the scattered intensity is a spherical iron oxide core with radiusrcore = 2.5 nm surrounded by an hPMMA shell with anapproximate thickness 4 nm. The chains outside of the shelladopt a radius of gyration Rg ∼ Nv with Rg = 5.406 ± 0.008 nmand ν = 0.4520 ± 0.0003 for Fe3O4-27K1, Rg = 5.537 ± 0.003nm and ν = 0.4854 ± 0.0004 for Fe3O4-27K2. Note that thevalues of ν are consistent with those obtained for ⟨RnN
2⟩1/2
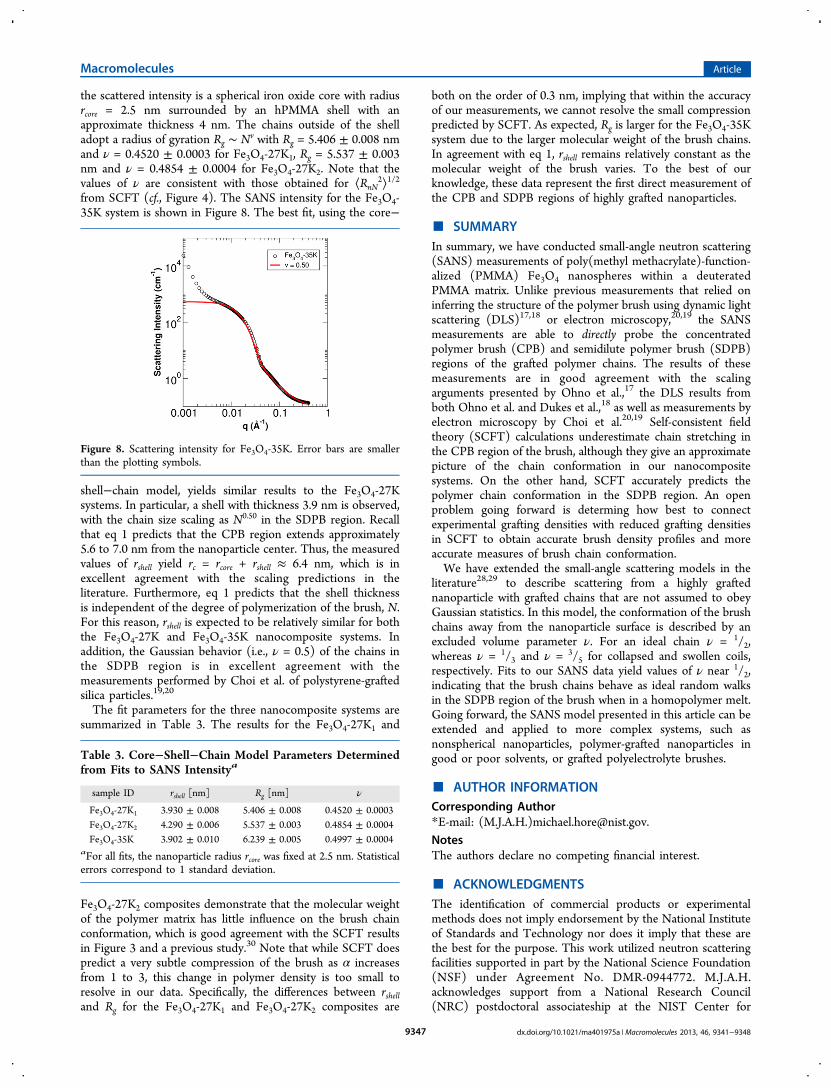
from SCFT (cf., Figure 4). The SANS intensity for the Fe3O4-35K system is shown in Figure 8. The best fit, using the core−
shell−chain model, yields similar results to the Fe3O4-27Ksystems. In particular, a shell with thickness 3.9 nm is observed,with the chain size scaling as N0.50 in the SDPB region. Recallthat eq 1 predicts that the CPB region extends approximately5.6 to 7.0 nm from the nanoparticle center. Thus, the measuredvalues of rshell yield rc = rcore + rshell ≈ 6.4 nm, which is inexcellent agreement with the scaling predictions in theliterature. Furthermore, eq 1 predicts that the shell thicknessis independent of the degree of polymerization of the brush, N.For this reason, rshell is expected to be relatively similar for boththe Fe3O4-27K and Fe3O4-35K nanocomposite systems. Inaddition, the Gaussian behavior (i.e., ν = 0.5) of the chains inthe SDPB region is in excellent agreement with themeasurements performed by Choi et al. of polystyrene-graftedsilica particles.19,20
The fit parameters for the three nanocomposite systems aresummarized in Table 3. The results for the Fe3O4-27K1 and
Fe3O4-27K2 composites demonstrate that the molecular weightof the polymer matrix has little influence on the brush chainconformation, which is good agreement with the SCFT resultsin Figure 3 and a previous study.30 Note that while SCFT doespredict a very subtle compression of the brush as α increasesfrom 1 to 3, this change in polymer density is too small toresolve in our data. Specifically, the differences between rshelland Rg for the Fe3O4-27K1 and Fe3O4-27K2 composites are
both on the order of 0.3 nm, implying that within the accuracyof our measurements, we cannot resolve the small compressionpredicted by SCFT. As expected, Rg is larger for the Fe3O4-35Ksystem due to the larger molecular weight of the brush chains.In agreement with eq 1, rshell remains relatively constant as themolecular weight of the brush varies. To the best of ourknowledge, these data represent the first direct measurement ofthe CPB and SDPB regions of highly grafted nanoparticles.
■ SUMMARYIn summary, we have conducted small-angle neutron scattering(SANS) measurements of poly(methyl methacrylate)-function-alized (PMMA) Fe3O4 nanospheres within a deuteratedPMMA matrix. Unlike previous measurements that relied oninferring the structure of the polymer brush using dynamic lightscattering (DLS)17,18 or electron microscopy,20,19 the SANSmeasurements are able to directly probe the concentratedpolymer brush (CPB) and semidilute polymer brush (SDPB)regions of the grafted polymer chains. The results of thesemeasurements are in good agreement with the scalingarguments presented by Ohno et al.,17 the DLS results fromboth Ohno et al. and Dukes et al.,18 as well as measurements byelectron microscopy by Choi et al.20,19 Self-consistent fieldtheory (SCFT) calculations underestimate chain stretching inthe CPB region of the brush, although they give an approximatepicture of the chain conformation in our nanocompositesystems. On the other hand, SCFT accurately predicts thepolymer chain conformation in the SDPB region. An openproblem going forward is determing how best to connectexperimental grafting densities with reduced grafting densitiesin SCFT to obtain accurate brush density profiles and moreaccurate measures of brush chain conformation.We have extended the small-angle scattering models in the
literature28,29 to describe scattering from a highly graftednanoparticle with grafted chains that are not assumed to obeyGaussian statistics. In this model, the conformation of the brushchains away from the nanoparticle surface is described by anexcluded volume parameter ν. For an ideal chain ν = 1/2,whereas ν = 1/3 and ν = 3/5 for collapsed and swollen coils,respectively. Fits to our SANS data yield values of ν near 1/2,indicating that the brush chains behave as ideal random walksin the SDPB region of the brush when in a homopolymer melt.Going forward, the SANS model presented in this article can beextended and applied to more complex systems, such asnonspherical nanoparticles, polymer-grafted nanoparticles ingood or poor solvents, or grafted polyelectrolyte brushes.
■ AUTHOR INFORMATIONCorresponding Author*E-mail: (M.J.A.H.)[email protected] authors declare no competing financial interest.
■ ACKNOWLEDGMENTSThe identification of commercial products or experimentalmethods does not imply endorsement by the National Instituteof Standards and Technology nor does it imply that these arethe best for the purpose. This work utilized neutron scatteringfacilities supported in part by the National Science Foundation(NSF) under Agreement No. DMR-0944772. M.J.A.H.acknowledges support from a National Research Council(NRC) postdoctoral associateship at the NIST Center for
Figure 8. Scattering intensity for Fe3O4-35K. Error bars are smallerthan the plotting symbols.
Table 3. Core−Shell−Chain Model Parameters Determinedfrom Fits to SANS Intensitya
sample ID rshell [nm] Rg [nm] ν
Fe3O4-27K1 3.930 ± 0.008 5.406 ± 0.008 0.4520 ± 0.0003Fe3O4-27K2 4.290 ± 0.006 5.537 ± 0.003 0.4854 ± 0.0004Fe3O4-35K 3.902 ± 0.010 6.239 ± 0.005 0.4997 ± 0.0004
aFor all fits, the nanoparticle radius rcore was fixed at 2.5 nm. Statisticalerrors correspond to 1 standard deviation.
Macromolecules Article
dx.doi.org/10.1021/ma401975a | Macromolecules 2013, 46, 9341−93489347

Neutron Research (NCNR). R.J.C. acknowledges support fromNSF Polymer DMR-0907493 and CEMRI DMR-1120901Programs. Tim Mori (NCSU Libraries) is acknowledged forproviding access to NVIDIA Tesla GPUs. We thank AmalieFrischknecht (Sandia), August Bosse (ExxonMobil), Jeff Meth(DuPont), and Jihoon Choi (Penn) for helpful discussions.
■ REFERENCES(1) Huynh, W. U.; Dittmer, J. J.; Alivisatos, A. P. Science 2002, 295,2425−2427.(2) Green, P. F. Soft Matter 2011, 7, 7914−7926.(3) Kumar, S. K.; Jouault, N.; Benicewicz, B.; Neely, T. Macro-molecules 2013, 46, 3199−3214.(4) Hore, M. J. A.; Frischknecht, A. L.; Composto, R. J. ACS MacroLett 2012, 1, 115−121.(5) Frischknecht, A. L.; Hore, M. J. A.; Ford, J.; Composto, R. J.Macromolecules 2013, 46, 2856−2869.(6) Frischknecht, A. L. J. Chem. Phys. 2008, 128, 224902.(7) Jiao, Y.; Akcora, P. Macromolecules 2012, 45, 3463−3470.(8) Gam, S.; Meth, J. S.; Zane, S. G.; Chi, W.; Wood, B. A.; Seitz, M.E.; Winey, K. I.; Clarke, N.; Composto, R. J. Macromolecules 2011, 44,3494−3501.(9) Gam, S.; Meth, J. S.; Zane, S. G.; Chi, C.; Wood, B. A.; Winey, K.I.; Clarke, N.; Composto, R. J. Soft Matter 2012, 8, 6512−6520.(10) Choi, J.; Hore, M. J. A.; Meth, J. S.; Clarke, N.; Winey, K. I.;Composto, R. J. ACS Macro Lett 2013, 2, 485−490.(11) Alexander, S. J. Phys. (Paris) 1977, 38, 983−987.(12) de Gennes, P. G. J. Phys. (Paris) 1976, 37, 1445−1452.(13) Daoud, M.; Cotton, J. P. J. Phys. (Paris) 1982, 43, 531−538.(14) Zhulina, E. B.; Birshtein, T. M.; Borisov, O. V. Eur. Phys. J. E2006, 20, 243−256.(15) Laradji, M. Europhys. Lett. 2002, 60, 594−600.(16) Laradji, M. J. Chem. Phys. 2004, 121, 1591.(17) Ohno, K.; Morinaga, T.; Takeno, S.; Tsujii, Y.; Fukuda, T.Macromolecules 2007, 40, 9143−9150.(18) Dukes, D.; Li, Y.; Lewis, S.; Benicewicz, B.; Schadler, L.; Kumar,S. K. Macromolecules 2010, 43, 1564−1570.(19) Choi, J.; Dong, H.; Matyjaszewski, K.; Bockstaller, M. R. J. Am.Chem. Soc. 2010, 132, 12537−12539.(20) Choi, J.; Hui, C. M.; Schmitt, M.; Pietrasik, J.; Margel, S.;Matyjaszewski, K.; Bockstaller, M. R. Langmuir 2013, 29, 6452−6459.(21) Kim, J. U.; Matsen, M. W. Macromolecules 2008, 41, 4435−4443.(22) Dan, N.; Tirrell, M. Macromolecules 1992, 25, 2890−2895.(23) Trombly, D. M.; Ganesan, V. J. Chem. Phys. 2010, 133, 154904.(24) Xu, J.; Qiu, F.; Zhang, H.; Yang, Y. J. Polym. Sci. B: Polym. Phys.2006, 44, 2811−2820.(25) Chevigny, C.; Gigmes, D.; Bertin, D.; Jestin, J.; Boue, F. SoftMatter 2009, 5, 3741−3753.(26) Chevigny, C.; Jestin, J.; Gigmes, D.; Schweins, R.; Di-Cola, E.;Dalmas, F.; Bertin, D.; Boue, F. Macromolecules 2010, 43, 4833−4837.(27) Chevigny, C.; Dalmas, F.; Di Cola, E.; Gigmes, D.; Bertin, D.;Boue, F.; Jestin, J. Macromolecules 2011, 44, 122−133.(28) Pedersen, J. S.; Gerstenberg, M. C. Macromolecules 1996, 29,1363−1365.(29) Pedersen, J. S. Adv. Colloid Interface Sci. 1997, 70, 171−210.(30) Vogiatzis, G. G.; Theodorou, D. N. Macromolecules 2013, 46,4670−4683.(31) Robbes, A. S.; Cousin, F.; Meneau, F.; Dalmas, F.; Schweins, R.;Gigmes, D.; Jestina, J. Macromolecules 2012, 45, 9220−9231.(32) Robbes, A. S.; Cousin, F.; Meneau, F.; Chevigny, C.; Gigmes,D.; Fresnais, J.; Schweins, R.; Jestin, J. Soft Matter 2012, 8, 3407−3418.(33) Chantawansri, T. L.; Hur, S.-M.; García-Cervera, C. J.;Ceniceros, H. D.; Fredrickson, G. H. J. Chem. Phys. 2011, 134, 244905.(34) Fredrickson, G. H. The Equilibrium Theory of InhomogeneousPolymers; Oxford University Press: New York, 2006.(35) Ceniceros, H. D.; Fredrickson, G. H. Multiscale Model. Simul.2004, 3, 452.
(36) Hore, M. J. A.; Composto, R. J.Macromolecules 2012, 45, 6078−6086.(37) Schmid, F.; Muller, M. Macromolecules 1995, 28, 8639−8645.(38) Meth, J. S.; Lustig, S. R. Polymer 2010, 51, 4259−4266.(39) Xu, C.; Ohno, K.; Ladmiral, V.; Composto, R. J. Polymer 2008,49, 3568−3577.(40) Ohno, K.; Morinaga, T.; Koh, K.; Tsujii, Y.; Fukuda, T.Macromolecules 2005, 38, 2137−2142.(41) Hammouda, B. Adv. Polym. Sci. 1993, 106, 87−133.(42) Krycka, K. L.; Borchers, J. A.; Booth, R. A.; Hogg, C. R.; Ijiri, Y.;Chen, W. C.; Watson, S. M.; Laver, M.; Gentile, T. R.; Harris, S.;Dedon, L. R.; Rhyne, J. J.; Majetich, S. A. J. Appl. Phys. 2010, 107,09B525.(43) Zeroni, I.; Lodge, T. P. Macromolecules 2008, 41, 1050−1052.
Macromolecules Article
dx.doi.org/10.1021/ma401975a | Macromolecules 2013, 46, 9341−93489348
Related Documents