DIRECT INTERACTION WITH AND ACTIVATION OF p53 BY SMAR1 RETARDS CELL-CYCLE PROGRESSION AT G 2 /M PHASE AND DELAYS TUMOR GROWTH IN MICE Ruchika KAUL, Sujoy MUKHERJEE, Farid AHMED, Manoj Kumar BHAT, Rishiraj CHHIPA, Sanjeev GALANDE and Samit CHATTOPADHYAY * National Center for Cell Science, Pune University Campus, Pune, India The tumor-suppressor p53 is a multifunctional protein mainly responsible for maintaining genomic integrity. p53 induces its tumor-suppressor activity by either causing cell- cycle arrest (G 1 /S or G 2 /M) or inducing cells to undergo apoptosis. This function of wild-type p53 as “guardian of the genome” is presumably achieved by forming molecular com- plexes with different DNA targets as well as by interacting with a number of cellular proteins, e.g., Mdm2, Gadd45, p21, 14-3-3, Bax and Apaf-1. Upon activation, p53 activates p21, which in turn controls the cell cycle by regulating G 1 or G 2 checkpoints. Here, we report SMAR1 as one such p53-inter- acting protein that is involved in delaying tumor progression in vivo as well as in regulating the cell cycle. SMAR1 is a newly identified MARBP involved in chromatin-mediated gene reg- ulation. The SMAR1 gene encodes at least 2 alternatively spliced variants: SMAR1 L (the full-length form) and SMAR1 S (the shorter form). We report that expression of SMAR1 S , but not of SMAR1 L , mRNA was decreased in most of the human cell lines examined, suggesting selective silencing of SMAR1 S . Overexpression of SMAR1 S in mouse melanoma cells (B16F1) and their subsequent injection in C57BL/6 mice delays tumor growth. Exogenous SMAR1 S causes significant retardation of B16F1 cells in the G 2 /M phase of the cell cycle compared to SMAR1 L . SMAR1 S activates p53-mediated re- porter gene expression in mouse melanoma cells, breast cancer cells (MCF-7) and p53 null cells (K562), followed by activation of its downstream effector, p21. We further dem- onstrate that SMAR1 physically interacts and colocalizes with p53. These data together suggest that SMAR1 is the only known MARBP that delays tumor progression via direct activation and interaction with tumor-suppressor p53. © 2002 Wiley-Liss, Inc. Key words: SMAR1; matrix attachment region; p53; p21; G 2 /M arrest The p53 tumor-suppressor protein is a critical regulator of the cell cycle and genomic stability. Besides mediating DNA damage responses by modulating cellular transcription, p53 exhibits mul- tifunctional roles that directly implicate it as a major control element in maintaining the integrity of the genetic information of the cell. 1 In response to genotoxic stress, p53 is activated and in turn regulates the expression of its target genes involved in cell growth arrest and apoptosis. 2 In normal mammalian cells, p53 is associated with the NM, and this association is enhanced in re- sponse to DNA damage. 3 The NM, a nonchromatin nuclear substructure, is the site of recombination, replication, repair and transcription. 4 The NM is the binding site for MARs. These are a class of cis-regulatory elements, typically representing 200 –300 bp, AT-rich DNA se- quences and occurring at an average of 1 for every 30 kb of eukaryotic DNA. 5–9 MARs possess high affinity to the isolated NM. 10 –15 They are often closely associated with transcriptional promoters and enhancers of several genes 11,14 –17 and are well studied in the IgH enhancer 9,18 as well as the antigen receptor gene loci. 19 MARs are thought to tether chromatin onto the NM and, therefore, to organize genomic DNA into topologically indepen- dent loop domains that are implicated in transcription, replication, repair, recombination, demethylation and chromatin accessibil- ity. 20 –23 MARBPs, such as Bright, Cux, SATB1, Ku and PARP, have attracted attention due to their diverse roles ranging from regulation of chromatin structure to transcription to cell-cycle progression to specifying cell fate during cell development and differentiation. 24 –28 Altered expression of several MARBPs has also been implicated in cancers. 29,30 SMAR1, a recently identified MARBP, was isolated from double-positive mouse thymocytes. 31 It specifically binds to a putative MAR (MAR), a DNase I-hy- persensitive site located 400 bp upstream of the transcriptional enhancer (E) at the T-cell receptor locus. 31–33 Using the 170 bp MAR as a probe to screen a DP thymocyte expression library, both SMAR1 L and SMAR1 S were cloned. 31 SMAR1 exists in 3 alternatively spliced forms: SMAR1 L ; SMAR1 S , with deletion of 39 amino acids in the N terminus; and BANP, which is the same as SMAR1 S except that it has 9 additional nucleotides in the C terminus. The SMAR1 gene maps to the distal portion of mouse chromosome 8 at a distance of 111.8 cM, 31 and its human coun- terpart maps to the 16q24 subregion. The human genomic se- quence of SMAR1 so far exists in at least 6 exons spanning 200 kb. 34 In the present study, we demonstrate that SMAR1 S is down- regulated in various tumor cell lines. Ectopic expression of SMAR1 S in mouse melanoma cells and their subsequent injection in mice delays tumor progression. SMAR1-overexpressing cells exhibit slower growth compared to control cells. Overexpression of the alternatively spliced form (SMAR1 S ) also causes retardation of mouse melanoma cells in the G 2 /M phase of the cell cycle. Here, we report that p53, upon direct interaction with SMAR1, is activated and in turn activates p21. Thus, activation of p53 and its downstream effector, p21, by SMAR1 is responsible for the ob- served G 2 /M cell-cycle retardation and delay in tumor progression. Abbreviations: BANP, BTG3 associated nuclear protein; CAT, chlor- amphenicol acetyltransferase; Cdk, cyclin-dependent kinase; CY3, indo- carbocyanin; DTT, dithiothreitol; EGFP, enhanced green fluorescent pro- tein; GFP, green fluorescent protein; HA, hemaglutanin antigen; HRP, horseradish peroxidase; MAb, monoclonal antibody; MAR, matrix attach- ment region; MARBP, matrix attachment region binding protein; NCCS, National Center for Cell Science; NM, nuclear matrix; PARP, poly(ADP- ribose)polymerase; PI, propidium iodide; SMAR1, scaffold/matrix attach- ment region binding protein-1; SMAR1 L , full-length form; SMAR1 S , short form; TST, 20 mM TRIS-HCl (pH 7.6), 0.5 M NaCl and 0.05% Tween-20. Grant sponsor: Department of Biotechnology (India); Grant sponsor: Department of Science and Technology (India). S. Mukherjee is now deceased. *Correspondence to: National Center for Cell Science, Pune University Campus, Ganeshkhind, Pune 411007, India. Fax: 91-20-569-2259. E-mail: [email protected] Received 10 April 2002; Revised 9 September 2002; Accepted 18 October 2002 DOI 10.1002/ijc.10881 Int. J. Cancer: 103, 606 – 615 (2003) © 2002 Wiley-Liss, Inc. Publication of the International Union Against Cancer

Welcome message from author
This document is posted to help you gain knowledge. Please leave a comment to let me know what you think about it! Share it to your friends and learn new things together.
Transcript
DIRECT INTERACTION WITH AND ACTIVATION OF p53 BY SMAR1 RETARDSCELL-CYCLE PROGRESSION AT G2/M PHASE AND DELAYS TUMOR GROWTHIN MICERuchika KAUL, Sujoy MUKHERJEE, Farid AHMED, Manoj Kumar BHAT, Rishiraj CHHIPA, Sanjeev GALANDE andSamit CHATTOPADHYAY*
National Center for Cell Science, Pune University Campus, Pune, India
The tumor-suppressor p53 is a multifunctional proteinmainly responsible for maintaining genomic integrity. p53induces its tumor-suppressor activity by either causing cell-cycle arrest (G1/S or G2/M) or inducing cells to undergoapoptosis. This function of wild-type p53 as “guardian of thegenome” is presumably achieved by forming molecular com-plexes with different DNA targets as well as by interactingwith a number of cellular proteins, e.g., Mdm2, Gadd45, p21,14-3-3�, Bax and Apaf-1. Upon activation, p53 activates p21,which in turn controls the cell cycle by regulating G1 or G2checkpoints. Here, we report SMAR1 as one such p53-inter-acting protein that is involved in delaying tumor progressionin vivo as well as in regulating the cell cycle. SMAR1 is a newlyidentified MARBP involved in chromatin-mediated gene reg-ulation. The SMAR1 gene encodes at least 2 alternativelyspliced variants: SMAR1L (the full-length form) and SMAR1S
(the shorter form). We report that expression of SMAR1S,but not of SMAR1L, mRNA was decreased in most of thehuman cell lines examined, suggesting selective silencing ofSMAR1S. Overexpression of SMAR1S in mouse melanomacells (B16F1) and their subsequent injection in C57BL/6 micedelays tumor growth. Exogenous SMAR1S causes significantretardation of B16F1 cells in the G2/M phase of the cell cyclecompared to SMAR1L. SMAR1S activates p53-mediated re-porter gene expression in mouse melanoma cells, breastcancer cells (MCF-7) and p53 null cells (K562), followed byactivation of its downstream effector, p21. We further dem-onstrate that SMAR1 physically interacts and colocalizeswith p53. These data together suggest that SMAR1 is theonly known MARBP that delays tumor progression via directactivation and interaction with tumor-suppressor p53.© 2002 Wiley-Liss, Inc.
Key words: SMAR1; matrix attachment region; p53; p21; G2/Marrest
The p53 tumor-suppressor protein is a critical regulator of thecell cycle and genomic stability. Besides mediating DNA damageresponses by modulating cellular transcription, p53 exhibits mul-tifunctional roles that directly implicate it as a major controlelement in maintaining the integrity of the genetic information ofthe cell.1 In response to genotoxic stress, p53 is activated and inturn regulates the expression of its target genes involved in cellgrowth arrest and apoptosis.2 In normal mammalian cells, p53 isassociated with the NM, and this association is enhanced in re-sponse to DNA damage.3
The NM, a nonchromatin nuclear substructure, is the site ofrecombination, replication, repair and transcription.4 The NM isthe binding site for MARs. These are a class of cis-regulatoryelements, typically representing 200–300 bp, AT-rich DNA se-quences and occurring at an average of 1 for every 30 kb ofeukaryotic DNA.5–9 MARs possess high affinity to the isolatedNM.10–15 They are often closely associated with transcriptionalpromoters and enhancers of several genes11,14–17 and are wellstudied in the IgH enhancer9,18 as well as the antigen receptor geneloci.19 MARs are thought to tether chromatin onto the NM and,therefore, to organize genomic DNA into topologically indepen-dent loop domains that are implicated in transcription, replication,repair, recombination, demethylation and chromatin accessibil-ity.20–23 MARBPs, such as Bright, Cux, SATB1, Ku and PARP,have attracted attention due to their diverse roles ranging from
regulation of chromatin structure to transcription to cell-cycleprogression to specifying cell fate during cell development anddifferentiation.24–28 Altered expression of several MARBPs hasalso been implicated in cancers.29,30 SMAR1, a recently identifiedMARBP, was isolated from double-positive mouse thymocytes.31
It specifically binds to a putative MAR (MAR�), a DNase I-hy-persensitive site located 400 bp upstream of the transcriptionalenhancer (E�) at the T-cell receptor � locus.31–33 Using the 170 bpMAR� as a probe to screen a DP thymocyte expression library,both SMAR1L and SMAR1S were cloned.31 SMAR1 exists in 3alternatively spliced forms: SMAR1L; SMAR1S, with deletion of39 amino acids in the N terminus; and BANP, which is the sameas SMAR1S except that it has 9 additional nucleotides in the Cterminus. The SMAR1 gene maps to the distal portion of mousechromosome 8 at a distance of 111.8 cM,31 and its human coun-terpart maps to the 16q24 subregion. The human genomic se-quence of SMAR1 so far exists in at least 6 exons spanning 200kb.34
In the present study, we demonstrate that SMAR1S is down-regulated in various tumor cell lines. Ectopic expression ofSMAR1S in mouse melanoma cells and their subsequent injectionin mice delays tumor progression. SMAR1-overexpressing cellsexhibit slower growth compared to control cells. Overexpressionof the alternatively spliced form (SMAR1S) also causes retardationof mouse melanoma cells in the G2/M phase of the cell cycle.Here, we report that p53, upon direct interaction with SMAR1, isactivated and in turn activates p21. Thus, activation of p53 and itsdownstream effector, p21, by SMAR1 is responsible for the ob-served G2/M cell-cycle retardation and delay in tumor progression.
Abbreviations: BANP, BTG3 associated nuclear protein; CAT, chlor-amphenicol acetyltransferase; Cdk, cyclin-dependent kinase; CY3, indo-carbocyanin; DTT, dithiothreitol; EGFP, enhanced green fluorescent pro-tein; GFP, green fluorescent protein; HA, hemaglutanin antigen; HRP,horseradish peroxidase; MAb, monoclonal antibody; MAR, matrix attach-ment region; MARBP, matrix attachment region binding protein; NCCS,National Center for Cell Science; NM, nuclear matrix; PARP, poly(ADP-ribose)polymerase; PI, propidium iodide; SMAR1, scaffold/matrix attach-ment region binding protein-1; SMAR1L, full-length form; SMAR1S, shortform; TST, 20 mM TRIS-HCl (pH 7.6), 0.5 M NaCl and 0.05% Tween-20.
Grant sponsor: Department of Biotechnology (India); Grant sponsor:Department of Science and Technology (India).
S. Mukherjee is now deceased.
*Correspondence to: National Center for Cell Science, Pune UniversityCampus, Ganeshkhind, Pune 411007, India. Fax: �91-20-569-2259.E-mail: [email protected]
Received 10 April 2002; Revised 9 September 2002; Accepted 18October 2002
DOI 10.1002/ijc.10881
Int. J. Cancer: 103, 606–615 (2003)© 2002 Wiley-Liss, Inc.
Publication of the International Union Against Cancer
MATERIAL AND METHODS
cDNA cloningThe 2.1 and 1.9 kb XhoI-EcoRI fragments of the SMAR1L and
SMAR1S cDNAs, respectively, were cloned in pBK-CMV (Strat-agene, La Jolla, CA). The pG13CAT and pWWPCAT (p21CAT)vectors were gifts from Dr. B. Vogelstein (Johns Hopkins Univer-sity, Baltimore, MD). SMAR1S and SMAR1L cloned in pBK-CMV were digested with EcoRI-KpnI and cloned into the EcoRI-KpnI site of a p3XFLAG-CMV10 (Sigma, St. Louis, MO)expression vector.
RT-PCR analysisTotal cellular RNA was extracted from different tissues and cell
lines by a 1-step acid guanidine isothiocyanate-phenol methodusing Trizol reagent (GIBCO BRL, Gaithersburg, MD), precipi-tated with ethanol and quantitated by spectrophotometry. TotalRNA (10 �g) was used for each RT-PCR. Two hundred units ofMoloney murine leukemia virus reverse transcriptase (GIBCOBRL) were added in a typical 50 �l reaction (10 �g RNA, 1 �first-strand buffer, 1 mM DTT, 0.125 mM dNTPs, random primersand RNAse H) and incubated for 1 hr at 37°C. The purified cDNAtemplate was amplified using different sets of primers. Primerswere as follows: smar1–7, 5�-gcattgaggccaagctgcaagctc-3�;smar1–8, 5�-cggagttcagggtgatgagtgtgac-3�; m-�-actin-a, 5�-tac-cactggcatcgtgatggact-3�; m-�-actin-b, 5�-tttctgcatcctgtcggcaat-3�;h-�-actin-a, 5�-gtggggcgccccaggcacca-3�; and h-�-actin-b, 5�-ctc-cttaatgtcacgcacgatttc-3�. Both mouse as well as human �-actinwere used as an internal control. PCRs were performed in a 25 �lvolume in which 1 � PCR buffer, 0.2 mM dNTPs, 1.5 mM MgCl2,2.5 U of Taq polymerase and 100 ng of the specific primers wereadded. A brief initial denaturation at 95°C for 2 min was followedby 30 cycles with the following steps: 94°C for 1 min, annealingat 55–65°C for 1 min and extension at 72°C for 1 min. RT-PCRproducts were then separated on a 1.2% agarose gel and visualizedby staining with ethidium bromide. The intensities of the bandscorresponding to the RT-PCR products were quantified using aphosphorimager (Bio-Rad, Hercules, CA) and normalized withrespect to the �-actin product.
Tissues and cell linesTissues from different mouse organs as well as cell lines were
used to monitor the presence of the 2 forms of SMAR1. RT-PCRwas carried out using RNA isolated from mouse thymus, spleen,liver, lung, kidney, brain, intestine and testis as well as fromvarious human and mouse cell lines. The cell lines analyzed wereSKN-MC (neuroblastoma), H9 (lymphoma), HT-1080 (fibrosar-coma), SK-Hep1 (liver), MDA-MB-231 (breast cancer), Daudi(Burkitt’s lymphoma), 293T (human embryonic kidney), SK-Nep1(kidney) and B16F1, obtained from our in-house repository(NCCS, Pune, India). H9 and Daudi were grown in RPMI; HT-1080, SK-Hep1, 293T, MCF-7, SKN-MC and B16F1 were grownin DMEM; and SK-Nep1 was grown in McCoy’s 5A medium. Allcell lines were maintained in their respective media supplementedwith 10% FBS. RT-PCR was also performed with B16F1 cells andcells stably transfected with SMAR1L and SMAR1S. For Westernblot and immunoprecipitation assays, 293 cells were used. Thesewere maintained in DMEM containing 10% FBS. For CAT assays,the K562 (p53–/–) cell line was used, which was maintained inRPMI containing 10% FBS.
Transfection of cultured cells and in vivo gene transferSeventy percent confluent B16F1 cells were transfected in
6-well plates with 1.0 or 2.0 �g of pBK-CMV (control), SMAR1L
and SMAR1S using Lipofectamine 2000 (Life Technologies, Be-thesda, MD). After 48-72 hr, cells were harvested, washed with1 � PBS and counted. Cells (1 to 2 � 105) in 100 �l volume wereinjected s.c. into 6- to 8-week-old C57BL/6 mice. Stable clones ofSMAR1S, SMAR1L and pBK-CMV vector in B16F1 cells weregenerated by lipofectamine-mediated transfection. Followingtransfection, cells were selected by growing in 800 �g/ml of G418,
and single-cell cloning was achieved by limiting dilution. Stablytransfected cells were then injected as described above. Beforeinjection into mice, viable cells were counted by trypan blueexclusion. After 2–3 weeks, mice were killed and tumors weresurgically excised, weighed and measured.
Western blot analysisCell extracts were prepared from B16F1 cells and stable clones
of SMAR1L and SMAR1S in B16F1. Briefly, the cell pellet wasresuspended in 200 �l extraction buffer35 containing 20 mMHEPES (pH 7.9), 0.42 M NaCl, 1.5 mM MgCl2, 0.2 mM EDTA,0.5 mM DTT, 25% glycerol and protease inhibitor cocktail(Roche, Lewes, UK) and incubated on ice for 30 min with inter-mittent mixing. The extract was centrifuged for 20 min at 4°C inan FA 45-30-11 rotor in an Eppendorf 5804R centrifuge at 10,620g.The supernatant was directly used for Western blot analyses.Proteins were separated on a 10% SDS-polyacrylamide gel andtransferred electrophoretically to a Sequi-Blot PVDF membrane(Bio-Rad) in 20 mM sodium phosphate buffer (pH 6.8) as de-scribed.30 The filter was blocked in 5% BSA in TST, washed inTST buffer alone and incubated at room temperature for 1.5 hrwith rabbit polyclonal antibody for GST-SMAR1 at a 1:1,000dilution. The filter was washed in TST and incubated with a1:10,000 dilution of goat antirabbit IgG HRP conjugate. Afterextensive washing in TST, the blot was incubated with SuperSig-nal West Pico Chemiluminescence kit (Pierce, Rockford, IL) re-agents and exposed to XAR film.
Cell growth analysisB16F1 cells and cells stably expressing SMAR1L and SMAR1S
were seeded at a density of 1 � 105/ml in 6-well plates intriplicate. Cells were grown for 24, 48 and 72 hr; harvested; andcounted for viability by trypan blue dye exclusion using a hemo-cytometer.
[3H]-Thymidine incorporation assayB16F1 cells and cells stably expressing either vector, SMAR1L
or SMAR1S, were seeded at 2 � 104/200 �l in each well of96-well plates. Cells were pulsed with 1 �Ci /ml [3H]-thymidinefor 24 and 36 hr and harvested using a semiautomatic cell har-vester (Skatron, Lier, Norway) before counting in a � scintillationcounter (Packard, Meriden, CT). All experiments were performedin triplicate and repeated 3 times.
Colony-forming assayB16F1 cells and cells stably expressing vectors for SMAR1L
and SMAR1S were plated at a seeding density of 1 � 103/ml in 35mm culture dishes; after 3 weeks, cell colonies were stained with2% methylene blue containing 50% ethanol and photographed.
Soft agar assayAliquots of B16F1 cells and cells stably expressing vector,
SMAR1L or SMAR1S (5 � 103), were mixed at 40°C with 0.35 %agarose (DNA grade, GIBCO BRL) in complete medium andgelled at room temperature for 20 min over a previously gelledlayer of 0.5% agarose in complete medium in 6-well plates. Afterincubation for 3 weeks, colonies were photographed either directlyor after staining with 0.005% crystal violet for 24 hr using anOlympus (Tokyo, Japan) microscope and counted.
Flow cytometryB16F1 cells (4 � 105) and SMAR1S or SMAR1L stably trans-
fected B16F1 cells were trypsinized, washed with 1 � PBS andfixed in 70% ice-cold ethanol. After incubating at –20°C for 20min, cells were spun at 180g for 5 min at room temperature.Cells were washed with 1 � PBS, treated with RNase A (75 U/ml)for 30 min at 37°C, washed again in PBS and resuspended in PBScontaining 50 �g/ml PI. After staining with PI, cells were analyzedby FACS Vantage (Becton Dickinson, Mountain View, CA) usingthe ModFit program (Verity Software, Topsham, ME) for cell-cycle profiles. Cells were also analyzed for apoptosis using the
607ACTIVATION AND INTERACTION OF p53 WITH SMAR1
ApoAlert Annexin V-EGFP Apoptosis kit (Clontech, Palo Alto,CA).
CAT assayMCF-7 and B16F1 cells were cultured in DMEM containing
10% FBS, whereas K562 cells were cultured in RPMI containing10% FBS. Cells were seeded at a density of 3 to 4 � 105/plate in35 mm culture plates. After 24 hr, cells were transfected bylipofectamine-mediated transfection with different amounts ofSMAR1L and SMAR1S expression plasmid DNAs (0.1–1.0 �g);0.5 or 0.75 �g of pG13CAT or pWWPCAT; 0.5 �g of p53; and0.2 or 0.5 �g of pGL3 as an internal control. Cells were harvestedafter 24–48 hr following transfection and lysed in 1 � reporterlysis buffer (Promega, Madison, WI). Cells were subjected to 3freeze–thaw cycles, followed by centrifugation at 10,620g at 4°Cfor 10 min. Supernatants were collected and protein concentrationsestimated spectrophotometrically using the Bradford reagent perthe manufacturer’s instructions (Bio-Rad). Luciferase activity wasdetermined, followed by CAT assay. CAT activity was assayed byincubating cell extracts for 4 hr at 37°C in the presence of 1 �Ci(14C)-chloramphenicol (100 mCi/mmol; NEN, Boston, MA) and
100 �g/ml of acetyl CoA (Amersham, Aylesbury, UK) in 0.25 MTRIS-HCl (pH 7.4) in a total reaction volume of 100 �l. CATactivity was normalized with luciferase activity. The reaction wasstopped by adding 1 ml ethyl acetate, and samples were driedovernight and resuspended in 25 �l ethyl acetate. Samples werechromatographed on a thin layer chromatography plate (Whatman,Maidstone, UK) and subjected to phosphorimager (Bio-Rad) scan-ning as well as autoradiography.
Coimmunoprecipitation assays for SMAR1 and p53293 cells were seeded at a density of 4 � 105/ml in a 35 mm
culture dish. After 24 hr, cells were transfected with 3�FLAG-SMAR1S and 3�FLAG-SMAR1L constructs. Forty-eight hoursposttransfection, cells were harvested and washed twice with 1 �PBS. The cell pellet was resuspended in buffer C [10 mM HEPES(pH 7.9), 1.5 mM MgCl2, 420 mM NaCl and protease inhibitorcocktail],36 incubated on ice for 30 min and spun at 10,000 rpm for30 min at 4°C. The supernatant was collected and the proteinconcentration estimated using the Bradford reagent. Protein (50�g) was loaded on 10% SDS-polyacrylamide gel and transferredto a nitrocellulose membrane (Hybond, Amersham). For detection
FIGURE 1 – Schematic representation of SMAR1 and its expression in mouse primary tissues and cell lines. (a) Schematic diagram showingthe alternatively spliced region within 2.0 kb of SMAR1. Arrows correspond to primers used for RT-PCR. Solid bars depict approximate lengthof RT-PCR products corresponding to SMAR1L and SMAR1S. (b) Lane 1, 1 kb DNA ladder; lane 2, 2 alternatively spliced forms of SMAR1in thymus: SMAR1L (444 bp) and SMAR1S (327 bp). (c) RT-PCR analysis of SMAR1 mRNA expression from various organs of mice asindicated by lane designations at the top of the gel. Total RNA was isolated and subjected to RT-PCR analysis as discussed in Material andMethods. RT-PCR products from spleen (lane 1), liver (lane 2), lung (lane 3), kidney (lane 4), brain (lane 5), intestine (lane 6) and testis (lane7) were run on a 1.2% agarose gel and visualized by staining with ethidium bromide. Expression SMAR1S was reduced by 42%, 60%, 70% and80% in spleen, brain, intestine and testis, respectively (c, lanes 1, 5, 6 and 7) compared to the highest expression in lung and kidney (lanes 3and 4, respectively). SMAR1L expression was highest in kidney, brain and testis (c, lanes 4, 5 and 7, respectively), whereas in spleen, liver, lungand intestine the expression was decreased by 42%, 50%, 45% and 76%, respectively (lanes 1, 2, 3 and 6). (d) RT-PCR products from SKN-MC(lane 1), H9 (lane 2), HT-1080 (lane 3), SK-Hep1 (lane 4), MDA (lane 5), Daudi (lane 6), 293T (lane 7), SK-Nep1 (lane 8), �4b (lane 9) and4980 (lane 10) were resolved on a 1.2% agarose gel. Expression of SMAR1S was reduced in a majority of the cancer cell lines, e.g., SKN-MC,H9, HT-1080 and SK-Hep1 by 23%, 21%, 37% and 44%, respectively (d, lanes 1–4). About 70% reduction in expression of SMAR1S wasobserved for MDA, 293T and SK-Nep1 (d, lanes 5, 7 and 8, respectively). Compared to SMAR1L, SMAR1S showed 60% reduced expressionin �4b and 4980 cell lines (d, lanes 9 and 10, respectively). �-Actin, SMAR1L and SMAR1S indicate the positions of the respective expectedRT-PCR products.
608 KAUL ET AL.
of p53, anti-p53 (Ab-6; Oncogene Research Products, Manhasset,NY) was used as a primary antibody at a dilution of 1:500, andanti-FLAG M2 antibody (Sigma) was used for the detection ofFLAG-SMAR1S and FLAG-SMAR1L at a dilution of 1:1,000. Thesecondary antibody used was antimouse IgG conjugated to HRP ata dilution of 1:5,000. Signals were detected using the Super SignalChemiluminescent Substrate kit (Pierce). For coimmunoprecipita-tion, 100 �g protein, from the whole-cell extract of 293 cells, werediluted in 500 �l of buffer A [10 mM HEPES (pH 7.9), 1.5 mMMgCl2, 10 mM KCl and protease inhibitor cocktail]36 in 2 separateEppendorf tubes. For preclearing and as isotype control, 1 �l of
mouse IgG2a (Sigma) was added to the extract and incubated at4°C for 1 hr, followed by addition of 10 �l protein A/G Plus beads(Pierce) and incubation at 4°C for 1 hr on a rocker platform.Precleared extracts were incubated either with 5 �l of anti-p53antibody [p53 (Ab-5)] or with 6 �l of anti-FLAG antibody over-night at 4°C on a rocker platform. This was followed by additionof 10 �l of protein A/G Plus beads and incubation for 2 hr at 4°Con a rocker platform. Beads were then washed 3 times in 200 �lof 1 � PBS containing 0.1% NP40 and collected by centrifugationat 1,125g for 3 min at 4°C. The sample immunoprecipitated withanti-FLAG antibody was boiled in 2 � SDS gel loading dye(nonreducing) for 30 sec at 95°C, run on a 10% gel, immunoblot-ted and detected with anti-p53 antibody (Ab-6) as described.36
Samples immunoprecipitated with anti-p53 antibody (Ab-5) wereboiled in 2 � SDS gel loading dye (reducing) for 5 min at 95°C,run on a 10% gel, immunoblotted and detected with anti-FLAGantibody.
Confocal microscopyCells from mouse melanoma (B16F1) or the breast cancer cell
line (MDA-MB-231) were plated at 2 � 105/ml on coverslips in 35mm culture dishes. After 24 hr, B16F1 cells were transfected with1.0 �g each of pEGFP-C3-SMAR1L, pEGFP-C3-SMAR1S andcontrol pEGFP-C3 plasmids using Lipofectamine 2000. Cover-slips were removed after 48 hr and processed for confocal micros-copy. For immunofluorescence studies, MDA-MB-231 cellsgrown on coverslips were transfected with 1.0 �g of FLAG-SMAR1S and HA-SMAR1L fusion constructs. After 48 hr, cellswere washed with PBS and fixed with 2.5% paraformaldehydemade in 200 mM HEPES buffer for 15 min at room temperature.Cells were washed for 5 min in PBS, permeabilized with 0.1%Triton X-100 in PBS for 5 min and blocked in 10% FBS in PBSfor 1 hr. For endogenous p53 immunostaining, the primary anti-body (anti-p53; Santa Cruz Biotechnology, Santa Cruz, CA) wasdiluted in blocking buffer at 1:100 dilution. For costaining withanti-FLAG (Sigma) and anti-HA (Boehringer-Mannheim, Mann-heim, Germany), primary antibodies were diluted in blockingbuffer at 1:50 dilution. Secondary antibodies, FITC-conjugatedantigoat immunoglobulin (Santa Cruz) and CY3-conjugated anti-mouse immunoglobulin (Amersham) were used at a 1:200 and1:400 dilution, respectively. When indicated, specimens were an-alyzed with a confocal laser microscope (LSN 510, version 2.01;Zeiss, Thornwood, NY) equipped with filters for fluorescein andCY3 epifluorescence. For excitation, 488 and 543 nm laser linesand for emission 505–530 nm band-pass and 560 nm long-passfilters were used.
Statistical evaluationStatistical analysis was conducted with the SigmaStat 2.03 pro-
gram (SPSS, Inc.) using Student’s t-test and 1-way ANOVA. The� level used for comparisons was � � 0.05.
RESULTS
Differential expression of alternatively spliced forms of SMAR1in different tissues and cell lines
In the present study, by RT-PCR assays, we investigated theexpression of alternatively spliced forms of SMAR1 in differenttissues. RNA was isolated from mouse thymus, spleen, liver, lung,kidney, brain, intestine, testis and thymus. Employing a single-tube RT-PCR assay, both alternatively spliced forms of SMAR1were amplified. SMAR1L is 444 bp and SMAR1S is 327 bp in size(Fig. 1a,b). By densitometric analysis, we observed that expressionof SMAR1S was higher in spleen, liver, lung and kidney (Fig. 1c,lanes 1–4, respectively). SMAR1S expression was reduced inspleen, brain, intestine and testis (Fig. 1c, lanes 1, 5–7, respec-tively) compared to the highest expression observed in lung andkidney (Fig. 1c, lanes 3 and 4, respectively). Expression ofSMAR1L was highest in kidney, brain and testis (Fig. 1c, lanes 4,5 and 7, respectively), whereas it was decreased in spleen, liver,lung and intestine (Fig. 1c, lanes 1–3 and 6, respectively). The
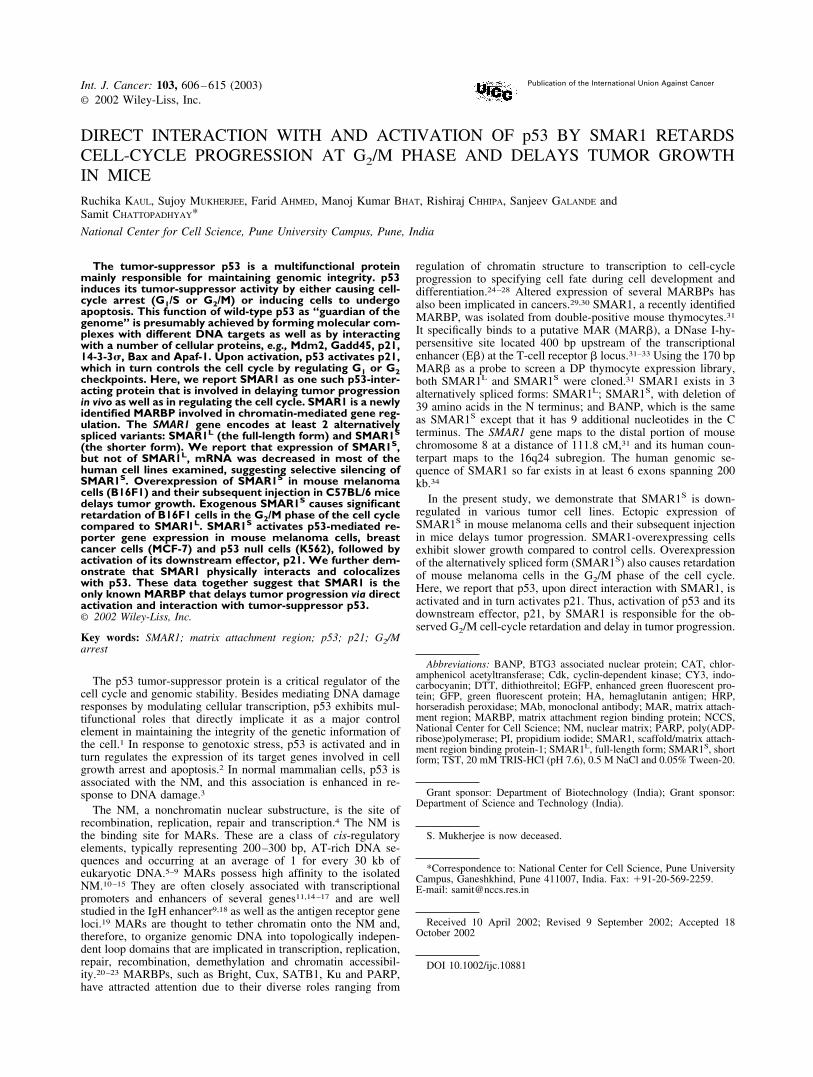
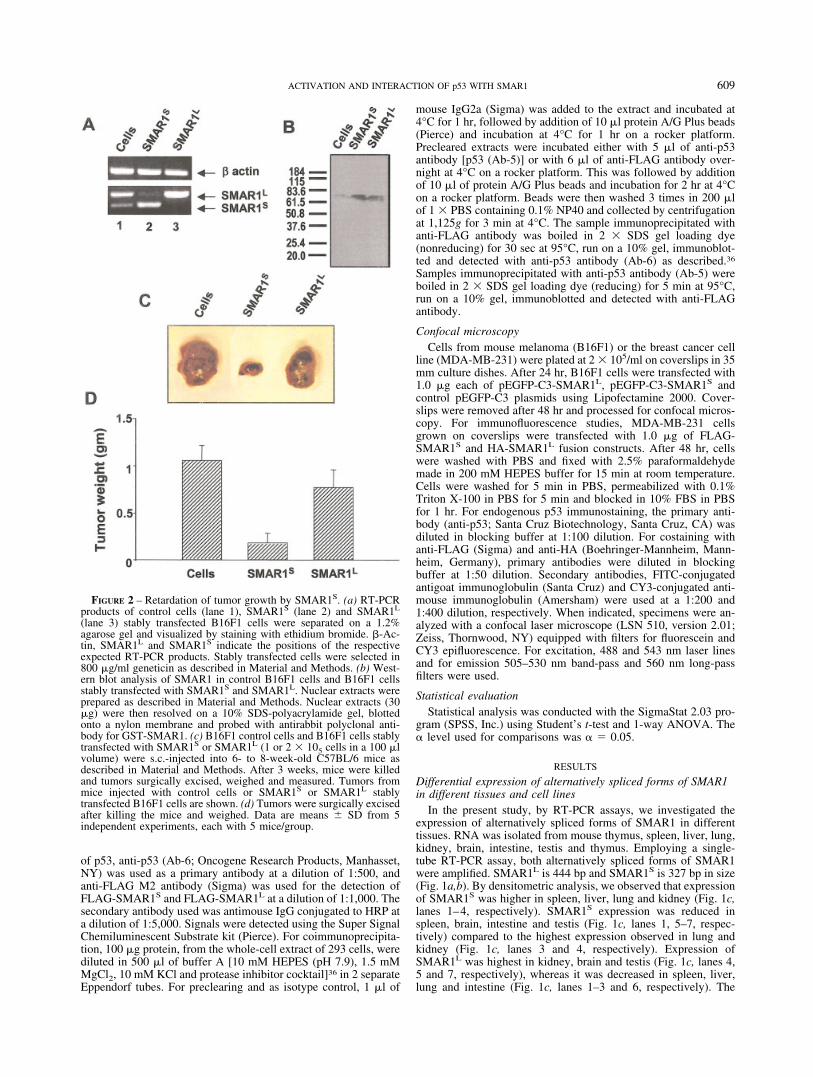
FIGURE 2 – Retardation of tumor growth by SMAR1S. (a) RT-PCRproducts of control cells (lane 1), SMAR1S (lane 2) and SMAR1L
(lane 3) stably transfected B16F1 cells were separated on a 1.2%agarose gel and visualized by staining with ethidium bromide. �-Ac-tin, SMAR1L and SMAR1S indicate the positions of the respectiveexpected RT-PCR products. Stably transfected cells were selected in800 �g/ml geneticin as described in Material and Methods. (b) West-ern blot analysis of SMAR1 in control B16F1 cells and B16F1 cellsstably transfected with SMAR1S and SMAR1L. Nuclear extracts wereprepared as described in Material and Methods. Nuclear extracts (30�g) were then resolved on a 10% SDS-polyacrylamide gel, blottedonto a nylon membrane and probed with antirabbit polyclonal anti-body for GST-SMAR1. (c) B16F1 control cells and B16F1 cells stablytransfected with SMAR1S or SMAR1L (1 or 2 � 105 cells in a 100 �lvolume) were s.c.-injected into 6- to 8-week-old C57BL/6 mice asdescribed in Material and Methods. After 3 weeks, mice were killedand tumors surgically excised, weighed and measured. Tumors frommice injected with control cells or SMAR1S or SMAR1L stablytransfected B16F1 cells are shown. (d) Tumors were surgically excisedafter killing the mice and weighed. Data are means SD from 5independent experiments, each with 5 mice/group.
609ACTIVATION AND INTERACTION OF p53 WITH SMAR1
actual percentage increase or decrease in expression correspondingto each lane is given in the legend to Figure 1. Thus, the alterna-tively spliced form of SMAR1 is differentially expressed in vari-ous mouse tissues.
Since the expression of other ubiquitous MARBPs, e.g., PARP,the autoantigen Ku70/86, SAF-A and HMG-I(Y), is significantlyelevated in cancer,28,30 expression levels of SMAR1 were com-pared in different tumor cell lines. RT-PCR was carried out usingRNA isolated from various cell lines (Fig. 1d). The highest ex-pression of SMAR1S was observed in Daudi (Fig. 1d, lane 6). Incontrast to this, expression of SMAR1S was reduced in the ma-jority of cancer cell lines, e.g., SKN-MC, H9, HT-1080 andSK-Hep1 (Fig. 1d, lanes 1–4, respectively). About 70% reductionin the expression of SMAR1S was observed for MDA, 293T andSK-Nep1 (Fig. 1d, lanes 5, 7 and 8, respectively). Similarly,expression of the 2 forms of SMAR1 was determined in variousmouse thymoma lines, e.g., 4980 (generated from Rag mutantmice) and �4b (both Rag and p53 mutant). Compared to SMAR1L,SMAR1S showed 60% reduced expression in �4b and 4980 celllines (Fig. 1d, lanes 9 and 10, respectively). These results indicatethat the relative amount of mRNA corresponding to SMAR1S and
SMAR1L varies in different cancer cell lines and that expression ofthe spliced form is defective in a majority of cancer lines.
Ectopic expression of SMAR1S delays tumor growth in miceTo study the functional significance of the alternatively spliced
forms of SMAR1, we separately introduced expression vectorscontaining SMAR1S or SMAR1L, either transiently or stably intoB16F1 cells. Prior to injection into mice, the transcripts of the 2forms of SMAR1 were confirmed in stably expressing B16F1 cellsby RT-PCR assays. Elevated levels of expression of both forms ofSMAR1 are shown in Figure 2a (lanes 1–3). The increased ex-pression of both SMAR1L and SMAR1S forms in the stable clonescompared to control cells was also confirmed by Western blotanalysis (Fig. 2b) using rabbit polyclonal anti-GST-SMAR1 anti-body.
Mock-transfected cells and SMAR1-transfected cells were in-dependently injected s.c. into C57BL/6 mice, and mice weremonitored for tumor development. As shown in Figure 2c, after 15days, SMAR1S tumors grew significantly slower than vector-transfected and SMAR1L tumors. After 3 weeks, the mice werekilled and the tumors measured for size and weight. The average
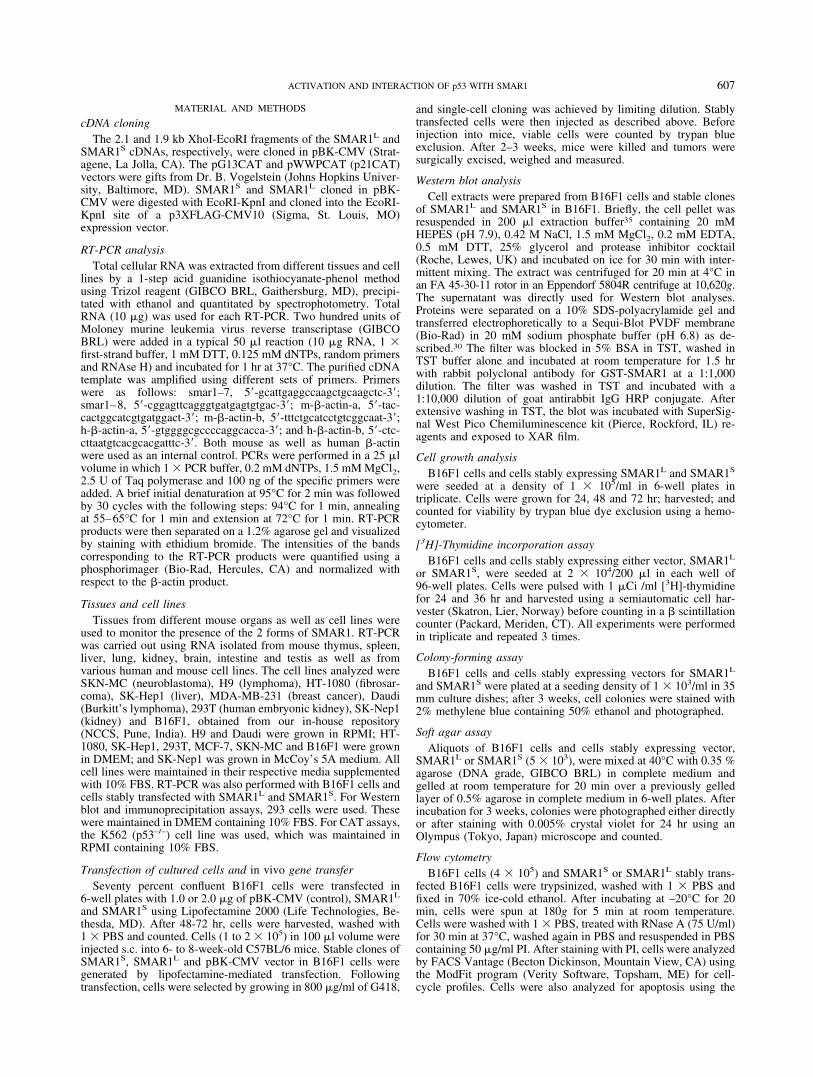
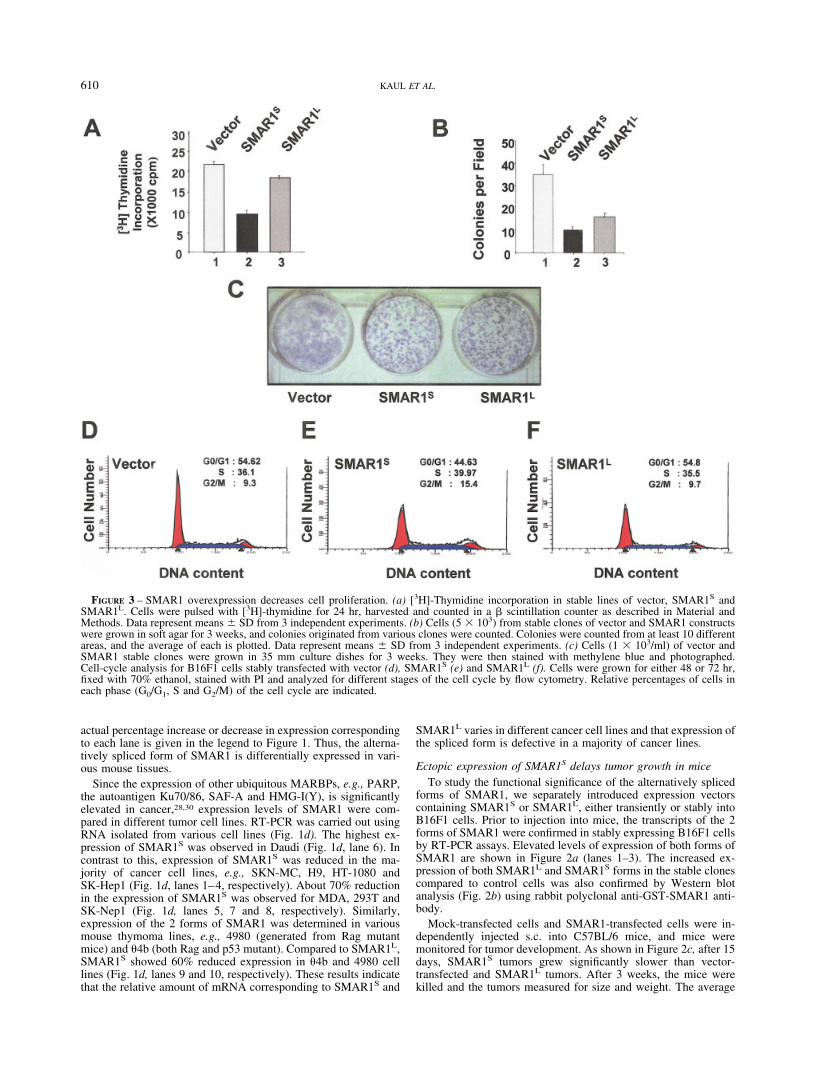
FIGURE 3 – SMAR1 overexpression decreases cell proliferation. (a) [3H]-Thymidine incorporation in stable lines of vector, SMAR1S andSMAR1L. Cells were pulsed with [3H]-thymidine for 24 hr, harvested and counted in a � scintillation counter as described in Material andMethods. Data represent means SD from 3 independent experiments. (b) Cells (5 � 103) from stable clones of vector and SMAR1 constructswere grown in soft agar for 3 weeks, and colonies originated from various clones were counted. Colonies were counted from at least 10 differentareas, and the average of each is plotted. Data represent means SD from 3 independent experiments. (c) Cells (1 � 103/ml) of vector andSMAR1 stable clones were grown in 35 mm culture dishes for 3 weeks. They were then stained with methylene blue and photographed.Cell-cycle analysis for B16F1 cells stably transfected with vector (d), SMAR1S (e) and SMAR1L (f). Cells were grown for either 48 or 72 hr,fixed with 70% ethanol, stained with PI and analyzed for different stages of the cell cycle by flow cytometry. Relative percentages of cells ineach phase (G0/G1, S and G2/M) of the cell cycle are indicated.
610 KAUL ET AL.
weight of tumors from control mice was 1.1 g, whereas that ofSMAR1S- and SMAR1L-injected mice was 0.2 and 0.6 g, respec-tively. SMAR1S- and SMAR1L-injected mice showed reducedtumor size, and the weight was reduced by 5- and 2- fold, respec-tively, compared to controls (Fig. 2c,d, respectively). The reduc-tion in tumor weight was significant in SMAR1S-injected mice(p 0.001) but not in SMAR1L-injected mice (p � 0.059). Tumorweights are means SD of 5 independent experiments using 5individual clones, each experiment being carried out with 5 mice/group (Fig. 2d). The striking functional difference between the 2forms of SMAR1 suggests that, compared to SMAR1L, SMAR1S
causes significant delay in tumor growth in mice.
SMAR1-overexpressing cells exhibit altered growth kineticsWe monitored the effect of SMAR1 overexpression on the
growth kinetics of mouse melanoma cells. B16F1 cells as well ascells overexpressing SMAR1L and SMAR1S were grown for 24,48 and 72 hr and stained with trypan blue, and the viable cells thatexcluded the dye were counted. Doubling times for SMAR1S- andSMAR1L-overexpressing cells were 1.75 and 1.3 times, respec-tively, more than for control cells (data not shown). Proliferationof SMAR1-overexpressing cells as well as control cells was ana-lyzed by [3H]-thymidine incorporation. Cells were pulsed with[3H]-thymidine for 24 and 36 hr, as described in Material andMethods. After 24 hr, compared to the vector/mock-transfected
cells, [3H]-thymidine incorporation was less by 2-fold in SMAR1S
(p 0.001) and 1.2-fold in SMAR1L (p � 0.007) transfected cells(Fig. 3a).
To determine the cause of the tumor-retarding activity ofSMAR1 in mouse melanoma cells, we performed a colony-form-ing assay of SMAR1-overexpressing cells. At a low seeding den-sity of 1 � 103 cells/ml, as described in Material and Methods,cells were grown for 3 weeks. The number of SMAR1S-transfectedcells was consistently lower than that of SMAR1L or control cells(Fig. 3c). Consistent with the slow growth rate of SMAR1-over-expressing cells, both SMAR1L and SMAR1S cells showed sig-nificant reduction (p 0.001) in the number of soft agar coloniescompared to the control cell line (Fig. 3b). The experiment wasperformed using 5 individual clones from each of the variants ofSMAR1. SMAR1S and SMAR1L cells showed 3.4 and 2.2 times,respectively, fewer colonies than control cells. Our results thusindicate that SMAR1S delays cell growth in melanoma cells.
SMAR1S retards growth of cells in culture by causing G2/Mdelay
We investigated the potential role of SMAR1 in B16F1 cell-cycle regulation. Cell viability and apoptosis were analyzed by
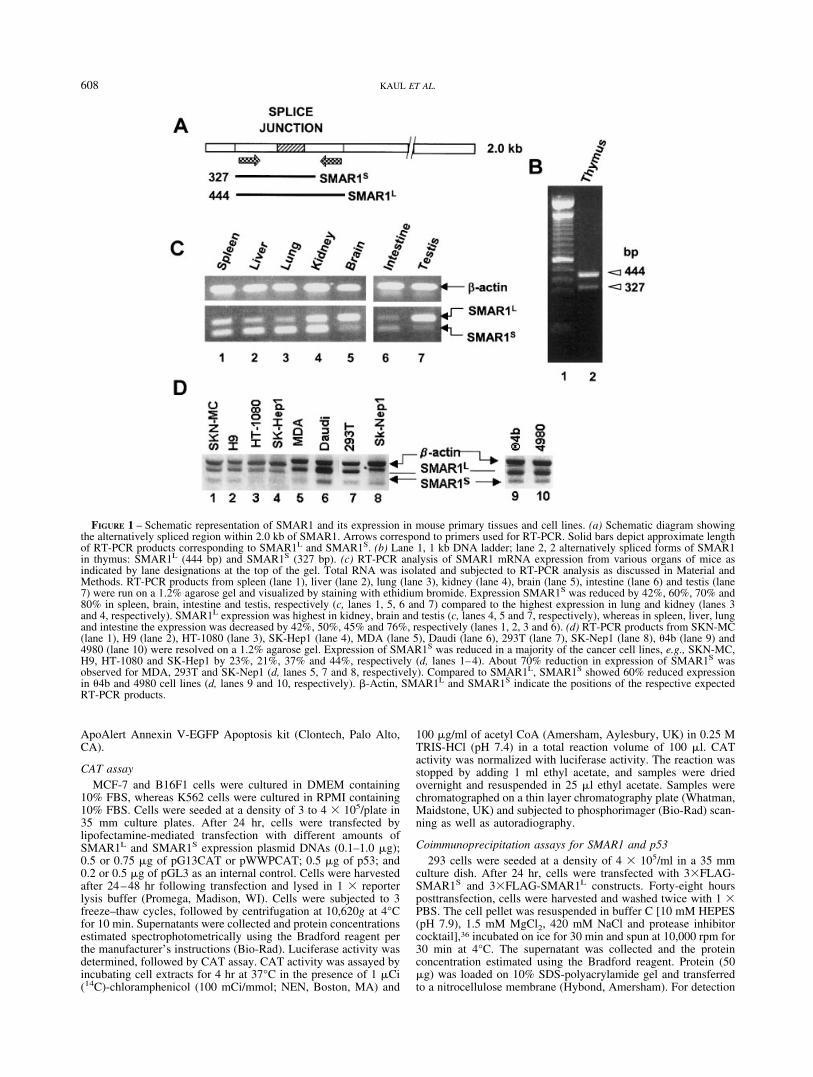
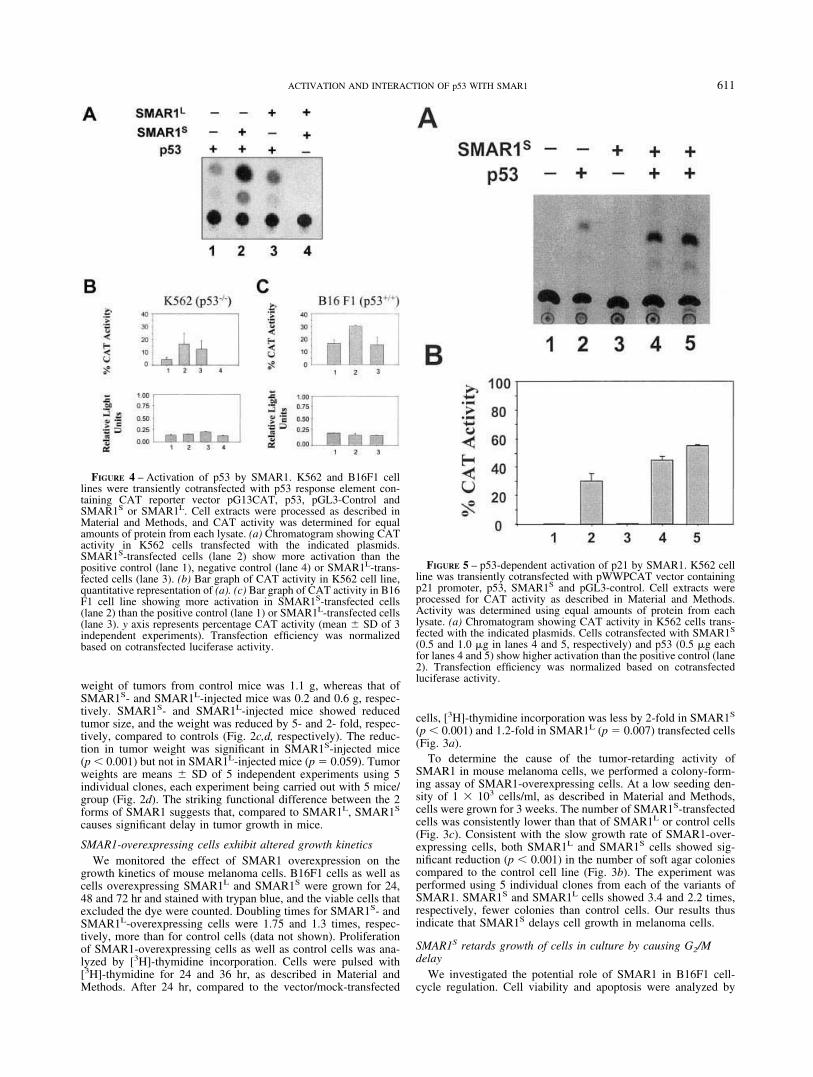
FIGURE 4 – Activation of p53 by SMAR1. K562 and B16F1 celllines were transiently cotransfected with p53 response element con-taining CAT reporter vector pG13CAT, p53, pGL3-Control andSMAR1S or SMAR1L. Cell extracts were processed as described inMaterial and Methods, and CAT activity was determined for equalamounts of protein from each lysate. (a) Chromatogram showing CATactivity in K562 cells transfected with the indicated plasmids.SMAR1S-transfected cells (lane 2) show more activation than thepositive control (lane 1), negative control (lane 4) or SMAR1L-trans-fected cells (lane 3). (b) Bar graph of CAT activity in K562 cell line,quantitative representation of (a). (c) Bar graph of CAT activity in B16F1 cell line showing more activation in SMAR1S-transfected cells(lane 2) than the positive control (lane 1) or SMAR1L-transfected cells(lane 3). y axis represents percentage CAT activity (mean SD of 3independent experiments). Transfection efficiency was normalizedbased on cotransfected luciferase activity.
FIGURE 5 – p53-dependent activation of p21 by SMAR1. K562 cellline was transiently cotransfected with pWWPCAT vector containingp21 promoter, p53, SMAR1S and pGL3-control. Cell extracts wereprocessed for CAT activity as described in Material and Methods.Activity was determined using equal amounts of protein from eachlysate. (a) Chromatogram showing CAT activity in K562 cells trans-fected with the indicated plasmids. Cells cotransfected with SMAR1S
(0.5 and 1.0 �g in lanes 4 and 5, respectively) and p53 (0.5 �g eachfor lanes 4 and 5) show higher activation than the positive control (lane2). Transfection efficiency was normalized based on cotransfectedluciferase activity.
611ACTIVATION AND INTERACTION OF p53 WITH SMAR1
trypan blue exclusion and annexin V-EGFP staining, respectively,of control B16F1 cells and B16F1 cells stably transfected withvector or SMAR1. Cells were grown up to 72 hr, stained andprocessed for FACS analysis. Annexin V staining was negative forapoptosis, indicating that overexpression of SMAR1 did not leadto cell death (data not shown). Cell-cycle analysis by FACS wasperformed using control cells as well as SMAR1-overexpressingcells. After 72 hr, the percentage of either SMAR1L (Fig. 3f) ormock-transfected (Fig. 3d) cells in G2/M phase varied from 9% to10%. In contrast, cells overexpressing SMAR1S (Fig. 3e) showeda significant increase to about 15% in G2/M phase. This suggeststhat upon overexpression of SMAR1S, there is an at least 1.5-foldincrease in the percentage of cells at G2/M phase.
SMAR1 activates p53-mediated reporter gene expressionp53 is a potent tumor-suppressor gene known to mediate cell-
cycle arrest in the G1/S as well as G2/M phases of the cell cycle.29
Since our results clearly demonstrated that SMAR1S delays tumorgrowth in vivo as well as causes G2/M arrest of cells, we investi-gated whether this arrest was mediated via p53. Both SMAR1L andSMAR1S were independently cotransfected at different concentra-tions with a reporter construct containing p53 response element(pG13CAT) and p53-expressing plasmid into B16F1, MCF-7 andp53 null K562 cell lines. In all cell lines, SMAR1 activatedp53-mediated reporter gene expression. In K562 p53–/– cells, com-pared to positive controls, SMAR1S exhibited a 5-fold increase(p � 0.026) in activity, which was significant compared toSMAR1L (p � 0.132) (Fig. 4a,b). However, in B16F1 cells, wherep53 is endogenously expressed, SMAR1S overexpression led to a2-fold (p 0.001) increase in activity compared to controls (Fig.4c). The increase in CAT activity by SMAR1L was not significant(p � 0.534). Similarly, in MCF-7, SMAR1S exhibited more acti-vation of p53-mediated reporter gene expression than either con-trols or SMAR1L cells (data not shown).
p53-mediated activation of p21 by SMAR1The p53 and p21 proteins appear to be essential for maintaining
the G1 and G2 checkpoints of the cell cycle. p21 is activated by p53in response to DNA damage or other stimuli, e.g., cytokines and
cell adhesion events, and during cell growth and differentiationunder both p53-dependent and p53-independent conditions.37
Our studies indicate that SMAR1 arrests cells at the G2/M phaseand activates p53 through direct interaction (Fig. 5). To determinewhether SMAR1 also activates the p53-responsive p21WAF1/Cip1
gene, assays were performed with the p21 promoter-containingCAT reporter system. K562 cells were cotransfected withpWWPCAT and either p53 (Fig. 5, lane 2) or SMAR1 (Fig. 5, lane3) or with both p53 and SMAR1 (Fig. 5, lanes 4, 5). Compared tocells transfected with p53 alone (Fig. 5, lane 2), cells cotransfectedwith p53 and SMAR1 exhibited a 1.5- to 1.8-fold increase (p �0.018 and p � 0.002) (Fig. 5b, lanes 4 and 5, respectively) in CATactivity. Thus, upon simultaneous expression of p53 and SMAR1,p21-mediated reporter gene expression is enhanced significantlycompared to the activation induced by p53 alone.
SMAR1 physically interacts with p53On the basis of the observation that SMAR1 activates p53, we
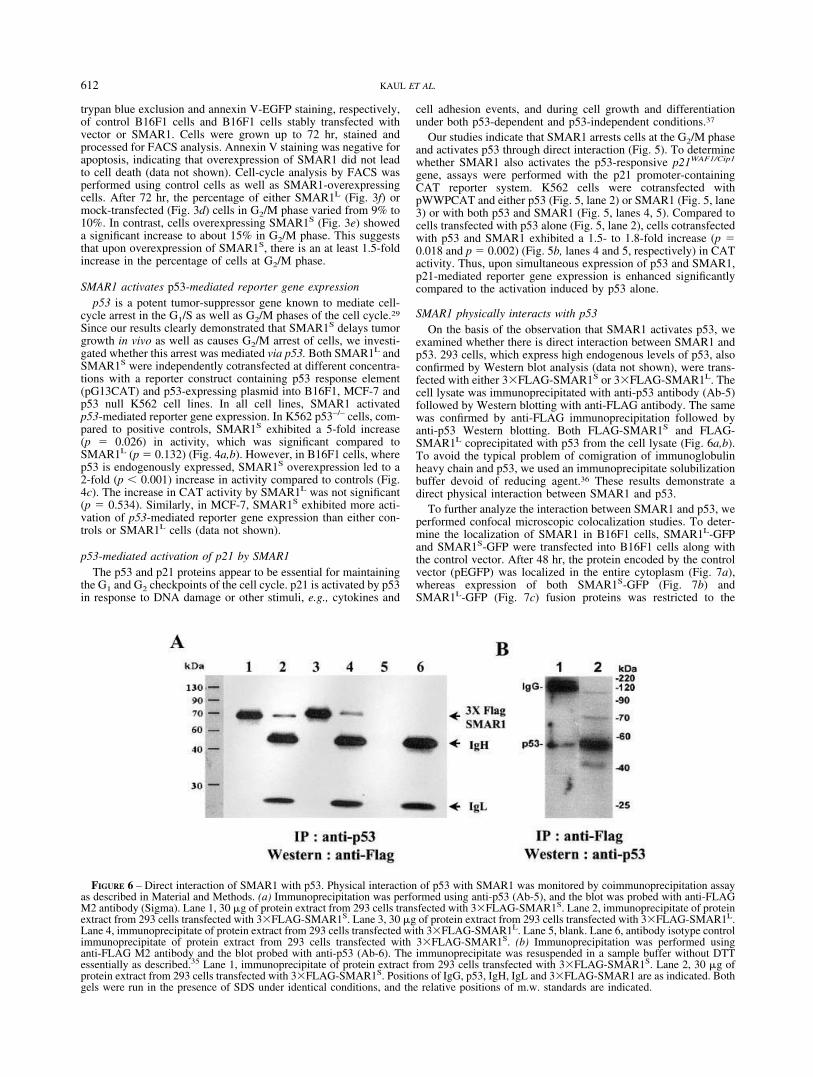
examined whether there is direct interaction between SMAR1 andp53. 293 cells, which express high endogenous levels of p53, alsoconfirmed by Western blot analysis (data not shown), were trans-fected with either 3�FLAG-SMAR1S or 3�FLAG-SMAR1L. Thecell lysate was immunoprecipitated with anti-p53 antibody (Ab-5)followed by Western blotting with anti-FLAG antibody. The samewas confirmed by anti-FLAG immunoprecipitation followed byanti-p53 Western blotting. Both FLAG-SMAR1S and FLAG-SMAR1L coprecipitated with p53 from the cell lysate (Fig. 6a,b).To avoid the typical problem of comigration of immunoglobulinheavy chain and p53, we used an immunoprecipitate solubilizationbuffer devoid of reducing agent.36 These results demonstrate adirect physical interaction between SMAR1 and p53.
To further analyze the interaction between SMAR1 and p53, weperformed confocal microscopic colocalization studies. To deter-mine the localization of SMAR1 in B16F1 cells, SMAR1L-GFPand SMAR1S-GFP were transfected into B16F1 cells along withthe control vector. After 48 hr, the protein encoded by the controlvector (pEGFP) was localized in the entire cytoplasm (Fig. 7a),whereas expression of both SMAR1S-GFP (Fig. 7b) andSMAR1L-GFP (Fig. 7c) fusion proteins was restricted to the
FIGURE 6 – Direct interaction of SMAR1 with p53. Physical interaction of p53 with SMAR1 was monitored by coimmunoprecipitation assayas described in Material and Methods. (a) Immunoprecipitation was performed using anti-p53 (Ab-5), and the blot was probed with anti-FLAGM2 antibody (Sigma). Lane 1, 30 �g of protein extract from 293 cells transfected with 3�FLAG-SMAR1S. Lane 2, immunoprecipitate of proteinextract from 293 cells transfected with 3�FLAG-SMAR1S. Lane 3, 30 �g of protein extract from 293 cells transfected with 3�FLAG-SMAR1L.Lane 4, immunoprecipitate of protein extract from 293 cells transfected with 3�FLAG-SMAR1L. Lane 5, blank. Lane 6, antibody isotype controlimmunoprecipitate of protein extract from 293 cells transfected with 3�FLAG-SMAR1S. (b) Immunoprecipitation was performed usinganti-FLAG M2 antibody and the blot probed with anti-p53 (Ab-6). The immunoprecipitate was resuspended in a sample buffer without DTTessentially as described.35 Lane 1, immunoprecipitate of protein extract from 293 cells transfected with 3�FLAG-SMAR1S. Lane 2, 30 �g ofprotein extract from 293 cells transfected with 3�FLAG-SMAR1S. Positions of IgG, p53, IgH, IgL and 3�FLAG-SMAR1 are as indicated. Bothgels were run in the presence of SDS under identical conditions, and the relative positions of m.w. standards are indicated.
612 KAUL ET AL.
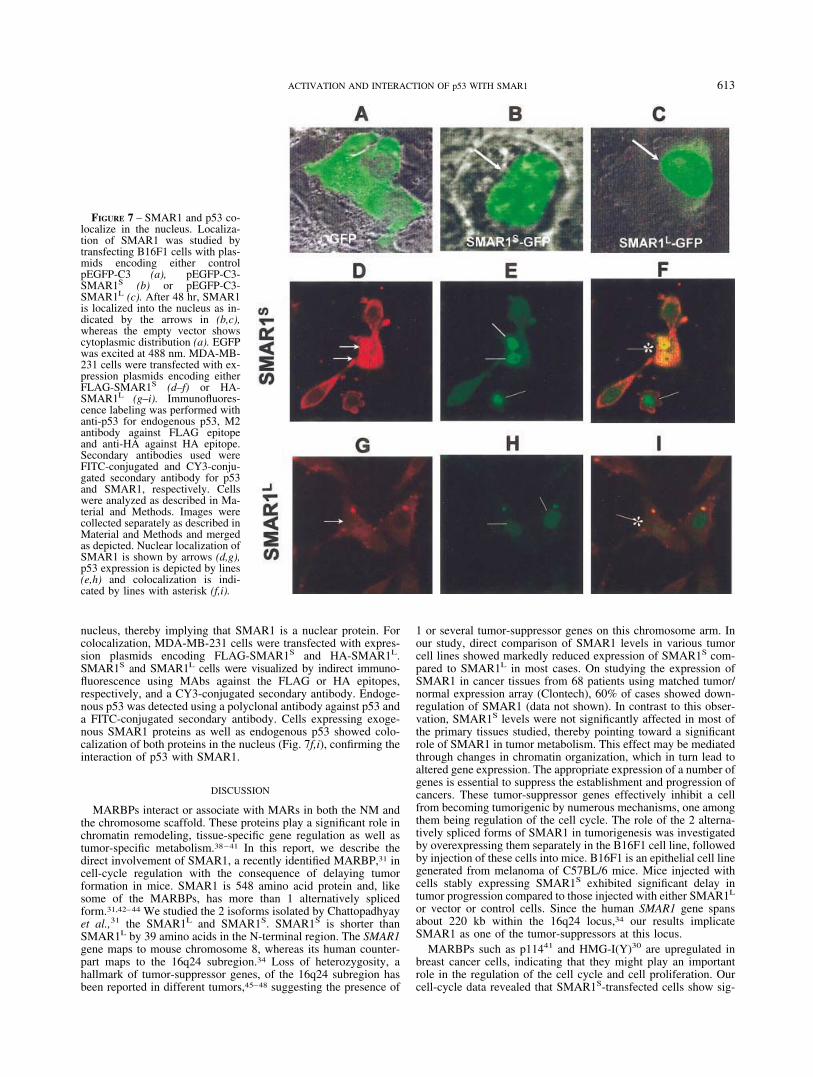
nucleus, thereby implying that SMAR1 is a nuclear protein. Forcolocalization, MDA-MB-231 cells were transfected with expres-sion plasmids encoding FLAG-SMAR1S and HA-SMAR1L.SMAR1S and SMAR1L cells were visualized by indirect immuno-fluorescence using MAbs against the FLAG or HA epitopes,respectively, and a CY3-conjugated secondary antibody. Endoge-nous p53 was detected using a polyclonal antibody against p53 anda FITC-conjugated secondary antibody. Cells expressing exoge-nous SMAR1 proteins as well as endogenous p53 showed colo-calization of both proteins in the nucleus (Fig. 7f,i), confirming theinteraction of p53 with SMAR1.
DISCUSSION
MARBPs interact or associate with MARs in both the NM andthe chromosome scaffold. These proteins play a significant role inchromatin remodeling, tissue-specific gene regulation as well astumor-specific metabolism.38–41 In this report, we describe thedirect involvement of SMAR1, a recently identified MARBP,31 incell-cycle regulation with the consequence of delaying tumorformation in mice. SMAR1 is 548 amino acid protein and, likesome of the MARBPs, has more than 1 alternatively splicedform.31,42–44 We studied the 2 isoforms isolated by Chattopadhyayet al.,31 the SMAR1L and SMAR1S. SMAR1S is shorter thanSMAR1L by 39 amino acids in the N-terminal region. The SMAR1gene maps to mouse chromosome 8, whereas its human counter-part maps to the 16q24 subregion.34 Loss of heterozygosity, ahallmark of tumor-suppressor genes, of the 16q24 subregion hasbeen reported in different tumors,45–48 suggesting the presence of
1 or several tumor-suppressor genes on this chromosome arm. Inour study, direct comparison of SMAR1 levels in various tumorcell lines showed markedly reduced expression of SMAR1S com-pared to SMAR1L in most cases. On studying the expression ofSMAR1 in cancer tissues from 68 patients using matched tumor/normal expression array (Clontech), 60% of cases showed down-regulation of SMAR1 (data not shown). In contrast to this obser-vation, SMAR1S levels were not significantly affected in most ofthe primary tissues studied, thereby pointing toward a significantrole of SMAR1 in tumor metabolism. This effect may be mediatedthrough changes in chromatin organization, which in turn lead toaltered gene expression. The appropriate expression of a number ofgenes is essential to suppress the establishment and progression ofcancers. These tumor-suppressor genes effectively inhibit a cellfrom becoming tumorigenic by numerous mechanisms, one amongthem being regulation of the cell cycle. The role of the 2 alterna-tively spliced forms of SMAR1 in tumorigenesis was investigatedby overexpressing them separately in the B16F1 cell line, followedby injection of these cells into mice. B16F1 is an epithelial cell linegenerated from melanoma of C57BL/6 mice. Mice injected withcells stably expressing SMAR1S exhibited significant delay intumor progression compared to those injected with either SMAR1L
or vector or control cells. Since the human SMAR1 gene spansabout 220 kb within the 16q24 locus,34 our results implicateSMAR1 as one of the tumor-suppressors at this locus.
MARBPs such as p11441 and HMG-I(Y)30 are upregulated inbreast cancer cells, indicating that they might play an importantrole in the regulation of the cell cycle and cell proliferation. Ourcell-cycle data revealed that SMAR1S-transfected cells show sig-
FIGURE 7 – SMAR1 and p53 co-localize in the nucleus. Localiza-tion of SMAR1 was studied bytransfecting B16F1 cells with plas-mids encoding either controlpEGFP-C3 (a), pEGFP-C3-SMAR1S (b) or pEGFP-C3-SMAR1L (c). After 48 hr, SMAR1is localized into the nucleus as in-dicated by the arrows in (b,c),whereas the empty vector showscytoplasmic distribution (a). EGFPwas excited at 488 nm. MDA-MB-231 cells were transfected with ex-pression plasmids encoding eitherFLAG-SMAR1S (d–f) or HA-SMAR1L (g–i). Immunofluores-cence labeling was performed withanti-p53 for endogenous p53, M2antibody against FLAG epitopeand anti-HA against HA epitope.Secondary antibodies used wereFITC-conjugated and CY3-conju-gated secondary antibody for p53and SMAR1, respectively. Cellswere analyzed as described in Ma-terial and Methods. Images werecollected separately as described inMaterial and Methods and mergedas depicted. Nuclear localization ofSMAR1 is shown by arrows (d,g),p53 expression is depicted by lines(e,h) and colocalization is indi-cated by lines with asterisk (f,i).
613ACTIVATION AND INTERACTION OF p53 WITH SMAR1
nificant arrest in the G2/M phase compared to either SMAR1L- orvector-transfected cells. This correlates with the increased dou-bling time as well as decreased cell proliferation observed inSMAR1S-overexpressing cells. These observations suggest thatSMAR1S might play a key role in the regulation of the cell cycle.
The importance of p53 in G2 arrest has been shown undervarious conditions where p53 plays a role either directly or indi-rectly.49 In many p53-null cells, G2 arrest has been shown to occurin response to DNA damage.50 Thus, the importance of p53 in G2
arrest is complicated by p53-independent mechanisms, suggestingthe involvement of other factors. Overexpression of SMAR1 doesnot lead to apoptosis (data not shown); however, it leads to G2/Mdelay, indicating that SMAR1 may mediate it by directly interact-ing with either p53 or other antiproliferative proteins or throughinteraction with various cis elements, including MARs. CAT re-porter assays show that both SMAR1S and SMAR1L upregulatep53-mediated reporter gene expression, the effect of the formerbeing much stronger than that of the latter. The increase in CATactivity by SMAR1S is more pronounced in p53–/– cell linesexpressing exogenous p53 compared to p53�/� cell lines. Thisimplies that p53-mediated transcription is influenced by a stoichi-ometric balance between these 2 proteins. Consistent with thisresult, our coimmunoprecipitation experiment confirms thatSMAR1 activates p53 by directly interacting with it. Althoughboth forms of SMAR1 interact with p53 functionally, SMAR1S
appears to be more efficient at regulating p53 function. The func-tional significance of SMAR1S compared to SMAR1L is supportedby the observations of cell-cycle arrest and delay in tumor pro-gression. Thus, the observed G2/M arrest in SMAR1S-overex-pressing cells may be mediated through its direct interaction withand activation of p53.
The cell cycle–regulatory proteins, e.g., p21, play an importantrole in maintaining the G1 and G2 checkpoints. p21 is a member of
the Cip/Kip family of Cdk inhibitory proteins. It inhibits Cdk2, ineffect preventing cells from entering S phase (G1/S transition) andbinds to cdc2, thereby preventing cells from proceeding from G2 toM phase (G2/M transition), even though the latter mechanism isnot clear.51,52 SMAR1, upon interaction with p53, activates it,which in effect activates p21. The activation of p21 might inhibitthe positive regulators of the cell cycle, which may be one of thereasons for delaying cells from proceeding from G2 to M phase.
It has been shown that wild-type p53 directly binds to the NM3
through its proline-rich domain. Also, p53 binds weakly to MARsequences.50,53 Since SMAR1 is a MARBP31 and MARs areknown to be associated with the NM, it can be speculated that thedual interaction of p53 with the NM and SMAR1 might regulatetranscription in a coordinated manner. In various cancers, mutantp53 binds to MAR sequences, directly causing their unwinding,54
which in turn dysregulates gene function. In this regard, SMAR1might play a pivotal role by binding to p53 and thereby regulatingits association with either the NM or MAR sequences. This in turnmight help in regulating the transcription of various genes that maybe essential in controlling tumorigenesis.
Therefore, although the role of a SMAR1–p53 interaction re-mains to be elucidated, the delay in tumor progression induced bySMAR1 suggests that this protein functions as a candidate tumor-suppressor. The reduced expression of SMAR1 in a significantnumber of cancer cell lines and the localization of its humancounterpart on chromosome 16q24,34 a region showing loss ofheterozygosity in certain cancers,45–48 support the suggestion.
ACKNOWLEDGEMENTS
We thank our NCCS director, Dr. G.C. Mishra, for generoussupport in carrying out these experiments. We also thank Drs. G.C.Kundu and K. Rao for critical comments on the manuscript. Wededicate this report to the memory of Dr. S. Mukherjee.
REFERENCES
1. Deppert W. Binding of MAR-DNA elements by mutant p53: possibleimplications for its oncogenic functions. J Cell Biochem 1996;62:172–80.
2. May P, May, E. Twenty years of p53 research: structural and func-tional aspects of the p53 protein. Oncogene 1999;18:7621–36.
3. Jiang M, Axe T, Holgate R, Rubbi PC, Okorokov LA, Mee T, MilnerJ. p53 binds the nuclear matrix in normal cells: binding involves theproline-rich domain of p53 and increases following genotoxic stress.Oncogene 2001;20:5449–58.
4. Stein GS, Montecino M, van Wijnen AJ, Stein JL, Lian JB. Nuclearstructure–gene expression interrelationships: implications for aberrantgene expression in cancer. Cancer Res 2000;60:2067–76.
5. Garrard WT. Chromosomal loop organization in eukaryotic genomes.Nucleic Acids Mol Biol 1990;4:163–75.
6. Adachi Y, Kas E, Laemmli UK. Preferential, cooperative binding ofDNA topoisomerase II to scaffold-associated regions. EMBO J 1989;8:3997–4006.
7. Pommier Y, Cockerill PN, Kohn KW, Garrard WT. Identificationwithin the simian virus 40 genome of a chromosomal loop attachmentsite that contains topoisomerase II cleavage sites. J Virol 1990;64:419–23.
8. Sperry AO, Blasquez VC, Garrard WT. Dysfunction of chromosomalloop attachment sites: illegitimate recombination linked to matrixassociation regions and topoisomerase II. Proc Natl Acad Sci USA1989;86:5497–501.
9. Webb CF, Das C, Eneff KL, Tucker PW. Identification of a matrix-associated region 5� of an immunoglobulin heavy chain variableregion gene. Mol Cell Biol 1991;11:5206–11.
10. Mirkovitch J, Mirault M-E, Laemmli UK. Organization of the higher-order chromatin loop: specific DNA attachment sites on nuclearscaffold. Cell 1984;9:223–32.
11. Cockerill PN, Garrard WT. Chromosomal loop anchorage of the �immunoglobulin gene occurs next to the enhancer in a region con-taining topoisomerase II sites. Cell 1986;44:273–82.
12. Gasser SM, Laemmli UK. Cohabitation of scaffold binding regionswith upstream/enhancer elements of three developmentally regulatedgenes of D. melanogaster. Cell 1986;46:521-530.
13. Gasser SM, Laemmli UK. The organization of chromatin loops:characterization of a scaffold. EMBO J 1986;5:511–8.
14. Cockerill PN, Yuen M-H, Garrard WT. The enhancer of the immu-noglobulin heavy chain locus is flanked by presumptive chromosomalloop anchorage elements. J Biol Chem 1987;262:5394–7.
15. Gasser SM, Laemmli UK. A glimpse at chromosomal order. TrendsGenet 1987;3:16–22.
16. Blasquez VC, Sperry AO, Cockerill PN, Garrard WT. Protein:DNAinteractions at chromosomal loop attachment sites. Genome 1989;31:503–9.
17. Berezney R, Coffey DS. Identification of a nuclear protein matrix.Biochem Biophys Res Commun 1974;60:1410–7.
18. Kohwi-Shigematsu T, Kohwi Y. Torsional stress stabilizes extendedbase unpairing in suppressor sites flanking immunoglobulin heavychain enhancer. Biochemistry 1990;29:9551–60.
19. Scheuermann RH, Garrard WT. MARs of antigen receptor and co-receptor genes. Crit Rev Eukaryot Gene Expr 1999;9:295–310.
20. Hart CM, Laemmli UK. Facilitation of chromatin dynamics by SARs.Curr Opin Genet Dev 1998;8:519–25.
21. Forrester WC, van Genderen C, Jenuwein T, Grosschedl R. Depen-dence of enhancer-mediated transcription of the immunoglobulin �gene on nuclear matrix attachment regions. Science 1994;265:1221–5.
22. Kirillov A, Kistler B, Mostsolasky R, Cedar H, Wirth T, Bergman Y.A role for nuclear NF-�B-cell-specific demethylation of the Igk locus.Nat Genet 1996;13:435–41.
23. Jenuwein T, Forrester WC, Fernandez-Herrero LA, Laible G, Dull M,Grosschedl R. Extension of chromatin accessibility by nuclear matrixattachment regions. Nature 1997;385:269–72.
24. Ellis T, Gambardella L, Horcher M, Tschanz S, Capol J, Bertram P,Jochum W, Barrandon Y, Busslinger M. The transcriptional repressorCDP (Cutl1) is essential for epithelial cell differentiation of the lungand the hair follicle. Genes Dev 2001;15:2307–19.
25. Nepveu A. Role of the multifunctional CDP/Cut/Cux homeodomaintranscription factor in regulating differentiation, cell growth and de-velopment. Gene 2001;270:1–15.
26. Alvarez JD, Yasui DH, Niida H, Joh T, Loh DY, Kohwi-ShigematsuT. The MAR-binding protein SATB1 orchestrates temporal and spa-tial expression of multiple genes during T-cell development. GenesDev 2001;14:521–35.
27. Hawkins SM, Kohwi-Shigematsu T, Skalnik DG. The matrix attach-ment region-binding protein SATB1 interacts with multiple elements
614 KAUL ET AL.
within the gp91phox promoter and is down-regulated during myeloiddifferentiation. J Biol Chem 2001;276:44472–80.
28. Galande S, Kohwi-Shigematsu T. Caught in the act: binding of Kuand PARP to MARs reveals novel aspects of their functional interac-tion. Crit Rev Eukaryot Gene Expr 2000;10:63–72.
29. Galande S. Chromatin (dis)organization and cancer: BUR-bindingproteins as biomarkers for cancer. Curr Cancer Drug Targets 2002;2:157–190.
30. Liu WM, Guerra-Vladusic FK, Kurakata S, Lupu R, Kohwi-Shige-matsu T. HMG-I(Y) recognizes base-unpairing regions of matrixattachment sequences and its increased expression is directly linked tometastatic breast cancer phenotype. Cancer Res 1999;59:5695–703.
31. Chattopadhyay S, Kaul R, Charest A, Housman D, Chen J. SMAR1,a novel alternatively spliced gene product, binds the scaffold/matrix-associated region at the T cell receptor � locus. Genomics 2000;68:93–6.
32. Chattopadhyay S, Whitehurst C, Schwenk F, Chen J. Biochemical andfunctional analyses of chromatin changes at the TCR� gene locusduring CD4–CD8– to CD4�CD8� thymocyte differentiation. J Immu-nol 1998;160:1256–67.
33. Chattopadhyay S, Whitehurst C, Schwenk F, Chen J. A nuclear matrixattachment region upstream of the T cell receptor � gene enhancerbinds Cux/CDP and SATB1 and modulates enhancer dependent re-porter gene expression but not endogenous gene expression. J BiolChem 1998;273:29838–46.
34. Birot A-M, Duret L, Bartholin L, Santalucia B, Tigaud I, Magaud J,Rouault J-P. Identification and molecular analysis of BANP. Gene2000;253:189–96.
35. Dignam JD, Lebovitz RM, Roeder RG. Accurate transcription initia-tion by RNA polymerase II in a soluble extract from isolated mam-malian nuclei. Nucleic Acids Res 1983;11:1475–89.
36. Wiese C, Galande S. Elimination of reducing agent facilitates quan-titative detection of p53 antigen. Biotechniques 2001;30:960–3.
37. Niculescu AB III, Chen X, Smeets M, Hengst L, Prives C, Reed SI.Effects of p21Cip1/Waf1 at both the G1/S and the G2/M cell cycletransitions: pRb is a critical determinant in blocking DNA replicationand in preventing endoreduplication. Mol Cell Biol 1998;18:629–43.
38. Raziuddin A, Court D, Sarkar FH, Liu YL, Kung HF, Raziuddin R. Ac-erbB-2 promoter-specific nuclear matrix protein from human breasttumor tissues mediates NF-kappaB DNA binding activity. J BiolChem 1997;272:15715–20.
39. Liu J, Bramblett D, Zhu Q, Lozano M, Kobayashi R, Ross SR, DudleyJP. The matrix attachment region-binding protein SATB1 participatesin negative regulation of tissue-specific gene expression. Mol CellBiol 1997;17:5275–87.
40. Cunningham JM, Purucker ME, Jane SM, Safer B, Vanin EF, NeyPA, Lowrey CH, Nienhuis AW. The regulatory element 3� to the Agamma-globin gene binds to the nuclear matrix and interacts with
special A-T-rich binding protein 1 (SATB1). Blood 1994;84:1298–308.
41. Yanagisawa J, Ando J, Nakayama J, Kohwi Y, Kohwi-Shigematsu T.A matrix attachment region (MAR)-binding activity due to a p114kilodalton protein is found only in human breast carcinomas and notin normal and benign breast disease tissues. Cancer Res 1996;56:457–62.
42. Van den Heuvel GB, Quaggin SE, Igarashi P. A unique variant of ahomeobox gene related to Drosophila cut is expressed in mouse testis.Biol Reprod 1996;55:731–9.
43. Lievens PMJ, Tufarelli C, Donady JJ, Stagg A, Neufeld EJ. CASP, anovel, highly conserved alternative-splicing product of the CDP/cut/cux gene, lacks cut-repeat and homeo DNA-binding domains, andinteracts with full-length CDP in vitro. Gene 1997;197:73–81.
44. Zeng WR, Soucie E, Moon NS, Martin-Soudant N, Berube G, LeduyL, Nepveu A. Exon/intron structure and alternative transcripts of theCUTL1 gene. Gene 2000;241:75–85.
45. Tsuda H, Callen DF, Fukutomi T, Nakamura Y, Hirohashi S. Alleleloss on chromosome 16q24.2-qter occurs frequently in breast cancersirrespectively of differences in phenotype and extent of spread. Can-cer Res 1994;54:513–7.
46. Radford DM, Phillips NJ, Fair KL, Ritter JH, Holt M, Donis-Keller H.Allelic loss and the progression of breast cancer [erratum appears inCancer Res 1996;56:935]. Cancer Res 1995;55:5180–3.
47. Mori Y, Matsunaga M, Abe T, Fukushige S, Miura K, Sunamura M,Shiiba K, Sato M, Nukiwa T, Horii A. Chromosome band 16q24 isfrequently deleted in human gastric cancer. Br J Cancer 1999;80:556–62.
48. Wang X, Gleich L, Pavelic ZP, Li YQ, Gale N, Hunt S, Gluckman JL,Stambrook PJ. Cervical metastases of head and neck squamous cellcarcinoma correlate with loss of heterozygosity on chromosome 16q.Int J Oncol 1999;14:557–61.
49. Taylor WR, Stark GR. Regulation of the G2/M transition by p53.Oncogene 2001;20:1803–15.
50. Kastan MB, Onyekwere O, Sidransky D, Vogelstein B, Craig RW.Participation of p53 protein in the cellular response to DNA damage.Cancer Res 1991;51:6304–11.
51. Dulic V, Stein GH, Far DF, Reed SI. Nuclear accumulation of p21Cip1
at the onset of mitosis: a role at the G2/M-phase transition. Mol CellBiol 1998;18:546–57.
52. Bunz F, Dutriaux A, Lengauer C, Waldman T, Zhou S, Brown JP,Sedivy JM, Kinzler KW, Vogelstein B. Requirement for p53 and p21to sustain G2 arrest after DNA damage. Science 1998;282:1497–501.
53. Muller BF, Paulsen D, Deppert W. Specific binding of MAR/SARDNA-elements by mutant p53. Oncogene 1996;12:1941–52.
54. Will K, Warnecke G, Albrechtsen N, Boulikas T, Deppert W. Highaffinity MAR-DNA binding is a common property of murine andhuman mutant p53. J Cell Biochem 1998;69:260–70.
615ACTIVATION AND INTERACTION OF p53 WITH SMAR1
Related Documents