Direct evidence for activity-dependent glucose phosphorylation in neurons with implications for the astrocyte-to-neuron lactate shuttle Anant B. Patel a,b,1 , James C. K. Lai c , Golam M. I. Chowdhury a,d , Fahmeed Hyder a,e,f , Douglas L. Rothman a,e,f , Robert G. Shulman a,1 , and Kevin L. Behar a,d,1 a Magnetic Resonance Research Center and Departments of e Diagnostic Radiology, d Psychiatry, and f Biomedical Engineering, Yale University, New Haven, CT 06520; c Department of Biomedical and Pharmaceutical Sciences, College of Pharmacy, Division of Health Sciences, Idaho State University, Pocatello, ID 83209; and b NMR Microimaging and Spectroscopy, CSIR-Centre for Cellular and Molecular Biology, Council for Scientific and Industrial Research, Hyderabad 500007, India Contributed by Robert G. Shulman, February 26, 2014 (sent for review March 13, 2013) Previous 13 C magnetic resonance spectroscopy experiments have shown that over a wide range of neuronal activity, approximately one molecule of glucose is oxidized for every molecule of gluta- mate released by neurons and recycled through astrocytic gluta- mine. The measured kinetics were shown to agree with the stoichiometry of a hypothetical astrocyte-to-neuron lactate shuttle model, which predicted negligible functional neuronal uptake of glucose. To test this model, we measured the uptake and phos- phorylation of glucose in nerve terminals isolated from rats infused with the glucose analog, 2-fluoro-2-deoxy-D-glucose (FDG) in vivo. The concentrations of phosphorylated FDG (FDG 6P ), normalized with respect to known neuronal metabolites, were compared in nerve terminals, homogenate, and cortex of anesthetized rats with and without bicuculline-induced seizures. The increase in FDG 6P in nerve terminals agreed well with the increase in cortical neuronal glucose oxidation measured previously under the same conditions in vivo, indicating that direct uptake and oxidation of glucose in nerve terminals is substantial under resting and activated condi- tions. These results suggest that neuronal glucose-derived pyru- vate is the major oxidative fuel for activated neurons, not lactate-derived from astrocytes, contradicting predictions of the original astrocyte-to-neuron lactate shuttle model under the range of study conditions. neuroenergetics | glutamate−glutamine cycle | neuronal glucose phosphorylation | synaptoneurosomes | 2-fluorodeoxyglucose M etabolic and neurophysiological research has experimen- tally related brain energy consumption, in the form of glu- cose oxidation, to the brain work supporting neuronal firing. Carbon-13 magnetic resonance spectroscopy (MRS) measure- ments (1, 2) of the associated fluxes in cerebral cortex of anes- thetized rats over a range of electrical activity revealed, surprisingly, a near 1:1 relationship (in molar equivalent units) between increments in the glutamate−glutamine neurotransmitter cycle and neuronal glucose oxidation. Subsequent studies of rat and human cerebral cortex have been consistent with this finding (3, 4). The near 1:1 flux relation was consistent with a cellular/ molecular model, originally proposed by Pellerin and Magistretti (5), and subsequently expanded to include the glutamate/gluta- mine cycle (1, 6). Evidence for the astrocyte-to-neuron lactate shuttle (ANLS) model is summarized in ref. 7. In this model (Fig. 1A), glutamate released from neurons is taken up by astrocytes and converted to glutamine using ATP derived from glycolysis. Lactate produced by this process is transferred to neurons where oxidation occurs. This ANLS model predicts a 1:1 relationship between increments in astrocytic glutamate uptake and glycolysis. Glycolytically derived ATP might provide for more rapid clear- ance of glutamate from the synaptic cleft into astrocyte processes devoid of mitochondria (8). The ANLS hypothesis has been challenged on biochemical, in vivo, in situ, and in vitro experimental and theoretical grounds (9– 13), as well as the lack of direct in vivo evidence for oxidation of astroglia-derived lactate by neurons. The experimental data against the ANLS model are described in a recent review by Dienel (13). The present study tested predictions of the ANLS model in anesthetized rats (both at baseline and during seizure- induced activation) by direct measurement in brain nerve termi- nals of the uptake and phosphorylation of an i.v.-infused glucose analog, 2-fluoro-2-deoxy-D-glucose (FDG). To test the hypothe- sized model (1, 6) (Fig. 1A), we measured the rate of glucose phosphorylation in nerve terminals isolated from the brains of rats receiving a short-timed infusion of FDG mixed with 13 C-la- beled glucose. FDG is phosphorylated by hexokinase to fluoro- 2-deoxy-glucose-6-phosphate (FDG 6P ), which is metabolized only to a limited extent; thus, FDG 6P accumulates in neural cells at a rate proportional to glucose utilization (14). The FDG and 13 C-glucose mixture (1:7) was infused for 8 min followed by a 52-min washout of FDG by infusing only 13 C-glucose (Fig. 2A), after which the animals were euthanized and the nerve terminals were isolated. FDG 6P was measured in extracts using 19 F NMR and normalized to N-acetylaspartate (NAA) or glutamate plus γ-aminobutyrate (GABA), predominantly neuronal metabolites, measured in the same extracts using 1 H-[ 13 C] NMR. Measurements were made both of nerve terminals and of total brain tissue ho- mogenate, the latter consisting of metabolites from all cells, in- cluding neurons and astrocytes. Comparisons were made of the normalized FDG 6p formed in brain nerve terminals and homogenate Significance A near one-to-one relationship had previously been observed between increments in the fluxes of the glutamate-glutamine neurotransmitter cycle and neuronal glucose oxidation in the tricarboxylic acid (TCA) cycle. This flux relationship was con- sistent with a hypothesized mechanism involving glycolytic ATP in astrocytes and astrocyte-to-neuron lactate shuttling. Here, 2-fluoro-2-deoxy-D-glucose was used to evaluate the glucose flux through glycolysis and the TCA cycle in nerve terminals isolated from the brains of rats under baseline and high-activity conditions. In a direct contradiction of this hy- pothesis, the results show that nerve terminals metabolize sig- nificant amounts of glucose. Author contributions: A.B.P., D.L.R., R.G.S., and K.L.B. designed research; A.B.P., J.C.K.L., G.M.I.C., and K.L.B. performed research; A.B.P., J.C.K.L., and K.L.B. analyzed data; A.B.P., F.H., D.L.R., R.G.S., and K.L.B interpreted the data; A.B.P., F.H., D.L.R., R.G.S., and K.L.B. wrote the paper; and K.L.B. supervised and directed the overall project. The authors declare no conflict of interest. 1 To whom correspondence may be addressed. E-mail: [email protected], robert. [email protected], or [email protected]. This article contains supporting information online at www.pnas.org/lookup/suppl/doi:10. 1073/pnas.1403576111/-/DCSupplemental. www.pnas.org/cgi/doi/10.1073/pnas.1403576111 PNAS | April 8, 2014 | vol. 111 | no. 14 | 5385–5390 NEUROSCIENCE

Welcome message from author
This document is posted to help you gain knowledge. Please leave a comment to let me know what you think about it! Share it to your friends and learn new things together.
Transcript
Direct evidence for activity-dependent glucosephosphorylation in neurons with implicationsfor the astrocyte-to-neuron lactate shuttleAnant B. Patela,b,1, James C. K. Laic, Golam M. I. Chowdhurya,d, Fahmeed Hydera,e,f, Douglas L. Rothmana,e,f,Robert G. Shulmana,1, and Kevin L. Behara,d,1
aMagnetic Resonance Research Center and Departments of eDiagnostic Radiology, dPsychiatry, and fBiomedical Engineering, Yale University, New Haven,CT 06520; cDepartment of Biomedical and Pharmaceutical Sciences, College of Pharmacy, Division of Health Sciences, Idaho State University, Pocatello, ID83209; and bNMR Microimaging and Spectroscopy, CSIR-Centre for Cellular and Molecular Biology, Council for Scientific and Industrial Research, Hyderabad500007, India
Contributed by Robert G. Shulman, February 26, 2014 (sent for review March 13, 2013)
Previous 13C magnetic resonance spectroscopy experiments haveshown that over a wide range of neuronal activity, approximatelyone molecule of glucose is oxidized for every molecule of gluta-mate released by neurons and recycled through astrocytic gluta-mine. The measured kinetics were shown to agree with thestoichiometry of a hypothetical astrocyte-to-neuron lactate shuttlemodel, which predicted negligible functional neuronal uptake ofglucose. To test this model, we measured the uptake and phos-phorylation of glucose in nerve terminals isolated from rats infusedwith the glucose analog, 2-fluoro-2-deoxy-D-glucose (FDG) in vivo.The concentrations of phosphorylated FDG (FDG6P), normalizedwith respect to known neuronal metabolites, were compared innerve terminals, homogenate, and cortex of anesthetized rats withand without bicuculline-induced seizures. The increase in FDG6P innerve terminals agreed well with the increase in cortical neuronalglucose oxidation measured previously under the same conditionsin vivo, indicating that direct uptake and oxidation of glucose innerve terminals is substantial under resting and activated condi-tions. These results suggest that neuronal glucose-derived pyru-vate is the major oxidative fuel for activated neurons, notlactate-derived from astrocytes, contradicting predictions of theoriginal astrocyte-to-neuron lactate shuttle model under therange of study conditions.
neuroenergetics | glutamate−glutamine cycle |neuronal glucose phosphorylation | synaptoneurosomes |2-fluorodeoxyglucose
Metabolic and neurophysiological research has experimen-tally related brain energy consumption, in the form of glu-
cose oxidation, to the brain work supporting neuronal firing.Carbon-13 magnetic resonance spectroscopy (MRS) measure-ments (1, 2) of the associated fluxes in cerebral cortex of anes-thetized rats over a range of electrical activity revealed,surprisingly, a near 1:1 relationship (in molar equivalent units)between increments in the glutamate−glutamine neurotransmittercycle and neuronal glucose oxidation. Subsequent studies of ratand human cerebral cortex have been consistent with this finding(3, 4). The near 1:1 flux relation was consistent with a cellular/molecular model, originally proposed by Pellerin and Magistretti(5), and subsequently expanded to include the glutamate/gluta-mine cycle (1, 6). Evidence for the astrocyte-to-neuron lactateshuttle (ANLS) model is summarized in ref. 7. In this model (Fig.1A), glutamate released from neurons is taken up by astrocytesand converted to glutamine using ATP derived from glycolysis.Lactate produced by this process is transferred to neurons whereoxidation occurs. This ANLS model predicts a 1:1 relationshipbetween increments in astrocytic glutamate uptake and glycolysis.Glycolytically derived ATP might provide for more rapid clear-ance of glutamate from the synaptic cleft into astrocyte processesdevoid of mitochondria (8).
The ANLS hypothesis has been challenged on biochemical, invivo, in situ, and in vitro experimental and theoretical grounds (9–13), as well as the lack of direct in vivo evidence for oxidation ofastroglia-derived lactate by neurons. The experimental dataagainst the ANLS model are described in a recent review byDienel (13). The present study tested predictions of the ANLSmodel in anesthetized rats (both at baseline and during seizure-induced activation) by direct measurement in brain nerve termi-nals of the uptake and phosphorylation of an i.v.-infused glucoseanalog, 2-fluoro-2-deoxy-D-glucose (FDG). To test the hypothe-sized model (1, 6) (Fig. 1A), we measured the rate of glucosephosphorylation in nerve terminals isolated from the brains ofrats receiving a short-timed infusion of FDG mixed with 13C-la-beled glucose. FDG is phosphorylated by hexokinase to fluoro-2-deoxy-glucose-6-phosphate (FDG6P), which is metabolized onlyto a limited extent; thus, FDG6P accumulates in neural cellsat a rate proportional to glucose utilization (14). The FDG and13C-glucose mixture (1:7) was infused for 8 min followed by a52-min washout of FDG by infusing only 13C-glucose (Fig. 2A),after which the animals were euthanized and the nerve terminalswere isolated. FDG6P was measured in extracts using 19F NMRand normalized to N-acetylaspartate (NAA) or glutamate plusγ-aminobutyrate (GABA), predominantly neuronal metabolites,measured in the same extracts using 1H-[13C] NMR. Measurementswere made both of nerve terminals and of total brain tissue ho-mogenate, the latter consisting of metabolites from all cells, in-cluding neurons and astrocytes. Comparisons were made of thenormalized FDG6p formed in brain nerve terminals and homogenate
Significance
A near one-to-one relationship had previously been observedbetween increments in the fluxes of the glutamate−glutamineneurotransmitter cycle and neuronal glucose oxidation in thetricarboxylic acid (TCA) cycle. This flux relationship was con-sistent with a hypothesized mechanism involving glycolyticATP in astrocytes and astrocyte-to-neuron lactate shuttling.Here, 2-fluoro-2-deoxy-D-glucose was used to evaluate theglucose flux through glycolysis and the TCA cycle in nerveterminals isolated from the brains of rats under baseline andhigh-activity conditions. In a direct contradiction of this hy-pothesis, the results show that nerve terminals metabolize sig-nificant amounts of glucose.
Author contributions: A.B.P., D.L.R., R.G.S., and K.L.B. designed research; A.B.P., J.C.K.L.,G.M.I.C., and K.L.B. performed research; A.B.P., J.C.K.L., and K.L.B. analyzed data; A.B.P., F.H.,D.L.R., R.G.S., and K.L.B interpreted the data; A.B.P., F.H., D.L.R., R.G.S., and K.L.B. wrote thepaper; and K.L.B. supervised and directed the overall project.
The authors declare no conflict of interest.1To whom correspondence may be addressed. E-mail: [email protected], [email protected], or [email protected].
This article contains supporting information online at www.pnas.org/lookup/suppl/doi:10.1073/pnas.1403576111/-/DCSupplemental.
www.pnas.org/cgi/doi/10.1073/pnas.1403576111 PNAS | April 8, 2014 | vol. 111 | no. 14 | 5385–5390
NEU
ROSC
IENCE
during control conditions and a more stimulated state (seizure) in-duced by the GABAA receptor antagonist, bicuculline. The nor-malized FDG flux in nerve terminals was then compared with thecortical flux of glucose oxidation, measured in vivo in a previousstudy of anesthetized rats (15), as well as with the flux inwhole brain homogenate, both of which included neuronaland glial contributions. The present results reveal high levels
of neuronal phosphorylation of FDG, suggesting that over a sig-nificant activity range, neurons are capable of supporting a sub-stantial fraction of their substrate requirements by direct uptakeand phosphorylation of glucose.
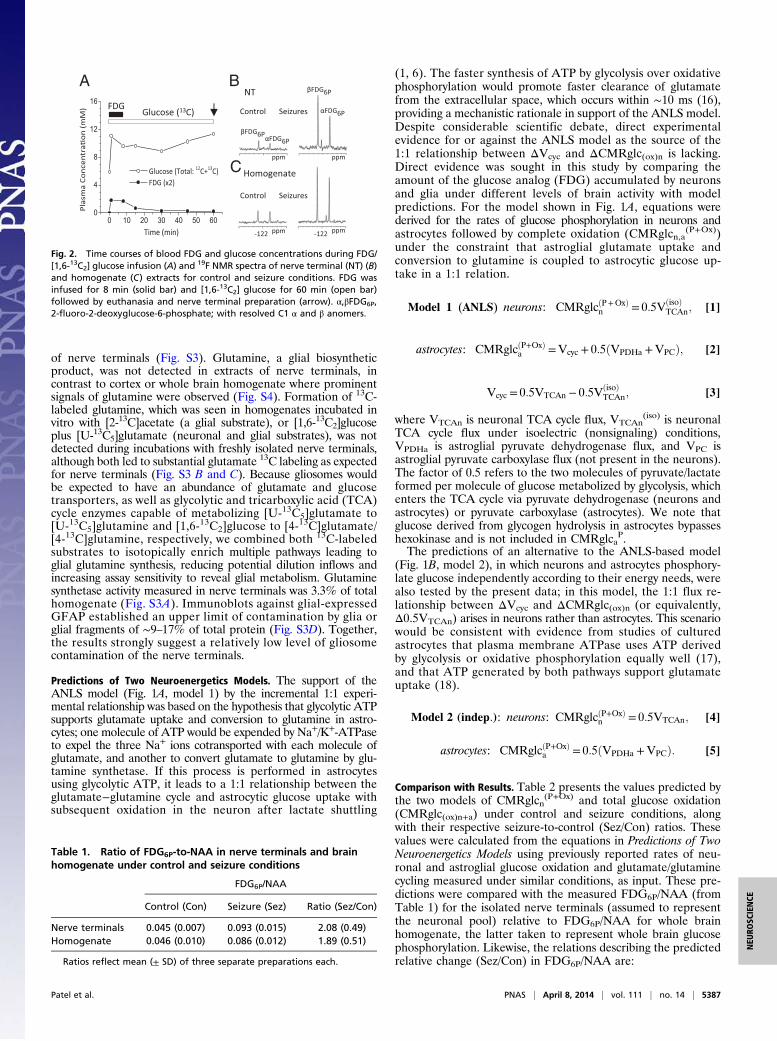
ResultsFDG Metabolism Reflects Premortem Glucose Phosphorylation. FDGlevels and enrichments in arterial plasma increased rapidlyduring the i.v. FDG/[1,6-13C2]glucose infusions in both saline-injected (control) and bicuculline-injected animals, reachingaverage values of ∼0.8–1.1 mM and ∼7%, respectively (Fig. 2and Table S1). Cessation of the FDG infusion at 8 min led todeclines in plasma FDG levels to <0.2 mM and <2 mol% by 60min, when animals were euthanized and nerve terminals wereisolated (Fig. S1 and Table S1). In pilot experiments conductedwithout a washout period (euthanasia and terminal isolation at8 min), blood and brain FDG levels were much higher (Fig.S2) than with washout (Fig. 2 B and C). Thus, the washoutsignificantly reduced the levels of FDG in blood and brain,ensuring that brain FDG6P accumulation mostly reflects premortemmetabolism.
Glucose Phosphorylation Levels Are High in Nerve Terminals. Fig. 2 Band C depicts 1H-decoupled 19F NMR spectra of nerve terminaland homogenate extracts prepared from control and seizing ratsinfused with FDG and [1,6-13C2]glucose. The α and β anomers ofFDG6P prominently appear in the 19F NMR spectrum. To comparethe levels of FDG6P for different nerve terminal preparations,FDG6P was expressed as a ratio with NAA, a neuronal marker, thusnormalizing FDG6P to the neuronal fraction. We comparedFDG6P/NAA for nerve terminals and the brain homogenate asa measure of glucose phosphorylation in “neurons” to total glucosephosphorylation in brain homogenate. Unexpectedly, FDG6P/NAAin nerve terminals (0.045 ± 0.007) was not significantly differentfrom that in brain homogenate (0.046 ± 0.010) (Table 1). Becausebrain homogenate includes neurons and astrocytes, prima facieglucose phosphorylation appeared to be dominant in neurons.Similar results were obtained when FDG6P was referenced to thesum of the steady-state concentrations of glutamate-13C4 andGABA-13C2, produced by metabolism of the coinfused [1,6-13C2]glucose, or the sum of glutamate and GABA (Table S2), all pre-dominately neuronal metabolites.
Seizures Increase Nerve Terminal Glucose Phosphorylation. FDG6Pwas substantially increased in nerve terminals of bicuculline-treated rats compared with saline-injected controls (Fig. 2B). Innerve terminals from seizing rats, FDG6P/NAA was 208% ofcontrol, comparable to that seen in brain homogenate (189% ofcontrol) (Table 1 and Fig. 2C). Similar increases were also seenwhen FDG6P was expressed relative to the sum of 13C-labeledglutamate and GABA (nerve terminals, 188% of control; ho-mogenate, 260% of control) or the sum of their total levels(nerve terminals, 196% of control; homogenate, 220% of con-trol) (Table S2). Thus, increased activity led to a large increase interminal glucose phophorylation. We also compared the seizure-induced changes in FDG6P/NAA for a small piece of parietal/temporal cortex with cortical glucose consumption (CMRglc(ox)nand CMRglc(tot)) reported in a previous in vivo 13C NMR study(15) (Table S3). In the in vivo study, CMRglc(tot) was estimatedas the sum of glucose oxidation and the initial rate of lactateaccumulation during seizure onset. The seizure-related change inFDG6P/NAA (260% of control) was similar to the change inCMRglc(tot) during seizures (277%) but less than CMRglc(tot) atseizure onset (470%). The larger change in CMRglc(tot) duringseizure onset than in FDG6P/NAA could be related to the con-tribution of glial glycogen breakdown to net lactate formation,which also is the likely source of lactate (and glutamate) isotopicdilution seen during early seizures (15).
Nerve Terminal Astroglial Contamination Is Low. Several glial-asso-ciated markers were assessed to estimate glial contamination
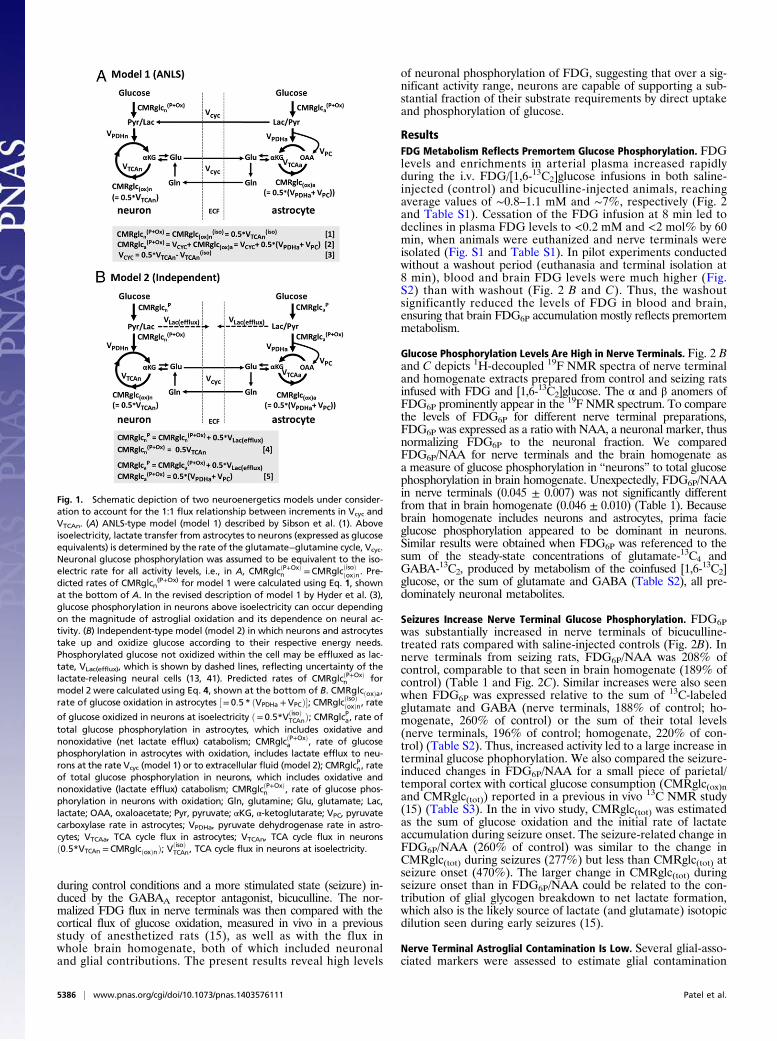
Fig. 1. Schematic depiction of two neuroenergetics models under consider-ation to account for the 1:1 flux relationship between increments in Vcyc andVTCAn. (A) ANLS-type model (model 1) described by Sibson et al. (1). Aboveisoelectricity, lactate transfer from astrocytes to neurons (expressed as glucoseequivalents) is determined by the rate of the glutamate−glutamine cycle, Vcyc.Neuronal glucose phosphorylation was assumed to be equivalent to the iso-electric rate for all activity levels, i.e., in A, CMRglcðP+OxÞ
n =CMRglcðisoÞðoxÞn. Pre-dicted rates of CMRglcn
(P+Ox) for model 1 were calculated using Eq. 1, shownat the bottom of A. In the revised description of model 1 by Hyder et al. (3),glucose phosphorylation in neurons above isoelectricity can occur dependingon the magnitude of astroglial oxidation and its dependence on neural ac-tivity. (B) Independent-type model (model 2) in which neurons and astrocytestake up and oxidize glucose according to their respective energy needs.Phosphorylated glucose not oxidized within the cell may be effluxed as lac-tate, VLac(efflux), which is shown by dashed lines, reflecting uncertainty of thelactate-releasing neural cells (13, 41). Predicted rates of CMRglcðP+OxÞ
n formodel 2 were calculated using Eq. 4, shown at the bottom of B. CMRglcðoxÞa,rate of glucose oxidation in astrocytes ½= 0:5* ðVPDHa +VPCÞ�; CMRglcðisoÞðoxÞn, rate
of glucose oxidized in neurons at isoelectricity ð= 0:5*VðisoÞTCAnÞ; CMRglcPa, rate of
total glucose phosphorylation in astrocytes, which includes oxidative andnonoxidative (net lactate efflux) catabolism; CMRglcðP+OxÞ
a , rate of glucosephosphorylation in astrocytes with oxidation, includes lactate efflux to neu-rons at the rate Vcyc (model 1) or to extracellular fluid (model 2); CMRglcPn, rateof total glucose phosphorylation in neurons, which includes oxidative andnonoxidative (lactate efflux) catabolism; CMRglcðP+OxÞ
n , rate of glucose phos-phorylation in neurons with oxidation; Gln, glutamine; Glu, glutamate; Lac,lactate; OAA, oxaloacetate; Pyr, pyruvate; αKG, α-ketoglutarate; VPC, pyruvatecarboxylase rate in astrocytes; VPDHa, pyruvate dehydrogenase rate in astro-cytes; VTCAa, TCA cycle flux in astrocytes; VTCAn, TCA cycle flux in neuronsð0:5*VTCAn =CMRglcðoxÞnÞ; VðisoÞ
TCAn, TCA cycle flux in neurons at isoelectricity.
5386 | www.pnas.org/cgi/doi/10.1073/pnas.1403576111 Patel et al.
of nerve terminals (Fig. S3). Glutamine, a glial biosyntheticproduct, was not detected in extracts of nerve terminals, incontrast to cortex or whole brain homogenate where prominentsignals of glutamine were observed (Fig. S4). Formation of 13C-labeled glutamine, which was seen in homogenates incubated invitro with [2-13C]acetate (a glial substrate), or [1,6-13C2]glucoseplus [U-13C5]glutamate (neuronal and glial substrates), was notdetected during incubations with freshly isolated nerve terminals,although both led to substantial glutamate 13C labeling as expectedfor nerve terminals (Fig. S3 B and C). Because gliosomes wouldbe expected to have an abundance of glutamate and glucosetransporters, as well as glycolytic and tricarboxylic acid (TCA)cycle enzymes capable of metabolizing [U-13C5]glutamate to[U-13C5]glutamine and [1,6-13C2]glucose to [4-13C]glutamate/[4-13C]glutamine, respectively, we combined both 13C-labeledsubstrates to isotopically enrich multiple pathways leading toglial glutamine synthesis, reducing potential dilution inflows andincreasing assay sensitivity to reveal glial metabolism. Glutaminesynthetase activity measured in nerve terminals was 3.3% of totalhomogenate (Fig. S3A). Immunoblots against glial-expressedGFAP established an upper limit of contamination by glia orglial fragments of ∼9–17% of total protein (Fig. S3D). Together,the results strongly suggest a relatively low level of gliosomecontamination of the nerve terminals.
Predictions of Two Neuroenergetics Models. The support of theANLS model (Fig. 1A, model 1) by the incremental 1:1 experi-mental relationship was based on the hypothesis that glycolytic ATPsupports glutamate uptake and conversion to glutamine in astro-cytes; one molecule of ATP would be expended by Na+/K+-ATPaseto expel the three Na+ ions cotransported with each molecule ofglutamate, and another to convert glutamate to glutamine by glu-tamine synthetase. If this process is performed in astrocytesusing glycolytic ATP, it leads to a 1:1 relationship between theglutamate−glutamine cycle and astrocytic glucose uptake withsubsequent oxidation in the neuron after lactate shuttling
(1, 6). The faster synthesis of ATP by glycolysis over oxidativephosphorylation would promote faster clearance of glutamatefrom the extracellular space, which occurs within ∼10 ms (16),providing a mechanistic rationale in support of the ANLS model.Despite considerable scientific debate, direct experimentalevidence for or against the ANLS model as the source of the1:1 relationship between ΔVcyc and ΔCMRglc(ox)n is lacking.Direct evidence was sought in this study by comparing theamount of the glucose analog (FDG) accumulated by neuronsand glia under different levels of brain activity with modelpredictions. For the model shown in Fig. 1A, equations werederived for the rates of glucose phosphorylation in neurons andastrocytes followed by complete oxidation (CMRglcn,a
(P+Ox))under the constraint that astroglial glutamate uptake andconversion to glutamine is coupled to astrocytic glucose up-take in a 1:1 relation.
Model 1 (ANLS) neurons: CMRglcðP+OxÞn = 0:5VðisoÞ
TCAn; [1]
astrocytes: CMRglcðP+OxÞa =Vcyc + 0:5ðVPDHa +VPCÞ; [2]
Vcyc = 0:5VTCAn − 0:5VðisoÞTCAn; [3]
where VTCAn is neuronal TCA cycle flux, VTCAn(iso) is neuronal
TCA cycle flux under isoelectric (nonsignaling) conditions,VPDHa is astroglial pyruvate dehydrogenase flux, and VPC isastroglial pyruvate carboxylase flux (not present in the neurons).The factor of 0.5 refers to the two molecules of pyruvate/lactateformed per molecule of glucose metabolized by glycolysis, whichenters the TCA cycle via pyruvate dehydrogenase (neurons andastrocytes) or pyruvate carboxylase (astrocytes). We note thatglucose derived from glycogen hydrolysis in astrocytes bypasseshexokinase and is not included in CMRglca
P.The predictions of an alternative to the ANLS-based model
(Fig. 1B, model 2), in which neurons and astrocytes phosphory-late glucose independently according to their energy needs, werealso tested by the present data; in this model, the 1:1 flux re-lationship between ΔVcyc and ΔCMRglc(ox)n (or equivalently,Δ0.5VTCAn) arises in neurons rather than astrocytes. This scenariowould be consistent with evidence from studies of culturedastrocytes that plasma membrane ATPase uses ATP derivedby glycolysis or oxidative phosphorylation equally well (17),and that ATP generated by both pathways support glutamateuptake (18).
Model 2 (indep:): neurons: CMRglcðP+OxÞn = 0:5VTCAn; [4]
astrocytes: CMRglcðP+OxÞa = 0:5ðVPDHa +VPCÞ: [5]
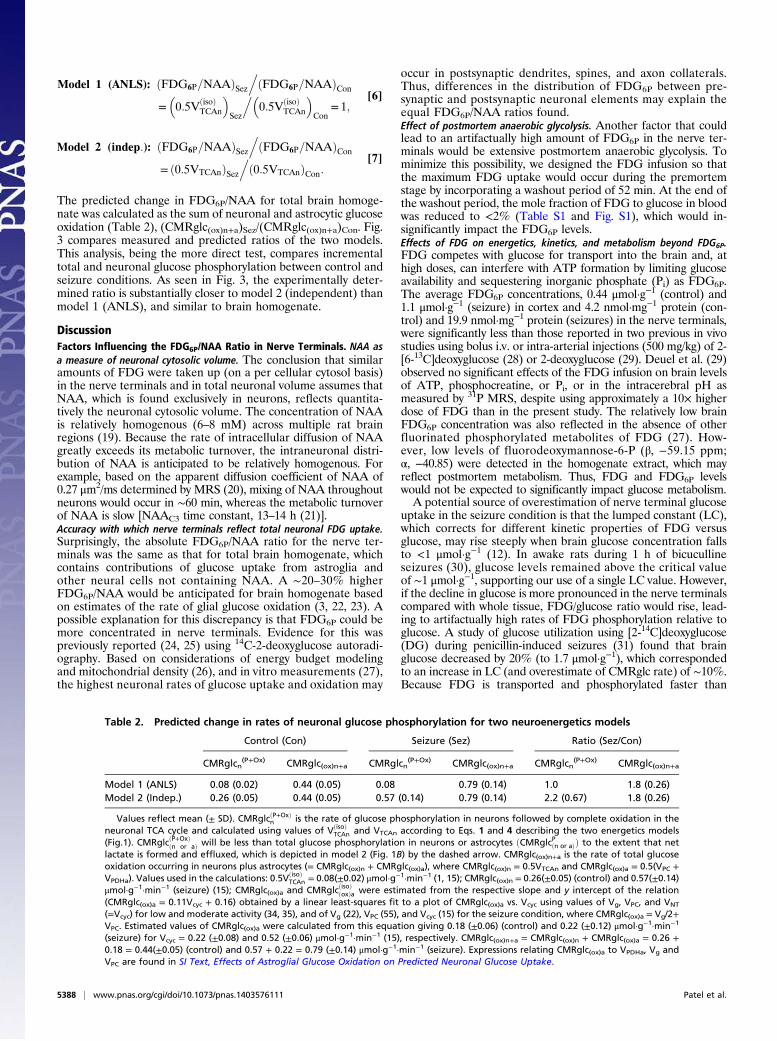
Comparison with Results. Table 2 presents the values predicted bythe two models of CMRglcn
(P+Ox) and total glucose oxidation(CMRglc(ox)n+a) under control and seizure conditions, alongwith their respective seizure-to-control (Sez/Con) ratios. Thesevalues were calculated from the equations in Predictions of TwoNeuroenergetics Models using previously reported rates of neu-ronal and astroglial glucose oxidation and glutamate/glutaminecycling measured under similar conditions, as input. These pre-dictions were compared with the measured FDG6P/NAA (fromTable 1) for the isolated nerve terminals (assumed to representthe neuronal pool) relative to FDG6P/NAA for whole brainhomogenate, the latter taken to represent whole brain glucosephosphorylation. Likewise, the relations describing the predictedrelative change (Sez/Con) in FDG6P/NAA are:
0 10 20 30 40 50 600
4
8
12
16
Glucose (Total: 12C+13C) FDG (x2)
Plas
ma
Conc
entr
a�on
(mM
)
Time (min)
Glucose (13C)FDGNT
Control Seizures αFDG6P
βFDG6P
αFDG6PβFDG6P
Seizures
Homogenate
Control
ppm
-122
ppm
ppm-122ppm
A B
C
Fig. 2. Time courses of blood FDG and glucose concentrations during FDG/[1,6-13C2] glucose infusion (A) and 19F NMR spectra of nerve terminal (NT) (B)and homogenate (C) extracts for control and seizure conditions. FDG wasinfused for 8 min (solid bar) and [1,6-13C2] glucose for 60 min (open bar)followed by euthanasia and nerve terminal preparation (arrow). α,βFDG6P,2-fluoro-2-deoxyglucose-6-phosphate; with resolved C1 α and β anomers.
Table 1. Ratio of FDG6P-to-NAA in nerve terminals and brainhomogenate under control and seizure conditions
FDG6P/NAA
Control (Con) Seizure (Sez) Ratio (Sez/Con)
Nerve terminals 0.045 (0.007) 0.093 (0.015) 2.08 (0.49)Homogenate 0.046 (0.010) 0.086 (0.012) 1.89 (0.51)
Ratios reflect mean (± SD) of three separate preparations each.
Patel et al. PNAS | April 8, 2014 | vol. 111 | no. 14 | 5387
NEU
ROSC
IENCE
Model 1 (ANLS): ðFDG6P=NAAÞSez.ðFDG6P=NAAÞCon
=�0:5VðisoÞ
TCAn
�Sez
.�0:5VðisoÞ
TCAn
�Con
= 1;[6]
Model 2 (indep:): ðFDG6P=NAAÞSez.ðFDG6P=NAAÞCon
= ð0:5VTCAnÞSez.ð0:5VTCAnÞCon:
[7]
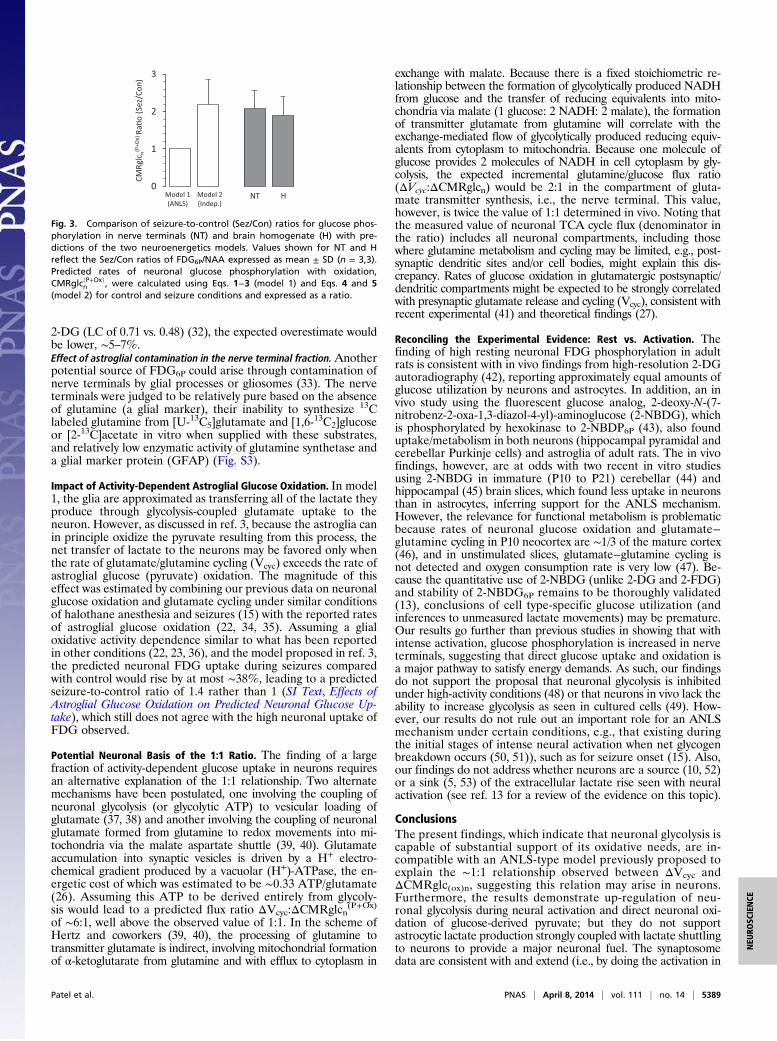
The predicted change in FDG6P/NAA for total brain homoge-nate was calculated as the sum of neuronal and astrocytic glucoseoxidation (Table 2), (CMRglc(ox)n+a)Sez/(CMRglc(ox)n+a)Con. Fig.3 compares measured and predicted ratios of the two models.This analysis, being the more direct test, compares incrementaltotal and neuronal glucose phosphorylation between control andseizure conditions. As seen in Fig. 3, the experimentally deter-mined ratio is substantially closer to model 2 (independent) thanmodel 1 (ANLS), and similar to brain homogenate.
DiscussionFactors Influencing the FDG6P/NAA Ratio in Nerve Terminals. NAA asa measure of neuronal cytosolic volume. The conclusion that similaramounts of FDG were taken up (on a per cellular cytosol basis)in the nerve terminals and in total neuronal volume assumes thatNAA, which is found exclusively in neurons, reflects quantita-tively the neuronal cytosolic volume. The concentration of NAAis relatively homogenous (6–8 mM) across multiple rat brainregions (19). Because the rate of intracellular diffusion of NAAgreatly exceeds its metabolic turnover, the intraneuronal distri-bution of NAA is anticipated to be relatively homogenous. Forexample, based on the apparent diffusion coefficient of NAA of0.27 μm2/ms determined by MRS (20), mixing of NAA throughoutneurons would occur in ∼60 min, whereas the metabolic turnoverof NAA is slow [NAAC3 time constant, 13–14 h (21)].Accuracy with which nerve terminals reflect total neuronal FDG uptake.Surprisingly, the absolute FDG6P/NAA ratio for the nerve ter-minals was the same as that for total brain homogenate, whichcontains contributions of glucose uptake from astroglia andother neural cells not containing NAA. A ∼20–30% higherFDG6P/NAA would be anticipated for brain homogenate basedon estimates of the rate of glial glucose oxidation (3, 22, 23). Apossible explanation for this discrepancy is that FDG6P could bemore concentrated in nerve terminals. Evidence for this waspreviously reported (24, 25) using 14C-2-deoxyglucose autoradi-ography. Based on considerations of energy budget modelingand mitochondrial density (26), and in vitro measurements (27),the highest neuronal rates of glucose uptake and oxidation may
occur in postsynaptic dendrites, spines, and axon collaterals.Thus, differences in the distribution of FDG6P between pre-synaptic and postsynaptic neuronal elements may explain theequal FDG6P/NAA ratios found.Effect of postmortem anaerobic glycolysis. Another factor that couldlead to an artifactually high amount of FDG6P in the nerve ter-minals would be extensive postmortem anaerobic glycolysis. Tominimize this possibility, we designed the FDG infusion so thatthe maximum FDG uptake would occur during the premortemstage by incorporating a washout period of 52 min. At the end ofthe washout period, the mole fraction of FDG to glucose in bloodwas reduced to <2% (Table S1 and Fig. S1), which would in-significantly impact the FDG6P levels.Effects of FDG on energetics, kinetics, and metabolism beyond FDG6P.FDG competes with glucose for transport into the brain and, athigh doses, can interfere with ATP formation by limiting glucoseavailability and sequestering inorganic phosphate (Pi) as FDG6P.The average FDG6P concentrations, 0.44 μmol·g−1 (control) and1.1 μmol·g−1 (seizure) in cortex and 4.2 nmol·mg−1 protein (con-trol) and 19.9 nmol·mg−1 protein (seizures) in the nerve terminals,were significantly less than those reported in two previous in vivostudies using bolus i.v. or intra-arterial injections (500 mg/kg) of 2-[6-13C]deoxyglucose (28) or 2-deoxyglucose (29). Deuel et al. (29)observed no significant effects of the FDG infusion on brain levelsof ATP, phosphocreatine, or Pi, or in the intracerebral pH asmeasured by 31P MRS, despite using approximately a 10× higherdose of FDG than in the present study. The relatively low brainFDG6P concentration was also reflected in the absence of otherfluorinated phosphorylated metabolites of FDG (27). How-ever, low levels of fluorodeoxymannose-6-P (β, −59.15 ppm;α, −40.85) were detected in the homogenate extract, which mayreflect postmortem metabolism. Thus, FDG and FDG6P levelswould not be expected to significantly impact glucose metabolism.A potential source of overestimation of nerve terminal glucose
uptake in the seizure condition is that the lumped constant (LC),which corrects for different kinetic properties of FDG versusglucose, may rise steeply when brain glucose concentration fallsto <1 μmol·g−1 (12). In awake rats during 1 h of bicucullineseizures (30), glucose levels remained above the critical valueof ∼1 μmol·g−1, supporting our use of a single LC value. However,if the decline in glucose is more pronounced in the nerve terminalscompared with whole tissue, FDG/glucose ratio would rise, lead-ing to artifactually high rates of FDG phosphorylation relative toglucose. A study of glucose utilization using [2-14C]deoxyglucose(DG) during penicillin-induced seizures (31) found that brainglucose decreased by 20% (to 1.7 μmol·g−1), which correspondedto an increase in LC (and overestimate of CMRglc rate) of ∼10%.Because FDG is transported and phosphorylated faster than
Table 2. Predicted change in rates of neuronal glucose phosphorylation for two neuroenergetics models
Control (Con) Seizure (Sez) Ratio (Sez/Con)
CMRglcn(P+Ox) CMRglc(ox)n+a CMRglcn
(P+Ox) CMRglc(ox)n+a CMRglcn(P+Ox) CMRglc(ox)n+a
Model 1 (ANLS) 0.08 (0.02) 0.44 (0.05) 0.08 0.79 (0.14) 1.0 1.8 (0.26)Model 2 (Indep.) 0.26 (0.05) 0.44 (0.05) 0.57 (0.14) 0.79 (0.14) 2.2 (0.67) 1.8 (0.26)
Values reflect mean (± SD). CMRglcðP+OxÞn is the rate of glucose phosphorylation in neurons followed by complete oxidation in the
neuronal TCA cycle and calculated using values of VðisoÞTCAn and VTCAn according to Eqs. 1 and 4 describing the two energetics models
(Fig.1). CMRglcðP+OxÞðn or aÞ will be less than total glucose phosphorylation in neurons or astrocytes ðCMRglcPðn or aÞÞ to the extent that net
lactate is formed and effluxed, which is depicted in model 2 (Fig. 1B) by the dashed arrow. CMRglc(ox)n+a is the rate of total glucoseoxidation occurring in neurons plus astrocytes (= CMRglc(ox)n + CMRglc(ox)a), where CMRglc(ox)n = 0.5VTCAn and CMRglc(ox)a = 0.5(VPC +VPDHa). Values used in the calculations: 0:5VðisoÞ
TCAn = 0.08(±0.02) μmol·g−1·min−1 (1, 15); CMRglc(ox)n = 0.26(±0.05) (control) and 0.57(±0.14)μmol·g−1·min−1 (seizure) (15); CMRglc(ox)a and CMRglcðisoÞðoxÞa were estimated from the respective slope and y intercept of the relation(CMRglc(ox)a = 0.11Vcyc + 0.16) obtained by a linear least-squares fit to a plot of CMRglc(ox)a vs. Vcyc using values of Vg, VPC, and VNT
(=Vcyc) for low and moderate activity (34, 35), and of Vg (22), VPC (55), and Vcyc (15) for the seizure condition, where CMRglc(ox)a = Vg/2+VPC. Estimated values of CMRglc(ox)a were calculated from this equation giving 0.18 (±0.06) (control) and 0.22 (±0.12) μmol·g−1·min−1
(seizure) for Vcyc = 0.22 (±0.08) and 0.52 (±0.06) μmol·g−1·min−1 (15), respectively. CMRglc(ox)n+a = CMRglc(ox)n + CMRglc(ox)a = 0.26 +0.18 = 0.44(±0.05) (control) and 0.57 + 0.22 = 0.79 (±0.14) μmol·g−1·min−1 (seizure). Expressions relating CMRglc(ox)a to VPDHa, Vg andVPC are found in SI Text, Effects of Astroglial Glucose Oxidation on Predicted Neuronal Glucose Uptake.
5388 | www.pnas.org/cgi/doi/10.1073/pnas.1403576111 Patel et al.
2-DG (LC of 0.71 vs. 0.48) (32), the expected overestimate wouldbe lower, ∼5–7%.Effect of astroglial contamination in the nerve terminal fraction.Anotherpotential source of FDG6P could arise through contamination ofnerve terminals by glial processes or gliosomes (33). The nerveterminals were judged to be relatively pure based on the absenceof glutamine (a glial marker), their inability to synthesize 13Clabeled glutamine from [U-13C5]glutamate and [1,6-13C2]glucoseor [2-13C]acetate in vitro when supplied with these substrates,and relatively low enzymatic activity of glutamine synthetase anda glial marker protein (GFAP) (Fig. S3).
Impact of Activity-Dependent Astroglial Glucose Oxidation. In model1, the glia are approximated as transferring all of the lactate theyproduce through glycolysis-coupled glutamate uptake to theneuron. However, as discussed in ref. 3, because the astroglia canin principle oxidize the pyruvate resulting from this process, thenet transfer of lactate to the neurons may be favored only whenthe rate of glutamate/glutamine cycling (Vcyc) exceeds the rate ofastroglial glucose (pyruvate) oxidation. The magnitude of thiseffect was estimated by combining our previous data on neuronalglucose oxidation and glutamate cycling under similar conditionsof halothane anesthesia and seizures (15) with the reported ratesof astroglial glucose oxidation (22, 34, 35). Assuming a glialoxidative activity dependence similar to what has been reportedin other conditions (22, 23, 36), and the model proposed in ref. 3,the predicted neuronal FDG uptake during seizures comparedwith control would rise by at most ∼38%, leading to a predictedseizure-to-control ratio of 1.4 rather than 1 (SI Text, Effects ofAstroglial Glucose Oxidation on Predicted Neuronal Glucose Up-take), which still does not agree with the high neuronal uptake ofFDG observed.
Potential Neuronal Basis of the 1:1 Ratio. The finding of a largefraction of activity-dependent glucose uptake in neurons requiresan alternative explanation of the 1:1 relationship. Two alternatemechanisms have been postulated, one involving the coupling ofneuronal glycolysis (or glycolytic ATP) to vesicular loading ofglutamate (37, 38) and another involving the coupling of neuronalglutamate formed from glutamine to redox movements into mi-tochondria via the malate aspartate shuttle (39, 40). Glutamateaccumulation into synaptic vesicles is driven by a H+ electro-chemical gradient produced by a vacuolar (H+)-ATPase, the en-ergetic cost of which was estimated to be ∼0.33 ATP/glutamate(26). Assuming this ATP to be derived entirely from glycoly-sis would lead to a predicted flux ratio ΔVcyc:ΔCMRglcn
(P+Ox)
of ∼6:1, well above the observed value of 1:1. In the scheme ofHertz and coworkers (39, 40), the processing of glutamine totransmitter glutamate is indirect, involving mitochondrial formationof α-ketoglutarate from glutamine and with efflux to cytoplasm in
exchange with malate. Because there is a fixed stoichiometric re-lationship between the formation of glycolytically produced NADHfrom glucose and the transfer of reducing equivalents into mito-chondria via malate (1 glucose: 2 NADH: 2 malate), the formationof transmitter glutamate from glutamine will correlate with theexchange-mediated flow of glycolytically produced reducing equiv-alents from cytoplasm to mitochondria. Because one molecule ofglucose provides 2 molecules of NADH in cell cytoplasm by gly-colysis, the expected incremental glutamine/glucose flux ratio(ΔVcyc:ΔCMRglcn) would be 2:1 in the compartment of gluta-mate transmitter synthesis, i.e., the nerve terminal. This value,however, is twice the value of 1:1 determined in vivo. Noting thatthe measured value of neuronal TCA cycle flux (denominator inthe ratio) includes all neuronal compartments, including thosewhere glutamine metabolism and cycling may be limited, e.g., post-synaptic dendritic sites and/or cell bodies, might explain this dis-crepancy. Rates of glucose oxidation in glutamatergic postsynaptic/dendritic compartments might be expected to be strongly correlatedwith presynaptic glutamate release and cycling (Vcyc), consistent withrecent experimental (41) and theoretical findings (27).
Reconciling the Experimental Evidence: Rest vs. Activation. Thefinding of high resting neuronal FDG phosphorylation in adultrats is consistent with in vivo findings from high-resolution 2-DGautoradiography (42), reporting approximately equal amounts ofglucose utilization by neurons and astrocytes. In addition, an invivo study using the fluorescent glucose analog, 2-deoxy-N-(7-nitrobenz-2-oxa-1,3-diazol-4-yl)-aminoglucose (2-NBDG), whichis phosphorylated by hexokinase to 2-NBDP6P (43), also founduptake/metabolism in both neurons (hippocampal pyramidal andcerebellar Purkinje cells) and astroglia of adult rats. The in vivofindings, however, are at odds with two recent in vitro studiesusing 2-NBDG in immature (P10 to P21) cerebellar (44) andhippocampal (45) brain slices, which found less uptake in neuronsthan in astrocytes, inferring support for the ANLS mechanism.However, the relevance for functional metabolism is problematicbecause rates of neuronal glucose oxidation and glutamate−glutamine cycling in P10 neocortex are ∼1/3 of the mature cortex(46), and in unstimulated slices, glutamate−glutamine cycling isnot detected and oxygen consumption rate is very low (47). Be-cause the quantitative use of 2-NBDG (unlike 2-DG and 2-FDG)and stability of 2-NBDG6P remains to be thoroughly validated(13), conclusions of cell type-specific glucose utilization (andinferences to unmeasured lactate movements) may be premature.Our results go further than previous studies in showing that withintense activation, glucose phosphorylation is increased in nerveterminals, suggesting that direct glucose uptake and oxidation isa major pathway to satisfy energy demands. As such, our findingsdo not support the proposal that neuronal glycolysis is inhibitedunder high-activity conditions (48) or that neurons in vivo lack theability to increase glycolysis as seen in cultured cells (49). How-ever, our results do not rule out an important role for an ANLSmechanism under certain conditions, e.g., that existing duringthe initial stages of intense neural activation when net glycogenbreakdown occurs (50, 51)), such as for seizure onset (15). Also,our findings do not address whether neurons are a source (10, 52)or a sink (5, 53) of the extracellular lactate rise seen with neuralactivation (see ref. 13 for a review of the evidence on this topic).
ConclusionsThe present findings, which indicate that neuronal glycolysis iscapable of substantial support of its oxidative needs, are in-compatible with an ANLS-type model previously proposed toexplain the ∼1:1 relationship observed between ΔVcyc andΔCMRglc(ox)n, suggesting this relation may arise in neurons.Furthermore, the results demonstrate up-regulation of neu-ronal glycolysis during neural activation and direct neuronal oxi-dation of glucose-derived pyruvate; but they do not supportastrocytic lactate production strongly coupled with lactate shuttlingto neurons to provide a major neuronal fuel. The synaptosomedata are consistent with and extend (i.e., by doing the activation in
0
1
2
3
CMRg
lcn(P
+Ox )
Ra�o
(Sez
/Con
)
Model 1(ANLS)
Model 2(Indep.)
NT H
Fig. 3. Comparison of seizure-to-control (Sez/Con) ratios for glucose phos-phorylation in nerve terminals (NT) and brain homogenate (H) with pre-dictions of the two neuroenergetics models. Values shown for NT and Hreflect the Sez/Con ratios of FDG6P/NAA expressed as mean ± SD (n = 3,3).Predicted rates of neuronal glucose phosphorylation with oxidation,CMRglcðP+OxÞ
n , were calculated using Eqs. 1−3 (model 1) and Eqs. 4 and 5(model 2) for control and seizure conditions and expressed as a ratio.
Patel et al. PNAS | April 8, 2014 | vol. 111 | no. 14 | 5389
NEU
ROSC
IENCE
vivo instead of in vitro) studies of synaptosomes from adultrodents, clearly demonstrating their high capacity for increasingglycolysis and oxidative metabolism.
Materials and MethodsAdult male Wister rats were prepared under halothane anesthesia (15) inaccordance with protocols approved by the Yale Animal Care and UseCommittee.
FDG and [1,6-13C2]glucose were infused for 8 min, followed by[1,6-13C2]glucose alone (washout) for 60 min.
Nerve terminals were prepared from rat forebrain using isotonic mediaand Ficoll density gradient centrifugation (54).
Tissue extracts were prepared using ethanol (15) for high-resolution 19F or1H-[13C] NMR at 11.7T.
The values reported reflect mean ± SD. Statistical significance of differ-ences was assessed by Student t test with level of P < 0.05. Further detailsappear in SI Text.
ACKNOWLEDGMENTS. The authors thank Bei Wang for animal preparationand Shirley Wang for immunoblotting. This study was supported by NationalInstitutes of Health Grants R01-DK27121 and R01-DK27121-28S.
1. Sibson NR, et al. (1998) Stoichiometric coupling of brain glucose metabolism andglutamatergic neuronal activity. Proc Natl Acad Sci USA 95(1):316–321.
2. Shen J, et al. (1999) Determination of the rate of the glutamate/glutamine cycle in thehuman brain by in vivo 13C NMR. Proc Natl Acad Sci USA 96(14):8235–8240.
3. Hyder F, et al. (2006) Neuronal-glial glucose oxidation and glutamatergic-GABAergicfunction. J Cereb Blood Flow Metab 26(7):865–877.
4. Rothman DL, De Feyter HM, de Graaf RA, Mason GF, Behar KL (2011) 13C MRS studiesof neuroenergetics and neurotransmitter cycling in humans. NMR Biomed 24(8):943–957.
5. Pellerin L, Magistretti PJ (1994) Glutamate uptake into astrocytes stimulates aerobicglycolysis: A mechanism coupling neuronal activity to glucose utilization. Proc NatlAcad Sci USA 91(22):10625–10629.
6. Magistretti PJ, Pellerin L, Rothman DL, Shulman RG (1999) Energy on demand. Science283(5401):496–497.
7. Pellerin L, Magistretti PJ (2012) Sweet sixteen for ANLS. J Cereb Blood Flow Metab32(7):1152–1166.
8. Shulman RG, Hyder F, Rothman DL (2001) Cerebral energetics and the glycogen shunt:Neurochemical basis of functional imaging. Proc Natl Acad Sci USA 98(11):6417–6422.
9. Gjedde A, Marrett S (2001) Glycolysis in neurons, not astrocytes, delays oxidativemetabolism of human visual cortex during sustained checkerboard stimulation invivo. J Cereb Blood Flow Metab 21(12):1384–1392.
10. Chih CP, Roberts EL, Jr. (2003) Energy substrates for neurons during neural activity: Acritical review of the astrocyte-neuron lactate shuttle hypothesis. J Cereb Blood FlowMetab 23(11):1263–1281.
11. Hertz L (2004) The astrocyte-neuron lactate shuttle: A challenge of a challenge.J Cereb Blood Flow Metab 24(11):1241–1248.
12. Dienel GA (2012) Fueling and imaging brain activation. ASN Neuro 4(5):e00093.13. Dienel GA (2012) Brain lactate metabolism: The discoveries and the controversies.
J Cereb Blood Flow Metab 32(7):1107–1138.14. Sokoloff L, et al. (1977) The [14C]deoxyglucose method for the measurement of local
cerebral glucose utilization: Theory, procedure, and normal values in the consciousand anesthetized albino rat. J Neurochem 28(5):897–916.
15. Patel AB, et al. (2004) Glutamatergic neurotransmission and neuronal glucose oxi-dation are coupled during intense neuronal activation. J Cereb Blood Flow Metab24(9):972–985.
16. Bergles DE, Diamond JS, Jahr CE (1999) Clearance of glutamate inside the synapse andbeyond. Curr Opin Neurobiol 9(3):293–298.
17. Silver IA, Ereci�nska M (1997) Energetic demands of the Na+/K+ ATPase in mammalianastrocytes. Glia 21(1):35–45.
18. Swanson RA, Benington JH (1996) Astrocyte glucose metabolism under normal andpathological conditions in vitro. Dev Neurosci 18(5-6):515–521.
19. Wang J, et al. (2010) Regional metabolite levels and turnover in the awake rat brainunder the influence of nicotine. J Neurochem 113(6):1447–1458.
20. Pfeuffer J, Tkác I, Gruetter R (2000) Extracellular-intracellular distribution of glu-cose and lactate in the rat brain assessed noninvasively by diffusion-weighted 1Hnuclear magnetic resonance spectroscopy in vivo. J Cereb Blood Flow Metab 20(4):736–746.
21. Choi IY, Gruetter R (2004) Dynamic or inert metabolism? Turnover of N-acetyl as-partate and glutathione from D-[1-13C]glucose in the rat brain in vivo. J Neurochem91(4):778–787.
22. Oz G, et al. (2004) Neuroglial metabolism in the awake rat brain: CO2 fixation in-creases with brain activity. J Neurosci 24(50):11273–11279.
23. Hertz L, Peng L, Dienel GA (2007) Energy metabolism in astrocytes: High rate of ox-idative metabolism and spatiotemporal dependence on glycolysis/glycogenolysis.J Cereb Blood Flow Metab 27(2):219–249.
24. Schwartz WJ, et al. (1979) Metabolic mapping of functional activity in the hypo-thalamo-neurohypophysial system of the rat. Science 205(4407):723–725.
25. Mata M, et al. (1980) Activity-dependent energy metabolism in rat posterior pituitaryprimarily reflects sodium pump activity. J Neurochem 34(1):213–215.
26. Attwell D, Laughlin SB (2001) An energy budget for signaling in the grey matter ofthe brain. J Cereb Blood Flow Metab 21(10):1133–1145.
27. Hall CN, Klein-Flügge MC, Howarth C, Attwell D (2012) Oxidative phosphorylation,not glycolysis, powers presynaptic and postsynaptic mechanisms underlying braininformation processing. J Neurosci 32(26):8940–8951.
28. Cohen DM, et al. (2002) A method for measuring cerebral glucose metabolism in vivoby 13C-NMR spectroscopy. Magn Reson Med 48(6):1063–1067.
29. Deuel RK, Yue GM, Sherman WR, Schickner DJ, Ackerman JJ (1985) Monitoring thetime course of cerebral deoxyglucose metabolism by 31P nuclear magnetic resonancespectroscopy. Science 228(4705):1329–1331.
30. Chapman AG, Meldrum BS, Siesjö BK (1977) Cerebral metabolic changes duringprolonged epileptic seizures in rats. J Neurochem 28(5):1025–1035.
31. Nakanishi H, Cruz NF, Adachi K, Sokoloff L, Dienel GA (1996) Influence of glucosesupply and demand on determination of brain glucose content with labeled meth-ylglucose. J Cereb Blood Flow Metab 16(3):439–449.
32. Tokugawa J, Ravasi L, Nakayama T, Schmidt KC, Sokoloff L (2007) Operational lumpedconstant for FDG in normal adult male rats. J Nucl Med 48(1):94–99.
33. Henn FA, Anderson DJ, Rustad DG (1976) Glial contamination of synaptosomal frac-tions. Brain Res 101(2):341–344.
34. Choi IY, Lei H, Gruetter R (2002) Effect of deep pentobarbital anesthesia on neuro-transmitter metabolism in vivo: On the correlation of total glucose consumption withglutamatergic action. J Cereb Blood Flow Metab 22(11):1343–1351.
35. Duarte JM, Lanz B, Gruetter R (2011) Compartmentalized cerebral metabolism of[1,6-13C]glucose determined by in vivo 13C NMR spectroscopy at 14.1 T. Front Neu-roenergetics 3:3.
36. Dienel GA, Schmidt KC, Cruz NF (2007) Astrocyte activation in vivo during gradedphotic stimulation. J Neurochem 103(4):1506–1522.
37. Ikemoto A, Bole DG, Ueda T (2003) Glycolysis and glutamate accumulation into syn-aptic vesicles. Role of glyceraldehyde phosphate dehydrogenase and 3-phospho-glycerate kinase. J Biol Chem 278(8):5929–5940.
38. Ishida A, Noda Y, Ueda T (2009) Synaptic vesicle-bound pyruvate kinase can supportvesicular glutamate uptake. Neurochem Res 34(5):807–818.
39. Hertz L, Yu AC, Kala G, Schousboe A (2000) Neuronal-astrocytic and cytosolic-mito-chondrial metabolite trafficking during brain activation, hyperammonemia and en-ergy deprivation. Neurochem Int 37(2-3):83–102.
40. Palaiologos G, Hertz L, Schousboe A (1988) Evidence that aspartate aminotransferaseactivity and ketodicarboxylate carrier function are essential for biosynthesis oftransmitter glutamate. J Neurochem 51(1):317–320.
41. Caesar K, et al. (2008) Glutamate receptor-dependent increments in lactate, glucoseand oxygen metabolism evoked in rat cerebellum in vivo. J Physiol 586(5):1337–1349.
42. Nehlig A, Wittendorp-Rechenmann E, Lam CD (2004) Selective uptake of [14C]2-deoxyglucose by neurons and astrocytes: High-resolution microautoradiographicimaging by cellular 14C-trajectography combined with immunohistochemistry. J CerebBlood Flow Metab 24(9):1004–1014.
43. Itoh Y, Abe T, Takaoka R, Tanahashi N (2004) Fluorometric determination of glucoseutilization in neurons in vitro and in vivo. J Cereb Blood Flow Metab 24(9):993–1003.
44. Barros LF, et al. (2009) Preferential transport and metabolism of glucose in Berg-mann glia over Purkinje cells: A multiphoton study of cerebellar slices. Glia 57(9):962–970.
45. Jakoby P, et al. (2014) Higher transport and metabolism of glucose in astrocytescompared with neurons: A multiphoton study of hippocampal and cerebellar tissueslices. Cereb Cortex 24(1):222–231.
46. Chowdhury GM, Patel AB, Mason GF, Rothman DL, Behar KL (2007) Glutamatergicand GABAergic neurotransmitter cycling and energy metabolism in rat cerebral cor-tex during postnatal development. J Cereb Blood Flow Metab 27(12):1895–1907.
47. Badar-Goffer RS, Ben-Yoseph O, Bachelard HS, Morris PG (1992) Neuronal-glialmetabolism under depolarizing conditions. A 13C-n.m.r. study. Biochem J 282(Pt 1):225–230.
48. Occhipinti R, Somersalo E, Calvetti D (2009) Astrocytes as the glucose shunt for gluta-matergic neurons at high activity: An in silico study. J Neurophysiol 101(5):2528–2538.
49. Bolaños JP, Almeida A, Moncada S (2010) Glycolysis: A bioenergetic or a survivalpathway? Trends Biochem Sci 35(3):145–149.
50. Shetty PK, Sadgrove MP, Galeffi F, Turner DA (2012) Pyruvate incubation enhancesglycogen stores and sustains neuronal function during subsequent glucose depriva-tion. Neurobiol Dis 45(1):177–187.
51. Dienel GA, Ball KK, Cruz NF (2007) A glycogen phosphorylase inhibitor selectivelyenhances local rates of glucose utilization in brain during sensory stimulation ofconscious rats: Implications for glycogen turnover. J Neurochem 102(2):466–478.
52. Mangia S, Simpson IA, Vannucci SJ, Carruthers A (2009) The in vivo neuron-to-astrocyte lactate shuttle in human brain: Evidence from modeling of measured lac-tate levels during visual stimulation. J Neurochem 109(Suppl 1):55–62.
53. Bélanger M, Allaman I, Magistretti PJ (2011) Brain energy metabolism: Focus on as-trocyte-neuron metabolic cooperation. Cell Metab 14(6):724–738.
54. Lai JCK, Clark JB (1989) Isolation and Characterization of Synaptic and NonsynapticMitochondria From Mammalian Brain (Humana Press, Inc., Clifton, NJ).
55. Patel AB, et al. (2005) Cerebral pyruvate carboxylase flux is unaltered during bicuculline-seizures. J Neurosci Res 79(1-2):128–138.
5390 | www.pnas.org/cgi/doi/10.1073/pnas.1403576111 Patel et al.
Supporting InformationPatel et al. 10.1073/pnas.1403576111SI TextAnimal Preparation. Overnight-fasted Wistar rats (120−150 g) wereanesthetized with 2–3% halothane in 30% O2/67–68%N2O, tra-cheotomized, and ventilated. The left femoral artery was cannulatedfor continuousmonitoring of arterial blood pressure and intermittentsampling of blood for the measurement of glucose and gases.Both femoral veins were cannulated for the infusion of labeled sub-strates and the administration of either bicuculline (1 mg/kg dis-solved inwater, i.v.) or saline. Body temperaturewasmaintainednear37 °C using a heating pad. In animals receiving bicuculline, a pair ofcarbon fiber leads were inserted in the scalp for monitoring electro-cortical activity during the seizure,whichwas amplified, digitized, andrecorded (Biopac Systems). Following surgery, halothane was re-duced to ∼1% to sustain an adequate blood pressure. Before in-duction of seizures, animals were immobilized with D-tubocurarinechloride (initial dose of 0.25 mg/kg, i.p. with supplements of 0.10 mg/kg every 40 min). Blood was withdrawn (∼1.5 mL) into heparinizedsaline 2minafter the start of the glucose infusion to limit thepeak risein arterial blood pressure during the seizures and reinfused, asneeded, to maintain blood pressure.
Infusion of FDG and [1,6-13C2]Glucose. The 2-Fluoro-2-deoxy-D-glucose (FDG, Sigma) and [1,6-13C2]glucose (Cambridge Isotopes;99 atom%) were dissolved (molar ratio of 1:7) in deionized water(0.75 M per 200 g rat). The FDG/[1,6-13C2]glucose solution wasinfused as a bolus (0.27 mL in 15 s) followed by a stepped re-duction in infusion rate every 30 s for the next 8 min (1), where-upon the rate was held constant until the time of decapitation.Pilot experiments with FDG infused for 8 min followed by de-capitation showed that postmortem phosphorylation of FDG toFDG6P occurred in the ischemic period following decapitation.Thus, to minimize postmortem FDG phosphorylation, the infusionof FDG was halted at 8 min, whereas the [1,6-13C2]glucose infusionwas continued to 60 min. Plasma FDG levels declined rapidly after8 min, comprising <3% of total plasma glucose at 60 min, thusminimizing the degree of postmortem phosphorylation. Thus,brain FDG6P accumulation was proportional to the rate of glucosemetabolism (glycolysis) in the interval preceding decapitation. Incontrast, the 13C labeling of amino acids had achieved their steady-state 13C percentage enrichment at the time of decapitation.In the seizure experiments, bicuculline was injected 2 min after
the start of the FDG/13C-glucose infusion to prelabel the brainglucose pool, minimizing 13C label dilution of brain pyruvate bythe expected rapid breakdown of unlabeled glucose and glycogen(2). Additional bicuculline was administered, as needed, to main-tain electrographic seizure activity. In control animals not ad-ministered bicuculline, an equivalent volume of saline was injected2 min after beginning the labeled [1,6-13C2]glucose infusion. Ar-terial blood samples were taken periodically for the analysis ofplasma FDG/glucose concentration and label enrichment.
Preparation of Nerve Terminals. Nerve terminals were preparedfrom the forebrain (minus cerebellum) of rats using the method ofLai and Clark (3). A small amount (30 mg) of cortical tissue wasalso removed and frozen separately from each animal for theanalysis of total FDG6P and amino acids. Following decapitation,brains were removed quickly into a preweighed beaker containingice-cold isolation medium (0.32 M sucrose, 10 mM Hepes, and1 mM EDTA at pH 7.4), and weighed again to obtain brainweight. The volume of ice-cold medium was reduced and the brainchopped rapidly into small pieces, with frequent pauses to allowfor heat dissipation. Residual blood in the solution was removed
by decanting. Additional isolation medium was added (to final1:10 vol/vol) and the brain was homogenized, and a small aliquot(1 mL) was removed and frozen to assess total homogenateFDG6P. The homogenate was centrifuged at 1,300 × g for 3 min at4 °C (Sorvall, SS-34 rotor), and the supernatant was collected. Thepellet was resuspended in 10 mL of isolation medium, rehomo-genized, and centrifugation repeated. The supernatants werepooled and recentrifuged at 17,000 × g for 10 min at 4 °C to pelletthe crude mitochondrial fraction. The resulting pellet was re-suspended in 15 mL of isolation medium and layered over a pre-viously made discontinuous density gradient consisting of 11 mLof 7.5% (wt/wt) Ficoll 400 (dialyzed) solution over 11 mL of 10%(wt/wt) Ficoll 400 in Beckman Ultra-Clear thin wall (25 × 89 mm)centrifuge tubes. The resulting suspension was centrifugedin a Beckman SW 28 or Ti 32 rotor at 99,000 × g for 45 min(Beckman 5M ultracentrifuge). After ultracentrifugation, sampletubes revealed three bands: a white upper band at the boundaryof isolation medium and 7.5% Ficoll medium, a white middleband at the 7.5%/10% (wt/wt) boundary consisting of nerve ter-minals, and a brown mitochondrial pellet. The myelin band andmost of the 7.5% Ficoll layer were carefully removed. The nerveterminals were collected from the 7.5%/10% Ficoll interface andpelleted by centrifugation at 17,000 × g for 10 min at 4 °C (Sor-vall, SS-34 rotor). Nerve terminal pellets were gently resuspendedand pelleted twice in isotonic sodium chloride (1:5 vol/vol), re-suspended in 1 mL final volume, and frozen in liquid nitrogen.Samples were stored at −80 °C until extracted.
Preparation of Extracts and NMR Analysis. Metabolites were ex-tracted from nerve terminals and tissue homogenates using ice-cold ethanol (1:6 vol/vol; ethanol 60%, deionized water 40%).The [2-13C]glycine (10 mM, 25 μL) and trifluoromethylalanine(TFMA, 10 mM, 25 μL; Lee’s Bio-organic Laboratories) wereadded as internal concentration references. Suspensions werefrozen and thawed several times to ensure complete cell lysis andcentrifuged (20,000 × g). Extracts of cortical tissue (∼30 mg)were prepared as previously described (2) with addition of[2-13C]glycine (10 mM, 50 μL) and TFMA (10 mM, 25 μL) asconcentration references. The supernatants were lyophilized andresuspended in 500 μL of a phosphate-buffered (100 mM, pH7)deuterium oxide (Cambridge Isotopes) solution containing 0.25mM 3-trimethylsilyl[2,2,3,3-D4]-propionate as a chemical shiftreference. The effective final concentrations of the [2-13C]gly-cine and TFMA references were 1 mM and 0.5 mM, respectively.NMR analysis of extracts. NMR spectra were measured on an 11.7Tesla Bruker AVANCE spectrometer (Bruker Instruments) op-erating at 500.13 MHz for 1H and 470.51 MHz for 19F. FDG6P wasmeasured in extracts relative to trifluoromethylalanine (TFMA;Lee’s Bio-organic Laboratories) using 1H-decoupled 19F NMRunder nonrelaxed pulsing conditions (1-s interscan delay) andcorrected for differential saturation of TFMA relative to FDG6Pand the relative number of fluorine atoms (3/1). The correctionfactor (0.865) was determined for a solution of FDG6P (1 mM)and TFMA (1 mM) in 50 mM phosphate buffer at pH 7.0 (H2O:D2O, 85:15 vol%) by dividing the ratio FDG6P/TFMA measuredunder fully relaxed conditions without 1H decoupling (0.366) bythat measured under the rapid pulsing conditions with 1H de-coupling (0.423). Total plasma FDG and brain FDG6P concen-trations were determined by measurement of the α anomerdivided by the α anomer equilibrium fraction [α/β = 0.44/0.63 (4)].In extracts of brain tissue, nerve terminals and homogenate, FDG
Patel et al. www.pnas.org/cgi/content/short/1403576111 1 of 6
and FDG6P were determined as the sum of the resolved C1 α andβ anomers.Amino acid concentrations were determined with 1H-[13C]-
NMR under fully relaxed conditions (20-s interscan delay) asdescribed in de Graaf et al. (5). The N-acetylaspartate (NAA)acetyl methyl and 13C-labeled glycine methine protons were mea-sured from the respective peak areas of the 1H-[13C]-NMR spectrareflecting total 12C+13C covalently bound 1H (NAA) or 13C bound1H resonances ([2-13C]glycine).Analysis of plasma FDG and glucose.FDG and glucose were measuredfrom arterial blood plasma sampled periodically during experi-ments. Plasma glucose was measured with a Glucose Analyzer II(Beckman Instruments). For NMR measurements, plasma wasmixed with deuterium oxide and passed through a centrifugalfilter (10 kDa cut off, Nanosep, Gelman Laboratory) to removemacromolecules (14,000 × g). The FDG mole fraction in plasmawas calculated by dividing the FDG-C1α resonance intensity bythe total (FDG + glucose)-C1α intensity.
Assessment of Nerve Terminal Purity. Protein Determination forImmunoblotting. Protein concentrations in samples were de-termined, following protein precipitation using the Compat-Able Protein Assay Preparation Reagent Set (Pierce), by abicinchoninic acid method using BSA as a protein standard (BCAProtein Assay Kit, Pierce). Equal amounts of protein (15 μg) weremixed with an equal volume of 1× loading buffer containing 8 Murea, 62.5 mM Tris (pH 6.8), 2% SDS, 20% glycerol, and 0.2%bromophenol blue.Immunoblotting. Immunoblotting for glial fibrillary acidic protein(GFAP) and β-actin (loading control) was performed using com-mercially available primary antibodies and HRP-coupled secondaryantibodies with chemiluminescence detection on standard X-rayfilm. Briefly, equal amounts of total protein (10 μg) were loadedand separated by polyacrylamide gel electrophoresis on 4–20%gradient gels (Criterion, Bio-Rad) and transferred onto nitrocel-lulose membranes (Biotrace NT, Pall Life Sciences). Nonspecificbinding sites were blocked (5% skimmed milk in 10 mM Tris pH7.5, 37.5 mM sodium chloride, and 0.5% Tween-20) and mem-branes were incubated for 1 h with antibodies directed againstGFAP or β-actin (Santa Cruz Biotechnology). After repeatedwashings, the membranes were incubated overnight (GFAP) orfor 1 h (actin) with an appropriate species-specific secondary an-tibody. GFAP and actin were detected by enhanced chem-iluminescence following exposure to photographic film (Kodak X-Omat AR). The films were digitized (Linoscan 1400) and storedas tagged image file format images for analysis using ImageJ (6).GFAP optical densities were expressed as the ratio with β-actin.Glutamine synthetase assay.Glutamine synthetase (GS) activity wasmeasured in the synthetase (Glu + ATP + NH2OH) directionusing a modification of the assay of Petito et al. (7) to accom-modate use of a plate reader. Nerve terminals, brain homoge-nate, or cortical tissues were homogenized in 10 volumes of ice-cold 0.15M KCl using a glass homogenizer. Homogenate (100μL; 10:1 v/w) was incubated for 15 min at 37 °C with 0.2 mL ofa reaction mixture containing 50 mM glutamate, 100 mM imid-azole-HCL buffer (pH 7.4), 10 mM β-mercaptoethanol, 10 mMMgCl2, 50 mM hydroxylamine (pH 7.4), and 10 mM ATP. After15 min, the reaction was stopped by addition of 0.8 mL of a so-lution containing 0.37 M ferric chloride, 0.2 M trichloroaceticacid, and 0.67 M HCl, and centrifuged. The supernatant wasincubated for 15 min at room temperature and the colored re-action product, γ-glutamyl hydroxamate, was measured at 540nm using a 96-well plate reader (Biotek Instruments; KC-4 v.3software) and compared with standard quantities of pure γ-glutamylhydroxamate treated with FeCl2 reagent.Incubation of isolated nerve terminals with 13C-labeled substrates. Met-abolic 13C labeling assays were conducted to assess potentialcontamination of nerve terminals by intact astroglia. The nerve
terminals were diluted with isotonic medium (1:5) and were in-cubated with either [2-13C]acetate (12 μL; 100 mM) or [1,6-13C2]glucose (30 μL; 100 mM) plus [U-13C5]glutamate (6 μL; 20 mM) for15 min and 30 min. At the end of the incubation period, the nerveterminal suspensions were centrifuged at 17,000 × g for 10 min at4 °C. Both the pellet and supernatant were frozen in liquid N2and stored separately at −80 °C. In addition, aliquots of brain tissuehomogenates from the nerve terminal preparations were also in-cubated with the same 13C-labeled substrates described above.
Effects of Astroglial Glucose Oxidation on Predicted Neuronal GlucoseUptake. As discussed in Hyder et al. (8), the 1:1 relationshipbetween ΔVcyc and Δ0.5VTCAn allows for direct neuronal glu-cose uptake to the extent that glucose uptake in astrocytes(stimulated by glutamate uptake) is oxidized there, rather thanreleasing lactate for export to neurons. In this case, the predictedneuronal glucose phosphorylation and oxidation in neurons canbe computed as
CMRglcðP+OxÞn = 0:5*VTCAn
−�Vcyc −
hCMRglcðoxÞa −CMRglcðisoÞðoxÞa
i�;
[S1]
where ½CMRglcðoxÞa −CMRglcðisoÞðoxÞa� represents the magnitudeof activity-dependent astrocytic glucose oxidation above isoe-lectricity, effectively reducing the supply of pyruvate (lactate)available for transfer to neurons. Substitution of CMRglcðoxÞa =0:5*ðVPDHa +VPCÞ and CMRglcðisoÞðoxÞa = 0:5*ðVPDHa +VPCÞðisoÞ inEq. S1 gives
CMRglcðP+OxÞn = 0:5*VTCAn −
�Vcyc −
h0:5 * ðVPDHa +VPCÞ
− 0:5 * ðVPDHa +VPCÞðisoÞi�
; [S2]
where VTCAn is the neuronal tricarboxylic acid (TCA) cycle flux,VPDHa is the astroglial pyruvate dehydrogenase flux, and VPC isthe astroglial pyruvate carboxylase flux. Using estimates of as-trocyte oxidation and other fluxes with activity as given in Table2 (legend) with Eq. S2, the predicted CMRglcðP+OxÞ
n for the sei-zure condition would be ∼0.11 μmol·g−1·min−1, which is ∼38%above the value of 0.08 μmol·g−1·min−1 predicted for model 1 un-der the assumption that astroglial oxidation is unchanged by theincreased activity (Table 2). Higher values of astroglial glucose ox-idation than assumed here would lead to correspondingly moreglucose uptake in neurons (8, 9) to satisfy their oxidative needs.The expression, 0.5*(VPDHa + VPC) in Eq. S2, is equal to
the rate of astroglial oxidation, CMRglc(ox)a. From Gruetteret al. (10):
CMRglcðoxÞa =�VTCA
g +VPC
�.2; where VTCA
g
=Vg +VPC and Vg =VPDHa −VPC;
which, after substitution of VTCAg and rearrangement, becomes
CMRglcðoxÞa =��Vg +VPC
�+VPC
��2 =
�Vg + 2VPC
��2
=Vg=2+VPC:[S3]
With substitution of Vg (= VPDHa – VPC) in Eq. S3,
CMRglcðoxÞa = ðVPDHa −VPCÞ=2+VPC = ðVPDHa +VPCÞ=2:[S4]
Eq. S4 appears in Eqs. 2 and 5 and Table 2 legend.
Patel et al. www.pnas.org/cgi/content/short/1403576111 2 of 6
1. Fitzpatrick SM, Hetherington HP, Behar KL, Shulman RG (1990) The flux from glucoseto glutamate in the rat brain in vivo as determined by 1H-observed, 13C-edited NMRspectroscopy. J Cereb Blood Flow Metab 10(2):170–179.
2. Patel AB, et al. (2004) Glutamatergic neurotransmission and neuronal glucose oxidationare coupled during intense neuronal activation. J Cereb Blood Flow Metab 24(9):972–985.
3. Lai JCK, Clark JB (1989) Isolation and Characterization of Synaptic and NonsynapticMitochondria From Mammalian Brain (Humana Press, Inc., Clifton, NJ).
4. Oberdorfer F, Hull WE, Traving BC, Maier-Borst W (1986) Synthesis and purification of 2-deoxy-2-[18F]fluoro-D-glucose and 2-deoxy-2-[18F]fluoro-D-mannose: Characterization ofproducts by 1H- and 19F-NMR spectroscopy. Int J Rad Appl Instrum [A] 37(8):695–701.
5. de Graaf RA, Brown PB, Mason GF, Rothman DL, Behar KL (2003) Detection of[1,6-13C2]-glucose metabolism in rat brain by in vivo 1H-[13C]-NMR spectroscopy.MagnReson Med 49(1):37–46.
6. Schneider CA, Rasband WS, Eliceiri KW (2012) NIH Image to ImageJ: 25 years of imageanalysis. Nat Methods 9(7):671–675.
7. Petito CK, Chung MC, Verkhovsky LM, Cooper AJ (1992) Brain glutamine synthetaseincreases following cerebral ischemia in the rat. Brain Res 569(2):275–280.
8. Hyder F, et al. (2006) Neuronal-glial glucose oxidation and glutamatergic-GABAergicfunction. J Cereb Blood Flow Metab 26(7):865–877.
9. Jolivet R, Magistretti PJ, Weber B (2009) Deciphering neuron-glia compartmentalizationin cortical energy metabolism. Front Neuroenergetics 1:4.
10. Gruetter R, Seaquist ER, Ugurbil K (2001) A mathematical model of compartmentalizedneurotransmitter metabolism in the human brain. Am J Physiol Endocrinol Metab281(1):E100–E112.
A) B)
0 10 20 30 40 50 600.0
0.4
0.8
1.2
1.6
CONTROL SEIZURE
Plas
ma
FDG
(mM
)
Time (min)0 10 20 30 40 50 60
0
2
4
6
8
10
CONTROL SEIZURE
Plas
ma
FDG
(mol
e %
)Time (min)
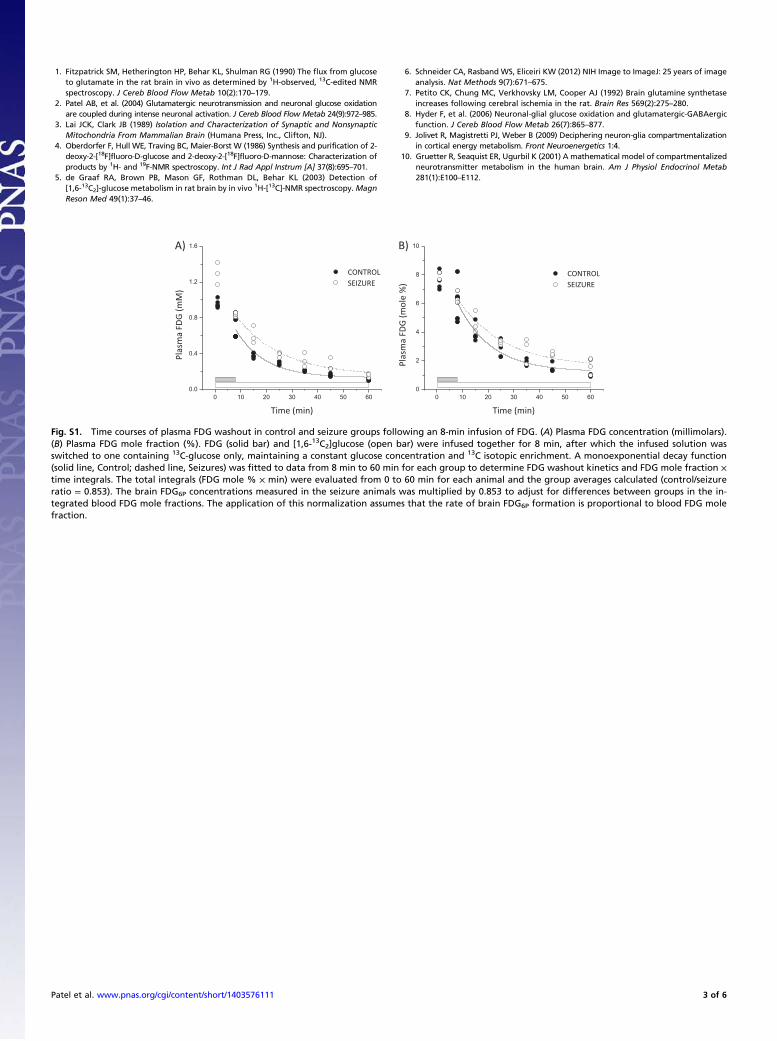
Fig. S1. Time courses of plasma FDG washout in control and seizure groups following an 8-min infusion of FDG. (A) Plasma FDG concentration (millimolars).(B) Plasma FDG mole fraction (%). FDG (solid bar) and [1,6-13C2]glucose (open bar) were infused together for 8 min, after which the infused solution wasswitched to one containing 13C-glucose only, maintaining a constant glucose concentration and 13C isotopic enrichment. A monoexponential decay function(solid line, Control; dashed line, Seizures) was fitted to data from 8 min to 60 min for each group to determine FDG washout kinetics and FDG mole fraction ×time integrals. The total integrals (FDG mole % × min) were evaluated from 0 to 60 min for each animal and the group averages calculated (control/seizureratio = 0.853). The brain FDG6P concentrations measured in the seizure animals was multiplied by 0.853 to adjust for differences between groups in the in-tegrated blood FDG mole fractions. The application of this normalization assumes that the rate of brain FDG6P formation is proportional to blood FDG molefraction.
Patel et al. www.pnas.org/cgi/content/short/1403576111 3 of 6
β-FDG + β-FDG6P
α-FDG
α-FDG6P
β-FDG + β-FDG6P
α-FDG
α-FDG6P
6P
α-FDG
α-FDG6P
6P
α-FDG
α-FDG6P
A) Control B) Seizures
β-FDG6P+ β-FDG
α-FDG
α-FDG6P
β-FDG6P+ β-FDG
α-FDG6P
ppm ppm-121.4 -121.6 -121.8 -121.4 -121.6 -121.8
α-FDG
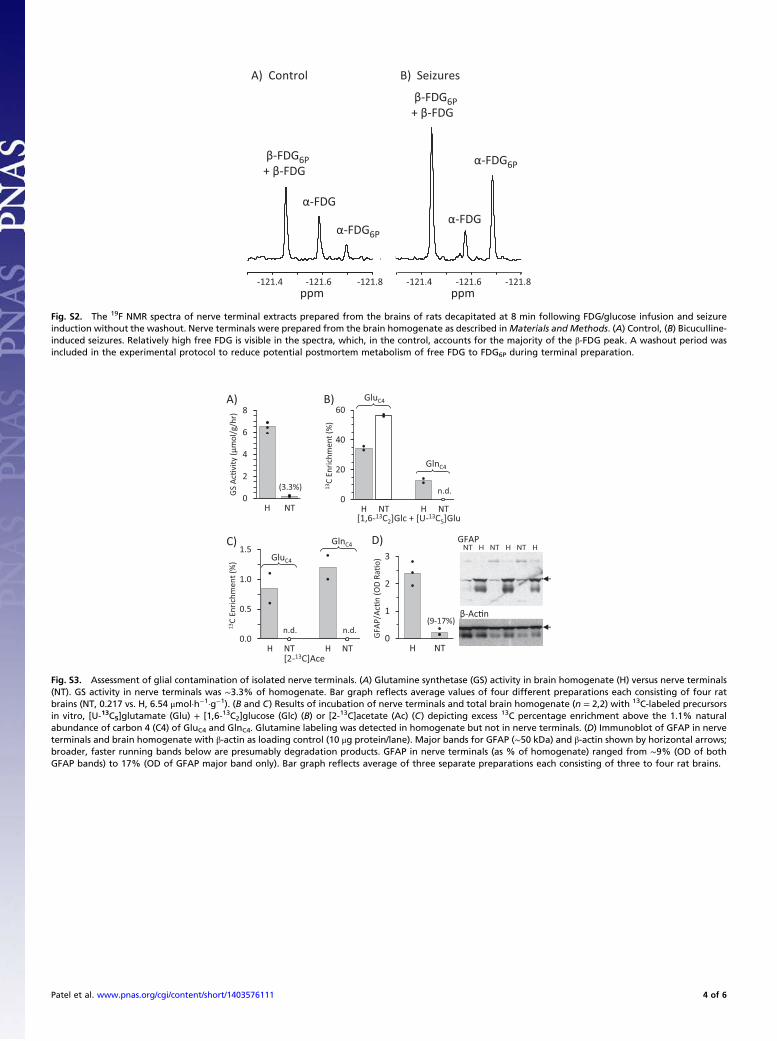
Fig. S2. The 19F NMR spectra of nerve terminal extracts prepared from the brains of rats decapitated at 8 min following FDG/glucose infusion and seizureinduction without the washout. Nerve terminals were prepared from the brain homogenate as described inMaterials and Methods. (A) Control, (B) Bicuculline-induced seizures. Relatively high free FDG is visible in the spectra, which, in the control, accounts for the majority of the β-FDG peak. A washout period wasincluded in the experimental protocol to reduce potential postmortem metabolism of free FDG to FDG6P during terminal preparation.
GluC4
n.d.
[1,6-13C2]Glc + [U-13C5]Glu
GlnC4
B)
0
20
40
60
H NT H NT
13C
Enric
hmen
t (%
)
n.d.
[2-13C]Ace
n.d.
GluC4
GlnC4C)
0.0
0.5
1.0
1.5
H NT H NT
13C
Enric
hmen
t (%
)
GFAPNT H NT H NT H
β-Ac�n
0
2
4
6
8
H NT
(3.3%)
GS A
c�vi
ty (μ
mol
/g/h
r)
A)
0
1
2
3
H NT
GFA
P/Ac
�n (O
D Ra
�o)
(9-17%)
D)
Fig. S3. Assessment of glial contamination of isolated nerve terminals. (A) Glutamine synthetase (GS) activity in brain homogenate (H) versus nerve terminals(NT). GS activity in nerve terminals was ∼3.3% of homogenate. Bar graph reflects average values of four different preparations each consisting of four ratbrains (NT, 0.217 vs. H, 6.54 μmol·h−1·g−1). (B and C) Results of incubation of nerve terminals and total brain homogenate (n = 2,2) with 13C-labeled precursorsin vitro, [U-13C5]glutamate (Glu) + [1,6-13C2]glucose (Glc) (B) or [2-13C]acetate (Ac) (C) depicting excess 13C percentage enrichment above the 1.1% naturalabundance of carbon 4 (C4) of GluC4 and GlnC4. Glutamine labeling was detected in homogenate but not in nerve terminals. (D) Immunoblot of GFAP in nerveterminals and brain homogenate with β-actin as loading control (10 μg protein/lane). Major bands for GFAP (∼50 kDa) and β-actin shown by horizontal arrows;broader, faster running bands below are presumably degradation products. GFAP in nerve terminals (as % of homogenate) ranged from ∼9% (OD of bothGFAP bands) to 17% (OD of GFAP major band only). Bar graph reflects average of three separate preparations each consisting of three to four rat brains.
Patel et al. www.pnas.org/cgi/content/short/1403576111 4 of 6
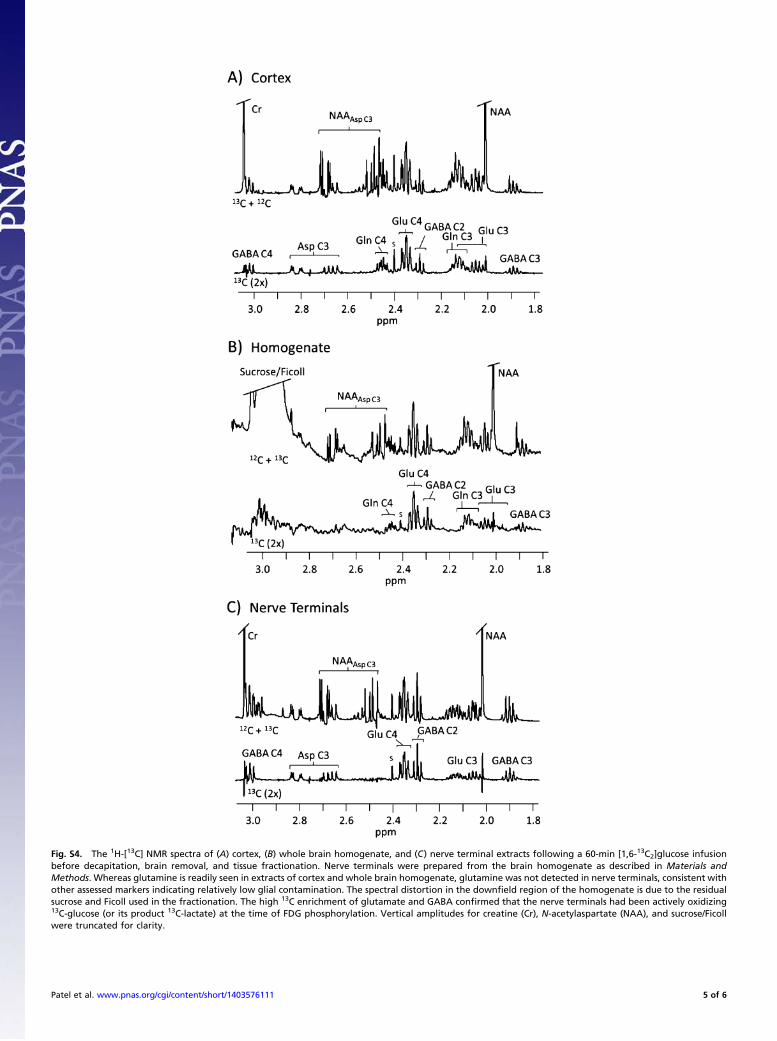
Fig. S4. The 1H-[13C] NMR spectra of (A) cortex, (B) whole brain homogenate, and (C) nerve terminal extracts following a 60-min [1,6-13C2]glucose infusionbefore decapitation, brain removal, and tissue fractionation. Nerve terminals were prepared from the brain homogenate as described in Materials andMethods. Whereas glutamine is readily seen in extracts of cortex and whole brain homogenate, glutamine was not detected in nerve terminals, consistent withother assessed markers indicating relatively low glial contamination. The spectral distortion in the downfield region of the homogenate is due to the residualsucrose and Ficoll used in the fractionation. The high 13C enrichment of glutamate and GABA confirmed that the nerve terminals had been actively oxidizing13C-glucose (or its product 13C-lactate) at the time of FDG phosphorylation. Vertical amplitudes for creatine (Cr), N-acetylaspartate (NAA), and sucrose/Ficollwere truncated for clarity.
Patel et al. www.pnas.org/cgi/content/short/1403576111 5 of 6
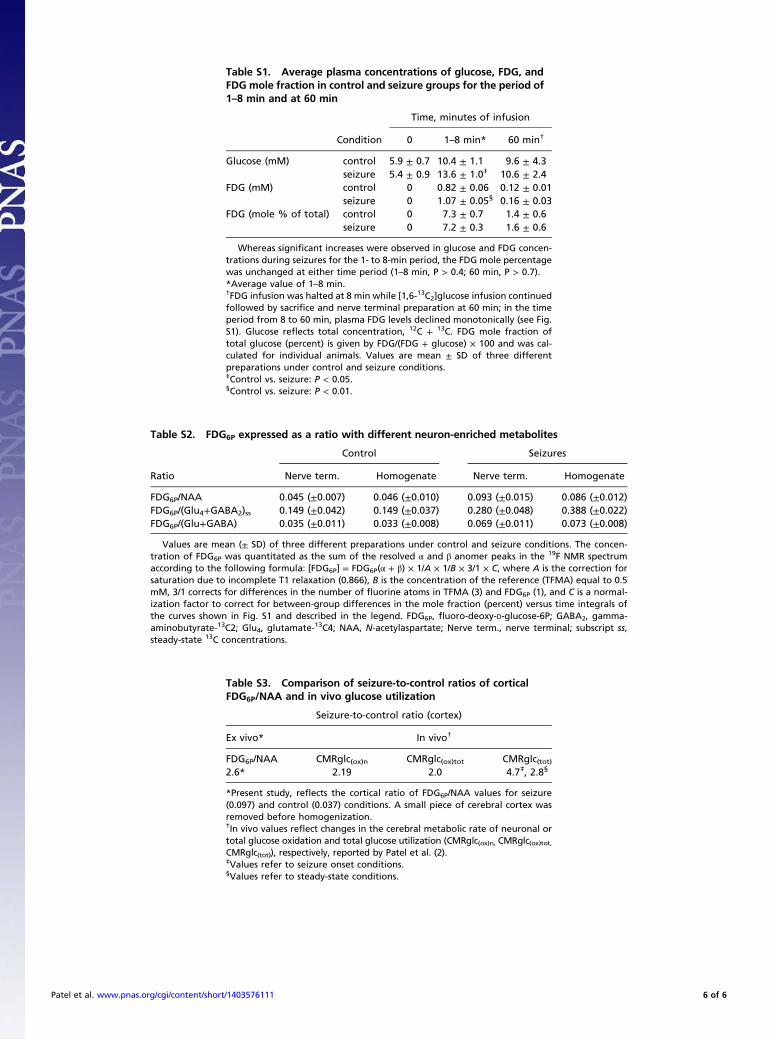
Table S1. Average plasma concentrations of glucose, FDG, andFDG mole fraction in control and seizure groups for the period of1–8 min and at 60 min
Condition
Time, minutes of infusion
0 1–8 min* 60 min†
Glucose (mM) control 5.9 ± 0.7 10.4 ± 1.1 9.6 ± 4.3seizure 5.4 ± 0.9 13.6 ± 1.0‡ 10.6 ± 2.4
FDG (mM) control 0 0.82 ± 0.06 0.12 ± 0.01seizure 0 1.07 ± 0.05§ 0.16 ± 0.03
FDG (mole % of total) control 0 7.3 ± 0.7 1.4 ± 0.6seizure 0 7.2 ± 0.3 1.6 ± 0.6
Whereas significant increases were observed in glucose and FDG concen-trations during seizures for the 1- to 8-min period, the FDG mole percentagewas unchanged at either time period (1–8 min, P > 0.4; 60 min, P > 0.7).*Average value of 1–8 min.†FDG infusion was halted at 8 min while [1,6-13C2]glucose infusion continuedfollowed by sacrifice and nerve terminal preparation at 60 min; in the timeperiod from 8 to 60 min, plasma FDG levels declined monotonically (see Fig.S1). Glucose reflects total concentration, 12C + 13C. FDG mole fraction oftotal glucose (percent) is given by FDG/(FDG + glucose) × 100 and was cal-culated for individual animals. Values are mean ± SD of three differentpreparations under control and seizure conditions.‡Control vs. seizure: P < 0.05.§Control vs. seizure: P < 0.01.
Table S2. FDG6P expressed as a ratio with different neuron-enriched metabolites
Ratio
Control Seizures
Nerve term. Homogenate Nerve term. Homogenate
FDG6P/NAA 0.045 (±0.007) 0.046 (±0.010) 0.093 (±0.015) 0.086 (±0.012)FDG6P/(Glu4+GABA2)ss 0.149 (±0.042) 0.149 (±0.037) 0.280 (±0.048) 0.388 (±0.022)FDG6P/(Glu+GABA) 0.035 (±0.011) 0.033 (±0.008) 0.069 (±0.011) 0.073 (±0.008)
Values are mean (± SD) of three different preparations under control and seizure conditions. The concen-tration of FDG6P was quantitated as the sum of the resolved α and β anomer peaks in the 19F NMR spectrumaccording to the following formula: [FDG6P] = FDG6P(α + β) × 1/A × 1/B × 3/1 × C, where A is the correction forsaturation due to incomplete T1 relaxation (0.866), B is the concentration of the reference (TFMA) equal to 0.5mM, 3/1 corrects for differences in the number of fluorine atoms in TFMA (3) and FDG6P (1), and C is a normal-ization factor to correct for between-group differences in the mole fraction (percent) versus time integrals ofthe curves shown in Fig. S1 and described in the legend. FDG6P, fluoro-deoxy-D-glucose-6P; GABA2, gamma-aminobutyrate-13C2; Glu4, glutamate-13C4; NAA, N-acetylaspartate; Nerve term., nerve terminal; subscript ss,steady-state 13C concentrations.
Table S3. Comparison of seizure-to-control ratios of corticalFDG6P/NAA and in vivo glucose utilization
Seizure-to-control ratio (cortex)
Ex vivo* In vivo†
FDG6P/NAA CMRglc(ox)n CMRglc(ox)tot CMRglc(tot)2.6* 2.19 2.0 4.7‡, 2.8§
*Present study, reflects the cortical ratio of FDG6P/NAA values for seizure(0.097) and control (0.037) conditions. A small piece of cerebral cortex wasremoved before homogenization.†In vivo values reflect changes in the cerebral metabolic rate of neuronal ortotal glucose oxidation and total glucose utilization (CMRglc(ox)n, CMRglc(ox)tot,CMRglc(tot)), respectively, reported by Patel et al. (2).‡Values refer to seizure onset conditions.§Values refer to steady-state conditions.
Patel et al. www.pnas.org/cgi/content/short/1403576111 6 of 6
Related Documents