Direct electron heating experiment on the Aditya tokamak using fast waves in the ion cyclotron resonance frequency range This article has been downloaded from IOPscience. Please scroll down to see the full text article. 2011 Plasma Phys. Control. Fusion 53 095011 (http://iopscience.iop.org/0741-3335/53/9/095011) Download details: IP Address: 202.131.103.220 The article was downloaded on 05/08/2011 at 04:56 Please note that terms and conditions apply. View the table of contents for this issue, or go to the journal homepage for more Home Search Collections Journals About Contact us My IOPscience

Welcome message from author
This document is posted to help you gain knowledge. Please leave a comment to let me know what you think about it! Share it to your friends and learn new things together.
Transcript
Direct electron heating experiment on the Aditya tokamak using fast waves in the ion
cyclotron resonance frequency range
This article has been downloaded from IOPscience. Please scroll down to see the full text article.
2011 Plasma Phys. Control. Fusion 53 095011
(http://iopscience.iop.org/0741-3335/53/9/095011)
Download details:
IP Address: 202.131.103.220
The article was downloaded on 05/08/2011 at 04:56
Please note that terms and conditions apply.
View the table of contents for this issue, or go to the journal homepage for more
Home Search Collections Journals About Contact us My IOPscience
IOP PUBLISHING PLASMA PHYSICS AND CONTROLLED FUSION
Plasma Phys. Control. Fusion 53 (2011) 095011 (10pp) doi:10.1088/0741-3335/53/9/095011
Direct electron heating experiment on the Adityatokamak using fast waves in the ion cyclotronresonance frequency range
Kishore Mishra, S V Kulkarni, D Rathi, Atul D Varia, H M Jadav,K M Parmar, B R Kadia, R Joshi, Y S S Srinivas, Raj Singh,Sunil Kumar, S Dani, A Gayatri, R A Yogi, Singh Manoj, Y S Joisa,C V S Rao, Sameer Kumar, R Jha, R Manchanda, J Ghosh, P K Atrey,S B Bhatt, C N Gupta, P K Chattopadhyaya, A K Chattopadhyaya,R Srinivasan, Dhiraj Bora, P K Kaw and Aditya Team
Institute for Plasma Research, Bhat, Gandhinagar, 382 428, Gujarat, India
E-mail: [email protected]
Received 25 February 2011, in final form 15 June 2011Published 4 August 2011Online at stacks.iop.org/PPCF/53/095011
AbstractSecond harmonic heating experiments using fast waves are carried out on theAditya tokamak in the ion cyclotron resonance frequency (ICRF) range withthe help of a 200 kW, 20–40 MHz RF heating system, which is developedindigenously. Significant direct electron heating is observed in a hydrogenplasma. The rise in electron temperature is prompt with the application ofRF power and the increment in electron temperature increases linearly with RFpower. A corresponding increase in plasma beta and hence an increase in storeddiamagnetic energy are also observed in the presence of RF power. The low-Zimpurity radiation and electron density do not increase significantly with RFpower. The direct electron heating by fast wave in Aditya is also predicted bythe ion cyclotron resonance heating code TORIC.
(Some figures in this article are in colour only in the electronic version)
1. Introduction
Plasma heating by fast magneto-sonic waves in the ion cyclotron resonance frequency (ICRF)range at second harmonic is an established method of radio frequency heating in tokamaks andother devices [1, 2] and is found to be quite successful. The fast wave (FW) is a compressionalwave that propagates primarily perpendicular to the static toroidal magnetic field [3]. Inmost cases, after tunneling a thin evanescent layer from the low magnetic field side, itpropagates to the cyclotron resonance layer as defined by the launched RF frequency andstatic toroidal magnetic field. The wave energy is absorbed either directly by ions throughcyclotron absorption, or indirectly via mode conversion in a single or multi-species plasma.
0741-3335/11/095011+10$33.00 © 2011 IOP Publishing Ltd Printed in the UK & the USA 1
Plasma Phys. Control. Fusion 53 (2011) 095011 K Mishra et al
FWs have also been seen to transfer their wave energy to electrons broadly by two mechanisms.The first one is indirect electron heating, where resonating majority or minority ions pick upenergy from waves and transfer their energy to electrons via collisional equipartition. Thesecond mechanism is a direct electron heating where FW is damped on electrons via electronLandau damping (ELD) and transit time magnetic pumping (TTMP) [4–6]. Both direct andindirect electron heating are observed in JET [7] and DIII-D [8] tokamaks with various minorityheating scenarios, namely H in D, 3He in 4He and 3He in D plasmas. In DIII-D experiments, theeffectiveness of electron heating is found to increase with target electron temperature, whichis in the range 0.7–1.3 keV. In TFTR, direct electron heating by FW is observed in the 3Heminority regime with D plasma heated with neutral beam injection (NBI), but without any 3Hepresent in the plasma [9]. In their experiments, the only ion resonance is the D fundamentalat the high-field side. In all these experiments, the target plasma is either of two species orpreheated with NBI or EC to enable the high-energy tail electrons to interact with FWs. To thebest of our knowledge, direct electron heating in a low-temperature (<500 eV) single speciesplasma (H2) in a medium-sized tokamak is not observed elsewhere.
We report here the direct electron heating observed on the Aditya tokamak [10] in hydrogenplasma at a low temperature and having a second harmonic resonance layer near the plasmacenter. A prompt rise in electron temperature with application of RF power and its linear risewith RF power are observed in this experiment. No significant impurity production or rise indensity is seen with RF power, and an increase in stored diamagnetic energy is observed withthe application of RF power. The experimental results are in conformity with the simulationof power deposition profile using the TORIC code.
The rest of the paper is organized as follows: section 2 briefly describes the Aditya ICRFsystem; section 3 contains experimental conditions, and results are discussed in detail insection 4. In section 5 propagation characteristics using the cold plasma dispersion relationand wave absorption profiles using the TORIC code are discussed. Section 6 concludes thepaper along with future scope.
2. Aditya ICRF system
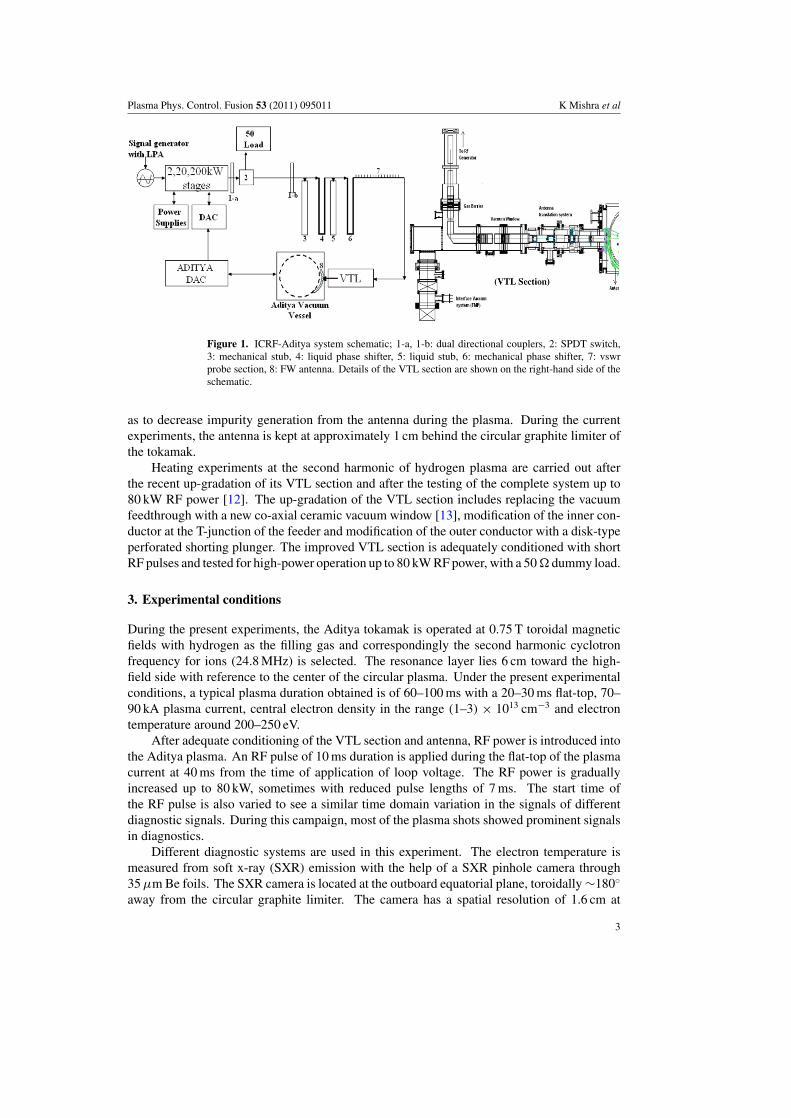
A system of plasma heating by a poloidal-type FW antenna is currently being employed onthe Aditya tokamak [10, 11]. Aditya is a medium-sized tokamak (R = 0.75 m, a = 0.25 m,Bt = 0.75 T) with hydrogen plasma in the circular channel cross-section. The ICRF systemon Aditya is of 20–40 MHz frequency range and 200 kW of RF power. A simplified blockdiagram of the complete ICRF system on Aditya is shown in figure 1. A 100 m long 9 inch co-axial copper transmission line carries RF power from the generator to the Aditya tokamak. Aseries of SPDT switches allow us to divert the RF power either toward Aditya or toward a 50 �
water dummy load system housed in a generator hall for testing purpose. A matching networkconsisting of two stubs and two phase shifters is placed between the antenna and the generatorfor matching antenna–plasma impedance to that of the 50 � impedance of the generator andtransmission line. A vacuum transmission line (VTL) section, which has a separate vacuumsystem, isolates the Aditya vacuum from the atmospheric pressure transmission line. The VTLsection also facilitates the radial movement of antenna up to 3 cm in the scrape-off layer (SOL)of the Aditya plasma. The VTL section also has a provision of torque rings to bring backthe antenna to its original position in case of antenna movement during plasma disruption. Ashorted strip line type FW antenna is placed inside the Aditya torus poloidally to inject RFpower into the plasma. The poloidal-type FW antenna (length 30 cm, width 10 cm) is made upof stainless steel (SS304L) material with grounded Faraday shield and has graphite tiles on theplasma facing sides to protect the antenna from damage due to high-energy particles as well
2
Plasma Phys. Control. Fusion 53 (2011) 095011 K Mishra et al
Figure 1. ICRF-Aditya system schematic; 1-a, 1-b: dual directional couplers, 2: SPDT switch,3: mechanical stub, 4: liquid phase shifter, 5: liquid stub, 6: mechanical phase shifter, 7: vswrprobe section, 8: FW antenna. Details of the VTL section are shown on the right-hand side of theschematic.
as to decrease impurity generation from the antenna during the plasma. During the currentexperiments, the antenna is kept at approximately 1 cm behind the circular graphite limiter ofthe tokamak.
Heating experiments at the second harmonic of hydrogen plasma are carried out afterthe recent up-gradation of its VTL section and after the testing of the complete system up to80 kW RF power [12]. The up-gradation of the VTL section includes replacing the vacuumfeedthrough with a new co-axial ceramic vacuum window [13], modification of the inner con-ductor at the T-junction of the feeder and modification of the outer conductor with a disk-typeperforated shorting plunger. The improved VTL section is adequately conditioned with shortRF pulses and tested for high-power operation up to 80 kW RF power, with a 50 � dummy load.
3. Experimental conditions
During the present experiments, the Aditya tokamak is operated at 0.75 T toroidal magneticfields with hydrogen as the filling gas and correspondingly the second harmonic cyclotronfrequency for ions (24.8 MHz) is selected. The resonance layer lies 6 cm toward the high-field side with reference to the center of the circular plasma. Under the present experimentalconditions, a typical plasma duration obtained is of 60–100 ms with a 20–30 ms flat-top, 70–90 kA plasma current, central electron density in the range (1–3) × 1013 cm−3 and electrontemperature around 200–250 eV.
After adequate conditioning of the VTL section and antenna, RF power is introduced intothe Aditya plasma. An RF pulse of 10 ms duration is applied during the flat-top of the plasmacurrent at 40 ms from the time of application of loop voltage. The RF power is graduallyincreased up to 80 kW, sometimes with reduced pulse lengths of 7 ms. The start time ofthe RF pulse is also varied to see a similar time domain variation in the signals of differentdiagnostic signals. During this campaign, most of the plasma shots showed prominent signalsin diagnostics.
Different diagnostic systems are used in this experiment. The electron temperature ismeasured from soft x-ray (SXR) emission with the help of a SXR pinhole camera through35 µm Be foils. The SXR camera is located at the outboard equatorial plane, toroidally ∼180◦
away from the circular graphite limiter. The camera has a spatial resolution of 1.6 cm at
3
Plasma Phys. Control. Fusion 53 (2011) 095011 K Mishra et al
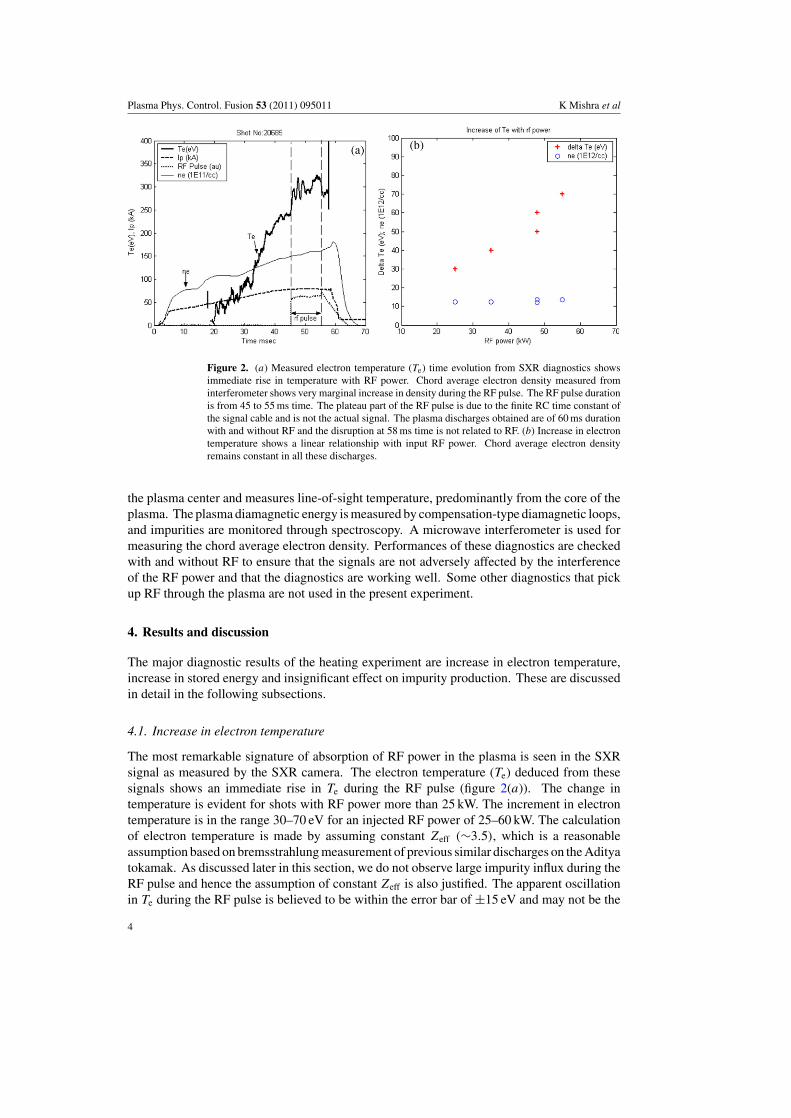
Figure 2. (a) Measured electron temperature (Te) time evolution from SXR diagnostics showsimmediate rise in temperature with RF power. Chord average electron density measured frominterferometer shows very marginal increase in density during the RF pulse. The RF pulse durationis from 45 to 55 ms time. The plateau part of the RF pulse is due to the finite RC time constant ofthe signal cable and is not the actual signal. The plasma discharges obtained are of 60 ms durationwith and without RF and the disruption at 58 ms time is not related to RF. (b) Increase in electrontemperature shows a linear relationship with input RF power. Chord average electron densityremains constant in all these discharges.
the plasma center and measures line-of-sight temperature, predominantly from the core of theplasma. The plasma diamagnetic energy is measured by compensation-type diamagnetic loops,and impurities are monitored through spectroscopy. A microwave interferometer is used formeasuring the chord average electron density. Performances of these diagnostics are checkedwith and without RF to ensure that the signals are not adversely affected by the interferenceof the RF power and that the diagnostics are working well. Some other diagnostics that pickup RF through the plasma are not used in the present experiment.
4. Results and discussion
The major diagnostic results of the heating experiment are increase in electron temperature,increase in stored energy and insignificant effect on impurity production. These are discussedin detail in the following subsections.
4.1. Increase in electron temperature
The most remarkable signature of absorption of RF power in the plasma is seen in the SXRsignal as measured by the SXR camera. The electron temperature (Te) deduced from thesesignals shows an immediate rise in Te during the RF pulse (figure 2(a)). The change intemperature is evident for shots with RF power more than 25 kW. The increment in electrontemperature is in the range 30–70 eV for an injected RF power of 25–60 kW. The calculationof electron temperature is made by assuming constant Zeff (∼3.5), which is a reasonableassumption based on bremsstrahlung measurement of previous similar discharges on the Adityatokamak. As discussed later in this section, we do not observe large impurity influx during theRF pulse and hence the assumption of constant Zeff is also justified. The apparent oscillationin Te during the RF pulse is believed to be within the error bar of ±15 eV and may not be the
4
Plasma Phys. Control. Fusion 53 (2011) 095011 K Mishra et al
actual Te fluctuation. In these discharges we have not observed sawtooth activity because oflow temperature and high MHD discharges. In Aditya, sawtoothing is generally observed attemperatures 300–450 eV for different Zeff .
It is very interesting to ascertain the mechanism of increase in electron temperature (Te)by ICRF when a second harmonic resonance layer for hydrogen ions is present near the plasmacenter. ICRF is known to heat electrons broadly by two different mechanisms. The first oneis usual ion heating through second harmonic or at minority heating where energetic ionsgive away energy to electrons through collision. This method of electron heating is normallyreferred to as indirect electron heating. The second mechanism is called direct electron heatingwhere collisionless absorption of FW to electrons occurs via ELD and TTMP. The remarkabledifference between the above two electron heating mechanisms is the time scales in which theplasma responds to RF power. In the case of indirect electron heating the typical time scale withwhich Te evolves would be the ion slowing down time [14] on electrons collisionally, whichis typically 6 ms for an electron temperature of 200 eV, electron density of 1 × 1013 cm−3 andCoulomb logarithm for a medium-sized tokamak of 15 for the present experiment. The Te risein our case is, however, much faster as seen in figure 2(a), and hence such a prompt responseof Te may not have been possible due to indirect electron heating. In case direct electronheating should take place, the time scale would be governed by the electron–electron collisiontime, which is of the order of microseconds for the present experimental parameters. Thisindicates that in the case of direct electron heating, the temperature rise should be prompt withthe application of RF, which is observed in our case. Another remarkable signature of directelectron heating is that the increment of electron temperature has almost a linear relation withthe applied RF power, which is seen in the present experiment (figure 2(b)). Erickson et al [7]also reported similar observations on JET. Although, we have not measured ion temperaturein this set of experiments, the possibility of ion heating through cyclotron resonance cannotbe ruled out which is also predicted by simulation results using the TORIC code as shown inthe next section and needs to be explored further.
4.2. Increase in stored energy
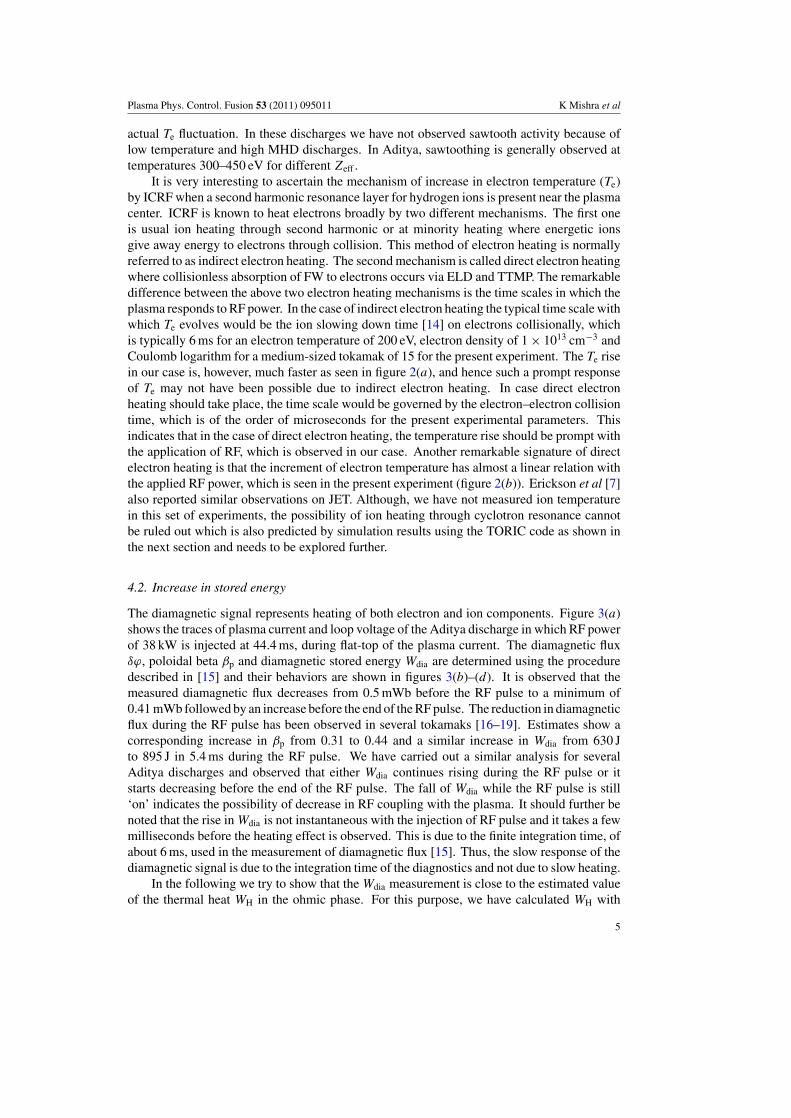
The diamagnetic signal represents heating of both electron and ion components. Figure 3(a)shows the traces of plasma current and loop voltage of the Aditya discharge in which RF powerof 38 kW is injected at 44.4 ms, during flat-top of the plasma current. The diamagnetic fluxδϕ, poloidal beta βp and diamagnetic stored energy Wdia are determined using the proceduredescribed in [15] and their behaviors are shown in figures 3(b)–(d). It is observed that themeasured diamagnetic flux decreases from 0.5 mWb before the RF pulse to a minimum of0.41 mWb followed by an increase before the end of the RF pulse. The reduction in diamagneticflux during the RF pulse has been observed in several tokamaks [16–19]. Estimates show acorresponding increase in βp from 0.31 to 0.44 and a similar increase in Wdia from 630 Jto 895 J in 5.4 ms during the RF pulse. We have carried out a similar analysis for severalAditya discharges and observed that either Wdia continues rising during the RF pulse or itstarts decreasing before the end of the RF pulse. The fall of Wdia while the RF pulse is still‘on’ indicates the possibility of decrease in RF coupling with the plasma. It should further benoted that the rise in Wdia is not instantaneous with the injection of RF pulse and it takes a fewmilliseconds before the heating effect is observed. This is due to the finite integration time, ofabout 6 ms, used in the measurement of diamagnetic flux [15]. Thus, the slow response of thediamagnetic signal is due to the integration time of the diagnostics and not due to slow heating.
In the following we try to show that the Wdia measurement is close to the estimated valueof the thermal heat WH in the ohmic phase. For this purpose, we have calculated WH with
5
Plasma Phys. Control. Fusion 53 (2011) 095011 K Mishra et al
Figure 3. (a) Plasma current and loop voltage in ICRF heated plasma discharge, (b) diamagneticflux, (c) poloidal beta and (d) stored diamagnetic energy.
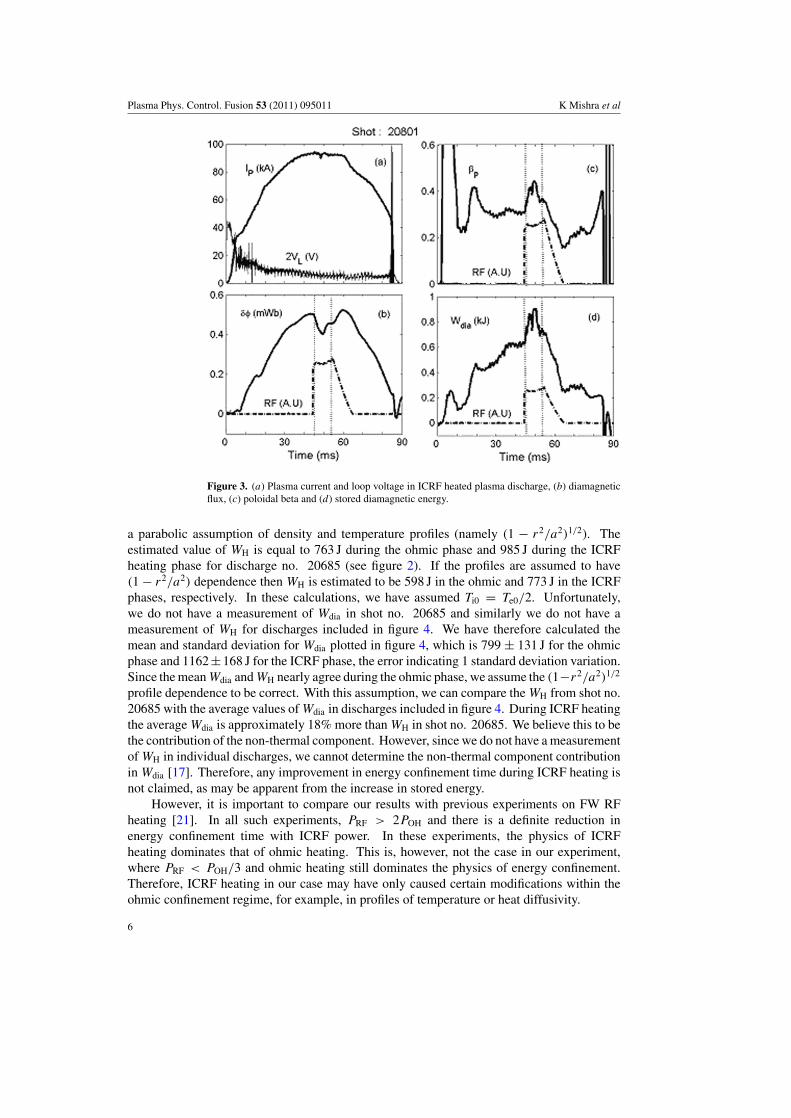
a parabolic assumption of density and temperature profiles (namely (1 − r2/a2)1/2). Theestimated value of WH is equal to 763 J during the ohmic phase and 985 J during the ICRFheating phase for discharge no. 20685 (see figure 2). If the profiles are assumed to have(1 − r2/a2) dependence then WH is estimated to be 598 J in the ohmic and 773 J in the ICRFphases, respectively. In these calculations, we have assumed Ti0 = Te0/2. Unfortunately,we do not have a measurement of Wdia in shot no. 20685 and similarly we do not have ameasurement of WH for discharges included in figure 4. We have therefore calculated themean and standard deviation for Wdia plotted in figure 4, which is 799 ± 131 J for the ohmicphase and 1162±168 J for the ICRF phase, the error indicating 1 standard deviation variation.Since the mean Wdia and WH nearly agree during the ohmic phase, we assume the (1−r2/a2)1/2
profile dependence to be correct. With this assumption, we can compare the WH from shot no.20685 with the average values of Wdia in discharges included in figure 4. During ICRF heatingthe average Wdia is approximately 18% more than WH in shot no. 20685. We believe this to bethe contribution of the non-thermal component. However, since we do not have a measurementof WH in individual discharges, we cannot determine the non-thermal component contributionin Wdia [17]. Therefore, any improvement in energy confinement time during ICRF heating isnot claimed, as may be apparent from the increase in stored energy.
However, it is important to compare our results with previous experiments on FW RFheating [21]. In all such experiments, PRF > 2POH and there is a definite reduction inenergy confinement time with ICRF power. In these experiments, the physics of ICRFheating dominates that of ohmic heating. This is, however, not the case in our experiment,where PRF < POH/3 and ohmic heating still dominates the physics of energy confinement.Therefore, ICRF heating in our case may have only caused certain modifications within theohmic confinement regime, for example, in profiles of temperature or heat diffusivity.
6
Plasma Phys. Control. Fusion 53 (2011) 095011 K Mishra et al
Figure 4. Stored energy measured with diamagnetic loop, Wdia, as a function of absorbed powerPin = POH +PRF −PRAD, where POH is the ohmic power, PRF is the injected ICRF power and PRADis the radiated power as measured by the bolometer camera [15, 20]. Since the PRAD measurementgets affected during ICRF, we use the same value as before the ICRF pulse. Symbols having thesame colors represent data from the same discharge.
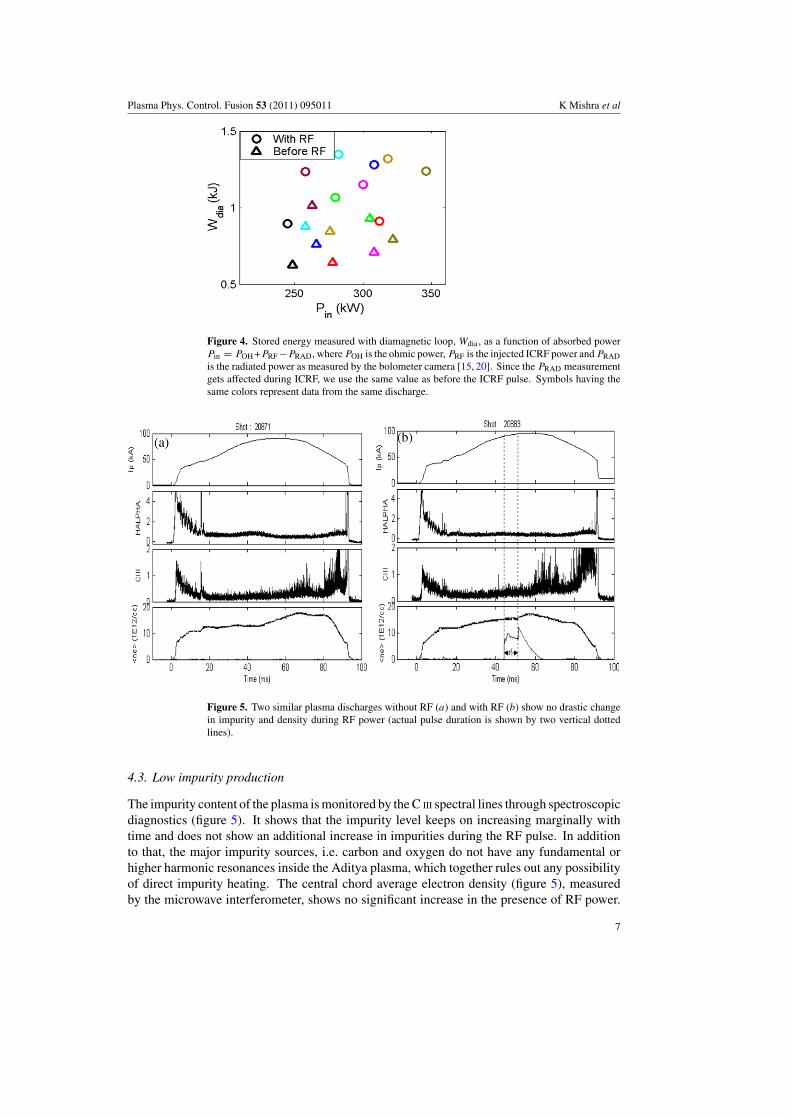
Figure 5. Two similar plasma discharges without RF (a) and with RF (b) show no drastic changein impurity and density during RF power (actual pulse duration is shown by two vertical dottedlines).
4.3. Low impurity production
The impurity content of the plasma is monitored by the C III spectral lines through spectroscopicdiagnostics (figure 5). It shows that the impurity level keeps on increasing marginally withtime and does not show an additional increase in impurities during the RF pulse. In additionto that, the major impurity sources, i.e. carbon and oxygen do not have any fundamental orhigher harmonic resonances inside the Aditya plasma, which together rules out any possibilityof direct impurity heating. The central chord average electron density (figure 5), measuredby the microwave interferometer, shows no significant increase in the presence of RF power.
7
Plasma Phys. Control. Fusion 53 (2011) 095011 K Mishra et al
This can again be correlated with the fact that density generally rises during RF heating whenthe latter induces impurity influx into the plasma, which is not seen in our case. Althoughin many ICRF heating experiments it is observed that the antenna introduces a significantamount of impurities into the plasma, similar effects are not observed in our case. In thepresent experiment high-Z impurities are not monitored. However, we do not expect [22] it tobe present in our case owing to low edge density ((2 –5)×1011 cm−3) and low edge temperature(15–20 eV) near the antenna as measured by the Langmuir probe [23]. Our ICRF antenna isprotected by graphite tiles on all the four sides and is kept behind the limiter avoiding directexposure to the plasma. The antenna is well conditioned and we have not observed arcing on itduring the operation and as inspected after the experiment. Low-voltage (∼2–3 kV) operationof the ICRF antenna in the present experiment and low edge density near the antenna alsoreduce the sheath effect and hence generation of impurities [24, 25]. These may be some ofthe explanations as to why we have not observed a rise in impurity during ICRF in the presentexperiment.
5. Wave propagation and power absorption
The present experiment uses a FW antenna located poloidally at the low-field side. In thisconfiguration, the wave propagation characteristics are obtained by solving the cold plasmadispersion relation [26]. For the case when the antenna is placed behind the limiter, we find thatthe slow wave does not propagate, as it is totally evanescent, while the FW freely propagates inthe plasma volume with virtually no evanescent layer. However in reality since the antenna isalways placed at a finite distance, which is typically 1 cm away from the last closed flux surface(LCFS), a thin evanescent layer may exist in the low-density region between the antenna andthe LCFS. The wave usually tunnels through this thin evanescent region and propagates intothe bulk plasma, where it is supposed to see the ion cyclotron resonance layer and get dampedonto ions. Some part of the wave energy may directly get coupled to electrons via usual ELDand TTMP. Now in order to establish how the wave energy is absorbed in bulk plasma, thepower deposition profile of the launched waves is numerically calculated with the help of thefull-wave TORIC code [27].
TORIC is a finite Larmor radius full-wave code which solves the wave equation in thegeneral toroidal axisymmetric configuration. It describes the propagation and absorption ofFWs inside the plasma. It models ion absorption at fundamental and second harmonic ioncyclotron frequencies whereas absorption to electrons through TTMP, ELD and their cross-term absorption of the FW. It also predicts ELD of the mode-converted ion Bernstein wave,which propagates in the high-field side. The power deposition profile is computed for thepresent experimental parameters and the results are shown in figure 6.
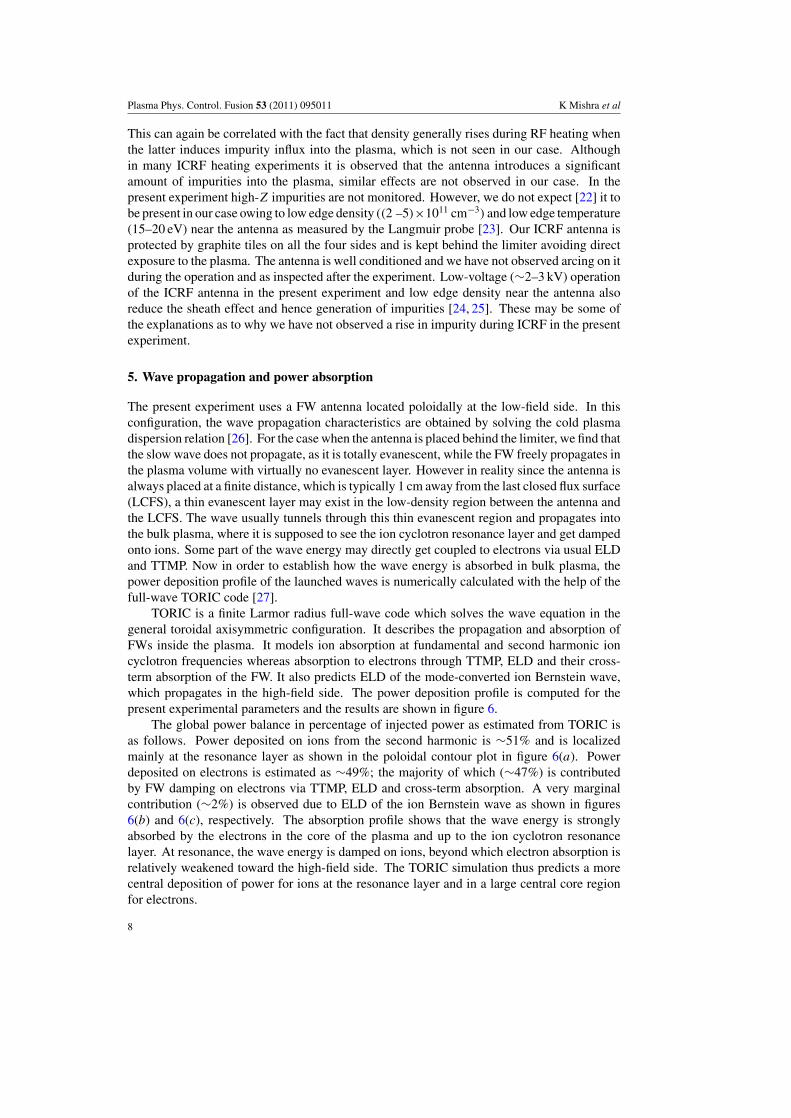
The global power balance in percentage of injected power as estimated from TORIC isas follows. Power deposited on ions from the second harmonic is ∼51% and is localizedmainly at the resonance layer as shown in the poloidal contour plot in figure 6(a). Powerdeposited on electrons is estimated as ∼49%; the majority of which (∼47%) is contributedby FW damping on electrons via TTMP, ELD and cross-term absorption. A very marginalcontribution (∼2%) is observed due to ELD of the ion Bernstein wave as shown in figures6(b) and 6(c), respectively. The absorption profile shows that the wave energy is stronglyabsorbed by the electrons in the core of the plasma and up to the ion cyclotron resonancelayer. At resonance, the wave energy is damped on ions, beyond which electron absorption isrelatively weakened toward the high-field side. The TORIC simulation thus predicts a morecentral deposition of power for ions at the resonance layer and in a large central core regionfor electrons.
8
Plasma Phys. Control. Fusion 53 (2011) 095011 K Mishra et al
Figure 6. Power absorbed by (a) ions at the second harmonic (FW), (b) electrons from FW,(c) electrons from IBW in the poloidal cross-section as computed from TORIC. The vertical linein the figures indicates the second harmonic resonance layer for hydrogen ions.
6. Conclusions and future work
ICRF heating experiments are conducted by a poloidal FW antenna on the Aditya tokamak. Theexperimental results show two remarkable signatures of a prompt rise in electron temperatureand its linear rise with injected RF power that indicate direct electron heating by FW via TTMPand ELD. The stored diamagnetic energy Wdia increases from 0.6–1 kJ to 0.8–1.3 kJ duringthe RF pulse. The Wdia either continues increasing during the RF pulse or it starts decreasingmidway during the RF pulse, which may indicate reduction in the coupling of RF power with theplasma. The peak Wdia increases approximately linearly with input power Pin. Impurity signalsdo not indicate large impurity influx during RF heating and consequently chord average electrondensity does not significantly increase during the RF pulse. A full-wave TORIC simulationunder the present experimental conditions also indicates direct coupling of FWs to electronsvia TTMP and ELD with essentially central power deposition. Another set of experimentswill be carried out in the near future at a higher RF power and by including more diagnostics,with special emphasis on ion temperature measurements with the help of Doppler broadeningof impurity lines and charge exchange diagnostics. The major task would be experimentallyascertaining the percentage of electron and ion heating during second harmonic experiments.
We find indirect evidence of non-thermal components during ICRF heating in Wdia
measurement. However, a more direct measurement of thermal and non-thermal populationneeds to be carried out. Similarly, a more detailed analysis using the Fokker–Planck solver incombination with the full-wave code will be carried out for estimating fast particle componentsintroduced in the diamagnetic measurement to establish the apparent increase in energyconfinement time in the present experiment and would be reported separately.
Acknowledgments
The authors would like to acknowledge the contributions made by all the RF group membersin developing the ICRF system on Aditya. One of the authors (AKP) also acknowledges theprocurement of the TORIC ion cyclotron code and the help in understanding the code from theMax Planck Institute for Plasma Physics (IPP), Garching, Germany. The authors acknowledgeuseful comments and suggestions from Dr Pochelon, TCV, during the preparation of thismanuscript.
9
Plasma Phys. Control. Fusion 53 (2011) 095011 K Mishra et al
References
[1] Koch R 1994 Trans. Fusion Technol. 25 194[2] Mutoh T et al NIFS Report-602 (R-8789)[3] Stix T H 1962 The Theory of Plasma Waves (New York: McGraw-Hill)[4] Stix T H 1975 PPPL Report MATT-1113[5] Adam J 1987 Plasma Phys. Control. Fusion 29 443[6] Chiu S C, Chan V S, Harvey R W and Porklab M 1989 Nucl. Fusion 29 2175[7] Eriksson L G et al 1989 Nucl. Fusion 29 875[8] Petty C C et al 1992 Phys. Rev. Lett. 69 289[9] Murakami M et al 1993 20th EPS Conference on Controlled Fusion and Plasma Physics (Lisboa, Portugal,
26–30 July 1993)[10] Bhatt S B et al 1989 Indian J. Pure Appl. Phys. 27 710–42[11] Bora D et al 2005 Ion cyclotron resonance heating system on Aditya Sadhana 30 21–46[12] Mishra K et al 2008 Recent advances and up gradation system on Aditya IPR-Technical Report IPR/TR-420/2008[13] Rathi D, Mishra K, Siju George, Varia A, Singh R, Kulkarni S V and ICRH –RF Group 2008 Development of
high power co-axial vacuum window for ICRF IPR-Technical Report IPR/TR-146/2008, October 2008[14] Wesson J 1987 Tokamaks (Oxford: Clarendon)[15] Kumar S, Jha R, Lal P, Hansaliya C, Gopalkrishna M V, Kulkarni S and Mishra K 2010 Rev. Sci. Instrum.
81 123505[16] Wolf R C et al 1993 Nucl. Fusion 33 1835[17] Joffrin E and Defrasne P 2002 Rev. Sci. Instrum. 73-6 2266, and references therein[18] Mutoh T et al 2000 Plasma Phys. Control. Fusion 42 265–74[19] Yatsu K et al 2003 Nucl. Fusion 43 358[20] Tahiliani K, Jha R, Gopalkrishna M V, Doshi K, Rathod V and Hanshalia C 2009 Plasma Phys. Control. Fusion
51 085004[21] Chin R and Li S 1992 Nucl. Fusion 32 951–64[22] Hinnov E et al 1978 Plasma Phys. 20 723[23] Mishra K et al 2004 Diagnosis of ADITYA SOL region with the help of electric probes 19th National Symp. on
Plasma Science and Technology (Jhansi, India)[24] Cohen S A et al 1984 J. Nucl. Mater. 128 & 129 280[25] D’Ippolito D A, Myra J R, Bures M and Jacquinot J 1991 Plasma Phys. Control. Fusion 33 607–42[26] Stix T H 1989 Waves in Plasma (New York: American Institute of Physics)[27] Brambilla M 1999 Plasma Phys. Control. Fusion 41 1–34
10
Related Documents