80 t u 84 15 CACHE RICH WEBER BOX ELDER MORGAN DAVIS SUMMIT UT NV CO WY ID AZ NM CA OR Direct Building Economic Loss - Earthquake Scenario: Cache Valley, UT − 0 2.5 5 7.5 10 12.5 15 Miles 07-10-08 FEMA & URS Corporation * All values are thousands of dollars County Cost Strucutral Damage Cost Non- Structural Damage Total Loss (Including Contents) Box Elder $135 $232 $508 Cache $3,715 $14,020 $27,519 Weber $14 $98 $184 Total $3,864 $14,350 $28,211 M 5.7 Cache Valley Earthquake PGA (g's) > 0.02 0.02 - 0.04 0.04 - 0.09 0.09 - 0.18 0.18 - 0.34 1 Dot = $10,000

Welcome message from author
This document is posted to help you gain knowledge. Please leave a comment to let me know what you think about it! Share it to your friends and learn new things together.
Transcript
���80
tu84
���15
CACHE
RICH
WEBER
BOX ELDER
MORGAN
DAVISSUMMIT
UTNV CO
WYID
AZ NMCA
OR
Direct Building Economic Loss - Earthquake Scenario: Cache Valley, UT
−0 2.5 5 7.5 10 12.5 15Miles
07-10-08 FEMA & URS Corporation
* All values are thousands of dollars
CountyCost
Strucutral Damage
Cost Non-Structural Damage
Total Loss (Including Contents)
Box Elder $135 $232 $508Cache $3,715 $14,020 $27,519Weber $14 $98 $184Total $3,864 $14,350 $28,211
M 5.7 Cache Valley Earthquake
PGA (g's)> 0.02
0.02 - 0.04
0.04 - 0.09
0.09 - 0.18
0.18 - 0.34
1 Dot = $10,000
���80
���15
CACHE
RICH
WEBER
BOX ELDER
MORGAN
DAVISSUMMIT
UTNV CO
WYID
AZ NMCA
OR
−0 3 6 9 12 15 18
Miles
07-10-08 FEMA & URS Corporation
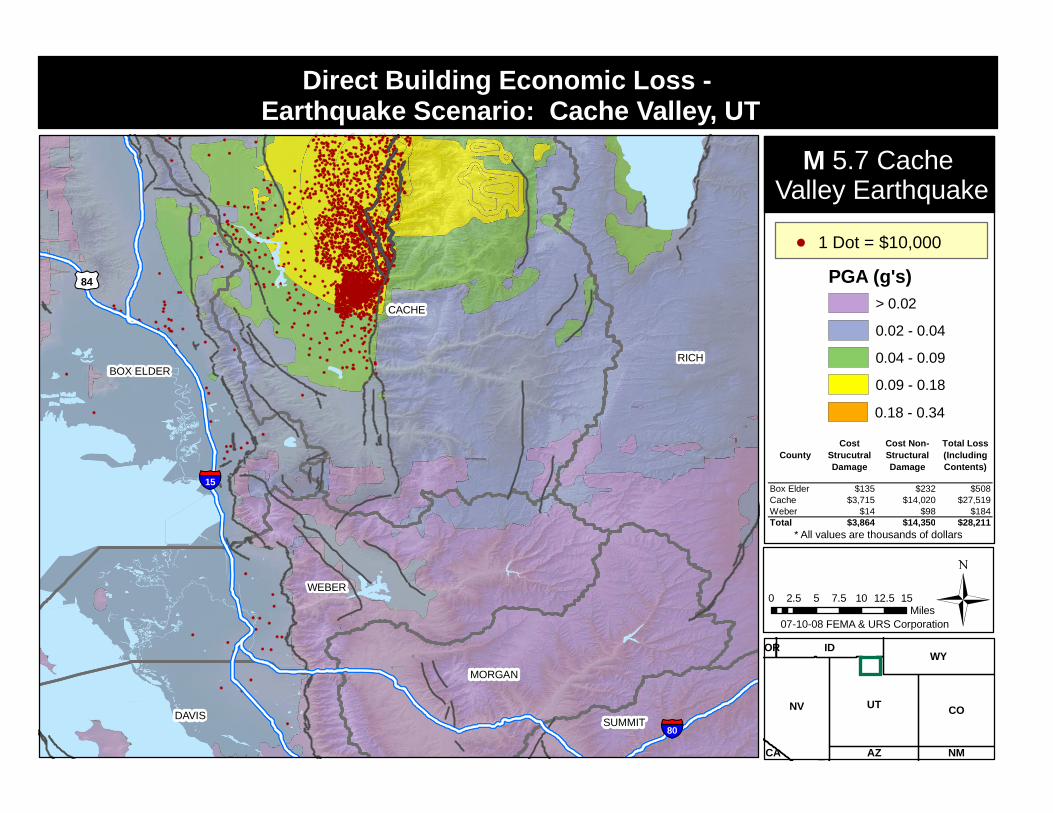
Estimated Displaced Households & Short Term Public Shelter Needs - Earthquake Scenario: Cache Valley, UT
1 Dot = 1 Displaced Household*
1 Dot = 1 Public Shelter Need (Individuals)*
* delineated by census tract
Interstate
HighwayMajor Road
Counties
Roads
Total #Public Shelter
Needs (Individuals)
7
Displaced Households
8
M 5.7 Cache Valley Earthquake

Æq
Æq
Æq
Æq
Æq
Æq
ÆqÆq
���80
���15
CACHE
RICH
WEBER
BOX ELDER
MORGAN
DAVISSUMMIT NV COUT
CA
WYID NEOR
NMAZ
KS
OK
−0 3 6 9 12 15 18
Miles
07-10-08 FEMA & URS Corporation
Distribution of Elderly, Impaired Hospitals (Day 1), & Hospital Bed Availability - Earthquake Scenario: Cache Valley, UT
1 Dot = 30 People over 65
Highway Functionality - Day 1Damage is expressd as the percentagechance that a given highway or bridgesegment will be functional at Day 1.
Highway
NursingHome
!(
Impaired Hospitals at Day 1Damage is expressed as the percentage chance that a given hospital will be functional at Day 1.
!(
100%
Æq < 99%Æq > 99%
M 5.7 Cache Valley Earthquake
CountyTotal #
Hospital Beds
Hospital Beds
Available
Box Elder 107 107Cache 158 156Carbon 84 84Davis 468 468Duchesne 42 42Juab 31 31Millard 40 40Salt Lake 3,440 3,440Sanpete 44 44Tooele 118 118Utah 1,013 1,013Wasatch 20 20Weber 655 655Total 6,220 6,218

!?
���80
���15
CACHE
RICH
WEBER
BOX ELDER
MORGAN
DAVISSUMMIT NV COUT
CA
WYID NEOR
NMAZ
KS
OK
−0 3 6 9 12 15 18
Miles
07-10-08 FEMA & URS Corporation
Electrical, Natural Gas, and Oil Facility Damage - Earthquake Scenario: Cache Valley, UT
Damage is expressed as the percentage chance that a given Utility System
will realize at least moderate damage.
Utility Damage (at least moderate)
Electric Power Facility
Oil Facility
Natural Gas Facility
!? < 20%
!? 20% - 60%
!? > 60%
< 20%
20% - 60%
> 60%
�
�
�
� < 20%
� 20% - 60%
� > 60%
5.7 Cache Valley Earthquake
M
PGA (g's)> 0.02
0.02 - 0.04
0.04 - 0.09
0.09 - 0.18
0.18 - 0.34

���80
���15
CACHE
RICH
WEBER
BOX ELDER
MORGAN
DAVISSUMMIT
UTNV CO
WYID
AZ NMCA
OR
−0 2.5 5 7.5 10 12.5 15
Miles07-10-08 FEMA & URS Corporation
Red Tag (Complete Damage)Yellow Tag (Extensive Damage)Green Tag (Slight/Moderate Damage)
*Estimated number of inspectors needed to complete inspections in 30 days.
1 Dot = 10 (by census tract)
Estimated Building Inspection Needs - Earthquake Scenario: Cache Valley, UT
Estimated # of Structures
Estimated # of Inspectors Needed
Red (Complete)
1 1
Yellow (Extensive)
28 3
Light Green (Slight/
Moderate)2,746 37
Total 2,775 41
M 5.7 Cache Valley Earthquake

���80
���15
CACHE
RICH
WEBER
BOX ELDER
MORGAN
DAVISSUMMIT
UTNV CO
WYID
AZ NMCA
OR
−0 2.5 5 7.5 10 12.5 15
Miles07-10-08 FEMA & URS Corporation
Estimated Concrete, Steel Debris and Highway Damage - Earthquake Scenario: Cache Valley, UT
* Truck loads estimated at 25 tons per truck
1 Dot = 1 thousand tons ofConcrete and Steel Debris(by census tract)Counties
Damage is expressed as the percentage
chance that a Highway segment will realize
at least moderate damage.
Highway Damage (at least moderate)
< 5%
5% - 10%
> 10%
CountyBrick and
Wood (tons)
Concrete and Steel
(tons)
Estimated Truck Loads*
Box Elder 1,000 0 40Cache 15,000 2,000 680Total 16,000 2,000 720
M 5.7 Cache Valley Earthquake

Æq
Æq
Æq
Æq
Æq
Æq
ÆqÆq
���80
���15
CACHE
RICH
WEBER
BOX ELDER
MORGAN
DAVISSUMMIT NV COUT
CA
WY NEIDOR
NMAZ
KS
OK
−0 3 6 9 12 15 18
Miles
07-10-08 FEMA & URS Corporation
Demographic Distribution and Highway Functionality (Day 1) - Earthquake Scenario: Cache Valley, UT
Highway Functionality - Day 1Damage is expressd as the percentagechance that a given highway or bridgesegment will be functional at Day 1.
Highway
1 Dot = 500 People (by census tract)
Demographics
Impaired Hospitals (Day1)Damage is expressed asthe percentage chancethat a given hospital willbe functional on Day 1.
< 90%
90% - 95%
> 95%
English Speaking
Potentially Non-EnglishSpeaking
Æq < 99%
> 99% Æq
M 5.7 Cache Valley Earthquake

���80
���15
CACHE
RICH
WEBER
BOX ELDER
MORGAN
DAVISSUMMIT NV COUT
CA
WY NEIDOR
NMAZ
KS
OK
−0 2.5 5 7.5 10 12.5 15
Miles
07-10-08 FEMA & URS Corporation
Estimated Highway Infrastructure Damage - Earthquake Scenario: Cache Valley, UT
Highway Segment
Damage is expressed as the percentage chance that a given Bridge or Highway
segment will realize at least moderate damage.
Major Roadway Bridge
* 2 engineers can inspect 5 bridges a day for 3 days
Highway Damage (at least moderate)
< 20%
20% - 60%
> 60%
< 5%
5% - 10%
> 10%
County# of Bridges
Needing Inspection
# of Bridge Engineers Needed*
Box Elder 230 31Cache 62 2Davis 131 17Morgan 80 11Rich 23 3Summit 155 21Weber 141 19Total 822 73
M 5.7 Cache Valley Earthquake

Æq
Æq
Æq
Æq
Æq
Æq
ÆqÆq
���80
���15
CACHE
RICH
WEBER
BOX ELDER
MORGAN
DAVISSUMMIT NV COUT
CA
WY NE
KS
IDOR
NMAZ OK
−0 2.5 5 7.5 10 12.5 15
Miles
07-10-08 FEMA & URS Corporation
Impaired Hospitals (Day 1), Hospital Bed Availability, & Highway Functionality - Earthquake Scenario: Cache Valley, UT
Highway Functionality - Day 1Damage is expressd as the percentagechance that a given highway or bridgesegment will be functional at Day 1.
Impaired Hospitals at Day 1
HighwayBridge Seg.
Damage is expressed as the percentage chance that a given hospital will be functional at Day 1.
Æq < 99%Æq > 99%
< 90%
90% - 95%
> 95%
< 99%
> 99%
M 5.7 Cache Valley Earthquake
CountyTotal #
Hospital Beds
Hospital Beds
AvailableBox Elder 107 107Cache 158 156Carbon 84 84Davis 468 468Duchesne 42 42Juab 31 31Millard 40 40Salt Lake 3,440 3,440Sanpete 44 44Tooele 118 118Utah 1,013 1,013Wasatch 20 20Weber 655 655Total 6,220 6,218
gW
gWgW
gW
gW
gW
gW
gW
gW
gW
gW
gW
gW
gW
gW
gW
gW
gW
gWgWgWgW
gW
gW
gW
gW
gW
gW
gW
gW
gW
gW
gW
gW
gW
gW
gW
gW
gW
gW
gW
gWgW
gW
gW
gW
gW
gW
gW
gW
gW
gW
gW
gW
gW
gWgW
gW
gW
gW
gW
gW
gW
gWgW gW
gW
gWgW
gW
gW
gW
gW
gW
gW
gW
gW
gW
gWgW
gW
gW
gW
gW
gW
gWgW
gW
gW
gW
gW
gW
gW
gWgW
gW gW
gW
gW
+]
+]
+]
+]
+]
���80
���15
CACHE
RICH
WEBER
BOX ELDER
MORGAN
DAVISSUMMIT
UTNV CO
WYID
AZ NMCA
OR
−0 3 6 9 12 15 18
Miles07-10-08 FEMA & URS Corporation
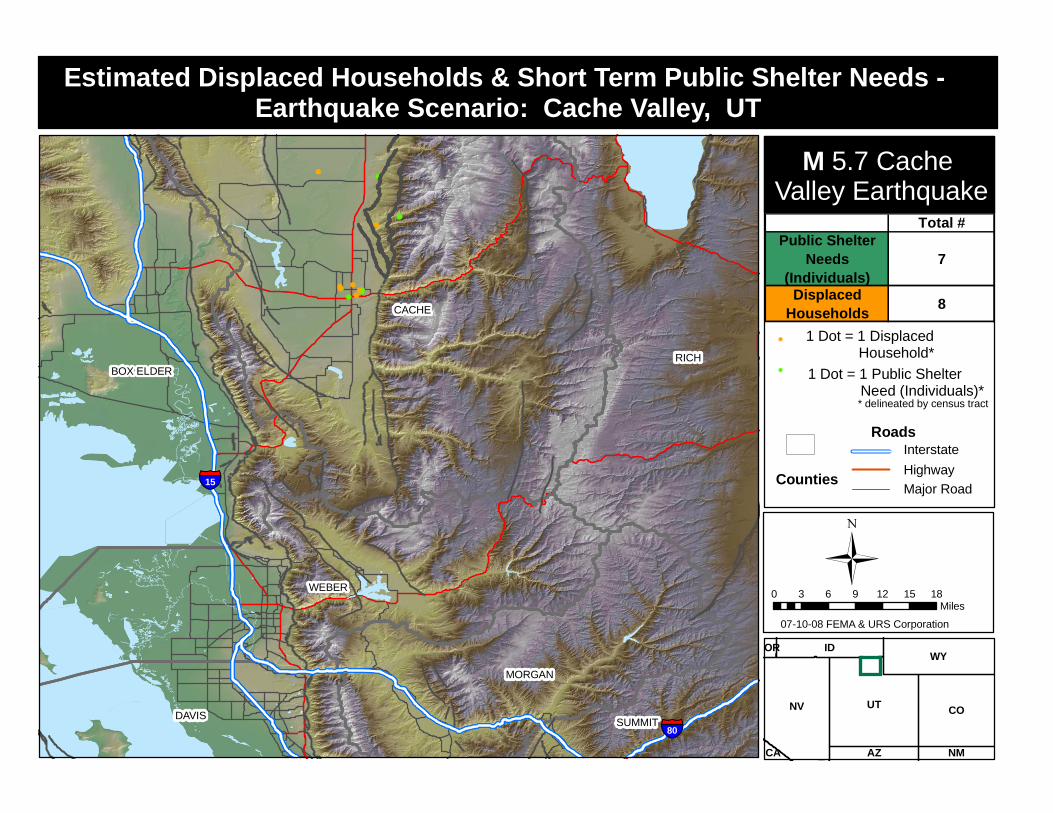
Water Line, Sewage Treatment Facility Distribution and Liquefaction Susceptibility - Earthquake Scenario: Cache Valley, UT
* Based on U.S. Army Corp Mission Guidebook(Daily water is based on an esimated 3 people per household.One truck can transport an esimated 5000 gallons of water.)
Liquefaction Susceptibility
Low
Medium
High
Very High
Sewage Treatment Facilities+]
5.7 Cache Valley Earthquake
M
County
# Households without
Potable Water (at Day 1)
Daily Potable Water Needs Per Person
(Gallons/day)
Number of Truckloads
needed Daily
None 0 0 0
gW Dams
����
����
����
����
����
��������
��������
����
����
����
����
����
����
��������
����
��������
������������
����
����
��������
��������
����
����
����
����
����
����
������������
����
����
����
����
����
����
����
��������
��������
����
����
����
����
����
����
����
����
����
��������
����
����
����
����
����
����
����
����
����������������
����
����
����
������������ ����
����
��������
������������
����
��������
����
��������
����
����
����
����
����
����
����
����
����
����
��������
����
����
����
����
����
������������
����
����
����
����
����
í
í
í
í
í
íí
í
í
í
í
í
í
���80
���15
CACHE
RICH
WEBER
BOX ELDER
MORGAN
DAVISSUMMIT NV COUT
CA
WY NEIDOR
NMAZ
KS
OK
−0 3 6 9 12 15 18
Miles
07-10-08 FEMA & URS Corporation
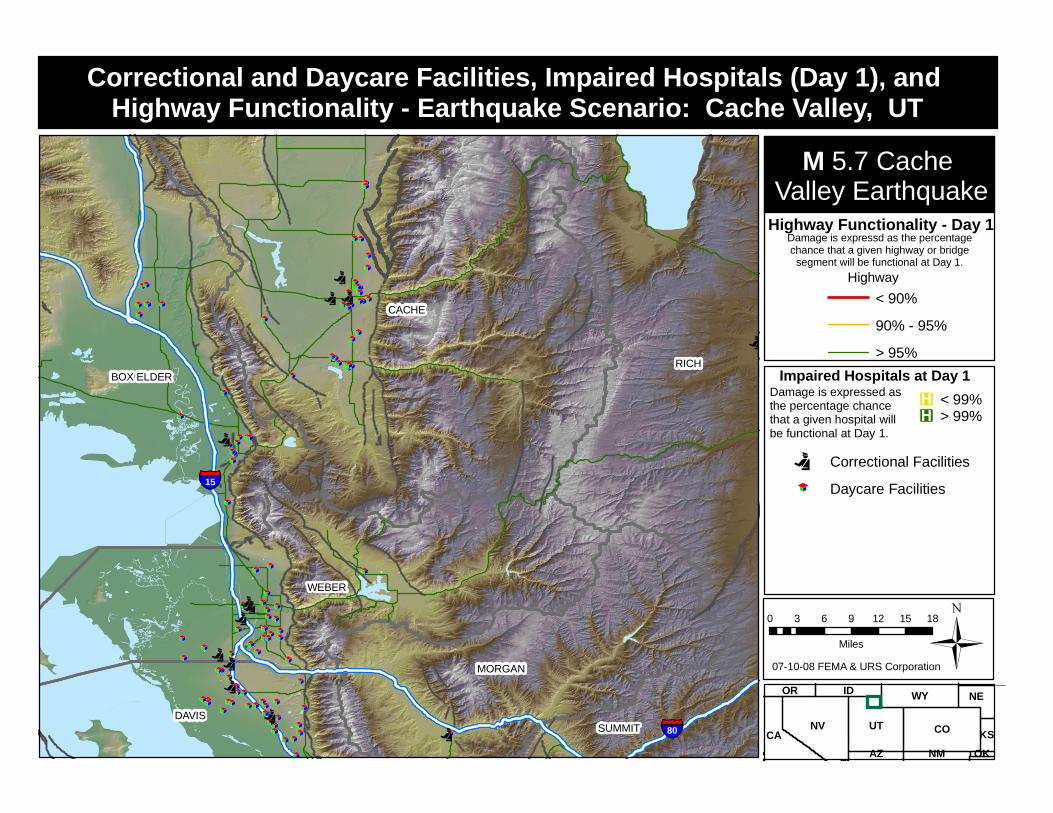
Correctional and Daycare Facilities, Impaired Hospitals (Day 1), and Highway Functionality - Earthquake Scenario: Cache Valley, UT
Highway Functionality - Day 1Damage is expressd as the percentagechance that a given highway or bridgesegment will be functional at Day 1.
Impaired Hospitals at Day 1
Highway
Damage is expressed as the percentage chance that a given hospital will be functional at Day 1.
í Correctional Facilities
���� Daycare Facilities
Æq < 99%Æq > 99%
< 90%
90% - 95%
> 95%
M 5.7 Cache Valley Earthquake
Æq
Æq
ÆqÆq
Æq
Æq
ÆqÆq
���80
���15
CACHE
RICH
WEBER
BOX ELDER
MORGAN
DAVISSUMMIT
UTNV CO
WYID
AZ NMCA
OR
−0 3 6 9 12 15 18Miles
07-10-08 FEMA & URS Corporation
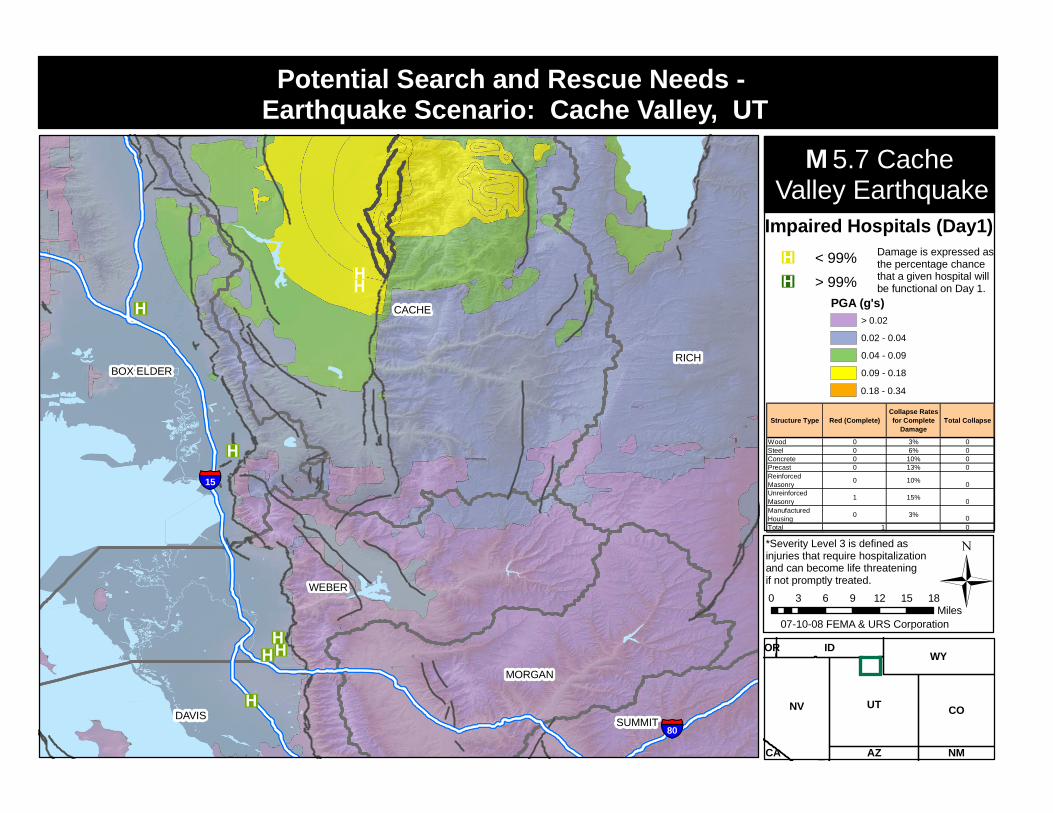
Potential Search and Rescue Needs - Earthquake Scenario: Cache Valley, UT
Impaired Hospitals (Day1)Damage is expressed asthe percentage chancethat a given hospital willbe functional on Day 1.
*Severity Level 3 is defined as injuries that require hospitalization and can become life threatening if not promptly treated.
5.7 Cache Valley Earthquake
M
Æq < 99%
Æq > 99%
Structure Type Red (Complete)Collapse Rates for Complete
DamageTotal Collapse
Wood 0 3% 0Steel 0 6% 0Concrete 0 10% 0Precast 0 13% 0Reinforced Masonry
0 10%0
Unreinforced Masonry
1 15%0
Manufactured Housing
0 3% 0Total 1 0
PGA (g's)> 0.02
0.02 - 0.04
0.04 - 0.09
0.09 - 0.18
0.18 - 0.34
Related Documents