Faculty of Computer Science Computer Architecture Group Diploma Thesis Monitoring of large-scale Cluster Computers Stefan Worm [email protected] February 12, 2007 Supervisor: Prof. Dr.-Ing. W. Rehm * Advisors: Dipl.-Inf. Torsten Mehlan * , Dipl.-Inf. Torsten Hoefler * * Chemnitz University of Technology, Indiana University

Welcome message from author
This document is posted to help you gain knowledge. Please leave a comment to let me know what you think about it! Share it to your friends and learn new things together.
Transcript

Faculty of Computer ScienceComputer Architecture Group
Diploma Thesis
Monitoring of large-scale ClusterComputers
Stefan [email protected]
February 12, 2007
Supervisor: Prof. Dr.-Ing. W. Rehm∗
Advisors: Dipl.-Inf. Torsten Mehlan∗, Dipl.-Inf. Torsten Hoefler∗?∗ Chemnitz University of Technology,? Indiana University

The original (PDF) version of this document is available at:http://archiv.tu-chemnitz.de/pub/2007/0003/
Keywords: monitoring, remote monitoring, local monitoring, cluster monitoring,cluster management, cluster, computer, cluster computer, network, network load,performance, scalability, Chemnitz High-Performance Linux Cluster, CHiC, OFED,InfiniBand, port counters, netgauge, Abinit, Nagios, plugin, plug-in
Worm, Stefan:Monitoring of large-scale ClusterComputersDiploma Thesis, Chemnitz Universityof Technology, 2007.

Abstract
The constant monitoring of a computer is one of the essentials to be up-to-date aboutits state. This may seem trivial if one is sitting right in front of it but when monitoringa computer from a certain distance it is not as simple anymore. It gets even moredifficult if a large number of computers need to be monitored. Because the processof monitoring always causes some load on the network and the monitored computeritself, it is important to keep these influences as low as possible. Especially for a high-performance cluster that was built from a lot of computers, it is necessary that themonitoring approach works as efficiently as possible and does not influence the actualoperations of the supercomputer.
Thus, the main goals of this work were, first of all, analyses to ensure the scalabilityof the monitoring solution for a large computer cluster as well as to prove the function-ality of it in practise. To achieve this, a classification of monitoring activities in termsof the overall operation of a large computer system was accomplished first. There-after, methods and solutions were presented which are suitable for a general scenarioto execute the process of monitoring as efficient and scalable as possible.
During the course of this work, conclusions from the operation of an existing clusterfor the operation of a new, more powerful system were drawn to ensure its functionalityas good as possible. Consequently, a selection of applications from an existing poolof solutions was made to find one that is most suitable for the monitoring of the newcluster. The selection took place considering the special situation of the system like theusage of InfiniBand as the network interconnect. Further on, an additional softwarewas developed which can read and process the different status information of the In-finiBand ports, unaffected by the vendor of the hardware. This functionality, which sofar had not been available in free monitoring applications, was exemplarily realisedfor the chosen monitoring software.
Finally, the influence of monitoring activities on the actual tasks of the cluster wasof interest. To examine the influence on the CPU and the network, the self-developedplugin as well as a selection of typical monitoring values were used exemplarily. Itcould be proven that no impact on the productive application for typical monitoringintervals can be expected and only for atypically short intervals a minor influence couldbe determined.
Task of the Diploma Thesis
Today’s cluster computers are used in different sizes. The number of small andmedium installations with up to 128 nodes is growing continuously. At the upper endof the range very large clusters with several thousands of compute nodes were designed.The administration of such systems requires a supervising and monitoring system thatcan be used in those different kinds of parallel computers in a scalable manner.
The aim of this work is to analyse existing cluster monitoring mechanisms and todesign extensions to these already existing tools. First the most relevant freely avail-able solutions shall be considered. Thereby this thesis should especially elaborate howto detect irregular behaviour patterns or errors and moreover how to react on them.Furthermore, the scalability to a large number of nodes and the influence on other com-putation processes shall be analysed.
After the phase of analysing, missing functions and error cases should be identi-fied. In addition convenient methods of statistical appraisal shall be found to identifypossible accumulations of errors and as a consequence the detection of increasing prob-ability of a failure of a component. Furthermore suitable behaviour patterns which canbe defined as a reaction to errors shall be identified. It should be discussed in whichway automatic interventions are possible. Hence, the achieved specification of an en-hanced monitoring system should be adapted in the most relevant parts so that it can beintegrated into the Chemnitz High-Performance Linux Cluster (CHiC). In addition, aspecial focus of this work shall be on the scalability and the smallest possible influenceon other compute processes.

Theses
I It is possible to run a cluster monitoring system with only minimum effects onuser tasks.
II A system that monitors only the necessary things is less error-prone and thereforeeasier to maintain.
III A monitoring system that presents the information in a suitable way does relievethe administrators from unnecessary maintenance work.
IV The outage of the cluster has to be minimised.
V Most application runtimes (e.g. ABINIT ) are not significantly influenced by stan-dard monitoring activities.
VI One server can handle the monitoring of hundreds of components, each of themwith a set of values that has to be checked.
VII The integrated monitoring of all components of a system, instead of the use ofindependent approaches for each of them, is to be favoured.
VIII It exist no vendor independent InfiniBand network interface port counter moni-toring software that supports established open source monitoring applications.
IX The size and quantity of the network packets of the monitoring system have ameasurable influence on the performance of the communication network.

Contents
List of Figures . . . . . . . . . . . . . . . . . . . . . . . . . . . . . . . . . ixList of Tables . . . . . . . . . . . . . . . . . . . . . . . . . . . . . . . . . . ixListings . . . . . . . . . . . . . . . . . . . . . . . . . . . . . . . . . . . . .ixAbbreviations and Acronyms . . . . . . . . . . . . . . . . . . . . . . . . . xv
1 Introduction 11.1 Cluster Computers. . . . . . . . . . . . . . . . . . . . . . . . . . . . 11.2 Cluster Management. . . . . . . . . . . . . . . . . . . . . . . . . . . 31.3 Summary . . . . . . . . . . . . . . . . . . . . . . . . . . . . . . . . . 5
2 Cluster Monitoring 72.1 Monitoring as Part of Management. . . . . . . . . . . . . . . . . . . . 72.2 A Monitoring Model . . . . . . . . . . . . . . . . . . . . . . . . . . . 92.3 Generation of Data. . . . . . . . . . . . . . . . . . . . . . . . . . . .10
2.3.1 Local and Remote Monitoring. . . . . . . . . . . . . . . . . . 102.3.2 Communication Methods. . . . . . . . . . . . . . . . . . . . . 102.3.3 Overview about Monitoring Objects. . . . . . . . . . . . . . . 112.3.4 Performance and Scalability. . . . . . . . . . . . . . . . . . . 11
2.4 Processing of Data. . . . . . . . . . . . . . . . . . . . . . . . . . . .142.4.1 Data Validation and Storage. . . . . . . . . . . . . . . . . . . 142.4.2 Combination of Monitoring Values. . . . . . . . . . . . . . . 142.4.3 Filtering and Analysis. . . . . . . . . . . . . . . . . . . . . . 18
2.5 Dissemination of Information. . . . . . . . . . . . . . . . . . . . . . . 192.6 Presentation of Results. . . . . . . . . . . . . . . . . . . . . . . . . .212.7 Summary . . . . . . . . . . . . . . . . . . . . . . . . . . . . . . . . .22
3 Chemnitz High-Performance Linux Cluster (CHiC) 233.1 Introduction to the CHiC. . . . . . . . . . . . . . . . . . . . . . . . . 233.2 Experiences from the CLiC System. . . . . . . . . . . . . . . . . . . 243.3 Summary . . . . . . . . . . . . . . . . . . . . . . . . . . . . . . . . .29
4 Evaluation of Monitoring Approaches 314.1 Selection of a Monitoring Application. . . . . . . . . . . . . . . . . . 314.2 Nagios and the Plugin Topology. . . . . . . . . . . . . . . . . . . . . 374.3 The InfiniBand Interconnection Network. . . . . . . . . . . . . . . . . 38
Stefan Worm vii
Contents
4.3.1 Introduction to Design and Features. . . . . . . . . . . . . . . 394.3.2 Constitution of the Port Counters. . . . . . . . . . . . . . . . 39
4.4 Design and Implementation of a Port Counter Monitoring Plugin. . . . 404.4.1 Preliminary Considerations. . . . . . . . . . . . . . . . . . . . 404.4.2 Thecheck_iberr Script . . . . . . . . . . . . . . . . . . . 42
4.5 Summary . . . . . . . . . . . . . . . . . . . . . . . . . . . . . . . . .44
5 Evaluation of the Performance Impact of Monitoring Activities 475.1 Introduction to the Test Configuration. . . . . . . . . . . . . . . . . . 475.2 Impact regarding the Execution of Applications. . . . . . . . . . . . . 47
5.2.1 Influence on Abinit due to Local and Remotecheck_iberrScript Execution . . . . . . . . . . . . . . . . . . . . . . . . . 48
5.2.2 Influence on Abinit due to Local and Remote Nagios Plugins. . 505.2.3 Influence of Local and Remote Nagios Plugins via IPoIB and
GbE on Four Local Abinis Jobs. . . . . . . . . . . . . . . . . 525.3 Impact regarding the Network Performance. . . . . . . . . . . . . . . 54
5.3.1 Network Performance with and without Remote and Local Ex-ecution of Nagios Plugins via IPoIB and GbE. . . . . . . . . . 54
5.3.2 Network Performance with and without Execution ofthecheck_iberr Script . . . . . . . . . . . . . . . . . . . . 56
5.3.3 Network Performance with and without Execution of NagiosPlugins Depending on the Delay of their Execution. . . . . . . 58
5.4 Quantitative CPU and Network Load Analysis. . . . . . . . . . . . . . 595.4.1 Influence of Nagios Plugins on Clients and the Monitoring Server595.4.2 Influence of thecheck_iberr Script on Clients and the Mon-
itoring Server. . . . . . . . . . . . . . . . . . . . . . . . . . .605.4.3 Exemplary Monitoring Server Test with Nagios Plugins and the
check_iberr Script . . . . . . . . . . . . . . . . . . . . . . 615.5 Summary . . . . . . . . . . . . . . . . . . . . . . . . . . . . . . . . .63
6 Conclusion and Outlook 65
A Source Code Listing of the check_iberr Perl Script 67
B Monitoring Server and Client Configuration 73B.1 Definition of Hosts and Services on the Monitoring Server. . . . . . . 73B.2 Definition of the Check Commands on the Monitoring Server for Direct
Execution . . . . . . . . . . . . . . . . . . . . . . . . . . . . . . . . .76B.3 Definition of the Check Commands on the Monitoring Server for Exe-
cution via NRPE . . . . . . . . . . . . . . . . . . . . . . . . . . . . .76B.4 Definitions on the Monitoring Client. . . . . . . . . . . . . . . . . . . 77
Bibliography 79
Index 85
viii Stefan Worm

List of Figures
List of Figures
2.1 Correlation of Management and Monitoring. . . . . . . . . . . . . . . 92.2 Object that is Controlled and Monitored. . . . . . . . . . . . . . . . . 17
3.1 Exemplary Timetable as Basis for Alerting Methods. . . . . . . . . . . 253.2 Monitoring of the Infrastructure with Corresponding Importance. . . . 27
5.1 Influence on Abinit due to Local and Remotecheck_iberr ScriptExecution . . . . . . . . . . . . . . . . . . . . . . . . . . . . . . . . .49
5.2 Influence on Abinit due to Local and Remote Nagios Plugins. . . . . . 505.3 Influence of Local and Remote Nagios Plugins via IPoIB and GbE on
Four Local Abinis Jobs. . . . . . . . . . . . . . . . . . . . . . . . . .535.4 Network Performance with and without Remote and Local Execution
of Nagios Plugins via IPoIB and GbE. . . . . . . . . . . . . . . . . . 555.5 Network Performance with and without Execution of thecheck_iberr
Script . . . . . . . . . . . . . . . . . . . . . . . . . . . . . . . . . . .575.6 Network Performance with and without Execution of Nagios Plugins
Depending on the Delay of their Execution. . . . . . . . . . . . . . . 585.7 Network Packet Size Regarding the Communication of Various Nagios
Plugins and thecheck_iberr Script . . . . . . . . . . . . . . . . . . 62
List of Tables
1.1 Layers of Integrated Management and Functional Areas of Management5
2.1 Monitoring Objects and their States. . . . . . . . . . . . . . . . . . . 122.2 Errors of Event Classification. . . . . . . . . . . . . . . . . . . . . . . 18
4.1 InfiniBand HCA port counters. . . . . . . . . . . . . . . . . . . . . . 40
5.1 Nagios Plugins . . . . . . . . . . . . . . . . . . . . . . . . . . . . . .51
Listings
A.1 check_iberr.pl. . . . . . . . . . . . . . . . . . . . . . . . . . . . . . .67B.1 Configuration of the Hosts and Services on the Nagios Server. . . . . . 73B.2 Nagios Server Direct Command Execution Configuration. . . . . . . . 76B.3 Nagios Server Command Execution Configuration via NRPE. . . . . . 76B.4 NRPE Monitoring Client Configuration. . . . . . . . . . . . . . . . . 77
Stefan Worm ix

Abbreviations and Acronyms
ACM . . . . . . . . . . Association for Computing Machinery− page 83
AES . . . . . . . . . . . Advanced Encryption Standard− page 38
AMD . . . . . . . . . . Advanced Micro Devices,Inc. − page 23
AP . . . . . . . . . . . . Access Point− page 12
API . . . . . . . . . . . Application Programming Interface− page 34
BLAS . . . . . . . . . Basic Linear Algebra Subroutines− page 23
CHIC . . . . . . . . . . Chemnitz High-Performance Linux Cluster − page iv
CLIC . . . . . . . . . . Chemnitz Linux Cluster − page 23
CPMD. . . . . . . . . Car-Parrinello Molecular Dynamics− page 24
CPU . . . . . . . . . . . Central Processing Unit− page 11
DB . . . . . . . . . . . . DataBase− page 12
DDR . . . . . . . . . . Double Data Rate− page 86
DES . . . . . . . . . . . Data Encryption Standard− page 38
DFT . . . . . . . . . . . Density Functional Theory− page 47
DGEMM . . . . . . Double-precision GEneral Matrix Multiply− page 23
DHCP . . . . . . . . . Dynamic Host Configuration Protocol− page 59
DMA . . . . . . . . . . Direct Memory Access− page 86
DNS. . . . . . . . . . . Domain Name Service− page 12
DPS . . . . . . . . . . . Distributed Processing System− page 13
FCAPS . . . . . . . . Fault-, Configuration-, Accounting-, Performance- and Security- (man-agement) − page 4
Stefan Worm xi
Abbreviations and Acronyms
FTP . . . . . . . . . . . File Transfer Protocol− page 10
GB . . . . . . . . . . . . Gigabit (109 bit = 1.25 ∗ 108 byte = 125 MB) − page 23
GBE . . . . . . . . . . . Gigabit Ethernet (network interconnect)− page 47
GFLOPS . . . . . . . giga (109) floating point operations per second − page 23
GNU . . . . . . . . . . GNU is not Unix − page xii
GPL . . . . . . . . . . . GNU General Public License − page 87
GPU. . . . . . . . . . .Graphics Processing Unit− page 12
GUI . . . . . . . . . . . Graphical User Interface− page 21
GUID . . . . . . . . . (InfiniBand) Global Unique IDentifier− page 42
HA . . . . . . . . . . . . High-Availability − page 2
HCA . . . . . . . . . . (InfiniBand) Host Channel Adapter− page 57
HDD . . . . . . . . . . Hard Disk Drive − page 11
HP . . . . . . . . . . . . High-Performance− page 2
HPC . . . . . . . . . . . High-Performance Cluster− page 2
HTTP . . . . . . . . . HyperText Transfer Protocol− page 12
HVAC . . . . . . . . . Heating, Ventilation and Air Conditioning− page 87
HW . . . . . . . . . . . HardWare − page 5
I/O . . . . . . . . . . . . Input / Output − page 12
IA . . . . . . . . . . . . . Intel Architecture (IA-32, IA-64) − page 31
IB . . . . . . . . . . . . . InfiniBand − page 23
IBA . . . . . . . . . . . InfiniBand Architecture − page 39
IBTA . . . . . . . . . . InfiniBand Trade Association− page 81
ICMP . . . . . . . . . Internet Control Message Protocol− page 11
ID . . . . . . . . . . . . . IDentifier − page 11
IEC . . . . . . . . . . . International Electronical Commission− page 4
IEEE . . . . . . . . . . Institute of Electrical & Electronics Engineers− page 83
xii Stefan Worm

Abbreviations and Acronyms
IETF . . . . . . . . . . Internet Engineering Task Force− page 11
IM . . . . . . . . . . . . Instant Message− page 20
IMAP . . . . . . . . . Internet Message Access Protocol− page 12
IP . . . . . . . . . . . . . Internet Protocol− page 12
IPC. . . . . . . . . . . . Inter-Process Communication− page 53
IPDPS . . . . . . . . .(IEEE) International Parallel & Distributed Processing Symposium− page 81
IPMI . . . . . . . . . . Intelligent Platform Management Interface− page 23
IPOIB . . . . . . . . . Internet Protocol over InfiniBand − page 50
ISO . . . . . . . . . . . International Organization for Standardization− page 4
IT . . . . . . . . . . . . . Information Technology− page 1
JTC . . . . . . . . . . . Joint Technical Committee− page 81
LAN . . . . . . . . . . Local Area Network − page xv
LB . . . . . . . . . . . . Load-Balancing − page 2
LID . . . . . . . . . . . (InfiniBand) Local IDentifier − page 42
MAC . . . . . . . . . . Media Access Control− page 11
MAD . . . . . . . . . . (InfiniBand) MAnagement Diagram− page 49
MPI . . . . . . . . . . . Message Passing Interface− page 24
MRTG. . . . . . . . . Multi Router Traffic Grapher− page 34
MUA . . . . . . . . . . Mail User Agent − page 89
NFS . . . . . . . . . . . Network File System− page 12
NIC . . . . . . . . . . . Network Interface Card− page 57
NMS . . . . . . . . . . Network Management System− page 33
NRPE . . . . . . . . . Nagios Remote Plugins Executor− page 48
NSCA . . . . . . . . . Nagios Service Check Acceptor− page 38
NTP . . . . . . . . . . . Network Time Protocol− page 26
OFED . . . . . . . . . OpenFabrics Enterprise Distribution− page 42
Stefan Worm xiii
Abbreviations and Acronyms
OOB . . . . . . . . . . Out-Of-Band − page 48
OS . . . . . . . . . . . . Operating System− page 11
OSCAR . . . . . . . Open Source Cluster Application Resources− page 84
OSI . . . . . . . . . . . Open Systems Interconnection− page 4
PBS . . . . . . . . . . . Portable Batch System− page 27
PCI . . . . . . . . . . . . Peripheral Component Interconnect− page 91
PCI-X . . . . . . . . . PCI eXtended− page 39
PCIE . . . . . . . . . . PCI express − page 39
PMEO-PDS . . . (International Workshop on) Performance Modelling, Evaluation,and Optimization of Parallel and Distributed Systems− page 81
POP . . . . . . . . . . .Post Office Protocol− page 12
POWERPC . . . . . Performance optimization with enhanced RISC Performance Chip− page 31
PPC . . . . . . . . . . .PowerPC − page 31
PSU . . . . . . . . . . . Power Supply Unit − page 12
RAID . . . . . . . . . Redundant Array of Independent Disks− page 28
RAM . . . . . . . . . . Random Access Memory− page 11
RDMA . . . . . . . . Remote Direct Memory Access− page 39
RFC . . . . . . . . . . . Request For Comments− page 11
RISC . . . . . . . . . . Reduced Instruction Set Computer− page 82
RTT . . . . . . . . . . . Round Trip Time − page 51
S.M.A.R.T. . . . . Self-Monitoring, Analysis, and Reporting Technology− page 12
SDR . . . . . . . . . . . Single Data Rate (InfiniBand network connection) − page 23
SIESTA . . . . . . . Spanish Initiative for Electronic Simulations with Thousands of Atoms− page 24
SM . . . . . . . . . . . . (InfiniBand) Subnet Manager− page 40
SMP. . . . . . . . . . .Symmetric Multi-Processor− page 23
xiv Stefan Worm

Abbreviations and Acronyms
SMS. . . . . . . . . . .Short Message Servicecellular phone text messaging− page 20
SMTP . . . . . . . . . Simple Mail Transfer Protocol− page 12
SNMP . . . . . . . . . Simple Network Management Protocol− page 11
SSH . . . . . . . . . . . Secure SHell− page 10
TB . . . . . . . . . . . . TeraByte (1012 byte ≈ 240 byte) − page 23
TCP . . . . . . . . . . . Transmission Control Protocol− page 51
TDES . . . . . . . . . Triple DES − page 38
UDP. . . . . . . . . . . User Datagram Protocol− page 93
UPS . . . . . . . . . . . Uninterruptible Power Supply− page 12
VL . . . . . . . . . . . . Virtual Lane − page 40
WLAN . . . . . . . . Wireless LAN − page 12
XML . . . . . . . . . . eXtensible Markup Language− page 33
Stefan Worm xv


1 Introduction
The semi-annual published Top5001 list containing the five hundred fastest computerson earth fascinates computer interested people as well as the rest of the world every timeanew. This topic is very attractive not only because of the very illustrative coverage inthe media, especially the amazing comparisons with the first supercomputers like theone which was used for planning the moon landing, but also because of the abilitiesof recent ordinary computers or even with mobile phones which have about the sameperformance. This shall show that every person can have one of today’s supercomputersome time in the future for himself and that it is only a matter of perspective what asupercomputer is.
In this work not the pure computing power is the main topic, it is the supervision ofthose computers. Because only with the help of monitoring it can be ascertained what isthe state of the system and only with that information a system’s administrator is ableto keep it running properly so that a user can really benefit from the full computingpower.
1.1 Cluster Computers
“When computing, there are three basic approaches to improving performance – usea better algorithm, use a faster computer, or divide the calculation among multiplecomputers.”[Slo05, p.4] Often the algorithms and their implementation are already op-timised and cannot be made significantly faster – furthermore at a certain stage of theproblem which needs to be calculated, the computing power of a fast computer is notenough or the price for it is too high.
In this situation, the use of the third approach is advisable. Having a minimumof two computers, is already a cluster because of its definition2. But usually the term“cluster” in Information Technology (IT) refers to a large number of systems commonlyat supercomputer size which means “The class of fastest and most powerful computersavailable.”[LJ93, p.275]
Still, having a bunch of computers is still not a computer in the sense of a super-computer-cluster. Referring to Sterling [Ste02], “[. . . ] a cluster is any ensemble ofindependently operational elements integrated by some medium for coordinated andcooperative behaviour.” The most important issue regarding the definition is the need
1The Top500 list is presented at the Supercomputer Conference twice a year since 1993.http://www.top500.org/lists/
2cluster: a number of persons, animals, or things grouped together (refer to Webster’s New WorldDictionary of American English, Third College Edition [Neu88])
Stefan Worm 1
Chapter 1. Introduction
of something that makes the computers work together which means in this specific caseat least two things: an interconnection network and some special software.
What kind of computers, network connections and cluster–software is used dependson the purpose of the cluster. Sloan [Slo05, p.11] distinguishes three types:
High-Performance Cluster This is the original type of cluster. At the very begin-ning when sets of computers where assembled to a cluster it was because of high-performance (HP) reasons. It was done with the intention to get more computingpower than a single machine can provide, usually to solve a specific problemwithin an acceptable period of time. In literature the termssupercomputerandclusterusually refer to this type of cluster which is also the focus of this work.
High-Availability Cluster These types of clusters are made for scenarios wheremaximum reliability is necessary. It means that a service or application is avail-able whenever it is needed, with only a minimum of downtime. High-Availability(HA) clusters can guarantee that because of their failover mechanism. It meansthat there is a set of computers which are doing their job and another set of sparecomputers which are running idle, just checking the working ones and waiting totake over if one of them fails. Respectively the “spare” computers are also work-ing but they are able to take over the load of the other ones if necessary. Thoseclusters, because of their functionality, are also called failover clusters [Slo05,p.11] or Fault-Tolerant Clusters [Boo03]. They typically consist of only a fewcomputers, often only of two machines and not of tens, hundreds or thousandlike the High-Performance Clusters (HPC).
Load-Balancing Cluster This kind of cluster is very similar to the HPCs becausethey are also made for dividing the work among multiple computers, but with thedifference that a Load-Balancing (LB) cluster is for providing a better real-time3
performance. For example a scenario where a web server, that cannot handle thetraffic on its own or within an acceptable period of time any longer, is suitable tobe replaced by a LB cluster.
Especially when thinking of a slightly different scenario, like processing a largeamount of data in a short period of time from a physical simulation, this class ofcluster can also be named High-Throughput Cluster (refer to [Luc04]).
The classification mentioned above is not precise. Depending on the problem thathas to be solved, and especially the type of software and algorithms which are used, thecluster can be a combination of the different types.
In addition to a definition concerning the purpose of the cluster, the National Re-search Council of the National Academies [GSP05] further classifies supercomputer–clusters regarding their overall productivity:
3The termreal-timemeans that a response to a query [the result of an operation] has to be given withina specified period of time, this can be a fraction of a second, but it does not have to be. (refer to[Dib02])
2 Stefan Worm

1.2. Cluster Management
capability A capability cluster is used as a whole to solve a single, large problem –one that otherwise cannot be solved in a reasonable period of time [GSP05, p.24].
capacity The representative capacity system is one on which several and smallercomputations are executed. The merit is a system that has good performance/ cost value and can be used for a lot of domains.
1.2 Cluster Management
Working out what kind of cluster is needed, buying the hardware and building up thesystem is one thing – to keep it running another. It is necessary to have a strategy formanaging all work related to the cluster computer. One of the first things that comesto one’s mind thinking ofmanagementis probably the management of a company orthe act of conducting or supervising something. In its general meaning,to manage4
something means “to handle or direct with a degree of skill”.5
In a more specific conception, management is every action inside an organisationwith the focus to guarantee an effective and efficient way of operation.
Thus, management can be classified into five layers of integrated management re-ferring to Hegering [HAN99] whereby every layer is based on the efficiency of theunderlying ones:
5. enterprise management / service management (organisation of business processes,business services and policies)
4. management of applications (computer programs, distributed applications)
3. information management (all kinds of business data)
2. system management (server, workstation, printer, etc.)
1. network management (communication network, router, switches, etc.)
Integrated management describes the process of the seamless interaction of tools ofevery layer to cooperate and interact together. This is contrary to an isolated approachof management where a single tool is used for single problems especially of singlemanagement layers without interacting with one another [HA94]. Referring to thismodel, the overall integration is, of course, an ideal point of view. But nevertheless, thegoal is to coordinate as much as possible within the system of management.
Based on the classification mentioned above and the limited focus of this work fur-ther considerations are dedicated to the two basic layers system and network manage-ment only. Obviously, the areas of enterprise and information management are primarynon technical ones and therefore not interesting in terms of “Cluster Monitoring”. In
4manage: Italianmaneggiare, from manohand (refer to Webster’s New World Dictionary of AmericanEnglish, Third College Edition [Neu88])
5Merriam-Webster Online Dictionary [man05]
Stefan Worm 3
Chapter 1. Introduction
addition to that the area of application management is touched only in few points sothat a complete consideration of this is not necessary and would go beyond the scopeof this work.
Furthermore, the classification of the five layers of integrated management is directedto the specific objects belonging to them. This is important in order to knowwhathas to be managed. But it is at least as essential as this to knowhow all that can bemanaged. To achieve that, the International Organization for Standardization (ISO)and the International Electronical Commission (IEC) has published the ISO/IEC 7498-4 standard “Information processing systems – Open Systems Interconnection – BasicReference Model – Part 4: Management Framework” [ISO89]. 6
In this document, the ISO has categorised the requirements for management func-tionality into five areas that are also known as FCAPS based on the starting letters offault, configuration, accounting, performance and security:7
fault management A fault is the abnormal operation of a component that reveals asa particular event (e.g. an error). The management of it deals with its detection,isolation and correction.
configuration management This management part is responsible for collectingand providing information, as well as for the identification and control over com-ponents. It includes the initialisation and termination as well as the provision ofcontinuous operation of the system.
accounting management Accounting is the recording and summarising of actionswith the intention to analyse, verify and report them for being able to charge forthe use of resources.
performance management The management of performance is the evaluation ofthe behaviour and the effectiveness of resources. It is used for gathering statisticalinformation for tuning and sizing them, as well as for reporting reasons.
security management Principally this is the support of applications’ security poli-cies. It has importance in the secure implementation of management tasks, thedetection of security violations and maintaining security audits, as well as thecreation, deletion, and control of security mechanisms.
Those five functional areas of management explicitly apply to each of the five layersof integrated management [HAN99] that are mentioned above. It means the classifica-tion in functional areas is orthogonal to the classification in layers.
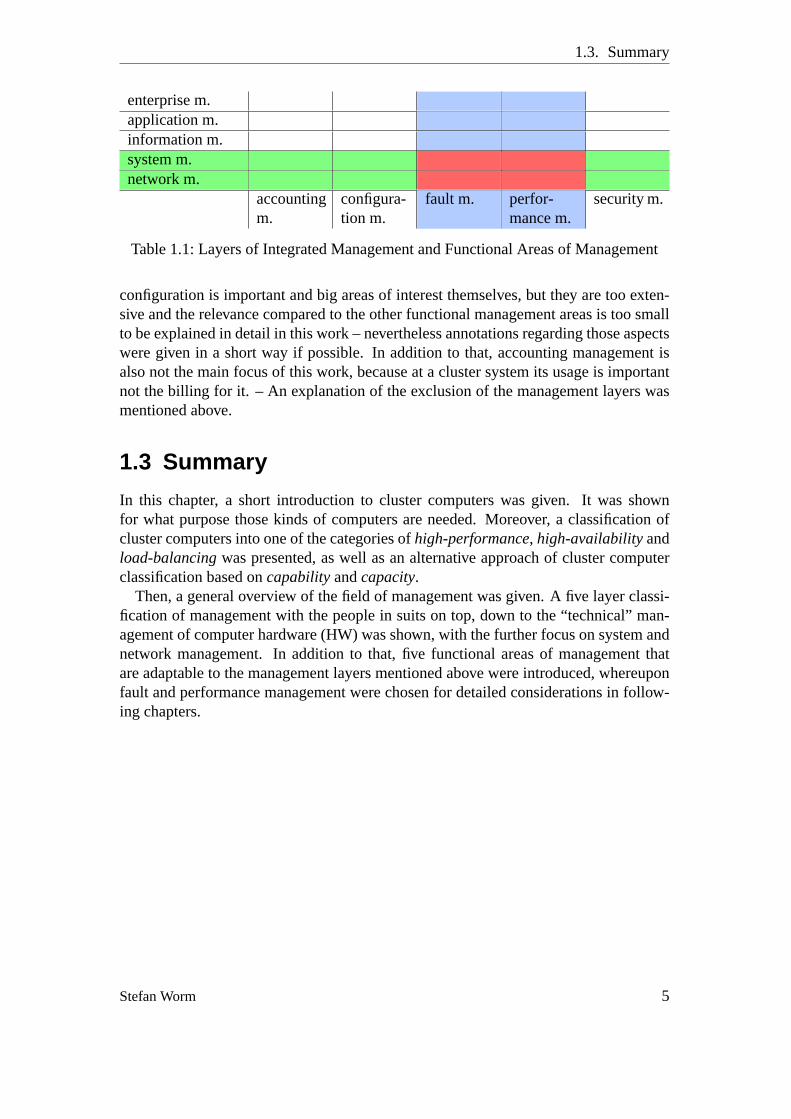
Because of the limited focus of this work, only the intersection of system and net-work management with fault and performance management is considered (refer to Ta-ble 1.1 on the facing page). Apparently, the management of security [Wor05] and
6This is the fourth part of the well known ISO/IEC 7498-1 standard [ISO94] (refer to [Tan03]), inwhich the seven layer Open Systems Interconnection (OSI) reference model is defined, that is theabstract description for communications and computer network protocol design.
7An interpretation of this standard can be found in [Lan94, CS92, Lib00].
4 Stefan Worm
1.3. Summary
enterprise m.application m.information m.system m.network m.
accountingm.
configura-tion m.
fault m. perfor-mance m.
security m.
Table 1.1:Layers of Integrated Management and Functional Areas of Management
configuration is important and big areas of interest themselves, but they are too exten-sive and the relevance compared to the other functional management areas is too smallto be explained in detail in this work – nevertheless annotations regarding those aspectswere given in a short way if possible. In addition to that, accounting management isalso not the main focus of this work, because at a cluster system its usage is importantnot the billing for it. – An explanation of the exclusion of the management layers wasmentioned above.
1.3 Summary
In this chapter, a short introduction to cluster computers was given. It was shownfor what purpose those kinds of computers are needed. Moreover, a classification ofcluster computers into one of the categories ofhigh-performance, high-availabilityandload-balancingwas presented, as well as an alternative approach of cluster computerclassification based oncapabilityandcapacity.
Then, a general overview of the field of management was given. A five layer classi-fication of management with the people in suits on top, down to the “technical” man-agement of computer hardware (HW) was shown, with the further focus on system andnetwork management. In addition to that, five functional areas of management thatare adaptable to the management layers mentioned above were introduced, whereuponfault and performance management were chosen for detailed considerations in follow-ing chapters.
Stefan Worm 5

2 Cluster Monitoring
In Section1.2 on page3 an introduction to the management of clusters was given.It describes all the procedures that have to be done beginning with installation, overmaintenance to the shut down of the system. There are decisions to makehow, when,where, what, etc. to do with the cluster. To get a basis of information, necessary tomake management decisions, it requires monitoring. Based on a useful business axiom“if you can’t measure it, you can’t manage it” [LH02] it means that it is essential to getan overview of the state of the cluster before it can be run in a useful and efficient way.
The verbto monitor1 means “to watch and check on a person or thing” [Neu88],in a more technical definition it means “to check on or regulate the performance of amachine” [Neu88]. For this it is necessary to measure – to realise performance mea-surement. In this aspectperformanceis always related to what is intended. Based on aspecific task, the performance of a system can be anything fromnone, it cannot performat all, to it has optimum performance, in the way that it uses the existing resources asgood as possible.
Finally, referring to Joyce et al. monitoring can be defined as the process of collec-tion, interpretation and presentation of information concerning objects [JLSU87].
2.1 Monitoring as Part of Management
As mentioned in Section1.2on page3 there are various fields of management that canbe categorised in different ways. Furthermore, it was also emphasised in the precedingsection that monitoring is the basis for management. Thus, monitoring is essential forevery kind of management and every kind of management requires its own type ofmonitoring. Therefore management is not possible without proper monitoring. Basedon this conclusion, it is permissible to substitute the wordmanagementby monitoringin Table1.1on page5 and with its new meaning it also describes the kind of monitoringthat is focused in this work.
There are two primary types of monitoring regarding their purpose [LH02, CWSC01]where each of both belongs to its correlative management area (refer to Section1.2onpage3):
real-time monitoring Also known as event or fault monitoring.2 It watches everyunintended, unexpected change of the systems state, this could be a check for a
1monitor: past participle of the classical Latin “monere” which means “to warn” [Neu88]2Although fault monitoring is the correlative of fault management, the term real-time monitoring is
used because it describes its task in a better way.
Stefan Worm 7

Chapter 2. Cluster Monitoring
subsystem’s outage or the exceed of preset threshold values. The key premise isthe permanent check of the system and the instant processing and disseminationof the information (refer to Section2.4on page14 and Section2.5on page19),which can be, for example, the immediate alerting of a responsible person in caseof an unexpected behaviour.
It allows only reactiveactions related to the systems state. Consequently, anaction can be taken only after an event has occurred, which usually means thatthe unwanted behaviour has already appeared.
historical monitoring Another term is performance monitoring3, the result of itsjob is the automatic generation of (long-term) statistics, for example foravail-ability, utilisation and throughput. First, a system performing historical monitor-ing collects the data and stores them. After this, the gathered data can be usedto generate graphs that usually show the dependency between values, e.g., thesystem’s performance over time, or for the detection of problems that occurredin the past.
It is the basis for predictions of the systems behaviour in the future and possi-ble actions that can be taken to prevent system outages (proactiveactions). Forexample for the prediction of future resource demands.
A classification in two categories, like mentioned above, does not mean that the twotypes of monitoring are incompatible to one another – indeed the gathered data of areal-time monitoring system can be used as the input for historical monitoring. Butit has to be kept in mind that both systems have their own purpose and that a simpleintegration would not lead to a satisfactory solution, for example the storing of all real-time monitoring data without any concept would lead to a huge data grave instead ofconvincing historical monitoring statistics.
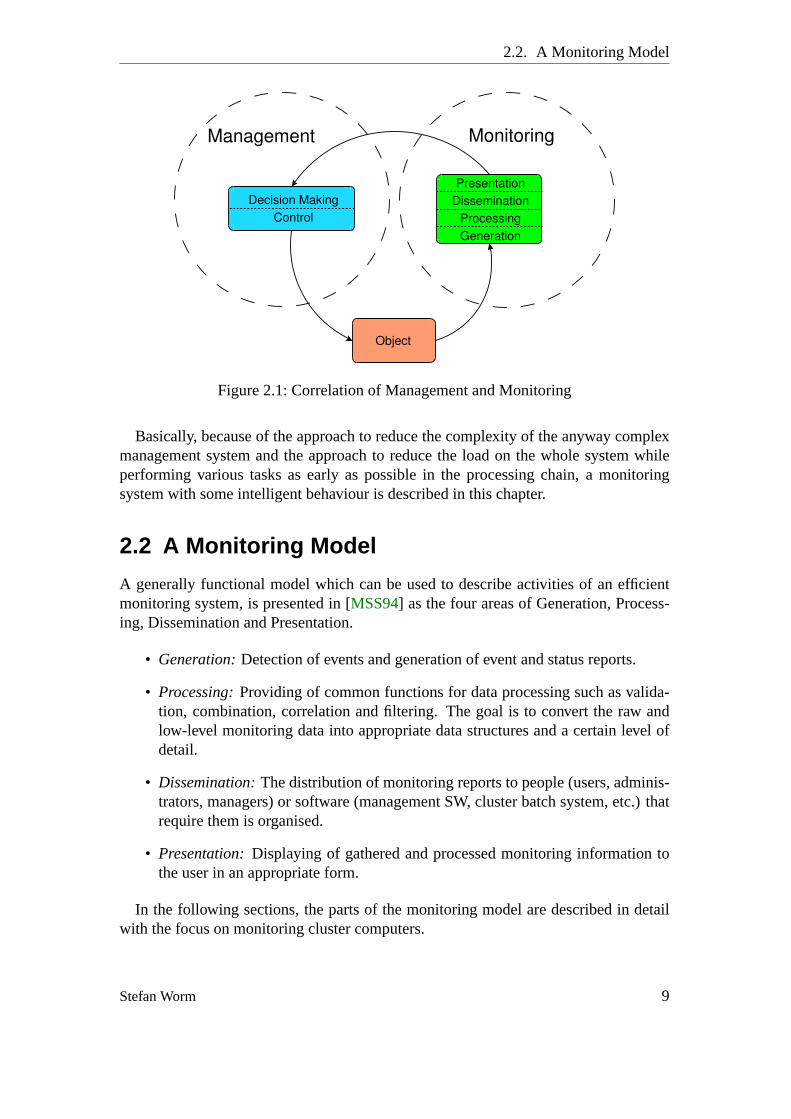
Finally the question is posted, where does monitoring end and where does man-agement begin. Although both terms are sometimes used to describe the same thingand even appear interchangeable for some reasons, it is possible to make a distinc-tion. Monitoring can be defined as the process of gaining information about an objectand management as the process of making decisions regarding the object based on themonitoring information, as well as the control of the object. The control loop betweenmonitoring, management and the object that is managed and monitored is shown inFigure2.1on the next page (refer to [MSS94]).
This distinction is important to define what type of action belongs to monitoring andwhat belongs to management. Regarding the definition mentioned above, additionally,there is the scope of direct processing of the monitoring data that can be seen either asa task of the monitoring system or of the management system. It depends on whethermonitoring is defined as the pure gaining of information of an object or as a system thatsupplies the management system as good as possible.
3Though performance monitoring correlates to performance management, because of its better descrip-tion of what is meant with it, the term historical monitoring is used further on.
8 Stefan Worm
2.2. A Monitoring Model
Management Monitoring
Object
PresentationDissemination
ProcessingGeneration
Decision MakingControl
Figure 2.1:Correlation of Management and Monitoring
Basically, because of the approach to reduce the complexity of the anyway complexmanagement system and the approach to reduce the load on the whole system whileperforming various tasks as early as possible in the processing chain, a monitoringsystem with some intelligent behaviour is described in this chapter.
2.2 A Monitoring Model
A generally functional model which can be used to describe activities of an efficientmonitoring system, is presented in [MSS94] as the four areas of Generation, Process-ing, Dissemination and Presentation.
• Generation:Detection of events and generation of event and status reports.
• Processing:Providing of common functions for data processing such as valida-tion, combination, correlation and filtering. The goal is to convert the raw andlow-level monitoring data into appropriate data structures and a certain level ofdetail.
• Dissemination:The distribution of monitoring reports to people (users, adminis-trators, managers) or software (management SW, cluster batch system, etc.) thatrequire them is organised.
• Presentation:Displaying of gathered and processed monitoring information tothe user in an appropriate form.
In the following sections, the parts of the monitoring model are described in detailwith the focus on monitoring cluster computers.
Stefan Worm 9

Chapter 2. Cluster Monitoring
2.3 Generation of Data
The beginning of the monitoring process is to generate the monitoring information.This can be done in several ways. Simply by performing several actions manuallyfrom time to time [Sel00], for exampleping the machine, login viaSSHto performsome commands likedf , ifconfig, top, psand others, or check the system’s services byfetching a website, downloading a file via FTP and so on. Although this kind of “mon-itoring” is very common among administrators supervising a small set of computers, itis not as seldom as expected also for large computer sets. Nevertheless, for a clustercomputer the better way is to use tools that generate monitoring data in an automatedway. Therefore the approach of a centralised monitoring server is analysed, which issupported by specialised software modules for monitoring, or the status and event logsof a third party (software-)system.
2.3.1 Local and Remote Monitoring
Based on the location where monitoring is performed, it is differentiated between localand remote monitoring. The method oflocal monitoring means that the monitoredobject itself performs the necessary actions for getting its own status information andthat it is responsible itself for all monitoring activities. This can be done by scripts orprograms that are executed periodically for example with the help of thecron service,by a specialised, permanent running monitoring daemon, or by a dedicated hardwaresystem like a specialservice CPU. The gained information can, but does not have tobe sent (pushed) periodically, or if necessary, to a system that collects data from localmonitoring systems to store and further process them.
The counterpart of local monitoring isremote monitoring. The termremotemeansthat the monitoring supervision of the system is mandatory performed from the outsideby a dedicated monitoring server which is driven by a kind of policy. This could berealised completely externally for example by passively analysing the network trafficor by actively checking the host’s status. For this reason a local monitoring daemon canbe installed too, but with the difference that it is dependent on the monitoring serverand controlled by it. The communication between them can be organised bypulling(also:polling), which means that the server periodically demands information (probe)from the monitored object that thereon replies the requested information. If necessary,the monitored objects send analert (also: trap) to the server in addition.
2.3.2 Communication Methods
In addition to the principles where monitoring is performed, the two principles haveone thing in common: a kind of communication between the monitored object and themonitoring server. This can be done in various ways.
A very common practise is the use of the Simple Network Management Protocol
10 Stefan Worm

2.3. Generation of Data
(SNMP)4 standard [MS01], that offers a standardised and flexible method mainly fornetwork devices. It has not only been developed to meet monitoring but also manage-ment requirements.
Especially for network status concerns the use of Internet Control Message Proto-col (ICMP) specified in RFC 792 [RFC81] is suitable [Hal00]. For example networkconnectivity and performance can be monitored by actively usingping messages orpassively record ICMP error messages like “destination unreachable”.
Among other methods like remote execution of commands which was mentionedabove, the communication protocol of a specialised monitoring client is usually realisedin a very specific implementation. Not the interoperability of those implementations isthe main topic, the focus typically lies on the lowest possible impact on the performanceof the involved monitored components, and a minimum network load and the possibilityto fit the communication method to the specific needs of dedicated monitoring systemsbest (refer to Section2.3.4).
2.3.3 Overview about Monitoring Objects
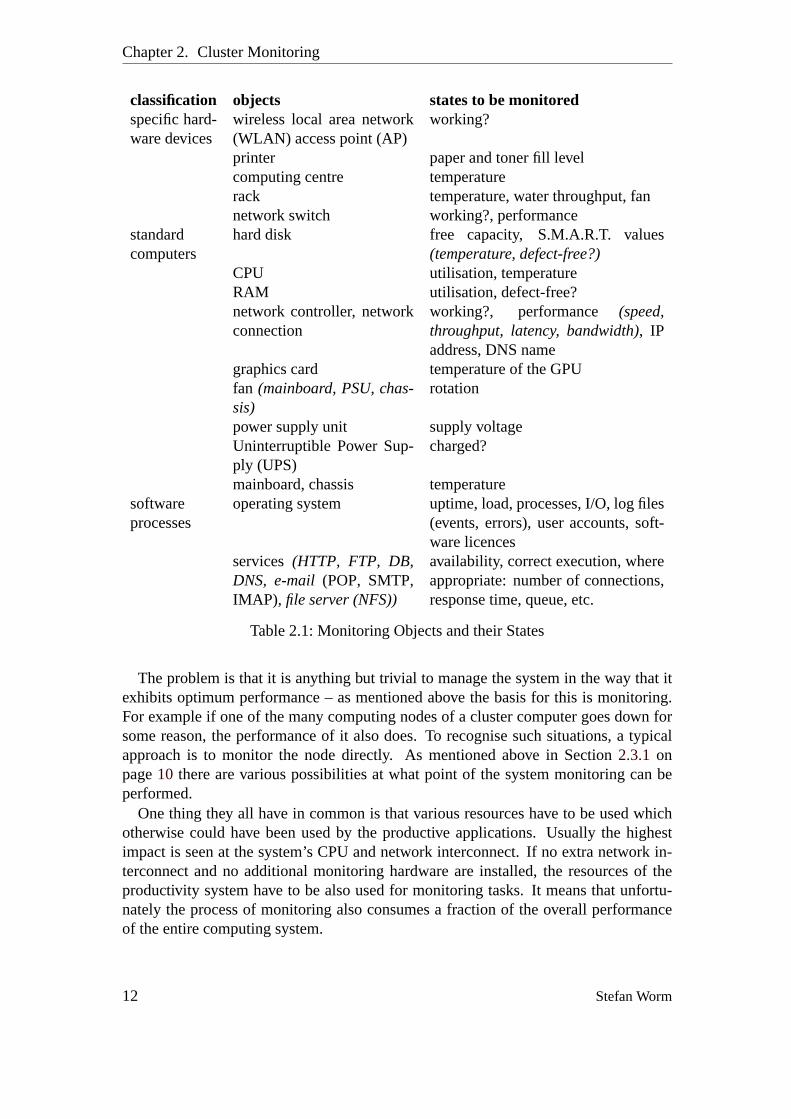
At this point, the kind of real objects that are meant forsystem and networkmonitoringin combination withfault and performancemonitoring are presented. With the term“objects” every kind of things that can be monitored or that are involved in the processof monitoring are described. See Table2.1on the next page for a brief overview.
Apart from the objects whose values can change, not mentioned in Table2.1on thefollowing page are all the objects that are static, for example CPU ID, CPU type, HDDvendor, HDD size, RAM size, OS version, MAC address, etc., because the focus ofmonitoring is on the objects that are applicable for finding out if something is workingas it should do or not. Although those object values are also retrievable and usable forthe monitoring system, they are more interesting for configuration management (seeSection1.2 on page4). Further on, the non-requesting of the values mentioned abovevia the monitoring system also avoids network traffic.
2.3.4 Performance and Scalability
Theperformance of a system describes the ability how well it carries out an action orpattern of behaviour [per05]. A statement regarding a system’s general performance isoften a relative value, either compared to another system or the practically measuredperformance value compared with the theoretically expected one of the system. Onlybased on the results of the system’s comparison mentioned above, a statement likepoor,good, optimumregarding its performance can be made. Obviously, the performanceshould always be the optimum, which usually means to use the full power of a system,because of the reason not to give away the expensively purchased performance, e.g., ofa cluster computer.
4The SNMP standard consists of various Request for Comments (RFC), the details of the actual SNMPversion 3 can be found in RFC 3410 to 3418 at the Internet Engineering Task Force (IETF) website –http://www.ietf.org/rfc/ .
Stefan Worm 11
Chapter 2. Cluster Monitoring
classification objects states to be monitoredspecific hard-ware devices
wireless local area network(WLAN) access point (AP)
working?
printer paper and toner fill levelcomputing centre temperaturerack temperature, water throughput, fannetwork switch working?, performance
standardcomputers
hard disk free capacity, S.M.A.R.T. values(temperature, defect-free?)
CPU utilisation, temperatureRAM utilisation, defect-free?network controller, networkconnection
working?, performance (speed,throughput, latency, bandwidth), IPaddress, DNS name
graphics card temperature of the GPUfan (mainboard, PSU, chas-sis)
rotation
power supply unit supply voltageUninterruptible Power Sup-ply (UPS)
charged?
mainboard, chassis temperaturesoftwareprocesses
operating system uptime, load, processes, I/O, log files(events, errors), user accounts, soft-ware licences
services(HTTP, FTP, DB,DNS, e-mail(POP, SMTP,IMAP), file server (NFS))
availability, correct execution, whereappropriate: number of connections,response time, queue, etc.
Table 2.1:Monitoring Objects and their States
The problem is that it is anything but trivial to manage the system in the way that itexhibits optimum performance – as mentioned above the basis for this is monitoring.For example if one of the many computing nodes of a cluster computer goes down forsome reason, the performance of it also does. To recognise such situations, a typicalapproach is to monitor the node directly. As mentioned above in Section2.3.1 onpage10 there are various possibilities at what point of the system monitoring can beperformed.
One thing they all have in common is that various resources have to be used whichotherwise could have been used by the productive applications. Usually the highestimpact is seen at the system’s CPU and network interconnect. If no extra network in-terconnect and no additional monitoring hardware are installed, the resources of theproductivity system have to be also used for monitoring tasks. It means that unfortu-nately the process of monitoring also consumes a fraction of the overall performanceof the entire computing system.
12 Stefan Worm
2.3. Generation of Data
Therefore the goal is to keep the influence of the monitoring actions on the system’sperformance as low as possible. Especially the impact of the monitoring activities onthe system’s CPU and the network interconnect has to be minimised. In order to reachthat goal a careful selection has to be made of the objects thathave to bemonitored andthe objects thatcan bemonitored (refer to Table2.1on the preceding page). Sometimesthe more likely disadvantageous proceeding is made by trying to monitor everythingthat is possible, because at first sight every object appears worth it.
Unfortunately this does not increase the chance of getting to know about an importantevent. In contrast, without appropriate filtering and processing this approach lowers it,because of the flooding of information the chance of getting to know about the reallyimportant ones gets lower. The lower the number of objects that have to be monitoredthe lower the performance impact. Furthermore the impact of the monitoring systemitself regarding its architecture, monitoring principles and rules, implementation andespecially the frequency of executing monitoring activities is also an issue that has tobe paid attention to [SDA+00].
From this it follows that there is a trade-off between the performance loss because ofthe execution of monitoring functions and the risk of not getting to know if somethingis wrong with the cluster, that therefore also could lead to a significant performanceloss.
Another issue that affects the performance of monitoring and therefore also of thecluster computer is thescalability of the monitoring system. The scalability describesthe capability of a system being easily expandable or upgradeable on demand [sca05].For a monitoring system it means that a small installation of a few monitored objectscould work well but for a huge number of objects like on a large cluster computer thesame monitoring approach could have that much influence on the productive systemthat it needs a large fraction of its performance for monitoring only. This is of courseunacceptable, hence a monitoring system must be examined regarding its ability towork well with a large number of monitored objects. A big influence on this problemhas the type of application that runs on the computer cluster and the period of timebetween the execution of two monitoring actions.
For example when a distributed application5 runs on a cluster computer and has todo a lot of communication work among each of its components, additionally thereis a monitoring application that shares the CPU and the network connection with thedistributed application, in a special case an uncoordinated execution of the two appli-cations can lead to a significant slowdown of the productive application [PKP03]. Al-though the outlined scenario above is a very special one it shows that the configurationof the monitoring system is essential for the scalability of the system.
Another aspect of the scalability is the ability of the system that controls all monitor-ing activity to handle a large amount of monitoring data. Based on the monitoring datathis system needs an appropriate network connection, an adequate data storage space
5 A distributed application, based on a distributed processing system (DPS), consists of several au-tonomous parts which interact in order to cooperate to achieve an overall goal by coordinating theiractivities and exchange information by means of communication systems. [SK87]
Stefan Worm 13
Chapter 2. Cluster Monitoring
and reasonable computation power or a distribution of the monitoring functionality it-self or by using a load-balancing cluster (refer to Section1.1on page2).
2.4 Processing of Data
In the previous section the generation of monitoring information was discussed. Inthis section common processing activities that can be performed on this informationare considered. Note that these processing functionalities are often integrated and areperformed in different places and at various stages.
2.4.1 Data Validation and Storage
First of all the generated monitoring information (Section2.3 on page10) has to passvalidation and plausibility tests to make sure the system has been monitored correctly.This may be performed on different levels. When the monitoring information is exam-ined, it is tested for example whether the identification number (ID) is the expected oneor if the time-stamp is valid. Invalid reports are discarded.
A different class of invalid values are those out of the defined range of a certain valueand which appear obviously incorrect for a human, for example if the CPU load is morethan 100 percent or the rotation of a fan is twice the value of its absolute maximum. Theorigins of such values, e.g., a wrong measurement itself, are various and the treatmentof them depends on the analysis strategy. Those values can be generally ignored or theycan be stored and analysed further, depending on if they occur only once, occasionallyor frequently to extrapolate appropriate reactions towards this.
The monitoring data is stored in a database to have a current status of the system,because it is used to access it for further analysis of the data later on, especially fordetecting component failures or for concerns of the management system. The data isstored separately for real-time or historical monitoring reasons (refer to Section2.1onpage7) or the real-time data can be converted for historical monitoring by summarisingthe data with a specific procedure to master its volume.
2.4.2 Combination of Monitoring Values
The combination describes the real analysis of the monitored data. Up to this point thegenerated, validated and stored monitoring information are completely uninterpreted.Not until the measured values are put into relation with the expected ones a statementabout the system’s status can be made.
A simple approach to monitoring is to find out if a system is healthy or not. Butwithout the definition what the “right” status is, this question cannot be answered. Thus,it has to be defined what an “error” is.
14 Stefan Worm
2.4. Processing of Data
Events
The measured monitoring information can be classified into various types ofevents.
• alright/okay (no problems)
• unknown (no classification possible – the monitoring value cannot be classifiedotherwise)
• warning
• critical (an error has occurred)
But the definition to which class an event belongs is the administrator’s concern. Notbefore the administrator has defined what an expected value is and what an unexpectedvalue or behaviour of an object is, a statement regarding an event’s classification can bemade. Thus, this is the prerequisite to make intelligent appearing statements like“thetemperature of the CPU is too high”.
The conditions for the classification of the events can be different. The simplest wayis that the monitored value is compared with one or more predefined ranges in which itfits best – resulting from this the classification is made. For example if the temperatureof the CPU is below valuex1 it is anokay event, above valuex1 and below valuey1 itis awarning eventand above valuey1 it is acritical event.
In a more complex situation the measured value is additionally compared with pre-ceding values of the object or with values of another object to perform the event clas-sification. For example if the CPU temperature is between valuex1 andy1 (warning)for z hours the administrator can define a rule that classifies this ascritical. Regardingthe comparison of values, it has to be paid attention that also the missing of the presentor preceding ones can lead to a reaction. This can be for example the classification asa warningevent immediately after the missing of just one value or after some time if afew are missing, or for example it can be classified as acritical event if the missing ofa value remains persistent, depending on the configuration.
But the previous situation can be expanded even more to model more complex situ-ations. The reason for the further enhancements of the classification process is due tospecial requirements.
First, the user of the monitoring system could demand the monitoring of very specialsituations or combinations of events that are not scheduled in the normal monitoringrules.
Second, wrong measured values should be excluded by comparing for example val-ues that are directly or indirectly related to each other, such as the comparison of thetemperature of the CPUs, of the chassis and of the rack to eliminate situations like thefollowing one. The temperature of the rack rises, but the CPU and chassis temperaturesof all the computers in that rack stay almost the same. If only the rack’s temperaturewould have been measured, a possible conclusion would have been that the coolingsystem has a problem and the classification would have beencritical for instance. Butknowing about all temperature implies the more possible conclusion that there is only
Stefan Worm 15

Chapter 2. Cluster Monitoring
a problem with the measurement of the temperature of the rack, as the computer workwell, therefore the classification would bewarningonly.
Third, it is possible to make more general and abstract statements of the system’sstate by correlate several values to get just one value that for example expresses thatone computer is without any problems. If all measured objects of the computer indicatethat there are no problems at the moment, or the computer is accessible via the network,the infrastructure (network switch, network connection), for instance, is alright as well.The main reason for value summarisation is to ease the work of the administrator byreducing the classification of events in eitherwarningor critical, because usually a lotof effort is involved to handle these. Another possibility for a better classification isthe performing of additional monitoring actions to confirm or rebut a measured valuewhere qualified doubts about its validity exist. For instance, the additional measuringof the CPU’s load can test if the possibly too high value of the CPU’s temperature iscaused by a lot of work the CPU is doing or because of a defective temperature sensor.
The monitoring system is able to perform this action because the monitoring modulefor a specific value is already available on the system which is monitored. The monitor-ing system can simply access this value if necessary – the execution of general purposecommands in this context is not necessary by the monitoring system. Moreover its ex-ecution also would not have been allowed, because of the separation of monitoring andmanagement tasks regarding a specific object (refer to Figure2.1on page9), the directcontrol of it is part of the management only, refer to Figure2.2on the facing page. Thisis also important for the field ofproactive managementwhich handles the execution ofcommands on an object. It can be the installation of additional software like anothermonitoring module (refer to Section1.2on page4 – areas of management) or just theexecution of a command that takes influence on the monitored object [CS92].
For instance a high load, almost 100 percent, on a specific computer that is not work-ing on a cluster job may occur from time to time. The reason for this was figured out –it was caused by a program that sometimes misbehaves and because of this consumesalmost all processing power for nothing. The newest version of this program is alreadyinstalled and there is no replacement for this program, which means that only the ef-fects of it can be treated. Thus, a possible solution would be to implement that if a highload on the specific computer occurs, an additional measuring verifies if it actually isdue to the program that sometimes misbehaves, if yes the process of the program is ter-minated and it is restarted. The solution is suitable for this situation only and this kindof solutions should be used only rarely, because there is a high danger that somethinggoes (automatically) wrong and it can cover up problems instead of solving them. Toencounter this risk, at least a notification of the administrator should be made after theperforming of the solution of the problem (refer to Section2.5– Dissemination, p.19).
Another use of the summarisation of events is the avoidance of event flooding. Forexample if a network switch breaks down, only one event is generated and not one forevery single computer that is affected by this situation [LH02]. In addition to that, ina situation where the measured value of an object wobbles slightly around a thresholdvalue in a fast manner, for example at the stage towarning, the generation of one eventfor every exceeding of it is not desired.
16 Stefan Worm

2.4. Processing of Data
ObjectConfiguration;
CommandExecution
Request of Monitoring Information
Transmissionof Monitoring Information
InformationExchange
MonitoringManagement
Figure 2.2:Object that is Controlled and Monitored
The configuration of the scenarios described above requires the foregone modellingof them by the administrator of the monitoring system as mentioned before, as well asthe support of the monitoring system for this. It means, that it has to have the possi-bility for example to record the representation of the network regarding the situationmentioned above where event flooding has to be avoided if just one component failsbut many others are affected.
The classification and combination of the monitoring information is essential to keepa clear view of the system. The increasing level of abstraction associated with this ap-proach prevents the users of such information from being overwhelmed by the consid-erable volume of information. The separation of events and their associated reactionsis for reducing the complexity, so that it is not necessary to define appropriate reactionson every single monitored value – the aggregation of them allows the definition of a setof reactions for the event classes only. Any appropriate reaction to this is part of thedissemination of the monitoring data (refer to Section2.5on page19).
Although the reactions are not directly on a single measured value but on an eventclass the information, of what the reason for the event was, is put through to the objector person which handles the reaction to it in the end.
Measurement Errors
The classification of the measured values in event classes is not without errors. Ideallythere is a measured value that really is a specified event type (e.g.warning) and it willbe classified accordingly. It is the same situation if a measured value does not belong
Stefan Worm 17

Chapter 2. Cluster Monitoring
to a specified event type and is not classified as this, too. This seems trivial, but it isnot. There are situations conceivable where this is not correct (see below). If the twosituations mentioned above occur, everything is alright and it is the way how it shouldwork (refer totrue positive andtrue negative in Table2.2).
Nevertheless, the following two situations are more important, because somethinghas gone wrong if they occur. Thefalse positive(also: typeI error orα error) is theresult of a classification which describes that the measured value is not of the specifiedevent type, but it is wrongly classified as this type. Thus, a measured value would beclassified as awarningalthough its true nature does not fulfil the requirements for theevent class. Further on, afalse negative(also: typeII error orβ error) classificationdescribes that the measured value is of the specified event type, but it is not classifiedas this type. Thus, although for example a measured value should have been classifiedas acritical event it has not been.
the true nature of the eventit is the specified type it is not the specified type
classifi-cation ofthe event
as the speci-fied type
true positive false positive
not as thespecified type
false negative true negative
Table 2.2:Errors of Event Classification
The importance of the topic is to understand that a monitoring system itself can neverbe without any errors, so it cannot be perfect. There are always errors that can occur,mainly that a value is not classified as a special event although it is or vice versa. Inconsequence this can lead to events that are not handled although they should and thenperhaps cause big trouble regarding the monitoring purpose. For example a bug inthe software of the I/O server can lead to a misbehaviour of it, so that it writes datato the storage system which causes damage to the stored information and that needsto be stopped immediately. In the other error situation it bothers the administratorunnecessarily if a lot of false alarms occur.
The reasons for the wrong event classifications are mainly systematic errors likeinsufficient classification rules, wrong measurement interpretation, general errors in thesoftware that processes the classification, etc. or random errors like in the measurementitself and in the measurement data transmission [Kan02].
2.4.3 Filtering and Analysis
The filtering of the information is primarily for their reduction on all levels of themonitoring system due to the amount of data that has to be generated, processed, dis-seminated and presented. The filtering on a stage as early as possible of the monitoringprocess reduces the work for the stages that follow. For example it reduces the CPUand network influence on the cluster computer best by ascertaining only the actuallynecessary data. Also the validation of information (refer to Section2.4.1on page14) is
18 Stefan Worm
2.5. Dissemination of Information
a kind of filtering that pursues the goal of information reduction, as well as the controlof the dissemination of information (refer to Section2.5), for example that the mon-itoring reports are only sent to the person who is interested in them. The criteria onwhich the filtering is performed, are defined as a part of the processing rules and arealso based on the requirements that are defined by the administrator of the monitoringsystem.
Another important issue of the processing of the monitoring information is the anal-ysis of them. The analysis can be the main purpose for example of a historical moni-toring system (refer to Section2.1on page7) that usually has specialised functions forthis. But it can also be useful for a real-time monitoring system (refer to Section2.1onpage7) that can benefit, e.g., from the ability to determine the average or a mean aver-age of particular status variables, forecasting faults in components and the possibilityto get some statistics that allow a clear view of the system’s state [MSS94]. Often, forinstance it is interesting to have statistics such as the total CPU usage, idle and busytimes, the amount of data sent, etc. Another use of the analysis can be the supervisionof the monitoring system and its process itself. For example with the help of the ad-ministrator that classifies all false alarms on their occurrence, statements regarding thesystem’s quality of the classification of events can be made.
2.5 Dissemination of Information
Monitoring reports that are the result of the monitoring information processing have tobe forwarded to different users of such information. The destination of such reportsmay be human users, the management system, other monitoring objects or processingentities. It is based on the approach to disseminate only the really necessary informationto avoid a big workload on the monitoring system and to ensure that the receiver of theinformation gets only those that are interesting.
The following reactions on events are conceivable, based on the classification ofthem (refer to Section2.4.2 on page15) and the principle of separating the event’sclassification by their reaction to it.
1. forwarding the information to other systems
• event log database
• further processing instances
• the management system
• presentation module (refer to Section2.6 on page21), change the object’sstatus in the monitoring system if necessary – information available forpulling
2. inform user or administrator – by pushing information
a) e-mail
Stefan Worm 19

Chapter 2. Cluster Monitoring
b) cellular phone text message (SMS)
c) instant messages (IM) or playing a sound file if the person is working at thecomputer
d) phone call
A dissemination of the information to other systems always happens. Either the re-ceiving objects and instances have rules to handle the event information or they simplydiscard or ignore them. But the main task of the dissemination module is the handlingof the information that is sent directly to the human user. This is done only if the infor-mation is of such importance that it needs the attention of a person. Which information,respectively event classes are chosen for this is part of the configuration of the monitor-ing rules, as mentioned above. An exemplary situation could be that if awarningeventoccurs an e-mail is sent and if acritical event occurs an SMS or IM is sent.
Further on, the dissemination module is responsible for the enforcement of the rulesthat handle theWho? is informed, depending on theWhen?. It means, that only theresponsible person or a group of persons (Who?) will be informed at a certain time(When?) to ensure that the person is really able to handle the information and that thisperson is in duty or stand-by duty and not on holidays so that he or she can really dealwith it. It has to be ensured as well that at every time and for every event the rightdestination is addressed. This is part of an escalation procedure in the handling of thedissemination of monitoring reports.
The procedure ofescalatinga problem means that it is tried to counteract on a per-ceived discrepancy, for example that a problem gets bigger and bigger if not treated andthat it is levelled up fromwarning to critical if it lasts to ensure the treatment of it forinstance. But if it is acritical event already, there are two possibilities to ensure thattreatment of it takes place. One is to define subclasses of an event class and to performdifferent actions based on the level of sub-classification. Another one is to handle theescalation of the treatment of monitoring events with the help of the dissemination pro-cedure itself. In a reliable monitoring system it has to be ensured that there is a reactionto an event that has occurred.
This can be done by the receiver of the event notification by sending an answer to themonitoring system that the processing of the event is under way. The escalation of allmonitoring information finally end at a person, because if every preceding classificationand the therewith associated actions, like automated execution of programs that shouldfix something, fail, a person is the last instance that can handle a problem. Thus, theescalation of the treatment of a problem if it is disseminated to people is very important.
One possibility to do this is for example the rule that a person flags the problem heor she starts working on. This can be done by sending a reply message on the receivede-mail, SMS, etc. or by marking the problem asworking onat the front-end of themonitoring system. If the flagging does not happen after a period of time or the statusdoes not change although the problem is flagged, its treatment is further escalated.Furthermore it is unaffected by the possibility to flag the problem as, e.g.,not solvable
20 Stefan Worm

2.6. Presentation of Results
until further noticeor evenbrokenif there are conditions that cannot be fulfilled at themoment and that thereon no further escalation is carried out.
Finally, the escalation of the treatment of a problem means that another person whichcan be the member of the team or someone from outside (horizontal escalation) is in-formed, or a person that has more experience or the superior or even his or her superioris informed (vertical escalation), or that it is tried to get through to a specific personby means of different communication methods, for example e-mail first, text message(SMS) second and automated phone call as the last resort.
2.6 Presentation of Results
The final step in monitoring is the presentation of the information as the result of thepreceding generation, collection, processing and dissemination of data.
The way in which this can be done depends on the physical device the administratoris using, for example a computer display, a mobile phone display or a voice interac-tion system. Additionally it also depends on the requirements of the user to choose theappropriate presentation form. This can be a textual representation in a system con-sole, short message or e-mail, as well as a graphical representation with the help of aGraphical User Interface (GUI) or a specialised display system. Thus, the presentationmodule has to control the amount of monitoring data, the levels of abstraction of suchinformation and the rate at which this information is presented.
The main focus of the presentation of information has to be on theusability of thesystem which means the ability of convenient and practical use of something [MAS+03,Nie04]. It means that the quantity of information, the detail of information and the timeinterval in which the information is presented depends on the specific requirements ofthe user and the presentation system and is essential for the success of the monitor-ing strategy. Only if the user of such information is not overwhelmed by irrelevantinformation a proper reaction to it is possible.
Thus, user-friendly techniques for instance at the presentation device computer mon-itor is desirable, for example the grouping of the information for a better overview,comprehensible event messages especially for e-mail or adjusted display format withweighted lists (e.g. tag clouds [MHS06]). The use of weighted lists can also solvea typical problem in information presentation, that is to find out which of thecriticalevents is the most urgent one. It means, the system administrators “have to be able totell at a glance which of the “red” issues is the “reddest” and having the most impact”[LH02, p. 519]. The condition on which a very urgent event is highlighted with a largerfont or the top position of a list, has to be an additional value which could be the po-sition in the dependency hierarchy, a manually predefined one or a dynamic one suchas the number of events over a fixed period of time. Thus, events may be displayed intheircausalrather thantemporalorder.
Nevertheless, especially for historical monitoring the use of two dimensional dia-grams, with one axis representing a specific value and the other representing time is themost common method to show the changes over time.
Stefan Worm 21
Chapter 2. Cluster Monitoring
2.7 Summary
In this chapter, the relation between management and monitoring has been shown. Thedistinction between real-time monitoring and historical monitoring as the correlative offault management and performance management was made and the different require-ments of both on a monitoring system were presented in detail.
Furthermore a model that describes the procedure of monitoring as the four areasof generation, processing, dissemination and presentation of data was introduced andexplained in more detail.
In Section2.3“Generation of Data” the distinction between local monitoring and re-mote monitoring was made, an overview about objects and their states was given, in ad-dition to that some remarks were made about building up a preferably high-performanceand scalable system.
The Section2.4 “Processing of Data” discusses various types of classification ap-proaches to classify the measured values in event categories for further processing, aswell as the appearance of measurement errors.
In the last two sections, first the dissemination of the monitoring results to the ob-jects or people that use them with the help of an appropriate escalation procedure andsecond the presentation of them on various devices with the focus on their usability wasdiscussed (refer to Section2.5on page19and Section2.6on the previous page).
Finally, this chapter has given a comprehensive overview about cluster monitoring ingeneral and about topics on which it has to be paid attention to, in particular to be ableto understand the requirements of such a system.
22 Stefan Worm

3 Chemnitz High-PerformanceLinux Cluster (CHiC)
3.1 Introduction to the CHiC
The Chemnitz High-Performance Linux Cluster (CHiC)1 is a computer system, ac-cording to the definition in Section1.1 on page2 and it serves as a capacity systemregarding the classification in Section1.1on page3. It is the successor of the ChemnitzLinux Cluster (CLiC)2, a 528 node, single-CPU, self-made Beowulf3 system incorpo-rating Intel Pentium III 800 MHz CPUs and Fast Ethernet interconnection network.It is maintained by the university’s computing centre and it was rated on position 126(Rmax = 143.3 GFlops4, Rpeak = 424.3 GFlops) of the November Top500 list [top00]in the year 2000.
The CHiC installed in November 2006 under the supervision of the Computer Ar-chitecture Group is a diskless 530 node system with dual-CPU (SMP architecture) anddual-core AMD Opteron 2218 (2600 MHz) central processing units, which was buildby IBM and installed by Megware. Additional 8 input and output (I/O) nodes for theconnection to the 60 TB storage system, 12 visualisation nodes with high-end graphicscards, two management and two login nodes are also part of the system. The intercon-nection network for computation is a 4xSDR (10 Gb raw bandwidth) InfiniBand5 (IB)network with Clos network topology [LNC98, Clo53] and an extra network for man-agement according to the Intelligent Platform Management Interface (IPMI)6 standardis realised with Gigabit Ethernet technology.
The CHiC project group consists of 23 professorships and institutes at the Chem-nitz University of Technology with the intention to support research in the fields ofmodelling and numeric simulation of problems, for example in quantum mechanics,as well as real-time rendering of complex virtual reality scenes. The following com-putational kernels, libraries and tools were identified to contribute to the majorityof the system’s load regarding a foregone survey: Basic Linear Algebra Subroutines(BLAS), double-precision General Matrix Multiply (DGEMM), ABINIT [GBC+02],
1http://www.tu-chemnitz.de/chic/2http://www.tu-chemnitz.de/urz/clic/3http://www.beowulf.org/overview/4GFlops = giga (109) floating point operations per second5http://www.infinibandta.org/6http://www.intel.com/design/servers/ipmi/
Stefan Worm 23
Chapter 3. Chemnitz High-Performance Linux Cluster (CHiC)
Car-Parrinello Molecular Dynamics (CPMD)7, SIESTA8 and self-developed ones. Thecommunication interface is almost only the Message Passing Interface (MPI).
3.2 Experiences from the CLiC System
The Chemnitz Linux Cluster (CLiC) is the predecessor of the Chemnitz High-Perfor-mance Linux Cluster (CHiC) as mentioned in Section3.1. Experiences from the long-standing operation of the CLiC and therefore, resulting recommendations for the CHiCwill be described as follows.
The current infrastructure of the CLiC monitoring is based on the Big Brother9 mon-itoring software – the following statements and conclusions are drawn from the useof the Big Brother Version 2003. The monitoring of specific hardware values on thecomputers with a Linux operating system is done by thelm_sensors 10 software incombination with a Big Brother script that is executed by the system’scron daemonaccording to the preset interval. This is not necessary at the CHiC, because every nodeof the system has an Intelligent Platform Management Interface (IPMI) that takes overthis functionality.
At the CLiC the monitoring of the system’s fans was very error-prone. The statusreports from the monitoring system often did not match the real state (refer to Sec-tion 2.4.2on page17). The reasons for this could not be clearly identified, but a faultymainboard chip is the most likely explanation for this. Due to the filtering of the airwithin the air conditioning, no considerable dust has been deposited on the fans, thismay also be the reason that only few of them actually broke down. Because of a rack-based air conditioning at the CHiC system and as a consequence of that an even morecleaner environment, a prematurely breakdown of fans is not expected at the CHiC.The future use of IPMI hardware monitoring, another monitoring software, and CPUsthat turn off before overheating should prevent the appearance of this problem at theCHiC. The more so as a fan breakdown can be indirectly recognised by a temperatureincrease, which is a feature that was not implemented in the CLiC, but it is conceivablefor an implementation in the CHiC.
Common practise in the monitoring of the CLiC was, that the responsible adminis-trator looked for event e-mails every morning and from time to time during the day orthe person looked at the central status website of the monitoring system to see whatis the state of the system at the moment or what happened in the past. Other alertingmechanisms besides e-mail like mentioned in Section2.5on page19were not used.
Mechanisms that are able to complement the e-mail approach like SMS or automatedphone calls may be viewed as useful, but only if they are set up carefully so that theydo not annoy during working hours, as well as during stand-by duty. Also helpfulfor the configuration of the alerting as well as for the escalation procedure (refer to
7http://www.cpmd.org8http://www.uam.es/departamentos/ciencias/fismateriac/siesta/9http://www.bb4.org/
10http://www.lm-sensors.org/
24 Stefan Worm

3.2. Experiences from the CLiC System
Section2.5on page20) is the interconnection with a groupware system [Got02, Mur00]or a similar system, which contains holidays, meetings, working hours, even the lunchbreak schedule if necessary, on which a decision can be madeWho?, When?andHow?a person is contacted (refer to Figure3.1). This will help to prevent the configuration ofthose anyhow existing information at a second place which would originate only morework and the risk of a misconfiguration.
6 a.m. - 8 a.m.
12 a.m. - 1 p.m.
8 a.m. - 12 a.m.
3 p.m. - 5 p.m.
1 p.m. - 3 p.m.
Paul AlexAnne
lunchbreak
12 p.m. - 6 a.m.
5 p.m. - 12 p.m.
working
holi-day
stand-by duty
stand-by duty
meeting
out of duty
out of duty
...
...
...
...
...
...
...
...
available via e-mail
not available for any communication
available via phone calls only
available via SMS - only if urgent (escalation)
available via SMS
working
working
working
working
Figure 3.1:Exemplary Timetable as Basis for Alerting Methods
One problem with the CLiC monitoring system was the insufficient filtering of lessimportant event messages and the tagging of really important ones. This led to thegeneration of up to several hundred e-mails if a central component broke down (referto Section2.4.2on page16), whereas usually only around five e-mails occurred duringthe day. Moreover, sometimes the administrator did not pay appropriate attention to asingle possibly very important incoming e-mail, due to the large number of less impor-tant messages that too often contained only information that not necessarily require aperson’s attention.
Another thing that can be improved based on the experiences of the CLiC systemis the amount of monitoring information that was sent. The problem is that too manymessages weaken the attention of the administrator for the really important ones. Italso consumes the administrator’s time with things that not necessarily have to be doneimmediately and therefore a notification has not necessarily to be generated for this.In this situation the regular survey of the system’s status for example several times aday or perhaps only now and then during the week, depending on the importance ofthe system that is monitored, may be enough for the administrator’s check of minorimportant events.
Stefan Worm 25
Chapter 3. Chemnitz High-Performance Linux Cluster (CHiC)
Three main approaches need to be considered for this. One is that also minor impor-tant events and messages are sent via e-mail to the administrator and that in addition tothat major important ones are sent also via another communication method like SMS.Second, only e-mails are used and major important messages are flagged with a cus-tom mail header for example with the priority class ”high“ which can be interpretedadequately by the e-mail client. The third approach is topushonly the really impor-tant information to the administrator and let the minor important ones bepulled byhim or her. Which one of them, perhaps slightly modified or even another approachshould be chosen is mainly an issue of the dissemination and escalation procedure (re-fer to Section2.5on page19), as well as of the administration policy and the person’spreferences.
One approach to prevent false event messages (refer to Section2.4.2on page17) isthe use of some kind of maintenance support functionality like the registration of themaintenance schedules. With this, the administrator would be able to see if an eventis caused by something to which it has to be paid attention to or because of a plannedoutage for maintenance. Otherwise the administrator would not be bothered at all if nomessage is sent out because of the monitoring system’s knowledge about the serviceplan. The installation of additional functionality whereby a person can advert his or herwork on the elimination of a problem is not necessary at the CHiC system because theoperation and maintenance is not accomplished by a huge staff but by a small group ofpeople, therefore the installation of such a system would not justify the additional workcompared with the expected benefit from this.
Disadvantages of the Big Brother monitoring system that was used at the CLiC sys-tem were, among others, the following ones. The system’s abilities for historical mon-itoring (refer to Section2.1 on page7) was very limited and not very meaningful,moreover the information was not very helpful in trend observation. In addition to thatthe reporting of events, especially in e-mails was not very intuitive. The generated mes-sages contained only very short and cryptic text that needed a person trained in readingthem. This stands in contrast to the recommendations of an easy comprehensible anduser friendly content (refer to Section2.6 on page21), especially the source of theinformation and the rule of processing that led to this message should be given – thiscounts all the more for a replacement administrator, who would gladly take on somehelp additionally provided by the system like the proposal of possible solutions regard-ing a specific event or if it would have executed a preceding test (refer to Section2.4.2on page16) to present a perimeter of the problem. Nonetheless, the creation of rulesfor this is very complex and it has to be paid attention that a wrong configuration of itor an error in its execution can be misleading for the administrator.
An example for a misconfiguration of the monitoring system at the CLiC is, thatfor a specific computer a problem with the Network Time Protocol (NTP) service wasindicated because it could not be verified if the NTP daemon runs or works correctly.But the reason for this was that the node was very busy with computations and themonitoring plugin that checks the NTP availability could not be executed in time. Thus,the problem indicated by the monitoring application was not the actual one. This couldhave been prevented by a more careful configuration, for example by interpreting only
26 Stefan Worm
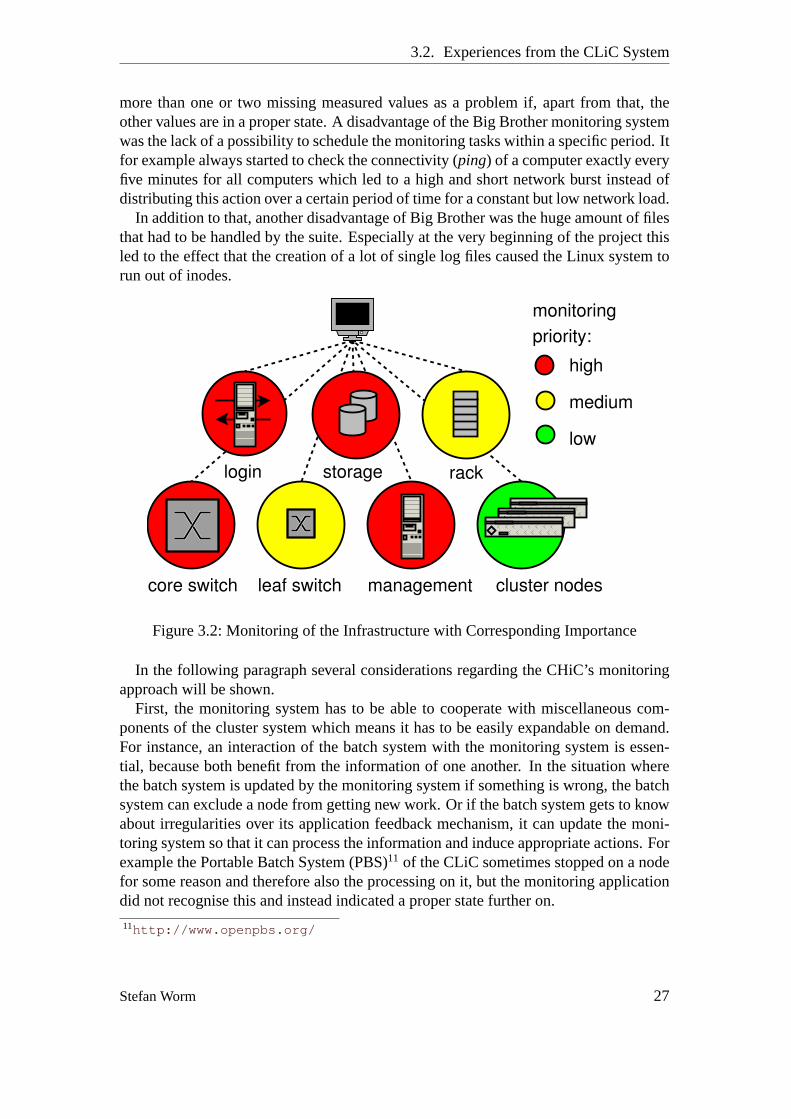
3.2. Experiences from the CLiC System
more than one or two missing measured values as a problem if, apart from that, theother values are in a proper state. A disadvantage of the Big Brother monitoring systemwas the lack of a possibility to schedule the monitoring tasks within a specific period. Itfor example always started to check the connectivity (ping) of a computer exactly everyfive minutes for all computers which led to a high and short network burst instead ofdistributing this action over a certain period of time for a constant but low network load.
In addition to that, another disadvantage of Big Brother was the huge amount of filesthat had to be handled by the suite. Especially at the very beginning of the project thisled to the effect that the creation of a lot of single log files caused the Linux system torun out of inodes.
monitoringpriority:
high
medium
lowlogin
core switch management
rack
cluster nodes
storage
leaf switch
Figure 3.2:Monitoring of the Infrastructure with Corresponding Importance
In the following paragraph several considerations regarding the CHiC’s monitoringapproach will be shown.
First, the monitoring system has to be able to cooperate with miscellaneous com-ponents of the cluster system which means it has to be easily expandable on demand.For instance, an interaction of the batch system with the monitoring system is essen-tial, because both benefit from the information of one another. In the situation wherethe batch system is updated by the monitoring system if something is wrong, the batchsystem can exclude a node from getting new work. Or if the batch system gets to knowabout irregularities over its application feedback mechanism, it can update the moni-toring system so that it can process the information and induce appropriate actions. Forexample the Portable Batch System (PBS)11 of the CLiC sometimes stopped on a nodefor some reason and therefore also the processing on it, but the monitoring applicationdid not recognise this and instead indicated a proper state further on.
11http://www.openpbs.org/
Stefan Worm 27
Chapter 3. Chemnitz High-Performance Linux Cluster (CHiC)
In addition to that the monitoring of the critical infrastructure of the cluster is veryimportant, which includes the monitoring of the I/O servers, storage system, air condi-tioning, login servers, network switches and more. Although some infrastructure likethe storage system, network switches and racks bring their own monitoring function-ality, leveraging SNMP or even own mechanisms for alerting, mostly via e-mail, it isessential that those components are also connected to the overall monitoring system dueto the integrated approach of management (refer to Section1.2on page4) and thereforethe monitoring system (refer to Section2.1on page7). Because only if the breakdownof a disk in a RAID system or irregularities at a high-availability system (refer to Sec-tion 1.1on page2) are properly processed by an overall monitoring system, instead ofthe use of special purpose mechanisms and approaches, an efficient monitoring can beassured. In the end, the precise monitoring of every single compute node of a cluster isless important than the monitoring of the central infrastructure components, because aproblem at this point may affect everything else on the cluster system, whereas a prob-lem at one or a few compute nodes may only affect limited computation jobs or evennothing if the node is anyway idle at the occurrence of an error (refer to Figure3.2onthe previous page).
Another aspect that has to be paid attention to on a monitoring system for the CHiCis the ability to present the status information in a meaningful and clear way, becauseon a system with so many nodes there is always something that is not in a proper state.Furthermore, there may be several nodes that are in a specific state and may remain in itfor some time, for instance until the exchange hardware has arrived the node is indicatedasoffline for maintenanceinstead ofcritical – host unreachable. In Big Brother thisled to the effect, that the overview website of the CLiC was very colourful, becauseBig Brother indicates the states of an object in several colours like green, yellow, red,purple, etc. but the sorting criterion was always the name of a monitored object andso the really interesting states were mixed with other ones and that was not usefulto quickly find out what was wrong. A possibility to group and filter the informationwould simplify the work with the monitoring system in the way that it should be able tosort for example the most urgent events at the top of a table followed by the remainingevents in ascending order.
Although the use of an extra network for management and monitoring reasons is agood idea, because it reduces the impact on the productive network connection, it hasto be paid attention to the fact that the monitoring of the reachability of a system overthe management network does not proof the reachability of it through the productivenetwork. So additional tests have to be made, like the approach that was used at theCLiC: a node that has currently no work to do is temporarily converted into a monitor-ing assistant by using it for connectivity tests over the productive network.
Another possibility to improve the quality of the event messages is to introduce aseparate rating system that handles the administrator’s feedback regarding an eventmessage with the goal to reduce the handling of unimportant or uninteresting messagesfor the administrator. Because the monitoring system cannot find this out for itself,it requires the administrator’s feedback. This approach is very interesting, becauseit relieves the administrator from wasting time making changes in the configuration
28 Stefan Worm
3.3. Summary
files that may not be very intuitive, every time some little change has to be made.But the problem is, that it is not trivial to set up a system that is able to appraise theadministrator’s feedback to transform it into a format which is capable to be executedby the monitoring system.
The monitoring must be easily configurable, as seen at the CLiC system, a too com-plicated system is not suitable for the continuous change of the configuration that hasto be performed at a system of this size.
Also observed at the CLiC was the effect, that a self-developed monitoring expansionmodule that performed several specific tests in a row could not be supervised regardingwhat it is doing at the moment and in which state it is in. In addition to that it checkedtoo many objects too often, for example the CLiC system had trouble with the outageof the disks, the reason for this may have been the execution of extensive bad block testof the hard disks.
3.3 Summary
In this chapter, the Chemnitz High-Performance Linux Cluster (CHiC) and its prede-cessor the Chemnitz Linux Cluster (CLiC) were presented. Regarding those systems,information of the construction and of the purpose of the systems were given (refer toSection3.1on page23).
Furthermore, experiences made at the CLiC system were discussed and it is consid-ered how the operation of the CHiC could be improved based on these information. Forthis, advantages and disadvantages from the operation of the CLiC were analysed andrecommendations were derived from this as well as from the conclusions of a genericmonitoring approach (refer to Section2.2on page9).
Stefan Worm 29

4 Evaluation of MonitoringApproaches
In this chapter the monitoring software that was chosen for the CHiC shall be consid-ered as well as the reasons that led to this decision. Furthermore, a short descriptionand comparison of other monitoring applications that could have been used also for theCHiC shall be given.
Based on this, a monitoring script is presented that adds new functionality, to themonitoring application. Further on, it was paid attention to the fact that this new pieceof software fits into the desired monitoring strategy and infrastructure.
4.1 Selection of a Monitoring Application
In the area of monitoring software a lot of different applications are established. Theyall have different features, depending on what kind of monitoring they are focused on(refer to Section1.2on page4and Section2.1on page7). There are products, that focuson the network which means that they can easily monitor the network infrastructure,e.g., switches, routers, etc., and they usually have a good SNMP support. Another kindof software is explicitly made for performing a specific task, for example monitoring acomputer cluster or very specific hardware or software components.
There are also products that have a general focus on a possibly wide availabilityfor example in heterogeneous environments for Unix, Linux, Windows, Mac OS, etc.,as well as a support for very different platforms such as standard computers with IA-32/IA-64 or PowerPC (PPC), proprietary hardware or software (storage systems, accesscontrol systems, air conditioning, embedded devices, micro-controllers and so on). Fur-ther on, they all have different strengths and weaknesses in several areas, for examplein maintenance, alerting mechanisms, use formission criticalinfrastructure, etc. Andfinally a differentiation regarding proprietary software, freeware and open source soft-ware could be made.
During the course of this chapter, proprietary software products such as the moni-toring components of large suites like HP OpenView1 (NNM2) and IBM Tivoli3 (Net-View4) are not considered further. The advantages of this kind of software which are
1OpenView Monitoring:http://openview.hp.com/solutions/nsm/2Network Node Manager:http://openview.hp.com/products/nnm/3Tivoli Monitoring: http://www.ibm.com/software/tivoli/products/monitor/4NetView: http://www.ibm.com/software/tivoli/products/netview/
Stefan Worm 31
Chapter 4. Evaluation of Monitoring Approaches
primarily a rich function set and a seamless integration in the existing workflow or in-frastructure of an institution do not compensate the disadvantages of them regarding theuse for the CHiC. These disadvantages are first of all a high complexity of the wholesystem that results in expensive customising and a comparatively deep know-how thatis necessary for operation and the development of special extensions, as well as thehigh purchase price and partially obligatory vendor support.
The further considerations shall be restricted on free software that is widely usedfor monitoring tasks, and in addition to that software that is used at the CLiC andthe university’s computing centre. The following section gives a short overview aboutsoftware that could be suitable for the CHiC, regarding an as far as possible genericapproach that allows the easy integration of all the monitoring objects into one solutionwithout having multiple applications for similar tasks side by side.
If not mentioned otherwise, only a short introduction and significant advantages ordisadvantages are given for every software to clarify the reasons that led to the decisionfor one or another monitoring software for the CHiC. The selection of the softwarecan be made regardless of existing applications at the university’s computing centreand CLiC, which are Big Brother 2003, Nagios 2.6 and Network Node Manager ofHP OpenView 6.2, because the CHiC is a self-contained system which is going to bearranged preferably independent from other systems.
Big Brother The monitoring software Big Brother5 was used for the CLiC systemand it is still in use for monitoring the infrastructure of the university’s computingcentre. The software is not state of the art any longer. Some design aspects, likethe way of using shell scripts means a lot of maintenance work [Sel00]. For moreaspects regarding the use of Big Brother refer to Section3.2on page24.
Another aspect that keeps this software from being deployed at the CHiC is theambiguous licence situation of it for non-commercial users and that there is noongoing development. Still, this software was analysed because it would havebeen a good idea to use software that is already used in the institution but becauseof its disadvantages and that there is no need to use the same software as thecomputing centre as described above, the application was discarded at an earlystage of the evaluation of monitoring software.
Big Sister A very close alternative would have been Big Sister6. It is still being devel-oped, open source and compatible to Big Brother [CWSC01], but it also meansthat the weaknesses of the design, for example the inability to efficiently paral-lelise the checks, are included too. In addition to that, the existence of only a fewplugins and the small dissemination of it in combination with a comparativelysmall community, led to the decision to discard Big Sister for further analysis atthis point.
5http://www.bb4.org/6http://www.bigsister.ch/
32 Stefan Worm
4.1. Selection of a Monitoring Application
OpenNMS The open source network management system OpenNMS7 is an applica-tion that has its main focus on the management of networks, which can be seen atthe excellent SNMP support. The first impression of this program is quite good,but there are some disadvantages [O’D02, Bal05]. It is the most complex soft-ware of the ones presented here, the design is based on Java and XML which isamong other reasons causal for the difficulties to get the system running. Remoteand passive monitoring capabilities are relatively new features, and in addition tothat, the possibility for an easy use of plugins for one’s specific needs is based onthe Nagios plugin infrastructure.
To sum up, OpenNMS is a very powerful program for managing and monitoringa network of components, if supporting SNMP. The use of additional softwarethat can monitor specific values is only supported by an indirection via Nagiosplugins. After all, OpenNMS will not be analysed further regarding a possibleuse at the CHiC.
Ganglia An application that has been explicitly developed for the use in cluster com-puters is Ganglia8. The software architecture consists of a daemon which is in-stalled on each computer that shall be monitored. The daemon gains the desiredinformation and sends status reports to another daemon on a server which collectsand stores the information gained by the client daemons.
The application has some very good features, for example a very lightweight dataexchange protocol between the daemons [SKMC03] and an easy installation andconfiguration. But there are some disadvantages, for instance the documentationis very short. A resulting problem from this is, that neither there nor in otherdocumentations9 for Ganglia an option for a notification of the administrator incase of a problem can be found – alas this is an important component for anintegrated monitoring system with real-time monitoring (refer to Section2.1 onpage7). Another disadvantage is that there is no possibility for modelling theinfrastructure in-depth and therefore also no option for modelling dependenciesbetween the components. There is an automatic discovery feature that is quitefunctional, but it has one vital handicap – it does not recognise computers thatare already down right from the beginning because it has no information aboutthe infrastructure in advance as mentioned above.
Another aspect which is a two-edged sword is the procedure that every monitor-ing client briefs its current state via multicast in the network at default settings.On the one hand, this has the advantage that the status of the whole network canbe seen at every node and not just on the monitoring server. On the other hand,this behaviour only scale up to a certain limit of cluster nodes – as the developersof Ganglia confess themselves (refer to [MCC04]). Furthermore, for a clustercomputer environment this feature is definitely not necessary.
7http://www.opennms.org/8http://ganglia.sourceforge.net/9http://www.ibm.com/collaboration/wiki/display/WikiPtype/ganglia
Stefan Worm 33

Chapter 4. Evaluation of Monitoring Approaches
Although the application was among the last choices, not only because of its wideuse in other clusters all over the world, it was not chosen for the CHiC becauseof the disadvantages mentioned above.
Nagios The software Nagios10 is basically just a framework which have to be ex-tended by various kinds of features, plugins and extensions, to set up a solutionthat fits one’s needs best. It is the last one that should be mentioned here and toanticipate the decision, it is the one that was chosen for the use at the CHiC. Itis an application that also has some negative aspects, for example a somewhathigher network load compared to other software and the design issue that it startsa single process for every task that it has to accomplish, leading to a higher loadon the monitoring server. Nevertheless, it is the one that showed the most solidperformance in various important disciplines.
First of all, the Nagios open source software is only a monitoring frameworkwhich is delivered with various extensions that makes it a very generic appli-cation that can monitor notionally everything. For example the Nagios RemotePlugins Executor (NRPE) add-on allows, the execution of software on a remotemachine and beyond network boarders. In addition to that the Nagios ServiceCheck Acceptor (NSCA) add-on allows passive checks that work in a trap-basedstyle. On top of that the flexibility that comes with the plugin concept makesNagios capable of monitoring network devices with and without SNMP, as wellas standard computer clients and special hardware and software. For standardrequirements, plugins are included, for everything else, the large and active com-munity provides a lot of additional plugins that fulfil most needs. In the end, be-cause of the open plugin application programming interface (API) and the goodand comprehensive documentation [Gal06] it is possible to add necessary func-tionality.
Furthermore, compared to other software the notification and alerting functional-ity is very good as well as the graphical report and visualisation functions whichare feasible for a basic recognition of trends and the historical performance of anentity – it can be even improved by additional tools such as Multi Router TrafficGrapher (MRTG).
Facts about Nagios that are important for this work are given above, a further ex-tensive introduction of the detailed functioning, features, installation, etc. shallbe refrained from at this point – for this refer to [Gal06], [Fri02] and [Har03].Moreover, a general, only matter-of-fact comparison of Ganglia, Nagios and var-ious other applications that does not contain a rating of the software, but whichcompares only specific aspects and features, can be found in [GWB+04].
The monitoring applications shown above are only a selection from plenty of soft-ware that is similar to those, but which was not examined in-depth, for various reasons.For example they are not developed further, the software is a one-man project only,
10http://www.nagios.org/
34 Stefan Worm
4.1. Selection of a Monitoring Application
the latest release is too old, there is no community for it, important functions are miss-ing, the information on the website appears outdated, respectively a documentationis missing. In alphabetic order these are: Angel Network Monitoring11, CluMon12,GroundWork13, Lemon14, Midas15, Mon16, Munin17, Performance Co-Pilot18, PIKT19,Spong20, Supermon21 and Zenoss22.
At the end and as glanced at quickly above, Nagios was chosen for the CHiC basedon the selection of various monitoring applications and the considerations that weremade regarding them. Due to its powerful framework design the implementation ofvarious functions that extend the basic monitoring abilities can be carried out easily.Which kinds of specialised plugins and functions could be realised, will be discussednext.
One feature of a monitoring application that has to be paid attention to, are the abil-ities for historical monitoring(refer to Section2.1 on page8). Also known as trendor performance monitoring this function could be necessary to watch thetrend of thesystem’s capacity utilisation – usually this is done to detect bottlenecks in advance andto gain information for the expansion of a system. For the CHiC, no upgrades areplanned and a capacity overload will be prevented with the help of a batch system.Thus, regarding this topic, an extensive monitoring of the system to gain those datais not mandatory. For example, information regarding the system’s usage can also begained via the load of the batch system or indirectly via the analysis of anyway avail-ablereal-time monitoring data(refer to Section2.1on page7) – an active and becauseof its nature performance reducing monitoring, only because of this, would be a wasteof resources.
Another reason for historical monitoring, the accounting of the system’s usage, isnot the main focus at the CHiC, because at the first expansion stage only researchinside the university shall be performed. If the CHiC should some day be included intoa grid infrastructure, monitoring because of accounting reasons does not have to bedone at the stage of the system’s monitoring software, because for example the GlobusToolkit since version 4.0 does contain the SweGrid Accounting System (SGAS) whichis responsible for this.
Furthermore, at a late stage of expansion the system could be extended to support theusers in analysing the possibly good performance of their applications. For the supportand also for the training of the users, information, regarding the enhancement of their
11http://www.paganini.net/index.cgi/angel/12http://clumon.ncsa.uiuc.edu/13http://groundworkopensource.com/14http://lemon.web.cern.ch/15http://midas-nms.sourceforge.net/16http://www.kernel.org/software/mon/17http://munin.projects.linpro.no/18http://oss.sgi.com/projects/pcp/19http://pikt.org/20http://spong.sourceforge.net/21http://supermon.sourceforge.net/22http://www.zenoss.com/
Stefan Worm 35

Chapter 4. Evaluation of Monitoring Approaches
programs that run on the cluster, for example data regarding the cache misses and thetime that was spent with waiting, could be gained by additional monitoring modules.Although, this is a very useful feature, it is not the primary concern of the monitoring ofthe cluster. If this option is required, specialised tools (e.g. Paradyn23) that are usuallystarted via the batch system can be used for this, but these are not the main focus of ageneric monitoring system.
Nevertheless, additional monitoring time and effort can be spent during times whena cluster node is idle. In combination with the batch system that knows about thesesituations, some tests could be performed. For example at the CLiC system, hard drivechecks were performed, but they are not necessary at the CHiC, because the computenodes are diskless ones. A useful check on an idle computer could be the test of thesystem’s memory as well as for example the check of the behaviour of specific compo-nents. This could be for instance the throughput of the network connections, primarilythe InfiniBand (refer to Section4.3on page38) but also the Gigabit Ethernet manage-ment connection is conceivable. If there are a minimum of two idle nodes, fitness testsof involved network hardware could be made which means that the speed and the errorrate could be measured. First of all, physical damages from the installation and thosethat could arise from the maintenance can be discovered, as well as the slow deteriora-tion of performance caused for example by the ageing of the components which couldbe discovered by the analysis of the monitoring data over time.
Finally, a main goal of the efforts regarding monitoring is the creation of a powerfulsystem with which the users can solve their problems as good as possible. This canbe done by making and keeping the system as fast as possible, which does work onlyif everything is in good condition – this is the issue of the monitoring system. Theworst performance, a single component can have, is if it does not work at all, so thedowntime of it must be as short as possible as well as the downtime of the wholecluster, if a major incident has happened. Although, this is not very comfortable, theconsequences are not as significant as on a high-availability system, for example in acommercial environment. Nevertheless, the downtime of for example the whole clustershould be minimised, because the depreciation of it is distinctive and can be calculatedas follows.
The pure purchase price of the cluster was2, 640, 000 Euro. If an operation periodof 5 years is assumed,
2, 640, 000 Euro
5 years · 365 days · 24 hours≈ 60 Euro/hour
in terms of figures one hour mathematically costs about60 Euro. In addition to that,also singular costs for the reconstruction of the room (≈ 1, 800, 000 Euro), runningexpenses for the maintenance staff (one administrator for one year:≈ 45, 000Euro),electricity24 (maximum power consumption:≈ 200 kW ) and air conditioning (addi-tional200 kW ) have to be considered,
23http://www.paradyn.org/24energy price: roughly estimated 0.10 Euro/kWh
36 Stefan Worm
4.2. Nagios and the Plugin Topology
1, 800, 000 Euro
5y · 365d · 24h+
45, 000 Euro
365d · 24h+ 2 · 200 kW · 0.10 Euro/kWh
≈ 41.10 Euro/hour + 5.14 Euro/hour + 40.00 Euro/hour ≈ 86 Euro/hour
so that the additional costs are about86 Euro/hour.Thus, the total expenses are60 Euro/hour + 86 Euro/hour = 146 Euro/hour.
That means in total, every day, the cluster cannot be used for scientific calculations,costs in terms of figures146 Euro/h · 24 h = 3504 Euro/day25, so that the outage ofthe whole cluster or just a few nodes should be as short as possible with the help of theappropriate monitoring strategy.
4.2 Nagios and the Plugin Topology
As the monitoring platform for the cluster, Nagios was chosen (refer to Section4.1onpage34), hence a short introduction into the topology of Nagios 2.6 shall be given foran easier understanding of the decisions regarding the developed software.
The simplest way of monitoring is, if the monitoring server actively checks the mon-itoring client directly via a network connection – for this, the server sends a requestmessage to the client which sends an answer and finally the server processes the answer.Hereupon the server performs an adequate reaction to it which can be also caused bya missing answer, depending on the configuration of the monitoring application (referto Section2.5 on page19). With this approach of monitoring, for example, it can bechecked if the client is up (check_ping) or if a certain service is working (check_ssh,check_mail, etc.). The advantage is that nothing at the configuration of the client has tobe changed and if the administrator is interested only in monitoring values that can begained via the network, the setup of such an approach can be performed very easily.
If the requirements regarding what has to be known about a client are more demand-ing, for example the CPU temperature or the system’s load, the approach from abovehas to be expanded. For this, on the specific client that has to be monitored, an addi-tional service has to be set up which can gain the necessary information. It works inthe way that on the monitored computer the Nagios Remote Plugins Executor (NRPE)is installed, which is responsible for the communication with the monitoring serversimilar to the description above as well as for gaining the information by executingplugins (check_temperature, check_load). Hence, the NRPE add-on, that was testedand utilised in version 2.5.2, works as an agent in between the request of the monitor-ing server and the location from where the monitoring information is required. Becauseit is possible for NRPE to execute any kind of plugin, even another NRPE instance, thissoftware can be used not only as a local, but also as a remote gateway which can be evenmulti-level. It means, in a situation where a device that should be monitored could notbe accessed directly by the monitoring server, for example because the client is in thescope of another network, NRPE could be used as gateway if it is installed on a com-puter that is accessible from both networks, so that the monitoring server can check the
253504 Euro are around $4555 (1 Euro≈ 1.30 USD, Jan. 2007)
Stefan Worm 37

Chapter 4. Evaluation of Monitoring Approaches
clients health status by performing acheck_pingcommand via NRPE. The monitor-ing server would send a request for executing a check, if a specific computer is alive,to the computer, on which the NRPE service is running, that executes thecheck_pingcommand by proxy for the monitoring server and sends the result back to it.
The third main possibility of the server for gaining monitoring information is to“perform” passive checks. It means, the server is configured in the way that it is waitingfor a status report from a specific device or for a specific value instead of initiating anactive check itself. If the information of a passive check, which is also called a trap,reaches the server it is processed like a response to an active check. Depending onthe server’s configuration, the absence of a message within a specific period of timeeither means for the server that everything is alright or that it is not. For Nagios, theadd-on NSCA (Nagios Service Check Acceptor) exists which runs as a daemon onthe monitoring server. It receives the incoming passive values and passes them on tothe core of the Nagios application which further processes them. In order that no onecan send possibly faked information to the server, the connection between the NSCAdaemon and the NSCA client can be weakly (XOR) or strongly encrypted (e.g. DES,TDES, AES, Twofish, Serpent) – because of the additional load that every encryptiongenerates it should be carefully considered which level of security is necessary in aspecific situation. Sending monitoring status information to the server in the Nagioscontext means to pass the information in a specified format to thesend_nsca clienton the computer that is monitored which delivers them to the NSCA daemon on themonitoring server. During this work, version 2.6 of NSCA was tested and utilised.
Last but not least a few words regarding the configuration of Nagios – some examplescan be seen in AppendixB on page73. The text-based files are self-explaining as faras possible, the configuration of the hosts and services is straightforward, but someattention has to be paid to the definition of the check commands, depending on theintention to use a check command directly or via NRPE a different argument passinghas to be considered (refer to SectionB.2and SectionB.3on page76). Furthermore, forthe passive monitoring with NSCA it is crucial that the value names that are passed onto Nagios are the same as the service names for what Nagios is expecting information,otherwise Nagios will reject them without notice. Because of the missing responseregarding the nature of the design it is hard to detect misbehaviours concerning thismatter.
4.3 The InfiniBand Interconnection Network
Due to the usage of InfiniBand at the CHiC system and that an enhancement of itsmonitoring approach is presented in Section4.4.1on page40 which is based on thistechnology, some basic information about InfiniBand are given below.
38 Stefan Worm
4.3. The InfiniBand Interconnection Network
4.3.1 Introduction to Design and Features
As the main interconnection network the InfiniBand Architecture (IBA) is used. Al-though, it was developed as a point-to-point bidirectional high-speed interconnect forinter-server and server-I/O communication in standard computing centres, in the ma-jority of cases it is nowadays used in High-Performance Computing (HPC) systems.
The design goal of the InfiniBand Trade Association26 (IBTA) was a system thatoffers a possibly high “reliability, availability, performance, and scalability necessaryfor present and future server systems” [Pfi01]. The result was a standard [Inf04] thatsupports symmetric full-duplex connection from 2.5 Gb/s gross (single data rate). Verycommon in InfiniBand installations is a 4x 2.5 Gb/s = 10 Gb/s raw bandwidth connec-tion which results in a usable data rate of a maximum of 8 Gb/s.
Important features of InfiniBand are Remote Direct Memory Access (RDMA), mes-sage send/receive within the user space and the support of standard bus systems likePCI-X or PCIe [Hoe05, CWP03]. The main reason for the use at the CHiC was thecomparably low price regarding the provided bandwidth and latency.
4.3.2 Constitution of the Port Counters
The InfiniBand network interface, that is called Host Channel Adapter (HCA), offersa set of values that can be monitored. In general they are calledport countersbutdepending on the characteristic that should be accentuated it can also be referred tothem asperformance counters, health countersor error counters.
A selection of the most interesting port counters that are also important for the spe-cific monitoring of the HCA regarding the InfiniBand standard [Inf04] are presented inTable4.1on the following page. They are collected separately for every single port, ofwhich a Host Channel Adapter can have multiple ones.
In addition to the counters in Table4.1on the next page, the InfiniBand HCA also of-fers the values PortXmitData (transmitted data in byte), PortRcvData (received data inbyte), PortXmitPkts (transmitted packets) and PortRcvPkts (received packets), but be-cause of the limited benefit for monitoring the system’s health, they are not consideredfurther.
The knowledge of the significance of each counter is based on the experiences withthe network, therefore no generally valid statements of the importance of each valuecan be made. So, the detailed setting of threshold values and the appropriate reactionof the monitoring system on their exceeding must be customised during the operationof the system. Hence, no preferred differentiations will be made at this point regardingthe attention to each counter.
26http://www.infinibandta.org/
Stefan Worm 39
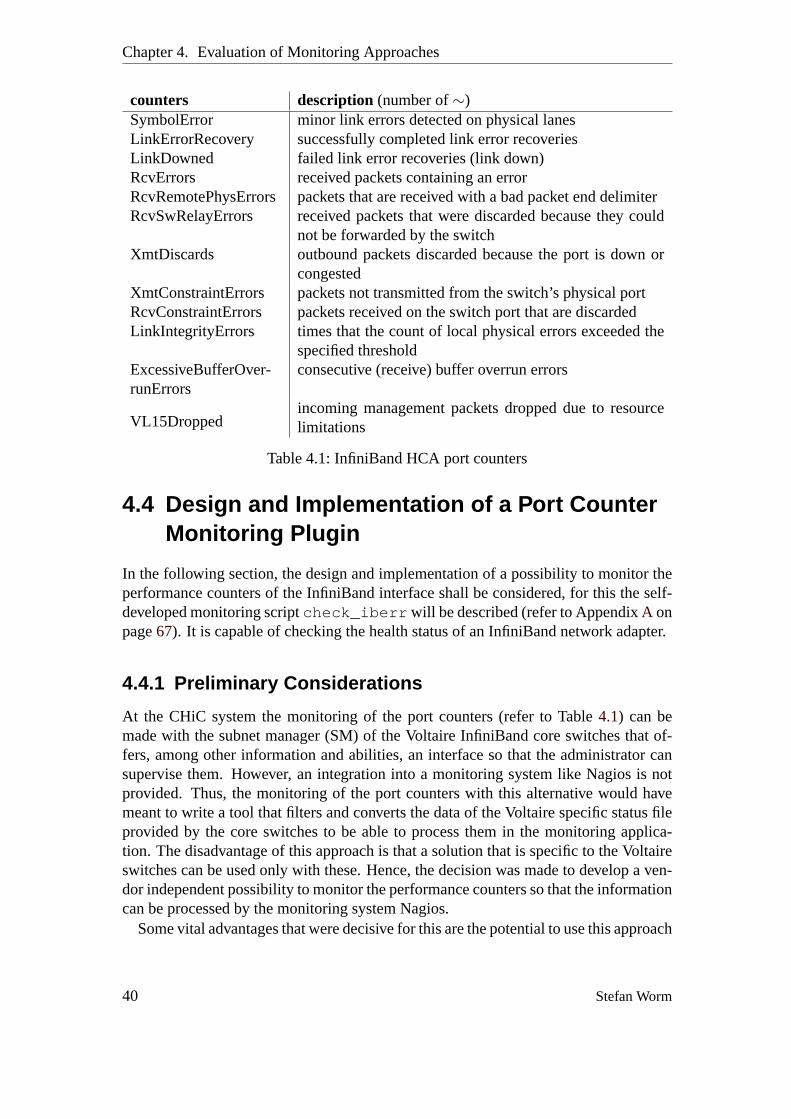
Chapter 4. Evaluation of Monitoring Approaches
counters description (number of∼)SymbolError minor link errors detected on physical lanesLinkErrorRecovery successfully completed link error recoveriesLinkDowned failed link error recoveries (link down)RcvErrors received packets containing an errorRcvRemotePhysErrors packets that are received with a bad packet end delimiterRcvSwRelayErrors received packets that were discarded because they could
not be forwarded by the switchXmtDiscards outbound packets discarded because the port is down or
congestedXmtConstraintErrors packets not transmitted from the switch’s physical portRcvConstraintErrors packets received on the switch port that are discardedLinkIntegrityErrors times that the count of local physical errors exceeded the
specified thresholdExcessiveBufferOver-runErrors
consecutive (receive) buffer overrun errors
VL15Droppedincoming management packets dropped due to resourcelimitations
Table 4.1:InfiniBand HCA port counters
4.4 Design and Implementation of a Port CounterMonitoring Plugin
In the following section, the design and implementation of a possibility to monitor theperformance counters of the InfiniBand interface shall be considered, for this the self-developed monitoring scriptcheck_iberr will be described (refer to AppendixA onpage67). It is capable of checking the health status of an InfiniBand network adapter.
4.4.1 Preliminary Considerations
At the CHiC system the monitoring of the port counters (refer to Table4.1) can bemade with the subnet manager (SM) of the Voltaire InfiniBand core switches that of-fers, among other information and abilities, an interface so that the administrator cansupervise them. However, an integration into a monitoring system like Nagios is notprovided. Thus, the monitoring of the port counters with this alternative would havemeant to write a tool that filters and converts the data of the Voltaire specific status fileprovided by the core switches to be able to process them in the monitoring applica-tion. The disadvantage of this approach is that a solution that is specific to the Voltaireswitches can be used only with these. Hence, the decision was made to develop a ven-dor independent possibility to monitor the performance counters so that the informationcan be processed by the monitoring system Nagios.
Some vital advantages that were decisive for this are the potential to use this approach
40 Stefan Worm

4.4. Design and Implementation of a Port Counter Monitoring Plugin
also in environments with mixed vendors and in situations where multiple isolated In-finiBand network scopes have to be monitored. Furthermore, the use of the locallyexecuted version of the plugin via NRPE (see below) allows to monitor the port coun-ters of the InfiniBand network interface and, in spite of a malfunction of the InfiniBandnetwork, troubleshooting can be made with the help of another network connection. Atthe CHiC system this is a Gigabit Ethernet connection that can be used in this case toperform analyses of the InfiniBand state despite its outage.
Furthermore, the reason for developing thecheck_iberr script was the interestin the health status of the network connections. The knowledge about the detailed stateof a network connection can be an important information in several fields. For exampleit can be useful for error diagnostics or the verification if everything is alright with thenetwork, so that as reason for a possible misbehaviour of some software the networkconnection can be excluded. This knowledge is also important for finding the reasonsfor performance issues, as well as for isolating the possible reason for a problem withthe network. Among others also for the identification of possibly abnormal behaviourof the network regarding specific issues that can be seen only in the temporal trend,e.g., abnormal behaviour of a component that was caused by occasional errors at thenetwork interface.
Thecheck_iberr plugin was written in the programming language Perl, becauseif necessary Nagios can be used with an integrated Perl interpreter that has a betterperformance than the standard Perl interpreter that otherwise would have to be executedevery time for the accomplishment of each script. Furthermore, Perl is the preferredscript language for plugins by the Nagios community27, shown by the fact that a lotof them are written in Perl and that tutorials and libraries exists for this programminglanguage. Plugins can also be written in other script languages, as far as their executionis possible on the Nagios server or on the device that is monitored if NRPE is used.
Nevertheless, binary programs can also be used as a plugin for Nagios. Actually,the difference that makes an ordinary script or binary program a Nagios plugin is justthe way how it expresses its return codes and values. Basically, Nagios expects returncodes that stand for the status types (0 = “OK”, 1 = “WARNING”, 2 = “CRITICAL ”,3 = “U NKNOWN”) and optional some textual information that describe the status codescloser, as well as additional information that are stored for generating detailed reports,e.g., for historical monitoring (refer to2.1 on page8). If some program provides thedesired monitoring information but it does return them in another format, a Nagiosplugin would consist only of a wrapper that converts them as needed.
The name of the scriptcheck_iberr comes from the different names that expressthe characteristics of the InfiniBand port counters (refer to Section4.3.2on page39).The names of the plugins in Nagios regardless if they are scripts or binaries are usuallycomposed ofcheck + underscore+ NAME, whereas the NAME typically describeswhat exactly the plugin is doing. In this case, the namecheck_iberr describes thata Nagios plugin that checks the InfiniBand (IB) error counters, the ending.pl to markit as a Perl script can be optionally added.
27http://www.nagiosexchange.org/
Stefan Worm 41

Chapter 4. Evaluation of Monitoring Approaches
4.4.2 The check_iberr Script
The realisation of the port status monitoringcheck_iberr plugin for Nagios is basedon the OpenFabrics Enterprise Distribution (OFED) in version 1.1 of the OpenFabricsAlliance28, therefore this software collection has to be available on the systems thatshall be monitored. The plugin has to be executed with additional rights29 due to thedependency on information that can be gained only with extended rights. Apart fromthe installation of the NSCA client on the computer that runs the plugin, no other pre-conditions are necessary30.
First, only the essential parameters shall be considered. The execution of./check_iberr.pl -H name is the most basic variant. Whereas, the parameter-H is theonly one that is mandatory, which expects thenameof the computer that is monitored.It has to be the exact name of the computer as it was defined in the Nagios configuration,so that the monitoring server can correctly associate the results to it (refer to Section4.2on page38). All other parameters are optional, respectively they have default values,so that they not have to be specified until they are needed. Anyhow, the parameter-Gfor the global unique identifier (GUID) of the port or-l for the local identifier (LID)of the monitored InfiniBand interface is usually specified, as well as the parameter-mfor the name of the Nagios monitoring server. The GUID of an InfiniBand networkport is comparable with the MAC address of an Ethernet network port, whereas theInfiniBand LID, which is a kind of a dynamic identifier that is only valid inside aspecific network scope, does not have a straight counterpart at an Ethernet network, butthe LID is soonest comparable with a private IP address. More script parameters likefor the output of debug messages, the specification of paths for the OFED or NSCAdirectory, etc. can be discovered with the-h help option (also refer to AppendixA onpage67).
The application works as follows. It expects the GUID or LID of the InfiniBand portthat should be monitored, otherwiselocalhostis assumed. If a GUID or the optionlo-calhostis given, the corresponding LID is looked up with theibaddr program from theOFED software collection. The next step is to perform the check of the port counters(refer to Table4.1on page40) with the help of the LID. For this, theibcheckerrsscriptthat is also part of the OFED software collection is used. After this, its response isprocessed and the results are sent out to the monitoring server with thesend_nscapro-gram. The standard option is to send out only the values that exceed the correspondingthresholds, but optionally also the status of all port counters can be sent out (-u updateoption). If desired, the counters of the InfiniBand port are reseted (-r reset option) af-terwards. The last activity of the plugin is to choose its appropriate return value, whichis either “OK” (non of the port counters exceed a threshold value), “WARNING” (one or
28http://www.openfabrics.org/29The execution of an application with root permissions is a known security concern, that is why the
limitation of the rights is advisable. This can be done among other possibilities viasudo, setuidorSELinux.
30For detailed instructions of the installation of the script and the necessary configurations on the mon-itoring server, as well as on the computer that executes the script, refer to the documentation that isincluded in the plugin.
42 Stefan Worm

4.4. Design and Implementation of a Port Counter Monitoring Plugin
more values exceeded a threshold), “CRITICAL ” (the exceeding of minimum one valueis higher than defined with the-c factor option) or “UNKNOWN” (something un-expected has happened or an error occurred during execution, e.g., a wrong LID orGUID was given). In addition to that, applicable extra information regarding the returnvalues are printed out for further processing in Nagios.
For a detailed insight how thecheck_iberr plugin works, refer to the source codein AppendixA on page67.
As it can be seen from the explanation above, there are two ways in which thecheck_iberr plugin can be used for monitoring the port counters of an InfiniBandHCA. The first is that it reads only the port counters of the host on which it is executed.This is the alternative for the use of the plugin via the Nagios Remote Plugins Executor(NRPE) as described in Section4.2on page37, it is recommended if the port countersshall be checked without using the InfiniBand network. The second alternative is, start-ing from one computer, to check the port counters of different hosts via the InfiniBandnetwork. If it has to be assured that the check of the counters is performed locally only,the plugin has to be executed neither with the GUID (-G) nor with the LID (-l ) optionso that the default valuelocalhost is assumed. Otherwise, using either the GUID orLID port identifier, it is automatically detected if the counters for the given identifiercan be checked locally, because it belongs to the local InfiniBand interface from whichthe information can be obtained. If the detection shows that the port counters have tobe obtained remotely via the InfiniBand network connection, they are requested fromthe remote host corresponding to the given identifier (GUID or LID). The differencesof the two alternatives of checking the port counter information locally or remotely,regarding the impact on the network performance, as well as on the host’s computingperformance are discussed in Section5.2on page47and Section5.3on page54.
Compared to the standard approach of Nagios for gaining monitoring information,the use of the Nagios Service Check Acceptor (NSCA) add-on has several advantages.
The general procedure of checking a value with Nagios plugins is, that the monitor-ing server requests the check of a specific value regarding its internal schedule and thata plugin is executed thereupon. This plugin checks, regardless if it is executed locallyor remotely, usually one value and returns the result as mentioned above to the moni-toring server. If there are multiple values to check, one plugin each has to be executed.This approach is advisable if all values are different, because different plugins have tobe used for this anyway. Unlike the port counters (refer to Table4.1on page40) of theInfiniBand network interface which can be checked all in the same way.
The execution of one plugin for every value that has to be checked would mean asignificant expense. Therefore, the monitoring of the InfiniBand port status shall beperformed in a more efficient way. Thus, the approach was chosen to use NSCA (referto Section4.2 on page38) to reduce the plugin’s communication and execution effortfor gaining the monitoring information. The advantage of it is, that only the valuesthat exceed a predefined threshold are reported to the monitoring server. However, ifa specific value is alright for a long time, no reports are sent to the monitoring server,which hereupon cannot be sure if the absence of reports is due to an alright status ofa value or because a problem has occurred in the monitoring workflow. To face this
Stefan Worm 43

Chapter 4. Evaluation of Monitoring Approaches
issue, thecheck_iberr script has the update option (-u ) that reports the status ofall values of a specific InfiniBand port to the monitoring system.
Finally, thecheck_iberr plugin that was presented above is able to monitor theInfiniBand port counters in different efficient ways. However, there are a few minorthings that could be done to improve it further. One thing is to refine the usability ofthe script. For example, to use the-G and-l option for passing a GUID and a LID atthe same time does not make sense. Either both identifiers refer to the same port, thanthey do not both have to be passed on, or they refer to different ports and the script hasto opt for one, which would not be conformable with a consistent program behaviourand shall be avoided. Hence, a possible usability improvement is if the script wouldoffer only one option for passing an identifier and be able to detect whether it is a GUIDor LID.
Another thing that could be improved in thecheck_iberr plugin is its robustnessof the program flow against unexpected behaviour of external, depending programs andfunctions. But all these are minor topics which do not effect the general functionalityof the script if installed and used as documented. However, those improvements are notcrucial, and have to be put off until a later development version due to time restrictionsfor this work.
4.5 Summary
In this chapter, considerations regarding a monitoring approach for the CHiC weremade.
First, starting from a plenty of different monitoring software that exists, the numberof applications to be considered further was limited to a subset of them that could beused for the CHiC. According to this, several products were excluded because they didnot fit minimum requirements, so that the software Big Brother, Big Sister, OpenNMS,Ganglia and Nagios were chosen for a more detailed comparison (refer to Section4.1on page32). Based on this, the Nagios monitoring framework was chosen as the onethat fits best for the monitoring of the CHiC system.
Furthermore, several aspects and requirements were considered that are relevant forthe monitoring of the cluster, for example the need for minimising the outage of thesystem. Calculations regarding this showed that every day which the cluster cannot beused as planned the amount of around 3500 Euro gets lost in terms of figures. Hence,this showed that it is important to minimise the time that the CHiC is out of service andthat it is crucial to monitor the system to face this issue.
With reference to the monitoring software Nagios that was suggested for the CHiC,an introduction was given to the application itself and the corresponding plugin topol-ogy which is important for the monitoring topics (refer to Section4.2 on page37).In addition to that, a short introduction to the InfiniBand interconnection network wasgiven, in particular to the port counters of the InfiniBand HCA (refer to Section4.3onpage38).
Finally, the design and implementation of thecheck_iberr monitoring plugin
44 Stefan Worm

4.5. Summary
that checks the health counters of an InfiniBand network interface was presented (referto Section4.4.2on page42). Thereby, the focus was on a solution that is as efficientas possible in checking the values so that the influence on the computation tasks of acomputer is preferably low.
Moreover, thecheck_iberr plugin was posted on the Nagios plugin developermailing list (nagiosplug-devel) whereupon it was challenged releasing the plugin on theofficial central repository31 for plugins, which is now the place where possible furtherimprovements will be released.
31http://www.nagiosexchange.org/
Stefan Worm 45

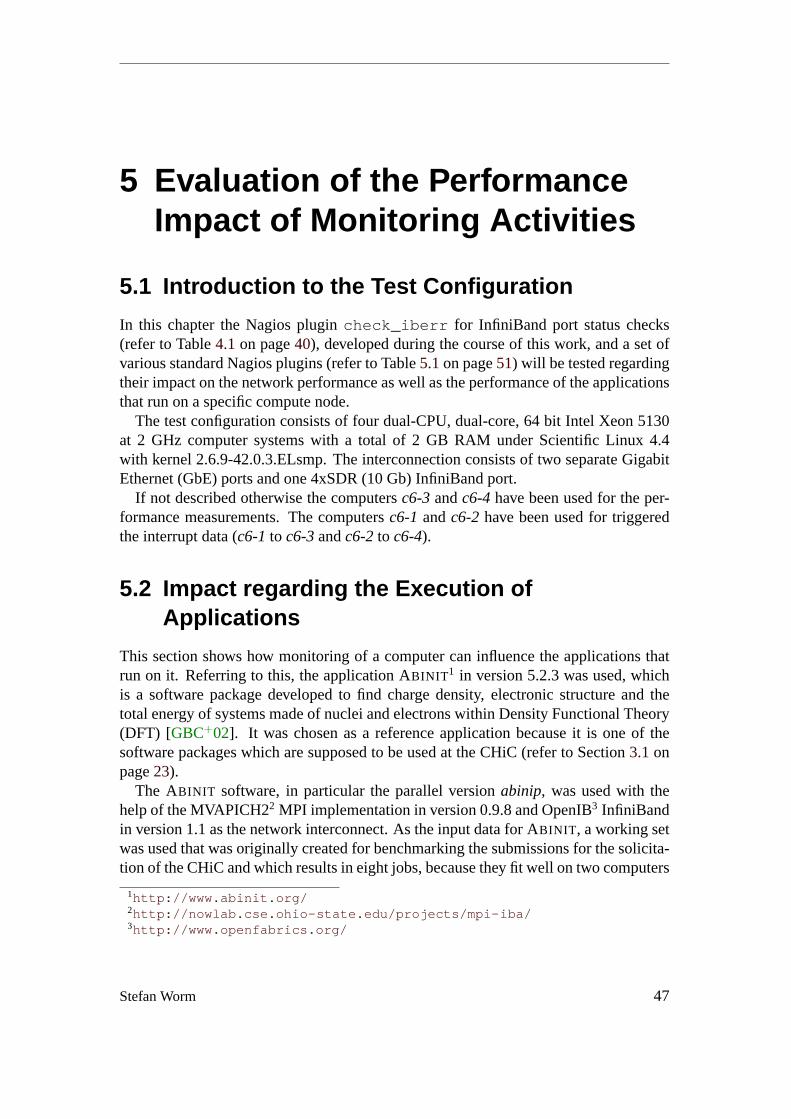
5 Evaluation of the PerformanceImpact of Monitoring Activities
5.1 Introduction to the Test Configuration
In this chapter the Nagios plugincheck_iberr for InfiniBand port status checks(refer to Table4.1on page40), developed during the course of this work, and a set ofvarious standard Nagios plugins (refer to Table5.1on page51) will be tested regardingtheir impact on the network performance as well as the performance of the applicationsthat run on a specific compute node.
The test configuration consists of four dual-CPU, dual-core, 64 bit Intel Xeon 5130at 2 GHz computer systems with a total of 2 GB RAM under Scientific Linux 4.4with kernel 2.6.9-42.0.3.ELsmp. The interconnection consists of two separate GigabitEthernet (GbE) ports and one 4xSDR (10 Gb) InfiniBand port.
If not described otherwise the computersc6-3andc6-4have been used for the per-formance measurements. The computersc6-1 andc6-2 have been used for triggeredthe interrupt data (c6-1to c6-3andc6-2to c6-4).
5.2 Impact regarding the Execution ofApplications
This section shows how monitoring of a computer can influence the applications thatrun on it. Referring to this, the application ABINIT 1 in version 5.2.3 was used, whichis a software package developed to find charge density, electronic structure and thetotal energy of systems made of nuclei and electrons within Density Functional Theory(DFT) [GBC+02]. It was chosen as a reference application because it is one of thesoftware packages which are supposed to be used at the CHiC (refer to Section3.1onpage23).
The ABINIT software, in particular the parallel versionabinip, was used with thehelp of the MVAPICH22 MPI implementation in version 0.9.8 and OpenIB3 InfiniBandin version 1.1 as the network interconnect. As the input data for ABINIT , a working setwas used that was originally created for benchmarking the submissions for the solicita-tion of the CHiC and which results in eight jobs, because they fit well on two computers
1http://www.abinit.org/2http://nowlab.cse.ohio-state.edu/projects/mpi-iba/3http://www.openfabrics.org/
Stefan Worm 47

Chapter 5. Evaluation of the Performance Impact of Monitoring Activities
with two CPUs and two cores each. Another issue for choosing this benchmark is theexecution time of approximately 90 seconds which is long enough to compensate mi-nor irregularities during the measurements and short enough for the test series to bemanageable regarding the large number of them that have to be executed for gainingthe measured values.
Moreover, ABINIT uses 100 percent of the CPU resources on all cores, so it is guar-anteed that the system is always on heavy load and that also minimum influences onthe system can be measured indirectly via the execution time of ABINIT .
5.2.1 Influence on Abinit due to Local and Remotecheck_iberr Script Execution
The influence on ABINIT caused by the execution of thecheck_iberr script as alocal script via the Nagios NRPE add-on, as well as the execution of the same script ona remote computer is presented in Figure5.1 on the facing page. Its intention was toclarify the significance of the slowdown of a typical application that runs on the clusterregarding a specific monitoring value and its monitoring interval. In addition to thatthe difference between two methods of gaining the same information was determined.The reason for this was to find out whether it is better to gain the performance countersfor the InfiniBand network connection on a specific host either directly via the sameInfiniBand network connection that is also used by ABINIT or via an additional out-of-band (OOB) communication over the GbE management network.
Referring to this, Figure5.1on the next page shows the dependency between the ex-ecution time of ABINIT (in seconds) on the y-axis and the delay between the executionof two check_iberr scripts in a row (in seconds) on the x-axis. The delay betweentwo script executions is displayed on the abscissa because during the measurements thedelay was the best way to guarantee a constant triggering rate on the two systems to bemeasured during the variable execution time of ABINIT . The labelling of the second y-axis on the right side of the diagram shows the issue mentioned above as the slowdownof the ABINIT execution (in seconds) regarding its execution time without any distur-bances. An uninterrupted run of ABINIT takes about 90.9 seconds – this value wasused as the basis for the calculation of the slowdown of the application. Furthermore,every measuring point consists of the average of at least six independent measurements,which means a minimum of six full ABINIT runs at any given script execution delayvalue. The delay of1e−6 s = 1µs = 0.000001s is roughly the same as if the there is nodelay, which means that the script executing process cannot be made faster than this.
Thus, the analysis of Figure5.1on the facing page shows a slowdown of the ABINIT
execution if thecheck_iberr script is executed locally via NRPE over GbE of about40% but only for very small delays which is synonymous for a high monitoring fre-quency. If the delay between two script executions becomes larger, the slowdown ofthe ABINIT execution becomes smaller. At a delay of one second the slowdown is lessthan 4% and at a delay of ten seconds less than 0.5%. It means that the influence of thescript execution on ABINIT is already that low at this untypically frequent monitoring
48 Stefan Worm

5.2. Impact regarding the Execution of Applications
0
20
40
60
80
100
120
140
160
1e-06 1e-05 1e-04 0.001 0.01 0.1 1 10 100 0
20
40
60
80
100
Execution time of Abinit [sec]
Slowdown [percent]
Delay of check-iberr.pl script execution [sec]
Influence on Abinit due to Local and Remote check-iberr Script
Abinit execution time (local script)Abinit execution time (remote script)
Abinit slowdown (local script)Abinit slowdown (remote script)
Figure 5.1:Influence on Abinit due to Local and Remotecheck_iberr Script Exe-cution
interval that the expected slowdown of intervals of three or five minutes (180 to 300seconds) will be even lower. A more detailed consideration regarding this aspect willbe made explaining Figure5.2 on the next page. The cause of the general slowdownis the CPU consumption of the NRPE plugin and thecheck_iberr script. A distur-bance of the communication between the ABINIT jobs can be eliminated by using anextra Gigabit Ethernet network, so that the communication of ABINIT via InfiniBandnetwork is exclusive.
Regarding the impact on ABINIT caused by the remote monitoring of the perfor-mance counters via a remote execution of thecheck_iberr script it can be statedthat, even at a very low delay rate of1µs between two executions, the slowdown ofABINIT was less than 1%. The reason for the very low slowdown close to the border-line of measuring errors is that the CPU load caused by the InfiniBand kernel moduleib_mad1 which is responsible for answering those queries is very low compared tothe load caused by the scenario mentioned above. Obviously the impact on the ABINIT
job communication via InfiniBand is not significant, probably because of the imple-mentation of remote communication on the InfiniBand network regarding the query ofthe performance counters via Management Datagram (MAD) packets as described in[Inf04].
Finally, the method of querying the performance counters of an InfiniBand networkcard via the remote execution of thecheck_iberr script has a much lower slowdownon a specific ABINIT calculation with very small monitoring intervals than the localexecution of it and should be preferred because of this aspect.
Stefan Worm 49

Chapter 5. Evaluation of the Performance Impact of Monitoring Activities
5.2.2 Influence on Abinit due to Local and Remote NagiosPlugins
In Figure5.2 the execution time of ABINIT depending on the local execution of vari-ous Nagios plugins via Gigabit Ethernet network, as well as via InfiniBand network isshown. The conditions are similar to Figure5.1on the previous page, which means thatthe labelling of the axes is the same except that the abscissa displays the delay betweentwo executions of the whole set of Nagios plugins instead of only thecheck_iberrscript.
0
20
40
60
80
100
120
140
160
1e-05 1e-04 0.001 0.01 0.1 1 10 100 0
20
40
60
80
100
Execution time of Abinit [sec]
Slowdown [percent]
Delay of Nagios plugins execution [sec]
Influence on Abinit due to Local and Remote Nagios Plugins
Abinit execution time (plugins via IPoIB)Abinit execution time (plugins via GbE)
Abinit slowdown (IPoIB)Abinit slowdown (GbE)
Figure 5.2:Influence on Abinit due to Local and Remote Nagios Plugins
The main purpose of this measurement is to find out the impact of a typical moni-toring situation on the performance of the reference application ABINIT . The purposeis to determine whether the execution of the Nagios plugins via GbE or via IPoIB isthe faster alternative. The preliminary considerations are that either the communicationvia the Internet Protocol over InfiniBand (IPoIB) could have less impact on ABINIT ,because the InfiniBand network (10 Gb) is faster than GbE (1 Gb) or it could havemore impact on ABINIT , because the network connection has to be shared unlike thecommunication via Gigabit Ethernet.
Table5.1on the facing page shows the list of plugins that were exemplarily chosenas a possible set of values for monitoring. During the use of this set of plugins fortest purposes, they were executed sequentially as they appear in Table5.1. This set ofplugins, that are selected from the Nagios plugin collection4 in version 1.4.4, covers
4http://nagiosplug.sourceforge.net/
50 Stefan Worm

5.2. Impact regarding the Execution of Applications
many values which an administrator can be interested in. They reflect a profile of whatcan be monitored, but they do not lay claim to be a ready to use selection. Usuallythe number of plugins that are used to monitor a specific machine would be smallerthan the eleven plugins that are presented here, especially at a cluster computer wherehigh performance is desired. Because every additional check module influences theperformance of the system in a negative way, only modules that are really necessaryshould be used.
plugin name via descriptioncheck_load NRPE checks the CPU loadcheck_mem NRPE checks the memory usagecheck_procs NRPE (1) checks the general number of processes
(2) checks if the MPI daemon is running(3) checks if theipoib module is loaded
check_sensors NRPE reads the health status (CPU temperature, fan speed, etc.)with lm_sensors
check_log NRPE checks if something has changed in /var/log/messagescheck_ntp network checks if the NTP server is running and the possible time
differencecheck_ping network checks the average round trip time (RTT) and packet losscheck_ssh network checks if the SSH daemon is answeringcheck_tcp network checks if a daemon is listening on a specific TCP port, in
this case port 80 for a web server
Table 5.1:Nagios Plugins
Figure5.2on the preceding page shows that the execution of monitoring applicationsslows down the execution of ABINIT all the more the number of disturbances increaseswhich is equivalent to a decrease of the delay between two executions. The maximumslowdown is 23% for plugins via GbE and 36% for plugins via IPoIB, but the slowdowndecreases as the delay between two sets of Nagios plugins executions increases, forexample for a delay of 10 seconds the slowdown for GbE is 1.58% and for IPoIB it is2.05%.
Furthermore, the chart shows that the execution of the plugins via the IPoIB networkconnection slows down ABINIT more than the execution of the same plugins via theGigabit Ethernet network connection. This difference cannot be explained due to theplugins execution, because exactly the same set was executed via both network con-nections and therefore they also had the same impact on the system’s CPU.
Thus, the less impact of the plugins via GbE is probably caused by the plugin com-munication via an extra network, so that the communication of ABINIT via another oneis not affected. The other way around, the greater impact of the plugins via IPoIB ismore likely because of the network connection that has to be shared among the com-munication for the plugins and the communication for ABINIT (refer to Figure5.4 onpage55). This is interesting in reference to the higher bandwidth and lower latency of
Stefan Worm 51

Chapter 5. Evaluation of the Performance Impact of Monitoring Activities
the InfiniBand network. Obviously, the advantage from this is not enough to get a betterperformance than with the GbE communication via two separated networks. Anotherreason for worse performance via IPoIB network could be a potentially higher CPUconsumption for processing the IPoIB communication on a specific machine which isdiscussed in Figure5.3on the next page.
Finally, the impact of the plugins regarding an application that runs on a computercan be calculated as follows. For the consideration of a usual monitoring interval fromthree to five minutes the run time of ABINIT of about 90 seconds is too short. This runtime is good for measurement reasons as described above in Section5.2on page47, butfor reflections regarding practical monitoring intervals, extrapolations have to be made.Based on a slowdown of1.58% at a delay of ten seconds via the GbE interface (referto Figure5.2on page50) which corresponds to nine sets of monitoring checks duringa 90.9 seconds ABINIT run, the slowdown for one set of checks every90.9 secondswould be: (1.58% / 9) = 0.175%. Assuming a monitoring interval of5 minutes(= 300 seconds) which would mean one check every300 seconds instead of one checkevery90.9 seconds, this would reduce the influence on the application by a factor of(300 seconds / 90.9 seconds = 3.30033) ≈ 3.3. Thus, for an ABINIT that runs verylong, the performance loss would be0.175% / 3.3 ≈ 0.053%.
To sum up, it can be stated that for a monitoring interval of five minutes for thecollection of eleven plugins via Gigabit Ethernet a slowdown of just around 0.053% isexpected – by using InfiniBand and a basis of2.05% the expected slowdown would bearound 0.069%. Even if a very short monitoring interval of one minute and InfiniBandis used, the maximum expected performance loss would be0.069% · 5 = 0.345%. Dueto the fact that usually less than eleven plugins per computer are used the expectedslowdown is actually less than this, nonetheless a higher impact on the system’s per-formance could be seen if other, uncommon types of plugins are used that for examplecause a high CPU or network load.
5.2.3 Influence of Local and Remote Nagios Plugins viaIPoIB and GbE on Four Local Abinis Jobs
Figure5.3on the facing page shows the analysis of the influence of the Nagios plugins(refer to Table5.1 on the previous page) on the execution of the sequential version ofABINIT , calledabinis. In contrast toabinip which was used for gaining the measure-ment data of Figure5.1on page49 and Figure5.2on page50, abinisuses, because ofits sequential nature, only one CPU core for its calculations and therefore it does notperform any communication with other processes on the same machine or on a remoteone. A similar input file as before was used forabinis, but with the difference that thecomplexity of it was reduced by the factor of eight, so that a single run also took about90 seconds.
In this test, only one machine was used for getting the measuring results and one fortriggering the plugins (refer to Section5.1 on page47). On the computer for gettingthe measuring data,abinis was started four times almost in parallel. The duration of
52 Stefan Worm
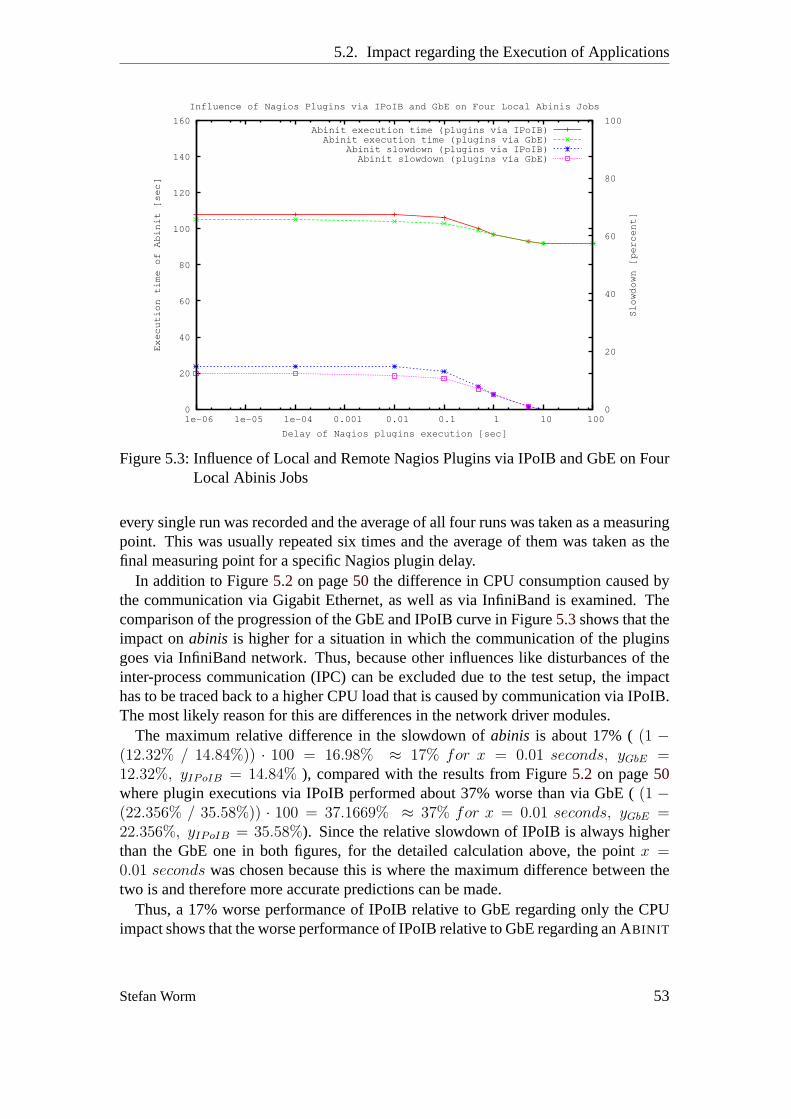
5.2. Impact regarding the Execution of Applications
0
20
40
60
80
100
120
140
160
1e-06 1e-05 1e-04 0.001 0.01 0.1 1 10 100 0
20
40
60
80
100
Execution time of Abinit [sec]
Slowdown [percent]
Delay of Nagios plugins execution [sec]
Influence of Nagios Plugins via IPoIB and GbE on Four Local Abinis Jobs
Abinit execution time (plugins via IPoIB)Abinit execution time (plugins via GbE)
Abinit slowdown (plugins via IPoIB)Abinit slowdown (plugins via GbE)
Figure 5.3:Influence of Local and Remote Nagios Plugins via IPoIB and GbE on FourLocal Abinis Jobs
every single run was recorded and the average of all four runs was taken as a measuringpoint. This was usually repeated six times and the average of them was taken as thefinal measuring point for a specific Nagios plugin delay.
In addition to Figure5.2 on page50 the difference in CPU consumption caused bythe communication via Gigabit Ethernet, as well as via InfiniBand is examined. Thecomparison of the progression of the GbE and IPoIB curve in Figure5.3shows that theimpact onabinis is higher for a situation in which the communication of the pluginsgoes via InfiniBand network. Thus, because other influences like disturbances of theinter-process communication (IPC) can be excluded due to the test setup, the impacthas to be traced back to a higher CPU load that is caused by communication via IPoIB.The most likely reason for this are differences in the network driver modules.
The maximum relative difference in the slowdown ofabinis is about 17% ((1 −(12.32% / 14.84%)) · 100 = 16.98% ≈ 17% for x = 0.01 seconds, yGbE =12.32%, yIPoIB = 14.84% ), compared with the results from Figure5.2 on page50where plugin executions via IPoIB performed about 37% worse than via GbE ((1 −(22.356% / 35.58%)) · 100 = 37.1669% ≈ 37% for x = 0.01 seconds, yGbE =22.356%, yIPoIB = 35.58%). Since the relative slowdown of IPoIB is always higherthan the GbE one in both figures, for the detailed calculation above, the pointx =0.01 seconds was chosen because this is where the maximum difference between thetwo is and therefore more accurate predictions can be made.
Thus, a 17% worse performance of IPoIB relative to GbE regarding only the CPUimpact shows that the worse performance of IPoIB relative to GbE regarding an ABINIT
Stefan Worm 53
Chapter 5. Evaluation of the Performance Impact of Monitoring Activities
run with process communication via InfiniBand network of 37% is caused partially bythe higher CPU load of the IPoIB network communication. It means, that only a littlemore than half of it is caused through the InfiniBand network connection that has to beshared among ABINIT and Nagios plugins (refer to Figure5.2on page50).
5.3 Impact regarding the Network Performance
In the following section, figures are presented that show the influence of monitoringactivities on the network performance. For this, the network benchmark applicationnetgauge5 in version 1.0a1 was used ([HLR]), analogical to ABINIT with the help ofMVAPICH2 MPI over InfiniBand. The test configuration as described in Section5.1on page47 stays the same, which means the computersc6-3 andc6-4 were used forbenchmarking only and the computersc6-1andc6-2for triggering the interrupt data.
The functionality ofnetgaugeis that it begins with a packet size of one byte andin the process of measuring the packet size increases exponentially by doubling thepreceding value to get the actual one, until the desired maximum packet size is reached– for example223 = 8388608 byte ≈ 8.4 MB. For every size, a packet is sent to thesecond computer which echoes it as soon as it has been received and when it reachesthe first computer again, the total runtime is taken – after this, the next measuring of apacket with the same size can start. This is repeated several times, from around 500 to8000 times, depending on the accuracy that is needed. For every total measurement ofa specific packet size, among other values the median for it is calculated by netgauge.The median, which is the value for what the sum of the absolute deviations from it isminimal, is used instead of the arithmetic mean because of its resistance to outliers.
5.3.1 Network Performance with and without Remote andLocal Execution of Nagios Plugins via IPoIB and GbE
In this section, by means of Figure5.4on the facing page, the impact on the InfiniBandnetwork performance regarding the set of Nagios plugins as described in Table5.1onpage51 via GbE network, as well as via IPoIB network connection is discussed. Incomparison to Figure5.2 on page50 and Figure5.3 on the previous page the delaybetween two executions of the whole set of plugins was made zero, which means thatthe triggering computers tried to generate as much influence as possible. The labellingon the x-axis is the packet size in byte with a logarithmic scale and the labelling of they-axis, which is in a logarithmic scale too, is the throughput of the InfiniBand networkconnection in Megabit per second (Mb/s).
The unhindered chart shows an almost linear increasing network throughput depend-ing on the packet size at the beginning, which starts to slightly flatten past a packet sizeof 211 byte and intensifies with further growing packet sizes. As from a size of220 bytethe chart does show only marginal growth until a maximum network throughput of
5http://www.unixer.de/research/netgauge/
54 Stefan Worm

5.3. Impact regarding the Network Performance
1
10
100
1000
10000
20 25 210 214 220 225 0
20
40
60
80
100
InfiniBand (IB) Network Throughput [Mbit/sec]
Slowdown [percent]
Packet size [byte]
Network Performance w and w/o Remote and Local Execution of Nagios Plugins
median throughput (w/o plugins)median throughput (w plugins via IPoIB)median throughput (w plugins via GbE)
IB slowdown (regarding plugins via IPoIB)IB slowdown (regarding plugins via GbE)
Figure 5.4:Network Performance with and without Remote and Local Execution ofNagios Plugins via IPoIB and GbE
around 7600 Mb/s is reached. The charts for the measurements of the Nagios pluginsinfluence via Gigabit Ethernet or InfiniBand network are very similar to the unhinderedone, whereas the performance is always lower in comparison to the unhindered chart.Referring to this, only a small difference in those three charts can be seen, although thelabelling is already in a logarithmic scale, hence the slowdown in percent was plottedon the second y-axis due to plugin execution via GbE and IPoIB.
First, it shows that the slowdown on the InfiniBand network is always higher thanthe one on the GbE network. This can be explained with the fact that the plugin com-munication via IPoIB influences the InfiniBand performance and as a consequence ofthat the network performance measurement too. It also fits with the conclusion that wasmade at Figure5.2on page50and Figure5.3on page53.
Second, the value, which shows that the IPoIB slowdown is higher compared to theGbE slowdown, is almost zero or it differs not more than 2% on most measuring points.In particular for very small and very large packet sizes – for example atx = 28 byte,yGbE = 312.36 byte andyIPoIB = 318.15 byte it is (1− (312.36 byte / 318.15 byte)) ·100 ≈ 1.82%. Complementary to this, three significant differences can be identified.At x = 24, x = 26and x = 211 byte the throughput slowdown of IPoIB differs explicitlyfrom the GbE slowdown. A possible explanation for this are conflicts of the measuredpacket size with the packet sizes of specific Nagios plugins. In Figure5.7on page62thepacket sizes for the test set of Nagios plugins which were used during the measurementscan be seen. The peak of packets smaller than 150 byte is significant and possibly thereason for the IPoIB slowdown atx = 16 byte andx = 64 byte. The peak between
Stefan Worm 55
Chapter 5. Evaluation of the Performance Impact of Monitoring Activities
the Nagios plugins packet size of 1126 byte and 1200 byte could be causal for theInfiniBand slowdown at the network benchmark packet size ofx = 2048 byte, whichis expected to be the packet size that is affected next for data of 1126 byte to 1200 byte.
Since at all stages of packet size measuring the same set of Nagios plugins wasexecuted, it seems that plugin packets of a specific size have a significant impact on theInfiniBand network performance if their size is just at the size of the packets that aretested at this moment bynetgauge.
As a reason for this, the influence of the different treatment of different packet sizesof InfiniBand is assumed. It seems that for the IB packet processing, a set of queues isused, each for a specific range of packet sizes. Hence, for the network benchmark ofa specific packet size the corresponding InfiniBand processing queue is used only andvery extensively, whereas the other queues are almost empty, except for a few packetsfor the Nagios plugins. Thus, if Nagios packets in addition to the plenty of benchmarkpackets of a specific size are in the queue, the possible reason for the slowdown as de-scribed above can be explained as a consequence of the load on this specific InfiniBandprocessing queue.
5.3.2 Network Performance with and without Execution ofthe check_iberr Script
The test setup for obtaining the charts of Figure5.5 on the next page was used to findout the influence of thecheck_iberr script in relation to the InfiniBand networkperformance via GbE, as well as via IPoIB. It is very similar to the test setup of Fig-ure5.4on the preceding page which means that thecheck_iberr script is executedover and over again without any delays instead of the execution of the known set ofNagios plugins. Everything else stays the same, which means the assignment of theroles to the computers and the labelling of the axes has not changed, as well as no de-lay between two script executions means that the triggering computers try their best togenerate as much load as possible. Furthermore, the general conclusions regarding thefirst three charts that show the throughput depending on the packet size, without thepresentation of the slowdown, are still applicable (refer to Section5.3.1on page54).
The first difference in Figure5.5 on the facing page compared to Figure5.4 on theprevious page is the percentage slowdown of the script due to execution via the twodifferent networks. In this figure, the InfiniBand network slowdown regarding the ex-ecution of thecheck_iberr script via IPoIB is not always higher than the networkslowdown that is caused by script execution via GbE. In fact, the two charts of IPoIBand GbE have very much the same progression and do differ only marginally in twomeasuring points each.
Although, some differences could also be explained by possible conflicts of Infini-Band queues (refer to Figure5.4 on the preceding page), the generally more alignedprogression of the two slowdown charts points to another relevant explanation for this.Note that both slowdown charts in Figure5.5 are constantly higher than the one inFigure 5.4. Regarding the InfiniBand slowdown charts, for example the percentage
56 Stefan Worm

5.3. Impact regarding the Network Performance
1
10
100
1000
10000
20 25 210 214 220 225 0
20
40
60
80
100
InfiniBand (IB) Network Throughput [Mbit/sec]
Slowdown [percent]
Packet size [byte]
Network Performance w and w/o Execution of the check-iberr.pl Script
median throughput (w/o any disturbance)median throughput (w check-iberr via IPoIB)median throughput (w check-iberr via GbE)
IB slowdown (check-iberr via IPoIB)IB slowdown (check-iberr via GbE)
Figure 5.5:Network Performance with and without Execution of thecheck_iberrScript
slowdown for a packet size ofx = 20 byte tox = 23 byte is just around 13% in Figure5.4 and with around 28% significantly higher in Figure5.5. In addition to that at themeasuring point ofx = 28 where the percentage slowdown in both figures begins itscontinuous decrease, the slowdown is just about 16% in Figure5.4, but about 27% inFigure5.4.
As a reason for this, the very different kinds of monitoring information that wheregained on the one hand by the set of Nagios plugins and on the other hand by thecheck_iberr script can be taken into account. Whilst the set of Nagios plugins arechecking various kinds of information that basically result in load for the CPU andmemory, as well as some load on the network for the essential communication of theplugins, thecheck_iberr script primarily checks only one kind of information thatmostly stresses the InfiniBand Host Channel Adapter (HCA) itself. The HCA, whichis equivalent to the Network Interface Card (NIC) on other network types, is the targetof the check_iberr script to gain the performance counter information. It meansthat the script checks over and over again those values and therewith interferes with theInfiniBand HCA. Because of the high frequency of the checks and the direct influenceon the InfiniBand network card, the overall performance of the IB network connectionis substantially lower than shown in Figure5.4on page55.
Stefan Worm 57
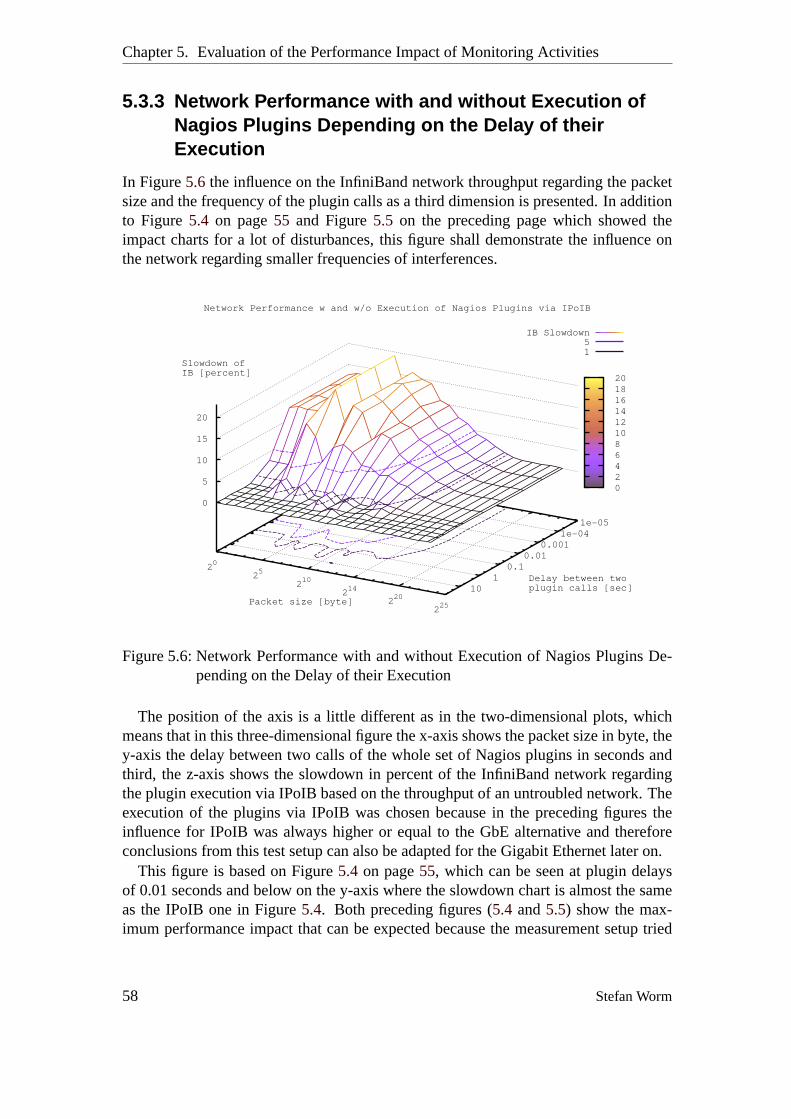
Chapter 5. Evaluation of the Performance Impact of Monitoring Activities
5.3.3 Network Performance with and without Execution ofNagios Plugins Depending on the Delay of theirExecution
In Figure5.6 the influence on the InfiniBand network throughput regarding the packetsize and the frequency of the plugin calls as a third dimension is presented. In additionto Figure5.4 on page55 and Figure5.5 on the preceding page which showed theimpact charts for a lot of disturbances, this figure shall demonstrate the influence onthe network regarding smaller frequencies of interferences.
0 2 4 6 8 10 12 14 16 18 20
Network Performance w and w/o Execution of Nagios Plugins via IPoIB
IB Slowdown 5 1
2025
210214
220225
Packet size [byte]
1e-05 1e-04
0.001 0.01
0.1 1
10 Delay between two plugin calls [sec]
0
5
10
15
20
Slowdown of IB [percent]
Figure 5.6:Network Performance with and without Execution of Nagios Plugins De-pending on the Delay of their Execution
The position of the axis is a little different as in the two-dimensional plots, whichmeans that in this three-dimensional figure the x-axis shows the packet size in byte, they-axis the delay between two calls of the whole set of Nagios plugins in seconds andthird, the z-axis shows the slowdown in percent of the InfiniBand network regardingthe plugin execution via IPoIB based on the throughput of an untroubled network. Theexecution of the plugins via IPoIB was chosen because in the preceding figures theinfluence for IPoIB was always higher or equal to the GbE alternative and thereforeconclusions from this test setup can also be adapted for the Gigabit Ethernet later on.
This figure is based on Figure5.4 on page55, which can be seen at plugin delaysof 0.01 seconds and below on the y-axis where the slowdown chart is almost the sameas the IPoIB one in Figure5.4. Both preceding figures (5.4 and5.5) show the max-imum performance impact that can be expected because the measurement setup tried
58 Stefan Worm

5.4. Quantitative CPU and Network Load Analysis
to generate as much influence as possible. This impact can be easily recognised at theslowdown for small packet sizes, but for a realistic monitoring scenario the charts forlarger delays have to be paid attention to.
Figure5.6on the facing page shows that an influence of less than 1% is reached witha delay of 10 seconds at most. It means that if the time between two total executionsof the set of Nagios plugins is larger than 10 seconds, the influence is marginal and fora delay of 20 seconds the influence on the InfiniBand network performance cannot bedetected anymore as it can be seen in the chart. Thus, for considerations concerningrealistic monitoring intervals of 1 minute to 5 minutes, as made for Figure5.2regardingthe impact on the execution time of ABINIT , no measurable influence of the networkthroughput is expected.
5.4 Quantitative CPU and Network Load Analysis
One aspect that has not yet been considered is the quantitative load of the CPU and thenetwork connection of the monitoring server and its corresponding clients. For this, theknown set of Nagios plugins (refer to Table5.1 on page51) and thecheck_iberrscript are examined regarding their effects on the monitoring server, as well as regardingtheir effects on the clients that are monitored.
For this, the applicationiptraf 6 was used because it has features to determine de-tailed network statistics regarding a specific interface. To exclude parasitic influencesregarding the measurements, the configuration as described in Section5.1 on page47was used. In particular the use of two network interfaces was important whereby everyusual traffic like SSH, DHCP messages, and others used the first network interface,so that the second network interface could be used for untroubled measurements. Formeasuring the CPU load, the applicationstopandpswere used.
5.4.1 Influence of Nagios Plugins on Clients and theMonitoring Server
First, the quantitative influence of the set of Nagios plugins (refer to Table5.1 onpage51) on the client computers that were monitored and second the total impact onthe monitoring server was examined. The singular execution of this set of plugins gen-erated a total of 143 packets with 29883 byte of data. It means that statistically everypacket has a size of29883 byte / 143 packets ≈ 209 byte/packet and that every packetis responsible for143 packets / 11 plugins = 13 packets/plugin in average.
The next test setup was based on the execution of the whole set of Nagios plugins1000 times in a row without any delays. This took 210 seconds and generated a networktraffic of around 29.8 MB which is a traffic rate of round 141 kB/sec, whereas half of itwas traffic that wentin and the other half was traffic that wentout.
6http://iptraf.seul.org/
Stefan Worm 59
Chapter 5. Evaluation of the Performance Impact of Monitoring Activities
The execution of 1000 times 11 plugins within 210 seconds equals to1000 · 11plugins / 210 seconds ≈ 52.4 plugins/second which means that52.4 plugins/second/ 11 plugins ≈ 4.76 computer/second can be monitored. For the CHiC systemwith around 550 computers to be monitored the time of550 computer/4.76 computer/second ≈ 115.5 second is necessary.
Thus, less than two minutes are needed to check eleven values from each computerof the CHiC. Therefore, a monitoring frequency of three to five minutes can be usedwithout any problems. Also a very low frequency of just one minute is feasible if theplugins were executed in parallel as it is supported by Nagios and not sequentially asit was performed in the benchmark script or if fewer values for monitoring are used(refer to Section5.2.2on page50). Furthermore, not the amount of data, a monitoringserver can send out in parallel, was examined, only the fastest possible interaction oftwo computers was analysed as it was also done in the test setups in Section5.1 onpage47 et sqq. Hence, this has no effect on the considerations because the parallelexecution of the plugins on more than one computer at once tends to be faster than thestrict sequential execution – an approximately realistic load on a monitoring server willbe discussed below (refer to Section5.4.3on the facing page).
5.4.2 Influence of the check_iberr Script on Clients andthe Monitoring Server
As the next step, the quantitative influence of thecheck_iberr script on client com-puters and the monitoring server shall be examined. The singular local execution of thescript via the Nagios Remote Plugins Executor (NRPE) generates a total of 18 packetswith 3965 byte of data.
The execution of this script 1000 times in a row without any delays took 64 seconds.Thus, a speed of1000 executions / 64 seconds ≈ 15.6 executions/second can bereached, which means that around 550 computers of the CHiC can be monitored atleast once within550 computer / 15.6 computer/second ≈ 32 seconds. Hence, theperformance of the script is sufficient for realistic checking frequencies.
Above, thecheck_iberr script was executed in standard mode which reports thestatus of the performance counters of the InfiniBand network adapter only if they ex-ceed a specific threshold. Usually, nothing is reported, because most of the performancecounters are error counters and in a stable operation of the system they occur only oc-casionally. But to make sure that the monitoring of the performance counters workswell, there is an update option which forces the script to read and report all countersirrespective of the exceeding of a certain threshold, as well as an option for resettingthem to assure a well defined state if desired (refer to4.4.1on page40).
This results in a total of 51 packets with 14931 byte of data which are generatedby one singular local execution of the script with the update option via the NagiosRemote Plugins Executor (NRPE). The execution of the script 550 times in a rowwithout any delays, which is equivalent for one update check for each of the CHiCcomputers, took 9 minutes and 10 seconds (= 550 seconds). This seems to be a
60 Stefan Worm
5.4. Quantitative CPU and Network Load Analysis
long time, because monitoring intervals of 10 minutes or more appear possible. Ina realistic scenario the update check would be made only once an hour or less fre-quently. Hence, to fit into the 5 minutes monitoring pattern, based on hourly in-tervals (1 hour = 60 minutes / 5 minutes = 12) it has to be calculated with550 seconds / 12 ≈ 45.8 seconds. Thus, in addition to the time consumption of 32seconds of the standardcheck_iberr execution to check every CHiC computer atleast once and the 45.8 seconds that are proportionally necessary for an update execu-tion of thecheck_iberr script, to sum up an interval of 77.6 seconds is sufficient fora supposed monitoring interval of three to five minutes. Further on, the considerationmade above regarding the limitations of the test setup and among others the sequentialexecution are still valid. The load on the monitoring server in a realistic situation willbe discussed below.
5.4.3 Exemplary Monitoring Server Test with Nagios Pluginsand the check_iberr Script
In the preceding sections some tests were performed that showed the influence of Na-gios plugins and thecheck_iberr script regarding their influence on impact thathave to be monitored as well as on a computer that works as a monitoring server. Thosetests were good for discussing the quantitative influence in a controlled situation con-sidering a specific aspect. In the following section the behaviour of the computer thatworks as the monitoring server in a realistic situation shall be examined.
For this, a computer with AMD Athlon at 950 MHz, 0.5 GB RAM under ScientificLinux 4.3 with kernel 2.6.9-34EL was used. On this computer, Nagios was installed.Further on, the four computers described in Section5.1 on page47 where used asthe ones that should be monitored. To generate a preferably high load on the moni-toring server, the known set of Nagios plugins (refer Table5.1 on page51) and thecheck_iberr script with the update option that generates more load as the standardversion (refer to Section5.4.2on the facing page) were used and a monitoring intervalof 10 seconds was set.
The impact on the CPU load of the monitoring machine varied from zero percentup to about five percent. During a 20 minutes = 1200 seconds interval the Nagiosprocess consumed 26 seconds of CPU time. It means, that the average load was(26 seconds / 1200 seconds) · 100 = 2.16% ≈ 2.2%. Thus, for the 550 comput-ers of the CHiC a load of550 · (2.16% / 4 computers) ≈ 297.9% is expected.
For a realistic monitoring interval of 5 minutes = 300 seconds instead of 10 secondsas in the measurements above, the load would be300 seconds / 10 seconds = 30 timeslower and therefore only around297.9% / 30 = 9.93%. Although this is not a lot, theload would be even less, because the computer that is actually used as monitoring serverin the CHiC is a much more powerful one which is faster and has more cores (refer toSection3.1on page23).
Other processes like the NRPE or NSCA add-ons which assist Nagios are not neces-
Stefan Worm 61
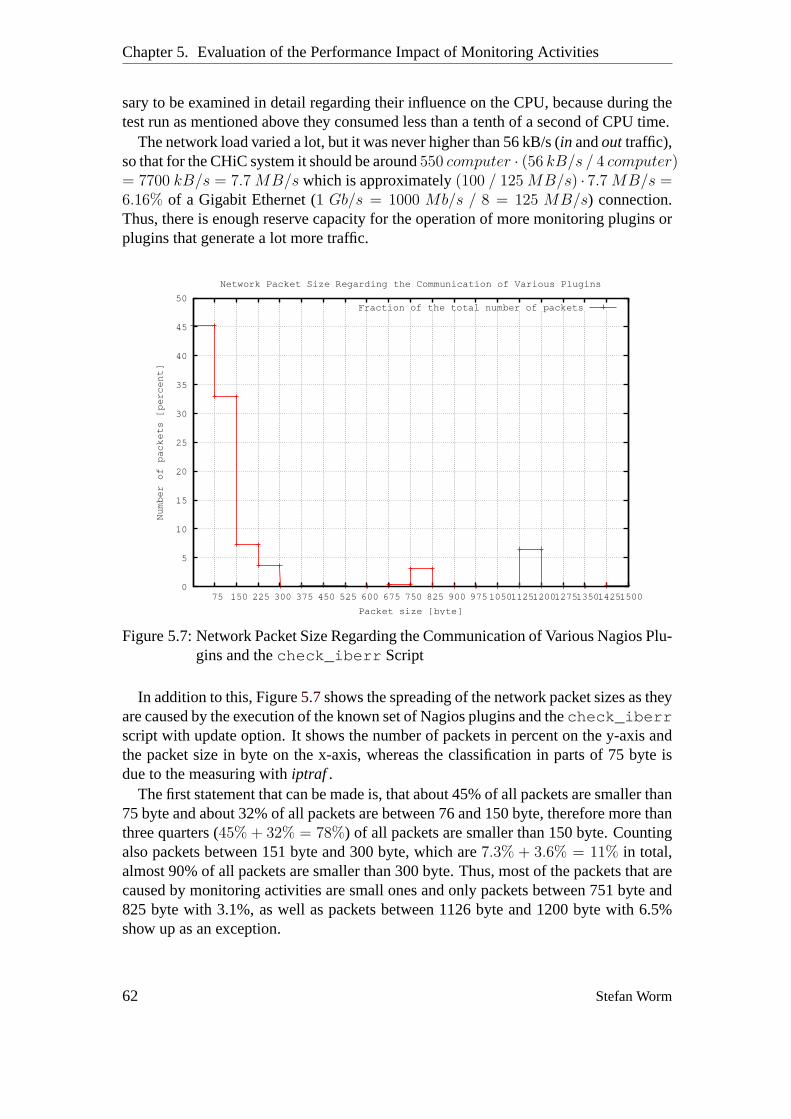
Chapter 5. Evaluation of the Performance Impact of Monitoring Activities
sary to be examined in detail regarding their influence on the CPU, because during thetest run as mentioned above they consumed less than a tenth of a second of CPU time.
The network load varied a lot, but it was never higher than 56 kB/s (in andout traffic),so that for the CHiC system it should be around550 computer · (56 kB/s / 4 computer)= 7700 kB/s = 7.7 MB/s which is approximately(100 / 125 MB/s) · 7.7 MB/s =6.16% of a Gigabit Ethernet (1 Gb/s = 1000 Mb/s / 8 = 125 MB/s) connection.Thus, there is enough reserve capacity for the operation of more monitoring plugins orplugins that generate a lot more traffic.
0
5
10
15
20
25
30
35
40
45
50
75 150 225 300 375 450 525 600 675 750 825 900 975 1050 1125 1200 1275 1350 1425 1500
Number of packets [percent]
Packet size [byte]
Network Packet Size Regarding the Communication of Various Plugins
Fraction of the total number of packets
Figure 5.7:Network Packet Size Regarding the Communication of Various Nagios Plu-gins and thecheck_iberr Script
In addition to this, Figure5.7shows the spreading of the network packet sizes as theyare caused by the execution of the known set of Nagios plugins and thecheck_iberrscript with update option. It shows the number of packets in percent on the y-axis andthe packet size in byte on the x-axis, whereas the classification in parts of 75 byte isdue to the measuring withiptraf .
The first statement that can be made is, that about 45% of all packets are smaller than75 byte and about 32% of all packets are between 76 and 150 byte, therefore more thanthree quarters (45% + 32% = 78%) of all packets are smaller than 150 byte. Countingalso packets between 151 byte and 300 byte, which are7.3% + 3.6% = 11% in total,almost 90% of all packets are smaller than 300 byte. Thus, most of the packets that arecaused by monitoring activities are small ones and only packets between 751 byte and825 byte with 3.1%, as well as packets between 1126 byte and 1200 byte with 6.5%show up as an exception.
62 Stefan Worm
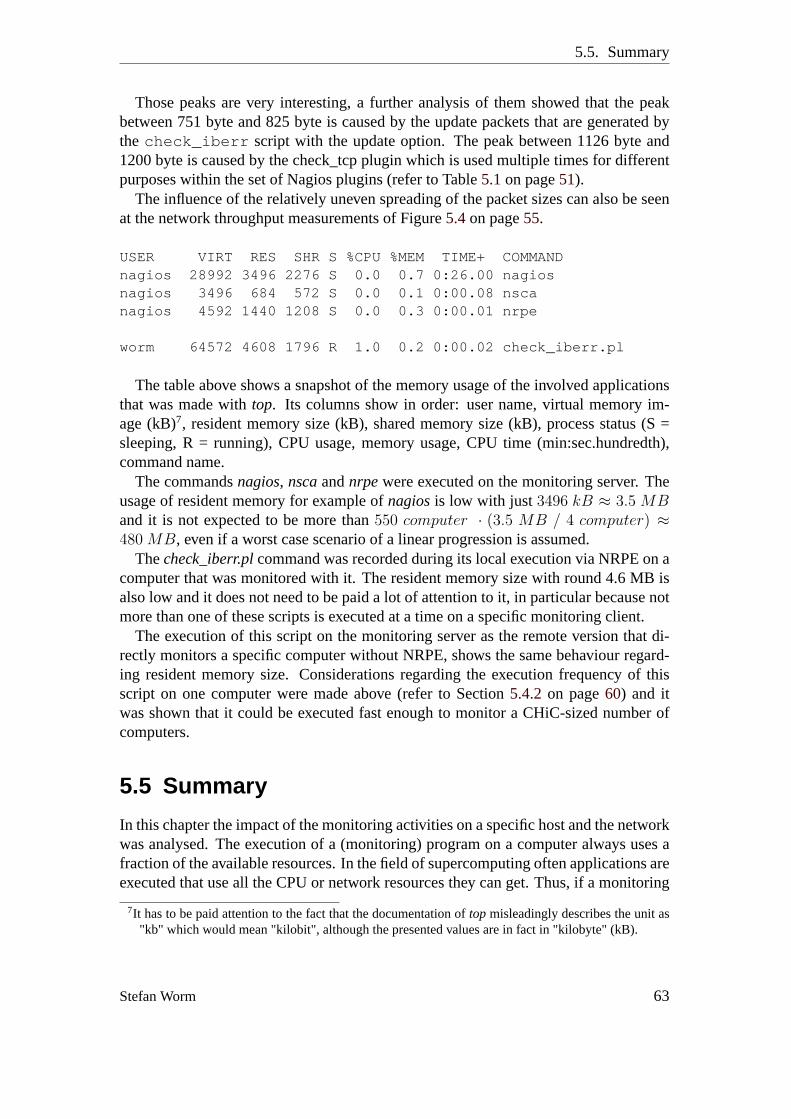
5.5. Summary
Those peaks are very interesting, a further analysis of them showed that the peakbetween 751 byte and 825 byte is caused by the update packets that are generated bythe check_iberr script with the update option. The peak between 1126 byte and1200 byte is caused by the check_tcp plugin which is used multiple times for differentpurposes within the set of Nagios plugins (refer to Table5.1on page51).
The influence of the relatively uneven spreading of the packet sizes can also be seenat the network throughput measurements of Figure5.4on page55.
USER VIRT RES SHR S %CPU %MEM TIME+ COMMANDnagios 28992 3496 2276 S 0.0 0.7 0:26.00 nagiosnagios 3496 684 572 S 0.0 0.1 0:00.08 nscanagios 4592 1440 1208 S 0.0 0.3 0:00.01 nrpe
worm 64572 4608 1796 R 1.0 0.2 0:00.02 check_iberr.pl
The table above shows a snapshot of the memory usage of the involved applicationsthat was made withtop. Its columns show in order: user name, virtual memory im-age (kB)7, resident memory size (kB), shared memory size (kB), process status (S =sleeping, R = running), CPU usage, memory usage, CPU time (min:sec.hundredth),command name.
The commandsnagios, nscaandnrpewere executed on the monitoring server. Theusage of resident memory for example ofnagiosis low with just3496 kB ≈ 3.5 MBand it is not expected to be more than550 computer · (3.5 MB / 4 computer) ≈480 MB, even if a worst case scenario of a linear progression is assumed.
Thecheck_iberr.plcommand was recorded during its local execution via NRPE on acomputer that was monitored with it. The resident memory size with round 4.6 MB isalso low and it does not need to be paid a lot of attention to it, in particular because notmore than one of these scripts is executed at a time on a specific monitoring client.
The execution of this script on the monitoring server as the remote version that di-rectly monitors a specific computer without NRPE, shows the same behaviour regard-ing resident memory size. Considerations regarding the execution frequency of thisscript on one computer were made above (refer to Section5.4.2 on page60) and itwas shown that it could be executed fast enough to monitor a CHiC-sized number ofcomputers.
5.5 Summary
In this chapter the impact of the monitoring activities on a specific host and the networkwas analysed. The execution of a (monitoring) program on a computer always uses afraction of the available resources. In the field of supercomputing often applications areexecuted that use all the CPU or network resources they can get. Thus, if a monitoring
7It has to be paid attention to the fact that the documentation oftop misleadingly describes the unit as"kb" which would mean "kilobit", although the presented values are in fact in "kilobyte" (kB).
Stefan Worm 63

Chapter 5. Evaluation of the Performance Impact of Monitoring Activities
program also needs to be executed by the CPU, the main application is necessarilyslowed down. This can be for example 0.1% or even 10% of the runtime depending onthe application and on the monitoring strategy.
How much slowdown is expected for the CHiC was analysed in this chapter. Forthis, a sample application that is also to be used on it (ABINIT ), as well as a set ofvalues that are worth to be monitored was chosen (refer to Table5.1 on page51) andthe effects caused by them were evaluated. In addition to that, the self-developed scriptcheck_iberr for monitoring the performance counters of the InfiniBand networkinterfaces was also embraced into the test setup (refer to Section4.4.1on page40).
First, the analysis of the measurements regarding both, the set of Nagios pluginsand thecheck_iberr script, showed that the slowdown of ABINIT is negligible forrealistic monitoring intervals of one minute or more. The slowdown expected for aninterval of one minute is definitely below 1% and for a five minutes interval it is evenbelow 0.1% of the run time (refer to Section5.2 on page47 and Section5.2.2 onpage52).
Furthermore, the behaviour of the local or remote execution of thecheck_iberrscript was examined. The result is that with the remote version of the script that gainsthe InfiniBand performance counters via InfiniBand management packets has no mea-surable influence on the monitored computer. This is done by the relocation of thescript execution to the monitoring server. With this the anyway small influence of thescript on a monitored computer can be decreased further, so that no impact on appli-cations that run on the monitored computer is expected regarding the utilisation of thisapproach (refer to Figure5.1on page49).
Second, the analysis of the measurements of the InfiniBand network throughput, alsoregarding the set of Nagios plugins and thecheck_iberr script, showed that theslowdown is negligible too, for realistic monitoring intervals of one minute or more.Already at an interval of 10 seconds or more, the slowdown is less than 1% (refer toFigure5.6on page58).
Last, an analysis, if the server on which Nagios runs can handle the entire monitoringof the CHiC was made. It showed that the CPU load and the network traffic which isexpected for monitoring various values for around 550 computers is less than 10%of the CPU load and also less than 10% of a Gigabit Ethernet network connectionand therefore managable for a monitoring server with Nagios running on it (refer toSection5.4.3on page61).
64 Stefan Worm

6 Conclusion and Outlook
This thesis dealt with the monitoring of large-scale cluster computers. There is oftenconfusion what exactly the termmonitoringstands for, favoured by the fact that thisterm is used in very different areas. Hence, for the monitoring of a cluster computer, aclassification was made.
The definition of monitoring is not possible without defining the termmanagement,thus a classification of it was presented. This contained a two-dimensional arrange-ment, that on the one hand describes five layers from enterprise and application man-agement to information, system, and network management (refer to Section1.2 onpage3), as well as on the other hand the FCAPS classification of the ISO/IEC 7498-4 standard that stands for fault, configuration, accounting, performance, and securitymanagement (refer to Section1.2on page4).
The actual scope of monitoring a cluster computer was elaborated by adopting themanagement fields as described above for the action of monitoring. This is admissiblebecause the relation of management and monitoring describes a control cycle regardinga specific entity (refer to Figure2.1on page9). Hence, this thesis describes the processof monitoring as the sequence of generation, processing, dissemination and presenta-tion of the information. The benefit from these classifications is the ability to describewhich specific monitoring task belongs where in the monitoring scope so that appro-priate actions can be performed at a computer system without getting in conflict withother duties and responsibilities.
Furthermore, the situation of the existing Chemnitz Linux Cluster regarding the mon-itoring was examined and suggestions for the improvement of the operation of it, aswell as for succeeding systems, were presented. For example a lot of time and effortfor maintenance can be saved by properly configured processing and dissemination ofthe monitoring data (refer to Section3.2on page24).
As the result of considerations regarding the applicability of various free monitoringsolutions at the Chemnitz High-Performance Cluster, the software Nagios was chosenas the one that fits the needs of the cluster system best (refer to4.1 on page34). Ona cluster computer various entities have to be monitored, for example the status of thecentral infrastructure such as core switches or storage systems (refer to Figure3.2 onpage27) or the health status of the racks. For most of these needs software is availablethat can perform such tasks. But there are other requirements that cannot be fulfilledwith existing free monitoring software, such as the check of the counters of the Infini-Band network ports. Hence, during the course of this work, a plugin was developedthat is able to read and process the different status information of the InfiniBand ports,unaffected by the vendor of the hardware. This software was exemplarily implemented
Stefan Worm 65

Chapter 6. Conclusion and Outlook
for the Nagios monitoring framework so that this plugin can be used as an integratedcomponent that seamlessly fits with the monitoring approach.
In general, the monitoring of some entity does always influence the actual operationof it. Thus, the impact of the monitoring activities has to be as small as possible. Es-pecially for a large number of computers, such as a cluster system, the scalability ofthe monitoring approach is very important. For this, various measurements were per-formed, regarding the influence of the self-developed plugincheck_iberr and a setof representative monitoring values on the computation and the network performanceof a specific system. Concerning this matter, it was evaluated how significant the ex-pected impact is. First, a typical monitoring interval of 5 minutes was taken as a basis,but the results of this work showed that even for a very frequent interval of 1 minutethe influence was always below 1% for every type of measurement. Whereas some ofthem showed even significantly less impact than this, for example, the remotely exe-cuted version of the self-developedcheck_iberr script had no measurable influenceon the execution time of ABINIT (refer to Section5.2.1on page48). Furthermore, thisthesis has demonstrated, that the proposed monitoring solution would scale also on alarge number of nodes, based on extrapolations from a test set with several monitoringvalues (refer to Section5.4.3on page61).
Additionally, during the course of this work it was discovered that the InfiniBandnetwork interface probably processes packets of different sizes in different queues,which would mean that the processing of several packets of one size would be lessefficient than the processing of several packets of different sizes (refer to Section5.3.1on page54). Considerations regarding this aspect should be accomplished in the future.For example a comprehensive test series could be developed that proves how far thisbehaviour of the InfiniBand network interface could be leveraged.
66 Stefan Worm
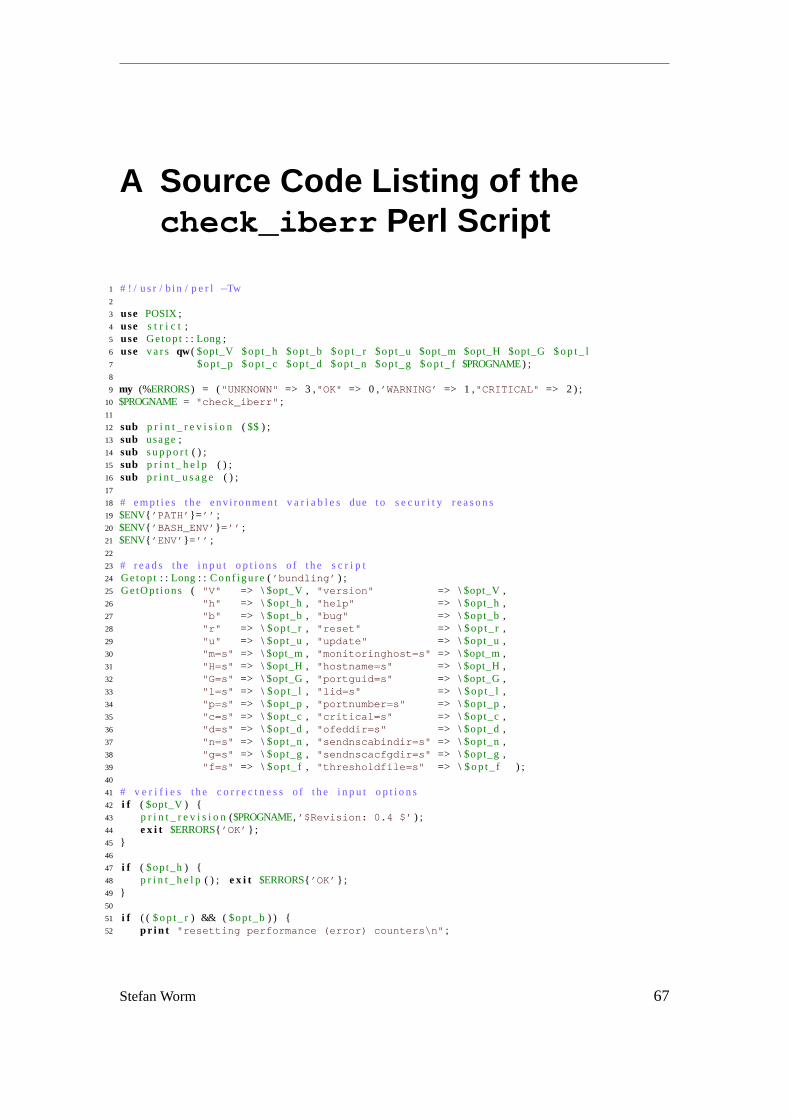
A Source Code Listing of thecheck_iberr Perl Script
1 # ! / u s r / b in / p e r l −Tw2
3 use POSIX;4 use s t r i c t ;5 use Getop t: : Long;6 use v a r s qw ( $opt_V $opt_h $opt_b $ o p t _ r $opt_u $opt_m $opt_H $opt_G $ o p t _ l7 $opt_p $op t_c $opt_d $opt_n $opt_g $ o p t _ f $PROGNAME) ;8
9 my (%ERRORS) = ( " UNKNOWN" => 3 ," OK" => 0 ,’ WARNING’ => 1 ," CRITICAL " => 2 ) ;10 $PROGNAME = " check_iberr " ;11
12 sub p r i n t _ r e v i s i o n ( $$ ) ;13 sub usage;14 sub s u p p o r t( ) ;15 sub p r i n t _ h e l p ( ) ;16 sub p r i n t _ u s a g e ( ) ;17
18 # emp t i es t h e env i ronment v a r i a b l e s due t o s e c u r i t y r e a s o n s19 $ENV{ ’ PATH’ }= ’ ’ ;20 $ENV{ ’ BASH_ENV’ }= ’ ’ ;21 $ENV{ ’ ENV’ }= ’ ’ ;22
23 # r e a d s t h e i n p u t o p t i o n s o f t h e s c r i p t24 Getop t: : Long : : Con f i gu re( ’ bundling ’ ) ;25 GetOpt ions ( " V" => \ $opt_V , " version " => \ $opt_V ,26 " h" => \ $opt_h, " help " => \ $opt_h,27 " b" => \ $opt_b, " bug" => \ $opt_b,28 " r " => \ $op t_ r , " reset " => \ $op t_ r ,29 " u" => \ $opt_u, " update " => \ $opt_u,30 " m=s" => \ $opt_m, " monitoringhost =s" => \ $opt_m,31 " H=s" => \ $opt_H, " hostname =s" => \ $opt_H,32 " G=s" => \ $opt_G, " portguid =s" => \ $opt_G,33 " l =s" => \ $op t_ l , " lid =s" => \ $op t_ l ,34 " p=s" => \ $opt_p, " portnumber =s" => \ $opt_p,35 " c=s" => \ $opt_c, " critical =s" => \ $opt_c,36 " d=s" => \ $opt_d, " ofeddir =s" => \ $opt_d,37 " n=s" => \ $opt_n, " sendnscabindir =s" => \ $opt_n,38 " g=s" => \ $opt_g, " sendnscacfgdir =s" => \ $opt_g,39 " f =s" => \ $op t_ f , " thresholdfile =s" => \ $ o p t _ f ) ;40
41 # v e r i f i e s t h e c o r r e c t n e s s o f t h e i n p u t o p t i o n s42 i f ( $opt_V) {43 p r i n t _ r e v i s i o n($PROGNAME, ’ $Revision : 0.4 $’ ) ;44 e x i t $ERRORS{ ’ OK’ } ;45 }46
47 i f ( $opt_h) {48 p r i n t _ h e l p( ) ; e x i t $ERRORS{ ’ OK’ } ;49 }50
51 i f ( ( $ o p t _ r) && ( $opt_b) ) {52 p r i n t " resetting performance ( error ) counters \ n" ;
Stefan Worm 67
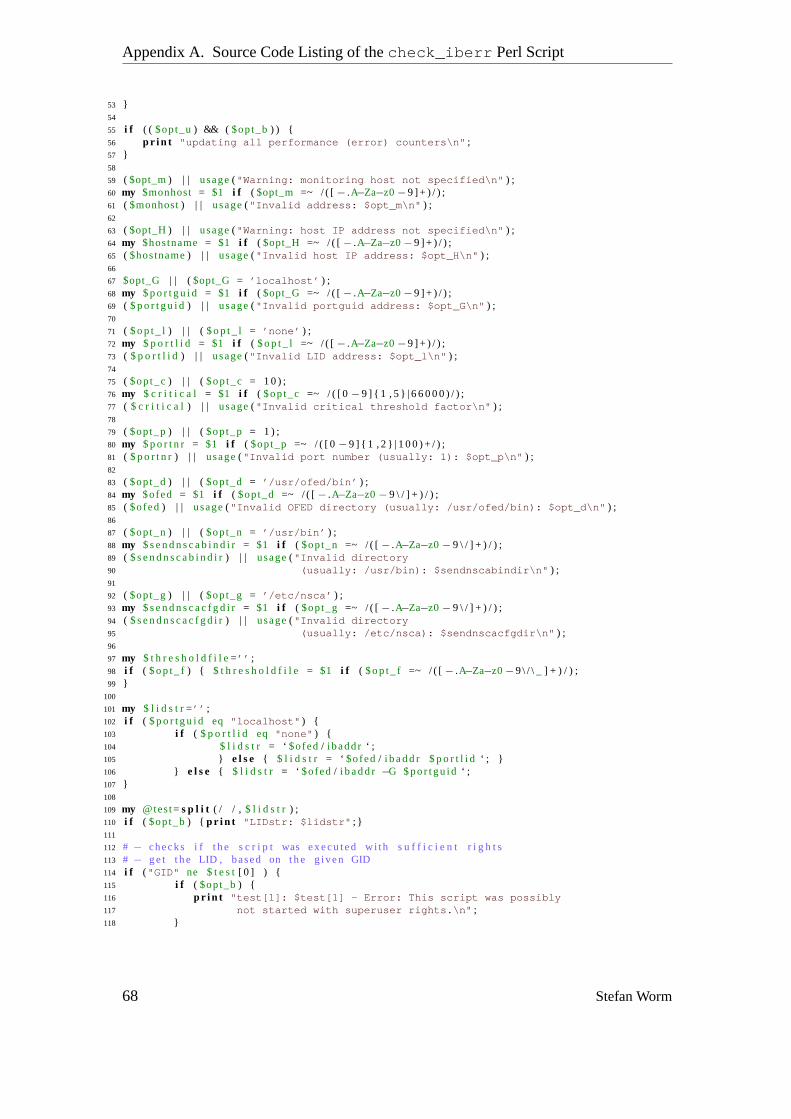
Appendix A. Source Code Listing of thecheck_iberr Perl Script
53 }54
55 i f ( ( $opt_u) && ( $opt_b) ) {56 p r i n t " updating all performance ( error ) counters \ n" ;57 }58
59 ( $opt_m) | | usage( " Warning : monitoring host not specified \ n" ) ;60 my $monhost = $1 i f ( $opt_m =~ / ( [ − .A−Za−z0−9 ] + ) / ) ;61 ( $monhost) | | usage( " Invalid address : $opt_m \ n" ) ;62
63 ( $opt_H) | | usage( " Warning : host IP address not specified \ n" ) ;64 my $hostname= $1 i f ( $opt_H =~ / ( [ − .A−Za−z0−9 ] + ) / ) ;65 ( $hostname) | | usage( " Invalid host IP address : $opt_H \ n" ) ;66
67 $opt_G | | ($opt_G = ’ localhost ’ ) ;68 my $ p o r t g u i d = $1 i f ( $opt_G =~ / ( [ − .A−Za−z0−9 ] + ) / ) ;69 ( $ p o r t g u i d) | | usage( " Invalid portguid address : $opt_G \ n" ) ;70
71 ( $ o p t _ l ) | | ( $ o p t _ l = ’ none ’ ) ;72 my $ p o r t l i d = $1 i f ( $ o p t _ l =~ / ( [ − .A−Za−z0−9 ] + ) / ) ;73 ( $ p o r t l i d ) | | usage( " Invalid LID address : $opt_l \ n" ) ;74
75 ( $op t_c) | | ( $op t_c = 1 0 ) ;76 my $ c r i t i c a l = $1 i f ( $op t_c =~ / ( [ 0 −9 ] { 1 , 5 } | 6 6 0 0 0 ) / ) ;77 ( $ c r i t i c a l ) | | usage( " Invalid critical threshold factor \ n" ) ;78
79 ( $opt_p) | | ( $opt_p = 1 ) ;80 my $ p o r t n r = $1 i f ( $opt_p =~ / ( [ 0 −9 ] { 1 , 2 } | 1 0 0 ) + / ) ;81 ( $ p o r t n r) | | usage( " Invalid port number ( usually : 1): $opt_p \ n" ) ;82
83 ( $opt_d) | | ( $opt_d = ’ / usr / ofed / bin ’ ) ;84 my $ofed = $1 i f ( $opt_d =~ / ( [ − .A−Za−z0− 9 \ / ] + ) / ) ;85 ( $o fed) | | usage( " Invalid OFED directory ( usually : / usr / ofed / bin ): $opt_d \ n" ) ;86
87 ( $opt_n) | | ( $opt_n = ’ / usr / bin ’ ) ;88 my $ s e n d n s c a b i n d i r= $1 i f ( $opt_n =~ / ( [ − .A−Za−z0− 9 \ / ] + ) / ) ;89 ( $ s e n d n s c a b i n d i r) | | usage( " Invalid directory90 ( usually : / usr / bin ): $sendnscabindir \ n" ) ;91
92 ( $opt_g) | | ( $opt_g = ’ / etc / nsca ’ ) ;93 my $ s e n d n s c a c f g d i r= $1 i f ( $opt_g =~ / ( [ − .A−Za−z0− 9 \ / ] + ) / ) ;94 ( $ s e n d n s c a c f g d i r) | | usage( " Invalid directory95 ( usually : / etc / nsca ): $sendnscacfgdir \ n" ) ;96
97 my $ t h r e s h o l d f i l e=’ ’ ;98 i f ( $ o p t _ f) { $ t h r e s h o l d f i l e = $1 i f ( $ o p t _ f =~ / ( [ − .A−Za−z0−9 \ / \ _ ] + ) / ) ;99 }
100
101 my $ l i d s t r=’ ’ ;102 i f ( $ p o r t g u i d eq " localhost " ) {103 i f ( $ p o r t l i d eq " none " ) {104 $ l i d s t r = ‘ $o fed/ i baddr ‘ ;105 } e l s e { $ l i d s t r = ‘ $o fed/ i b a d d r $ p o r t l i d ‘ ; }106 } e l s e { $ l i d s t r = ‘ $o fed/ i b a d d r −G $por tgu id ‘ ;107 }108
109 my @test= s p l i t ( / / , $ l i d s t r ) ;110 i f ( $opt_b) { p r i n t " LIDstr : $lidstr " ; }111
112 # − checks i f t h e s c r i p t was ex ec u t ed wi th s u f f i c i e n t r i g h t s113 # − g e t t h e LID , based on t h e g iven GID114 i f ( " GID" ne $ t e s t[ 0 ] ) {115 i f ( $opt_b) {116 p r i n t " test [1]: $test [1] - Error : This script was possibly117 not started with superuser rights .\ n" ;118 }
68 Stefan Worm
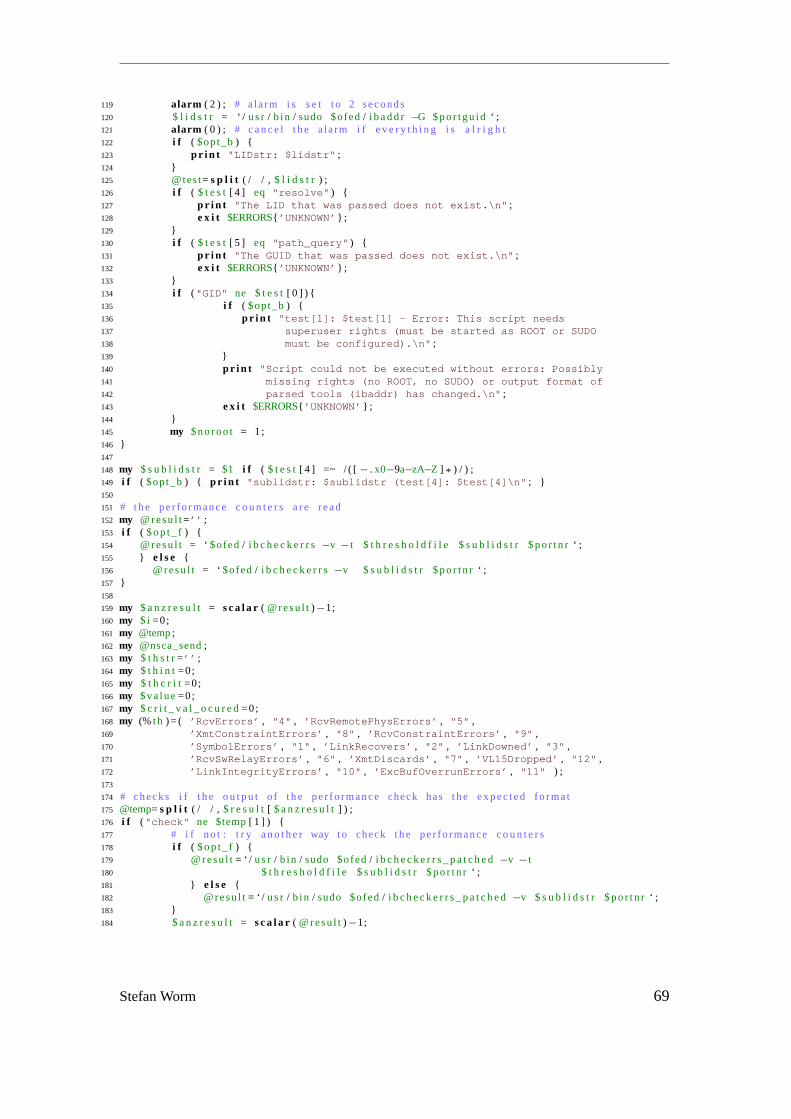
119 alarm ( 2 ) ; # a la rm i s s e t t o 2 seconds120 $ l i d s t r = ‘ / u s r / b in / sudo $ofed/ i b a d d r −G $por tgu id ‘ ;121 alarm ( 0 ) ; # c a n c e l t h e a la rm i f e v e r y t h i n g i s a l r i g h t122 i f ( $opt_b) {123 p r i n t " LIDstr : $lidstr " ;124 }125 @test= s p l i t ( / / , $ l i d s t r ) ;126 i f ( $ t e s t[ 4 ] eq " resolve " ) {127 p r i n t " The LID that was passed does not exist .\ n" ;128 e x i t $ERRORS{ ’ UNKNOWN’ } ;129 }130 i f ( $ t e s t[ 5 ] eq " path_query " ) {131 p r i n t " The GUID that was passed does not exist .\ n" ;132 e x i t $ERRORS{ ’ UNKNOWN’ } ;133 }134 i f ( " GID" ne $ t e s t[ 0 ] ) {135 i f ( $opt_b) {136 p r i n t " test [1]: $test [1] - Error : This script needs137 superuser rights ( must be started as ROOTor SUDO138 must be configured ).\ n" ;139 }140 p r i n t " Script could not be executed without errors : Possibly141 missing rights ( no ROOT, no SUDO) or output format of142 parsed tools ( ibaddr ) has changed .\ n" ;143 e x i t $ERRORS{ ’ UNKNOWN’ } ;144 }145 my $no roo t = 1 ;146 }147
148 my $ s u b l i d s t r = $1 i f ( $ t e s t[ 4 ] =~ / ( [ − . x0−9a−zA−Z ] * ) / ) ;149 i f ( $opt_b) { p r i n t " sublidstr : $sublidstr ( test [4]: $test [4]\ n" ; }150
151 # t h e per fo rmance c o u n t e r s a r e read152 my @resu l t=’ ’ ;153 i f ( $ o p t _ f) {154 @resu l t = ‘ $o fed/ i b c h e c k e r r s−v − t $ t h r e s h o l d f i l e $ s u b l i d s t r $ p o r t n r ‘ ;155 } e l s e {156 @resu l t = ‘ $o fed/ i b c h e c k e r r s−v $ s u b l i d s t r $ p o r t n r ‘ ;157 }158
159 my $ a n z r e s u l t = s c a l a r ( @resu l t)−1;160 my $ i =0;161 my @temp;162 my @nsca_send;163 my $ t h s t r=’ ’ ;164 my $ t h i n t =0;165 my $ t h c r i t =0;166 my $va lue=0;167 my $ c r i t _ v a l _ o c u r e d=0;168 my (%t h ) = ( ’ RcvErrors ’ , " 4" , ’ RcvRemotePhysErrors ’ , " 5" ,169 ’ XmtConstraintErrors ’ , " 8" , ’ RcvConstraintErrors ’ , " 9" ,170 ’ SymbolErrors ’ , " 1" , ’ LinkRecovers ’ , " 2" , ’ LinkDowned ’ , " 3" ,171 ’ RcvSwRelayErrors ’ , " 6" , ’ XmtDiscards ’ , " 7" , ’ VL15Dropped ’ , " 12" ,172 ’ LinkIntegrityErrors ’ , " 10" , ’ ExcBufOverrunErrors ’ , " 11" ) ;173
174 # checks i f t h e o u t p u t o f t h e per fo rmance check has t h e ex pe c t ed fo rma t175 @temp= s p l i t ( / / , $ r e s u l t[ $ a n z r e s u l t] ) ;176 i f ( " check " ne $temp[ 1 ] ) {177 # i f no t : t r y a n o t h e r way t o check t h e per fo rmance c o u n t e r s178 i f ( $ o p t _ f) {179 @resu l t= ‘ / u s r / b in / sudo $ofed/ i b c h e c k e r r s _ p a t c h e d−v − t180 $ t h r e s h o l d f i l e $ s u b l i d s t r $ p o r t n r ‘ ;181 } e l s e {182 @resu l t= ‘ / u s r / b in / sudo $ofed/ i b c h e c k e r r s _ p a t c h e d−v $ s u b l i d s t r $ p o r t n r ‘ ;183 }184 $ a n z r e s u l t = s c a l a r ( @resu l t)−1;
Stefan Worm 69
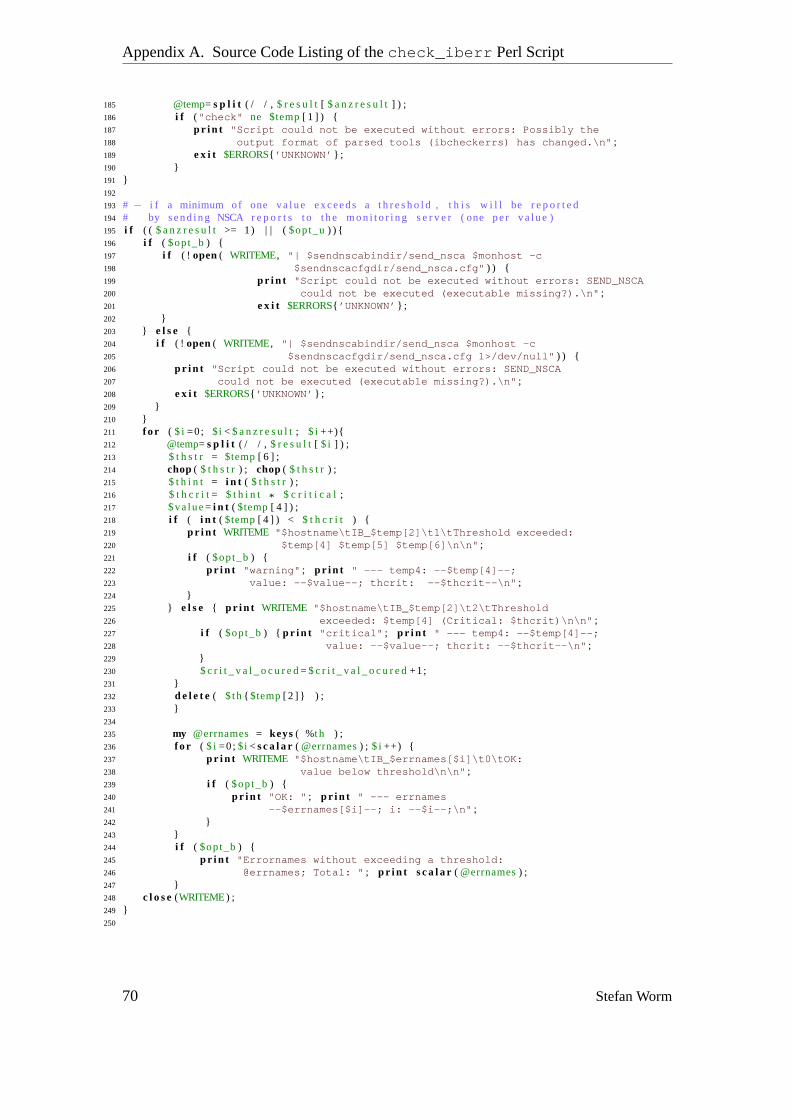
Appendix A. Source Code Listing of thecheck_iberr Perl Script
185 @temp= s p l i t ( / / , $ r e s u l t[ $ a n z r e s u l t] ) ;186 i f ( " check " ne $temp[ 1 ] ) {187 p r i n t " Script could not be executed without errors : Possibly the188 output format of parsed tools ( ibcheckerrs ) has changed .\ n" ;189 e x i t $ERRORS{ ’ UNKNOWN’ } ;190 }191 }192
193 # − i f a minimum of one v a l u e exceeds a t h r e s h o l d, t h i s w i l l be r e p o r t e d194 # by send ing NSCA r e p o r t s t o t h e m o n i t o r i n g s e r v e r ( one per v a l u e)195 i f ( ( $ a n z r e s u l t >= 1) | | ($opt_u) ) {196 i f ( $opt_b) {197 i f ( ! open( WRITEME, " | $sendnscabindir / send_nsca $monhost - c198 $sendnscacfgdir / send_nsca . cfg " ) ) {199 p r i n t " Script could not be executed without errors : SEND_NSCA200 could not be executed ( executable missing ?).\ n" ;201 e x i t $ERRORS{ ’ UNKNOWN’ } ;202 }203 } e l s e {204 i f ( ! open( WRITEME, " | $sendnscabindir / send_nsca $monhost - c205 $sendnscacfgdir / send_nsca . cfg 1>/ dev / null " ) ) {206 p r i n t " Script could not be executed without errors : SEND_NSCA207 could not be executed ( executable missing ?).\ n" ;208 e x i t $ERRORS{ ’ UNKNOWN’ } ;209 }210 }211 f o r ( $ i =0; $ i < $ a n z r e s u l t; $ i ++){212 @temp= s p l i t ( / / , $ r e s u l t[ $ i ] ) ;213 $ t h s t r = $temp[ 6 ] ;214 chop( $ t h s t r ) ; chop( $ t h s t r ) ;215 $ t h i n t = i n t ( $ t h s t r ) ;216 $ t h c r i t= $ t h i n t * $ c r i t i c a l ;217 $va lue= i n t ( $temp[ 4 ] ) ;218 i f ( i n t ( $temp[ 4 ] ) < $ t h c r i t ) {219 p r i n t WRITEME " $hostname \ tIB_$temp [2]\ t1 \ tThreshold exceeded :220 $temp [4] $temp [5] $temp [6]\ n\ n" ;221 i f ( $opt_b) {222 p r i n t " warning " ; p r i n t " --- temp4 : -- $temp [4]--;223 value : -- $value --; thcrit : -- $thcrit --\ n" ;224 }225 } e l s e { p r i n t WRITEME " $hostname \ tIB_$temp [2]\ t2 \ tThreshold226 exceeded : $temp [4] ( Critical : $thcrit )\ n\ n" ;227 i f ( $opt_b) { p r i n t " critical " ; p r i n t " --- temp4 : -- $temp [4]--;228 value : -- $value --; thcrit : -- $thcrit --\ n" ;229 }230 $ c r i t _ v a l _ o c u r e d= $ c r i t _ v a l _ o c u r e d+1;231 }232 d e l e t e( $ th{ $temp[ 2 ] } ) ;233 }234
235 my @errnames= keys( %t h ) ;236 f o r ( $ i =0; $ i < s c a l a r ( @errnames) ; $ i ++) {237 p r i n t WRITEME " $hostname \ tIB_$errnames [ $i ]\ t0 \ tOK:238 value below threshold \ n\ n" ;239 i f ( $opt_b) {240 p r i n t " OK: " ; p r i n t " --- errnames241 -- $errnames [ $i ]--; i : -- $i --;\ n" ;242 }243 }244 i f ( $opt_b) {245 p r i n t " Errornames without exceeding a threshold :246 @errnames ; Total : " ; p r i n t s c a l a r ( @errnames) ;247 }248 c l o s e(WRITEME) ;249 }250
70 Stefan Worm
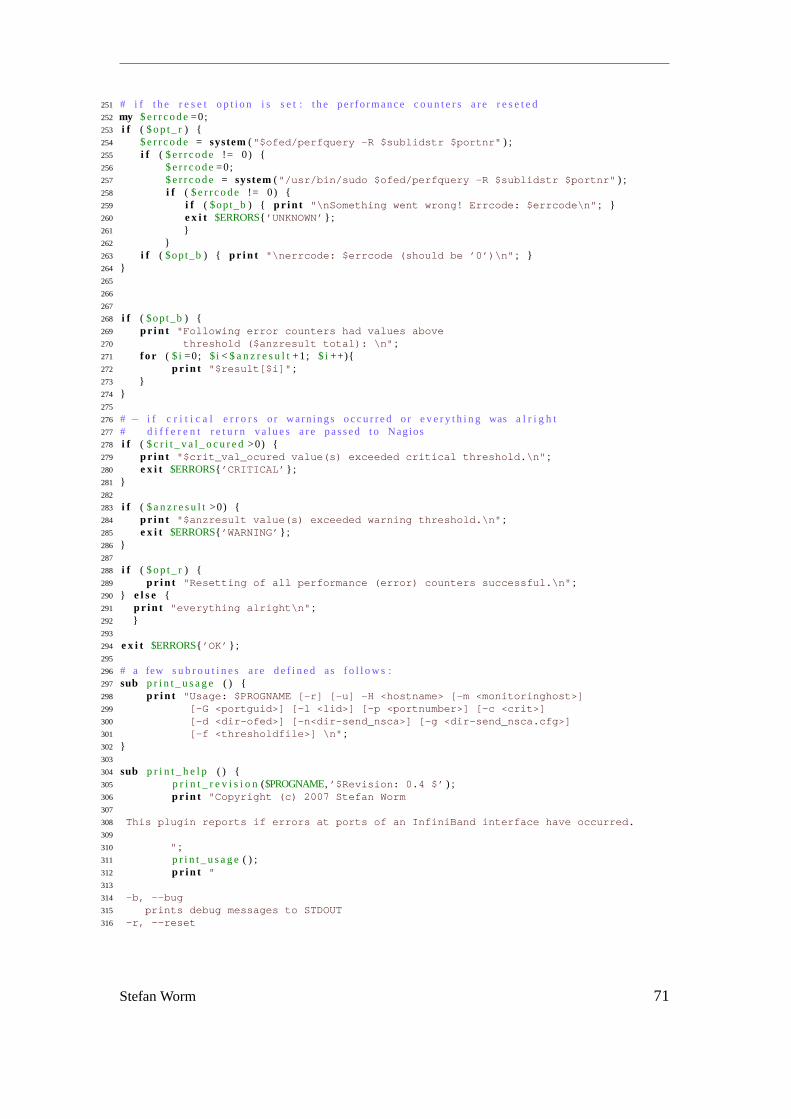
251 # i f t h e r e s e t o p t i o n i s s e t : t h e per fo rmance c o u n t e r s a r e r e s e t e d252 my $ e r r c o d e=0;253 i f ( $ o p t _ r) {254 $ e r r c o d e = system( " $ofed / perfquery - R $sublidstr $portnr " ) ;255 i f ( $ e r r c o d e != 0) {256 $ e r r c o d e=0;257 $ e r r c o d e = system( " / usr / bin / sudo $ofed / perfquery - R $sublidstr $portnr " ) ;258 i f ( $ e r r c o d e != 0) {259 i f ( $opt_b) { p r i n t " \ nSomething went wrong ! Errcode : $errcode \ n" ; }260 e x i t $ERRORS{ ’ UNKNOWN’ } ;261 }262 }263 i f ( $opt_b) { p r i n t " \ nerrcode : $errcode ( should be ’0’)\ n" ; }264 }265
266
267
268 i f ( $opt_b) {269 p r i n t " Following error counters had values above270 threshold ( $anzresult total ): \ n" ;271 f o r ( $ i =0; $ i < $ a n z r e s u l t+1; $ i ++){272 p r i n t " $result [ $i ] " ;273 }274 }275
276 # − i f c r i t i c a l e r r o r s or warn ings o c c u r r e d or e v e r y t h i n g was a l r i g h t277 # d i f f e r e n t r e t u r n v a l u e s a r e passed t o Nagios278 i f ( $ c r i t _ v a l _ o c u r e d>0) {279 p r i n t " $crit_val_ocured value ( s) exceeded critical threshold .\ n" ;280 e x i t $ERRORS{ ’ CRITICAL ’ } ;281 }282
283 i f ( $ a n z r e s u l t>0) {284 p r i n t " $anzresult value ( s) exceeded warning threshold .\ n" ;285 e x i t $ERRORS{ ’ WARNING’ } ;286 }287
288 i f ( $ o p t _ r) {289 p r i n t " Resetting of all performance ( error ) counters successful .\ n" ;290 } e l s e {291 p r i n t " everything alright \ n" ;292 }293
294 e x i t $ERRORS{ ’ OK’ } ;295
296 # a few s u b r o u t i n e s a r e d e f i n e d as f o l l o w s :297 sub p r i n t _ u s a g e ( ) {298 p r i n t " Usage: $PROGNAME[- r ] [- u] - H <hostname > [- m <monitoringhost >]299 [- G <portguid >] [- l <lid >] [- p <portnumber >] [- c <crit >]300 [- d <dir - ofed >] [- n<dir - send_nsca >] [- g <dir - send_nsca . cfg >]301 [- f <thresholdfile >] \ n" ;302 }303
304 sub p r i n t _ h e l p ( ) {305 p r i n t _ r e v i s i o n($PROGNAME, ’ $Revision : 0.4 $’ ) ;306 p r i n t " Copyright ( c) 2007 Stefan Worm307
308 This plugin reports if errors at ports of an InfiniBand interface have occurred .309
310 " ;311 p r i n t _ u s a g e( ) ;312 p r i n t "313
314 - b, -- bug315 prints debug messages to STDOUT316 - r , -- reset
Stefan Worm 71
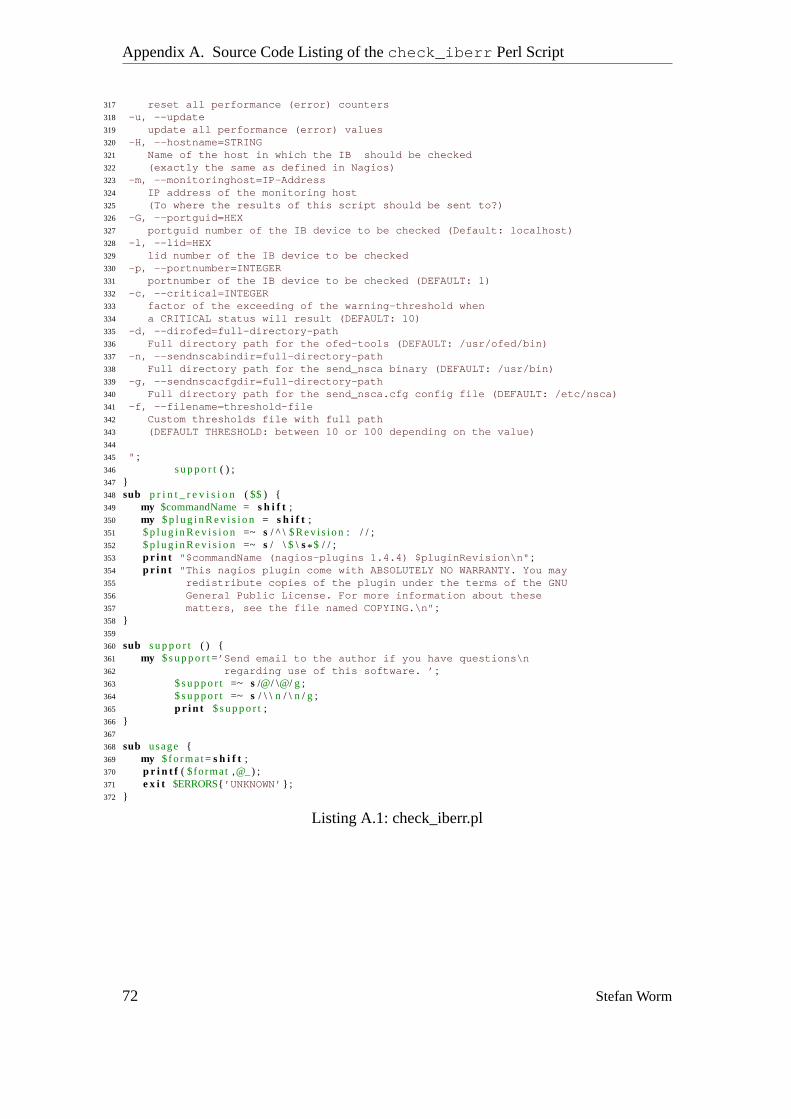
Appendix A. Source Code Listing of thecheck_iberr Perl Script
317 reset all performance ( error ) counters318 - u, -- update319 update all performance ( error ) values320 - H, -- hostname =STRING321 Name of the host in which the IB should be checked322 ( exactly the same as defined in Nagios )323 - m, -- monitoringhost =IP - Address324 IP address of the monitoring host325 ( To where the results of this script should be sent to ?)326 - G, -- portguid =HEX327 portguid number of the IB device to be checked ( Default : localhost )328 - l , -- lid =HEX329 lid number of the IB device to be checked330 - p, -- portnumber =INTEGER331 portnumber of the IB device to be checked ( DEFAULT: 1)332 - c, -- critical =INTEGER333 factor of the exceeding of the warning - threshold when334 a CRITICAL status will result ( DEFAULT: 10)335 - d, -- dirofed =full - directory - path336 Full directory path for the ofed - tools ( DEFAULT: / usr / ofed / bin )337 - n, -- sendnscabindir =full - directory - path338 Full directory path for the send_nsca binary ( DEFAULT: / usr / bin )339 - g, -- sendnscacfgdir =full - directory - path340 Full directory path for the send_nsca . cfg config file ( DEFAULT: / etc / nsca )341 - f , -- filename =threshold - file342 Custom thresholds file with full path343 ( DEFAULT THRESHOLD: between 10 or 100 depending on the value )344
345 " ;346 s u p p o r t( ) ;347 }348 sub p r i n t _ r e v i s i o n ( $$) {349 my $commandName= s h i f t ;350 my $ p l u g i n R e v i s i o n = s h i f t ;351 $ p l u g i n R e v i s i o n =~ s / ^ \ $Rev i s i on: / / ;352 $ p l u g i n R e v i s i o n =~ s / \ $ \ s* $ / / ;353 p r i n t " $commandName ( nagios - plugins 1.4.4) $pluginRevision \ n" ;354 p r i n t " This nagios plugin come with ABSOLUTELYNO WARRANTY. You may355 redistribute copies of the plugin under the terms of the GNU356 General Public License . For more information about these357 matters , see the file named COPYING.\ n" ;358 }359
360 sub s u p p o r t ( ) {361 my $ s u p p o r t=’ Send email to the author if you have questions \ n362 regarding use of this software . ’ ;363 $ s u p p o r t =~ s /@/ \@/ g ;364 $ s u p p o r t =~ s / \ \ n / \ n / g ;365 p r i n t $ s u p p o r t;366 }367
368 sub usage {369 my $ fo rma t= s h i f t ;370 p r i n t f ( $ format ,@_) ;371 e x i t $ERRORS{ ’ UNKNOWN’ } ;372 }
Listing A.1: check_iberr.pl
72 Stefan Worm

B Monitoring Server and ClientConfiguration
B.1 Definition of Hosts and Services on theMonitoring Server
On the Nagios monitoring server the following configurations regarding the hosts andservices that should be monitored have to be performed to set up an exemplary moni-toring scenario, to understand the situation under which the analyses of this work weremade.
The following Nagios configuration example creates a situation in which the hostnamedc5-2should be monitored regarding its InfiniBand (IB) error counters via NagiosRemote Plugins Executor (NRPE). This is appropriate if the Nagios monitoring serveris not connected via InfiniBand with the host that should be monitored. However, if it isconnected, thecheck_iberr.pl script can also be executed directly on the Nagiosmonitoring host and the error counters check could be made directly via IB-networkwhich performs much better than the version via NRPE.
The configuration causes the error counters at the monitoring clients to be checkedevery 5 minutes and only if the state of an error counter has changed (threshold ex-ceeded) this will be (passively) reported to the Nagios server. Furthermore, every 59minutes the status of all values will be passively updated and reported to the Nagiosserver, as well as every 24 hours all error counters will be reseted.
1 d e f i n e h o s t{2 use g e n e r i c−h o s t ; − Name of h o s t t e m p l a t e t o use3 ; ( Nagios−Standard−Template)4 host_name c5−25 a l i a s Compute−5−26 a d d r e s s 1 9 2 . 1 6 8 . 1 . 5 27 check_command check−hos t−a l i v e8 p a r e n t s j a c k9 max_check_a t tempts 10
10 c h e c k _ p e r i o d 24x711 n o t i f i c a t i o n _ i n t e r v a l 12012 n o t i f i c a t i o n _ p e r i o d 24x713 n o t i f i c a t i o n _ o p t i o n s d , r14 c o n t a c t _ g r o u p s admins15 }16
17 d e f i n e s e r v i c e{18 use g e n e r i c−s e r v i c e ; − Name of s e r v i c e t e m p l a t e t o use19 ; ( Nagios−Standard−Template)20 host_name c5−221 s e r v i c e _ d e s c r i p t i o n i b e r r _ n s c a _ t r i g g e r
Stefan Worm 73
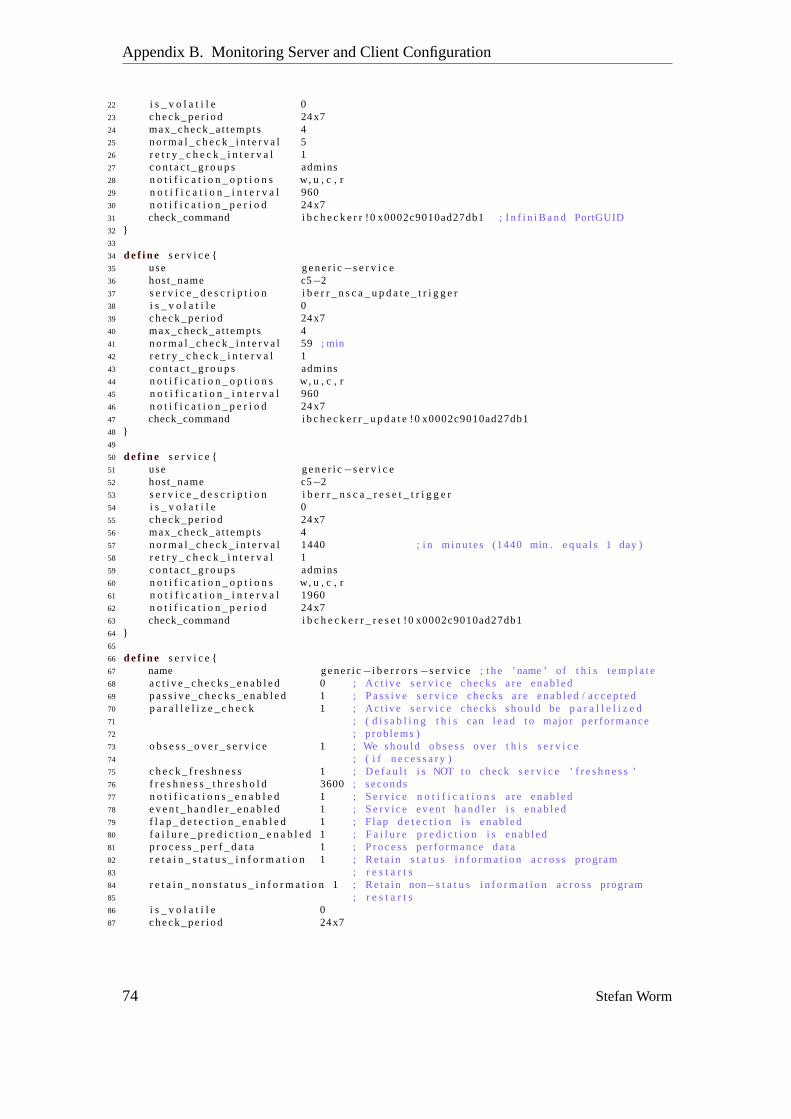
Appendix B. Monitoring Server and Client Configuration
22 i s _ v o l a t i l e 023 c h e c k _ p e r i o d 24x724 max_check_a t tempts 425 n o r m a l _ c h e c k _ i n t e r v a l 526 r e t r y _ c h e c k _ i n t e r v a l 127 c o n t a c t _ g r o u p s admins28 n o t i f i c a t i o n _ o p t i o n s w, u , c , r29 n o t i f i c a t i o n _ i n t e r v a l 96030 n o t i f i c a t i o n _ p e r i o d 24x731 check_command i b c h e c k e r r!0 x0002c9010ad27db1 ; I n f i n i B a n d PortGUID32 }33
34 d e f i n e s e r v i c e{35 use g e n e r i c−s e r v i c e36 host_name c5−237 s e r v i c e _ d e s c r i p t i o n i b e r r _ n s c a _ u p d a t e _ t r i g g e r38 i s _ v o l a t i l e 039 c h e c k _ p e r i o d 24x740 max_check_a t tempts 441 n o r m a l _ c h e c k _ i n t e r v a l 59 ; min42 r e t r y _ c h e c k _ i n t e r v a l 143 c o n t a c t _ g r o u p s admins44 n o t i f i c a t i o n _ o p t i o n s w, u , c , r45 n o t i f i c a t i o n _ i n t e r v a l 96046 n o t i f i c a t i o n _ p e r i o d 24x747 check_command i b c h e c k e r r _ u p d a t e!0 x0002c9010ad27db148 }49
50 d e f i n e s e r v i c e{51 use g e n e r i c−s e r v i c e52 host_name c5−253 s e r v i c e _ d e s c r i p t i o n i b e r r _ n s c a _ r e s e t _ t r i g g e r54 i s _ v o l a t i l e 055 c h e c k _ p e r i o d 24x756 max_check_a t tempts 457 n o r m a l _ c h e c k _ i n t e r v a l 1440 ; i n m inu tes (1440 min . e q u a l s 1 day)58 r e t r y _ c h e c k _ i n t e r v a l 159 c o n t a c t _ g r o u p s admins60 n o t i f i c a t i o n _ o p t i o n s w, u , c , r61 n o t i f i c a t i o n _ i n t e r v a l 196062 n o t i f i c a t i o n _ p e r i o d 24x763 check_command i b c h e c k e r r _ r e s e t!0 x0002c9010ad27db164 }65
66 d e f i n e s e r v i c e{67 name g e n e r i c−i b e r r o r s−s e r v i c e ; t h e ’ name’ o f t h i s t e m p l a t e68 a c t i v e _ c h e c k s _ e n a b l e d 0 ; Ac t i ve s e r v i c e checks a r e enab led69 p a s s i v e _ c h e c k s _ e n a b l e d 1 ; P a s s i v e s e r v i c e checks a r e enab led/ a c c e p t e d70 p a r a l l e l i z e _ c h e c k 1 ; Ac t i ve s e r v i c e checks shou ld be p a r a l l e l i z e d71 ; ( d i s a b l i n g t h i s can l e a d t o major pe r fo rmance72 ; p rob lems)73 o b s e s s _ o v e r _ s e r v i c e 1 ; We shou ld o b s e s s over t h i s s e r v i c e74 ; ( i f n e c e s s a r y)75 c h e c k _ f r e s h n e s s 1 ; D e f a u l t i s NOT t o check s e r v i c e ’ f r e s h n e s s’76 f r e s h n e s s _ t h r e s h o l d 3600 ; seconds77 n o t i f i c a t i o n s _ e n a b l e d 1 ; S e r v i c e n o t i f i c a t i o n s a r e enab led78 e v e n t _ h a n d l e r _ e n a b l e d 1 ; S e r v i c e e v e n t h a n d l e r i s enab led79 f l a p _ d e t e c t i o n _ e n a b l e d 1 ; F lap d e t e c t i o n i s enab led80 f a i l u r e _ p r e d i c t i o n _ e n a b l e d1 ; F a i l u r e p r e d i c t i o n i s enab led81 p r o c e s s _ p e r f _ d a t a 1 ; P r o c e s s per fo rmance d a t a82 r e t a i n _ s t a t u s _ i n f o r m a t i o n 1 ; R e t a i n s t a t u s i n f o r m a t i o n a c r o s s program83 ; r e s t a r t s84 r e t a i n _ n o n s t a t u s _ i n f o r m a t i o n1 ; R e t a i n non−s t a t u s i n f o r m a t i o n a c r o s s program85 ; r e s t a r t s86 i s _ v o l a t i l e 087 c h e c k _ p e r i o d 24x7
74 Stefan Worm
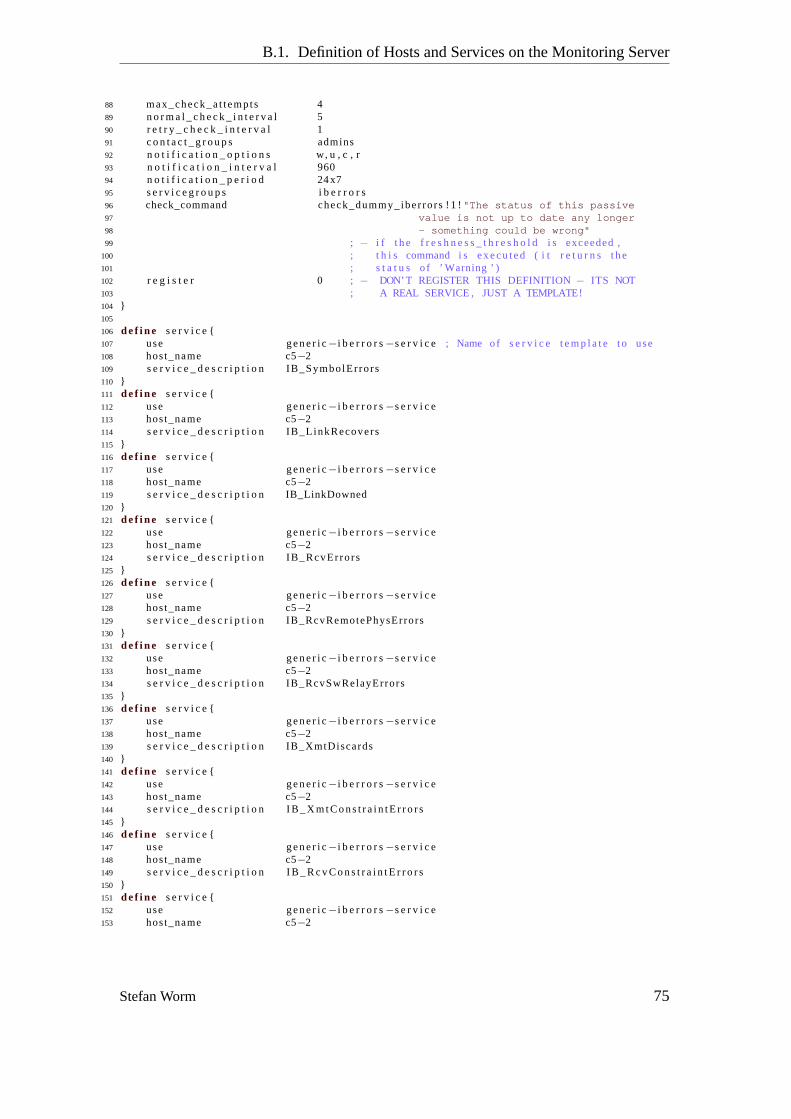
B.1. Definition of Hosts and Services on the Monitoring Server
88 max_check_a t tempts 489 n o r m a l _ c h e c k _ i n t e r v a l 590 r e t r y _ c h e c k _ i n t e r v a l 191 c o n t a c t _ g r o u p s admins92 n o t i f i c a t i o n _ o p t i o n s w, u , c , r93 n o t i f i c a t i o n _ i n t e r v a l 96094 n o t i f i c a t i o n _ p e r i o d 24x795 s e r v i c e g r o u p s i b e r r o r s96 check_command check_dummy_iber rors! 1 ! " The status of this passive97 value is not up to date any longer98 - something could be wrong "99 ; − i f t h e f r e s h n e s s _ t h r e s h o l di s exceeded,
100 ; t h i s command i s ex ec u t ed ( i t r e t u r n s t h e101 ; s t a t u s o f ’ Warning’ )102 r e g i s t e r 0 ; − DON’ T REGISTER THIS DEFINITION − ITS NOT103 ; A REAL SERVICE, JUST A TEMPLATE!104 }105
106 d e f i n e s e r v i c e{107 use g e n e r i c−i b e r r o r s−s e r v i c e ; Name of s e r v i c e t e m p l a t e t o use108 host_name c5−2109 s e r v i c e _ d e s c r i p t i o n IB_SymbolEr rors110 }111 d e f i n e s e r v i c e{112 use g e n e r i c−i b e r r o r s−s e r v i c e113 host_name c5−2114 s e r v i c e _ d e s c r i p t i o n IB_L inkRecovers115 }116 d e f i n e s e r v i c e{117 use g e n e r i c−i b e r r o r s−s e r v i c e118 host_name c5−2119 s e r v i c e _ d e s c r i p t i o n IB_LinkDowned120 }121 d e f i n e s e r v i c e{122 use g e n e r i c−i b e r r o r s−s e r v i c e123 host_name c5−2124 s e r v i c e _ d e s c r i p t i o n IB_RcvEr ro rs125 }126 d e f i n e s e r v i c e{127 use g e n e r i c−i b e r r o r s−s e r v i c e128 host_name c5−2129 s e r v i c e _ d e s c r i p t i o n IB_RcvRemotePhysErrors130 }131 d e f i n e s e r v i c e{132 use g e n e r i c−i b e r r o r s−s e r v i c e133 host_name c5−2134 s e r v i c e _ d e s c r i p t i o n IB_RcvSwRelayErrors135 }136 d e f i n e s e r v i c e{137 use g e n e r i c−i b e r r o r s−s e r v i c e138 host_name c5−2139 s e r v i c e _ d e s c r i p t i o n IB_XmtDiscards140 }141 d e f i n e s e r v i c e{142 use g e n e r i c−i b e r r o r s−s e r v i c e143 host_name c5−2144 s e r v i c e _ d e s c r i p t i o n I B _ X m t C o n s t r a i n t E r r o r s145 }146 d e f i n e s e r v i c e{147 use g e n e r i c−i b e r r o r s−s e r v i c e148 host_name c5−2149 s e r v i c e _ d e s c r i p t i o n I B _ R c v C o n s t r a i n t E r r o r s150 }151 d e f i n e s e r v i c e{152 use g e n e r i c−i b e r r o r s−s e r v i c e153 host_name c5−2
Stefan Worm 75
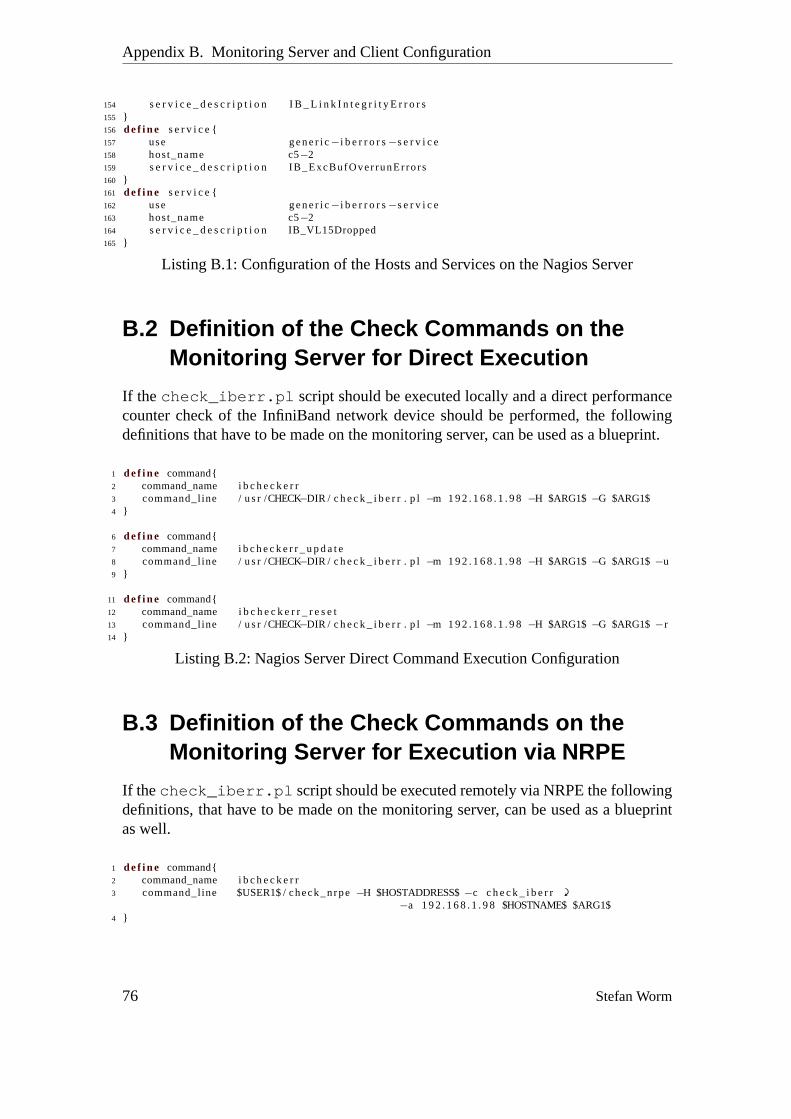
Appendix B. Monitoring Server and Client Configuration
154 s e r v i c e _ d e s c r i p t i o n I B _ L i n k I n t e g r i t y E r r o r s155 }156 d e f i n e s e r v i c e{157 use g e n e r i c−i b e r r o r s−s e r v i c e158 host_name c5−2159 s e r v i c e _ d e s c r i p t i o n IB_ExcBufOver runEr ro rs160 }161 d e f i n e s e r v i c e{162 use g e n e r i c−i b e r r o r s−s e r v i c e163 host_name c5−2164 s e r v i c e _ d e s c r i p t i o n IB_VL15Dropped165 }
Listing B.1:Configuration of the Hosts and Services on the Nagios Server
B.2 Definition of the Check Commands on theMonitoring Server for Direct Execution
If the check_iberr.pl script should be executed locally and a direct performancecounter check of the InfiniBand network device should be performed, the followingdefinitions that have to be made on the monitoring server, can be used as a blueprint.
1 d e f i n e command{2 command_name i b c h e c k e r r3 command_l ine / u s r /CHECK−DIR / c h e c k _ i b e r r. p l −m 1 9 2 . 1 6 8 . 1 . 9 8−H $ARG1$−G $ARG1$4 }
6 d e f i n e command{7 command_name i b c h e c k e r r _ u p d a t e8 command_l ine / u s r /CHECK−DIR / c h e c k _ i b e r r. p l −m 1 9 2 . 1 6 8 . 1 . 9 8−H $ARG1$−G $ARG1$−u9 }
11 d e f i n e command{12 command_name i b c h e c k e r r _ r e s e t13 command_l ine / u s r /CHECK−DIR / c h e c k _ i b e r r. p l −m 1 9 2 . 1 6 8 . 1 . 9 8−H $ARG1$−G $ARG1$−r14 }
Listing B.2:Nagios Server Direct Command Execution Configuration
B.3 Definition of the Check Commands on theMonitoring Server for Execution via NRPE
If the check_iberr.pl script should be executed remotely via NRPE the followingdefinitions, that have to be made on the monitoring server, can be used as a blueprintas well.
1 d e f i n e command{2 command_name i b c h e c k e r r3 command_l ine $USER1$/ check_nrpe−H $HOSTADDRESS$−c c h e c k _ i b e r r '
−a 1 9 2 . 1 6 8 . 1 . 9 8$HOSTNAME$ $ARG1$4 }
76 Stefan Worm

B.4. Definitions on the Monitoring Client
6 d e f i n e command{7 command_name i b c h e c k e r r _ u p d a t e8 command_l ine $USER1$/ check_nrpe−H $HOSTADDRESS$−c c h e c k _ i b e r r _ u p d a t e'
−a 1 9 2 . 1 6 8 . 1 . 9 8$HOSTNAME$ $ARG1$9 }
11 d e f i n e command{12 command_name i b c h e c k e r r _ r e s e t13 command_l ine $USER1$/ check_nrpe−H $HOSTADDRESS$−c c h e c k _ i b e r r _ r e s e t'
−a 1 9 2 . 1 6 8 . 1 . 9 8$HOSTNAME$ $ARG1$14 }
Listing B.3:Nagios Server Command Execution Configuration via NRPE
B.4 Definitions on the Monitoring Client
The configuration of the Nagios Remote Plugin Executor (NRPE) on the host thatshould be monitored is exemplary presented for the option that thecheck_iberr.plscript should be executed locally on this host. Of course, the path usually has to bechanged regarding where thecheck_iberr.pl script is located on the specific host.
If one or more of the several options of thecheck_iberr.pl script are used, theyshould be added at this point. The program parameters that are expected below, are theones that were passed by the command definition on the monitoring server to the NRPE(refer to SectionB.3 on the facing page).
1 command[ c h e c k _ i b e r r] = / u s r /CHECK−DIR / c h e c k _ i b e r r. p l '−m $ARG1$−H $ARG2$−G $ARG3$
2 command[ c h e c k _ i b e r r _ u p d a t e] = / u s r /CHECK−DIR / c h e c k _ i b e r r. p l '−m $ARG1$−H $ARG2$−G $ARG3$−u
3 command[ c h e c k _ i b e r r _ r e s e t] = / u s r /CHECK−DIR / c h e c k _ i b e r r. p l '−m $ARG1$−H $ARG2$−G $ARG3$−r
Listing B.4:NRPE Monitoring Client Configuration
Stefan Worm 77


Bibliography
[Bal05] Tarus Balog: Enterprise-Wide Network Management with OpenNMS.O’Reilly SysAdmin, 2005.URL http://www.oreillynet.com/pub/a/sysadmin/2005/09/08/opennms.html [p. 33]
[Boo03] Charles Bookman:Linux Clustering: Building and Maintaining LinuxClusters. New Riders Publishing, Indianapolis, 2003. ISBN 978-1-57870-274-9. [p. 2]
[Clo53] Charles Clos:A study of non-blocking switching networks. Bell SystemTechnical Journal, Volume 32 (Number 2), March 1953:pp. 406–424. [p.23]
[CS92] Dah Ming Chiu and Ram Sudama:Network Monitoring Explained: De-sign and Application. Ellis Horwood, Chichester, UK, 1992. ISBN 0-13-614710-0. [p. 4, 16]
[CWP03] B. Chandrasekaran, Pete Wyckoff and Dhabaleswar K. Panda:MIBA: AMicro-Benchmark Suite for Evaluating InfiniBand Architecture Implemen-tations. Lecture Notes in Computer Science - Computer Performance, Vol-ume 2497, Springer, Berlin / Heidelberg, 2003:pp. 29–46. ISSN 302-9743.(ISBN 978-3-540-40814-7).URL http://dx.doi.org/10.1007/b12028 [p. 39]
[CWSC01] Stephen Chan, Cary Whitney, Iwona Sakreja and Shane Canon:Monitor-ing Tools for Larger Sites. In: ;login: The Magazine ofUSENIX &SAGE, Volume 26, Number 5, August 2001.URL http://www.usenix.org/publications/login/2001-08/pdfs/chan.pdf [p. 7, 32]
[Dib02] Peter C. Dibble:Real-Time Java Platform Programming. Prentice Hall,Palo Alto, CA, 2002. ISBN 978-0-13-028261-3. [p. 2]
[Fri02] Æleen Frisch:Essential System Administration. O’Reilly, Sebastopel, CA,2002. ISBN 0-596-00343-9. [p. 34]
[Gal06] Ethan Galstad:Nagios Version 2.x Documentation, 2006.URL http://nagios.sourceforge.net/docs/2_0/ [p. 34]
Stefan Worm 79

Bibliography
[GBC+02] X. Gonze, J.-M. Beuken, R. Caracas, F. Detraux, M. Fuchs, G.-M. Rig-nanese, L. Sindic, M. Verstraete, G. Zerah, F. Jollet, M. Torrent, A. Roy,M. Mikami, Ph. Ghosez, J.-Y. Raty and D.C. Allan:First-principlescomputation of material properties : the ABINIT software project.Computational Materials Science 25, 478–492, 2002.URL http://dx.doi.org/10.1016/S0927-0256(02)00325-7 [p. 23, 47]
[Got02] Ellen Gottesdiener:Requirements by Collaboration: Workshops for Defin-ing Needs. Addison Wesley Professional, 2002. ISBN 978-0-201-78606-4.[p. 25]
[GSP05] Susan L. Graham, Marc Snir and Cynthia A. Patterson, editors:Getting upto speed: The future of supercomputing. The National Academies Pressof the National Research Council, Washington, D.C., 2005. ISBN 0-309-09502-6. [p. 2, 3]
[GWB+04] Michael Gerndt, Roland Wismüller, Zoltán Balaton, Gábor Gombás,Péter Kacsuk, Zsolt Németh, Norbert Podhorszki, Hong-Linh Truong,Thomas Fahringer, Marian Bubak, Erwin Laure and Thomas Margalef:Performance Tools for the Grid: State of the Art and Future. WorkingGroup on Automatic Performance Analysis: Real Tools (APART), 2004.URL http://urza.lpds.sztaki.hu/~zsnemeth/apart/repository/gridtools.pdf [p. 34]
[HA94] Heinz-Gerd Hegering and Sebastian Abeck:Integrated network and sys-tem management. Addison-Wesley, Wokingham, UK, 1994. ISBN 0-201-59377-7. [p. 3]
[Hal00] Eric A. Hall: Internet Core Protocols. O’Reilly, Sebastopel, CA, 2000.ISBN 1-56592-572-6. [p. 11]
[HAN99] Heinz-Gerd Hegering, Sebastian Abeck and Bernhard Neumair:Inte-grated Management of Networked Systems: Concepts, Architectures, andTheir Operational Application. Morgan Kaufmann, 1999. ISBN 1-55860-571-1. [p. 3, 4]
[Har03] Richard C. Harlan:Network Management with Nagios. Linux Journal,(Number 111), 2003. ISSN 1075-3583.URL http://portal.acm.org/citation.cfm?id=860378[p. 34]
[HLR] Torsten Hoefler, André Lichei and Wolfgang Rehm:Low-OverheadLogGP Parameter Assessment for Modern Interconnection Networks. TUChemnitz. presented in Long Beach, CA, USA, Mar. 2007, Accepted forpublication at the 6th International Workshop on Performance Modelling,
80 Stefan Worm

Bibliography
Evaluation, and Optimization of Parallel and Distributed Systems (PMEO-PDS) 2007 in conjunction with IEEE International Parallel & DistributedProcessing Symposium (IPDPS) 2007. [p. 54]
[Hoe05] Torsten Hoefler:Evaluation of publicly available Barrier-Algorithms andImprovement of the Barrier-Operation for large-scale Cluster-Systemswith special Attention on InfiniBand Networks. Diploma Thesis, TechnicalUniversity of Chemnitz, Faculty of Computer Science, Germany, 2005.URL http://archiv.tu-chemnitz.de/pub/2005/0073/data/diploma.pdf [p. 39]
[Inf04] InfiniBand Trade Association (IBTA):InfiniBand Architecture Specifica-tion Volume 1, Release 1.2. 2004. [p. 39, 49]
[ISO89] ISO/IEC (JTC 1) 7498-4: Information processing systems – OpenSystems Interconnection – Basic Reference Model – Part 4: Managementframework, 1989.URL http://standards.iso.org/ittf/PubliclyAvailableStandards/s014258_ISO_IEC_7498-4_1989(E).zip . [p. 4]
[ISO94] ISO/IEC (JTC 1) 7498-1: Information technology – Open SystemsInterconnection – Basic Reference Model: The Basic Model, 1994.URL http://standards.iso.org/ittf/PubliclyAvailableStandards/s020269_ISO_IEC_7498-1_1994(E).zip . [p. 4]
[JLSU87] Jeffrey Joyce, Greg Lomow, Konrad Slind and Brian Unger:Monitoringdistributed systems. ACM Transactions on Computer Systems (TOCS),Volume 5 (Number 2), ACM Press, New York, 1987:pp. 121–150. ISSN0734-2071.URL http://doi.acm.org/10.1145/13677.22723 [p. 7]
[Kan02] Stephan H. Kan:Metrics and Models in Software Quality Engineering,Second Edition. Addison Wesley Professional, 2002. ISBN 978-0-201-72915-3. [p. 18]
[Lan94] Alwyn Langsford: OSI Management Model and Standards. In MorrisSloman, editor,Network and distributed systems management, Addison-Wesley, Wokingham, UK. 1994. ISBN 0-201-62745-0, pp. 69–93. [p.4]
[LH02] Thomas A. Limoncelli and Christine Hogan:The Practice of System andNetwork Administration. Addison-Wesley – Pearson Education, 2002.ISBN 0-201-70271-1. [p. 7, 16, 21]
[Lib00] Hastings Maboshe Libati:Network Traffic Analysis and Security Monitor-ing to Detect Intrusions. Dissertation, Friedrich-Schiller-University Jena,School for Mathematics and Computer Science, Germany, 2000. [p. 4]
Stefan Worm 81
Bibliography
[LJ93] Rubin H. Landau and Paul J. Fink Jr.:A Scientist’s and Engeneer’s Guideto Workstations and Supercomputers: coping with Unix, RISC, Vectors,and programming. John Wiley & Sons, New York, 1993. ISBN 0-471-53271-1. [p. 1]
[LNC98] Soung C. Liew, Ming-Hung Ng and Cathy W. Chan:Blocking and non-blocking multirate Clos switching networks. IEEE/ACM Transactions onNetworking (TON), Volume 6 (Number 3), IEEE Press, Piscataway, NJ,1998:pp. 307–318. ISSN 1063-6692.URL http://dx.doi.org/10.1109/90.700894 [p. 23]
[Luc04] Robert W. Lucke:Building Clustered Linux Systems. Prentice Hall, UpperSaddle River, NJ, 2004. ISBN 978-0-13-144853-7. [p. 2]
[man05] "manage":Merriam-Webster Online Dictionary, 2005. (05 Oct. 2006).URL http://www.merriam-webster.com [p. 3]
[MAS+03] James McGovern, Scott W. Ambler, Michael E. Stevens, James Linn,Vikas Sharan and Elias K. Jo:A Practical Guide to Enterprise Archi-tecture. Prentice Hall, Upper Saddle River, NJ, 2003. ISBN 978-0-13-141275-0. [p. 21]
[MCC04] Matthew L. Massie, Brent N. Chun and David E. Culler:The GangliaDistributed Monitoring System: Design, Implementation, and Experience.IN: Parallel Computing, Volume 30, Issue 7, 2004:pp. 817–840. ISSN0167-8191. (http://ganglia.info/papers/science.pdf ).URL http://dx.doi.org/10.1016/j.parco.2004.04.001[p. 33]
[MHS06] Yusef Hassan Montero and Victor Herrero-Solana:Improving Tag-Cloudsas Visual Information Retrieval Interfaces. To appear in: InternationalConference on Multidisciplinary Information Sciences and Technologies(InSciT), Mérida, Spain, 2006.URL http://www.nosolousabilidad.com/hassan/improving_tagclouds.pdf [p. 21]
[MS01] Douglas R. Mauro and Kevin J. Schmidt:Essential SNMP. O’Reilly, Se-bastopel, CA, 2001. ISBN 0-596-00020-0. [p. 11]
[MSS94] Masoud Mansouri-Samani and Morris Sloman:Monitoring DistributedSystems. In Morris Sloman, editor,Network and distributed systems man-agement, Addison-Wesley, Wokingham, UK. 1994. ISBN 0-201-62745-0,pp. 303–347. [p. 8, 9, 19]
[Mur00] Richard Murch:Project Management: Best Practices for IT Professionals.Prentice Hall, Upper Saddle River, NJ, 2000. ISBN 978-0-13-021914-5.[p. 25]
82 Stefan Worm

Bibliography
[Neu88] Victoria Neufeldt, editor:Webster’s New World Dictionary of AmericanEnglish, Third College Edition. Webster’s New World Dictionaries - ADivision of Simon & Schuster, Inc., New York, 1988. ISBN 0-13-947169-3. [p. 1, 3, 7]
[Nie04] Jakob Nielsen:Usability engineering. Kaufmann, Amsterdam, 2004.ISBN 0-12-518406-9. [p. 21]
[O’D02] Shane O’Donnell: Network Management with OpenNMS. O’ReillyONLamp.com, 2002.URL http://www.onlamp.com/pub/a/onlamp/2002/04/18/opennms.html [p. 33]
[per05] "perform": Merriam-Webster Online Dictionary, 2005. (23 Oct. 2006).URL http://www.merriam-webster.com [p. 11]
[Pfi01] Gregory F. Pfister:Aspects of the InfiniBand Architecture. IN: IEEE Inter-national Conference on Cluster Computing, Proceedings, 2001:pp. 369–371. ISSN 0272-5428. (ISBN: 0-7695-1390-5). [p. 39]
[PKP03] Fabrizio Petrini, Darren J. Kerbyson and Scott Pakin:The Case of theMissing Supercomputer Performance: Achieving Optimal Performanceon the 8,192 Processors of ASCI Q. In SC ’03: Proceedings of the2003 ACM/IEEE conference on Supercomputing. IEEE Computer Society,Washington, DC, USA, 2003. ISBN 1-58113-695-1, p. 55. [p. 13]
[RFC81] RFC 792:Internet Control Message Protocol (ICMP), 1981.URL http://www.ietf.org/rfc/rfc792.txt [p. 11]
[sca05] "scalable":Merriam-Webster Online Dictionary, 2005. (23 Oct. 2006).URL http://www.merriam-webster.com [p. 13]
[SDA+00] Anthony Skjellum, Rossen Dimitrov, Srihari Angulari, David Lifka,George Coulouris, Putchong Uthayopas, Stephen L. Scott and Rasit Eski-cioglu: Systems Administration. In Mark Baker, editor,Cluster ComputingWhite Paper, chapter 6. 2000.URL http://arxiv.org/pdf/cs.DC/0004014 [p. 13]
[Sel00] John Sellens:System and Network Monitoring. In: ;login: TheMagazine ofUSENIX & SAGE, Volume 25, Number 3, June 2000.URL http://www.usenix.org/publications/login/2000-6/features/monitoring.html [p. 10, 32]
[SK87] Morris Sloman and Jeff Kramer:Distributed Systems and Computer Net-works. Prentice Hall, 1987. ISBN 0-13-215864-7. [p. 13]
Stefan Worm 83

Bibliography
[SKMC03] Federico D. Sacerdoti, Mason J. Katz, Matthew L. Massie andDavid E. Culler: Wide Area Cluster Monitoring with Ganglia.IN: IEEE International Conference on Cluster Computing, Proceed-ings, 2003:pp. 289–298. (http://ganglia.info/papers/Sacerdoti03Monitoring.pdf ).URL http://dx.doi.org/10.1109/CLUSTR.2003.1253327[p. 33]
[Slo05] Joseph D. Sloan:High Performance Linux Clusters with OSCAR, Rocks,openMosix, and MPI. O’Reilly, Sebastopel, CA, 2005. ISBN 0-596-00570-9. [p. 1, 2]
[Ste02] Thomas Sterling, editor:Beowulf Cluster Computing with Linux. TheMassachusetts Institute of Technology Press, 2002. ISBN 0-262-69274-0.[p. 1]
[Tan03] Andrew S. Tanenbaum:Computer Networks, Fourth Edition. PrenticeHall, Upper Saddle River, NJ, 2003. ISBN 978-0-13-066102-9. [p. 4]
[top00] The TOP500 list of the 500 most powerful commercially available com-puter systems. website, November 2000.URL http://www.top500.org/list/2000/11/200/ [p. 23]
[Wor05] Stefan Worm:Administration of Access Rights in Web Applications. Stu-dent Research Paper, Technical University of Chemnitz, Faculty of Com-puter Science, Germany, 2005.URL http://archiv.tu-chemnitz.de/pub/2005/0143/ [p.4]
84 Stefan Worm
Index
Symbolsα error,seefalse positive event classifi-
cationβ error,seefalse negative event classifi-
cation
AAbinit, 23, 47
abinip,47, 52abinis,52DFT, 47MPI, 47MVAPICH2, 47, 54OpenIB,47
absolute deviation,seemeasurementaccess point (AP),11accounting management,4active monitoring checks,seetypes of
monitoringadd-on,seeNagios add-onadministration policy,26administrator,1, 10, 15, 16Advanced Encryption Standard (AES),
seeencryption algorithmAdvanced Micro Devices,Inc. (AMD),
23agent,seeNagios Remote Plugins Ex-
ecutor (NRPE)air conditioning,28, 31alert,seemonitoring communicationAMD CPU
Athlon, 61Opteron,23
Angel Network Monitoring,seemoni-toring software (rejected)
application management,seeintegratedmanagement
Application Programming Interface (API),34
arithmetic mean,seemeasurementAssociation for Computing Machinery
(ACM), 83
Bbandwidth,seenetwork bandwidthBasic Linear Algebra Subroutines (BLAS),
23batch system,9, 27, 35benchmark
netgauge,54Beowulf,23Big Brother,seemonitoring softwareBig Sister,seemonitoring softwarebug,18
Ccapacity utilisation,35Car-Parrinello Molecular Dynamics (CPMD),
24cellular phone text message,20chassis,11, 15check_iberr script source code,67check_iberr.pl,42, 56, 63, 73Chemnitz High-Performance Linux Clus-
ter (CHiC),23Chemnitz Linux Cluster (CLiC),23
Stefan Worm 85
Index
Chemnitz University of Technology1, 23CHiC components
12x visualisation nodes,232x login nodes,232x management nodes,23530x compute nodes,238x I/O nodes,23
Clos network,23CluMon, seemonitoring software (re-
jected)cluster
capability,3, 5capacity,3, 5, 23failover,2Fault-Tolerant,2High-Availability (HA), 2High-Performance (HP),2, 23, 51High-Throughput,2Load-Balancing (LB),2
commercial monitoring softwareOpenView,seeHP OpenViewTivoli, seeIBM Tivoli
community,seeNagioscomputer error,seebugcomputing centre,11, 32, 39configuration management,4CPU,11, 13, 15, 19, 51cron,seeUnix/Linux programs
Ddaemon,10, 38Data Encryption Algorithm (DEA),see
encryption algorithmData Encryption Standard (DES),seeen-
cryption algorithmDataBase (DB),11defective temperature sensor,16Density Functional Theory (DFT),see
Abinitdepreciation (of the cluster),36df, seeUnix/Linux programsDHCP (Dynamic Host Configuration Pro-
tocol),59
1http://www.tu-chemnitz.de/
Direct Memory Access (DMA),39diskless,23dissemination of monitoring data,19, 22distributed application,13Distributed Processing System (DPS),13Domain Name Service (DNS),11Double Data Rate (DDR),seeInfiniBand
(IB) networkdouble-precision General Matrix Multi-
ply (DGEMM), 23downtime (of an application),2downtime (of the cluster),36duplex network connection,39
Ee-mail,21e-mail client,26encryption algorithm
AES (Rijndael),38DES (DEA),38Serpent,38TDES (TDEA),38Twofish,38
enterprise management,see integratedmanagement
error counters,seeInfiniBand port coun-ters
error log file,11escalation,24
horizontal,21vertical,21
escalation procedure,20Ethernet
Fast,23Gigabit,23
event classesalright/okay,15critical, 15unknown,15warning,15
event classificationtrue negative,18true positive,18
event classification error
86 Stefan Worm
Index
false negative,18false positive,18
event log file,11event monitoring,seereal-time moni-
toringExcessiveBufferOverrunErrors,seeIn-
finiBand port counterseXtensible Markup Language (XML),
33
Ffalse negative event classification,18false positive event classification,18Fast Ethernet,23fault management,4, 22fault monitoring,seereal-time monitor-
ingFault, Configuration, Accounting, Per-
formance and Security (FCAPS),4
Fault-Tolerant Cluster,2File Transfer Protocol (FTP),11fixed disk,seeHard Disc Drive (HDD)full-duplex,seeduplex network connec-
tion
GGanglia,seemonitoring softwaregateway,seeNagios Remote Plugins Ex-
ecutor (NRPE)generation of monitoring data,10, 22GFlops,23Gigabit Ethernet (GbE),23, 47Global Unique IDentifier (GUID),see
InfiniBand (IB) networkGlobus Toolkit
SweGrid Accounting System (SGAS),35
Globus Toolkit2, 35GNU, xiiGNU General Public License (GPL),see
open source softwareGraphical User Interface (GUI),21
2http://www.globus.org/
graphics card,11, 23Graphics Processing Unit (GPU),11grid software,seeGlobus ToolkitGroundWork,seemonitoring software
(rejected)groupware system,25
HHard Disc Drive (HDD),11
bad block test,29hardware,11, 12health counters,seeInfiniBand port coun-
tersheating, ventilation and air conditioning
(HVAC), seeair conditioningHigh-Availability Cluster,2High-Performance Cluster (HPC),2, 23,
51high-speed interconnect,seeInfiniBand
(IB) networkHigh-Throughput Cluster,2historical monitoring,8, 19, 21, 22horizontal escalation,21Host Channel Adapter (HCA),seeIn-
finiBand (IB) networkHP OpenView,31
Network Node Manager (NNM),31HP3 (Hewlett-Packard),31HW, seehardwareHyperText Transfer Protocol (HTTP),11
II/O nodes,seeCHiC componentsI/O server,18, 23, 28IBM Tivoli, 31
NetView,31IBM4 (International Business Machines),
23ifconfig, seeUnix/Linux programsincoming traffic,seenetwork trafficIndiana University, Bloomington5, i
3http://www.hp.com/4http://www.ibm.com/5http://www.indiana.edu/
Stefan Worm 87

Index
InfiniBand (IB) network,23, 47Double Data Rate (DDR),39Global Unique IDentifier (GUID),
42high-speed interconnect,39Host Channel Adapter (HCA),39,
57ib_mad1,49inter-server communication,39Local IDentifier (LID),42Management Datagram (MAD),49processing queue,56Remote Direct Memory Access (RDMA),
39server-I/O communication,39Single Data Rate (SDR),23, 39, 47subnet manager (SM),40
InfiniBand Architecture (IBA),39InfiniBand network benchmark,seebench-
markInfiniBand port counters
ExcessiveBufferOverrunErrors,39LinkDowned,39LinkErrorRecovery,39LinkIntegrityErrors,39RcvConstraintErrors,39RcvErrors,39RcvRemotePhysErrors,39RcvSwRelayErrors,39SymbolError,39VL15Dropped,39XmtConstraintErrors,39XmtDiscards,39
InfiniBand Trade Association (IBTA),39,81
InfiniBand transmission countersPortRcvData,39PortRcvPkts,39PortXmitData,39PortXmitPkts,39
information management,seeintegratedmanagement
inodes,27Input/Output (I/O),39
instant messages (IM),20Institute of Electrical & Electronics En-
gineers (IEEE),83integrated management,3, 5
application management,3enterprise management,3information management,3network management,3service management,3systems management,3
Intel CPUPentium III,23Xeon,47
Intelligent Platform Management Inter-face (IPMI),23, 24
Inter-Process Communication (IPC),53inter-server communication,seeInfini-
Band (IB) networkinterconnection network,2, 23International Electronic Commission (IEC),
4International Organization of Standard-
ization (ISO)6, 4International Parallel & Distributed Pro-
cessing Symposium (IPDPS),81Internet Control Message Protocol (ICMP),
11Internet Message Access Protocol (IMAP),
11Internet Protocol over InfiniBand (IPoIB),
50interpreter,seePerl interpreteriptraf, seenetwork monitoring,62ISO/IEC 7498-1,4ISO/IEC 7498-4,4
JJava,seeprogramming language
Llatency,seenetwork latencyLemon,seemonitoring software (rejected)library, seeNagios
6http://www.iso.org/
88 Stefan Worm

Index
limitations of root permissionsSELinux,42setuid,42sudo,42
LinkDowned,seeInfiniBand port coun-ters
LinkErrorRecovery,seeInfiniBand portcounters
LinkIntegrityErrors,seeInfiniBand portcounters
Linux, 23, 24, 27, 47, 61Linux distribution
Scientific Linux,47, 61lm_sensors,24, 51Load-Balancing Cluster,2, 14Local Area Network (LAN),xiiiLocal IDentifier (LID), seeInfiniBand
(IB) networklocal monitoring,10, 22log file
error,11event,11
login, seeUnix/Linux programslogin nodes,seeCHiC componentslogin server,23, 28
MMail User Agent (MUA),seee-mail clientmainboard,11management,3, 16, 22management (ISO/OSI)
accounting management,4configuration management,4fault management,4performance management,4security management,4
MAnagement Datagram (MAD),seeIn-finiBand (IB) network
management network,28management nodes,seeCHiC compo-
nentsmeasurement
absolute deviation,54arithmetic mean,54
median,54outliers,54
Megware7, 23memory,seeRAMMessage Passing Interface (MPI),24, 47,
54Midas,seemonitoring software (rejected)Mon,seemonitoring software (rejected)monitoring,7, 22
event,7fault, 7historical,8, 19performance,8real-time,7, 19to monitor,7
monitoring communicationalert,10polling, 10probe,10pulling, 10pushing,10trap,10
monitoring model,9, 22Dissemination,9Generation,9Presentation,9Processing,9
monitoring policy,10monitoring reports,19monitoring software
Big Brother,24, 32Big Sister,32Ganglia,33Nagios,34OpenNMS,33
monitoring software (rejected)Angel Network Monitoring,35CluMon,35GroundWork,35Lemon,35Midas,35Mon, 35
7http://www.megware.de/
Stefan Worm 89
Index
Munin, 35Performance Co-Pilot,35PIKT, 35Spong,35Supermon,35Zenoss,35
monitoring suite,seemonitoring systemmonitoring system,iv, 8, 10, 11, 13, 15,
18, 20, 22, 26, 29Multi Router Traffic Grapher (MRTG)8,
34multicast,33Munin,seemonitoring software (rejected)MVAPICH2, seeAbinit
NNagios,34
community,41Perl plugin library,41plugin wrapper,41tutorials,41
Nagios add-onNagios Remote Plugins Executor (NRPE),
48, 60Nagios Service Check Acceptor (NSCA),
38, 61Nagios plugins
check_load,51check_log,51check_mem,51check_ntp,51check_ping,51check_procs,51check_sensors,51check_ssh,51check_tcp,51
Nagios status codesCritical, 41OK, 41Unknown,41Warning,41
netgauge,54
8http://oss.oetiker.ch/mrtg/
NetView,seeIBM Tivolinetwork,seeinterconnection networknetwork bandwidth,39network benchmark,seebenchmark
netgauge,54network connection,16network controller,11network driver
GbE,53IPoIB, 53
Network File System (NFS),11Network Interface Card (NIC),57network latency,39network management,seeintegrated man-
agementNetwork Management Software (NMS),
33network monitoring
iptraf9, 59Network Node Manager (NNM),seeHP
OpenViewnetwork switch,11, 16, 28network throughput,54Network Time Protocol (NTP),26, 51network traffic,11
in, 59out,59
NSCA communication encryption,seeencryption algorithm
Oopen source software
Big Sister,32Nagios,34OpenNMS,33
Open Systems Interconnection (OSI),4OpenFabrics Alliance10, 42OpenFabrics Enterprise Distribution (OFED),
42OpenIB,47OpenNMS,seemonitoring softwareOpenView,seeHP OpenView
9http://iptraf.seul.org/10http://www.openfabrics.org/
90 Stefan Worm

Index
Operating System (OS),11, 24Opteron CPU,23OSI Management functional areas,see
management (ISO/OSI)Out-Of-Band (OOB),48outgoing traffic,seenetwork traffic
PParadyn,36passive monitoring checks,seetypes of
monitoringPCI Express (PCIe/PCI-E),39PCI eXtended (PCI-X),39Pentium III,seeIntel CPUperformance,11, 22Performance Co-Pilot,seemonitoring
software (rejected)performance counters,seeInfiniBand port
countersperformance management,4, 22performance measurement tool,seePara-
dynPerformance Modelling, Evaluation, and
Optimization of Parallel and Dis-tributed Systems (PMEO-PDS),81
performance monitoring,seehistoricalmonitoring
Peripheral Component Interconnect (PCI),39
Perl,seeprogramming languagePerl interpreter,41PIKT, seemonitoring software (rejected)ping,seeUnix/Linux programsplugins,seeNagios pluginspolicy
administration,26monitoring,10
polling, seemonitoring communicationPortable Batch System (PBS),27PortRcvData,seeInfiniBand transmis-
sion countersPortRcvPkts,see InfiniBand transmis-
sion counters
PortXmitData,seeInfiniBand transmis-sion counters
PortXmitPkts,seeInfiniBand transmis-sion counters
Post Office Protocol (POP),11Power Supply Unit (PSU),11presentation of monitoring data,22presentation of monitoring results,21,
22proactive management,16proactive system management,8probe,seemonitoring communicationprocessing of monitoring data,14, 22programming language
Java,33Perl11, 41
ps,seeUnix/Linux programspseudo-encryption
XOR, 38pull information,20, 26pulling, seemonitoring communicationpush information,20, 26pushing,seemonitoring communication
Qqueue,seeInfiniBand (IB) network
Rrack,11, 15, 28RAM, 11, 47, 61RcvConstraintErrors,seeInfiniBand port
countersRcvErrors,seeInfiniBand port countersRcvRemotePhysErrors,seeInfiniBand
port countersRcvSwRelayErrors,seeInfiniBand port
countersreactive system management,8real-time monitoring,7, 19, 22Redundant Array of Independent Disks
(RAID), 28Remote Direct Memory Access (RDMA),
seeInfiniBand (IB) network
11http://www.perl.org/
Stefan Worm 91

Index
remote monitoring,10, 22active,10passive,10
return code,seeNagios status codesRijndael,seeencryption algorithmRound Trip Time (RTT),51, 54router,31
Sscalability,13, 22Scientific Linux,seeLinux distributionsecurity level,38security management,4Self-Monitoring, Analysis, and Report-
ing Technology (S.M.A.R.T.),11SELinux,seelimitations of root permis-
sionssensor,seetemperature sensorSerpent,seeencryption algorithmservice,seedaemonservice management,seeintegrated man-
agementsetuid, see limitations of root permis-
sionsSimple Mail Transfer Protocol (SMTP),
11Simple Network Management Protocol
(SNMP),11, 31Single Data Rate (SDR),seeInfiniBand
(IB) networkSMS,20, 24software,11software licences,11Spanish Initiative for Electronic Simu-
lations with Thousands of Atoms(SIESTA)12, 24
Spong,seemonitoring software (rejected)SSH,10, 51, 59status code,seeNagios status codesstorage system,18, 23, 28
12http://www.uam.es/departamentos/ciencias/fismateriac/siesta/
subnet manager (SM),seeInfiniBand (IB)network
sudo,seelimitations of root permissionssupercomputer,2Supermon,seemonitoring software (re-
jected)support,32SweGrid Accounting System (SGAS),
seeGlobus Toolkitswitch,seenetwork switchSymbolError,seeInfiniBand port coun-
terssymmetric duplex connection,seedu-
plex network connectionSymmetric Multi-Processor (SMP),23system administrator,seeadministratorsystems management,seeintegrated man-
agement
Ttag cloud, see weighted list21TDEA (Triple DEA), seeencryption al-
gorithmTDES (Triple DES),seeencryption al-
gorithmtemperature,11
chassis,11, 15computing centre,11CPU,11, 15, 51GPU,11HDD, 11mainboard,11rack,11, 15
temperature sensor,16throughput,seenetwork throughputTivoli, seeIBM Tivolitop,seeUnix/Linux programsTop500 list,1, 23Transmission Control Protocol (TCP),
51trap,seemonitoring communicationtrend monitoring,seehistorical moni-
toringtrue negative event classification,18
92 Stefan Worm
Index
true positive event classification,18tutorials,seeNagiosTwofish,seeencryption algorithmtype II error, see false negative event
classificationtypeI error,seefalse positive event clas-
sificationtypes of monitoring
active,37passive,38
UUnix/Linux programs
cron,10, 24df, 10ifconfig, 10login, 10ping,10, 27, 51ps,10, 59ssh,10, 51top,10, 59, 63
usability,21, 22, 44User Datagram Protocol (UDP) based
servicesNTP,26
Vvendor support,seesupportvertical escalation,21visualisation nodes,seeCHiC compo-
nentsVL15Dropped,seeInfiniBand port coun-
tersVoltaire13
HCA, 40switch,40
Wweb server,51webmail,seee-mail clientweighted list,21wireless local area network (WLAN),11wrapper,seeNagios
13http://www.voltaire.com/
XXeon,seeIntel CPUXiranet14 storage system,seestorage sys-
temXmtConstraintErrors,seeInfiniBand port
countersXmtDiscards,seeInfiniBand port coun-
tersXOR, seepseudo-encryption
ZZenoss,seemonitoring software (rejected)zero Nagios plugin execution delay,54
14http://www.xiranet.com/
Stefan Worm 93

Acknowledgements
Thank you for inspiring me, helping me, showing me the pro and contra regarding mydecisions, for the substantial discussions and the possibility of sharing their knowledge
with me. In short, everyone who was involved in the creation process of this work.
In alphabetic order:
Matthias ClaußDetlef Heine
Torsten HoeflerGerd KretzschmarTorsten MehlanFrank Mietke
Thomas MüllerAndreas PollerWolfgang RehmWolfgang RiedelThomas SchierRonald SchmidtTom SchwallerRegina TriederJens Wegener
Related Documents