AN INVESTIGATION OF REMOTE NON-CONTACT PHOTOPLETHYSMOGRAPHY AND PULSE OXIMETRY Kenneth Gerard Humphreys DIP EE, B.Sc.(Eng.), M.Eng.Sc. A thesis submitted to the National University of Ireland for the degree of Doctor of Philosophy August 2007 Department of Electronic Engineering Faculty of Science and Engineering Head of Department: Dr. F. Devitt Supervisors: Dr. Tomás E. Ward and Dr. Charles M. Markham

Welcome message from author
This document is posted to help you gain knowledge. Please leave a comment to let me know what you think about it! Share it to your friends and learn new things together.
Transcript

AN INVESTIGATION OF REMOTE NON-CONTACT
PHOTOPLETHYSMOGRAPHY AND PULSE OXIMETRY
Kenneth Gerard Humphreys DIP EE, B.Sc.(Eng.), M.Eng.Sc.
A thesis submitted to the
National University of Ireland
for the degree of
Doctor of Philosophy
August 2007
Department of Electronic Engineering
Faculty of Science and Engineering
Head of Department: Dr. F. Devitt
Supervisors: Dr. Tomás E. Ward and Dr. Charles M. Markham

ABSTRACT
This thesis presents an investigation of non-contact remote pulse oximetry and
photoplethysmography. A thorough description is given of the technique of pulse
oximetry along with some physiological effects and some characteristics of light-
tissue interaction that underlie pulse oximetry. A device is then described that is
capable of capturing two photoplethysmograph (PPG) signals simultaneously in a
multiplexed fashion. The device is comprised of a complementary metal oxide
semiconductor (CMOS) camera and a dual wavelength array of light emitting diodes
(LEDs) (760 nm and 880 nm). By alternately illuminating a region of tissue with
each wavelength of light and detecting the backscattered light with the camera at a
rate of 16 frames per second per wavelength, two PPG signals are simultaneously
captured. This process forms the basis of pulse oximetry. A methodical investigation
of the comparability of the camera-based device with a conventional clinical contact
device is presented. The camera-based device is demonstrated to provide a
comparable PPG waveform and measure of pulse rate and a description is given of
how, with the inclusion of a calibration procedure, such a device could be used to
estimate arterial oxygen saturation (SpO2). Some aspects of PPG signal acquisition
that are unique to a camera-based device are highlighted and camera-based capture
is shown to introduce both tractable complications and the potential for additional
utility beyond that of a conventional contact device. Additionally this thesis
describes a concept for camera-based reflection tomography with the potential to
yield structural information about shallow vasculature and tissue morphology.
Lastly this thesis describes areas of further work in relation to the development of
clinically useful camera-based pulse oximetry, and areas of further research
concerning the potential of camera-based photoplethysmography as an investigative
tool.
ii

DECLARATION
I hereby declare that this thesis is my own work and has not been submitted in
any form for another award at any university or other institute of tertiary
education. Information derived from the published or unpublished work of others
has been acknowledged in the text and a list of references is given.
Signed: Date:
iii

ACKNOWLEDGEMENTS
I would like to express my appreciation to my supervisors Dr Tomás Ward and
Dr Charles Markham: Tomás for his indefatigable enthusiasm and piquancy, and
Charles both for his technical input and for his opportune perspectives on the
research process, especially during Tomás’ sabbatical. This research was conducted
in the Department of Electronic Engineering at NUI Maynooth and I would like to
take the opportunity to thank the administrative, technical, and academic staff, as
well as the postgraduate researchers of the department. This research was funded by
Science Foundation Ireland as part of a Terahertz imaging project conducted in the
Department of Experimental Physics at NUI Maynooth. I would like to thank the
members of the Terahertz optics group and in particular the project’s principal
investigator Prof. J. Anthony Murphy. Thanks are due to Mr Christopher Soraghan
for his help in obtaining LED emission spectra.
This document was created using Microsoft® Word 2000 and MathType™ 5.0;
citations and referencing were managed using EndNote® 7; with the exception of
figures depicting frames captured by the camera, all images in this document were
produced by Matlab® 7 (R14) or were drawn in Microsoft® Word 2000.
iv

CONTENTS
TITLE PAGE ........................................................................ I
ABSTRACT ....................................................................... II
DECLARATION ...................................................................... III
ACKNOWLEDGEMENTS..............................................................IV
CHAPTER 1 INTRODUCTION ............................................... 1
1.1 Motivation....................................................................................... 2
1.2 Objectives........................................................................................ 3
1.3 Contributions of this thesis ............................................................. 3
1.4 Outline of thesis .............................................................................. 4
CHAPTER 2 SCIENTIFIC BACKGROUND.............................. 6
2.1 Oxygen transportation..................................................................... 7 2.1.1 Dyshaemoglobins and fetal haemoglobin................................ 11
2.2 Light absorption and scattering in tissue...................................... 12 2.2.1 Light absorption in tissue—the Beer-Lambert law ................. 13 2.2.2 Light attenuation—the modified Beer-Lambert law................ 14
2.3 Light transport in tissue ................................................................ 16 2.3.1 Light absorption ...................................................................... 16 2.3.2 Light scattering........................................................................ 17
v

Contents
2.3.3 Monte Carlo simulation of light propagation .......................... 17
2.4 Summary ....................................................................................... 26
CHAPTER 3 PULSE OXIMETRY .........................................27
3.1 Contemporary history of pulse oximetry ..................................... 28 3.1.1 The Clarke electrode and the transcutaneous PO2 sensor ....... 33 3.1.2 The CO-oximeter..................................................................... 35
3.2 Theory of pulse oximetry.............................................................. 37 3.2.1 Light absorption for pulse oximetry ........................................ 39 3.2.2 Deriving arterial oxygen saturation ......................................... 42 3.2.3 The need for calibration........................................................... 46
3.3 Operation of a clinical device....................................................... 49 3.3.1 Light emitting diodes............................................................... 49 3.3.2 Photodetectors and amplifiers.................................................. 54 3.3.3 Signal processing..................................................................... 55 3.3.4 Probes ...................................................................................... 57 3.3.5 Calibration of pulse oximeters................................................. 59
3.4 Limitations and applications of pulse oximetry........................... 62 3.4.1 Accuracy and errors................................................................. 62 3.4.2 Limitations............................................................................... 65 3.4.3 Applications............................................................................. 67
3.5 Chapter summary.......................................................................... 69
CHAPTER 4 DESIGN CONSIDERATIONS ............................70
4.1 Choice of source ........................................................................... 70 4.1.1 Safety guidelines ..................................................................... 71
4.2 Choice of detector (camera technology) ...................................... 73 4.2.1 CCD image sensors ................................................................. 75 4.2.2 CMOS image sensors .............................................................. 77 4.2.3 Choosing between CMOS and CCD ....................................... 79
vi

Contents
CHAPTER 5 INSTRUMENT DESCRIPTION AND PERFORMANCE .....................................................................82
5.1 System overview........................................................................... 83
5.2 Hardware description.................................................................... 84 5.2.1 The camera .............................................................................. 84 5.2.2 Illumination ............................................................................. 87 5.2.3 Timing signals ......................................................................... 95 5.2.4 Replicating aspects of a clinical device................................... 96
5.3 Image analysis............................................................................. 102 5.3.1 Extracting AVI files ............................................................... 103 5.3.2 Boxes and their analysis ........................................................ 104 5.3.3 Identifying PPG containing regions ...................................... 105
5.4 Testing and performance of device............................................. 109 5.4.1 Experimental protocol ........................................................... 109 5.4.2 Displaying a PPG ...................................................................111 5.4.3 Measuring pulse rates ............................................................ 115 5.4.4 Deriving SpO2 from a camera-based device........................... 122
5.5 Analysis of aspects of device’s performance ............................. 127 5.5.1 Effect of ROI size on plethysmograph characteristics .......... 128 5.5.2 Detection of inverted PPG signals......................................... 132
5.6 Achievable separation of tissue and camera .............................. 138 5.6.1 Monte Carlo simulation......................................................... 139 5.6.2 Probabilistic model of tissue-camera separation ................... 143
5.7 Chapter summary and discussion............................................... 153
CHAPTER 6 A CONCEPT FOR NON-CONTACT CAMERA-BASED BACKSCATTER TOMOGRAPHY ....................................157
6.1 Description of concept ................................................................ 160
6.2 Forward modelling and reconstruction ...................................... 163 6.2.1 Forward model ...................................................................... 163
vii

Contents
6.2.2 Algebraic reconstruction ....................................................... 165
6.3 Discussion ................................................................................... 169
CHAPTER 7 DISCUSSION AND FUTURE WORK................171
7.1 A synopsis of the contributions of this thesis............................. 171
7.2 Future work................................................................................. 173 7.2.1 Further research into camera-based pulse oximetry .............. 173 7.2.2 Investigation of camera-derived PPG signals........................ 173 7.2.3 Development of a clinically useful device ............................ 174 7.2.4 Investigation of single camera-based tomography ................ 175
7.3 Concluding remarks.................................................................... 175
APPENDIX A ...................................................................177
APPENDIX B ...................................................................181
REFERENCES ...................................................................184
viii

CHAPTER 1 INTRODUCTION
Equation Chapter 1 Section 1
It is fair to say that pulse oximetry has, since its invention in the nineteen seventies,
revolutionised anaesthesia and critical care. The technique provides a robust and
non-invasive means of accurately estimating arterial oxygen saturation—which is
the amount of oxygen that arterial blood is carrying compared to the amount it
could carry, expressed as a percentage. The provision of an estimate of arterial
oxygen saturation yields a critical insight into the health and well being of a patient
and provides a useful addition to the accepted four vital signs: heart rate, blood
pressure, respiration rate, and temperature.
The technique of pulse oximetry is based on near infrared (NIR) spectroscopy
and requires capturing at least two photoplethysmograph (PPG) signals at two
different wavelengths of light—a photoplethysmogram being a trace of the
peripheral arterial pressure waveform obtained by optical means. The ability to
capture and display a PPG signal as well as to derive the pulse rate has greatly
extended the clinical and investigative usefulness of pulse oximeters, which today
are employed in many diverse applications.
Pulse oximeters originally operated by transmission of light through small
extremities typically fingers, ear lobes, the bridge of the nose, and less commonly
the toes. Such locations are easily accessible but in the case of fingers and toes,
suffer from the disadvantage that in cases of trauma, surgery, shock, and
hypothermia (or even mild cold), the circulation to the peripheries is immediately
1

Introduction
reduced, making pulse oximetry difficult or impossible. Sensors were soon
developed that operated using diffuse reflected light, making possible measurement
from any part of the body surface, and in the process further extending the
applications of pulse oximetry and photoplethysmography.
This thesis describes an investigation of both the feasibility and practicalities
of remote non-contact pulse oximetry, specifically a camera-based embodiment. It
is hoped that such capabilities might further extend the uses of the technique.
1.1 MOTIVATION
Pulse oximetry and photoplethysmography are currently employed in a wide variety
of applications, in routine and critical clinical applications, and in surgical, inves-
tigative, diagnostic, and experimental applications. A key factor in the emergence of
so many applications was the development of reflectance-based probes that made
measurement possible from any point on the body surface. However many more
application have arisen that required the development of specialised probes,
including: probes to monitor mother and child during child birth, probes to be used
endoscopically during surgery, probes to fit in a pilot’s ear during aircraft testing,
probes to interface with the eye to measure retinal profusion, and many more
besides including ambulatory probes and probes for sports research (see the later
discussion of pulse oximetry applications in Section 3.4.3).
The development of non-contact capabilities might make possible and
practical new applications of pulse oximetry and photoplethysmography. Applica-
tions already exist that might benefit from non-contact pulse oximetry. For example,
the use of pulse oximeters (or any metal wire) in conjunction with magnetic
resonance imaging (MRI) can result in serious burns to the patient (Dempsey and
Condon 2001; Nakamura, et al. 2001). There also exist applications where it is
undesirable to make contact with the patient, such as sleep studies, patients in
isolation units, immunosuppressed patients susceptible to infection by cross-
contamination, and burns patients.
Pyrometers and camera-based technologies already exist capable of non-
contact temperature measurement. Conventional pulse oximeters provide an
estimate of arterial oxygen saturation, as well as pulse rate and potentially
respiration rate. If non-contact pulse oximeter functionality were to be achieved, but
2

Introduction
for the illusive non-contact measurement of blood pressure, non-contact vital signs
monitoring would be a realistic goal.
The ability to monitor a patient’s vital signs by non-contact means is a
tantalising prospect, and would likely be well received in both surgical and clinical
monitoring environments where efforts are already underway to minimise the
amount of cabling and clutter currently associated with patient monitoring. Indeed
non-contact vital signs monitoring and non-contact respiration monitoring using
microwave radar are topical areas of research (Lohman, et al. 2002; Matsui, et al.
2006; Uenoyama, et al. 2006).
1.2 OBJECTIVES
The broad objective of this thesis is to investigate the feasibility of non-contact
pulse oximetry. The functionality that a conventional pulse oximeter possesses
(which will be established in Chapter 3) includes the ability to estimate arterial
oxygen saturation, display a trace of the peripheral arterial pressure waveform, and
measure the pulse rate from that waveform. Thus it is necessary to investigate the
feasibility of comparably replicating these functions by non-contact means.
In pursuing this objective a camera-based approach is adopted. Thus a further
objective of this thesis is to investigate what, if any, complications or limitations are
introduced by a camera-based embodiment of a pulse oximeter? The complement to
this objective is to identify any additional utility that a camera-based device might
possess, beyond that of a conventional contact device.
Having adopted a camera-based approach, a secondary objective of this thesis
is to highlight any potential that camera-based devices might offer in NIR or optical
investigations of tissue beyond their current application in tissue oximetry and their
application here in determining arterial oximetry.
1.3 CONTRIBUTIONS OF THIS THESIS
The primary contribution of this thesis is the description of a device and method
that resulted in the first demonstration of the simultaneous capture of two PPG
signals at different wavelength, by remote non-contact means, from deep tissue and
from a range of subjects, under realistic environmental and lighting conditions. The
3

Introduction
subsequent analysis of the device’s performance and the demonstration of its
comparability with a conventional device collectively establish the feasibility of
(camera-based) non-contact pulse oximetry.
Beyond the investigations of feasibility and comparability, an investigation is
presented of some aspects of non-contact and camera-based pulse oximetry and
photoplethysmography that are unique to a camera-based device. These analyses
highlight previously unreported phenomena that allude to the complications and
also the potential additional investigative capabilities of a camera-based device.
Important necessary conditions are established pertaining to the choice of
illumination pattern, which if neglected undermine the assumptions upon which the
technique of pulse oximetry is based.
A concept for camera-based tomography is described that highlights new
avenues of research for camera-based NIR and optical investigations of tissue.
1.4 OUTLINE OF THESIS
This thesis is composed of six subsequent chapters, the subjects of which are
outlined here.
Chapter 2 establishes information pertaining to the physiology and anatomy of
blood oxygen transportation. This information has importance later in the
discussion of pulse oximeter operation, limitations, and accuracy. Chapter 2 also
establishes the fundamentals of the Beer-Lambert law and Beer-Lambert based
spectroscopy, of which pulse oximetry is a special case. Lastly Chapter 2 describes
a Monte Carlo simulation of photon migration in tissue. The simulation is used in
Chapter 2 to illustrate the path of light travelling through a turbid medium
simulating tissue; knowledge of this path is later used to explain the operation of
reflectance pulse oximetry (Chapter 3), to provide the rationale for certain design
decisions pertaining to the non-contact device (Chapter 4), and to hypothesise the
cause of some phenomena observed during non-contact photoplethysmography
(Chapter 5). The Monte Carlo simulation is re-employed later in Chapter 5 to
simulate the effect of tissue-detector separation on the received light intensity.
Chapter 3 provides a compendious description of pulse oximetry including the
history of the technique, its principles of operation, the practicalities of its impleme-
ntation, and a discussion of its applications and limitations. As such Chapter 3
4

Introduction
provides the constraints, specifications, and objectives for the design of a non-
contact device.
Chapter 4 describes design considerations pertaining to the source and
detector. For the source these primarily include wavelength, bandwidth, and
permissible exposure limits. The detector is ultimately chosen to be a digital camera
and the discussion in Chapter 4 is concerned with establishing the desirable
characteristics of the camera’s sensor and choosing between the two available
technologies, charge coupled devices (CCD) and complementary metal oxide
semiconductors (CMOS).
Chapter 5 provides a description of the non-contact camera-based device for
remote pulse oximetry and photoplethysmography. A detailed account is given of
the device’s design, construction, operation, and performance. An examination of its
comparability with a conventional contact device is presented along with an
investigation of some aspects of photoplethysmography that are unique to a camera-
based implementation. Some further aspects of the device’s performance are
investigated by simulation.
In Chapter 6 the topic of discussion changes and a concept for camera-based
diffuse optical or NIR tomography is described. The discussion is intended to
highlight the potential of camera-based NIR and optical investigations of tissue.
The thesis is concluded in Chapter 7 with a review of the arguments and
findings and resulting contributions, as well as a discussion of areas for future work,
both in further research and in the development of clinically useful devices.
5

CHAPTER 2 SCIENTIFIC BACKGROUND
Equation Chapter 2 Section 1
The desire to monitor the oxygenation of body tissues or of the blood is motivated
by the importance of oxygen to life. The motivation to measure the oxygenation of
both tissue and blood by near infrared spectroscopy (NIRS) stems from the
suitability of NIRS to safe, accurate, and non-invasive monitoring, of which much is
said later in relation to pulse oximetry. NIRS is made possible by several fortuitous
happenstances: tissue is relatively transparent to both red and near infrared light; an
important respiratory molecule, haemoglobin, exhibits a useful oxygen dependent
change in absorption over the same wavelength range; and the diffuse scattering of
light over this range by tissue makes possible the detection of backscattered light—
facilitating local tissue oxygenation and arterial oxygen saturation measurement
from any point on the body surface—and as this thesis advances, facilitates arterial
oxygen saturation measurement from beyond the body’s surface. (Appended to this
list of fortuities should be the abundance of suitable silicon-based near infrared
sources and detectors.) The discussion that follows in this thesis, the rationale for
the methods employed here and the analysis of the operation of the resulting device,
as well as the concept for a camera-based tomography system, are based on these
premises, and this chapter is intended to act as a primer for that discussion.
Specifically this chapter has three purposes. first a basic description of the
physiology and anatomy of oxygen transportation in the body is given. This
discussion highlights both the importance and the mechanism of maintaining a
6

Scientific Background
sufficient oxygen supply to body’s tissues, and in so doing hints at the motivation
for, and means by which, arterial oxygen saturation can be measured—which is the
subject of Chapter 3. Second this chapter is intended to provide a thorough
discussion of the modified Beer-Lambert law that describes light attenuation in
tissue, and upon which near infrared spectroscopy is based. Third the scattering of
light in tissue is described and with the aid of a Monte Carlo simulation, the arced
path of light travelling between two points on the tissue surface is illustrated, the
profile of this path is a key presupposition in the development of a non-contact
pulse oximeter and in explaining signals observed using such a device, as well as
the concept of camera-based tomography described in Chapter 6. Additionally the
Monte Carlo simulation, though it is employed here only as an illustrative tool, is
reapplied in Chapter 5 as an investigative tool to characterise the effect of tissue-
detector separation.
2.1 OXYGEN TRANSPORTATION
Oxygen is addicting; in its grip are all the mitochondria-rich eukaryotes that learned to depend on it during the past 1.4 billion years. This, the first atmospheric pollutant, is the waste product of stromatolites (formations of algal plankton), which excreted it at least 2.3 billion years ago. Since then, all sediments have been rusted or oxidized. Oxygen is toxic. It rusts a person in a century or less. With oxygen came the danger, and the blessing, of fire. If introduced today, this gas might have difficulty getting approved by the Food and Drug Administration.
(Severinghaus 1987a)
At sea level the pressure of air is defined as 1 atmosphere (1 atm), or 760 mmHg in
a mercury barometer, or 101.3 Pascals (Pa) (that is 101.3 N/m2) in the international
system of units. Dalton’s law of partial pressures states that the total pressure
exerted by a gaseous mixture is equal to the sum of the partial pressures of the
individual gases comprising the mixture. Under normal conditions oxygen accounts
for approximately 21% of air and so has a partial pressure (PO2) of 0.21 atm
(21.3 Pa or 159.6 mmHg).
Air is drawn into the body by the mechanical actions of the lungs and
respiratory muscles, under the control of respiratory neurons on the brain stem.
Once in the lungs, oxygen from the air, diffuses across the thin boundary formed by
the walls of the alveoli, into the oxygen depleted blood returning from supplying
oxygen to the body’s tissues. The oxygenated blood leaves the lungs and is
7

Scientific Background
distributed by the arteries around the body. Although the arterial blood passes tissue
in need of oxygen, diffusion—also the mechanism by which oxygen is passed
between the blood and tissue—can only take place over distances of about 1 mm,
so the arterial blood loses no oxygen at this point. Arteries branch off into smaller
arteries and eventually into arterioles, the walls of which are only one cell thick. At
this point oxygen from the blood in the arterioles diffuses into the tissue, while
CO2, the waste product of respiration, diffuses back into the blood. The arterioles
meet with venules (which collectively form the capillaries), through which the now
deoxygenated blood makes it way back into the veins and back towards the lungs to
expel its CO2 and acquire more O2.
Blood is composed of about 50% liquid (plasma). Under normal circum-
stances, Henry’s law describes the amount of gas that can be dissolved in a liquid at
a given temperature, and that amount is directly proportional to the gas’s partial
pressure. If oxygen dissolved in blood plasma were the only mechanism by which
the blood could transport oxygen around the body, then the plasma would need to
be circulated around the body about twenty times faster, just to meet the needs of a
resting body. The blood however has a much more efficient means of delivering
oxygen around the body: haemoglobin.
Haemoglobin is a respiratory molecule found on red blood cells
(erythrocytes). Each erythrocyte has approximately 265 million haemoglobin
molecules, and each haemoglobin molecule is capable of bonding with four oxygen
molecules (Curtis and Barnes 1989). Haemoglobin can typically carry 19 ml of O2
per 100 ml of blood, which is about sixty five times that which could be carried
dissolved in the plasma alone (Clark 1997).
When a completely deoxygenated haemoglobin molecule obtains its first
oxygen molecule, its affinity for oxygen increases, as it does again with the
acquisition of each subsequent molecule, until it is saturated. The same is true of the
reverse process. This characteristic of haemoglobin gives a sigmoidal shape to the
haemoglobin dissociation curve, which relates haemoglobin oxygen saturation (the
ratio of haemoglobin molecules with four attached O2 molecules, to all other
haemoglobin molecules) to oxygen partial pressure, PO2. Figure 2.1 illustrates the
profile of the haemoglobin oxygen dissociation curve, generated using Kelman’s
formula (1966),
2 3 4
1 2 3 42 2 3
4 5 6 7
O ( )a x a x a x a x
S xa a x a x a x x
+ + +=
+ + + + 4. (2.1)
8

Scientific Background
SO2 is the oxygen saturation of haemoglobin, the variable x represents the oxygen
partial pressure, and ai are constants defined by Kelman (1966).
Figure 2.1 Haemoglobin oxygen dissociation curve, generated using the equation described in Kelman (1966). Partial pressure of oxygen is indicated in atmospheres (top axis) and millimetres of mercury (bottom axis).
Figure 2.1 shows the normal dissociation curve, that is, for a blood pH of 7.4,
carbon dioxide partial pressure (PCO2) of 40 mmHg, and a temperature of 37 °C. A
change is any of these parameters, or a change in the concentration of phosphates in
the blood, will cause the dissociation curve to shift (Moyle 1994). Decreasing
PCO2 or temperature, or increasing pH, will cause the curve to shift to the left,
resulting in haemoglobin becoming saturated at lower oxygen partial pressures. A
change to the contrary in any of these parameters causes the curve to shift to the
right. A left-shifted curve, increases haemoglobin’s affinity for oxygen, which aides
in the uptake of oxygen from the environment but impairs tissue oxygenation—
since for the same pressure gradient, less oxygen will diffuse from the blood into
the tissue. Fetal haemoglobin has this left-shifted dissociation curve compared to
adult haemoglobin, that facilitates obtaining oxygen from the mother but prevents
too high an oxygen saturation in the foetus itself, which can be harmful. When
breathing an insufficient quantity of oxygen to meet the cellular demand, at high
altitudes for example, some cells will switch their metabolism to anaerobic
pathways, causing an increase in lactic acid production, resulting in an increase in
plasma pH (Moyle 1994). The increasing pH causes a left shift of the dissociation
9

Scientific Background
curve, making the situation worse. A right-shifted curve, conversely, results in
decreased affinity, but better facilitates oxygen delivery (Clark 1997).
The actual partial pressure of oxygen present in the alveoli, PAO2 is less than
the ambient oxygen partial pressure of the environment. It is a function of water
vapour partial pressure, and of the arterial carbon dioxide partial pressure PaCO2.
The alveolar oxygen partial pressure is given by,
2
2
2A 2 ambient H O i 2 a 2
Vol. CO producedO O CO
Vol. O consumed( )P P P F P= − − × , (2.2)
where FiO2 is the fraction oxygen in the inspired air.
John Scott Haldane, a noted physiologist (and the pioneer of diving decom-
pression theory) commented that lack of oxygen stops the machine and wrecks the
machinery. The response of individuals to an insufficient supply of oxygen
(hypoxia) varies with age and fitness. Within the body the response times of
individual tissues and organs also vary. Damage to the cerebral cortex occurs about
one minute after the cessation of oxygen supply to it, the liver and kidneys about ten
minutes, and skeletal muscle about two hours (Moyle 1994). J.F. Nunn (1987) thus
modified Haldane’s quote to , lack of oxygen stops the machine and then wrecks the
machinery.
Haemoglobin has another important property from the point of view of blood
oxygen measurement: the colour of haemoglobin changes when it acquires four
oxygen molecules. Georg Gabriel Stokes first reported that the coloured substance
in blood was the oxygen carrier in 1864. Felix Hoppe-Seyler later crystallised the
pigment and coined the name haemoglobin (Hb). Hoppe-Seyler observed that when
a solution of haemoglobin was exposed to air, it formed a dissociable bond with
oxygen, and named this compound oxyhaemoglobin (HbO2). Hoppe-Seyler further
observed that Hb was responsible for the absorption of blue and green bands of the
solar spectrum. This is why oxygenated blood appears bright red while
deoxygenated blood appears blue, however a more useful change in the absorption
spectrum of Hb occurs in the near infrared portion of the spectrum (see Figure 3.7)
where tissue is translucent—and this facilitates in vivo spectrometry and ultimately
pulse oximetry.
10

Scientific Background
2.1.1 DYSHAEMOGLOBINS AND FETAL HAEMOGLOBIN
Oxygen (O2) is not the only molecule with which haemoglobin can bind, nor is
oxygen the only binding agent with which haemoglobin forms a compound that is
absorptive of red and near infrared light. A brief description is given here of the
other common compounds that haemoglobin forms in blood. They are of relevance
to oxygen transportation as these forms of haemoglobin are not able to supply
oxygen (dyshaemoglobins), and will later be seen to be of importance in deter-
mining the accuracy of blood oxygen measurements (see Section 3.4.1).
2.1.1.1 CARBOXYHAEMOGLOBIN (COHB)
Carbon monoxide (CO) can also form a bond with haemoglobin to produce a
compound Carboxyhaemoglobin (COHb), indeed the affinity of Hb for CO is about
two hundred times greater than for O2. Once bound with haemoglobin however,
because of its high affinity, carbon monoxide does not easily relinquish the
haemoglobin molecule. From the point of view of oxygen transportation, COHb has
the effect of reducing the ability of the blood to carry and supply oxygen.
Haemoglobin bound with carbon monoxide has much higher absorptivity at
red wavelengths of light than haemoglobin by itself, and even more so than
haemoglobin bound with oxygen. From the point of view of oximetry, COHb levels
in excess of those used in calibration (typically < 2% of the total haemoglobin) can
cause a large error in the oximetry reading, the cause of which may not be
immediately apparent to a user—victims of smoke inhalation, urban dwellers, and
indeed heavy smokers can fall into this category (Clark 1997; Moyle 1994; Seidler,
et al. 1993; Tungjitkusolmun 1997).
2.1.1.2 METHAEMOGLOBIN (METHB)
Methaemoglobin does not result from the binding of haemoglobin with another gas
molecule, but rather, is haemoglobin that has been oxidised, that is, haemoglobin
that has lost an electron, and as a result is no longer capable of binding with oxygen.
The process can be described as,
2 3HbFe HbFe e+ +⇔ −+ . (2.3)
Unlike COHb, MetHb occurs naturally and an enzyme system exists for
maintaining haemoglobin in its reduced state (HbFe2+). Under normal circum-
11

Scientific Background
stances MetHb accounts for less that 0.6% of total haemoglobin, though the
concentrations varies during the day (Tungjitkusolmun 1997). Its effect on pulse
oximetry accuracy is generally less problematic than that of COHb, since MetHb
tends to produce an under estimation of blood oxygen content (Moyle 1994),
though its effects are difficult to quantify, since its absorption spectrum is strongly
pH dependent (Bunn 1986).
2.1.1.3 SULFHAEMOGLOBIN
The irreversible reaction of oxyhaemoglobin and hydrogen sulfide produces
sulfhaemoglobin. Sulfhaemoglobin has little effect on oxygen transport as its
affinity for oxygen is about one hundred times less than that of unmodified
haemoglobin. The absorption spectrum of sulfhaemoglobin is unreported upon, and
hence its effects on the accuracy of pulse oximetry are not quantifiable. It is not
included in pulse oximetry calibration calculations, though its concentrations in
human blood are thought to be sufficiently low as to be insignificant (Clark 1997).
2.1.1.4 FETAL HAEMOGLOBIN
Fetal haemoglobin has a different oxygen dissociation curve compared to normal
adult haemoglobin, appropriate to foetal oxygen requirements. It is gradually
replaced by adult haemoglobin during the first ten to twelve weeks of life. Its
production can be activated pharmacologically in later life, which is useful in the
treatment of diseases such as sickle-cell disease. It has a different absorption
spectrum to adult haemoglobin, the effects of which are not included in pulse
oximetry calibration techniques.
2.2 LIGHT ABSORPTION AND SCATTERING IN TISSUE
This section describes the long established laws and observations that govern the
absorption and scattering of light in biological tissue and form the basis of all near
infrared spectroscopic techniques, of which pulse oximetry is a special case.
12

Scientific Background
2.2.1 LIGHT ABSORPTION IN TISSUE—THE BEER-LAMBERT LAW
Layers of a substance of equal thickness each absorb the same fraction of an
incident beam of light. Thus in a medium consisting of three layers, if the first
absorbs ½ of the incident light, the second will absorb ½ the remaining light, as will
the third layer, and only ⅛ of the incident light will emerge from the third layer.
This law, derived in the 18th century, is commonly known as the Lambert-Bouguer
law, and describes the logarithmic attenuation of light travelling through an
absorbing medium. The Lambert-Bouguer can be written as,
010log IA
I=
. (2.4)
The dimensionless term A is the light attenuation, given nominal units of optical
density (OD), that indicates the order of magnitude of attenuation between the
incident light I0 and the transmitted light I.
In the 19th century August Beer derived a law stating that the optical density of
a non-absorbing medium, with an absorbing substance dissolved in it, is
proportional to the concentration of the absorbing substance. The combination of
these two laws is commonly know as the Beer-Lambert law and can be written as
010log IA
Icdα = =
, (2.5)
where α and c are respectively, the absorptivity1 and concentration of the absorbing
substance, and d is the distance between the points where the light enters and exits
the medium.
In cases where there are multiple absorbing substances dissolved in a non-
absorbing medium, the combined attenuation due to all the absorbing substance is
given by the sum of their individual contributions multiplied by the length of the
path travelled by the light, that is,
[ ]1 1 2 2 ... n nA c c cα α α= + + + d
. (2.6)
In a typical spectroscopic application, it is required to determine the
concentrations of a certain number of substances each of which has a different
absorptivity at different wavelengths. The absorptivity as a function of wavelength
1 Note that α is more correctly the specific extinction coefficient (with units of µmolar-1 cm-1) and c the concentration in µmolar. The term absorptivity is used loosely here since no quantitative data are discussed.
13

Scientific Background
is known for each absorber and the distance d can be measured. Then for different
wavelengths of light the attenuation of the medium is measured experimentally.
Provided the number of wavelengths used is at least equal to the number of
absorbing substances, the concentrations of each of the substances can be found by
solving the resulting set of simultaneous equations.
This is the basic premise of all spectroscopic methods of determining tissue
oxygen saturation. Tissue might seem apt to this model of attenuation: it is
composed largely of water, which can be considered non-absorbing between
wavelengths of 200 nm to 900 nm, compared to the absorbers (or chromophores) of
interest, Hb and HbO2. However tissue is also a highly scattering medium. The
effect of scattering is to increase the observed light attenuation between two points
to a level far greater than can be attributed to absorption alone. Thus the Beer-
Lambert law alone is insufficient for determining the concentration of chromo-
phores in tissue.
2.2.2 LIGHT ATTENUATION—THE MODIFIED BEER-LAMBERT LAW
Of the observed attenuation by tissue between two points, absorption accounts for
only about 20%, with scattering accounting for the remaining 80% (Elwell 1995).
The Beer-Lambert law, equation (2.5), can be modified to take account of the
effects of scattering by including an additive term G—the attenuation due to
scattering, and a multiplicative term B—the differential path length factor, which
when multiplied by the geometric distance d between the source and detector,
accounts for the increase in optical path length caused by scattering. Thus the
modified Beer-Lambert law can be written as
010log IA
Iα cdB G= = +
. (2.7)
The scattering loss G is usually unknown and is dependent on the relative
positions of the source and detector, and on the scattering coefficient of the tissue
under investigation. As a result of the unknown term, the modified law cannot be
used in the same way as the original law, to generate simultaneous equations
yielding quantitative values for the sought concentrations. Instead the equation (2.7)
is used in a differential form in which the scattering loss is considered to be constant
for a given source and detector position. A measurement is made at a particular
wavelength yielding attenuation A1 corresponding to concentration level c1. Some
14

Scientific Background
time later, the concentration of the chromophore has changed to c2; another
measurement is taken yielding attenuation A2. Provided the loss due to scattering
(G), the geometric distance between source and detector (d ), and the differential
path length factor (B), are the same for each measurement, the change in
concentration ∆c = (c2 – c1) can be calculated as
2 1( )A A A c dBα∆ = − = ∆ . (2.8)
For multiple chromophores measured at wavelength λ, the differential
attenuation can be written as
[ ]1 1 2 2( ) ( ) ( ) ... ( ) ( )n nA c c c dBλ α λ α λ α λ λ∆ = ∆ + ∆ + ∆ , (2.9)
where αn(λ) is the absorption of nth chromophore present in the medium measured
at a wavelength λ, and where cn is the concentration of that chromophore in the
medium.
Now in a typical spectroscopic application, the values of absorptivity
(α1(λ)…αn(λ)) are known, the geometric path length (d ) is measured or
calculated, and the differential path length factor (B(λ)) and the change in
chromophore concentration (∆c) remain unknown. Calculation of the differential
path length factor is not trivial; two methods are described by Elwell (1995). The
first is a time of flight technique that uses a laser capable of generating picosecond
duration pulses and a streak camera capable of measuring the time of arrival of a
pulse with great accuracy. The pulse from the laser is projected on a beam splitter.
One of the resulting beams is directed to the camera via a series of mirrors forming
a time reference. The second beam traverses a tissue sample en route to the camera.
The difference in the time of arrival is measured and using the speed of light in a
vacuum, the refractive index of tissue and the geometric distance, the differential
path length factor is calculated. The second method described by Elwell uses an
intensity modulated optical spectrometer. A laser beam is modulated and the phase
difference between the light entering the tissue and exiting the tissue is measured.
This time, using the speed of light in a vacuum, the refractive index of tissue, the
modulation frequency, and the measured phase difference, the differential path
length factor is calculated.
By measuring the differential attenuation at least at as many wavelengths as
there are chromophores, a set of equations can be constructed, which can be solved
simultaneously, to yield the time varying, relative change, in each of the
chromophores’ concentrations. Though this does not yield the quantitative values
15

Scientific Background
for the concentration of individual chromophores, as the unmodified Beer-Lambert
law purported to do, the changes in chromophore concentrations over time are
useful nonetheless, and form the basis of many spectroscopic investigations of
tissue oxygenation and tissue oxygen consumption. See for example Cope (1991)
who describes a spectroscopy system for monitoring cerebral oxygenation of new
born infants, Niwayama et al. (2006) and Yuanqing et al. (2002) who describe tissue
and muscle oxygenation measuring techniques respectively, and Coyle et al. (2004)
who describe motor cortex oxygenation monitoring as a means of implementing a
brain-computer interface.
Despite the development of such techniques and devices, modified Beer-
Lambert law based spectroscopic monitoring, is in general ill-suited to routine
clinical monitoring applications, where the need to establish an estimate of the
differential path length, for every patient and for each measurement site, is
impractical. Though modified Beer-Lambert based spectroscopy is extendable to
the application of pulse oximetry (Humphreys, et al. 2005b; Rolfe 2000), in
practice, no clinical device utilises the technique. Section 3.2.1 revisits the subject
of light attenuation in tissue and describes how the technique of pulse oximetry
eliminates the need to establish the optical path length in calculating arterial blood
oxygen saturation.
2.3 LIGHT TRANSPORT IN TISSUE
Section 2.2 described how light travelling through tissue is attenuated by the
combined effects of scattering and absorption. This section describes the affect of
scattering and absorption on the propagation of light through tissue with the aid of a
Monte Carlo simulation; specifically, the proclivity of scattering to cause the
bending of light propagating through tissue—making possible the measurement of
backscattered light and ultimately non-contact measurements of tissue and blood
oxygen saturation.
2.3.1 LIGHT ABSORPTION
Light absorption refers to the loss of photonic energy during interaction with
electrons, atoms, and molecules. The energy lost by photons is converted into either
heat or into light of longer wavelengths (Splinter and Hooper 2007). Within tissue,
16

Scientific Background
near infrared light is absorbed by molecules that posses an electric dipole moment,
typically these are molecules composed of dissimilar atoms and they include carbon
dioxide, carbon monoxide, nitric oxide, and water (Reddy 1997). Absorption is
wavelength dependent.
The absorbers of principal interest in this study are Hb and HbO2, a list of the
other common absorbers (or chromophores) in tissue and of relevance to this study
is given in Section 2.1.1.
2.3.2 LIGHT SCATTERING
Light scattering can be classified into three modes of light-particle interaction:
Rayleigh scattering, Mie scattering, and Raman scattering. The occurrence of
Rayleigh or Mie scattering is determined principally be the ratio of the wavelength
of the incident light (λ) to the dimensions of the scattering particle. Rayleigh
scattering occurs when λ is much larger than the dimensions of the scattering
particle and Mie scattering when the dimensions are comparable. Both Rayleigh
and Mie scattering are elastic and cause a change in the trajectory of the scattered
photon only. Raman scattering by contrast describes a phenomenon in which the
trajectory of the scattered photon is altered, but in addition the interaction causes the
emission of light, usually with longer wavelength, from the scattering particle
(Splinter and Hooper 2007).
Mie scattering is predominant in light interaction with biological tissue. The
interaction closely approximates geometrical optics. The cross-section of the
scattering particle and the angle of incidence of the photon are used to determine an
anisotropy factor g, which is the probability that the photon will be scattered in a
solid angle θ.
2.3.3 MONTE CARLO SIMULATION OF LIGHT PROPAGATION
A Monte Carlo simulation of light propagation through a homogenous scattering
medium is presented here. The simulations are instructive in establishing the most
probable path along which a beam of photons travels between the injection point
and the detection point. Knowledge of the likely path taken by a beam of photons is
necessary to explain the means by which contact and non-contact pulse oximetry
and photoplethysmography acquire pulse signals from tissue. The profile of the
17

Scientific Background
photons path also provides rationale for design considerations pertaining to
positioning of source and detector, and a means of explaining some of the
phenomena associated with non-contact camera-based photoplethysmography.
The propagation of optical radiation in tissue is most often described using
radiation transfer theory, which ignores wave-like phenomena such as interference.
The radiative transfer equation formulates the radiance of light in a medium in
terms of absorption and differential scattering coefficients (the derivation of which
has been provided by many authors—see for example Splinter and Hooper (2007)).
The equation can be solved analytically for simple geometries, however it is most
commonly solved by various numerical methods including, but not limited to,
Monte Carlo analysis, random walks (Bonner, et al. 1987), and finite element
analysis (Arridge, et al. 1993). Of these techniques, Monte Carlo analysis is perhaps
the most versatile and commonly used, lending itself to complex tissue geometries.
The disadvantage of the Monte Carlo method is that it is computationally intensive
and time consuming. The technique provides a simulation of light propagation
rather than a direct solution to the radiative transfer equation, and as such requires
the simulation of a large number of photons to produce accurate results, with the
accuracy increasing in proportion to the square root of the number of photons used
(Patterson, et al. 1990). Nonetheless, Monte Carlo simulations are commonly found
in investigations of light-tissue interaction and near infrared spectroscopy, see for
example: Hiraoko et al. (1993) on investigations of optical path length; Okada et al.
(1997) on investigations of light propagation in the adult head for spectroscopy;
Fukui et al. (2003) on investigation of light propagation in both adult and neonatal
heads; Strangman et al. (2003) on the effects of differential path length factor and
optical cross-talk as sources of error in NIR spectroscopy; Reuss (2005) on the
comparability of homogeneous and multi-layer models of tissue for reflectance
pulse oximetry; and Niwayama et al. (2006) on tissue oxygen measurement.
Figure 2.2 displays the flowchart of the Monte Carlo simulation program used
here. The flowchart and the description of its functions that follows, are based on
those described by Prahl et al. (1989) and Splinter and Hooper (2007). The method
described here utilises a variance reduction technique known as implicit capture, in
which a group or packet of photons, rather than an individual photon, is propagated
through the medium. Upon its launch, each packet is given the same weight; at each
tissue interaction location, a portion of the packet’s weight is lost due to absorption
and the remainder of the packet scattered in accordance with the optical properties
of the medium. Packets continue to propagate in the medium until their weight falls
18

Scientific Background
below a certain threshold value, or until they are backscattered from or transmitted
through the medium.
YES
INSUFFICIENT
SUFFICIENT
SURVIVE DIE
YES
NO
NO
YES
NO
YES
END SIMULATION
LAST PACKET?
STILL IN TISSUE?
INTERNALLY REFLECTED?
ROULETTE
CHECK WEIGHT
WILL A BOUNDARY
BE CROSSED ON NEXT MOVE?
LAUNCHA PACKET
CHANGE DIRECTION
ABSORB AND STORE LOCATION
MOVE PACKET AND UPDATE
STATUS
MOVE PACKET
CALCULATE NEXT LOCATION
GENERATE STEP SIZE
Figure 2.2 Flowchart of Monte Carlo simulation.
Throughout the simulation each packet’s three-dimensional location is
recorded as a Cartesian coordinate (x, y, z). The packet’s current trajectory is
19

Scientific Background
described by three directional cosines (µx, µy, µz); the cosines of the angles made
between the packet’s trajectory and each of the x, y and z-axes; defined as the dot
product of the trajectory vector and a unit vector along each of the x, y and z-axes.
The packet’s initial position is (0, 0, 0) and its initial trajectory (0, 0, 1). Thus
packets are injected at the origin, initially travelling vertically. (When the tissue
model comprises one or more horizontal layers, z < 0 defines air, z > 0 defines
tissue, and z = 0 defines the air-tissue interface.) In this manner an infinitely narrow
beam of photons is simulated.
Attenuation coefficients due to absorption, µa, and due to scattering, µs, are
defined respectively as the mean number of absorption and scattering events
encountered by a photon per millimetre. A total attenuation coefficient, µ t, is
defined as the sum of µa and µs. Thus the mean step size that a photon travels
without interacting with the medium, the mean free-path length ∆s, is described by,
1 1
t a
ssµ µ µ
∆ = =+
. (2.10)
The discussion of the Beer-Lambert law in Section 2.2.1 noted that light
travelling in tissue is attenuated exponentially, thus the probability density function
that describes the distribution of ∆s is also exponential and is proportional to
exp(−µ t∆s). A step size with such a density function is generated by,
ln
t
sξ
µ−
∆ = , (2.11)
where ξ is a random variable uniformly distributed between zero and one.
Having generated an appropriate step-size ∆s, a packet is moved to its new
location by updating its (x, y, z) Cartesian coordinates. The new coordinates
(xnew, ynew, znew) are given by,
.
new x
new y
new z
x x s
y y
z z
µ
µ
µ
s
s
= + ∆
= + ∆
= + ∆
(2.12)
At its new location the packet’s weight, w, is reduced by a fraction µa/µ t, such
that the packet’s new weight wnew, is given by,
anew
a s
wµ
µ µ=
+w . (2.13)
20

Scientific Background
The location of the absorption and the new weight of the packet are recorded. The
remainder of the packet is scattered.
The scattering trajectory is defined by two angles: an azimuthal angle φ and a
longitudinal angle θ. The azimuthal angle is uniformly distributed over the range 0
to 2π, and is hence given by,
2πφ ξ= , (2.14)
where ξ is again a random variable uniformly distributed between zero and one.
The longitudinal angle θ, is not uniformly distributed and is calculated using
the Henyey-Greenstein phase function2 defined as,
22
21 1cos 1
2 1 2g
gg g
θξ
−= + −
− + g
. (2.15)
The term g, was defined earlier as the anisotropy factor. The term ξ is a
random variable uniformly distributed between zero and one. When g = 1 scattering
is predominantly forward, as g tends towards zero, scattering tends towards
isotropic scattering. If scattering is truly isotropic then g = 0, and the longitudinal
angel is instead calculated as,
cos 2 1θ ξ= − . (2.16)
A photon with a current trajectory defined by the directional cosines
(µx, µy, µz) will, after being scattered in a direction (θ, φ), have a new trajectory
(µ'x, µ'y, µ'z), given by,
2
2
2
sin( cos sin ) cos
1
sin( cos sin ) cos
1
sin cos 1 cos .
x x z y x
z
y y z
z
z z z
x
'
'
'
θ
y
µ µ µ φ µ φ µ θµ
θµ µ µ φ µ φ µ θ
µ
µ θ φ µ µ θ
= −−
= +−
= − − +
+
+
(2.17)
If the current trajectory of the photon is close to vertical, say |µz| > 0.99999,
then equation (2.17) should be replaced by,
2 Henyey and Greenstein (1941) characterised the scattering of light in interstellar dust clouds, by developing an expression for the angular dependence of light scattering by small particles. The identity they developed (which describes the probability density function of an angle as a function of the anisotropy of the scattering medium) is now commonly used to describe the scattering of light in biological tissues.
21

Scientific Background
sin cos
sin cos
cos .
x
y
zz
z
'
'
'
µ
µµ
µµ
θ φ
θ φ
φ
=
=
=
(2.18)
Where a packet’s trajectory crosses a boundary between regions of different
refractive indices, be it tissue and air or two different tissues, there is a possibility
that the packet will be internally reflected with a probability proportional to the
angle of incidence. For simple models comprised of parallel layers of tissues, the
angle of incidence θ i, of the packet can be calculated as,
1cosi zθ µ−= . (2.19)
The angle of transmission, θ t, can be calculated using Snell’s law,
1sin sinit
t
nn iθ θ−=
, (2.20)
where ni and nt are respectively, the refractive indices of the medium from which,
and towards which, the packet is travelling.
The probability of internal reflection is given by the Fresnel reflection
coefficient R(θ i),
2 2
2 2
sin ( ) tan ( )1( )
2 sin ( ) tan ( )i t i t
ii t i t
Rθ θ θ θ
θθ θ θ θ
− −= +
+ +
. (2.21)
Whether the packet is reflected or not is determined by a random number
uniformly distributed between zero and one, ξ, such that reflection occurs if,
( )iR θ ξ< . (2.22)
Finally it is desirable to cease propagating packets with small remaining
weight, as they contribute little to determining the distribution of photons within the
medium. Eliminating all packets with less than a threshold weight violates the
conservation of energy principle, thus packets with a weighting less than a threshold
are subjected to a Roulette process—surviving packets have their weight reset to the
maximum and continue propagating.
A Monte Carlo routine based on the description given here and the flowchart
depicted in Figure 2.2 was implemented in Matlab® (MathWorks Inc.). Figure 2.3
displays the results of a simulation of one million launched packets through a
homogenous medium with the optical properties described in Table 2.1. The plot
22

Scientific Background
shows the locations where backscattered photons emerged from the medium.
Superimposed on Figure 2.3 are circles concentred on the injection point (0, 0).
Each annular region between adjacent circles encloses the same area as that
enclosed by the inner circle.
Parameter Value µ a 0.2 mm-1 µ s 1.3 mm-1 g 0.9
Refractive index of tissue 1.3 Minimum packet weight 0.1
Roulette survival probability 0.1
Table 2.1 Optical properties of tissue as used in Monte Carlo simulation.
Figure 2.3 Emergence of backscattered photons injected at the point (0, 0) with concentric circles each enclosing equal area.
Figure 2.4 displays a plot of the number of backscattered packets emerging in
each annular region, versus radial distance from the injection point. Figure 2.5
displays the cumulative weight of all packets contained in each annular region
versus the radial distance from the injection point (where the cumulative weight is
the sum of the variable weight that each packet retains upon its emergence from the
tissue, which is proportional to the received light intensity). As described earlier
(see Section 2.2) the emergent light intensity decreases exponentially in all
directions with increasing distance from the source.
23

Scientific Background
Figure 2.4 Number of emerging packets versus radial distance from injection point (one million photons launched).
Figure 2.5 Cumulative weight of emerging packets versus radial distance from injection point.
The probable path taken by a photon travelling between a given injection and
emergence point, can be predicted to some degree for a medium of known optical
characteristics and geometry. Figure 2.6 displays the path taken by all photons that
24

Scientific Background
emerged within a radius of 10 mm of the location (15, 15, 0), in a simulation of one
hundred thousand packets using the same optical properties given in Table 2.1.
−10 −5 0 5 10 15 20 −20
0
20
0
5
10
15
20
25
x−axis (mm)
z−ax
is (
mm
)
y−axis(mm)
Figure 2.6 Path taken by photons travelling between the injection point and the emergence area.
The photons travel in an arc between the injection point and the emergence
area, forming a three dimensional shape that is ubiquitously referred to in the
literature as an optical banana. The proportions of this banana within a given
medium depend on the separation of the injection and emergence point, or the
separation of source and detector points in an actual application, with the
penetration depth of the light increasing as the source-detector separation increases.
Note that in order to use a Monte Carlo simulation to characterise a medium in
terms of absorption, scattering, or light fluence, it is necessary to divide the volume
into discrete volumes—voxels. Each time an absorption event takes place, the
appropriate absorption quantity is added to the corresponding voxel. As the voxel
size is reduced, the granularity of the modelled volume is increased, giving better
resolution. However greater granularity results in smaller sampling of the photon
distribution, and consequently greater uncertainty. Lower granularity conversely
25

Scientific Background
provides less resolution but higher certainty of the distribution of light fluence,
absorption, or scattering within a voxel. Thus to achieve accurate results with a
Monte Carlo simulation, a large number of photons must be launched.
The number of photons used to generate the optical paths in Figure 2.6 is
insufficient to characterise the transport of light in a medium in general, and the
photon paths are intended only to illustrate the effect. (It is impracticable to store or
display the paths of very many photons.)
Furthermore, the above simulations characterise the response of the medium
to an infinitely narrow beam of photons. To simulate a realistic beam of incident
photons one of two techniques can be employed. Either the beam profile may be
convolved with the beam source function, or the initial location of the photons may
be varied randomly, with a distribution defined by the source profile.
2.4 SUMMARY
This chapter has presented a short overview of oxygen transportation, light
attenuation in tissue, and light transportation in tissue. The mechanism of oxygen
transportation is important to the method of pulse oximetry and will be shown in
Chapter 3 to affect the choice of wavelengths for a device and, in the case of
functional and dysfunctional haemoglobins, to affect both the accuracy of the
device and the actual measured quantity.
The Beer-Lambert model of absorption and scattering of light in tissue (which
are collectively observable as attenuation) is the basis of pulse oximetry and
Chapter 3 will build on this discussion in describing the method of pulse oximetry.
The banana-shaped path taken by light travelling between two points on the
tissue surface has ramifications for the choice of source and detector geometry, both
in a conventional contact device and especially in a non-contact device. Knowledge
of the shape of this path is used in Chapter 5 as the rationale for choosing the
relative position of the source and detector, and is referred to again in Chapter 6 to
describe the concept of camera-based diffuse tomography.
The Monte Carlo simulation is employed again in Chapter 5 to investigate the
effects of tissue-detector separation on the received light intensity.
26

CHAPTER 3 PULSE OXIMETRY
Equation Chapter 3 Section 1
The technique of pulse oximetry is rooted in the Beer-Lambert based spectrometry
described in the previous chapter. This chapter details the application of the
principles of Beer-Lambert based spectrometry to the specific application of arterial
blood oxygen saturation monitoring. This chapter has two principal objectives. First
it is intended to provide the reader with a thorough explanation of the principles and
technologies that form the basis of all variants of pulse oximetry. Second, following
this discussion, a description is given of some of the technical problems faced by
pulse oximeter designers and manufacturers. Some solutions to common problems
are reviewed. The prominence given to the various aspects of clinical device design
during this discussion, is not necessarily indicative of their importance to the
performance of clinical devices—for example, no consideration is given to the
microprocessor, though it is arguably the most important component of a pulse
oximeter and is the greatest variable among manufacturers. Rather, the discussion
that follows is intended to elucidate aspects of pulse oximeter functionality, which a
novel device must emulate comparably, and aspects of pulse oximeter operation
that are negated, obviated, or complicated, by a non-contact implementation.
27

Pulse Oximetry
3.1 CONTEMPORARY HISTORY OF PULSE OXIMETRY
An electrical engineer ultimately invented pulse oximetry, though the extent to
which it has since been reported upon in biomedical and electronics literature belies
the fact that pulse oximetry properly belongs to the physiological field of blood gas
analysis. Pulse oximetry owes its existence to fundamental investigations by natural
philosophers, physiologists and physicians over three centuries. This brief
discussion focuses only on the recent history of the subject, and then only on the
protagonists and their inventions, which led directly to the present day clinical
monitoring technology. The technology used in oximetry has varied markedly with
the era in which developments took place, and to a large extent, development in
oximetry took place as a result of technological development in other fields. Only
passing reference is made to those technologies here, though the concomitant
complexities of cumbersome sources, non-linear detectors, and weak amplification,
should be borne in mind when considering the pace and magnitude of
achievements.
Gas has been extracted from blood for centuries, initially by vacuum, and the
constituent gases and their quantities identified with ever increasing precision for
the last 150 years (Severinghaus 1987a). Though it has been possible to measure the
tension (partial pressure) of oxygen in blood by various means for some time, the
impetus for optical measurement was the discovery that the electron emission from
cesium cathodes was sensitive to light. This ultimately led to the development of
barrier layer photocells; semi-conductive barriers to electrons that become
conductive when light is incident upon them. Ludwig Nicolai made the first steps
towards modern oxygen saturation measurement in 1931. Using a mercury vapour
light and a rotating filter wheel to produce blue and green light, a vacuum
photoelectric cell detector, and a vacuum tube amplifier, Nicolai occluded the
circulation in his hand and derived curves for the decrease of HbO2 and increase in
Hb over time. Nicolai’s associate, Kurt Kramer, then made the first report of precise
oxygen saturation measurement of blood both in cuvettes and flowing blood in
1934 using an incandescent light and barrier photo cell (Severinghaus 1987a).
Building on their work, in 1935 another German physician, Karl Matthes, produced
the first device to continuously measure oxygen saturation in humans, by
transillumination of the ear (Severinghaus and Astrup 1986d).
The next important development was the outbreak of World War II in 1939.
Military aircraft at the time were not pressurised and at high altitudes, where
28

Pulse Oximetry
oxygen partial pressure is low, aviators sometimes lost consciousness (see
Section 2.1). Scientists involved in the British war effort, notably Lord Adrian,
professor of physiology at Cambridge University, had begun developing oxygen
delivery systems sensitive to altitude and activity. Adrian wrote to the American
physiologist Glenn Millikan asking for help with the task. Millikan was at the time
a lecturer at Cambridge, though had been visiting his parents in the United States at
the outbreak of war in Europe, and had subsequently remained there. Millikan was
well primed to take on the task; he had obtained his PhD for a thesis on a dual-
wavelength colourimeter, he had worked in Germany prior to the outbreak of war,
and in 1936 had been visited by Kramer and adopted the use of the barrier layer
photocell. Between 1940 and 1942, Millikan and his colleague Pappenheimer were
principally responsible for developing a lightweight and practical aviation ear
oximeter, which became know as the Millikan ear oximeter, and incidentally coined
the term oximeter.3 The device was first presented in 1941 (Millikan, et al. 1941).
Millikan and his colleagues had arranged for the device’s production and
successfully incorporated a servo that controlled the supply of oxygen to an
aviator’s mask. The device initially used an incandescent battery operated light, and
red and green gelatine filters. The use of green light was common at the time due to
the high absorption at this wavelength in the haemoglobin spectrum. Millikan had
shown the light detected at this wavelength to be independent of oxygen saturation
and thus useful as a reference wavelength. However just prior to publishing this in
Review of Scientific Instruments in 1942, the device manufacturer informed
Millikan that the ear was so opaque to green light and transparent to infrared light,
that the green filter and its photocell had in fact, fortuitously, been responding
primarily to infrared light. The paper was corrected in time and became the first
report of red and infrared light in oximetry (Millikan 1942).
Although Millikan had been working in the United States, the Unites States
military only became interested in the technology when they learned that the
German Luftwaffe already had such a device (Severinghaus and Astrup 1986d).
Despite having access to much of Matthes’ work (he had been a prodigious author
producing twenty papers on oximetry between 1935 and 1944), the United States
had failed to produce a working device. However after V-E Day, the United States
Army recovered Kramer (then an SS officer) from a Russian prisoner of war camp.
3 The term oximeter, though likely derived from the words oxygen and meter, is now used to refer exclusively to oxygen measuring devices based on the principle of spectrometry—that is optical methods of determining oxygen saturation.
29

Pulse Oximetry
Kramer was brought to the United States to help perfect the technology—which he
did.
Millikan was killed in a rock climbing accident in 1947, though the
tremendous efforts that he and others had expended during the war found new
application in the emerging field of respiratory physiology. By 1950 some sixty six
publications existed that described uses of the Millikan ear oximeter (Severinghaus
and Astrup 1986d). It is important to note, that at this point oximeters, though they
sought to measure arterial oxygen saturation, could not discern the contributions to
their readings from arterial blood, venous blood and scattering and absorption by
tissue. Thus while oximeters of the time could indicate a change in saturation and
could provide a reading proportional, even close to, the arterial oxygen saturation,
they could not provide absolute readings. An important improvement to the
Millikan oximeter was made by Wood and Geraci (1949), building on the work of
Squire (1940), when they introduced an inflatable balloon with which the ear could
be made bloodless to provide an initial zero reading. This technique removed the
components due to scattering and absorption by tissue to the arterial oxygen
saturation reading, though did not remove the contribution from venous blood.
At this point the ear oximeter was still dependent on barrier layer photocell
detector technology. It was not possible to measure the output current of these
devices without causing a drop in voltage that decreased the devices’ sensitivity.
Furthermore the devices’ output current varied with time and temperature
(Severinghaus 1987a; Severinghaus and Astrup 1986d). At about this time Leland
Clarke invented his oxygen electrode, which measured the oxygen partial pressure
in a gaseous mixture or the oxygen tension in a solution. Soon this device made
possible transcutaneous oxygen partial pressure measurement and as a result a
paradigm shift occurred in blood oxygen measurement, physiologists and
physicians began thinking of blood oxygen content in terms of partial pressure
rather than saturation (Severinghaus and Astrup 1986b). The use of oximetry began
to decline, a trend that continued until the development of silicon semiconductor
detectors and high gain solid-state amplification techniques.
The next important milestones in the development of pulse oximetry came in
the nineteen sixties. Previous oximeters had typically used two wavelengths of
light, one sensitive to oxygen saturation and one insensitive. In this manner it had
not been possible to discern the contributions of the various species of haemoglobin
to the saturation reading (see Section 2.1.1). This problem was tackled with the
introduction of the eight-wavelength ear oximeter by surgeon and inventor Robert
30

Pulse Oximetry
Shaw around 1964. This device (constructed from a broadband halogen lamp,
optical fibres and photodiode detector—though still utilising a rotating filter wheel
to produce multiple wavelengths) was bought and marketed by Hewlett-Packard. It
was widely used in physiological research (Moyle 1994), however due to its
expense and the large size of the ear piece, it was seldom used for clinical
monitoring (Severinghaus and Astrup 1986d). Though it was never intended for
clinical monitoring, another important development at this time was the CO-
oximeter, the operation and importance of which is discussed later.
The final step in the emergence of pulse oximetry came in the nineteen
seventies, when the Japanese engineer, Takuo Aoyagi, realised that by isolating the
pulsatile component of the received light intensity, the long sought oxygen
saturation of the arterial blood could be distinguished from all the other components
of the detected light intensity. Aoyagi had actually been trying to measure blood
flow and was initially concerned with removing the unwanted pulsatile component
when the realisation occurred (Aoyagi 1992, 2003; Aoyagi and Miyasaka 2002).
Aoyagi and his colleagues built the first prototype device between 1973 and 1974.
However prior oximeters had never been widely used in clinical applications and in
the decade that followed, few foresaw the potential of pulse oximetry. Severinghaus
and Honda (1987) attributed the enormous interest that eventually developed to the
multi-qualified engineer, physician, and physiologist, William New, and engineer,
Jack Lloyd, who together founded the company Nellcor Incorporated. New
recognised the potential for pulse oximetry in all applications where a patient is
unable to regulate their own oxygen supply. However with the success and
worldwide interest that followed came a lucrative medical instrumentation market,
and with that came patents and litigation (a decorous description of which, is
provided by Severinghaus and Honda (1987)).
The discussion here highlights the impetus and developments that directly
contributed to the invention of pulse oximetry. Also of significance to the modern
technology were the contributions to reflectance oximetry of Zijlstra (1953; 1958)
and his mentor Brinkman.
For an historical overview of the subject of blood oxygen measurement, and
its parent subject, blood gas analysis, the interested reader should refer to the works
of Severinghaus and Astrup (1985a; 1985b; 1986a; 1986b; 1986c; 1986d) and
Severinghaus and Honda (1987). An even more comprehensive and well-narrated
treatise of the subject is to be found in the epic, essay-style paper of Severinghaus
(1987a). For an insight into the early development of the technology, and transcripts
31

Pulse Oximetry
of symposium discussions between early protagonists (including Severinghaus,
Wukitsch, Tremper and others) the interested reader should refer to Payne and
Severinghaus (1986).
The taxonomy of the field of blood gas analysis is depicted in Figure 3.1. It is
apt to think of pulse oximetry as the culmination of the development of the in vivo
oximeters. Its displacement of all other methods of in vivo oxygen measuring in
clinical environments, and the re-reversion of clinical and experimental thinking,
from terms of oxygen partial pressure back to oxygen saturation, is now a matter of
historical record. However, until the emergence of commercial pulse oximeter
devices in the nineteen eighties, oximeter technology faced stiff competition from
chemical methods (particularly the invasive Clarke electrode) and the trans-
cutaneous oxygen partial pressure sensor. A short discussion of the construction and
operation of this device is included below. An appreciation of the Clarke electrode’s
operation is instructive in understanding the revolution that pulse oximetry brought
to clinical oxygen monitoring, and the comparative robustness of the pulse
oximeter.
Also included below is a short description of the aforementioned CO-
oximeter. Though the CO-oximeter is a cuvette-based technique that was neither
intended nor used for in vivo monitoring, it has however, become the gold standard
of laboratory blood oxygen measurement, and is central to the calibration procedure
(see Section 3.3.5) of both conventional pulse oximeters and the novel non-contact
technique described in this thesis.
On the subject of the non-contact device described in this thesis and its
classification within the taxonomy described in Figure 3.1, it could be argued that it
is either the direct descendant of pulse oximetry or perhaps a separate genus of in
vivo oximeters, the non-contact oximeter.
32

Pulse Oximetry
BLOOD GAS ANALYSIS
CARBON DIOXIDE TENSION
MEASUREMENT
Millikan ear oximeter
Fibre optic methods
Pulse oximeterHP 8λ ear oximeter
Optical-chemical oximeterCatheter oximeter
The Cyclops
IN VIVO OXIMETERS
Polanyi and Hehir (1962)CO Oximeter
IN VITRO OXIMETERS
Galvanic electrode Clarke electrode Mixing syringe methodVan Slyke method
OPTICAL METHODS (OXIMETERS)
TRANSCUTANEOUS PO2 SENSOR
CHEMICAL METHODS
OXYGEN MEASUREMENT
PH & ACID-BASE BALANCE
MEASUREMENT
Figure 3.1 Taxonomy of the field of blood gas analysis.
3.1.1 THE CLARKE ELECTRODE AND THE TRANSCUTANEOUS PO2 SENSOR
Leland Clarke invented the Clarke electrode in October 1954, assembling the first
electrode from glass, platinum and silver wire, and a potassium chloride solution,
wrapped in a polyethylene film (Severinghaus 1987a). The electrode measures the
partial pressure of oxygen (PO2) using the principles of oxidation and reduction.
When oxygen is dissolved in an aqueous solution and exposed to a voltage of
approximately 0.6 V the following reaction occurs (Farmer 1997),
2 2O 2H O 4e 4OH− −→+ + . (3.1)
The principle of the electrode is illustrated in Figure 3.2. Since the potassium
chloride solution provides everything for the reaction except O2, the amount of O2
dissolved in the solution determines the amount of current that flows between the
anode and cathode.
33

Pulse Oximetry
Current meter
H2O e- O2
Aqueous solution
OH-Cl-
Platinum cathode
Silver anode
Figure 3.2 Principle of operation of the Clarke electrode.
The actual electrode is arranged in a cylindrical fashion, and is used to
measure PO2 of blood solutions in vitro, and when miniaturised, can be attached to
the end of catheter and placed inside an artery to provide in vivo measurement.
Clarke’s electrode stills forms the basis of most laboratory blood gas analysers
(Shapiro, et al. 1989), and is also commonly used in the food industry, beer and
wine production, aviation, soil chemistry, and sewage management (Severinghaus
1987a).
The Clarke electrode, mounted upon a catheter, is however an invasive means
of monitoring blood oxygen, and the electrode found its greatest clinical use in its
less invasive guise, as the transcutaneous PO2 sensor. The transcutaneous PO2
sensor is depicted in Figure 3.3. Under normal circumstances, PO2 of blood near
the skin’s surface is atmospheric (0.21 bar or 157 mmHg), however hyperaemia
(increased blood volume) of the skin can cause the PO2 of the blood near the
surface to approach the arterial oxygen partial pressure, PaO2. This excess oxygen
near the skin’s surface then diffuses out through the skin and can be detected using
the Clarke electrode. Hyperaemia can be introduced by abrasions, drugs and
creams, or, as in the case of the transcutaneous PO2 sensor, by heating. The
transcutaneous PO2 sensor consists of a Clarke electrode with a heating element
and a thermistor for temperature control. The skin is heated to between 43 °C and
44 °C, the optimum temperature for achieving the desired transcutaneous effect
with minimum skin damage. The sensor must be periodically moved to avoid burns,
particularly with infants.
34

Pulse Oximetry
Silveranode
Gold cathodeInsulator
Polypropylenemembrane
Electrolyte
Heatingelement
PlasticbodyThermistor
Figure 3.3 Transcutaneous PO2 sensor.
The sensor has some advantages over a pulse oximeter; for example, it will
continue to produce a valid output in the presence of anaemia, which a pulse
oximeter will not do. However among its drawbacks are that it requires skin and
electrode preparation, a warm-up time of several minutes, requires recalibration,
reports low PO2 if poorly placed, and requires some operator skill (Barker and
Tremper 1984; New 1985; Severinghaus 1987b). Most of these requirements are
obviated by pulse oximetry, which despite some limitations (see Section 3.4.2)
provides less invasive, safer, and more robust clinical monitoring of oxygen
saturation, with the added benefits of heart rate monitoring and display of the
peripheral arterial pressure waveform.
3.1.2 THE CO-OXIMETER
The term CO-oximeter was coined but not copyrighted by Instrumentation
Laboratories Inc. who produced the first device in 1966 (Moyle 1994). CO-
oximeters are spectrometers designed to analyse haemolysed blood samples using
the Beer-Lambert law (see Section 2.2.1) to determine the concentrations of the
four most common species of haemoglobin; reduced haemoglobin (Hb),
oxyhaemoglobin (HbO2), carboxyhaemoglobin (COHb), and methaemoglobin
(MetHb).
A typical CO-oximeter analyses small samples of heparinised and haemolysed
blood. That is blood to which an anticoagulant has been added, and in which the red
blood cells have been destroyed (often by ultrasound), releasing haemoglobin into
the plasma. Blood samples are maintained at 37 °C. Placing either slits or
interference filters in front of a broadband light source generates several
monochromatic wavelengths of light, which are used to illuminate the blood
sample. The light is usually in the visible range between 500 nm and 700 nm.
35

Pulse Oximetry
Typically a photodiode is used as a detector. Since the test solution contains only
absorbers, the optical path length can be easily measured. The incident light
intensity can be obtained for each wavelength by means of a reference beam.
Determining the concentration of the absorbers is therefore, a straightforward
matter of applying the Beer-Lambert law for the case of multiple absorbers (Moyle
1994).
CO-oximeters are susceptible to error. The presence of scattering impurities in
the blood sample, such as cell fragments remaining from the haemolysis process or
lipids, invalidate the presuppositions on which the Beer-Lambert calculations are
based. CO-oximeters that use few wavelengths of light can be susceptible to error in
the presence of fetal haemoglobin, in which case an overestimation of COHb is
produced (Zwart, et al. 1981). Some CO-oximeters attempt to compensate for this
by using as many as seventeen wavelengths (Farmer 1997). Figure 3.4 depicts a
schematic representation of the IL-282 CO-oximeter. The IL-282 uses four
wavelengths of light that it produces by rotating four interference filters mounted on
a wheel controlled by a stepper-motor.
Cuvette with temperature regulated blood
Broadband lamp
Mirror
Filter wheelwavelengths
526.6 nm
594.5 nm
585.2 nm
535.0 nm
Beam splitter
Filter wheelcontrolled by
stepper-motor Sample detector
Reference detector
Lens
Lens
Figure 3.4 Schematic depiction of the Instrument Laboratories IL-282 4-wavelength CO-oximeter.
36

Pulse Oximetry
3.2 THEORY OF PULSE OXIMETRY
If red or near infrared (NIR) light is transmitted through tissue, the received light at a
detector will capture a slowly varying attenuation due to reflection from the skin,
scattering by tissues such as muscle, bone and fat, and absorption due to tissues
such as muscle, bone, fat and venous and arterial blood. The received light intensity
will also capture a faster pulsatile attenuation component that is due to the pulsation
of arterial blood. Figure 3.5 depicts the components of light attenuation in tissue
and indicates the relative contributions of each.
One pulse
Received light intensity at systole and diastole Id
<1-2%
<20%
>80%
Absorption by pulsating arterial blood
Absorption by arterial blood
Absorption venous blood
Absorption by other tissue
Scattering and reflection of incident light
Is
Ligh
t atte
nuat
ion
Time
Figure 3.5 Components of attenuation in the detected light exiting tissue.4
The pulsatile component of the absorption is specifically caused by the
peripheral arterial pressure waveform, a plot of this waveform is known as a
plethysmogram, or a photoplethysmogram (PPG) if measured by optical means.
Figure 3.6 depicts the arrangement of erythrocytes in an artery at various stages
during the cardiac pulse. At systole (peak pressure) the cells are packed tightly
together and are orientated such that their long axes are perpendicular to the
direction of flow. At diastole (low pressure), the cells are less densely grouped and
are rotated such that their long axes are parallel to the direction of flow. These
effects combine to produce maximum absorption (minimum transmittance) of light
4 Wukitsch et al. (1988) state that an arterial pulsation accounting for 3% of the signal amplitude can be considered normal and 10-11% considered high. Ohmeda pulse oximeters display a low-signal warning when the signal’s pulsatile component falls to 0.2% (Wukitsch 1987; Wukitsch, et al. 1988).
37

Pulse Oximetry
during systole and minimum absorption (maximum transmittance) at diastole
(Liebman, et al. 1962; Visser, et al. 1976).
Tissue surface
Falling Systole Rising Diastole
Source detector separation
Artery diameter
Tissue surface
Figure 3.6 Arrangement and orientation of erythrocytes (red blood cells) during the cardiac pulse.
During the discussion of the modified Beer-Lambert Law (see Section 2.2.2)
several parameters were identified that must be calculated in order to establish the
relative concentrations of absorbing chromophores in a scattering medium. These
parameters were enumerated: the incident light intensity at each wavelength; the
received light intensity at each wavelength—and by implication the detector’s
sensitivity to each wavelength; the optical path length; and the differential path
length factor that accounts for the increase in path length due to scattering. Two
methods of estimating the differential path length factor were described, both of
which required a significant amount of instrumentation. The optical path length for
a transmission geometry is relatively easily calculated, however, for a reflection
geometry it somewhat more difficult (see Section 2.3.3 and the optical banana
displayed in Figure 2.6). Calculation of the incident light intensity also requires
quantification of the reflection from the surface, which is a function of the angle of
incidence and hence also of the light source’s emission profile. A clinical oximeter
operating on the principle of the modified Beer-Lambert law would need to
establish each of these parameters for all wavelengths, for each patient and for each
measurement location. If probe movement were an issue, each parameter would
need continuous updating. Pulse oximetry however eliminates all these parameters
from the estimation of arterial blood oxygen saturation.
38

Pulse Oximetry
3.2.1 LIGHT ABSORPTION FOR PULSE OXIMETRY
Pulse oximetry is a special case of the Beer-Lambert based spectroscopy described
in Section 2.2. This section describes the set of conditional assumptions that enable
the technique of pulse oximetry by eliminating the incident light intensity and the
position and wavelength dependent optical path length as variables from the Beer-
Lambert model.
3.2.1.1 ELIMINATION OF INCIDENT LIGHT INTENSITY AND OPTICAL PATH LENGTH AS VARIABLES
The level of absorption due to tissues such as bone, muscle, fat and venous blood,
varies slowly with respect to the pulse. Let this baseline absorption have
absorptivity α and optical path length d. Let the pulsing arterial blood have
absorptivity αA and path length ∆d (and note that ∆d varies slightly as the blood
pulses). The light emerging from the baseline component Ib, can be written as a
function of the incident light intensity I0, as
b 0edI I α−= . (3.2)
The light emerging from the pulsatile component Ip, can be written as
p be A dI I α− ∆= . (3.3)
Substituting equation (3.2) into equation (3.3) yields the light emerging from
the pulsatile component as a function of the incident light intensity,
p 0(e AdI I α α )d− + ∆= . (3.4)
The transmittance of the arterial component can be defined as the ratio of the
light emerging from the arterial component and the light incident on the arterial
component; which is the light emerging from the baseline component. Therefore the
arterial transmittance T∆ A is given by
p 0
b 0
( )ee
A
A
d d
d
I ITI I
α α
α∆
− + ∆
−= = . (3.5)
The I0 terms cancel out leaving the arterial transmittance as a function of the
pulsatile component’s absorptivity and path length only.
e AA
dT α∆
− ∆= (3.6)
39

Pulse Oximetry
Note that the absorptivity of the pulsatile component is innate to the received
light attenuation signal (refer to Figure 3.5 where Is represents the transmittance at
systole and Id represents the transmittance at diastole). Any device employing this
principle is unaffected by fluctuations in the incident light intensity and is
effectively self-calibrating (Wieben 1997). It now remains to remove the variable
∆d from the calculations.
Taking the natural logarithm of the arterial transmittance yields
ln ln( ) (e )AAA
d dT α α∆− ∆ − ∆= = . (3.7)
Now by comparing the ratio of the arterial transmittance measured at two
wavelengths, a ratio ROS can be calculated such that,
( )( )
1
2 2
1
2
ln ( ) ( )
( ) ( )ln
( )
( )A
A
AOS
A
d
d
TR
T1α λ λ
α λ λ
λ
λ∆
∆
− ∆= =
− ∆. (3.8)
Now the variable distance ∆d (the optical path length over which arterial
absorption takes place) can be considered independent of the wavelength at which it
is measured if two conditions are met. First, the path of light through the artery
should be free of scattering events, since scattering can be wavelength dependent
and increases the optical path length beyond the geometric distance. This is not
strictly true of whole blood. However, the diameter of arteries in the limbs are small
(typically the radial artery is approximately 3 mm, the ulnar 2.5 mm, and the digital
arteries 1.6 mm (Fazan, et al. 2004)), and the mean number of scattering events for
near infrared light travelling in blood is of the order of 1 – 2 mm-1. So provided that
the two measurement wavelengths experience a similar number of scattering events
per millimetre, the first condition is approximately met. The second condition is that
the geometrical distance between the source and detector is the same at each
wavelength. In practice, both sources are located close together and at some
distance from the artery, a common detector, also at some distance from the artery,
is used for both sources, such that the difference in ∆d arising from source
positioning is negligible. Thus the second condition is also met and ∆d can be
considered approximately independent of wavelength—though the first of several
conditions pertaining to the choice of wavelengths has been imposed. Equation
(3.8) reduces to
( )( )
1
2
1
2
ln ( )
( )ln
( )
( )A
A
AOS
A
TR
Tα λ
α λ
λ
λ∆
∆
= = . (3.9)
40

Pulse Oximetry
3.2.1.2 CHOICE OF WAVELENGTHS
It is now required to choose wavelengths λ1 and λ2 such that the ratio ROS in
equation (3.9) is proportional to the arterial oxygen saturation. The precise
definition of arterial oxygen saturation entails some detail and will be discussed in
due course (see Section 3.4.1). For the present a limited but didactic definition will
suffice. Arterial oxygen saturation, SpO2, is the ratio of oxyhaemoglobin to total
haemoglobin. That is,
22
2
HbOO 100%
HbO +HbpS = × . (3.10)
Where the subscript p denotes the arterial oxygen saturation as measured by a pulse
oximeter.
It is now necessary to choose λ1 and λ2 such that one wavelength is most
strongly absorbed by oxyhaemoglobin (HbO2) and the other by reduced
haemoglobin (Hb).
Figure 3.7 depicts the absorption of Hb and HbO2 across a portion of the
visible and near infrared electromagnetic spectrum. It can be seen in Figure 3.7 that
Hb and HbO2 have different absorption across the entire portion of the spectrum
except at 805 nm, termed the isobestic point. Below the isobestic point, absorption
is principally due to Hb, while above the isobestic point most absorption is due to
HbO2. The most commonly used wavelengths in pulse oximetry are 660 nm (red)
and 940 nm (infrared) (Wukitsch, et al. 1988). There are several reasons why these
wavelengths have become prominent. The difference in absorption between Hb and
HbO2 is greatest at 660 nm below the isobestic point, thus absorption measured at
this wavelength will be largely proportional to the concentration of Hb only. Above
the isobestic point the difference is greatest above 970 nm, however from
approximately 950 nm and upwards, the absorption of light by water increases
sharply (Elwell 1995) making the use of these wavelengths impracticable. At
940 nm, absorption by water is sufficiently low, and both the Hb and HbO2
absorption curves are relatively flat. Their flatness is useful. The peak emitted
wavelength of an LED can vary somewhat from the specified value. Additionally,
the peak emitted wavelength can drift during operation. The relative flatness of both
the Hb and HbO2 absorption curves in this region, serves to insulate the calculations
from variances in the peak emitted wavelength of the infrared LED, since movement
left or right of 940 nm does not cause a significant change in absorption of either
species of haemoglobin. Contrast this with 660 nm, where the Hb curve has a steep
41

Pulse Oximetry
slope. Consequently, calculations are very sensitive to variance of the red LED
wavelength, especially at low saturations where Hb is the dominant absorber. (See
Section 3.3.1, and refer to de Kock et al. (1991) and Pologe (1987).) There are
reasons, discussed later, for choosing alternative wavelengths, notably in the
presence of low oxygen saturations (see Section 3.4.1.2 and Mannheimer et al.
(1997)), though another compelling reason to choose 660 nm and 940 nm is that
light emitting diodes have been commonly available—and thus economical to
purchase—at these wavelengths for some time.
Figure 3.7 Absorption spectra of reduced (Hb) and oxyhaemoglobin (HbO2).
3.2.2 DERIVING ARTERIAL OXYGEN SATURATION
Having recorded the intensity of light emerging from tissue at two wavelengths, and
establishing that each has a pulsatile component, that is a PPG, it is necessary to
calculate the variable ROS from the two PPG signals by implementing equation (3.9).
Though ultimately each device manufacturer implements this based on their own
research, two methods are commonly used (Palreddy 1997). They are the peak and
valley method and the derivative method.
42

Pulse Oximetry
3.2.2.1 THE PEAK AND VALLEY METHOD
Cheung et al. (1989b) first described the peak and valley method of deriving ROS in
a US patent application.
Figure 3.8 depicts a red and infrared PPG signal, the signals obtained by
monitoring the intensity of light emerging from tissue. Note that the PPG signals
appear inverted compared to the attenuation-derived waveform depicted in
Figure 3.5.
R H
Rec
eive
d lig
ht in
tens
ity
R L IR H
IR L
IR PPG Red PPG
Rec
eive
d lig
ht in
tens
ity
Time Time
Figure 3.8 Received light intensity from the red (R) and infrared (IR) LEDs over time.
Here the signal peaks correspond to diastolic pressure where the volume of
blood between the source and detector is lowest and the erythrocytes are aligned
with their long axes parallel to the direction of flow. Thus attenuation is at its lowest
and transmittance at its highest. As before, RH represents the baseline transmittance
at the red (R) wavelength, the transmittance in the presence of scattering and
absorption by skin, muscle, bone, fat, venous blood and the absorption due the
normal volume of arterial blood. The difference between RH and RL, represents the
reduction in transmittance due to the pulsation of the arterial blood. The natural
logarithm of the quotient of RL and RH, is the term defined earlier in equation (3.7)
as the natural logarithm of the arterial transmittance,
( )ln ( ) ( ) ( ) ln LA R A R R
H
RT d
Rλ α λ λ∆ = − ∆ =
. (3.11)
Similarly for the infrared (IR) PPG,
( )ln ( ) ( ) ( ) ln LA IR A IR IR
H
IRT d
IRλ α λ λ∆ = − ∆ =
. (3.12)
Equation (3.9) defined ROS as the ratio of these terms,
43

Pulse Oximetry
ln
( )
( )ln
L
A RHOS
A IRL
H
RR
RIRIR
α λ
α λ= =
. (3.13)
Since the numerator and denominator of the ratio ROS, are themselves, ratios
of the valleys and peaks of the red and infrared PPG signals respectively, the variable
ROS is commonly referred to as the ratio of ratios.
3.2.2.2 THE DERIVATIVE METHOD
The peak and valley method has intuitive appeal. The method closely resembles the
reasoning used to explain the concept of pulse oximetry and to develop the ROS
variable. The peak and valley method provides perfectly valid measurements of
ROS, however it has limitations that make it incongruous with clinical monitoring
requirements.
Peaks and valleys in the arterial pressure waveform occur only once per
heartbeat, thus ROS can be calculated only once per heartbeat by the peak and valley
method. As heart rate varies so does the rate at which ROS is calculated. Such a
dependency is unacceptable in a clinical monitoring device. The problem is
compounded by signal processing requirements. To mitigate the affects of spurious
ROS values resulting from artefacts in the PPG waveforms,5 it is desirable that the
current displayed oxygen saturation be in some way derived from a moving
weighted average of the previous calculated values. Under these conditions, the
displayed output saturation value is delayed by several heartbeats, each with a
variable period.
Device manufacturers each implement their own particular solutions to this
problem—some of which are to be found by searching patent claims—however the
underlying method upon which these solutions are based in the derivative method
(Palreddy 1997). Like the peak and valley method, the derivative method is based
on applying the Beer-Lambert law to the PPG signals present in the detected light
intensity, I1. I1 can be described in terms of the constant incident light intensity I0,
as,
5 Artefacts in the PPG can result from motion, momentary direct coupling of the source and detector, ambient light interference, or any other of a number of biological factors such as muscular contractions in the region of the probe.
44

Pulse Oximetry
1 0- ( ) ( )( ) e L tI t I α λ= . (3.14)
In this instance, α is defined as the relative (rather than specific) extinction
coefficient and encompasses the concentration of the chromophore. L is the path
length of the light through the arterial blood and varies as a function of the arterial
pressure waveform, as before it will be assumed approximately equal for both
wavelengths. The rate of change of the detected light intensity with respect to time
is given by,
10
- ( ) ( )( ) ( )e ( )L tdI t dL tIdt dt
α λ α λ= −
, (3.15)
thererefore,
1
1
( ) 1 (( )dI t dL tdt I dt
α λ= −)
. (3.16)
The measured light intensity I1, contains both the desired PPG component and
the large DC offset. However the derivative of I1 is equal to the derivative of the PPG
component alone. Thus the ratio of, the ratio defined in equation (3.16), for two
wavelengths, red (R) and infrared (IR), call it R ', is given by,
( )( )
RR R
IRIR IR
( )/' (/
dI dt IR
dI dt I )α λα λ
−= =
−. (3.17)
This is the variable defined in equation (3.13) as the ratio of ratios, that is,
ROS. For a uniformly sampled discrete time signal, the time domain derivative of a
signal I, is approximately given by,
2( ) ( ) ( )dI t
1I t I tdt
≈ − . (3.18)
Note that if t2 and t1 are chosen to be the peak and valley of the local PPG
signal respectively, then the derivative method reduces to the peak and valley
method.
Potratz (1994) described a variation of the derivative method of calculating
ROS in a US patent, intended for noise reduction. A limited description of the means
by which the Ohmeda clinical pulse oximeters perform ROS calculation is provided
by Wukitsch (1987) and by Wukitsch et al. (1988). The Ohmeda system calculated
the change in received light intensity (∆ I ) at each wavelength thirty times per
second. From these ∆ IR and ∆ I IR, the ratio ROS was calculated and converted to
45

Pulse Oximetry
instantaneous oxygen saturation values SpO2i. A moving weighted average of ten
SpO2i values at a time is used to update the displayed SpO2 value, which is updated
every three seconds. Wukitsch noted that the values of ∆ IR and ∆ I IR obtained close
to the inflection points of the PPG waveforms are less accurate than those obtained
during the rising part of the waveform, and as such are assigned a lower weighting.
Wukitsch and his co-authors were, at the time, Ohmeda employees and did not
describe how the device determined these weights.
Though Wukitsch does not state the cause of the inaccuracies near the
inflection points, they are to be expected on two accounts. First, the change in light
intensity over a given sampling period will be least in the region of the inflection
points, as the rising arterial pressure slows, temporarily remains static, and then
begins decreasing, and vice versa at the next inflection. Since the device has fixed
measurement accuracy, the error associated with very small values will be
proportionately greater. Second, the corresponding measurements of ∆ IR and ∆ IIR
are not made simultaneously but rather in a multiplexed fashion. While the arterial
pressure is rising steadily, the PPG waveform has relatively fixed slope, and
sampling the R and then the IR waveform introduces little error. This is not true at
the inflection points, where the slope may be positive at one sample instant and
negative at the next. (Section 5.4 revisits this in relation to the performance of the
non-contact camera based device described later.)
3.2.3 THE NEED FOR CALIBRATION
The method by which pulse oximetry operates and the exclusion of the variance in
path length and incident light intensity as variables from the calculation seem to
obviate calibration. To a large extent this is true, the isolation of the PPG signal
eliminates the contributions to the attenuation of the detected light that result from
reflection from the skin’s surface, and the relatively static attenuation due to
absorption and scattering by muscle, bone, fat, venous blood and other tissues.
However the change in attenuation that occurs over the duration of the cardiac
pulse, due only to arterial blood, is itself composed of both absorption and
scattering. The varying absorption (discussed above) was attributed to a rotation of
the biconcave erythrocytes and the increase in blood volume (that is more densely
packed erythrocytes) at systolic pressure. The erythrocytes, on which the absorbing
haemoglobin species are located, have a diameter of approximately 700 nm
(Wieben 1997). This is sufficiently close to the wavelength of the interrogating light
46

Pulse Oximetry
to cause Mie scattering. In addition, the populous erythrocytes are suspended in
plasma, each of which has a different refractive index, and so light is scattered by
the erythrocyte-plasma interface. The probability of scattering occurring at the
interface is determined not just by the respective refractive indices, but also by the
angles of incidence and transmission of the light (see Section 2.3.3). To compound
the complexity of this scattering, the erythrocytes and plasma are constantly pulsing
between the source and detector with the orientation of the erythrocytes alternating
with the pulse. In addition the magnitude of this effect varies with oxygen saturation
as the various species of absorbing haemoglobins become more or less numerous—
not to mention patient-to-patient variances such as anaemia (deficiency of
erythrocytes or haemoglobin) and sickle-cells (characterised by abnormally shaped
red blood cells). A further consideration is the bandwidth of the light sources: the
calculations assume monochromatic sources, the measurement of the emission
spectra of the LEDs in the non-contact device (presented in Section 5.2.4.2)
indicates the degree to which this assumption may be invalid.
For illustrative purposes, a comparison is made here, of the theoretically
predicted and empirically observed, variance of attenuation at two wavelengths
with arterial oxygen saturation (SaO2). For simplicity, assume that the only species
of haemoglobin present are oxyhaemoglobin HbO2, and (reduced) haemoglobin
Hb. Thus when SaO2 is 100%, HbO2 accounts for all of the haemoglobin and Hb
accounts for none; at 50% SaO2, they each account for half the haemoglobin; at 0%
SaO2, Hb accounts for all haemoglobin and so on. Using the common red and
infrared wavelengths of 660 nm and 940 nm respectively, the specific extinction
coefficients (α) of Hb and HbO2 are: αHb, 660 = 3.4408, αHb, 940 = 0.7874,
αHbO, 660 = 0.3346, and αHbO, 940 = 1.3520, each with units mMolar-1 cm-1 (from the
values reported by Cope (1991), see Figure 3.7). The absorption due to arterial
blood at each wavelength can be calculated using the equations,
,660 ,660660 0,660
(e )Hb Hb HbO HbCI I α α− × + ×= OC
)
, (3.19)
,940 ,940940 0,940
(e Hb Hb HbO HbCI I α α− × + ×= OC
. (3.20)
The variable C denotes the relative concentrations of either Hb or HbO and varies
between 0 and 1 as SaO2 varies. The sum of the relative concentrations of both
wavelengths is thus always 1. The optical path length is omitted from the
calculation using the earlier argument that it is approximately equal for both
47

Pulse Oximetry
wavelengths. The incident light intensity I0, is set to be the same for each
wavelength, thus the ratio of red to infrared arterial absorbance is given by,
660
940
lnln
(( )OSR
)II
= . (3.21)
The resulting curve is plotted in Figure 3.9 as the solid line. Also plotted in
Figure 3.9 is the empirically observed change in the ratio of the absorbance at the
same two wavelengths, as reported by Wukitsch et al. (1988). The empirical change
in absorption with SaO2 is linear. The empirical and theoretical graphs are in
relatively close agreement while oxygen saturation is above 37%, however below
this saturation6 the empirical observation increasingly underestimates the arterial
oxygen saturation. At high saturations, a small measurement error might be
tolerated, since decisions regarding the patients’ management would likely not be
affected. However at low saturations, decisions regarding a patient’s management
are critical and device error in this region of operation could be extremely
consequential.
Figure 3.9 Deviation of theoretically predicted and empirically observed, red/infrared ratio variance as a function of oxygen saturation.
6 Wukitsch et al. do not state how data pertaining to low oxygen saturations are obtained. Presumably it is by extrapolation or in vitro calibration techniques, since it is unacceptably dangerous to desaturate a human subject below 85% due to the risk of hypoxic brain damage (Moyle 1994). Note that Schowalter (1997a) suggests that a saturation as low as 60 % is achievable. Some studies have been made of pulse oximeter performance at low saturations using hospitalised patients already exhibiting very low saturation, see Kelleher (1989) for a summary of such studies.
48

Pulse Oximetry
For this reason, several studies have been conducted investigating the
applicability of various absorption and scattering models to pulse oximetry. Steinke
and Shepard (1986) studied the multiple scattering model developed by Twersky
(1970). Marbel et al. (1994) also studied this topic but reached the conclusion that
such models could not replace clinical calibration studies.
Some equations have been developed that relate measured ROS to SpO2 using
clinically derived constants. Mendelson and Kent (1989) derived the curve,
1 22
3 4
OSp
OS
k k RS O
k k R−
=−
. (3.22)
Where k1…k4 are clinically determined constants.
Fine and Wienreb (1995), report the use of a quadratic polynomial curve by
Ohmeda and Radiometer pulse oximeters, of the form
. (3.23) 22 1 2 3pS O k k R k R= + +
Where k1…k3 are again, clinically determined constants
The use of lookup tables is a popular alternative, as multiple conversion
curves can be stored to accommodate variances in the interrogation wavelength
(Moyle 1994; Wieben 1997).
3.3 OPERATION OF A CLINICAL DEVICE
3.3.1 LIGHT EMITTING DIODES
All clinical pulse oximeters utilise light emitting diodes (LEDs) as light sources
(Bourgeois 1997). LEDs produce light by electroluminescence, which is highly
efficient compared to other forms of light emission such as photoluminescence or
high-temperature emission. The fact that LEDs are so suited to the application is a
result of the convergence of several parameters. First, LEDs emit light with
wavelengths over a range of approximately 700 nm from violet (about 400 nm, just
below indigo and blue) in the visible range to the near infrared. This band of
emission overlaps the near infrared window into tissue (Jobsis-vanderVliet 1999)
and coincides with suitable peaks in the absorption spectra of Hb and HbO2 (Elwell
1995).
49

Pulse Oximetry
Manufacturers commonly specify the following parameters of LEDs: peak
emitted wavelength, bandwidth, beam angle, forward voltage, forward current and
corresponding emitted power, power dissipation, reverse breakdown voltage,
reverse current, operating temperature, switching times, maximum pulse current as
a function of duty cycle and frequency, dimensions, and finally, cost. A thorough
explanation of all of these parameters is to be found in many electronics textbooks
and handbooks. It is sufficient here to say that the requirements of pulse oximetry
do not approach the limits of any of these parameters—with two caveats. First the
specified peak emitted wavelength of a light emitting diode, can vary from one
device to the next, by an amount sufficient to introduce a significant error in the
calculated oxygen saturation percentage. Steps must be taken to account for this.
Second, in pulse oximetry, LEDs are placed in direct contact with the skin, often for
long periods. LEDs have the capacity to cause burns and their power dissipation
must meet certain specifications.
3.3.1.1 VARIANCE IN PEAK EMITTED WAVELENGTH
LEDs produced in bulk from the same material should have the same characteristics
including peak emitted wavelength. As with all manufacturing processes,
imperfections occur. Pologe (1987) investigated the variance in peak emitted
wavelength of LEDs produced in bulk from the same lot at the common
wavelengths of 660 nm and 940 nm, and found that the variance can be as much as
15 nm from the specified peak wavelength. This is particularly important at the
lower red wavelength, where the absorption spectrum of Hb has a very steep slope.
Figure 3.10 displays the effects on the theoretical ratio of the red and infrared
signals, caused by a 15 nm increase in the peak emitted wavelengths of a 660 nm
and a 940 nm LED, as the arterial oxygen saturation varies between 100% and 0%.
(The values of the Hb and HbO2 extinction coefficients at these wavelengths were
reported by Cope (1991) and the description of how these curves are generated was
given in Section 3.2.3.) Note that the deviation of the empirically observed red–
infrared ratio from the theoretical variation with arterial oxygen saturation was
discussed in Section 3.2.3.
50

Pulse Oximetry
Figure 3.10 Variance in red/infrared ratio caused by a 15 nm increase in peak emitted wavelength, in the red (660 nm) and infrared (940 nm) LEDs.
To compensate for this effect device manufacturers employ one of two
strategies. During manufacture, the peak emitted wavelength of each diode is
measured using a spectrometer. With the first strategy the manufacturer uses only
diodes that are extremely close to the specified wavelength, for example, Hewlett
Packard selects diodes that are within ±1 nm of 660 nm for the red wavelength
(Bourgeois 1997). The second strategy used by manufactures is to note the peak
emission wavelength of each LED and then to include some way for a device to
interrogate a probe upon connection and choose a calibration curve appropriate to
the two wavelengths contained in that probe. A common method of performing this,
described in patents by New and Corenman (1987; 1988), is to include a resistor in
the probe, the resistance of which, indicates the wavelength combinations of the
LEDs contained in that probe. When a probe is connected to a device, the device
sends a current through the coding resistor and uses the measured voltage drop to
determine the resistance and hence the wavelengths.
Each method has its drawbacks—selecting only LEDs that meet the criteria
diminishes the cost saving of bulk buying, while the addition of an extra component
and the associated additional functionality required by the coding resistor method
have a direct cost. Both approaches require measurement of every purchased LED.
51

Pulse Oximetry
3.3.1.2 DRIFT IN PEAK EMITTED WAVELENGTH
The wavelength of light emitted from an LED is described by,
g
hcE
λ= , (3.24)
where Eg is termed the band gap (or energy gap) in electron volts, h is Planck’s
constant, c is the speed of light in a vacuum, and λ is the wavelength of emitted
light. The physical properties of the material from which the LED is constructed
determine the value of Eg. Materials such as gallium arsenide phosphide (GaAsP)
and gallium phosphide (GaP) are commonly used to construct LEDs in the visible
range with wavelengths from 380 nm to 740 nm, while gallium arsenide (GaAs) is
commonly used to produce near infrared wavelengths. Though less common
gallium aluminium arsenide (GaAlAs) can be used to produce both visible and near
infrared light (Bourgeois 1997).
Eg is also a function of the p-n junction temperature, typically decreasing as
temperature increases (Varshni 1967), which, referring to equation (3.24), causes
the emitted wavelength to increase. During operation, the pulse oximeter LEDs are
alternately pulsed with duty cycles ranging from 2% to 50% depending on the
manufacturer (Reynolds, et al. 1991). The resulting average driving current is
usually still sufficient to cause heating of the p-n junction. Note that pulse oximeters
typically vary the driving current to each LED in proportion to the amplitude of the
detected PPG at that wavelength (Bourgeois 1997; Moyle 1994).
In addition to the heating caused by driving current, the effect of ambient
temperature can be significant. de Kock et al. (1991) investigated these effects using
wavelengths of 660 nm and 950 nm. The maximum shift of peak wavelength due to
driving current (at 100% of maximum rated drive current for duty cycle and
frequency) was 8 nm for the red LED and 0 nm for the infrared LED. For an increase
in ambient temperature from 0 °C to 50 °C, the maximum shift of peak wavelength
was 5.5 nm for the red LED and 7.8 nm for the infrared LED. Referring again to
Figure 3.10, though the error due to peak wavelength drift during operation is
smaller than that resulting from device-to-device peak wavelength variance, it will
be significant.
Device manufacturers compensate for this by either placing a temperature
sensor in the probe or by directly monitoring the driving current for both LEDs. In
both cases, the information is fed back to the device’s microprocessor, where an
estimate is made of the current LED wavelengths. The device then chooses a new
52

Pulse Oximetry
calibration curve appropriate to the current wavelength combination (Bourgeois
1997).
3.3.1.3 PREVENTION OF BURNS
Several international and national standards have been published pertaining to pulse
oximetry: ISO 9919 and ASTM F1415. For the most part these documents specify
the parameters, data, and methods of calibration, which the manufacturer should
provide or make available on request. Issues such as electrical safety and
electromagnetic interference are also covered, as well as descriptions of alarms that
devices should provide. For the most part these documents are of limited use to
pulse oximeter designers. The American Food and Drug Administration requires
that the temperature of the contact region between the probe and the skin not exceed
41 °C. The pertinent LED parameter is the specified thermal resistance, which is
defined as the increase in p-n junction temperature (TJ) above the ambient
temperature (TA), per unit of power dissipation (PD), with units of °C/W. In the
event there is no heat sink, it is given by,
J ATH
D
( ) =
T TR
P−
. (3.25)
Typically, LEDs used in pulse oximeters possess a sufficiently low RTH and
low average driving current to pose no significant risk (Bourgeois 1997). Moyle
(1994) noted that although there had, as of 1994, been several reports of pulse
oximeter probes causing burns, especially in small children, these were most likely
not caused by thermal emissions from LEDs; rather Moyle suggests that these were
pressure necroses caused either, by the probe being too tight, or by poor perfusion
of the skin under the probe. Note however that some specialised pulse oximetry and
tissue oximetry applications utilise higher performance LEDs with highly dissipative
metal cases, which may be necessitated by a demand for deeper tissue penetration,
beyond the normal requirements of pulse oximetry. Such systems have the potential
to cause thermal injuries and care should be taken to ensure compliance (see Coyle
(2005) as an example of such a system).
53

Pulse Oximetry
3.3.2 PHOTODETECTORS AND AMPLIFIERS
One of the hindrances to early oximetry was the lack of suitable detectors. While
the photocells used by early oximeters were sensitive across the wavelengths now
used in pulse oximetry, those devices produce a varying resistance in response to
changes in incident light intensity. Their response is highly non-linear and slow. In
addition they are temperature sensitive. The magnitude of the change in resistance
produced by incident light is very large, typically between 100 Ω and 100 MΩ
between dark and illuminated conditions (though Schowalter (1997b) states that it
can be as large as 1014), which makes incorporating them into instrumentation
circuitry challenging. They are also unsuitably large with diameters of 5 mm to
25 mm.
Modern pulse oximeters have a range of alternative devices available. Shottky
diodes provide ultra fast response times, though are typically used in ultraviolet
sensing applications. Avalanche photodetectors (APDs) use an avalanche
multiplication effect to provide very high sensitivity. APDs are suited to specialised
applications where detected light levels are low (see Coyle et al. (2004) as an
example of such). However APD response time is comparatively slow and the large
reverse bias required for their operation creates a large electric field that may
preclude the use of APDs in some clinical situations (Pallas-Areny and Webster
1991). Phototransistors possess some characteristics favourable to pulse oximetry,
notably they can provide built-in current amplification, yielding a light-to-current
conversion ratio that can be hundreds of times greater than a similar photodiode.
Phototransistors were used in early pulse oximeters (Schibli, et al. 1978) though
their comparatively large dark currents and non-linear sensitivity over the range
useful in pulse oximetry ultimately saw them replaced by photodiodes as the sensor
of choice (New and Corenman 1987).
Photodiodes offer good linearity between incident light and output current
when connected in a photoconductive mode, at a reasonable cost. The only
challenger to their dominance is the integrated circuit (IC) detector. IC devices can
incorporate a photodiode and transimpedance amplifier, to produce an output
voltage that varies linearly with incident light intensity. By placing the initial
amplification stage so close to the source, IC detectors can achieve excellent noise
performance. The principal drawback to the IC detector is that the component itself
is several times the price of a photodiode and requires extra wires. Its size may also
be a limiting factor in some applications.
54
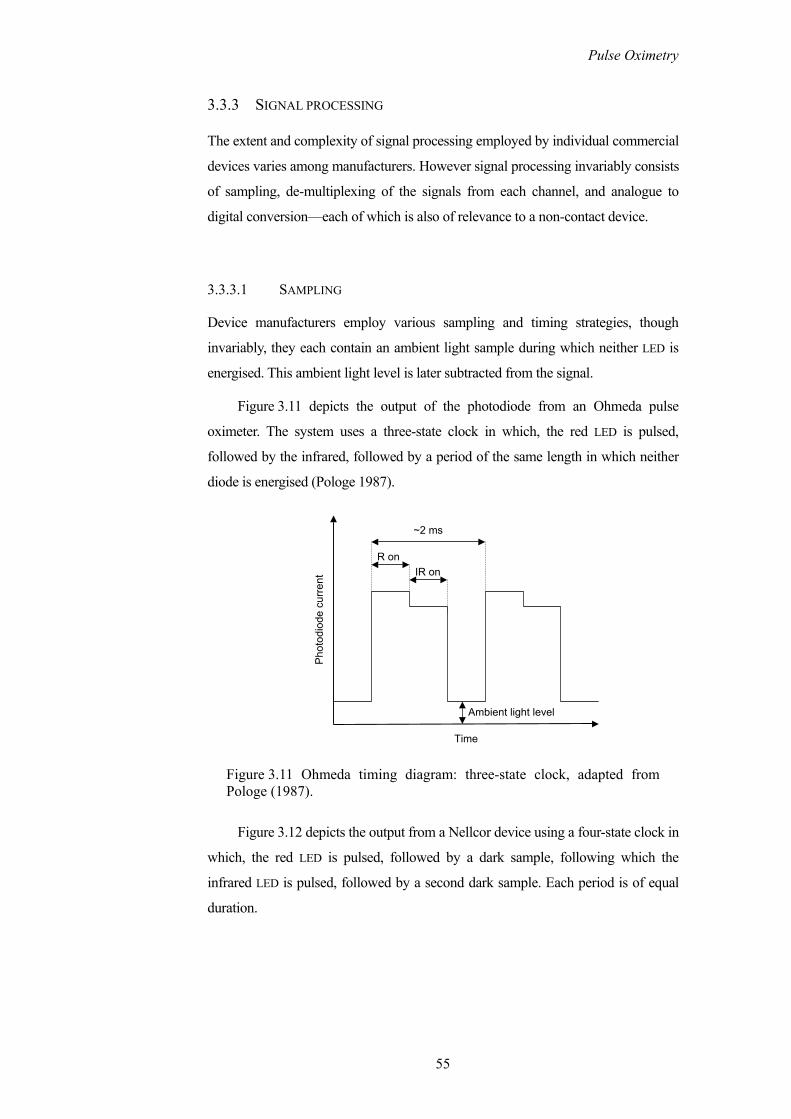
Pulse Oximetry
3.3.3 SIGNAL PROCESSING
The extent and complexity of signal processing employed by individual commercial
devices varies among manufacturers. However signal processing invariably consists
of sampling, de-multiplexing of the signals from each channel, and analogue to
digital conversion—each of which is also of relevance to a non-contact device.
3.3.3.1 SAMPLING
Device manufacturers employ various sampling and timing strategies, though
invariably, they each contain an ambient light sample during which neither LED is
energised. This ambient light level is later subtracted from the signal.
Figure 3.11 depicts the output of the photodiode from an Ohmeda pulse
oximeter. The system uses a three-state clock in which, the red LED is pulsed,
followed by the infrared, followed by a period of the same length in which neither
diode is energised (Pologe 1987).
Ambient light level
~2 ms
R onIR on
Pho
todi
ode
curr
ent
Time
Figure 3.11 Ohmeda timing diagram: three-state clock, adapted from Pologe (1987).
Figure 3.12 depicts the output from a Nellcor device using a four-state clock in
which, the red LED is pulsed, followed by a dark sample, following which the
infrared LED is pulsed, followed by a second dark sample. Each period is of equal
duration.
55

Pulse Oximetry
Ambient light level
~680 µs
IR onR on
Pho
todi
ode
curr
ent
Time
Figure 3.12 Nellcor timing diagram: four-state clock, adapted from Paranjape (1997).
The comparative merits of either sampling strategy or of other sampling
strategies are unreported in the literature.
3.3.3.2 DE-MULTIPLEXING
The photo diode detector of the pulse oximeter probe produces a continuously
varying output current that is sampled by a sample-and-hold circuit. Since the
photodiode’s output current contains information from both the red and infrared
channels, the signal is first de-multiplexed to produce two separate red and infrared
signals. Each signal is then low-pass filtered to remove any high frequency
switching noise (Paranjape 1997).
3.3.3.3 ANALOGUE TO DIGITAL CONVERSION
Note that the detected light intensity consists of a pulsatile, and non-pulsatile
component that varies slowly compared to the pulsatile component. Recalling the
discussion of Section 3.2, both of these components are required for the calculation
of the arterial oxygen saturation. However it is also important to measure the
pulsatile PPG component as accurately as possible (see Section 3.2.2.2 on the
inaccuracy of ROS readings obtained near the inflection points). Thus the maximum
utility of the analogue to digital conversion (ADC) quantization range would not be
obtained were the captured light intensity signals to be quantized directly, since a
large part of the quantization range would be used up by the almost stationery DC
offset. Therefore, prior to ADC the DC component is removed, its magnitude
56

Pulse Oximetry
digitised and stored, such that it can be added back to the signal prior to later
calculations where it is required. The matter was first described in a US patent by
Cheung et al. (1989a). (Whether this remains a problem for contemporary clinical
devices, with access to modern ADCs, is questionable, it is however pertinent to the
camera-based device described later, where limited quantization range will be
shown to be consequential.)
3.3.4 PROBES
The discussion so far in this chapter has alluded principally to transmission of light
through tissue, in practice, pulse oximeter probes can operate by transmittance or
reflectance—though the use of the word reflectance is a little misleading as the
sensor is actually detecting what is more accurately described as backscattered light.
The term reflectance is an anachronism that dates from the nineteen fifties, prior to
studies of light propagation in tissue, it remains in use in relation to pulse oximetry
(see Section 2.3.3). Within the category of reflectance probes, probes may also be
reusable or disposable.
3.3.4.1 TRANSMITTANCE PROBES
In the case of a transmittance probe, the two LEDs and the photo diode are housed in
a clip designed to fit around a finger or toe, the bridge of the nose, or the earlobe.
The photodiode is located on one side of the clip with the two LEDs side by side on
the other side of the clip directly opposite the detector. The clip itself serves to
shield the detector from ambient light and to maintain good contact between the
optical elements and the tissue. The only significant variable in transmission probes
is the force applied by the clip. This varies with manufacturer and model. If the
force exerted by the probe is significant, the blood underneath the probe may clot
and if the force is insufficient motion artefacts may increase (Reddy 1997).
The advantage of transmittance probes is that they are reusable indefinitely
and have the lowest associated cost per usage. Their disadvantages include the
aforementioned risk of clotting, their tendency to reduce circulation in the region of
the probe over time, and the risk of cross contamination. Indeed cleaning of the
probe is required between patients, and their use in not recommended for infectious
patients or patients with high risk of infection, such as neonates or immuno-
57

Pulse Oximetry
suppressed patients. As such, transmittance probes are best suited to short term
monitoring, typically less than four hours (Reddy 1997).
3.3.4.2 REFLECTANCE PROBES
Early investigations into measurements in a reflection geometry were conducted by
Brinkman and Zijlstra, who produced a commercially available reflectance
oximeter for measurements from the forehead—the Cyclops—as early as 1950.
Detailed studies were subsequently published by Zijlstra (1953; 1958). The idea of
reflectance (backscatter) based oxygen saturation measurement marked a significant
advancement in non-invasive measurement, ultimately making possible measure-
ment from any part of the body surface.
In the case of disposable probes, which are invariably reflectance probes, the
probe is adhesive. For reusable reflectance probes some variety of adhesive wrap is
used (Reddy 1997).
The mechanisms of back scattering of light in tissue were discussed in
Chapter 2. The two variables of concern in the design of reflectance probes are the
source and detector separation and the photosensitive area of the detector—or
indeed the number of detectors and their arrangement.
As the source and detector separation increases, so does the penetration depth
of the detected light. A greater penetration depth and longer optical path, illuminates
a larger vascular bed, and increase the likelihood of detecting a suitable PPG.
However, for a given incident light intensity, as the source and detector separation
increases the detected light intensity decreases.
Mendelson and Ochs (1988) investigated the effect of using three photodiode
detectors, arranged symmetrically around the two LEDs. This effectively tripled the
photosensitive area of their detector and allowed proportionately larger PPG signals
to be detected for a given source and detector separation. Reddy (1997) stated that
the same effect could be obtained by using a photodiode with three times the area.
This is likely inaccurate, as a single detector with an enlarged area could not be
positioned such that the extra area is equidistant from the source. Since the detected
light intensity decreases with increasing radial separation of the source and detector,
the extra area of the larger photodiode would receive increasingly less back
scattered light as it becomes distant from the sources, compared with the case of
three detectors arranged symmetrically. However, a case will be presented later in
58

Pulse Oximetry
this thesis, for favouring one large continuous detection area rather than multiple
symmetrically arranged discrete locations (see Section 5.5.2), particularly where the
source and detector separation is considerable.
3.3.5 CALIBRATION OF PULSE OXIMETERS
Recall from the discussion in Section 3.2.3, that while the technique of pulse
oximetry removes the unwanted contributions of absorption and scattering by
tissues other than the arterial blood, scattering by the arterial blood itself, causes the
empirically observed ratio of absorption at two wavelengths to differ from that
predicted by theory (see Figure 3.9). For this reason it is necessary to derive
empirical calibration curves that map the observed ratio of absorption at two
wavelengths to the actual value of arterial oxygen saturation. Calibration can be
performed in vivo or in vitro.
3.3.5.1 IN VIVO CALIBRATION
In vivo calibration was until 1993 the only method used to calibrate pulse oximeters
(Moyle 1994). In vivo calibration typically takes place in a hospital environment
using informed and consenting, non-smoking, healthy volunteers as human test
subjects. Subjects are fitted with an indwelling arterial cannula placed in the radial
artery. An initial arterial blood sample is taken and tested to ensure that only normal
adult haemoglobin is present and that each subject’s background levels of
carboxyhaemoglobin and methaemoglobin are within normal limits. Typical values
are MetHb < 1% and 1% < COHb < 2% (Moyle 1994; Schowalter 1997a;
Wukitsch, et al. 1988). A CO-oximeter is used to determine the oxygen saturation of
the blood samples precisely. The subjects breathe air or oxygen-enriched air until
their arterial blood samples show 100% saturation. The subjects’ arterial oxygen
saturation is gradually and incrementally reduced by replacing the oxygen in their
breathing gas with nitrogen, and pausing at each step to allow time to equilibrate.
When the device under test indicates a stable reading, an arterial sample is
immediately taken and analysed by the CO-oximeter. The data from each device are
plotted against each other to yield a graph with oxygen saturation on the vertical
axis and ratio of absorption at two wavelengths on the horizontal axis (see
Figure 3.9). A lookup table is then constructed to perform an exact mapping of the
ROS readings from the device under test to the corresponding SaO2 level, or, a
59

Pulse Oximetry
transform equation is constructed that generates a best fit to the plotted graph. This
process must be repeated for every LED wavelength combination that the
manufacturer intends to use in their probes.
There are several reasons why in vivo calibration is unsatisfactory. The
principal reason is that because it is unsafe to desaturate a human test subject below
85% (due to the aforementioned risk of hypoxic brain damage), the data that result
from in vivo calibration pertain only to high oxygen saturations—where the need to
ascertain accurate oxygen saturation readings is least. The mapping of ROS to SaO2
for lower saturations must be extrapolated.
3.3.5.2 IN VITRO CALIBRATION
In vitro calibration methods can be divided into those that use blood or
haemoglobin solutions and those that do not. Methods that do not use blood or
haemoglobin solutions can generally provide only one reference saturation point,
which limits their utility. Though the appeal of a blood free device is such that
several attempts have been published—see Munley (1989) for a pragmatic
example—the consensus however, is that versatile in vitro methods require a blood
or haemoglobin solution (Reynolds, et al. 1992).
Several blood-based in vitro techniques have been described in the literature
and in patents, ranging in complexity from Yount’s (1989) wedge-based technique
to the comprehensive system described by Reynolds et al. (1992). The system
described by Reynolds et al. is depicted in Figure 3.13. It serves as a good example
of the tasks and components involved.
The system uses whole blood to which the anticoagulant heparin has been
added. A computer controlled peristaltic pump circulates the blood around a closed
loop with minimum damage to the erythrocytes, mimicking the pulsatile blood flow
of the arteries. A gas-mixing pump provides a mixture of O2, N2 and CO2, in user
defined proportions. The CO2 is necessary to maintain the correct pH and realistic
carbon dioxide partial pressure. Gas diffuses into and out of the blood through an
oxygen membrane, which provides a large permeable interface area with gas on one
side and a thin film of blood on the other, mimicking the alveolar function of the
lungs. The probe of the pulse oximeter under test is attached to a phantom finger in
which the blood is circulating. A sample port provides an extraction point for blood
samples, which are subsequently analysed by a CO-oximeter. The computer, using
60

Pulse Oximetry
parameters fed-back from a second, modified pulse oximeter, varies and controls
the gas mixture and rate of peristaltic displacement, to simulate the desired heart
rate and arterial oxygen saturation.
Gas supply
Probe of deviceunder test
Phantom finger
Circulating blood
Sample port to CO-oximeter
MembraneoxygenatorComputer
controlled peristaltic
pump
Reservoir
Mixing Pump
CO2 NO2O2
Figure 3.13 Apparatus for in vitro calibration of pulse oximeters (Reynolds, et al. 1992).
The construction of the phantom finger, to which the probe of the device under
test is attached, is an important factor. The phantom should possess similar
absorptive and scattering properties to a real finger and in addition, should exhibit a
similar variance in volume to a real finger, when exposed to the artificial pulse. A
system similar to that of Reynolds et al. was developed by Vegfors et al. (1993),
though with a greater emphasis on the phantom finger.
61

Pulse Oximetry
3.4 LIMITATIONS AND APPLICATIONS OF PULSE OXIMETRY
3.4.1 ACCURACY AND ERRORS
In Section 3.2.1.2 the saturation quantity, SpO2, displayed by a pulse oximeter was
defined as the ratio of oxyhaemoglobin to total haemoglobin. This definition is
imprecise and in need of revision. The quantity defined in equation (3.10) is in fact
the functional arterial oxygen saturation, defined as,
22
2
HbOFunctional O 100%
HbO + HbaS = × . (3.26)
The functional oxygen saturation ignores species of haemoglobin that are
present in the blood but not available for oxygen transportation. The percentage
oxygen saturation of all haemoglobin in the blood is termed the fractional oxygen
saturation, and is given by,
22
2
HbOFractional O 100%
HbO + Hb + HbCO + MetHbaS = × . (3.27)
It is important to note that pulse oximeters measure neither of these quantities,
but rather measure the absorption of light at two wavelengths and use empirically
derived calibration tables to map the ratio of the absorption at each wavelength to
either the fractional or functional saturation. Since pulse oximeters are calibrated
using a CO-oximeter, which measures at least the four quantities in the denominator
of equation (3.27), CO-oximeters can measure either functional or fractional
saturation. Thus a pulse oximeter can display an estimate of either the fractional or
functional oxygen saturation; it is up to the manufacturer to explicitly state which
parameter their particular device is estimating.
It is important to remember that regardless of the manufacturer’s goal to
measure fractional of functional saturation, the device will display neither of these
quantities, since, invariably, the patients’ blood pH and background levels of
dyshaemoglobins will differ from those of the calibration subjects’—and perhaps
significantly since a patient is presumably in a state of illness when monitoring
commences. Moyle (1994) stated that the quantity displayed by a pulse oximeter,
SpO2, is best thought of and referred to, as the oxygen saturation as displayed by a
pulse oximeter, since it is variable between devices and unavoidably inaccurate in
either case to a varying degree.
62

Pulse Oximetry
With this in mind, how good is a pulse oximeter’s estimation of arterial
oxygen saturation, and how useful is it?
Pulse oximeter performance is rated by its accuracy; the systemic error or bias
associated with the method; and, its precision; the reproducibility of the
measurement or the variation of the random error associated with the
measurements. The CO-oximeter is the gold standard against which pulse oximeter
performance is calibrated and compared. (CO-oximeter manufacturers (IL 482)
report precisions as high as 0.5% (Tungjitkusolmun 1997).) It is obviously desirable
that the magnitudes of these parameters are as small as possible—however in
clinical practice it is generally acceptable for a device to exhibit a 95% confidence
limit of ±3% (Tungjitkusolmun 1997), though its accuracy will be determined by
several factors relating to the patient’s condition.
Some of the other factors affecting pulse oximeter accuracy are summarised
below. They are naturally of great interest to clinicians and competing device
manufacturers alike.
3.4.1.1 DYSHAEMOGLOBINS AND FETAL HAEMOGLOBIN
The affects of dyshaemoglobins and fetal haemoglobin beyond their normal
background levels are multifarious. Any increase in their levels causes an increase
in the denominator of the fractional saturation defined in equation (3.27). Their
overall effect on the displayed SpO2 value is determined by the haemoglobin
specie’s absorption spectrum and the wavelengths of light used by the pulse
oximeter.
A discussion of their individual affects on SpO2 is to be found in Moyle
(1994), Reynolds et al. (1993), and Tungjitkusolmun (1997).
3.4.1.2 SATURATION, PERFUSION, AND OTHER FACTORS
Perhaps the most crucial relationship to quantify is the variance in pulse oximeter
error as a function of oxygen saturation. This is typically specified for regions of
oxygen saturation. In the region of high saturation (greater than 97.5%) the
statistical parameters pertaining to a pulse oximeter’s performance are difficult to
establish accurately. Since pulse oximeters never display saturations greater than
100% the accuracy and precision of their measurements in this region are biased
63

Pulse Oximetry
(Clayton, et al. 1991a). However patients in this saturation range are in no
immediate danger.
Pulse oximeters have reliable performance in the region of normal saturation
(90% to 97.5%). This is the easiest region in which to obtain in vivo calibration
data. In a study of thirteen commercial devices Webb et al. (1991) found that eight
devices had absolute mean errors of less that 1% and a standard deviation of less
that 2%, while in the remaining five devices these figures were 2% and 3%
respectively. Taylor and Whitman (1988), reported a mean bias of +2.8% for five
commercially available devices in the saturation range 80% to 100%.
At low saturations (less than 80%) pulse oximeters are most susceptible to
errors. Recall from Section 3.3.5 on calibration that it is unethical and dangerous to
repeatedly desaturate volunteers to these levels during in vivo calibration. Thus
many of the calibration curves are extrapolated in this region. The absorption
spectrum of the most abundant absorber at these saturations, Hb, is steep at the
common red wavelength of 660 nm, making devices particularly susceptible to
wavelength variances at these saturations (see Section 3.3.1). Webb et al. (1991)
also reported the use of intensive care patients exhibiting low saturations to test the
same thirteen devices. The results varied among manufacturers, though absolute
values of bias and precision decreased in all devices. Two devices, a Datascope
Accusat and a Nonin 8604, had biases within 1.7% of each other for normal
saturations, which increased to 15.9% for low saturations.
Mannheimer et al. (1997) conducted the first study aimed at improving pulse
oximeter performance in the crucial low saturation range. They used both Monte
Carlo and photon diffusion numerical models to simulate the affect of wavelength
on oximetry accuracy at low saturations. They concluded that wavelengths of
735 nm and 900 nm provide the best trade-off between low saturation accuracy and
the need to equilibrate the fractional change in path length experienced by both
wavelengths (see Section 3.2.1.1).
Since pulse oximeters require an arterial pulse, low perfusion can be
problematic. Poor perfusion and a concomitant reduction in peripheral arterial
pulsations can result from hypothermia, vasoconstriction, hypotension, or cardiac
arrest. Another interesting complication can result from venous congestion, where
blood is accumulated within an organ. The resulting backpressure can introduce
pulsations into the venous blood, which cause that blood to contribute to the pulse
oximeter reading. Since venous blood is considerably less rich in oxygen, the
64

Pulse Oximetry
resulting SpO2 values are lower than the true value (Tungjitkusolmun 1997). This
phenomenon is also the basis for venous oximetry, in which, an artificial pulsation
that is discernable from the natural arterial pulsation, is introduced to the venous
blood. When combined with pulse oximetry, venous oximetry has the potential to
yield local tissue oxygen consumption data in a relatively non-invasive manner
(Chan, et al. 2003).
Some further factors that can introduce error are: motion artefacts, optical
interference, intravenous dyes, nail polish, activity, and the presence of dried blood.
3.4.1.3 ACCURACY AND PROBE LOCATION
Some consideration should also be given to the location of the pulse oximeter
probe. Under certain conditions, principally rapid desaturation, the accuracy can
vary with probe location. It has been known for some time that PPG signals captured
from the finger differ significantly compared to those captured from the ear. Nijboer
and Dorlas (1985) demonstrated that changes in pressure during induction,
maintenance, and recovery from anaesthesia, are greater when recorded from the
finger, and hence should preferably be measured from the finger.
In relation to pulse oximetry, Severinghaus et al. (1989) found that ear and
forehead probes generally had a much faster response to changing SaO2 values than
finger probes. Young et al. (1992) conducted a significant study of this phenomenon
at the Royal Air Force Institute of Aviation Medicine. They measured the response
times of thirteen pulse oximeters from ten manufacturers using twenty-six probes
(thirteen ear and thirteen finger probes) to a 10% step reduction in arterial oxygen
saturation. Ear probes showed a faster response than finger probes.
In relation to poor perfusion, Clayton et al. (1991b) showed that finger probes
have superior performance to either ear, nose or forehead probes, and recommended
their use in poor perfusion situations.
3.4.2 LIMITATIONS
J. Severinghaus at the conclusion of a considered history of the entire field of blood
gas analysis (to which he himself made significant contributions in carbon dioxide
measurement) said of pulse oximetry:
65
Pulse Oximetry
Pulse oximetry is arguably the most important technological advance ever made in monitoring the well-being and safety of patients during anesthesia, recovery and critical care.
(Severinghaus 1987a)
J. Moyle however, promulgated this caveat, enjoining users against complacency:
The reputation of the technique of pulse oximetry can be maintained only if its limitations are always borne in mind. Currently this in not the situation and the indicated value of SpO2 is relied on totally by most users.
(Moyle 1994)
Beyond the technical and circumstantial constraints discussed above, two
inherent factors largely account for the limitations of the technique. They should be
borne in mind equally by the clinician managing a patient and by the researcher
seeking to find new applications.
The first is pulse oximetry’s ability to monitor oxygen delivery, be it too much
or too little. Lack of oxygen at a cellular level is termed hypoxia. Hypoxia can be
further categorised into four groups: hypoxic hypoxia (arterial Hb oxygen saturation
is low), anaemic hypoxia (Hb concentration is low—but may be well saturated),
stagnant hypoxia (low cardiac output or vessel occlusion), and histotoxic or
cytotoxic hypoxia (oxygen is delivered but cells are unable to utilise it). Of these
categories, pulse oximetry can measure and indicate only one—hypoxic hypoxia—
though a device may produce readings during instances of other types of hypoxia.
Thus a patient may be globally or locally hypoxic despite SpO2 readings to the
contrary.
Also on this point, pulse oximetry is insensitive to the delivery of too much
oxygen—hyperoxia. Excess oxygen can be toxic, leading to either central nervous
system (CNS) toxicity (that can result immediately upon exposure to very high
oxygen partial pressure, typically greater than 1.6 atm (United States Navy 1994)),
or pulmonary oxygen toxicity (that can result from prolonged exposure to oxygen
partial pressures above 0.5 atm (Moyle 1994), common in intensive care). This
limitation of pulse oximetry is important in monitoring patients receiving
supplementary oxygen, particularly premature babies and neonates, who can suffer
retinopathy, resulting in blindness, if their arterial oxygen saturation is allowed to go
too high (Moyle 1994).
The second limitation of pulse oximetry is that it requires a pulse. Though it is
desirable to monitor the oxygen saturation of a patient experiencing cardiac arrest,
or, exhibiting an irregular pulse, low perfusion, or low blood volume (hypo-
66

Pulse Oximetry
volaemia), this is exactly when pulse oximetry either, is precluded in the case of
cardiac arrest, or should be treated sceptically in the remaining cases. Indeed Moyle
(1994) states that all pulse oximeters should display a PPG, and that the indicated
SpO2 value should not be relied upon unless the displayed PPG bears a strong
resemblance to an arterial pressure waveform complete with dichrotic notch.7
It is worth noting that the limitations of the technique of pulse oximetry apply
equally to both existing clinical devices and to any future non-contact device that is
based on the principle.
3.4.3 APPLICATIONS
The clinical applications of pulse oximetry in medicine are as important as oxygen is to life. This may seem an overstatement, but as more and more pulse-oximeters are coming into use, more and more hypoxaemic events are being seen as precursors of pathological events.
(Moyle 1994)
The scientific and medical literature is filled with examples of studies in which
pulse oximetry has been either the subject or an investigative tool. There are
numerous calls for, and statements that, pulse oximetry should become a standard
technique in monitoring patients where their own ability to regulate breathing is
diminished by either illness or medical treatment. However, the volume of
publications on the subject, suggests that pulse oximetry has already been adopted
as a standard in these situations. Indeed it has been suggested in several fields of
medicine that pulse oximetry should become, or is already being used as, a fifth
vital sign (Mower, et al. 1998; Mower, et al. 1997; Neff 1988).
In addition to its common functions pulse oximetry has been used surgically to
assess the viability of bowel tissue and in so doing, to discern recoverable from
irrecoverable levels of ischaemia of bowel tissue (DeNobile, et al. 1990). A list of
other uses to which pulse oximetry has been put since its inception, includes but is
not limited to the following:
- Assessing the perfusion of extremities and transferred tissue during
illness, after injury or surgery, and after reattachment (Lindsey, et al.
1991).
7 The dichrotic notch is the inflection in the falling edge of the PPG that results from a momentary back flow of blood caused by the abrupt closure of the aortic valve. See
. Figure 3.5
67

Pulse Oximetry
- In emergency medicine as a quick indicator of the likelihood of
desaturation as a cause of malaise and to monitor the effectiveness of
cardio pulmonary resuscitation.
- In dentistry where sedation or anaesthesia is used and to indicate the
perfusion and viability of dental pulp (Schmitt, et al. 1991).
- In monitoring sleep apnoea and generally in sleep studies.
- In continuous assessment of sick neonates—to whom high saturation
may also be dangerous.
- In monitoring the health of pilots of high performance aircraft and in
monitoring the effects of commercial aircraft cabin pressure on
passengers.
- Monitoring both mother and child during childbirth.
- Computer controlled oxygen weaning.
- Cerebral oxygen measurement through the eye and measurement of the
saturation of the retina—which is important in monitoring the progress
of diseases such as diabetes.
- Veterinary medicine.
Key to many of these applications, for example, monitoring the saturation of
mother and child during childbirth (Chung and McNamara 1993), measuring retinal
and cerebral saturation (de Kock, et al. 1993) (which unlike peripheral circulation is
not affected by shock, hypothermia, or haemorrhage), and measuring oesophageal
saturation (Kyriacou, et al. 2002; Kyriacou, et al. 2003) in patients under going
thoracic surgery (and who consequently have very low peripheral circulation), has
been the development of new and different probes apt to the particular needs of the
monitoring situation.
It should also be noted that many applications of pulse oximetry are in fact
utilising only the ability of a pulse oximeter to a display a PPG. For example,
compromised extremities or transferred tissue (such as skin, muscle flaps, and
digits) can be assessed using two probes, one on a healthy limb and the other on the
compromised extremity or transferred tissue.
68

Pulse Oximetry
3.5 CHAPTER SUMMARY
This chapter has reviewed the principles of pulse oximetry and highlighted some
aspects of commercial device design and construction. Commercial devices employ
numerous sophisticated digital signal-processing techniques and are comprised of
both a microprocessor and specialised instrumentation electronics. Though the
degree of sophistication varies among commercially available devices, the process
of capturing two PPG signals simultaneously at two different wavelengths is
fundamental to all conventional pulse oximeters, and equally so to a non-contact
device. As a further point on the importance of capturing a PPG, while this chapter
has emphasised how a PPG signal is captured by a pulse oximeter and how arterial
oxygen saturation is subsequently determined, the ability of a pulse oximeter to also
display a PPG signal is an integral part of the device’s clinical usefulness. The pulse
rate (which is determined from the PPG signal) and the profile of the waveform
itself, when interpreted in conjunction with the arterial oxygen saturation, greatly
enrich the capabilities of a pulse oximeter, as both a monitoring and diagnostic tool.
The aspects of clinical device design that have been highlighted—particularly
choice of source and detector, source and detector separation, reflection-based pulse
oximetry, and sampling strategy—will be prominent themes in the design
considerations for a remote non-contact device (Chapter 4), and will be shown to
have a strong bearing on the performance of such a device (Chapter 5).
Additionally this chapter has highlighted some of the uses and inherent
limitations of the technique of pulse oximetry, as well as the importance of the
technique in its primary application. The current diversity of applications in which
pulse oximetry is employed and particularly its use in anaesthesia, surgery and
patient monitoring (with which it has become synonymous), are in stark contrast to
the needs that spurred its development—an example of Diamond’s adage that in
contradiction to the popular saying, invention is often the mother of necessity
(Diamond 1997).
Together these areas of discussion provide a useful insight into the
functionality that a novel device must posses as well as defining the levels of
accuracy and precision that a novel device must approach. The description of the
limitations of pulse oximetry is instructive in delineating the capabilities and desired
functionality of a remote camera-based pulse oximeter from existing camera-based
tissue oxygenation monitoring techniques utilising similar technologies, however
with markedly different design requirements.
69

CHAPTER 4 DESIGN CONSIDERATIONS
Equation Chapter 4 Section 1
This chapter outlines considerations pertaining to the choice of source and detector
in a remote non-contact pulse oximetry (or photoplethysmography) application.
This chapter is concerned primarily with identifying suitable technologies for use as
a source and detector, while the details of the system used in this study are
presented in Chapter 5, along with analyses of both the components’ performance
and the system’s performance. This chapter also summarises the existing safety
guidelines pertaining to exposure to near infrared light.
4.1 CHOICE OF SOURCE
Section 3.2.1.2 described the three constraints on the choice of illumination
wavelength imposed by the technique of pulse oximetry. They were that the
wavelengths should fall within the optical window into tissue, that the two
wavelengths should be on opposite sides of the Hb/HbO2 isobestic point, and that
each wavelength should have a similar differential path length factor.
In addition the nature of a remote camera-based system requires that the
optical density of the tissue and the emitted power at each wavelength should be
sufficient to allow the detection of PPG signals at each wavelength, while
70

Design Considerations
maintaining an illumination intensity that is safely within the maximum permissible
exposure for that wavelength.
The formulation of the theory describing light attenuation by tissue assumed
monochromatic light sources. In practice monochromatic light is difficult to
produce within the power, size, and safety constraints of a clinical environment—as
is very narrow-band light. While some light emission at wavelengths other than the
desired wavelength can be accommodated, it is required as a minimum that the two
sources have no significant emission at common wavelengths, which can lead to
cross talk between the haemoglobin species.
There are three categories of light sources that meet these criteria: light-
emitting diodes (LEDs), laser diodes, and broadband sources (used in conjunction
with optical filters).
Lasers meet all of the criteria except safety, where their coherent light makes
them hazardous particularly to the eyes and especially in the near infrared where the
projected light is invisible to the naked eye.
Broadband sources (such as tungsten or halogen lamps) used in conjunction
with optical filters do not easily lend themselves to quickly alternating the emitted
wavelength (though such a source was utilised in the earliest reported studies of
camera-based non-contact photoplethysmography by Blažek et al. (2000) while an
annular ring of LEDs was used by Hülsbusch and Blažek (2002)).
Laser diodes are generally suitable though they are relatively large and often
require optical fibres to couple them to the tissue. By comparison LEDs are small
and relatively inexpensive. When used with inbuilt lenses LEDs can be arranged to
create various illumination patterns. The only drawback of LEDs in their application
to non-contact pulse oximetry is that light from an LED is emitted over a wide angle.
Even with the incorporation of a lens this limits the distance at which the light
source can be located from the tissue under investigation.
Other than the choice of illumination method the only other design
consideration pertaining to the light source is safety.
4.1.1 SAFETY GUIDELINES
The mechanisms by which light can cause damage to biological tissue include
thermal, acoustic, optical (electric breakdown), and photochemical interactions
71

Design Considerations
(ICNIRP 1996). The occurrence of each type of interaction is governed by the
wavelength of light and the duration of the exposure. For example, pulses less than
approximately 0.1 ms can lead to acoustic damage caused by rapid local expansion
of heated tissue, pulses of less than a nanosecond can cause optical breakdown and
plasma formation, while lengthy exposures (greater than 10 s) to very short
wavelengths can cause photochemical damage (ICNIRP 1996)—sun burn being an
example. The wavelengths used in pulse oximetry fall into the category visible and
IRA light, defined by the International Commission on Non-Ionizing Radiation
Protection (ICNIRP) as 400 nm to 1400 nm.
Although there are no definite boundaries between injury mechanisms, certain
mechanisms predominate according to the spectral region and exposure duration
(ICNIRP 1997). The pulse durations used in pulse oximetry (see Section 3.3) are
considerably longer than the threshold at which tissue damage can occur either by
acoustic or optical breakdown mechanisms. Within the visible-IRA range,
photochemical damage is predominant over thermal damage only in the wavelength
range 400 nm to 700 nm. Above 700 nm thermal damage is predominant with
injury to the skin resulting from temperature rises exceeding 45 °C (ICNIRP 1997).
LEDs in pulse oximeters are widely considered safe from a radiation perspective;
most absorption in tissue at these wavelengths is due to blood, which is constantly
circulating. Indeed the primary cause of heating of the skin in pulse oximetry is heat
conduction from the p-n junction, discussed in Section 3.3.1.3. Bozkurt and Onaral
(2004) conducted a study of skin heating resulting solely from semiconductor
junction heating. They found the temperature increase in skin due to the
semiconductor junction to be in the range 1 °C to 10 °C. Both Bozkurt and Onaral
and Ito et al. (2000) place the temperature increase due to near infrared light
absorption alone at less than 0.5 °C. The risk of burns caused by semiconductor
junction heat conduction is obviated by a remote non-contact application.
Guidelines exist for both incoherent broadband light sources (ICNIRP 1997)
and coherent monochromatic laser sources (ICNIRP 1996, 2000), though narrow-
band LEDs belong to neither category. With the advent of high power LEDs and their
widespread use have come calls for the development of safety standards specific to
LEDs (Horak 1999). ICNIRP (1997) recommends adherence to broadband safety
guidelines when evaluating the safety risk posed by LEDs; in contrast, the
International Electrotechnical Commission (IEC) includes LEDs in its safety
guidelines for laser products (British Standards 1994). The IEC guidelines are more
conservative and specify the following maximum permissible exposure (MPE) of
72

Design Considerations
skin to coherent light in the range 700 nm to 1400 nm (exposure time t,
103 s < t < 3×10⁴ s),
. (4.1) 20.002 ( 700)MPE = 2000 10 [W/m ] λ× −×
Individual LEDs generally do not exceed this exposure limit—though an array
of high power LEDs utilising lenses may have the potential to do so. The compliance
of the array used in this study is discussed in Section 5.2.2.3.
4.2 CHOICE OF DETECTOR (CAMERA TECHNOLOGY)
Various silicon semiconductor based detectors are used in near infrared spectro-
scopy applications. The band gap of silicon (the energy required by an electron to
move from the valance band to the conduction band) is approximately 1.12 eV.
Thus incident light with a wavelength shorter than approximately 1107 nm has
sufficient energy to induce conduction, making such detectors well suited to tissue
oximetry and pulse oximetry applications.
Within tissue oxygenation studies and particularly imaging based studies, the
charged coupled device (CCD) is the detector of choice. A CCD is effectively an
array of either photodiodes or photogates. In dedicated near infrared spectroscopic
systems, tissue is illuminated by a broadband source. Detected light is coupled to
the spectrometer by a fibre bundle where it is projected at a prescribed angle of
incidence onto a diffraction grating (or prism). Light is diffracted from the grating
(or refracted from the prism) at an angle that is a function of its wavelength; thus
different wavelengths of light fall on different parts of the CCD array and the
intensity of each can be measured separately (Lerner 2006). Such systems are suited
to measuring the oxygenation of small regions of immobile tissue. Two such
techniques are described by Irwin (1995) and Stranc (1998), which describe the use
of tissue oxygenation and perfusion monitoring to assess the viability of tissue
during plastic surgery.
CCDs have also been employed as detectors in camera-based systems to
measure regional variation in tissue oxygenation. Sowa et al. (1997), Sowa et al.
(1999a; 1999b), Sowa et al. (2001), and Attas (2001), present studies on tissue
hydration and oxygenation during surgical procedures and following burns using
both a spectrometer and a non-contact CCD-camera-based system. To acquire
images at various wavelengths, broadband sources were used to illuminate the
73

Design Considerations
tissue and either fixed wavelength or liquid crystal tuneable filters of variable centre
wavelengths were placed in front of the camera lens. The studies were interested in
establishing the value of tissue oxygenation and hydration monitoring as indicators
of tissue viability.
The development of non-contact camera-based tissue oxygenation imaging
systems seem—in name at least—similar to the goal of non-contact camera-based
pulse oximetry. However unlike tissue oxygenation, arterial oxygen saturation does
not vary regionally, thus there is little merit to arterial oxygen saturation imaging
with the intent to observe variation (refer to the discussion of oxygen transportation
in Section 2.1). A camera-based system does however, through its optics, offer the
ability to observe a significant area of tissue, while preserving the possibility of
compensating for motion.
Though a camera-based approach is suited to the task of non-contact pulse
oximetry, the nature of pulse oximetry, as opposed to tissue oximetry, places
significantly different demands on the camera. Changes in tissue oxygenation occur
over several minutes (Sowa, et al. 1997); arterial oxygen saturation changes are
more rapid (see Section 3.3.4) and the technique of pulse oximetry requires the
capture of two pulse signals simultaneously. Non-contact camera-based pulse
oximetry requires that near infrared spectroscopy be performed at faster frame rates
than are necessary in camera-based tissue oximetry. The technique of pulse
oximetry also requires narrow band (ideally monochromatic) light sources. Neither
the frequency response nor the time-domain response of the liquid crystal tuneable
filters used in the above studies is sufficient for use in pulse oximetry. Since a
silicon-based camera sensor has no inherent means of differentiating the intensity
due to incident light of different wavelengths, a camera-based system must resort to
the conventional pulse oximetry method: alternately illuminate tissue with two
separate sources at different wavelengths and construct a multiplexed output from
the detector.
The requirements of a camera for use in remote non-contact pulse oximetry
are thus: that it be sufficiently sensitive to measure the difference in absorption
(received light intensity) at two wavelengths of light (detector quantum efficiency
and signal to noise ratio); that it be capable of capturing frames at a rate sufficient to
monitor the pulse component of the change in absorption at both wavelengths in a
multiplexed fashion (frame rate); that it be capable of quantizing these data to a
useful resolution (bits per pixel); that it have sufficient dynamic range; and that it be
74

Design Considerations
capable of imaging a sufficiently large region of tissue that the observation of a PPG
signal at each wavelengths is probable (frame size).
Collectively these requirements can be grouped into two conflicting demands
of the imaging sensor: high sensitivity and accuracy, and high data rate. Although
CCD sensors have been the incumbent technology in scientific digital imaging
applications since its inception, the conflicting requirements of sensitivity and speed
that arise here, warrant the inclusion for consideration of CCD’s competing
technology—complimentary metal oxide semiconductors (CMOS).
4.2.1 CCD IMAGE SENSORS
Figure 4.1 depicts three common CCD sensor architectures: full frame, interline
transfer, and frame transfer. The full frame CCD sensor is the original format and
consists of an array of adjacent pixels. Each pixel consists of one photodiode or one
photogate. During an exposure incident photons with sufficient energy cause
photoelectrons to accumulate in the pixels upon which they are incident. At the end
of the exposure the charge from every pixel in the array is readout sequentially via a
buffer row in a process that manufacturers often refer to as a bucket brigade. The
charges from the last row of the array are transferred to the buffer row by reducing
the voltage in the last row and simultaneously increasing the voltage in the buffer
row. The charges in each of the above rows are moved to the row directly beneath
in the same manner. The charges in the buffer are then shifted horizontally towards
the amplifier. This coupling of charges is what gives the technology its name. At the
amplifier the charges from the accumulated photoelectrons are converted to
voltages. When each column of the buffer row has been emptied the next row from
the array is moved down. The arrows in Figure 4.1 depict the path taken by the
charge collected in one pixel on its way to the amplifier.
The sequential manner in which charge is read from a full frame CCD array
means that the readout time is long, and during readout the pixels are still
accumulating charge from the incident light. This causes the appearance of vertical
stripes in the captured image, emanating from bright parts of the image, known as
smearing, which can only be avoided through the use of a mechanical shutter that
halts exposure almost simultaneously across the array. This is of no concern in still
photography but is impractical in video applications.
75

Design Considerations
Smearing can be avoided by the use of an interline transfer layout. In such
schemes a small channel of light-shielded pixels are placed between each column
on the array. At the end of an exposure the accumulated charge in each pixel is
transferred to the adjacent shielded pixel thus ending the exposure. In addition it is
possible to conduct the readout of the previous frame during the exposure of the
current frame, thus increasing frame rate. The impunity from smearing and
increased frame rate however come at the expense of fill factor—that is the ratio of
the optically sensitive area to the total area of each pixel is reduced. By reducing the
fill factor the sensitivity of the array is reduced.
Full frame Frame transfer
Amplifier
Charge movement
Light shielded area
Light sensitive area
Interline transfer
Figure 4.1 Three common CCD image sensor architectures.
An alternative is the frame transfer CCD architecture, in which a second array
of light-shielded pixels is attached to the sensing array. At the end of an exposure
the charge from the sensing array is transferred to the shielded array. During the
next exposure the charge from the shielded array can be readout in the conventional
76

Design Considerations
way via a buffer row. Frame transfer architectures achieve frame rates and levels of
smearing mitigation higher than those of full frame architectures but lower than
those of interline transfer architectures. Their advantage over interline transfer
architectures is that fill factor and thus sensitivity is not compromised—their
disadvantage is that they require almost twice as much space and power.
An important characteristic of an image sensor’s performance that
incorporates several physical characteristics of the sensor itself is its dynamic
range—the ratio of a pixel’s saturation level (its full-well capacity) and its threshold
level (the minimum incident light required to produce an output signal in excess of
the noise floor). The threshold is determined by the characteristics of the material
from which the sensor is constructed, the fill factor, and the amount of noise
producing circuitry surround the image sensor. Saturation level is determined by the
size of the pixel and in the case of CCDs, the penetration depth of the electric field
that couples the pixels. When a CCD pixel becomes saturated any additional
accumulated charge spills over into adjacent pixels, an effect known as blooming.
Unlike smearing, which is characterised by vertical stripes, blooming causes streaks
to spread out radially from bright points in the image.
All forms of CCD sensor read every pixel in the array serially, thus charge to
voltage conversion and amplification are performed by a single amplifier. Large
array sizes and high frame rates place a heavy burden on this amplifier, which must
have an extremely high bandwidth. The amplifier’s bandwidth is a limiting factor in
some CCD applications.
4.2.2 CMOS IMAGE SENSORS
Figure 4.2 depicts a schematic of a CMOS image sensor. Each pixel of a CMOS
sensor is composed of an optical sensing area (photodiode or photogate) and an
optically insensitive area comprised of between one and five transistors. Between
each row and column of a CMOS sensor are optically insensitive metal tracks. The
fill factor of a CMOS sensor is thus always less than 100%.
77

Design Considerations
Column decoder
Output voltage Column buffer
Ext
erna
l row
add
ress
Row
dec
oder
External column address
Figure 4.2 Schematic of generic CMOS image sensor architecture.
CMOS sensors also contain a row and column decoder. During the readout
process any pixel or any group of pixels can be selected arbitrarily by their row and
column address. Unlike CCD sensors, the accumulated charge in each pixel of a
CMOS sensor is converted to a voltage and possibly amplified within the pixel.
The original CMOS sensors contained only one transistor per pixel and were
referred to as passive or 1T sensors. With just one transistor per pixel, 1T devices
could provide arbitrary readout from the array but no amplification and thus
suffered from low signal to noise ratios. Additionally they are subject to the same
smearing effects during readout as full frame CCD sensors. They are now obsolete.
Modern CMOS sensors have active pixels containing a minimum of three
transistors (3T). Charge collection and accumulation, charge to voltage conversion,
and amplification all occur within the pixel. Immediate amplification of the signal
78

Design Considerations
improves their SNR, though at the expense of fill factor and thus sensitivity and
dynamic range. To reduce the impact of extra components per pixel on fill factor
manufacturers switched to finer lithography wafer fabrication processes (typically
0.25 µm, 0.18 µm, or less). This increased cost and ultimately lead to the need for
manufacturing processes dedicated to CMOS image sensor production; CMOS
imagers had originally shared production processes with standard memory and
logic production processes giving them a cost advantage over CCD sensors, which
have always required customised processes. (Indeed the erudite reader may have
already noted the similarity between dynamic random access memory and the
CMOS sensor depicted in Figure 4.2.)
In-pixel amplification also gives rise to a phenomenon known as fixed pattern
noise. This results from slight variations in the amplifiers across the array. Fixed
pattern noise must be corrected by image processing.
Though 3T devices offer acceptable SNR for many applications they are
subject to smearing of the image during readout in video applications. A certain
amount of smearing is acceptable in some consumer applications though not in
most scientific or industrial applications. The addition of a fourth of fifth transistor
per pixel (4T and 5T) can provide such functions as electronic global shuttering and
correlated double frame shuttering (in which the dark current or pixel thermal noise
is subtracted from the recorded value for each pixel).
4T and 5T devices have significantly better SNR and dynamic range than 3T
devices.
4.2.3 CHOOSING BETWEEN CMOS AND CCD
CCD sensors have traditionally offered good sensitivity, good SNR, good
uniformity, and good dynamic range by virtue of their inherently high fill factor and
full well capacity. CMOS sensors have typically lagged CCD in each of these areas
but have traditionally been capable of higher frame rates and lower power
consumption. Figure 4.3 depicts the relative positions of the various CCD and CMOS
architectures in relation to some of these parameters.
Manufacturers are constantly improving the performance of both technologies
within both of their traditionally strong and weak areas. Many manufacturers
provide highly specialised devices that utilise cooling of the sensor, anti-reflective
coatings to minimise reflection losses, rear illumination to minimise transmission
79

Design Considerations
loss, micro-lenses over each pixel to mitigate the effects of diminished fill factor,
and various other techniques.
Though both technologies have become associated with various specialised
applications, for example CCD with spectroscopy and CMOS with machine vision,
non-contact pulse oximetry is a new application and the choice of technology is not
obvious, requiring both sensitivity and speed.
Inherent signal to noise characteristics
OS
Fast—but— lower dynamic range and greater non-uniformity across sensor
High full-well capacity— but—require mechanical shutter and prone to blooming Passive
(1T) CMInterline transfer CCD
5T CMOS
4T CMOS
3T CMOS
Frame transfer CCD
Full frame CCD
Achievable fram
e rate
Fill
fact
or
Complexity
Figure 4.3 Comparison of the characteristics and tradeoffs associated with various CCD and CMOS architectures.
CCD undoubtedly provides the greater sensitivity; the quantum efficiency of a
CCD pixel benefits from the larger fill factor. The sensitivity of a sensor is also a
function of the SNR. CMOS sensors have a greater amount of noise producing
circuitry mounted on the chip. Sensitivity is important to this application as tissue is
optically dense and light may have to traverse several centimetres before re-
emerging at greatly reduced intensity.
Quantization range and dynamic range are also important to non-contact pulse
oximetry. In conventional contact pulse oximetry the variation in received light
intensity due to the pulse may under normal circumstances be as little as 1% of the
total received light intensity (see Section 3.2). The camera’s ability to record such a
variation in both brightly and dimly illuminated areas of the image is determined by
80

Design Considerations
its dynamic range. CCD sensors provide better dynamic range by virtue of higher
sensitivity during low levels of illumination and larger full well capacity during
high levels of illumination. Both technologies can provide sufficient quantization
levels for non-contact pulse oximetry—that is sufficient to characterise the profile
of the PPG waveform.
To choose between CCD and CMOS it is necessary to prioritise the camera
requirements of non-contact pulse oximetry. Sensitivity is a desirable characteristic
of all detectors, however pulse oximetry does not require the sensitivity of tissue
oximetry methods, which endeavour to quantify the concentrations of individual
chromophores. Provided the tissue is sufficiently well illuminated either CCD or
CMOS cameras can provide sufficient sensitivity to detect a PPG waveform by non-
contact means. Thus the overriding consideration in choosing an image sensor is the
ability to achieve a frame rate sufficient to sample two PPG waveforms in a
multiplexed fashion while providing a suitable frame size.
As a constraint on the minimum frame size, a suitable size means that the
combination of the number of pixels per frame and the magnification produced by
the system’s optics, provide sufficient sensitivity to capture a PPG signal, while
imaging an area of tissue sufficiently large that the observation of a PPG signal is
probable. As a constraint on the maximum frame size, suitable size means that the
achievable frame rate should not be unduly diminished by an excessive number of
pixels per frame.
CMOS sensors generally offer higher frame rates than comparable CCD
sensors and crucially, posses the capability of varying the frame size—allowing
even higher frame rates.
This capability is paramount in non-contact pulse oximetry, in both offline
processing and especially in real-time processing. For this reason a CMOS image
sensor was adopted in this study.
81

CHAPTER 5 INSTRUMENT DESCRIPTION AND PERFORMANCE
Equation Chapter 5 Section 1
This chapter is intended to serve two purposes. First, the chapter details the
construction and operation of a novel non-contact remote camera-based device;
capable of capturing two PPG signals simultaneously—the prerequisite for pulse
oximetry. The non-contact system described here is based on the principles and
methods of conventional pulse oximetry, described in detail in Chapter 3. The
components of the system, principally an array of LEDs and a CMOS camera, were
designed and chosen respectively, in accordance with the considerations,
constraints, and requirements that were discussed in Chapter 4. The second purpose
of this chapter is to present a methodical investigation of the comparability of
measurements from the non-contact camera-based device with those from a
conventional contact device. Conventional devices perform three core functions:
monitor SpO2, monitor pulse rate, and display a plethysmogram; the comparability
of the camera-based device is examined in regard to each of these functions. The
examination is intended to establish both the feasibility of such a device and to
identify important inherent differences between conventional pulse oximetry and a
camera-based technique.
Additionally this chapter presents an investigation of some aspects of photo-
plethysmography that are unique to a non-contact implementation. The observation
82

Instrument Description and Performance
of inverted PPGs by non-contact means is described, a phenomenon that is, in the
least a curiosity, and may be a hint to the potential utility of a non-contact device
beyond that of a conventional device. A possible explanation of the phenomenon is
formed from the known characteristic path of light propagating in tissue (described
in Chapter 2) and from the absorptive characteristics of the pulsing arterial blood
(described in Chapter 3).
Finally this chapter attempts to address the effect of increasing distance
between the device and the tissue under investigation. The achievable tissue-device
separation is ultimately a function of the system’s optics, the camera’s character-
istics, and the type of source and its characteristics. However some predictions of
the decrease in detected light intensity with increasing separation can be made, with
knowledge of the characteristics of the backscattered light emerging from the tissue.
A simplified probabilistic model of the effect of tissue-camera separation is
developed here, based on a priori knowledge of the distribution of photon
trajectories emerging from the region of interest. The prediction by the model is
compared to results from a Monte Carlo simulation (described in Chapter 2) of a
three-layer tissue model and is shown to provide a prediction comparable to the
simulation results.
5.1 SYSTEM OVERVIEW
The principal components of the device are illustrated in Figure 5.1, in an
arrangement that is indicative of a typical experimental set-up. The main
components of the system are the camera, the array of LEDs, and the optical filter.
Also depicted in Figure 5.1 is the relative timing of the system, and the arrangement
of the two wavelengths of LEDs relative to each other on the illumination array.
Light from the LED array alternately illuminates the tissue under investigation at
wavelengths of 760 nm and 880 nm. By monitoring the backscattered light
emerging from the tissue using the camera, through image analysis, a PPG signal
can be obtained at each wavelength. The two resulting multiplexed PPG signals are
then separated and processed by a personal computer (PC) off line (not shown) to
yield the desired physiological measurements (the pulse rate and the shape of the
peripheral arterial pressure waveform) and to measure the ratio of arterial
absorption at each wavelength of light.
83

Instrument Description and Performance
Timing Signals
Switching signal 880 nm
Switching signal 760 nm
Trigger to camera
NIR band-pass filter
Triggersignal tocamera
IEEE 1394connection
to PC
C-mountzoom
lens
CMOSmono-
chromaticcamera
Arrangement of 760 nm and 880 nm LEDs in array
760 nm 880 nm
Approximately 15 cm separation between LEDs and tissue under investigation
Approximately 30 cm separation between lens and tissue under investigation
6x6 array of LEDspeak wavelengths760 nm & 880 nm
Tissue underinvestigation
Figure 5.1 Overview of the principal components of the non-contact system.
5.2 HARDWARE DESCRIPTION
5.2.1 THE CAMERA
In accordance with the design specifications pertaining to the sensor, enumerated in
the previous chapter (see Section 4.2), a CMOS camera was chosen for this
application. The camera (PixeLINK PLA-741, IIDC 1.3/DCAM compatible) utilises a
⅔ inch monochromatic CMOS sensor (8.576 mm × 6.912 mm, 11.01 mm diagonal).
The sensor has 1280×1024 square pixels of length 6.7 µm.
The camera uses an IEEE 1394-interface connection. Pixels can be encoded
using 8 bits or 10 bits.
84

Instrument Description and Performance
The camera is configured to operate using a global or synchronous shutter,
such that, upon generation of an internal trigger, or upon receipt of an external
trigger, the camera exposes the entire sensor for a predefined amount of time—the
exposure time. At the end of the exposure, the camera simultaneously reads out the
charge accumulated by each pixel, within a user-defined region of interest (ROI),
thus ensuring that each pixel has been exposed for precisely the same duration, and
for precisely the same period of time.
5.2.1.1 SENSITIVITY
Silicon is sensitive to wavelengths between approximately 1100 nm (in the near
infrared) and 400 nm (violet in the visible spectrum). At wavelengths longer than
1100 nm, incident photons lack sufficient energy to overcome the silicon energy
band gap, while wavelengths shorter than 400 nm do not penetrate silicon
sufficiently deeply to produce photoelectrons.
Manufacturers often specify their detector’s sensitivity using a graph of
quantum efficiency (QE) as a percentage versus wavelength. The QE parameter
incorporates other attributes of the sensor such as pixel area and fill factor, however
it excludes the SNR performance of the chip. A more useful figure of merit, which
incorporates the sensor’s SNR, is the amount of charge produced in excess of the
device’s noise floor per unit of incident light—usually expressed in units of A/W.
The CMOS detector used in this application has a sensitivity of 0.091 A/W at 760 nm
and 0.055 A/W at 880 nm.
5.2.1.2 MAXIMUM ACHIEVABLE FRAMERATE
The IEEE 1394 standard specifies a maximum data rate of 400 Mbits/s. This sets an
upper limit for the maximum achievable frame rate. For raw data the camera’s
output data rate is given by,
Bits per second = (Bits per frame) (Frames per second)× , (5.1)
where the number of bits per frame is given by,
Bits per frame = (Frame Width Frame Height) (Bits per pixel).× × (5.2)
Thus for a given frame size and number of bits per pixel, the maximum
achievable frame rate is limited by the IEEE 1394 maximum data rate. However
85
Instrument Description and Performance
equations (5.1) and (5.2) do not take account of the readout time associated with
each frame. The maximum achievable frame rate of the camera is a function of
readout time, which in turn is proportional to the frame size (or the user defined
ROI). The inclusion of the readout time imposes a lower limit on achievable frame
rate than the IEEE 1394 bandwidth. The maximum achievable frame rate FM, is thus
given by,
M
1F (frames/second)
Exposure time + Readout time = . (5.3)
Thus the camera’s maximum data rate DM, is given by,
, (5.4) M MD = (Bits per frame) F (bits/second) ×
which, due to readout time, is always less than 400 Mbits/s.
Operating at frame rates approaching the maximum achievable rate can result
in dropped frames, which are difficult to detect during operation, and can go
unnoticed during image analysis. A dropped frame has the potential to critically
impair the de-multiplexing of the PPG signal from each wavelength during the
image analysis process. It is desirable to avoid dropped frames completely, or at
least to detect them in the event of their occurrence.
In an attempt to eliminate dropped frames, a safe maximum frame rate FSM,
was empirically established for several frames sizes. To accomplish this, two LEDs
were placed side by side within the camera’s field of view. LED1 received a square
wave driving current, with period T1and 50% duty cycle. LED2 received a square
wave driving current, synchronised with LED1, but with period T2 = 2×T1, also with
50% duty cycle. The camera was externally triggered by a square wave voltage
signal, to capture a frame upon receiving a rising edge. The rising edge of the
voltage signal was synchronised with the rising edge of the driving current to LED1.
In this manner the two LEDs flash in a four-state binary sequence. The camera was
fixed in place such that the LEDs always flash in the same place in each of the
recorded frames. A dropped frame is observable as it causes the LEDs to flash out of
their correct binary sequence. In this manner up to four sequential dropped frames
can be detected. The resulting values of safe maximum frame rate for pixel
resolutions of 640×480 and 320×240 are tabulated in Table 5.1 and Table 5.2
respectively.
86

Instrument Description and Performance
Exposure Ideal maximum Maximum achievable
Resolution time (ms) frame rate (frame/s) frame rate (frames/s)
640×480 10 100 49 12 83 45 14 71 41 16 62 38 18 55 35 20 50 33 22 45 31 24 41 29 26 38 27 28 35 26 30 33 25
Table 5.1 Empirically derived maximum achievable frame rates at a pixel resolution of 640×480 with global shutter. Defined as the maximum frame rate that resulted in 0 dropped frames per 10,000 captured frames.
Exposure Ideal maximum Maximum achievable
Resolution time (ms) frame rate (frame/s) frame rate (frames/s)
320×240 10 100 76 12 83 66 14 71 58 16 62 52 18 55 47 20 50 43 22 45 40 24 41 36 26 38 34 28 35 33 30 33 30
Table 5.2 Empirically derived maximum achievable frame rates at a pixel resolution of 320×240 with global shutter. Defined as the maximum frame rate that resulted in 0 dropped frames per 10,000 captured frames.
5.2.2 ILLUMINATION
Illumination is provided by an array of thirty-six GaAlAs LEDs—eighteen with a
peak emission wavelength of 760 nm and eighteen with a peak wavelength of
880 nm. The 880 nm LEDs (Opto Diode Corp. OD880-L) emit 17 mW at a forward
current of 100 mA. The 760 nm LEDs (Opto Diode Corp. custom wavelength L-
package) emit 10 mW at the same forward current. Both types of LED are housed in
a TO-46 gold-plated casing, with in-built glass lenses and a specified full width half
87

Instrument Description and Performance
maximum (FWHM) beam angle of 30°. The LEDs are mounted on a printed circuit
board (PCB) along with two transistors that activate each wavelength of LED. A
schematic of the array showing the relative positioning of the two wavelengths of
LEDs is depicted in Figure 5.2. The various aspects of the array’s design and
operation are discussed separately below.
FET1 FET2 G1 G2
S1 S2 VCC
R2 R2 R2 R2 R2 R2
R1 R1 R1 R1 R1 R1
45.08 mm
49.75 mm
49.7
5 m
m
88 m
m
4.35 mm
4.35 mm 4.67 mm
56 mm
Figure 5.2 Schematic of the illumination array showing the arrangement of the 760 nm LEDs (surrounded by dotted outline) and the 880 nm LEDs, along with ancillary components.
5.2.2.1 CHOICE OF WAVELENGTH
The criteria for choosing the wavelengths of the two light sources were enumerated
in Section 3.2.1.2 and extended in Section 4.1: one wavelength either side of the
Hb/HbO2 isobestic point; each wavelength should have a similar differential path
length factor; and, the optical density of the tissue at each wavelength should be
sufficient to allow the detection of signals at each wavelength, without exceeding
the maximum permissible exposure for that wavelength.
The wavelengths selected for this application were 760 nm and 880 nm. This
choice was based in part on the prior work of Coyle et al. (2003) and Coyle et al.
88

Instrument Description and Performance
(2004), which demonstrated the capture of PPG signals by contact reflectance over
several centimetres of tissue using these wavelengths. Early investigations of the
feasibility of a camera-based approach (Humphreys, et al. 2005a; 2005b; 2005c)
further indicated the suitability of these wavelengths for use with the camera
described earlier (Section 5.2.1).
In particular, the choice of 760 nm as opposed to the more conventional pulse
oximetry wavelength of 660 nm, places the lower wavelength just inside the near
infrared band, making the use of a commonly available band pass filter possible,
and thus excluding much unwanted ambient light. Within the region of the near
infrared spectrum that lies below the Hb/HbO2 isobestic point, the region in the
vicinity of 760 nm is particularly apt to the technique of pulse oximetry due to a
hump in the Hb extinction curve, which causes a marked and desirable difference in
the absorption by Hb and HbO2 (refer to Figure 3.7). The total absorption by blood
at this wavelength is considerably less than at 660 nm. Note however that by
selecting a wavelength at the peak of the hump in the Hb extinction curve,
quantitative measurements of oxygen saturation are made vulnerable to error. Any
drift in the peak emitted wavelength of the 760 nm LEDs or deviation among
individual components would significantly alter the relative absorption by Hb and
HbO2 (see Section 3.3.1). The performance of the LEDs in this regard is described in
Section 5.2.4.
The difference in absorption by Hb and HbO2 at 880 nm is broadly similar
to—though less than—the difference at the conventional wavelength of 940 nm.
The sensitivity of the camera’s CMOS sensor however is approximately 45% less at
940 nm than at 880 nm.
5.2.2.2 ILLUMINATION PATTERN
Various illumination patterns were tested, including an annular pattern of LEDs
directed circumferentially around the camera’s field of view, and a small bright spot
adjacent to the camera’s field of view (see Humphreys et al (2005b; 2005c)). The
most successful pattern for obtaining signals from deep tissue, proved to be a large,
brightly illuminated area, adjacent to the camera’s field of view.
There are compelling reasons for preferring a small brightly illuminated spot
(ideally a point source) to any other illumination pattern and in particular the
technique of pulse oximetry implicitly precludes the use of an annular light source.
89

Instrument Description and Performance
However an explanation of this point is deferred until the conclusion of this chapter
(Section 5.7), at which point it is discussed in conjunction with several other aspects
of the device’s performance and some aspects of photoplethysmography and pulse
oximetry that are unique to a camera-based implementation.
The illumination pattern created by the array depicted in Figure 5.2 varies with
distance from the array. The manufacturer specifies a FWHM beam angle of 30° for
both types of diode. Measurements of this parameter suggested a FWHM beam
width of 32° for both wavelengths of LEDs. Using the FWHM parameter, the
diameter of a diodes’ half-maximum intensity beam d, at a distance x from the
diode, is given by,
FWHM22 tan(d x ∠= ) . (5.5)
Using the measured FWHM angle of 32°, and the geometry of the array
specified in Figure 5.2, the illumination pattern of the 760 nm LEDs, at a distance of
15 cm, from a flat surface, was computed, as the superposition of the illuminated
spot from each of the eighteen individual 760 nm LEDs. The resulting illumination
pattern is illustrated in Figure 5.3. At a distance of 15 cm, each diode projects a
half-maximum intensity spot of diameter 8.6 cm. The brightness of the image in
Figure 5.3 is proportional to the number of diodes coincident on that region. The
maximum height and width of the illuminated area is 131.10 mm. The illumination
pattern generated by the 880 nm LEDs is identical but rotated by 90°.
90

Instrument Description and Performance
millimetres
mill
imet
res
0 20 40 60 80 100 120
0
20
40
60
80
100
120
Figure 5.3 Computed illumination pattern resulting from the superpos-ition of the eighteen 760 nm LEDs depicted in Figure 5.2, at a distance of 15 cm from the array.
It is important to consider the profile of the illumination pattern when further
evaluating aspects of the system’s performance.
5.2.2.3 COMPLIANCE WITH MAXIMUM PERMISSIBLE EXPOSURE
The compliance of single LEDs in conventional contact pulse oximetry is well
established (see Section 3.3.1), however this study utilises an array of LEDs and it is
the compliance of the array as a whole that is investigated here. The various
standards pertaining to LED safety and maximum permissible exposure (MPE) were
discussed in Section 4.1.1. The most conservative applicable limit for skin
exposure, specified by the International Electrotechnical Commission (IEC), for
coherent light sources in the range 700 nm to 1400 nm (British Standards 1994) was
given in equation (4.1),
. 20.002 ( 700)MPE = 2000 10 [W/m ] λ× −×
The limit is applicable for exposure durations between 1000 s to 30000 s.
For 760 nm, equation (4.1) imposes a limit of 2.6 KW/m2, or 260 mW/cm2.
For 880 nm, the imposed limit is 450 mW/cm2. In evaluating the compliance of the
illumination array with the MPE limits, the effects of multiple LEDs coincident on
the same region of tissue should be taken into account. The intensity profile of the
91

Instrument Description and Performance
illumination pattern created on a flat surface, parallel to the array, at a distance of
15 cm, is depicted in Figure 5.3. Taking 15 cm as the nominal distance from tissue
under investigation, at which the array will be placed during operation, a contour
map of the intensity profile depicted in Figure 5.3 was computed, and is depicted in
Figure 5.4.
Figure 5.4 Contour map of illumination pattern intensity profile depicted in Figure 5.3. Contour lines mark regions where the specified numbers of LEDs are coincident—that is where their FWHM spots overlap at a distance of 15 cm from the array.
The entire illuminated area fits inside a square of dimensions 132×132 mm—
an area of 174.2 cm2. However within that area, the intensity is non-uniform—
indeed 30 cm2 receive no illumination (that is less than half the maximum intensity
of one LED). The intensity of only one LED illuminates a continuous region around
the edge of the pattern, while moving towards the centre of the pattern, the
projected spots of several LEDs begin to overlap. There is a region in the centre of
the pattern where all eighteen 760 nm LEDs are coincident. The tissue in this central
region experiences the greatest exposure.
Using the data mapped in Figure 5.3 and Figure 5.4, the area of the central
region where all 760 nm LEDs are coincident, was calculated to be 4.7158 cm2. The
specifications for the 760 nm LEDs, state a typical power output of 10 mW.
Assuming the worst case, in which all LEDs are located centrally over the region, at
a distance of 15 cm, for a FWHM beam angel of 32°, each diode could provide a
92

Instrument Description and Performance
radiant power density of 172.1524 µW/cm2. The entire region in Figure 5.4 upon
which all eighteen LEDs are incident, would therefore receive a collective exposure
of 14.6130 mW, or an exposure per unit area of 3.0987 mW/cm2. The 880 nm LEDs
have a specified typical emitted power of 17 mW, and under the same conditions
would deliver a collective exposure of 24.8241 mW, to the central region of
Figure 5.4, and an exposure per unit area of 5.2678 mW/cm2.
Thus the maximum possible radiant power delivered by the LED array per
square centimetre at 760 nm and 880 nm, represent just 1.19% and 1.17%
respectively, of the maximum permissible exposures at those wavelengths.8 As was
discussed earlier, the actual emitted power of the array will be mollified by the
requirement of pulse oximetry that both wavelengths of LEDs operate on a 50%
duty cycle or less (see the discussion of signal processing by a clinical device in
Section 3.3.3). Furthermore, the LEDs are not monochromatic; their maximum
emitted power is not in fact concentrated at one wavelength but rather spread over a
range of wavelengths (see Figure 5.8 and Figure 5.9 below), further diminishing the
hazard. Finally the MPE limit recommended by the IEC refers to coherent light
exposure, while LEDs produce incoherent light.
5.2.2.4 LED DRIVING
The LEDs are placed in series in groups of three, each group in series with a small
value resistor to limit the current. Both wavelengths of LED are limited to a
maximum driving current of 100 mA. The 880 nm LEDs have a forward voltage of
1.54 V at a forward current of 90 mA. Owing to their shorter emission wavelength
(see Section 3.3.1), the 760 nm LEDs have a forward voltage of 2.01 V at the same
forward current. Figure 5.5 depicts a schematic of the LED driving circuit. The LEDs
are arranged in the same pattern as that indicated in Figure 5.2.
8 In Section 5.2.4.2 it will be shown that the actual peak emitted wavelength of the 880 nm LEDs is closer to 860 nm. Recalculating the MPE at 860 nm, the array is found to produce 1.26% of the MPE.
93

Instrument Description and Performance
VCC
R1 R1 R1 R2 R2
R1 R1 R2 R2
R1 R2 R2
G2
S2
D2
IRFD024G1
S1
D1
IRFD024
Figure 5.5 Schematic of LED driving circuit. VCC is set at +6 V, R1 is 14 Ω and R2 is 4.7 Ω. The two transistors are n-channel enhancement type, power MOSFETs, with a maximum drain current rating of 2.5 A.
A suitable signal applied to the gate of either transistor energises the eighteen
diodes at that wavelength. The transistors used are metal-oxide semiconductor field-
effect transistors (MOSFETs), rated to a maximum continuous drain current of 2.5 A.
The MOSFET channels are fully conductive when their gate-source voltage exceeds
3.7 V. Since the MOSFETs are alternately activated with 50% duty cycle, the
maximum instantaneous current due to either wavelength of LED is 1.8 A. The
circuit’s rail voltage VCC, is +6 V, thus the circuit requires a maximum continuous
power of 10.8 W.
This circuit is intended exclusively for use in non-contact illumination. The
outer metal case of the LEDs is electrically connected to the anode, thus for safety,
94

Instrument Description and Performance
where contact illumination is required, these diodes should be driven between
ground and a negative cathode voltage.
5.2.3 TIMING SIGNALS
Section 3.3.3 described the use by clinical devices of dark samples to determine
ambient light levels. As will be discussed later, the frame rates achievable with a
camera-based device do not permit the inclusion of dark frames in the sampling
pattern. Therefore the LEDs are pulsed in a simple alternating fashion in which, each
wavelength is on for one period and then off for the next period. The camera is
triggered to capture a frame when either wavelength of diode is energised. The
circuit used to generate the triggering signals is depicted in Figure 5.6. Logic gates
driven between +5 V and ground provide sufficient signal levels to drive the
MOSFETS and the camera.
1 KΩ
S’
S
Signal to 880 nm indicator LED
4 6
5
Signal to 760 nm LEDs
3 2
114
4 7 85
3
6
2
1
CD4027BE
VSS
VDD
16
CLK
K
J
7 CD4081BE
Pin 3
Pin 2
+ 5V
Signal Generator
Signal to 880 nm LEDs CD4081BE
Camera internal circuitry
Figure 5.6 Logic circuit used to generate triggering signals to LED array and to camera.
A JK flip-flop is used to half the frequency of a square wave from a signal
generator, providing a signal S at half the frequency of the input clock. The rising
edges of S are synchronised with every other rising edge of the clock. The flip-flop
95

Instrument Description and Performance
also produces a signal S’ that is the inverse of S. The signal S is used to activate the
880 nm LEDs and the signal S’ to activate the 760 nm LEDs. The 880 nm signal is
also fed to an AND gate acting as a buffer, which drives an 880 nm indicator LED,
the purpose of which is discussed below.
The camera is triggered by the clock signal after it has been fed through an
AND gate. The gate serves two functions: first when connected as shown in
Figure 5.6 it isolates the camera from fluctuations in the clock signal level; and
second the connection from the AND gate to V + can be replaced by a connection to
a master trigger step that synchronises the initiation of a capture sequence by the
camera with a second device.
Figure 5.7 depicts the relative timing of the various signals. The response time
of the camera, the LEDs, the transistors, the flip-flop, and the AND gates, are all of
the order of microseconds, whereas a typical frame length is of the order of tens of
milliseconds. Thus the response times of all the components are negligible
compared to the duration over which a frame is integrated. In the event that a
master control signal is required, to either initiate a capture sequence by the camera
or to synchronise the system with another measurement device, the rising edge of
the master control step acts as the initial trigger. During such operation, the clock
signal AND the master control step signal, forms the trigger signal to the camera.
Master control signal
760 nm signal
880 nm signal
Clock and camera trigger
Am
plitu
de
Time
Figure 5.7 Relative timing of triggering signals to the camera, the indicator LED, and to both wavelengths of LEDs on the illumination array.
5.2.4 REPLICATING ASPECTS OF A CLINICAL DEVICE
In Section 3.3 several aspects of a conventional contact device’s operation were
emphasised; among them were: ambient light interference; compensation for the
96

Instrument Description and Performance
variance in the peak emitted wavelength of LEDs; compensation for drift in peak
emitted wavelength of LEDs caused by increased p-n junction temperature;
obtaining maximum utility from the analogue to digital quantization process; and
maintaining a sufficient signal level at the detector. These topics are revisited here
and the practicability of the conventional contact device’s countermeasures and
solutions to each are evaluated in the context of the non-contact camera-based
device.
5.2.4.1 AMBIENT LIGHT INTERFERENCE
Section 3.3.3.1 described the approach of clinical pulse oximeters to mitigating the
effects of ambient light. This invariably comprises sampling the ambient light while
the LEDs are off and subtracting the level from the adjacent samples during which
the LEDs are on. The ratio of ambient samples to data samples and the sampling rate
vary widely among manufacturers, though all clinical devices sample at a rate far
greater than the frame rates achievable with a camera-based non-contact device.
The camera-based system’s susceptibility to ambient light interference can
however be mitigated to some degree by the inclusion of a bandpass filter.
Figure 5.1 depicts such a filter placed directly in from of the camera’s lens. The
filter used is a Hoya RT830 near infrared glass band pass filter, centre wavelength
830 nm, half maximum pass band 570 nm to 1090 nm.
The inclusion of a dark frame in the camera-based system’s sampling
sequence is of course possible, however as will be discussed in Section 5.4,
achieving the maximum possible frame rate is paramount to a camera-based
device’s accuracy—at least within the range of frame rates currently achievable.
5.2.4.2 VARIANCE IN LED PEAK EMITTED WAVELENGTH
Limitations of the manufacturing process cause the actual peak emitted wavelength
of LEDs to differ from the design wavelength, even among components produced
from the same lot. The accuracy of the technique of pulse oximetry is conditional
on the use of two precisely known monochromatic wavelengths. In practice two
narrow-band light sources with precisely known peak emission wavelengths suffice.
Manufacturers compensate for inter-device variation in peak emitted wavelength by
either selecting only LEDs with specific wavelengths or noting the actual
97

Instrument Description and Performance
wavelengths and compensating for the discrepancy during the calibration process
(see Section 3.3.1).
The non-contact technique requires multiple LEDs of both wavelengths to
provide sufficient illumination. Thus the possibility of compensating for
discrepancy in peak emitted wavelength between LEDs is precluded. The
remaining—more costly—option for the non-contact device is ensuring each
individual LED used has the correct peak emitted wavelength, for both wavelengths.
Figure 5.8 displays an overlay of the normalised emission spectra of the
eighteen 760 nm LEDs used in the illumination array. (Measured using Ocean
Optics Inc. S2000 spectrometer.) The vertical dashed line at approximately 758 nm
indicates the mean peak emission wavelength.
Figure 5.9 displays the same data from the 880 nm LEDs. The mean peak
emitted wavelength for the 880 nm LEDs is 858 nm.
745 750 755 760 765
0.6
0.65
0.7
0.75
0.8
0.85
0.9
0.95
1
λ (nm)
Fra
ctio
n of
pea
k em
itted
pow
er
µ = 757.9306 nmσ = 0.6873 nm
Figure 5.8 Normalised peak emitted wavelength of the eighteen 760 nm LEDs. (Mean peak emission wavelength 758 nm.)
98

Instrument Description and Performance
800 820 840 860 8800.3
0.4
0.5
0.6
0.7
0.8
0.9
λ (nm)
Fra
ctio
n of
pea
k em
itted
pow
er
µ = 858.7419 nm
σ = 6.1850 nm
1
Figure 5.9 Normalised peak emitted wavelength of the eighteen 880 nm LEDs. (Mean peak emission wavelength 858 nm.)
In comparing the characteristics of the two types of LED, the 880 nm LEDs can
be seen to exhibit a much greater deviation from their design wavelength as well as
a greater variance in peak emitted wavelength between individual diodes than the
760 nm diodes. (Indeed the continued use of the label 880 nm LED is questionable.)
Owing to the profiles of the HbO2 and Hb extinction curves (Figure 3.7), pulse
oximetry is more sensitive to deviation in the peak emitted wavelength of the
760 nm LEDs; where the Hb curve exhibits a large inflection. Referring to
Figure 3.7, the 2 nm deviation in peak emitted wavelength of the 760 nm LEDs
would correspond to a change in the absorptivity of Hb and HbO2 of +0.45% and
–2.07% respectively. The 22 nm deviation in the 880 nm LEDs would correspond to
a change in absorptivity of Hb and HbO2 of –5.49% and –6.77%. Since it is the
change in the ratio of absorption of the two haemoglobin species that is
consequential, the 2 nm shift in the 760 nm LEDs would in fact be more detrimental
to quantitative estimates of SpO2 than the 22 nm shift in the 880 nm LEDs.
5.2.4.3 DRIFT IN PEAK EMITTED WAVELENGTH
The causes of drift in peak emitted wavelength during operation were described in
Section 3.3.1.2. Both ambient temperature and driving current affect the p-n
junction temperature of the diode, altering the amount of additional energy required
by an electron to cross the junction and hence altering the emitted wavelength.
99

Instrument Description and Performance
To quantify the drift in peak emitted wavelength of the LEDs during operation,
two sets of spectra were obtained. The first set was measured immediately after the
array had been energised, at a driving current of 60 mA with a 50% duty cycle to
each diode. The driving current was then increased to 110 mA and the spectra
measured again after ten minutes of continuous operation at 50% duty cycle. The
results are plotted in Figure 5.10. The 760 nm LEDs exhibited a shift in mean peak
emitted wavelength of 3.5 nm and the 880 nm LEDs 0.7 nm. These observations are
similar to those reported by de Kock et al. (1991).
Commercial pulse oximeters compensate for drift in peak emitted wavelength
by either placing a temperature sensor in the probe or by monitoring the LED
driving current. In either case the peak emitted (red and infrared) wavelengths’
dependence on either parameter is predetermined and the appropriate calibration
tables are chosen by the device during operation to match the current estimate of
peak emitted wavelengths.
Either approach is applicable to a non-contact device, though as will be
discussed in the next section, LED driving current need not be variable in the case of
a camera-based system.
100

Instrument Description and Performance
700 750 8000
0.2
0.4
0.6
0.8
1
λ (nm)
Fra
ctio
n of
pea
k em
itted
pow
er
First measurement
757.9 nm
750 800 850 9000
0.2
0.4
0.6
0.8
1
λ (nm)
Fra
ctio
n of
pea
k em
itted
pow
er
Second measurement
858.7 nm
750 800 850 9000
0.2
0.4
0.6
0.8
1
λ (nm)
Fra
ctio
n of
pea
k em
itted
pow
er
Second measurement
858.0 nm
700 750 8000
0.2
0.4
0.6
0.8
1
λ (nm)
Fra
ctio
n of
pea
k em
itted
pow
er
First measurement
761.4 nm
Figure 5.10 Drift in peak emitted wavelength of all LEDs on the illumination array after ten minutes at high driving current.
5.2.4.4 OPTIMISING PULSE SIGNAL LEVEL AND QUANTIZATION
At start up a conventional clinical pulse oximeter incrementally increases the
driving current to the LEDs until a sufficient pulse signal is detected at each
wavelength. This enables identical pulse oximeter probes to be used on the entire
range of subjects, regardless of an individual’s size or skin colour, and without ever
saturating the photodiode detector. During operation the LED driving current is
continually adjusted to maintain signal level and prevent saturation.
Control of the signal level in the camera-based system need not be limited to
control of the light source. The combination of the digital camera and its optics
form a highly configurable detector. While providing a constant illumination level,
sufficient to detect signals across a broad range of subjects, saturation of the
detector can be avoided by varying the lens aperture and the duration of the camera
exposure. Amplification of weak signals is made possible by the CMOS chip’s in-
built circuitry.
101

Instrument Description and Performance
Having obtained suitable pulse signals commercial devices also attempt to
maximise the utility of the ADC process by removing the DC offset from the
analogue signal prior to quantization (see Section 3.3.3.3). This makes the full
quantization range available to encode the important pulse component of the
received light intensity.
Since a camera produces a digital signal in response to a continuously varying
light intensity, there is no opportunity to remove the resulting DC component prior
to quantization by signal processing means. However the offset can be reduced
somewhat by carefully varying the camera’s lens aperture such that the mean
received light intensity is just below the current intensity at the troughs of the PPG
waveform (Wieringa, et al. 2005). If employed in conjunction with the sensor’s
onboard amplifier the technique has the potential to improve the quantization of the
PPG signal.
In the experiments that are described below (Section 5.4) this technique is not
employed however; since the base level of the PPG signal can vary significantly
over relatively short observation periods, it would be necessary that the lens
aperture be continuously varied to maintain the effect.
5.3 IMAGE ANALYSIS
Image analysis takes place offline using Matlab®. Successive frames of the tissue
under investigation, illuminated alternately by light with wavelengths of 760 nm
and 880 nm, are saved to a PC in Full Frame (uncompressed) Audio Video
Interleave (AVI) media container format—the merits and demerits of which are
discussed shortly. Image analysis comprises: separation of the multiplexed frames
into two separate sequences of frames, one illuminated at 760 nm and one at
880 nm; and the division of each frame, from both sequences, into smaller
rectangular regions apt to searching for PPG signals.
Synchronisation between the camera and the illumination array is maintained
by means of an 880 nm indicator LED that pulses synchronously with the 880 nm
LEDs on the array, with reduced intensity. The indicator LED is coupled to an optical
fibre, the other end of which is positioned in a corner of the camera’s field of view.
102

Instrument Description and Performance
5.3.1 EXTRACTING AVI FILES
Since it is not required to play back the recorded video file the utilisation of the AVI
format is an inefficient use of storage resources compared to a raw data format. The
uncompressed or Full Frame AVI format stores each frame in truecolor format, in
which three numbers are used to represent every pixel in a video frame. These
numbers indicate the red, green, and blue colour intensities of that pixel. However
the camera, being monochromatic, produces only one 8-bit number per pixel that
represents the intensity of each pixel on a grey scale with 256 levels. The truecolor
format triplicates the 8-bit number produced by the camera and saves it to each of
the red, green, and blue fields of that pixel. Thus for a grey scale image, the
truecolor format is three times as large as the raw data. For small numbers of
frames, the AVI structure also produces a header chunk that is significantly larger
than the collective size of the individual raw data headers, making AVI less than
three times as efficient for small numbers of frames. For larger numbers of frames,
the AVI format converges towards three times the size of the raw data. The
advantage of the AVI format is that it collects all the data from a period of
monitoring into just one file—rather than thousands of small files. At the start of
image analysis only one of the identical red, green, or blue fields need be processed
while the rest are discarded. This is simple matter of indexing in Matlab and need
not add to the processing delay. So long as memory and storage space permit, the
use of the AVI format in offline processing is not restrictive.
Figure 5.11 depicts the structure of the resulting frames. One of the red, green,
or blue layers of each frame is selected, and by identifying the state of the indicator
LED, on or off, the illumination wavelength of each frame is determined. The frames
are then divided into two separate sequences for further processing. To decide
whether the indicator LED is on or off, the mean value of intensity of that corner of
the video is determined over ten frames. If the intensity of that region in any
individual frame then exceeds a certain threshold, say 1.25 × mean value, the
indicator LED is determined to be on, and if it is less than a low threshold, say 0.8 ×
mean value, the LED is determined to be off. If neither threshold is passed, the mean
is recalculated using a different region of the video, or the thresholds moved closer
together.
103

Instrument Description and Performance
880 nm frame
760 nm frame
880 nm frame RGB
Indicator light
Figure 5.11 Depiction of the identical, red (R), green (G), and blue (B) layers of successive frames in the AVI file—only one of which need be selected per frame. The status of the indicator light indicates the wavelength at which the tissue was illuminated during that frame.
5.3.2 BOXES AND THEIR ANALYSIS
After generating a sequence of frames illuminated by the same wavelength, each
frame is analysed by dividing it into boxes, or rectangular regions comprised of
adjacent pixels. The mean values of these boxes are determined for every frame,
and a matrix constructed such that each frame adds a new row to the matrix, while
the mean value of each box within a frame resides in a column of the matrix. Thus a
particular column of the matrix records the time-varying mean value of the pixels in
a particular box, as they vary from frame to frame. Where backscattered light
emerging from the tissue and captured by the camera, has traversed an artery, a PPG
may be detectable. Where a PPG is detectable at both wavelengths, within the same
box, over the same period of time, the prerequisite for pulse oximetry is met.
Figure 5.12 depicts a sample PPG signal obtained in this manner during an early
trans-illumination experiment at one wavelength (805 nm).
104
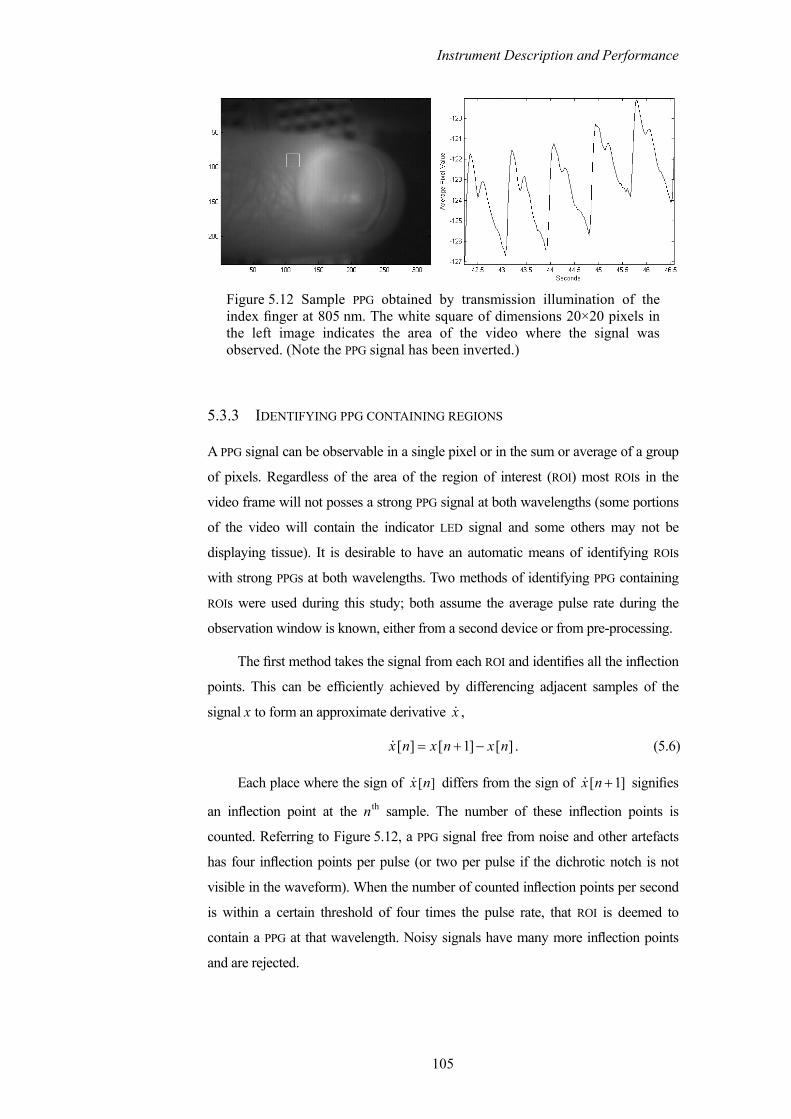
Instrument Description and Performance
Figure 5.12 Sample PPG obtained by transmission illumination of the index finger at 805 nm. The white square of dimensions 20×20 pixels in the left image indicates the area of the video where the signal was observed. (Note the PPG signal has been inverted.)
5.3.3 IDENTIFYING PPG CONTAINING REGIONS
A PPG signal can be observable in a single pixel or in the sum or average of a group
of pixels. Regardless of the area of the region of interest (ROI) most ROIs in the
video frame will not posses a strong PPG signal at both wavelengths (some portions
of the video will contain the indicator LED signal and some others may not be
displaying tissue). It is desirable to have an automatic means of identifying ROIs
with strong PPGs at both wavelengths. Two methods of identifying PPG containing
ROIs were used during this study; both assume the average pulse rate during the
observation window is known, either from a second device or from pre-processing.
The first method takes the signal from each ROI and identifies all the inflection
points. This can be efficiently achieved by differencing adjacent samples of the
signal x to form an approximate derivative x ,
[ ] [ 1] [ ]x n x n x n= + − . (5.6)
Each place where the sign of [ ]x n differs from the sign of signifies
an inflection point at the n
[ 1]x n +th sample. The number of these inflection points is
counted. Referring to Figure 5.12, a PPG signal free from noise and other artefacts
has four inflection points per pulse (or two per pulse if the dichrotic notch is not
visible in the waveform). When the number of counted inflection points per second
is within a certain threshold of four times the pulse rate, that ROI is deemed to
contain a PPG at that wavelength. Noisy signals have many more inflection points
and are rejected.
105

Instrument Description and Performance
Though this method is simple, it is computationally efficient and is not prone
to false positives. Figure 5.13 displays an image of the index and middle finger
from the right hand of twenty-six year old male subject. Each finger is trans-
illuminated by an 805 nm LED. Superimposed on the frame are 20×20 pixel ROIs in
which PPG signals were detected using the inflection point method (from
Humphreys et al. (2005a)).
Figure 5.13 ROIs containing PPG signals identified by the inflection point method.
The inflection point method is however susceptible to false negatives in the
presence of noisy signals. As such it is most suited for use with transmission
illumination schemes.
PPG signals at multiple wavelengths, obtained in a multiplexed fashion, from
deep tissue, and in a non-contact reflection geometry, are weaker, sampled at a
lower rate (because of both multiplexing and the need for a longer exposure time),
and are consequently less well defined than that depicted in Figure 5.12. To identify
ROIs containing PPG signals in such videos a simple spectral method was developed
and employed during this study.
A matrix containing the time-varying signal from each ROI is constructed as
described in Section 5.3.2. The mean value of the signal from each ROI is subtracted
to remove the DC offset and its Fourier spectrum calculated. A region of the
spectrum is defined from 0.2 Hz up to 1.9 times the pulse rate (in Hertz), which
excludes the low frequency Mayer wave and vasomotion, and the first harmonic of
the pulse frequency. Within this region a smaller region is defined from 0.5 times
the pulse rate up to 1.5 times the pulse rate that allows for pulse rate variability over
the observation window. A figure of merit is then calculated for each ROI, defined as
the area under the Fourier spectra in the smaller pulse-rate-centred region, divided
106

Instrument Description and Performance
by the area under the Fourier spectra in the larger region. The process is depicted in
Figure 5.14, which shows data from a thirty-three year old male subject with a
mean pulse frequency of 1.2 Hz (72 pulses per minute).
Figure 5.14 depicts a portion of the Fourier spectrum indicating the two
previously defined regions (top plot). The figure of merit is calculated as the area of
the black portion divided by the sum of the areas of the black and grey portions.
The figure of merit for all ROIs is plotted in the bottom plot of Figure 5.14, with a
circle marking the merit value for this example. The middle plot shows the PPG
signal associated with this ROI.
Figure 5.14 Spectral method of identifying ROIs containing PPG signals—depicting a good PPG signal.
107
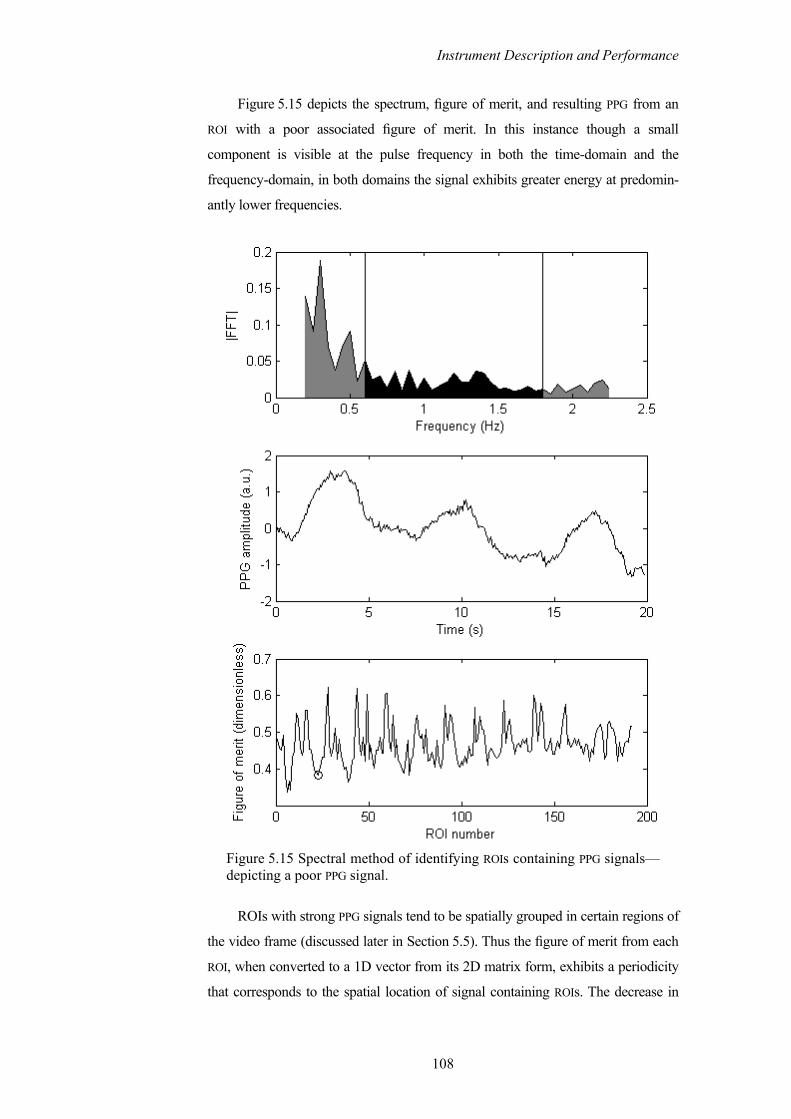
Instrument Description and Performance
Figure 5.15 depicts the spectrum, figure of merit, and resulting PPG from an
ROI with a poor associated figure of merit. In this instance though a small
component is visible at the pulse frequency in both the time-domain and the
frequency-domain, in both domains the signal exhibits greater energy at predomin-
antly lower frequencies.
Figure 5.15 Spectral method of identifying ROIs containing PPG signals—depicting a poor PPG signal.
ROIs with strong PPG signals tend to be spatially grouped in certain regions of
the video frame (discussed later in Section 5.5). Thus the figure of merit from each
ROI, when converted to a 1D vector from its 2D matrix form, exhibits a periodicity
that corresponds to the spatial location of signal containing ROIs. The decrease in
108

Instrument Description and Performance
magnitude of the figure of merit with increasing ROI number in Figure 5.14 and
Figure 5.15, is a result of increasing distance from the light source and the
concomitant decrease in received light intensity.
Neither of these methods is suited to a real-time implementation—the former
being too susceptible to false negatives in the presence of noise and the latter being
too computationally intensive—they are however well suited to off-line processing
of videos. The task of quickly and accurately identifying ROIs is key to a real-time
implementation and is deserving of further investigation.
5.4 TESTING AND PERFORMANCE OF DEVICE
This section describes the apparatus and experimental protocol used to test the non-
contact device. For the non-contact device to provide an acceptable substitute for a
conventional device in any application, it must provide comparable measurements
to a conventional device. Comparable, from a clinical perspective means that
decisions regarding the management and treatment of a patient would not alter
depending on the instrument used to assess the patient. For the case of a pulse
oximeter, the three primary indicators of a patient’s health provided by the device
are the patient’s arterial oxygen saturation SpO2, the patient’s pulse rate, and a
display of the patient’s peripheral arterial pressure waveform—a PPG. Collectively
these parameters are used to assess the effectiveness of the patient’s cardio
pulmonary system, the oxygen content of the arterial blood being indicated by the
SpO2 value, and the combined effectiveness of the cardiac pump and arterial
delivery system, being indicated by the pulse rate and PPG waveform (see
Chapter 3). Any novel non-contact pulse oximeter should provide comparable
measurements of all of these parameters. Furthermore though a non-contact device
will undoubtedly be subject to extra constraints by virtue of its position, remote
from the tissue under investigation, the device should nonetheless be capable of
obtaining measurements from a broad subject base and under realistic operating and
environmental conditions.
5.4.1 EXPERIMENTAL PROTOCOL
Experiments were conducted using ten informed subjects (ten Caucasian, nine
male, and one female) aged between 21 and 45 years (mean 31.70 years and
109

Instrument Description and Performance
standard deviation 6.37 years). Subjects were seated in an upright position with
their right arms resting, volar side upwards, on a cushioned bench. A conventional
reflection mode PPG sensor with a wavelength of 805 nm (BioPac UIM100C) was
connected to the subjects’ right index fingers. A conventional contact pulse oximeter
(Nellcor 660 nm/940 nm probe – Welch Allyn device) was connected to the
subjects’ left index fingers.
The camera was positioned and focused manually such that an area of the
volar side of the forearm close to the wrist was occupying most of the image. The
LED array was positioned so as to illuminate an area on the proximal side of the
imaged area, at a distance of approximately 15 cm from the tissue surface.
Figure 5.16 illustrates the relative position of the illuminated and imaged area.
Overhead fluorescent lighting was present during all of the experiments (mains
supply 50 Hz).
Over several sets of preliminary experiments on small numbers of test
subjects, using both the system described here and variations of the system
(described in Humphreys et al. (2005a; 2005b; 2005c)), PPG signals were captured
from various parts of the body surface. Reflection mode PPG signals were obtained
from the sole of the foot, the palm of the hand, the fingertips, the ankle, the forearm,
and the neck. The forearm was chosen as the region of interrogation for this
experiment because of the ease with which the apparatus can be repeatedly
positioned to obtain similar measurements from multiple test subjects of varying
physical size. Whilst other observation sites on the body and are undoubtedly of
interest, as are other observation positions, for example a reclined and supine
position, observing the forearm in a seated position represents a more practical and
comfortable protocol from the point of view of the volunteers, given the decidedly
experimental rather than clinical environment in which the experiments took place.
110

Instrument Description and Performance
Area illuminatedby LED array
ConventionalreflectancePPG probe
Area imagedby camera
Figure 5.16 Relative position of the imaged and illuminated regions of tissue.
Once stable and normal pulse rate and SpO2 readings were indicated by the
pulse oximeter, a trigger was sent to the camera-based system and the PPG data
acquisition system, simultaneously initiating a 20 s capture of data by both devices.
The camera was configured to capture 640 frames, at resolution of 640×480
pixels, with a 20 ms exposure time. The camera was triggered externally at a rate of
32 frames/s (refer to the maximum achievable frame rate data in Table 5.1). The
LED array was correspondingly switched at 16 Hz (see Figure 5.7).
The LED array was activated for several minutes prior to each experiment to
allow the LEDs reach their stable operating temperature and wavelength (see
Section 5.2.4 for timing signals).
All subjects were asked to sit motionless and to breathe normally during the
experiments.
5.4.2 DISPLAYING A PPG
Early commercially available pulse oximeters used in clinical monitoring incor-
porated an electro cardiograph (ECG)—as do many patient-monitoring suites
available currently. Though the pulse period could be and indeed was estimated
from the PPG waveform, the heart rate was also calculated from the distinctive R-
peak of the QRS complex of the ECG waveform. Both of these measurements of
heart rate were displayed and users often employed a rule of thumb: the displayed
SpO2 values should only be relied upon if the heart rate indicated by the electrical
ECG signal and the pulse rate indicated by the PPG signal were within one to two
beats per minute of each other (Wukitsch, et al. 1988). This rule of thumb served to
111

Instrument Description and Performance
alert users of instances where a PPG signal was poor; likely due to probe placement
but possibly due to a serious deterioration in the patient’s condition; pulse oximetry
requires only a weak pulsatile signal rather than a pulse to produce some SpO2
value, though it is likely erroneous in the former case.
The need for an extraneous corroboration of the validity of the pulse signal, on
which the SpO2 values are based, is obviated if the device is capable of displaying
the arterial pressure waveform on which it is currently basing its calculations. Thus,
by a pulse oximeter displaying a PPG waveform, the experienced user can evaluate
the validity of the current pulse rate and SpO2 values.
In addition, the displayed PPG trace gives the user a quick indication of the
cardiac rhythm and of any changes in its regularity. When the PPG trace is not
normalised, it will indicate any sudden changes in cardiac output or hypovolaemia.
Furthermore, the shape of the peripheral arterial pressure waveform, and
notably the prominence of the dichrotic notch, can provide diagnostic information
about the health and compliance of the vasculature (Joyce, et al. 1990).
For these reasons it is important that the camera-based device be capable of
capturing a suitable PPG signal. (Separate to the pursuit of pulse oximeter
functionality the ability to capture spatially resolved PPGs is important to the
device’s independent investigative capabilities.)
Figure 5.17 displays non-contact PPG signals captured at 760 nm and 880 nm
by the remote camera-based system, and also a contact PPG signal captured using a
finger probe at 805 nm (200 Hz sampling rate).9 The signals were captured from a
45-year-old male test subject imaging an area similar to that depicted in Figure 5.16
with a tissue-camera separation of approximately 30 cm. Note that although clear
pulses are visible, the dichrotic notch is not well defined in either of the non-contact
signals, and not discernable in the contact signal. For this subject, a 0.5 Hz high
pass filter has been applied to the contact PPG signal, while the non-contact PPG
signals are the result of the image analysis described in Section 5.3.2 only, to which
no further signal processing has been applied.
9 The non-contact PPG signals in and have been orientated such that their amplitude is proportional to light absorption rather than received light intensity. The contact device utilises this format by default—the non-contact signals are orientated such for ease of comparison only.
Figure 5.17 Figure 5.18
112

Instrument Description and Performance
Figure 5.17 PPG signals captured simultaneously by the camera-based, non-contact device at 760 nm and 880 nm, and from the conventional contact probe (on the finger) at 805 nm, from a 45-year-old male test subject.
Figure 5.18 displays the same data captured from a 21-year-old male test
subject, in which the pulses complete with dichrotic notch are clearly visible in all
three signals. The contact PPG signal, for this subject, is unfiltered. The non-contact
PPG signals again, represent the output of the image analysis described in
Section 5.3.2.
113

Instrument Description and Performance
Figure 5.18 PPG signals captured simultaneously by the camera-based, non-contact device at 760 nm and 880 nm, and from the conventional contact probe (on the finger) at 805 nm, from a 21-year-old male test subject.
In addition to the pulse component, a lower frequency oscillation can be seen
in the PPG signals (except the high pass filtered contact PPG in Figure 5.17). This
component is partially due to respiration. The component is more clearly visible in
the frequency domain. Figure 5.19 displays the Fourier spectra of the PPG signals
plotted in Figure 5.18. The component due to respiration can be seen in each of the
spectra as a peak at 0.35 Hz, prominent in both the camera PPG signals, though less
so in the contact signal. The pulse component is visible as the distinctive peak at
1.5 Hz and its first harmonic can be seen at 3 Hz. The low frequency Mayer waves
114

Instrument Description and Performance
and vasomotion can be seen between 0 Hz and 0.1 Hz 10 (it is particularly evident in
the time-domain contact PPG plot as the smooth undulation with a period slightly
longer than 10 s in Figure 5.18).
Figure 5.19 Fourier spectra of the PPG signals plotted in Figure 5.18, from a 21-year-old male test subject.
5.4.3 MEASURING PULSE RATES
The next important purpose of a commercial pulse oximeter is to measure the pulse
rate, a vital sign (Mower, et al. 1998; Mower, et al. 1997). In Section 5.4.2 reference 10 The Mayer waves are oscillations in arterial pressure at frequencies lower than respiration that are coupled with the activity of the sympathetic nervous system (Julien 2006). Vasomotion refers to small and slow changes in vascular diameter generated within the vascular wall. Though both phenomena are well documented their respective physiological causes remain elusive.
115

Instrument Description and Performance
was made to early clinical devices that incorporated an ECG. The ECG signal can
provide a measurement of heart rate, while a pulse oximeter—utilising a photo-
plethysmograph—provides a measurement of the pulse rate. These two parameters
should agree closely, but may vary a little, since the rate at which pulses pass by a
sensor in the peripheral arterial vasculature is affected by the transit time, the
compliance of the vasculature, and the musculature that lies between the probe site
and the heart. The need to ensure close agreement between the ECG indication of
heart rate and the pulse oximetry indication of pulse rate, as an indication of the
validity of SpO2 values, was ultimately obviated by the incorporation of a plethys-
mographic display. It is thus necessary to ensure that a measure of pulse rate
provided by the non-contact device agrees sufficiently closely with that produced
by the conventional contact plethysmogram, that the two devices can be used inter-
changeably for this purpose.
A useful method of assessing the agreement between two devices or
techniques is the Bland-Altman method (Altman and Bland 1983; Bland and
Altman 1986). The Bland-Altman method is a particularly popular tool for
assessing agreement between two clinical devices, where both devices exhibit a
certain amount of measurement error.11 It is preferable to other commonly
employed methods, for example Student’s t-test, in that it is fundamentally a
graphical method, which can compare the accuracy, precision, and bias between
two devices or methods, without requiring assumptions to be made about the
normality of the data’s distribution. Indeed insufficient data are available here to
reliably ascertain the normality of their distribution by usual means (for example a
Shapiro-Wilk or Kolmogorov-Smirnov test). The Bland-Altman method is to be
preferred to the use of a correlation coefficient, as it inherently identifies bias
between the devices.
To obtain a pulse rate measurement for each of the test subjects over the 20 s
observation window, the Fourier spectra of the contact, and 760 nm and 880 nm
non-contact, PPG signals were calculated and the peak frequency of the cardiac
component noted. Figure 5.20 shows a scatter plot of the pulse rate measurement
from the conventional contact finger probe, versus the measurement from the
camera-based non-contact device. The non-contact 760 nm measurements are
11 On a serendipitous note: the second paper Bland and Altman published on this method (1986)—which appeared in the Lancet and can be credited with bringing the technique to the attention of the clinical community—assessed, as an example, the agreement between the new technique of pulse oximetry and the established CO-Oximeter, as a means of determining arterial oxygen saturation.
116

Instrument Description and Performance
plotted as circles and the 880 nm measurements as crosses. Where the circles and
crosses align the non-contact measurements agree at both wavelengths for that
subject. Also plotted in Figure 5.20 is the line x = y, where data points lie along this
line, there is perfect agreement between the two devices. Deviation from the line
indicates disagreement, an underestimation of pulse rate by the non-contact device
when the plotted point is to the left of the line, and an overestimation when the
point is to the right of the line.
It is worth noting that the measurements by the two devices will be perfectly
correlated if the points in the scatter plot lie along any straight line; only along the
line x = y however, do the two devices agree.
Figure 5.20 Scatter plot showing the non-contact device’s measurement of pulse rate at two wavelengths, versus the contact device’s measure-ment, for each subject. Also plotted is the line x = y, where both devices are in perfect agreement about the measurement. From Humphreys et al. (2007).
Examining Figure 5.20 it can be seen that for eight subjects, both devices are
in perfect agreement. However, for two subjects the non-contact device recorded a
lower pulse rate than the conventional device. Since the two devices are in
agreement for higher, intermediate, and lower pulse rates, and since both devices
117
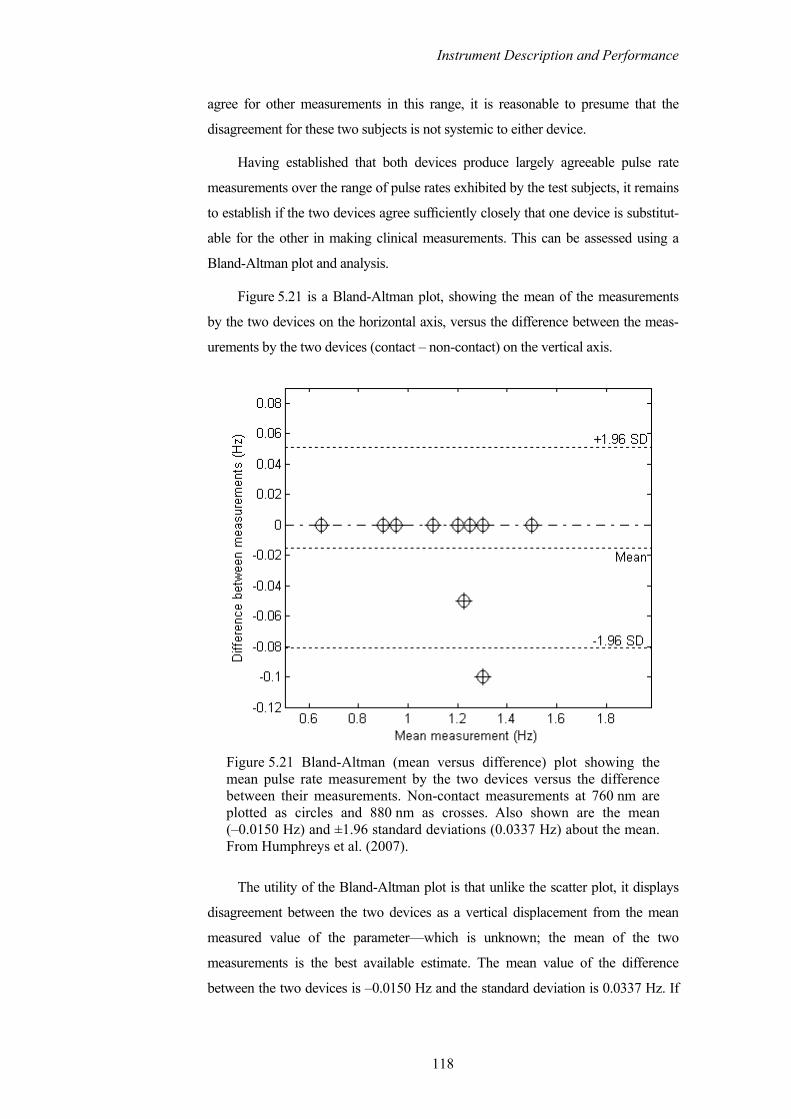
Instrument Description and Performance
agree for other measurements in this range, it is reasonable to presume that the
disagreement for these two subjects is not systemic to either device.
Having established that both devices produce largely agreeable pulse rate
measurements over the range of pulse rates exhibited by the test subjects, it remains
to establish if the two devices agree sufficiently closely that one device is substitut-
able for the other in making clinical measurements. This can be assessed using a
Bland-Altman plot and analysis.
Figure 5.21 is a Bland-Altman plot, showing the mean of the measurements
by the two devices on the horizontal axis, versus the difference between the meas-
urements by the two devices (contact – non-contact) on the vertical axis.
Figure 5.21 Bland-Altman (mean versus difference) plot showing the mean pulse rate measurement by the two devices versus the difference between their measurements. Non-contact measurements at 760 nm are plotted as circles and 880 nm as crosses. Also shown are the mean (–0.0150 Hz) and ±1.96 standard deviations (0.0337 Hz) about the mean. From Humphreys et al. (2007).
The utility of the Bland-Altman plot is that unlike the scatter plot, it displays
disagreement between the two devices as a vertical displacement from the mean
measured value of the parameter—which is unknown; the mean of the two
measurements is the best available estimate. The mean value of the difference
between the two devices is –0.0150 Hz and the standard deviation is 0.0337 Hz. If
118

Instrument Description and Performance
the two devices exhibited greater disagreement, Figure 5.21 would make any bias
plainly evident.
Assuming that the mean difference between the devices is normally
distributed, the 95% confidence interval can be calculated as ±1.96 standard
deviations. (It would take several more samples to establish if the difference is
normally distributed; a histogram would quickly show that these samples are not.)
Converting the 95% confidence limits from Hertz to pulses per minute, the non-
contact camera-based device should be expected to provide a measurement of pulse
rate that is within 4.8687 pulses/minute above or 3.0687 pulses/minute below the
contact device, for 95% of measurements. This is sufficiently close that the two
devices could be used interchangeably, since an indicated pulse rate 5 pulses/minute
above or 3 pulses/minute below the estimation of a currently accepted clinical
monitoring device, would not affect decisions regarding patient management
(Humphreys, et al. 2007).
In practice the pulse period can vary significantly from pulse to pulse, and
pulse oximeters use a weighted moving average of the peaks of the PPG waveforms
to calculate the displayed pulse rate (Wukitsch, et al. 1988). The use of the peaks of
the Fourier spectra in the above analysis has the effect of averaging the individual
pulse periods. This does not invalidate the analysis—the analysis is applied to the
contact and non-contact device alike—though it limits the number of sample points
on which the analysis is based to ten (the number of test subjects). It also limits the
range of pulse periods across which the two devices are compared, since the
variance in pulse rate of healthy resting adults is conceivably less than the variance
in the pulse-to-pulse period of an individual.
To analyse the comparability of the contact and non-contact devices in this
regard, the data pertaining to two test subjects were selected. Figure 5.17 and
Figure 5.18 depict the slowest and fastest recorded pulse rates among the test
subjects respectively. The data from these subjects were further processed to
determine the pulse periods of corresponding pulses as measured by the contact
device and the camera-based device, at both 760 nm and 880 nm. The pulse period
was measured as the distance between adjacent systolic peaks. Analysis of the data
pertaining to the two subjects exhibiting the maximum and minimum values of the
parameter of interest should identify any relationship that might exist between the
bias of the measurement and the value of the measured parameter.
119

Instrument Description and Performance
Figure 5.22 depicts a Bland-Altman plot of the contact device’s measurement
of pulse period versus the non-contact device’s measurement at 760 nm. Intuitively,
it might be expected that the measurements exhibit greater disagreement at higher
pulse rates—since the camera achieves a comparatively low 16 samples per second
compared to the contact devices 200 samples per second. The analysis shows the
opposite trend—disagreement between the contact and non-contact devices
increases with increasing pulse period. Figure 5.23 shows that the non-contact
measurements at 880 nm exhibit the same trend.
Figure 5.22 Bland-Altman plot of the contact device’s measurement of pulse period versus the non-contact device’s measurement at 760 nm. The data pertain to the two subjects that exhibited the fastest and slowest pulse rates during the experiments. (Mean 0.0043 s and standard deviation 0.0742 s.)
120

Instrument Description and Performance
Figure 5.23 Bland-Altman plot of the contact device’s measurement of pulse period versus the non-contact device’s measurement at 880 nm. (Mean 0.0043 s and standard deviation 0.0510 s.)
For pulse period measurements at 760 nm, the 95% confidence interval is
between +0.1497 s and –0.1411 s. (For 880 nm it is +0.1043 s and –0.0957 s.) If
this magnitude of disagreement were present between the conventional and camera-
based devices, for every pulse measurement, the resulting difference in the reported
pulses per minute, for a subject with a pulse rate of 72 beats per minute, would be
63.9931 – 86.6760 beats per minute. This is a significantly greater level of
disagreement between the conventional and camera-based technique than was
suggested by the analysis of the Fourier spectra measurement of all subjects’ pulse
rate. With this level of disagreement between the two devices, they could likely not
be considered comparable from a clinical perspective. However, some caution
should be exercised when interpreting these results.
The disagreement between the devices for large pulse periods is likely a result
of the differences in the shape of the contact and non-contact PPG waveforms for
this subject (refer to Figure 5.17). The non-contact PPG signals each display pulses
in which the systolic peak is consistently to the left of the pulses, which have a
sharp profile. The contact PPG signal for this subject exhibits pulses with a more
curved profile, on which the position of the systolic peak varies a little from pulse to
pulse—in addition to the normal pulse period variation. In addition to being
obtained by two different methods, the contact and non-contact PPG signals were
121

Instrument Description and Performance
captured from different locations. The effects of probe location on the shape of the
PPG waveform and its affect on pulse oximetry were discussed in Section 3.4.1.3,
while the combined effects of low sampling rate and camera-based detection on the
PPG waveform are the subject of the next section.
There is also a positive aspect of the pulse period analysis that deserves
mention. Referring again to the Bland-Altman plots depicted in Figure 5.22 and
Figure 5.23, it can be seen that the measurement difference between the two devices
does not exhibit a static bias or a varying bias across the pulse period’s range. This
bodes well for the inherent accuracy of the camera-based technique compared to the
contact technique—that is the measure of systemic error or bias. The absolute mean
error of the camera-based device is small (0.0150 Hz and 0.0043 s), and correct to
four decimal places, both wavelengths yielded the same mean error in both
analyses. The standard deviation of the measurement differences from both
analyses can be interpreted as an indication of the precision of the non-contact
technique compared to the contact technique—that is the degree of reproducibility
of the measurements. The analysis of the pulse period measurements suggests the
camera-based technique to be less precise for low pulse rates, though as mentioned
the shape of the non-contact PPG waveforms likely bear some culpability for this
precision. In general, the precision of the system can be improved by higher
sampling rates (yielding greater time resolution) and a camera with higher dynamic
and quantization ranges.
5.4.4 DERIVING SPO2 FROM A CAMERA-BASED DEVICE
As discussed in Section 3.2 pulse oximeters estimate arterial oxygen saturation
SpO2, by means of an interim variable ROS, the ratio of arterial absorption at two
wavelengths, obtained from the PPG waveforms, and then employ empirically
derived calibration curves to convert ROS to SpO2. The procedure and apparatus of
in vivo calibration and the principle of in vitro calibration were described in
Section 3.3.5; both in vivo and in vitro calibration are beyond the purview of this
research; this thesis instead focuses on evaluating the suitability of non-contact
photoplethysmography to existing calibration methods. In addressing the suitability
of non-contact PPG signals for use with existing methods of determining ROS (see
Section 3.2.2) two points about camera-based systems should be noted. They are
the effects of low sampling rates and the integrative effect of camera-based
sampling of waveforms (Humphreys, et al. 2007).
122

Instrument Description and Performance
Pulse oximeters typically sample at hundreds of Hertz, allowing over
100 samples per second per wavelength, as well as the sampling of ambient light
levels. Camera-based systems will likely never enjoy these frame rates, however at
low frame rate (Wieringa et al. (2005) reported frame rates as low as 6.7 frames/s)
the error in estimating the instantaneous amplitude of the PPG waveforms can be
significant. This is especially true of the peak and valley method (Section 3.2.2.1)
where sampling before or after the true peak or troughs in the waveform yields a
smaller peak-to-peak amplitude than the true value. Low frame rates will also affect
the accuracy of derivative type algorithms (Section 3.2.2.2). Recall that derivative
methods calculate ROS many times per pulse, though the values calculated in the
vicinity of the inflection points are inaccurate and need to be weighted as such to
prevent spurious values of SpO2. At low frame rates the number of estimates
possible during the most reliable, diastolic to systolic rise in the pulse waveform,
will be reduced. The problems of low frame rates are compounded by the manner in
which a camera samples a time-varying waveform.
The photodiode in a contact device produces a continuously varying output
current proportional to the instantaneous incident light intensity, which is converted
to a voltage and sampled by a sample-and-hold circuit, as often as once every 2 ms
(Section 3.3.3.1). A camera by contrast, exposes its CCD or CMOS sensor for
typically tens of milliseconds and then has a short readout time before beginning the
next exposure. The value readout at the end of the exposure is however, not an
instantaneously sampled value, but rather a charge proportional to the sum of all
photons received during the exposure—that is, the camera-derived signal is
proportional to the mean light intensity observed during the exposure. Thus none of
the points in a camera derived PPG signal are actual sample values of the true signal,
but rather they are all values proportional to the sum of the true signal, as observed
over several almost contiguous windows. The effect of this integrative sampling on
a sinusoidal waveform is illustrated in Figure 5.24.
Since the frame duration is constant, the mean value of the integration window
is plotted rather than the sum in Figure 5.24, which maintains the scale of the
integrative waveform. The dashed vertical lines indicate the end of a frame, at
which point the mean value of the true waveform (continuous line) between the
current vertical line and the vertical line immediately to the left is readout. During
periods of increasing amplitude, the mean value is always less than the
instantaneous value, and the converse is true during periods of decreasing
amplitude. The combined effect of low sampling rate and integrative sampling is to
123

Instrument Description and Performance
cause the observed waveform to exhibit reduced peak-to-peak amplitude and to
appear to lag the sample-and-hold waveform. Figure 5.25 illustrates one period of
the synthetic pulse waveform (generated by summing three sinusoids at typical
cardiac, vasomotion, and respiratory frequencies and amplitudes) and the corresp-
onding integrative waveform. The circles mark the inflection points of the sample-
and-hold waveform and the crosses the inflection points of the integrative
waveform.
Figure 5.24 Result of camera-based integrative sampling (dashed line) at 16 frames per second on a synthetic pulse waveform (continuous line) with 160 samples per second.
124

Instrument Description and Performance
Figure 5.25 Combined effect of low frame rate and integrative sampling on the peak-to-peak amplitude of a sample-and-hold synthetic pulse waveform.
The affect that this waveform distortion would have on a derivative based
method of calculating ROS would depend on the characteristics of the moving
weighted averaging of the instantaneous red/infrared ratios employed by the
manufacturer (see Section 3.2.2.2). It is reasonable to presume that it would not be
beneficial to accuracy. The affect of the waveform distortion on a peak and valley
based method of calculating ROS can be more readily quantified.
By again constructing a synthetic pulse signal composed of three sinusoids at
the typical vasomotion, respiratory, and cardiac frequencies, and with typical
proportionate amplitudes, the percentage error in the calculation of ROS values
using the peak and valley method, was determined for varying oxygen saturation
levels and pulse rates. The effect of varying oxygen saturation levels was emulated
by varying the ratio of the infrared and red PPG amplitudes linearly between
approximately 2.3 and 0.5, which for a red wavelength of 660 nm and an infrared
wavelength of 940 nm, correspond approximately to SpO2 values of between 100%
and 60% (see Figure 3.9 and refer to Wukitsch et al. (1988)). ROS was calculated
using equation (3.13):
ln
ln
L
HOS
L
H
RR
RIRIR
=
.
125

Instrument Description and Performance
The results of the simulation are summarised in Table 5.3. The discrepancy
between the ROS values obtained from the sample-and-hold waveform and the
integrative waveform vary with both pulse rate and oxygen saturation. The
percentage error is largest when both the saturation and pulse rate are at their
highest.
The dependence on pulse rate exhibited by the simulation results should be
interpreted with some caution. The likely cause of the increased error with
increased pulse rate, is the increased slope of the rising (diastolic to systolic) portion
of the synthetic PPG waveform, which causes the integrative waveform to further
lag the sample-and-hold waveform and consequently to underestimate the true
peak. In an actual PPG waveform, the slope of the rising edge is proportional to the
force of contraction of the heart, which is not particularly dependent on pulse rate—
compare the PPG signals plotted in Figure 5.17 and Figure 5.18.
Pulse rate Approx. SPO2 (%)
IR:R PPG scaling factor 50 72 100
100 2.32 1.3 1.69 2.58 1.66 0.69 0.9 1.35
85 1 0 0 0 0.81 -0.2 -0.28 -0.4
60 0.47 -0.51 -0.73 -1.09
Table 5.3 Simulated percentage error in calculation of ROS due to integrative sampling at a frame rate of 16 frames/s, compared to a sample-and-hold waveform sampled at 160 samples/s (Humphreys, et al. 2007).
More credence can be given to the error’s oxygen saturation level dependence.
As the magnitudes of the red and infrared PPG signals vary with oxygen saturation,
so too do the magnitudes of the integration error associated with each. At high
saturations the infrared PPG has much larger amplitude than the red PPG,
consequently its associated error is larger too. Equation (3.13) defined ROS as the
quotient of the red and infrared PPG signals. Thus for high saturations the error
associated with the numerator (the red PPG) is comparatively small and the error
associated with the denominator (the infrared PPG) is comparatively large. Since a
larger error means greater underestimation of the peak-to-peak amplitude, at high
saturations ROS is overestimated by a small fraction. At low saturations, the red PPG
has larger amplitude than the infrared, thus the reverse is true and ROS is under
126

Instrument Description and Performance
estimated by a small fraction—though the comparative difference in the PPG
amplitudes is slightly less at low saturations and so the underestimation has smaller
magnitude than the overestimation at high saturations. At some saturation level the
red and infrared PPG signals will have equal magnitude (approximately 85% for
660 nm and 940 nm), at this saturation level the error associated with each signal is
the same and their quotient does not introduce error into the ROS calculation.
Within the range of pulse rate and oxygen saturation level simulated,
compared to the contact technique, the camera-based technique produced a
maximum overestimation in ROS of 2.6% and a maximum underestimation of
–1.1%. If the differences in ROS values summarised in Table 5.3 were translated
directly in to SpO2 errors, for high saturations, the bias resulting from the camera’s
integrative sampling would cause an over estimation of saturation that is of
comparable size to the current clinically accepted accuracy of the contact method:
±3% (see Section 3.4.1). Such an additional error might be of clinical significance.
Fortuitously, the simulation results suggest that integration error decreases
with saturation, providing an underestimation in low saturation regions where a
patient would be danger.
5.5 ANALYSIS OF ASPECTS OF DEVICE’S PERFORMANCE
A further consideration should be made in performing camera-based non-contact
photoplethysmography for pulse oximetry: choosing the size of the region of
interest (ROI) within the imaged frame from which the PPG signal is obtained. The
size of the ROI and its position relative to the tissue under investigation influences
the characteristics of the derived PPG signal.
Section 3.3.4.2 reviewed the design considerations pertaining to reflectance
probes in conventional pulse oximeters. In summary, those parameters were the
source and detector separation and the surface area of the detector, or in the case of
multiple detectors, their arrangement. Mendelson and Ochs (1988) concluded that
in the case of contact reflectance pulse oximetry, summing the signals from multiple
detectors arranged symmetrically around the sources provided the best PPG signals.
Reddy (1997), in reviewing Mendelson and Ochs’ work, suggested that a detector
with enlarged area would achieve the same results.
In a camera-based system the active area of the detector—the regions of
interest within each frame—are almost arbitrarily variable in shape, number,
127

Instrument Description and Performance
arrangement, and area. This section investigates the effectiveness of enlarged
detector area and multiple detection sites in the camera-based device.
5.5.1 EFFECT OF ROI SIZE ON PLETHYSMOGRAPH CHARACTERISTICS
Unless the PPG signal is obtained from just one pixel a camera-based system
inherently utilises multiple detectors, combining their surface area to either sum or
average the intensity of the emitted light in the search for PPG signals. For
convenience in addressing pixels within the frames, the regions of interest are
chosen as contiguous pixels grouped into rectangles, which thus far, have also been
square. The shape and size of this area is naturally a variable of interest.
During investigations of the effects of the region of interest’s size and shape,
some interesting size dependent phenomena were observed, which hint at the
additional unforeseen complexity and indeed potential of camera-based photo-
plethysmographic investigation. For illustrative purposes, a comparison is provided
here of the PPG signals that are obtained from one twenty second AVI file, when
image analysis is performed using three different sized regions of interest.
Figure 5.26 depicts a sample frame from the 880 nm sequence on which are
imposed the square outlines of ROIs with dimensions, 20×20, 40×40, and 80×80
pixels respectively. Also visible in each image is the 880 nm indicator light in the
top right hand corner. The imaged area corresponds approximately to that depicted
in Figure 5.16 (though the orientation is upside down compared to Figure 5.16) and
the separation of the camera and tissue is approximately 30 cm. The actual area of
tissue that is imaged is a function of the system’s optics though the image in
Figure 5.26 depicts approximately 16 cm2.
128
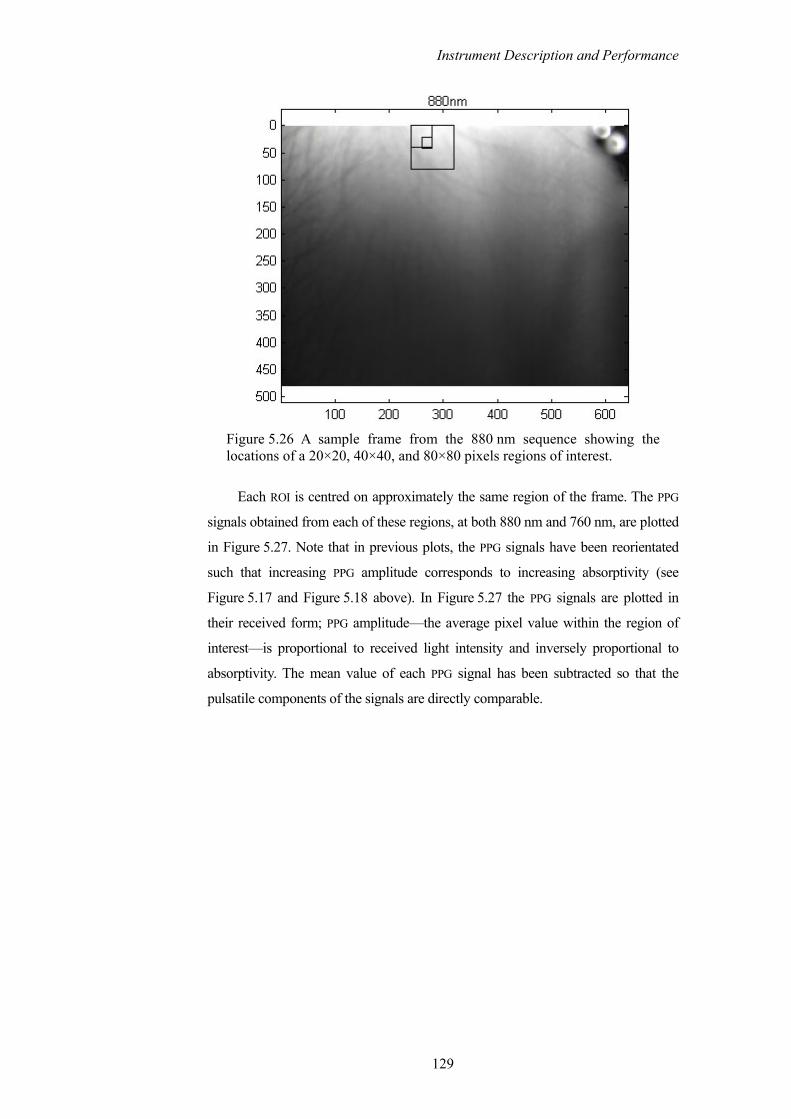
Instrument Description and Performance
Figure 5.26 A sample frame from the 880 nm sequence showing the locations of a 20×20, 40×40, and 80×80 pixels regions of interest.
Each ROI is centred on approximately the same region of the frame. The PPG
signals obtained from each of these regions, at both 880 nm and 760 nm, are plotted
in Figure 5.27. Note that in previous plots, the PPG signals have been reorientated
such that increasing PPG amplitude corresponds to increasing absorptivity (see
Figure 5.17 and Figure 5.18 above). In Figure 5.27 the PPG signals are plotted in
their received form; PPG amplitude—the average pixel value within the region of
interest—is proportional to received light intensity and inversely proportional to
absorptivity. The mean value of each PPG signal has been subtracted so that the
pulsatile components of the signals are directly comparable.
129

Instrument Description and Performance
Figure 5.27 PPG signals obtained from similarly positioned regions of interest of different sizes for both wavelengths.
The three PPG signals obtained using different size regions of interest are
broadly similar for both wavelengths. They are well aligned during the diastolic to
systolic portion of the pulse (the peaks and troughs respectively in Figure 5.27).
However the magnified view of the waveforms depicted in Figure 5.28 shows that a
significant difference exists in the peak-to-peak amplitude of the PPG signal
depending on the size of the region of interest. Converse to the findings of
Mendelson and Ochs (1988) and the predictions of Reddy (1997) pertaining to
contact reflectance PPG measurement, the detected PPG amplitude diminishes as the
area of the detector, the region of interest (the boxes) in this case, increases.
130

Instrument Description and Performance
Figure 5.28 Magnified portion of the three 880 nm PPG signals plotted in Figure 5.27, depicting variation in PPG peak-to-peak amplitude due to different size regions of interest.
The magnitude of the effect can be more clearly observed in the frequency
domain. The Fourier spectra of the PPG signals plotted in Figure 5.27 are plotted in
Figure 5.29. All three spectra share similar peaks, though the amplitudes vary. At
the pulse frequency (approximately 0.7 Hz) the enlarged regions of interest result in
a reduction of amplitude of approximately 25% at 880 nm and approximately 50%
at 760 nm, compared to the peak resulting from the 20×20 pixel region of interest.
The reduction that occurs at the pulse frequency is disproportionately large
compared to the other peaks, for example the respiratory peak at approximately
0.4 Hz, which is not affected by region of interest size at 880 nm and minimally
affected at 760 nm.
The cause of the PPG amplitude reduction with increasing region of interest
size in this instance is a phenomenon that is largely unreported upon in the
literature: PPG inversion. In some regions of the imaged tissue, the camera-based
device captures signals that are the precise inverse of the expected PPG signal. When
a region of interest becomes large enough to encompass both a normal PPG and an
inverted PPG, the two signals interfere destructively, resulting in a reduction of the
detected PPG amplitude.
An examination of the PPG inversion phenomenon and a hypothesis as to the
cause are the subjects of the next section.
131

Instrument Description and Performance
Figure 5.29 Fourier spectra of PPG signals obtained from different size regions of interest.
5.5.2 DETECTION OF INVERTED PPG SIGNALS
When making remote non-contact observations of deep tissue in a reflection
geometry the camera-based system routinely detects inverted PPG signals. That is,
signals where the peak in the detected light intensity occurs at the systolic peak of
the pulse waveform, and the trough at the diastolic trough of the pulse waveform.
This is the reverse of the normal situation, where high absorptivity during systole
causes low transmittance and a trough in the detected light intensity, the reverse
being true of the diastolic portion of the waveform (refer to Section 3.2.1).
Figure 5.30 displays a normal waveform captured by the camera system. The
vertical axis displays the average pixel value within the region of interest, which is
proportional to the received light intensity.
132

Instrument Description and Performance
Figure 5.30 Normal PPG waveforms captured from a 40×40 pixel region of interest.
Figure 5.31 displays an inverted PPG waveform captured from a different
region of the same AVI file. It can be seen that at both wavelengths the signals share
common inflection points, though the signals in Figure 5.31 appear to be the inverse
of those in Figure 5.30.
Figure 5.31 Inverted PPG waveforms captured from a 40×40 pixel region of interest within the same AVI as Figure 5.30.
133

Instrument Description and Performance
The inverted signals are not subjected here to the scrutiny that the normal PPG
signals received earlier; that they are indeed inverted PPG signals seems a reason-
able postulation given their similarity to the normal signals (note also the inversion
of the dichrotic notch).
Figure 5.32 displays an overlay of the Fourier spectra of the normal and
inverted PPG signals at both wavelengths.
Both signals have distinct peaks coincident at the pulse frequency (0.7 Hz) and
at its first harmonic. The inverted 760 nm spectrum exhibits a larger peak at the
pulse frequency than the normal PPG spectrum and a similar peak at the respiration
frequency (0.4 Hz). The inverted 880 nm spectrum has a comparable peak at the
pulse frequency and a reduced peak at the respiratory frequency compared to the
normal PPG spectrum.
Figure 5.32 Fourier spectra of the inverted and normal PPG signals at both wavelengths.
The inverted PPG signals are most often detected from contiguous regions of
the frames. Figure 5.33 displays a sample frame from the 880 nm sequence of an
134

Instrument Description and Performance
AVI file. Boxes are superimposed indicating the regions where PPG signals were
clearly discernable at both wavelengths. Also indicated in Figure 5.33 are the boxes
in which inverted PPG signals were detected at both wavelengths.
Figure 5.34 displays the results obtained from the same AVI file when image
analysis is performed using a box size of 40×40 pixels and Figure 5.35 the results
from analysis at 80×80 pixels. Note that for the most part between areas with
normal and inverted PPG signals, there is region in which no signals are detected.
Where light emerging from those regions contains both inverted and normal signals
the resulting destructive interference cause no pulsatile component to be detected.
Note from Figure 5.30 and Figure 5.31, and from the spectra in Figure 5.32, that the
inverted and normal PPG waveforms have comparable pulsatile amplitudes,
accounting for typically less than 1% of the quantization range. With reference to
the spectra in Figure 5.32 and the spectral method of identifying PPG containing
ROIs in Section 5.3.3, inverted PPG signals frequently produce the highest spectral
figure of merit for a video file.
Figure 5.33 Outline of 20×20 pixel regions from which PPG signals (continuous line) and inverted PPG signals (broken line) were discernable at both wavelengths.
135

Instrument Description and Performance
Figure 5.34 Outline of 40×40 pixel regions from which PPG signals (continuous line) and inverted PPG signals (broken line) were discernable at both wavelengths.
Figure 5.35 Outline of 80×80 pixel regions from which PPG signals (continuous line) and inverted PPG signals (broken line) were discernable at both wavelengths.
This phenomenon is unreported in the literature pertaining to either reflective
or transmissive contact pulse oximetry. The phenomenon was reported by Maguire
(2004), who encountered it but did not explain it, during a study of reflectance
photoplethysmography based pulse transit-time measurement. In the experiment
described here in Section 5.4.1, data from three of the ten test subjects exhibited the
136

Instrument Description and Performance
phenomenon. The phenomenon was not observed in earlier experiments using a
camera-based system to perform detection by either transmissive illumination and
detection (Humphreys, et al. 2005a; Humphreys, et al. 2005b), or reflective
illumination and detection of small extremities (Humphreys, et al. 2005c).
Figure 3.6 depicted the arrangement of erythrocytes during the various stages
of the pulse cycle. At systolic pressure the erythrocytes are densely grouped and
orientated such that their long axes are perpendicular to the direction of blood flow.
At diastole the erythrocytes are least densely grouped and are orientated such that
their long axes are parallel to the direction of blood flow. The direction of arteries
within small extremities means that transmission probes cannot be orientated other
than to have the path between the source and detector perpendicular to the direction
of the artery. Thus for a transmission geometry maximum absorption (minimum
transmittance) of light occurs at systole and minimum absorption (maximum
transmittance) at diastole. The position of a transmission source and detector and
the optical path between them are depicted in Figure 5.36.
DiastoleSystole Diastole
Blood flow
Tissue surface
Tissue surface
Non-contact detection
areaTransmission
source Non-contact
source
Vessel wall
Transmission detection
point
Figure 5.36 Depiction of the arrangement and orientation of erythrocytes in a peripheral artery during the cardiac pulse. Also depicted are the outline of the optical paths between source and detector for a transmiss-ion and non-contact reflection geometry (dashed lines). (Not to scale.)
Also depicted in Figure 5.36 are the relative locations of the source and
detector for the camera based device. The source and detector separation are
significantly greater for the non-contact device and since the signals are obtained
from backscattered light, the possibility exists that the optical path between the
source and detector will pass axially through an artery, rather than diametrically as
137

Instrument Description and Performance
in the transmission case. In this case, during diastole, the erythrocytes are orientated
such that their long axes, while still parallel to the direction of blood flow, are
perpendicular to the optical path. During systole, the erythrocytes present their short
axes to the optical path. This situation results in maximum transmittance (minimum
absorption) at systole and minimum transmittance (maximum absorption) at
diastole—resulting in a signal that is the inverse of a conventional PPG. The
proclivity of camera-based system to capture such signals may be due, in general to
the larger source and detector separation than is present in contact probes, and in
this instance in particular to the region of tissue being imaged; the forearm is
imaged with the axis of alignment between the source and detector parallel to the
major arteries (see Figure 5.16). The fact that such inverted signals have not
previously been observed with conventional contact reflectance probes might be
explained by the smaller source-detector separation. In conventional reflectance
contact probes the source-detector separation is limited to just a few millimetres.
This has the effect of limiting the penetration depth of the light so that absorption is
due to a shallow vascular bed, in which the directions of the smaller arteries do not
follow the orientation of the limb. Where the propagation path does intersect axially
with arteries, the short source-detector separation limits the axial absorption.
5.6 ACHIEVABLE SEPARATION OF TISSUE AND CAMERA
Naturally a question of interest to remote non-contact pulse oximetry or photo-
plethysmography, is how far can the light source and detector be located from the
tissue under investigation? The achievable separation may determine the uses to
which the technique can be put.
Experimentally testing the achievable separation of one particular camera and
source combination would be somewhat meaningless. The achievable separation of
the system is ultimately a function of the combined characteristics of the system’s
optics, source, and detector. To experimentally investigate the affect of tissue-source
separation would require several types of light source—since LEDs or arrays of
LEDs are unsuited to illuminating tissue from distances of more than a few
centimetres. Equally to investigate the achievable detector-tissue separation
experimentally would require at least a selection of lenses of suitable magnification
and optical format for the camera. These results would then pertain only to that
camera—which is in itself arguably the most variable component.
138

Instrument Description and Performance
Rather than collecting empirical data pertaining to the system described in this
thesis, a simplified probabilistic model is developed here. The model attempts to
predict the decrease in the number of photons striking the detector as a function of
tissue-detector separation and detector area, in response to a monochromatic point
source. The prediction by the model is compared to data from a Monte Carlo
simulation (see Section 2.3.3) of a three-layer tissue model.
During the course of the discussion that follows, knowledge of the distribution
of the photons’ trajectories as they emerge from the tissue under investigation, will
be seen to be crucial to the accuracy of the prediction by model. As such two
models are developed here, one based on a normal distribution and the other based
on a uniform distribution.
5.6.1 MONTE CARLO SIMULATION
The Monte Carlo simulation of tissue-detector separation is described first as
knowledge of the characteristics of photons emerging from the tissue model is
instructive in describing the rationale for the probabilistic models that follow.
A Monte Carlo simulation was conducted using a simple three-layer model of
tissue, consisting of parallel layers of skin and fat, with respective thicknesses of
2 mm and 5 mm, and an infinitely deep layer of muscle. Niwayama et al. (2006)
describe the optical properties of such a model for similar purposes, which are
given in Table 5.4. The same Cartesian coordinate system is used here as that
described in Section 2.3.3. The tissue surface is assumed to be the flat x-y plane
defined as z = 0. Positive values of z denote a position inside the tissue, negative
values a position outside the tissue, and z = 0 the air-tissue interface. The refractive
indices of all tissues are assigned the value 1.3.
Tissue µ's (mm-1)
µa (mm-1)
Skin 1.3 0.02 Fat 1.2 0.002
Muscle 0.6 0.02
Table 5.4 Values of bloodless scattering coefficients (µ's) and absorption coefficients (µa) for three-layer Monte Carlo model (Niwayama, et al. 2006).
139

Instrument Description and Performance
One million photon packets were injected vertically at location (0, 0, 0)
constituting a point source. The detector area (with dimensions in millimetres) was
defined as the circular region centred at (15, 15, z), with radius 10 mm, where the
value of z denotes the separation of the tissue and detector (with z = 0 being
contact).
At this point a simplifying assumption is made that the detector area, which in
practice is the lens face, is a flat surface, and that all incident photons striking the
detector surface are detectable (by the camera). This assumption ignores several
important physical attributes of both the system’s optics and the camera’s detector
(be it a CMOS or CCD sensor). Firstly the lens will present a convex parabola rather
than a flat surface towards the tissue surface, which itself is likely uneven and not
parallel to the detector surface. Secondly the glass lens will have a critical angle of
incidence, beyond which incident photons will be reflected from the surface rather
than refracted by the lens. Thirdly the lens will have a limited ability to focus light
from a wide numerical aperture onto the camera’s detector. Fourthly, assuming the
lens has focused light from a wide numerical aperture onto the camera’s detector,
the detector may yet be insensitive to light focused from such angles depending on
the geometry of the detector and the lens aperture. This may be particularly
prevalent in 4/5T CMOS devices, where a stack of optically insensitive components
can cast a shadow on the optically sensitive area of each pixel. The problem can be
compounded with either CMOS or CCD technology by the presence of micro-lenses
over the pixels (refer to the discussion in Section 4.2). The collective affect of these
assumptions is to overestimate the number of detectable photons at small tissue-
detector separations (since at larger separations photons travelling on wide
trajectories will likely not strike the detector area).
Thus under the contact condition (z = 0) a detectable photon is considered to
be any backscattered photon emerging from the tissue within a 10 mm radius of the
point (15, 15, 0).
Once a photon emerges from the tissue its trajectory in air remains unchanged.
Thus, using the photon’s point of emergence and its directional cosines (defined in
Section 2.3.3), a second point on each photon’s trajectory can be calculated by
equation (2.12), where ∆s is now an arbitrary distance,
.
new x
new y
new z
x x s
y y
z z
µ
µ
µ
s
s
= + ∆
= + ∆
= + ∆
140

Instrument Description and Performance
From the two points along each photon’s trajectory a parametric equation is
formed. For each parametric trajectory the point of intersection with each plane to
which the detector is moved is calculated, as well as the angle each trajectory makes
with the normal to the tissue plane (and all parallel detector planes). Where the
point of intersection of a trajectory and the current detector plane is less than 10 mm
from the point (15, 15, z), that photon is considered detectable at that distance from
the tissue.
Figure 5.37 displays the diverging trajectories of photons emerging from the
defined detector region, resulting from the Monte Carlo simulation. The points of
intersection of the trajectories with detector planes at 50 mm and 100 mm from the
tissue surface are marked by dots. Note that the rectangles imposed on the planes in
Figure 5.37 have dimensions of 100 mm by 100 mm.
Figure 5.37 Diverging trajectories of photon packets emerging from circular region of three-layer tissue model. Dots mark the points of intersection with parallel planes to the tissue at z = −50 mm and z = −100 mm.
Figure 5.38 depicts the results of the Monte Carlo simulation showing the
decrease in number of detectable photons as a function of tissue-detector separation.
141
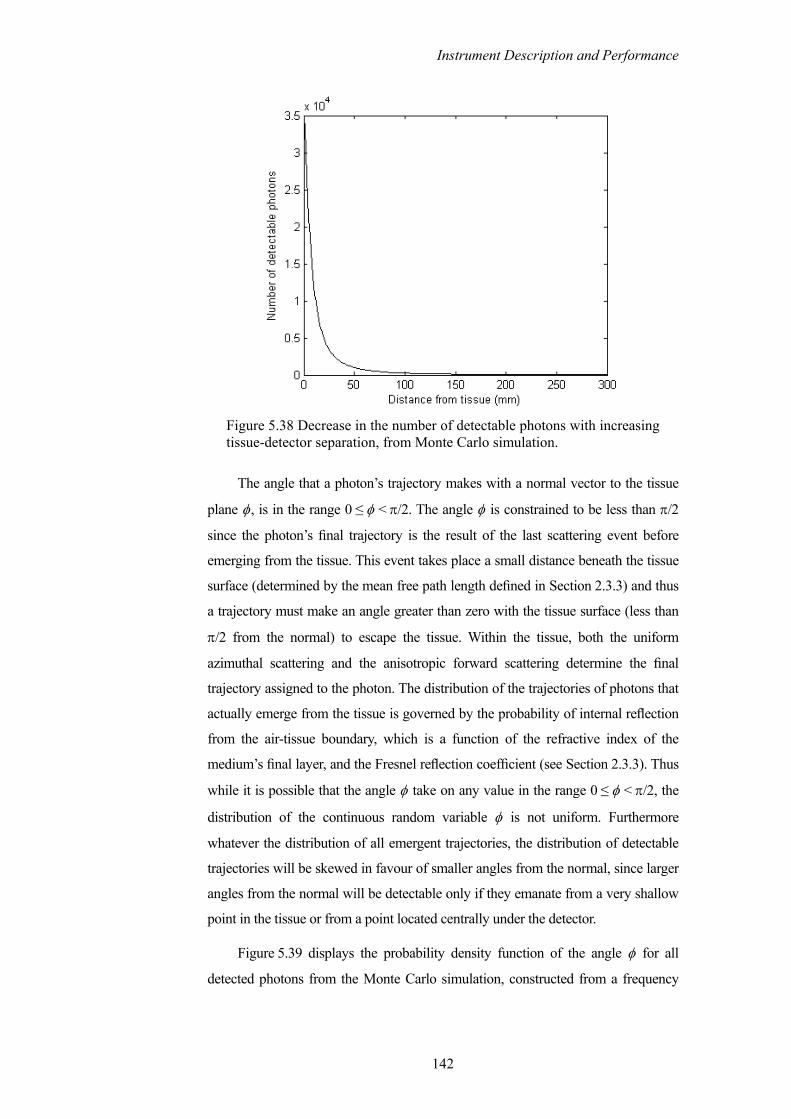
Instrument Description and Performance
Figure 5.38 Decrease in the number of detectable photons with increasing tissue-detector separation, from Monte Carlo simulation.
The angle that a photon’s trajectory makes with a normal vector to the tissue
plane φ, is in the range 0 ≤ φ < π/2. The angle φ is constrained to be less than π/2
since the photon’s final trajectory is the result of the last scattering event before
emerging from the tissue. This event takes place a small distance beneath the tissue
surface (determined by the mean free path length defined in Section 2.3.3) and thus
a trajectory must make an angle greater than zero with the tissue surface (less than
π/2 from the normal) to escape the tissue. Within the tissue, both the uniform
azimuthal scattering and the anisotropic forward scattering determine the final
trajectory assigned to the photon. The distribution of the trajectories of photons that
actually emerge from the tissue is governed by the probability of internal reflection
from the air-tissue boundary, which is a function of the refractive index of the
medium’s final layer, and the Fresnel reflection coefficient (see Section 2.3.3). Thus
while it is possible that the angle φ take on any value in the range 0 ≤ φ < π/2, the
distribution of the continuous random variable φ is not uniform. Furthermore
whatever the distribution of all emergent trajectories, the distribution of detectable
trajectories will be skewed in favour of smaller angles from the normal, since larger
angles from the normal will be detectable only if they emanate from a very shallow
point in the tissue or from a point located centrally under the detector.
Figure 5.39 displays the probability density function of the angle φ for all
detected photons from the Monte Carlo simulation, constructed from a frequency
142

Instrument Description and Performance
distribution with ninety bins, such that the magnitude of the nth vertical line in
Figure 5.39 gives the probability
π
Prob ( 1)180 180
n φ− ≤ <
πn
. (5.7)
Figure 5.39 Probability density function showing the distribution of the angle between the photon trajectories and the normal to the tissue plane φ.
As expected, the distribution can be seen to tail off more gradually to its left
side—favouring trajectories that make small angles with the normal to the tissue.
The next section describes two probabilistic models to predict the decrease in
the number of detectable photons as a function of tissue-detector separation and
detector area.
5.6.2 PROBABILISTIC MODEL OF TISSUE-CAMERA SEPARATION
Predicting the relative number of detectable photons at a given height above the
tissue surface, for a given detector area, depends upon correctly modelling the
distribution of the detectable photons. Two simplified geometric models are
developed here based on a uniform trajectory distribution and a normal trajectory
distribution. The predictions by both models are then compared to data from Monte
Carlo simulations.
143

Instrument Description and Performance
5.6.2.1 UNIFORM CONIC MODEL
Consider an infinitely tall inverted cone, perpendicular to the tissue surface, defined
by an angle θ, and emanating from a point p some distance below the tissue
surface. The cone is constructed such that its circular cross-section at the tissue
surface coincides exactly with the circular area of the detector of radius r, as
depicted in Figure 5.40. The angle θ is defined to be the maximum angle that a
photon trajectory (φ) makes with a normal vector to the tissue plane. Since the
cone’s surface coincides with the detector area at the tissue surface, the volume of
the cone encloses the trajectories of all photons that are detectable under contact
conditions. The point p, the apex of the cone located a distance z beneath the tissue
surface, is the geometrical projection of where the scattering appears to have taken
place when viewed from outside the tissue. In fact the photons are only collinear at
the injection point on the tissue surface, and after travelling through the region
indicated in Figure 5.40, acquire their ultimate trajectory only a fraction of a
millimetre beneath the tissue surface.
φ
Photon trajectory
h
p
Photon path
Tissue surface
Photon injection
point
z
h'
r R(h)
θ
Figure 5.40 Conic model of decrease in number of detectable photons as a function of tissue-detector separation and detector area.
Two assumptions are now made about the distribution of photons emerging
from the region of interest. First it is assumed that the points of emergence of the
backscattered photons are uniformly distributed throughout the region of interest. In
Chapter 2 it was established theoretically and by simulation that the number of
backscattered photons emerging from the tissue decreases exponentially with
increasing radial distance from the injection point. Thus the assumption that photon
emergence points are uniformly distributed over the detector area may be invalid
close to the injection point where the exponential profile is steep (refer to
Figure 2.4). However referring to Figure 2.4 (which depicts the number of
backscattered photons versus radial distance from the source), the assumption
144

Instrument Description and Performance
appears reasonable for larger source-detector separations (say greater than 50 mm).
Second it is assumed that the angle φ itself is uniformly distributed about the
normal to the tissue plane. (The invalidity of this assumption can quickly be
ascertained with reference to the actual distribution of φ depicted in Figure 5.39.)
Now having assumed that the photon trajectories are uniformly distributed
about the normal vector to the tissue, and that the emergence points are uniformly
distributed over the detector area, the probability of detecting any given photon at a
height h' above the tissue surface is given by the ratio of the detector area to the
area of the cone’s face at h',
2
2
πProb (detection at ) =
π ( , )r
h'R h' θ
. (5.8)
Thus if N photons are detectable when the detector is in contact with the
tissue, the number of photons detectable at a height h' above the tissue surface
n(h'), is given by
2 2
2( )
( , ) ( tan )Nr Nr
n h'R h' r h' 2θ θ
= =+
. (5.9)
The angle θ is bounded between the same limits as the photon trajectory angle
φ, thus 0 ≤ θ < π/2. In practice, the assumption of a uniform distribution greatly
exaggerates the divergence of the photons (see Figure 5.39) and predicts far fewer
detectable photons than the simulation suggests. The inaccuracy of the assumption
that the distribution is uniform can be reduced by limiting the range of θ to
0 ≤ θ < π/4. Imposing such a limit on θ excludes many photons emerging on
trajectories that form a large angle with the normal—indeed from Figure 5.39
Prob (0 ≤ θ < π/4) is calculated to be 0.4376. However trajectories with a large
divergence from the normal to the tissue quickly become undetectable in any event,
and the exclusion of such trajectories produces significant prediction error only at
small tissue-detector separations. The prediction by the conic model as compared to
the Monte Carlo simulation results can be seen in Figure 5.41.
145

Instrument Description and Performance
Figure 5.41 Comparison of uniform conic model prediction and Monte Carlo simulation data, showing decreasing number of detectable photons with increasing tissue-detector separation.
The uniform conic model forms its prediction based on assumptions about the
distribution of backscattered photon trajectories and on the area of the detector’s
lens. For a given system the model may be a useful predictor of achievable tissue-
lens separation, however it can also serve as a quick indicator of the effect of
varying the lens size. Figure 5.42 displays the predicted effect of increasing lens
radius from 5 mm to 50 mm on the relative number of detectable photons.
Figure 5.42 Uniform conic model prediction of effect of increasing lens radius on the relative number of detectable photons as a function of tissue-lens separation.
146

Instrument Description and Performance
The prediction of the effect of increased lens radius by the uniform conic
model was tested against the Monte Carlo simulation data. For a common injection
point defined at (0, 0, 0), data were collected from two detector areas, both centred
at (30, 0, z) with radii of 10 mm and 20 mm. The results are displayed in
Figure 5.43. The model can be seen to have a comparable prediction error for each
radius, and converges on the simulation data for separations greater than approxim-
ately 60 mm. This result in conjunction with that displayed in Figure 5.41 is
significant, as collectively they evaluate the model for varying detector areas, both
close to, and at some distance from the injection point. This gives some validity to
the first assumption of the uniform conic model that (despite being known to have
an exponential distribution) the emergence points of photons within the detector
area can be considered uniformly distributed.
Figure 5.43 Predicted and actual effect of increasing lens radius on the number of detectable photons.
A point worth noting about the relationship between the number of detectable
photons and the tissue-detector separation is that the curve is particularly steep for
small separations and almost flat beyond a few centimetres. Operating at distances
of several centimetres from the tissue surface, the detectable light intensity can be
147

Instrument Description and Performance
expected to vary little with small changes in the tissue-detector separation. However
at smaller tissue-detector separations, the variation in detected light intensity
emanating from the region of interest will be significantly affected by even slight
variations in the separation distance. It is in this initial sensitive region that the
uniform conic model’s prediction deviates most from the simulation data.
5.6.2.2 NORMAL CONIC MODEL
Though it is perhaps easiest to envision applications of non-contact pulse oximetry
or photoplethysmography that operate at larger tissue-detector separations, it is
conceivable that future applications may also operate close to the tissue surface. A
conic model based on a normal distribution of the angle between the photon
trajectories and the normal vector to the tissue is described here, which attempts to
improve upon the uniform conic model’s prediction, particularly in the initial
separation region.
For convenience the conic model depicted in Figure 5.40 is redrawn here as a
flat elevation view in Figure 5.44. Once again the photons’ trajectories are defined
by the angle they make with a normal vector to the tissue plane φ. While the
geometric construction of the cone is as before, an important distinction is made
here. In the uniform model the angle θ enclosed the trajectories of all backscattered
photons simultaneously. Now θ is defined to be the solid angle enclosing an
individual photon’s trajectory. Although θ has the same value and distribution as φ,
the cone formed by θ and emanating from the point p is constructed to intersect the
tissue plane through the circumference of the detector area. Thus the cone encloses
the photon trajectory with angle φ regardless of the point of emergence of the
photon, obviating the need for an explicit simplifying assumption about the
distribution of the emergence points within the detector area. The point p is located
a distance z beneath the tissue surface. The distance z must be sufficiently shallow
to accommodate the maximum value of θ, which like φ can be arbitrarily close to
but less than π/2. The maximum value of z is thus given by
1
maxtanr
zθ−
= . (5.10)
As before, the detector radius is denoted by r and the radius of the cone’s face
at a given height above either the apex (h) or the tissue surface (h') is denoted by R.
148

Instrument Description and Performance
φ
h
p
Tissue surface
z
h'
r R(h)
θ
Figure 5.44 Elevation view of 3D conic model depicted Figure 5.40.
For a given detector radius r, the probability that a photon with a trajectory φ
is detectable at a height h is given by,
Probability of detection Prob ( ( ) )R h r= ≤ . (5.11)
The radius of the cone’s face at a height h is given by,
( ) ( ) tanR h h' z θ= + . (5.12)
Thus the probability of detection at a height h' above the tissue surface can be
written as,
1 Probability of detection Prob tanr
h' zθ −= ≤
+
. (5.13)
Thus from equation (5.13) the probability that a particular trajectory is
detectable at a height h' above the tissue surface is given by the cumulative
distribution function of the continuous random variable θ, which is also the
cumulative distribution function of the continuous random variable φ.
Constructing a normal curve with a mean value (µ) of π/4 radians and a
standard deviation (σ) of π/8 radians produces a bell shaped curve that
approximates the distribution of the random variable φ (which from the Monte
Carlo simulations was found to have actual values of µ = 0.8341 radians and
σ = 0.3240 radians). The curve is depicted in Figure 5.45.
149

Instrument Description and Performance
Figure 5.45 Normal probability density function.
The desired cumulative distribution function is obtained by numerically
integrating the probability density function. The resulting curve is displayed in
Figure 5.46. For comparison the cumulative distribution of the actual Monte Carlo
simulation data is also displayed.
Figure 5.46 Normal cumulative distribution function.
Two points should be noted about using a normal distribution to approximate
the distribution of the backscattered photon trajectories. First with reference to
Figure 5.39, the distribution of the simulated photon trajectories is asymmetric
about its mean value; a normal approximation will be symmetric. The second, more
consequential point, is that unlike a true continuous normal random variable, the
photon trajectories, although continuous, are limited to the range 0 ≤ φ < π/2. The
area under the curve in Figure 5.45 is 0.9850 and only sums to unity as the limits of
integration become infinite in both directions. In this sense the curve depicted in
150

Instrument Description and Performance
Figure 5.45 is not a probability distribution. As a direct result, the cumulative
distribution function depicted in Figure 5.46 has a value of less than one as φ
approaches π/2, meaning that the conic model will assign a probability of less than
one to the event that all photons are detectable under contact conditions, despite the
geometry of the model having being explicitly constructed on this basis.
It now remains to calculate the distance z, which is a function of the largest
photon trajectory φ that the angle θ must enclose. In practice it is sufficient to
choose θmax to be some angle improbably close to π/2 (determinable from
cumulative distribution function), of the order 19π/40. A comparison of the Monte
Carlo simulation data and the normal conic model prediction of the decreasing
number of detectable photons is depicted in Figure 5.47.
Figure 5.47 Comparison of normal conic model prediction and Monte Carlo simulation data, showing decreasing number of detectable photons with increasing tissue-detector separation.
Apart from the normal conic model’s underestimation of contact detection, its
prediction rapidly converges on the simulation data. A comparison of both the
normal and uniform conic model predictions against the simulation data is depicted
in Figure 5.48. The data were collected with an injection point at (0, 0, 0), and a
detector area centred at (15, 15, z) with radius 10 mm. The performance of the two
models can be compared over three regions distinct regions. For close proximity,
say 5 mm to 20 mm, the normal model provides the most accurate prediction.
Between approximately 20 mm and 100 mm the two provide comparable
151

Instrument Description and Performance
predictions and both are close to the simulation data. For distances greater than
100 mm the uniform model provides the most accurate prediction while the normal
model begins to overestimate the number of detectable photons. The steps visible in
the normal model prediction at large tissue-detector separations result from the
numerical integration of the probability density function, producing discrete
samples of the cumulative distribution function.
Figure 5.48 Predictions by uniform and normal conic models, and Monte Carlo simulation data, depicting decreasing number of detectable photons with increasing tissue-detector separation.
The performance of both models can be improved upon by replacing the
normal distribution with the actual cumulative distribution of the simulation data,
which is depicted as the broken line in Figure 5.46.
152

Instrument Description and Performance
Rather than pursue further refinement of these models, at this point it is
prudent instead to note that knowledge of the backscattered photon trajectories is
paramount to the accuracy of any model—as highlighted by the application of the
actual cumulative distribution curve to the conic model. While the three-layer tissue
model employed here broadly replicates the absorptive and scattering characteris-
tics of tissue, the model lacks the intricate fine structure of real tissue, such as the
vascular bed, parenchymal and fascial tissue, hair, as well as an uneven tissue
surface. The distribution likely varies with time to some degree, as the pulsing
blood causes constant rotation of the scattering erythrocytes and mechanical
displacement of the surrounding tissue.
As a final point about the achievable separation of tissue and detector, it
should be noted that the probabilistic geometric models described here, and the
simulation data against which the models are compared, describe the decrease in the
detectable number of desired photons—that is the number of photons that emanated
from a particular region of interest on the tissue surface. For a circular region of
interest, there exists an annular region of surrounding tissue, from which unwanted
photons emerge. The number of unwanted photons striking the detector will
increase (from zero under contact conditions) as the detector is retracted from the
tissue surface. Where those photons have travelled a similar path to those emanating
from the region of interest, they may be a serendipitous boon, adding to the signal
level. In most instances however those photons will likely add only to the noise
level, and in some instances (as was described in Section 5.5.2) the unwanted
photons may contain an inverted signal that interferes destructively with the desired
signal and simultaneously adds to the noise level.
5.7 CHAPTER SUMMARY AND DISCUSSION
This chapter has presented a study of a remote non-contact camera-based device,
capable of simultaneously capturing two PPG signals at different wavelengths in a
multiplexed fashion. These PPG signals have been shown to be comparable to a
finger PPG signal captured simultaneously by a conventional contact device, both in
the characteristics of the waveform and as an indicator of peripheral arterial pulse
rate. In so doing, the prerequisite for non-contact camera based pulse oximetry has
been met and two of the three core functions performed by a clinical pulse oximeter
have been replicated: display of a plethysmogram and measurement of the pulse
rate.
153

Instrument Description and Performance
The determination of arterial oxygen saturation by the technique of pulse
oximetry requires calibration of the device either in vivo (which requires a clinical
setting as described in Section 3.3.5.1) or in vitro (which requires obtaining and
artificially oxygenating whole blood as was described in Section 3.3.5.2); both are
beyond the purview of this research. This chapter has instead focused on identifying
aspects of pulse oximetry (and indeed photoplethysmography) that are unique to a
camera-based implementation. Principally the effect of camera-based integrative
sampling, as opposed to a conventional sample-and-hold method, has been
highlighted. In summary both analysis and simulation suggest that integrative
sampling combined with low frame rates will cause a small (but potentially
significant) error in the calculation of the ratio of ratios variable (ROS) that is a
function of both pulse rate and arterial oxygen saturation.
The ultimate solution to integrative sampling error is higher frame rates, since
the integrative sample value will converge towards the sample-and-hold value as
the integration time becomes shorter. It may be possible to account for integrative
sampling error during the calibration phase: pulse oximeters currently store
calibration curves (which transform ROS values to SpO2) pertaining to all combi-
nations of LED wavelengths used in the probes to which the device may be
connected; it is conceivable that this could be extended to encompass several pulse
rate regions and in so doing account for integrative error.
The effects of camera-based sampling deserve further investigation. The pulse
rate exhibits a continuous and natural variability and the camera’s sampling
instances are not phase locked with the pulse waveform. It may be possible to apply
time-domain system identification techniques to correct the problem prior to the
calculation of SpO2.
A nuance of camera-based photoplethysmography discussed in Section 5.5.2,
which hints at the potential utility of a camera-based device beyond that of non-
contact pulse oximetry, is the detection of inverted PPG signals. This phenomenon
highlights the sensitivity of a camera-based device to regional variations in the PPG
signal. Blažek et al. (2000), Hülsbusch and Blažek (2002) and Wieringa et al.
(2005) highlighted the investigative potential of a device capable of spatially
mapping variations in the PPG signal. An important caveat about a camera-based
device’s ability to perform this task should be stated: a signal observed to be
emanating from a point on the tissue surface bears little if any information about the
point from which it is emerging; rather, the signal principally contains information
pertaining to the region of tissue the light has traversed between the point of entry
154

Instrument Description and Performance
into the tissue and the point from which it is observed leaving the tissue. The use of
a continuous-wave diffuse illumination scheme (Hülsbusch and Blažek employed a
ring of LEDs designed to give even diffuse lighting), annular illumination scheme
(as employed by Wieringa et al.), or, to a lesser degree, a large spot (as employed in
this study), precludes knowledge of the optical path, making it difficult to attribute a
particular PPG signal (which is likely due to the superposition of several paths) to a
specific region of tissue.
The choice of illumination scheme has ramifications for pulse oximetry as
well. Section 3.2.1 described a number of simplifying assumptions upon which
pulse oximetry is based, which free it from the constraints that apply to other forms
of Beer-Lambert based oximetry. Specifically the wavelength dependent optical
path length and differential path length factor are eliminated from the calculations
of oxygen saturation by making two assumptions: first it is assumed that both
wavelengths encounter a similar amount of scattering and second it is assumed that
the geometrical separation of the source and detector are the same for both
wavelengths. Collectively these assumptions imply that both wavelengths of light
have travelled a similar path between the source and detector. This assumption is
likely invalid for any source that does not closely resemble a point source. Where
multiple possible optical paths exist simultaneously between an uncontrolled source
and the detector point, the detected light must be considered to be due to the
superposition of all potential paths. In the case of an annular illumination scheme
illuminating an area of tissue surrounding the imaged region, the detected light at
the centre of the image would likely have traversed a volume of tissue similar in
shape to an inverted umbrella—completely undermining the assumption of similar
paths. The next chapter elaborates on this point to describe how a camera used in
conjunction with a controllable light source might be employed as a tomographic
imager yielding 3D images vascular anatomy.
It is however the contention of this thesis that despite the added complication
and complexity of a camera-based implementation, neither integrative sampling nor
restrictions on the illumination scheme preclude the achievement of full pulse
oximeter functionality by non-contact means.
Lastly this chapter has presented an illustrative analysis of the effect of tissue-
camera separation on the number of detectable photons compared to the number
detectable under contact conditions. A conic model of the detectable number of
photons as a function of the distribution of the photons’ trajectories, the distance
from the tissue, and the lens radius, has been developed, which in the least is
155

Instrument Description and Performance
instructive in providing an intuitive understanding of the effects of increasing
separation and in predicting the characteristics of regions of non-contact operation.
156

CHAPTER 6 A CONCEPT FOR NON-CONTACT CAMERA-BASED BACKSCATTER TOMOGRAPHY
Equation Chapter 6 Section 1
The principal subject of this thesis thus far has been the rigorous design,
development, and analysis of camera-based non-contact pulse oximetry and
photoplethysmography. In this, the penultimate chapter, both the subject and tone of
the thesis change somewhat. During the course of this work a number of camera-
based biomedical instruments of novel quality were conceived that might yet spawn
future research. This chapter contains an extended (though cursory) description of
one such concept that is of singular novelty and which exemplifies the potential of
camera-based techniques in biomedical investigations. To that end this chapter
describes a novel concept for a non-contact diffuse reflection tomographic imaging
device, comprised of a controlled light source and a single camera. Such a device
could be an independent investigative tool, capable of imaging and mapping tissue
morphology close to the body surface, providing complementary information to
haemodynamic measurements and profusion mapping (provided by a camera-based
pulse oximeter) or particularly tissue oxygenation mapping measurements
(provided by camera-based tissue oxygenation monitoring). Such a device could
also conceivably be amalgamated into an NIR non-contact pulse oximeter or non-
contact vital signs monitoring device.
157

A Concept for Camera-Based Tomography
The objective of this chapter is to describe the concept of camera-based
tomography rather than to establish the feasibility. Some commentary is provided
on potentially suitable apparatus and on foreseeable issues that will be associated
with any embodiment of the device. However in the interests of brevity this chapter
is limited to a description of the concept followed by a presentation of results from
a simplified simulation utilising qualitative data. Only superficial reference is made
here to technique’s mathematical basis and to the area of tomography.
Two examples of camera-based non-contact surface-vascular imaging systems
have been developed, the first by Zeman et al. (2004) and the second by Wieringa et
al. (2006). The system developed by Zeman et al., which is comprised of a CCD
camera and infrared LED ring light source, is intended to provide vein contrast
enhancement for phlebotomists in clinical environments. The system captures an
NIR image of a region of tissue and then projects an enhanced visible image back
onto the same region of tissue, enhancing the contrast of the veins. The system
displays the 2D location of vasculature but no depth information. The system
developed by Wieringa et al. is stereoscopic, comprised of two CMOS cameras and
an LED array providing both visible and NIR (920 nm) light. By combining the
multi-spectral stereoscopic images, the system is capable of selectively enhancing
superficial blood vessels, and by virtue of its stereoscopic operation, can perceive
the depth of the imaged vasculature. Wieringa et al. list the potential clinical
applications of such a device: blood withdrawal; vein inspection in dark skin; vein
detection through iodine; varicose vein inspection; and nevi pigmentosum
inspection.
Chapter 5 highlighted the importance of knowledge of the likely path light has
taken through tissue in interpreting the received light intensity as observed at a point
on the tissue surface. As an alternative to the stereoscopic system (utilising an
uncontrolled light source) developed by Wieringa et al. (2006), it may be possible to
construct a device comprising a single camera and a controllable light source that is
capable of 3D imaging of the vasculature close to the tissue surface, by utilising
diffuse reflection-based—or more correctly backscatter-based—optical tomogra-
phy.
Tomography refers to imaging by sections and the most common form is X-
ray computed tomography, which is used in many applications to form 3D images
of the interior structure of an object. X-rays travel in straight lines through tissue
though they are absorbed by dense structures. Computed tomography imagers
simultaneously transmit multiple X-ray beams trough tissue, the beams strike a
158

A Concept for Camera-Based Tomography
detector that measures the spatial variation in absorption. The source and detector
are then rotated relative to the imaged object and another set of measurements
made. This process results in a large volume of data to which a reconstruction
algorithm is applied, resulting in an image of the interior structure of the imaged
object. Two common geometries of computed tomography systems are depicted in
Figure 6.1, parallel X-rays incident on a flat detector (the original implementation),
and a fan beam emanating from a point source and incident on a curved detector.
Atte
nuat
ion
Atte
nuat
ion
Curved detector
Point sourceSource
Detector
Figure 6.1 Two common source and detector geometries used in X-ray computed tomography.
Optical and NIR light is strongly diffused in tissue and transmission imaging as
depicted for X-rays in Figure 6.1 is not generally possible in diffuse optical
tomography. Instead the curved path of optical radiation in tissue must be taken into
account. In such a system the transmission schemes depicted in Figure 6.1 can be
replaced by a geometry as depicted in Figure 6.2.
Detector
Point source
Figure 6.2 Depiction of geometry used in diffuse optical tomography.
The most prevalent biomedical imaging application of diffuse optical
tomography is mammography and breast-cancer detection. Though the diffusion of
light in tissue makes it difficult to obtain clear optical images of the inside of
159

A Concept for Camera-Based Tomography
biological tissue, the anticipated safety benefits of optical tomography alone
(compared to existing X-ray mammography) have spurred research in the area. A
comprehensive description of a representative device, its principles, and its
capabilities can be found in Colak et al. (1999).
The geometry of the breast necessitates a similar detector geometry, and to
that end the system described by Colak et al. (1999) utilises a cup, the walls of
which are lined with photodiode detectors. Most of the body surface is however
comparatively flat (when viewed in small areas), in this respect a camera may serve
as a suitable detector, allowing diffuse optical tomographic reconstruction methods
to be employed to form 3D reconstructions of shallow tissue morphology from a
2D camera derived image and multiple purposefully positioned point light sources.
The idea is illustrated in Figure 6.3 where the camera images the surface of the
tissue and measures the emergent light intensity in response to a point source.
Controllable point source
Tissue surface
Figure 6.3 Depiction of camera-based tomography concept.
Unlike X-ray tomography where the source and detector are rotated relative to
the object, here it is proposed that the camera remain fixed on an area of tissue
while the light source is moved across the tissue surface, with each source position
generating a different path to each region of the frame. Each region of the frame
effectively constitutes a separate detector position and by collating the detected
absorption due to many source and detector positions it is proposed to reconstruct a
tomographic image of the underlying tissue.
6.1 DESCRIPTION OF CONCEPT
Consider a point source of light perpendicularly incident on the flat surface of a
homogenous scattering and absorbing medium. Light from the source enters the
medium and is scattered in all directions. Some of the light, having travelled a
distance through the medium, is backscattered and detected by the camera, which is
observing this region of the medium’s surface. Further portions of the incident light
160

A Concept for Camera-Based Tomography
are backscattered from an unobserved area of the surface and a further portion
continues to propagate in the medium until it has been absorbed. (The medium is
considered infinitely deep and to extend infinitely in the horizontal plane.
Furthermore it is assumed that no reflection occurs at the medium’s surface.) For a
given source position, light detected at a certain position on the medium’s surface
can be considered most likely to have travelled along a curved path between the
source and detector points (refer to the Monte Carlo simulations of such a medium
described in Section 2.3.3). The optical characteristics of the medium define the
shape of the optical path, while the optical characteristics of the medium in
conjunction with the source and detector separation determine the depth of the path.
This concept is illustrated graphically in Figure 6.4, in which the most likely paths
between five source and detector positions (annotated A – E) are depicted as lines.
To illustrate the concept the lines have been arbitrarily chosen as ellipses, defined
by a major axis between the source and detector positions and a lower semi-minor
axis equal to one third of the major axis’ length. Figure 6.4 represents a 2D cross-
section of the medium, with the top line representing the medium’s surface.
0 5 10 15 20 250
5
10
Columns
Row
s
A B C D E
Figure 6.4 Depiction of the most likely paths between five source and detector positions.
Imposed on Figure 6.4 are rectangular voxels used to granularly identify
regions of the medium through which the light propagates.
If there are n mutually exclusive source and detector positions (columns of
voxels), then the number of possible source and detector groups, choosing one
source and detector position at a time, is given by the number of two-element
permutations of n. Assuming that light is subject to the same attenuation travelling
along the path between A and B, as between B and A, the number of unique source
and detector groups is given by the number of two-element combinations of n,
161

A Concept for Camera-Based Tomography
!
Number of unique paths2! ( 2)!
nn
=−
. (6.1)
The detector locations that form a unique path given a specified source
location are enumerated in Table 6.1.
Source position Detector positions
A B C D E B - C D E C - - D E D - - - E
Table 6.1 Unique source and detector positions from available permuta-tions in Figure 6.4.
It is now suggested that the absorption attributable to each voxel along an
elliptical path (or a projection in the parlance of tomography) might be determined
by the application of existing tomographic algorithms, such that an image of the
absorbing structure of the medium can be formed.
With reference to Figure 6.4 it can be seen that many voxels are poorly
interrogated by projections, becoming increasingly ill determined with increasing
depth, and several are not interrogated at all. This clearly limits the technique to
imaging shallow features perhaps the first 2 cm – 3 cm of tissue. While the
dependence on backscattered light limits the technique to surface features, it is
within the realm targeted by the devices of Zeman et al. (2004) and Wieringa et al.
(2006). However within this depth constraint, increasing the number of source and
detector positions—that is narrowing the voxels—greatly increases the determin-
ability of shallow voxels. Figure 6.5 depicts the same area as Figure 6.4 now
interrogated by three hundred unique projections resulting from twenty-five
columns of voxels.
162

A Concept for Camera-Based Tomography
0 5 10 15 20 250
5
10
Columns
Row
s
Figure 6.5 Depiction of elliptical projections for twenty-five source and detector points (yielding three hundred unique projections).
The next section describes the application of an existing tomographic recon-
struction algorithm to data obtained from a 2D phantom by simplified forward
modelling.
6.2 FORWARD MODELLING AND RECONSTRUCTION
To provide a qualitative indication of the degree of reconstruction that can be
attained by elliptical projections, a simulation is described here that applies an
algebraic reconstruction algorithm to a set of test data obtained from a simplified
forward model of elliptical propagation through a 2D phantom.
6.2.1 FORWARD MODEL
A simplified 2D phantom was constructed as a monochrome raster graphic
consisting of several discrete absorbing regions embedded in an otherwise non-
absorbing medium. The pattern used is depicted in Figure 6.6. The phantom itself
has no inherent scattering properties; rather the projection paths are predetermined
as a function of the source and detector separation, again they are arbitrarily chosen
as ellipses with a semi-minor axis to major axis ratio of 1:3.
163

A Concept for Camera-Based Tomography
Pixels
Pix
els
50 100 150 200
−20
0
20
40
60
80
100
Figure 6.6 2D phantom showing absorbing regions (white) in a non-absorbing medium (black).
Prior to projection the 2D phantom is converted to a voxel format, with each
voxel consisting of one or more pixels. Where a voxel consists of several pixels the
binary absorbency of that voxel is determined by the fraction of absorptive pixels
that it contains, with the absorbency of the voxel being set to one if half or more of
its constituent pixels are absorbing. Figure 6.7 depicts the voxel representation of
the phantom depicted in Figure 6.6; each voxel in Figure 6.7 has dimensions four
horizontal and four vertical pixels that span the entire width of the 2D phantom.
Thus the phantom is divided into fifty columns (and twenty rows) of voxels that
generate 1225 projections.
164

A Concept for Camera-Based Tomography
Pixels
Pix
els
50 100 150 200
−20
0
20
40
60
80
100
Figure 6.7 Conversion of original image so that twenty rows and fifty columns of voxels, rather than pixels, describe the absorption.
A projection is made from each source position (columns 1 to 49) to each
detector position (columns 2 to 50) with an initial weight of one. Each time a
projection passes through an absorbing voxel it looses half its weight (an arbitrarily
chosen absorption). The source is then moved to the next position and the process is
repeated noting the received weight for each source and detector position. In this
way a matrix is constructed of the form depicted in Table 6.1 in which each row
corresponds to a source position and each column to a detector position. This matrix
represents a description of the absorptive characteristics of the medium as observed
by elliptical projections through the medium.
It is now sought to evaluate the efficacy of the elliptical projection by applying
a reconstruction algorithm to the matrix of absorption values.
6.2.2 ALGEBRAIC RECONSTRUCTION
Various tomographic techniques exist for reconstructing a model (both 2D and 3D)
of tissue based on the observed attenuation of radiation. In general these methods
can be categorised as being direct (including filtered back projections and Fourier
reconstruction) or iterative. An iterative method of reconstruction is employed here
based on an algebraic reconstruction technique (ART) (Brooks and Di Chiro 1976;
Herman 1980).
165

A Concept for Camera-Based Tomography
The reconstruction algorithm begins by taking a conservatively small fraction
of the absorption observed along one projection (obtained by forward modelling)
and assigning that fraction to each voxel along that projection. This is repeated for
each projection. Some voxels will be traversed by multiple projections and will thus
accumulate a fraction of the observable absorption from each of those projections.
This represents an initial guess at the voxel absorption coefficients and constitutes
the first iteration.
On subsequent iterations the expected amount of absorption for a particular
source and detector combination is calculated using the current absorption
coefficients of the voxels that lie along that projection. A small fraction of the
difference between the expected and observed absorption for that projection (which
can be positive or negative) is now added to the voxel coefficients along that
projection. The process is repeated for many iterations (typically several hundred).
While many voxels are erroneously attributed a small level of absorption, over
many iterations bright spots emerge at the intersection of projections that
experienced absorption.
Figure 6.8 displays a reconstruction of the phantom depicted in Figure 6.7.
The reconstruction can be seen to display each of the components of the phantom
though they appear smeared. The deeper regions of the phantom are less well
determined since fewer projections traverse these regions.
Pixels
Pix
els
50 100 150 200
−20
0
20
40
60
80
100
Figure 6.8 ART reconstruction based on elliptical line projections.
166

A Concept for Camera-Based Tomography
The algorithm employed here inherently gives rise to false positives—that is
many voxels are falsely attributed an absorption because of absorptive regions that
lie elsewhere along a projection. However since a projection cannot traverse an
absorbing region without suffering some absorption, the image can be improved by
zeroing all voxels along projections that registered no absorption—effectively
discounting reports of absorption where there exists evidence to the contrary.
Figure 6.9 displays the effect on the reconstruction of zeroing the identifiable false
positives.
Pixels
Pix
els
50 100 150 200
−20
0
20
40
60
80
100
Figure 6.9 Reconstruction by elliptical line projection after zeroing of false positives.
The reconstructions depicted in Figure 6.8 and Figure 6.9 are the result of
projections along elliptical lines—a gross simplification of the distribution of light
in tissue. A more realistic approach is to assume that the projections form elliptical
beams. To test the efficacy of reconstruction under this condition the forward
modelling was repeated replacing the elliptical lines with beams. Each beam is
formed of several elliptical paths, again with a major axis defined between the
current source and detector position, however the semi-minor axis is now chosen to
be one third of the major axis plus a small normally distributed random number
with a magnitude proportional to the current length of the major axis. For each
constituent elliptical line in the beam, a small amount of noise (proportional to the
length of the major axis) is added to the y-coordinate of each point. The resulting
beams are depicted in Figure 6.10 for five columns of voxels (for clarity only the
167

A Concept for Camera-Based Tomography
projections corresponding to the first source position are illustrated). This mimics
crudely the migration of photons between source and detector that is known from
photon modelling studies.
0 5 10 15 20 250
2
4
6
8
10
Columns
Row
s
A B C D E
Pixels
Pix
els
50 100 150 200
−20
0
20
40
60
80
100
Figure 6.10 Elliptical beam projections corresponding to source position A.
The reconstruction that results from elliptical beam projections is depicted in
Figure 6.11. The reconstruction can be seen to incorporate the large features of the
2D phantom, though the small detail is less well defined and the lower voxels are
under determined compared to both the phantom and the reconstruction based on
elliptical line projections.
Figure 6.11 ART reconstruction based on elliptical beam projections.
168

A Concept for Camera-Based Tomography
False positives can again be identified and zeroed, which produces the
reconstruction depicted in Figure 6.12.
Pixels
Pix
els
50 100 150 200
−20
0
20
40
60
80
100
Figure 6.12 Reconstruction by elliptical beam projection after zeroing of false positives.
6.3 DISCUSSION
The description that is provided here is deliberately succinct and is intended firstly
to illustrate the concept, and secondly to illustrate the level of reconstruction that
might be achieved in ideal circumstances (with elliptical line projections) and under
more realistic circumstances (elliptical beam projections). That an ART algorithm
(intended for rectilinear X-ray projection) is suited to this form of projection is not
at all obvious and no attempt is made here to identify or develop an optimal recon-
struction algorithm.
The reconstructions based on elliptical beam projections, depicted in
Figure 6.11 and Figure 6.12, represent a realistic approximation of the path of light
in tissue, however the model inherently encompasses several important simplifica-
tions. The model assumes a point source of light and a point detector. In practice the
light source would likely be a laser beam with a small elliptical cross-section. As
was discussed in Section 2.3.3 in relation to Monte Carlo simulations, distribution
of the photon paths in tissue resulting from a beam source is obtained by
169

A Concept for Camera-Based Tomography
convolving the distribution due to a point source with the shape of the beam. This
would enlarge the projections. A further complication is the detector, which will not
be a single point. In the case of a camera the detector will be defined as either a
single rectangular pixel, a rectangular group of pixels, or a pixel approximation of
an elliptical (including circular) detector region—adding further to the three
dimensional broadening of the projection.
Nonetheless a device based on this concept could be constructed from a
Galvo-scanner (capable of projecting laser spot on a specified location or in a
specified pattern) and camera. The requirements of the camera would differ
markedly from those of a camera intended for pulse oximetry and photoplethys-
mography, sensitivity (SNR and dynamic range) being paramount and frame rate
being comparatively unimportant.
170

CHAPTER 7 DISCUSSION AND FUTURE WORK
Equation Chapter 7 Section 1
7.1 A SYNOPSIS OF THE CONTRIBUTIONS OF THIS THESIS
This thesis has investigated the feasibility of non-contact remote camera-based
pulse oximetry. To that end this research has produced the first report of the
simultaneous detection of two PPG signals at different wavelengths by a non-contact
camera-based technique. The method and apparatus used have been shown to be
applicable to a range of test subjects under realistic lighting and environmental
conditions.
While other researchers have investigated camera-based photoplethysmog-
raphy, both previously and contemporarily, those that have sought to extend
camera-based photoplethysmography to pulse oximetry have made two crucial
assumptions: firstly that the separate capture of PPG signals at multiple wavelengths
is readily extendable to simultaneous multiplexed capture; and secondly that
camera-based PPG signals are applicable to the technique of pulse oximetry. These
two assumptions are important in demarcating this thesis from contemporary
research by others. Having demonstrated simultaneous dual wavelength photo-
plethysmography, this thesis has subsequently scrutinised the assumption that the
171

Discussion and Further Work
resulting PPG signals are either directly or inherently applicable to the method of
pulse oximetry.
This thesis has investigated and demonstrated the comparability of a camera-
based device with a conventional contact device, as a means of obtaining a detailed
plethysmogram and as a means of measuring pulse rate. As a means of determining
arterial oxygen saturation by the method of pulse oximetry, this thesis has
highlighted the susceptibility of camera-based devices to two detrimental pheno-
mena that are precluded in contact devices. The first is the combined effect of low
frame rates and integrative sampling, which collectively distort the camera-derived
PPGs and introduce error into the ratio calculations from which arterial saturation is
derived. The second phenomenon is the proclivity (or perhaps ability) of camera-
based systems, when used in conjunction with an uncontrolled light source, to
detect PPG signals that pertain to unwanted, different, or multiple volumes of tissue,
which violates an enabling assumption of pulse oximetry—that the two detected
wavelengths of light have traversed the same path.
A secondary and perhaps less tangible contribution of this thesis is in
delineating the capabilities that camera-based SpO2 monitoring can attain as an
instance of pulse oximetry—estimate SpO2, measure pulse rate and display a PPG—
but not provide a spatial map of arterial oxygen saturation, which should not exhibit
a spatial variance. In circumstances where a camera-based device may indicate a
spatial variance in the estimated value of SpO2 (that is greater than the precision of
the device), it is hoped that the discussion throughout this thesis has highlighted the
danger in attributing that variation to an actual change in the saturation of the
passing arterial blood, rather than to any of the multifarious factors that may distort
the locally observed PPG signals from which the saturation values have been
derived. Where a camera-based device may possess additional utility, beyond that
which may come from non-contact pulse oximetry, it is likely in its ability to
observe spatial variation in PPG signals (with the caveat that the light source is
controllable), of which more is said in the next section.
Lastly this thesis describes a concept for a camera-based tomography system
comprised of a single camera and a controllable point source such as a Galvo-
scanner and laser. Such a device represents a departure from camera-based
haemodynamic investigations and is presented as an alternative to stereoscopic
methods of imaging shallow features in tissue. While such a system would not
necessarily share requirements with a camera-based pulse oximetry device it is an
172

Discussion and Further Work
indicator to the potential of camera-based NIR investigations of tissue as both a
probe of blood and tissue chemistry as well as structure.
7.2 FUTURE WORK
In investigating the feasibility and practicalities of non-contact pulse oximetry, this
research has identified both further unforeseen impediments as well as new
potential. The objectives of future work should encompass both further research and
new development and adaptation of these techniques to real-time operation.
7.2.1 FURTHER RESEARCH INTO CAMERA-BASED PULSE OXIMETRY
The inherent distortion of PPG signals resulting from camera-based capture was
highlighted in Section 5.4.4, where simulation results were described that showed
an error caused by the camera’s integrative sampling and low frame rates. The
simulation pertained to the ratio of ratios method of calculating ROS, however it is
worth investigating the susceptibility of the alternative derivative based methods of
calculating ROS, or indeed investigating if a method of calculating ROS can be
developed that is insensitive to PPG distortion by integrative sampling.
Since integrative sampling is inherent to all camera-based observations of
time-varying signals, a worthwhile alternative or parallel approach would be the
development of techniques to correct or mitigate the effects of integrative sampling.
Time-domain system identification techniques may be applicable.
7.2.2 INVESTIGATION OF CAMERA-DERIVED PPG SIGNALS
Section 3.4.3 listed some of the applications to which conventional pulse oximeter
devices have been put since becoming commonplace in clinical and surgical
environments. Many of those applications utilise the ability of a pulse oximeter
device to non-invasively measure profusion and spatial variations in profusion
through the PPG waveform—applications that have been made possible by the
development of reflectance probes and specialised application specific probes.
Camera-based photoplethysmography has a great deal of potential in this regard as
an investigative tool.
173

Discussion and Further Work
A further point that should be made is that a PPG signal is comprised of several
components including the pulse, respiration, and Mayer waves. Pulse oximetry is
concerned only with the pulse component though other clinical and experimental
applications may be equally interested in the remaining components. The spectral
power method of locating PPG signals in a video described in Section 5.3.3 is
equally applicable to searching a video for respiration or Mayer waves. Indeed with
reference to Figure 5.15 a signal that is rejected by the spectral power figure of
merit as not containing a strong pulse may still contain a significant respiration or
Mayer wave component.
Whichever the desired PPG component, it should be noted that the video will
contain multiple instances of the signal from different areas of tissue. Where the
objective is merely to monitor that signal (rather than to attribute significance to its
spatial variance), a camera-based technique may offer the potential for high SNR by
incorporating the signal from multiple detection sites in the frame.
The richness of a camera signal makes the notion of a non-contact vital signs
monitoring device seem plausible. A device might be envisioned capable of non-
contact measurement of pulse rate, SpO2, respiration, and display of the peripheral
arterial pressure waveform.
7.2.3 DEVELOPMENT OF A CLINICALLY USEFUL DEVICE
Perhaps the most significant step towards a clinically useful device is the
development of real-time operating capabilities. A practical device would likely
require dedicated hardware and software, providing the functionality described in
this thesis as well as a suitable user interface and mechanism for maintaining the
desired region of tissue in frame and under illumination.
CMOS is likely the camera technology of choice particularly because of its ability
to produce variable frame sizes and consequently varying frame rates. One can
envision a system that produces large frame sizes (and low frame rates) during a
signal acquisition period or during periods of subject movement, keeping a large
area of tissue in view, and smaller frame sizes (at increased frame rates) during
stable monitoring.
Real-time operation would also require the development of significant
ancillary functionality, for example motion artefact reduction or compensation.
Efficient means of identifying regions of interest within the frame that contain a
174

Discussion and Further Work
pulse signal—or a respiration or Mayer wave if they are the sought signals—need
to be developed.
A real-time device will require the development of efficient and robust image
analysis and image and signal processing techniques.
The second major step in the development of a clinical device is calibration.
Though the effects of integrative sampling and low frame rates have yet to be
quantified, assuming they can be mitigated, a non-contact device should be suited to
a similar in vivo calibration procedure as is currently used with conventional
devices (see Section 3.3.5). If the pulse rate and saturation dependent effects of
integrative sampling cannot be mitigated by either system identification techniques
or a purposefully designed method of calculating ROS, then it may fall to the
calibration procedure to remove pulse rate and saturation dependent error due to
integrative sampling.
7.2.4 INVESTIGATION OF SINGLE CAMERA-BASED TOMOGRAPHY
Camera-based backscatter tomography utilising one camera and a controlled light
source is a departure from non-contact pulse oximetry and photoplethysmography.
Such a system would likely achieve greater synergy with NIR tissue oxygenation
measurement or as part of a multi-modality tissue morphology imaging system. The
development of such a device would incorporate a large scope including instrum-
entation and optics design, image processing, image analysis, and reconstruction
algorithm development.
7.3 CONCLUDING REMARKS
Camera-based non-contact pulse oximetry will not replace conventional devices in
routine bedside monitoring applications or ambulatory monitoring. Its most likely
field of initial application is as an investigative tool in research, in specialised
applications and environments, or in conjunction with other modalities such as MRI.
Obstacles remain to developing a clinically useful device. Other researchers
investigating camera-based photoplethysmography have pointed to camera
limitations including low SNR and dynamic range, as well as motion artefacts and
ambient light interference as current obstacles. While any system would doubtlessly
benefit from a camera with improved SNR and dynamic range, simultaneous dual
175

Discussion and Further Work
wavelength PPG capture has been demonstrated as being achievable with currently
available technology. Cameras capable of producing comparable or better SNR
performance at higher frame rates will be beneficial. Motion artefacts will certainly
be an issue in the future and may be a significant constraint on the applications to
which a camera device may be put. Further investigation is needed on a wide range
of subjects to quantify the effects of physical variation among subjects such as fat
and skin pigmentation and to identify regions of the body from which signals can be
reliably obtained.
Despite impediments to developing clinically useful devices the allure of non-
contact pulse oximetry and photoplethysmography is strong. Collectively they
represent a step towards video based vital signs monitoring and video based
biometrics in general.
176

APPENDIX A PUBLICATIONS ARISING FROM THIS WORK This appendix contains a list of peer-reviewed publications that arose from this
work. Papers pertaining to camera-based pulse oximetry and camera-based photo-
plethysmography are additionally cited, in context, in the body of this thesis and as
such appear in the list of references. The full reference of each paper is reproduced
here along with its published abstract as a guide to its contents.
The list is preceded by a reference to an article on medical applications of
Terahertz. Though the body of this thesis reports exclusively on a near infrared
investigation of pulse oximetry and photoplethysmography, this work originally
began as a search for a medical application of Terahertz imaging. Terahertz refers to
a band of the electromagnetic spectrum stretching from the upper microwave
frequencies, through the far infrared, and into the mid infrared—encompassing
wavelengths from approximately 3 mm to 10 µm. Terahertz radiation is apt to
monitoring the moisture content of tissue and has been demonstrated to be capable
of discerning cancerous tissue from tissue that is healthy, and also from tissue that is
inflamed but otherwise normal. A dual modality imaging system was sought
(utilising Terahertz and near infrared) to develop a means of objectively assessing
and monitoring the progression and condition of pressure ulcers, which can result
from sustained pressure and shearing force on tissue as may occur in people who
are immobile. It was envisaged that Terahertz would provide structural information
about a region of tissue while near infrared imaging would provide information
about tissue dynamics such as perfusion, oxygenation, and hydration.
177

Appendix A
Humphreys K., J. Loughran, M. Gradziel, W. Lanigan, T. Ward, J.A. Murphy
and C. O'Sullivan, Medical applications of terahertz imaging: a review of
current technology and potential applications in biomedical engineering, In
proceedings of the IEEE Engineering in Medicine and Biology Society
Conference, 2004.
Terahertz (THz) imaging is in its early stages of development but already the potential clinical impact of this new imaging modality is clear. From cancer research to DNA analysis THz technology is improving or even making possible imaging of hitherto inaccessible phenomena. In this paper we present a short review of THz imaging from the point of view of biomedical engineering. We discuss the current state of the art in terms of THz imaging systems; describe current applications, future potential and our own approaches to harnessing this novel technology. We draw attention to open problems in the area with respect to the limitations of the technology before concluding with descriptions of our future work in the area.
Humphreys K., C. Markham and T. Ward, A CMOS camera-based system
for clinical photoplethysmographic applications, In proceedings of SPIE,
5823, 88-95, 2005.
In this work an-image based photoplethysmography (PPG) system is developed and tested against a conventional finger-based system as commonly used in clinical practise. A PPG is essentially an optical instrument consisting of a near infrared (NIR) source and detector that is capable of tracking blood flow changes in body tissue. When used with a number of wavelengths in the NIR band blood oxygenation changes as well as other blood chemical signatures can be ascertained yielding a very useful device in the clinical realm. Conventionally such a device requires direct contact with the tissue under investigation which eliminates the possibility of its use for applications like wound management where the tissue oxygenation measurement could be extremely useful. To circumnavigate this shortcoming we have developed a CMOS camera-based system, which can successfully extract the PPG signal without contact with the tissue under investigation. A comparison of our results with conventional techniques has yielded excellent results.
178

Appendix A
Humphreys K., T. Ward and C. Markham, A CMOS camera-based pulse
oximetry imaging system, In proceedings of the IEEE Engineering in
Medicine and Biology Society Conference, 2005.
In this paper a CMOS camera-based system for non-contact pulse oximetry imaging in transmission mode is described. Attention is drawn to the current uses of conventional pulse oximetry and the potential application of pulse oximetry imaging to developing objective wound assessment systems.
Humphreys K., T. Ward and C. Markham, A CMOS camera-based system
for non-contact pulse oximetry imaging, In proceedings of the International
Federation for Medical and Biological Engineering Conference, 11, 2005.
In this paper a non-contact pulse oximetry imaging system is described. The system utilises a CMOS digital camera and near infrared (NIR) light emitting diodes operating in a reflection mode to simultaneously capture photoplethysmograph (PPG) signals at two wavelengths. The Modified Beer-Lambert law is used to extrapolate tissue oxygenation from the PPG signals. Attention is drawn to the system’s potential in applications such as the assessment and management of wounds.
179

Appendix A
Humphreys K., T. Ward and C. Markham, Noncontact simultaneous dual
wavelength photoplethysmography: A further step toward noncontact pulse
oximetry, Review of Scientific Instruments, 78, (4), 2007.
We present a camera-based device capable of capturing two photoplethysmographic (PPG) signals at two different wavelengths simultaneously, in a remote noncontact manner. The system comprises a complementary metal-oxide semiconductor camera and dual wavelength array of light emitting diodes _760 and 880 nm_. By alternately illuminating a region of tissue with each wavelength of light, and detecting the backscattered photons with the camera at a rate of 16 frames/wavelength s, two multiplexed PPG wave forms are simultaneously captured. This process is the basis of pulse oximetry, and we describe how, with the inclusion of a calibration procedure, this system could be used as a noncontact pulse oximeter to measure arterial oxygen saturation (SpO2) remotely. Results from an experiment on ten subjects, exhibiting normal SpO2 readings, that demonstrate the instrument’s ability to capture signals from a range of subjects under realistic lighting and environmental conditions are presented. We compare the signals captured by the noncontact system to a conventional PPG signal captured concurrently from a finger, and show by means of a J. Bland and D. Altman [Lancet 327, 307 (1986); Statistician 32, 307 (1983)] test, the noncontact device to be comparable to a contact device as a monitor of heart rate. We highlight some considerations that should be made when using camera-based “integrative” sampling methods and demonstrate through simulation, the suitability of the captured PPG signals for application of existing pulse oximetry calibration procedures.
180

APPENDIX B FURTHER CHARACTERISTICS OF THE LIGHT EMITTING DIODES As a further indication of the characteristics of the light emitting diodes used in this
study a sample data sheet is included here illustrating the various electrical, thermal
and optical parameters of a typical device.
181

Appendix B
HIGH-POWER GaAlAs IR EMITTERS OD-880F
ANODE(CASE)
.017
.100
CATHODE .036
.041
45°
GLASSDOME
1.00MIN.
.030
.040
.197
.205
.015.209.212
.183
.186.152.154
FEATURES
• High reliability liquid-phase epitaxially grown GaAlAs
• 880nm peak emission for optimum matching withODD-45W photodiode
• Wide range of linear power output
• Hermetically sealed TO-46 package
• Narrow angle for long distance applications
• OD-880F1 selected to meet minimum radiant intensity
All surfaces are gold plated. Dimensions are nominalvalues in inches unless otherwise specified. Windowcaps are welded to the case.
Radiant Intensity, Ie
Peak Emission Wavelength, λP
Spectral Bandwidth at 50%, ∆λHalf Intensity Beam Angle, θForward Voltage, VF
Reverse Breakdown Voltage, VR
Capacitance, C
Rise Time
Fall Time
IF = 50mA
IF = 100mA
IR = 10µA
VR = 0V
120
5
135160
880
80
8
1.55
30
17
0.5
0.5
1.9
mW/sr
nm
nm
Deg
Volts
Volts
pF
µsec
µsec
ELECTRO-OPTICAL CHARACTERISTICS AT 25°CPARAMETERS TEST CONDITIONS MIN TYP MAX UNITS
OD-880FOD-880F1
OD-880FOD-880F1
Total Power Output, PoIF = 100mA
mW15 17
8
Storage and Operating Temperature Range
Maximum Junction Temperature
Thermal Resistance, RTHJA1
Thermal Resistance, RTHJA2
-55°C to 100°C100°C
350°C/W Typical
115°C/W Typical
THERMAL PARAMETERS
1Heat transfer minimized by measuring in still air with minimum heat conducting through leads2Air circulating at a rapid rate to keep case temperature at 25°C
Power Dissipation1
Continuous Forward Current
Peak Forward Current (10µs, 400Hz)2
Reverse Voltage
Lead Soldering Temperature (1/16" from case for 10sec)
190mW
100mA
3A
5V
240°C
ABSOLUTE MAXIMUM RATINGS AT 25°C CASE
1Derate per Thermal Derating Curve above 25°C2Derate linearly above 25°C
750 Mitchell Road, Newbury Park, California 91320Phone: (805) 499-0335 Fax: (805) 499-8108
Email: [email protected] Web Site: www.optodiode.com
Page 1 of 2
182

Appendix B
HIGH-POWER GaAlAs IR EMITTERS OD-880F
DEGRADATION CURVE
FORWARD I-V CHARACTERISTICS
SPECTRAL OUTPUT
POWER OUTPUT vs TEMPERATURE
POWER OUTPUT vs FORWARD CURRENT
RE
LAT
IVE
PO
WE
RO
UT
PU
T(%
)
STRESS TIME, (hrs)101
100F
OR
WA
RD
CU
RR
EN
T,I
F(a
mps
)
FORWARD VOLTAGE, VF (volts)0
4
RE
LAT
IVE
PO
WE
RO
UT
PU
T
AMBIENT TEMPERATURE (°C)–50
1.5
RE
LAT
IVE
PO
WE
RO
UT
PU
T(%
)
WAVELENGTH, λ(nm)750
100
PO
WE
RO
UT
PU
T,P
o(m
W)
FORWARD CURRENT, IF (mA)10
1,000
90
80
70
60
50102 103 104 105
IF = 20mA
IF = 50mA
IF = 100mA
3
2
1
01 2 3 4 5 6
800 850 900 950 1,000
80
60
40
20
0
100
10
1100 1,000 10,000
1.4
1.3
1.2
1.1
1.0
0.9
0.8
0.7
0.6
0.5–25 0 25 50 75 100
TCASE = 25° CNO PRE BURN-IN PERFORMED
THERMAL DERATING CURVE
DUTY CYCLE, D (%)0.01 0.1 1
MAXIMUM PEAK PULSE CURRENT
10 100
PE
AK
FO
RW
AR
DC
UR
RE
NT
,Ip
(am
ps)
0.1
0.01
10
1
AMBIENT TEMPERATURE (°C)25 50 75 100
PO
WE
RD
ISS
IPA
TIO
N(m
W)
180
80
60
40
20
0
200
160
140
120
100
t = 10µs
t = 100µs
t = 500µs
t
T
Ip
D = tT
RE
LAT
IVE
PO
WE
RO
UT
PU
T(%
)
BEAM ANGLE, θ(deg)–25
100
80
60
40
20
0–20 –15 –10 –5 0 5 10 15 20 25
RADIATION PATTERN
NOHEAT SINK
INFINITEHEAT SINK
DC
PULSE10µs, 100Hz
MA
XIM
UM
RA
TIN
GS
TY
PIC
AL
CH
AR
AC
TE
RIS
TIC
S
750 Mitchell Road, Newbury Park, California 91320Phone: (805) 499-0335 Fax: (805) 499-8108
Email: [email protected] Web Site: www.optodiode.com
Page 2 of 2
183

REFERENCES
Altman D. and J. Bland, Measurement in medicine: the analysis of method
comparison studies, The Statistician, 32, 307-317, 1983.
Aoyagi T., Pulse oximetry: Its origin and development, In proceedings of IEEE
Engineering in Medicine and Biology Society Conference, 14, 1992.
Aoyagi T., Pulse oximetry: its invention, theory, and future, Journal of Anesthesia,
17, (4), 259-66, 2003.
Aoyagi T. and K. Miyasaka, Pulse oximetry: its invention, contribution to medicine,
and future tasks, Anesthesia and Analgesia, 94, (1 Suppl), S1-3, 2002.
Arridge S. R., M. Schweiger, M. Hiraoka and D. T. Delpy, A finite element
approach for modeling photon transport in tissue, Medical Physics, 20, (2 Pt 1),
299-309, 1993.
Attas M., M. Hewko, J. Pologe, T. Posthumus, M. Sowa and H. Mantsch,
Visualization of cutaneous hemoglobin oxygenation and skin hydration using near-
infrared spectroscopic imaging, Skin Research and Technology, 7, (4), 238-245,
2001.
Barker S. and K. Tremper, Transcutaneous oxygen tension: a physiological variable
for measuring oxygen tension, Journal of Clinical Monitoring, 1, (2), 130-134,
1984.
Bland J. and D. Altman, Statistical methods for assessing agreement between two
methods of clinical measurement, Lancet, 327, (8476), 307-310, 1986.
184

References
Blazek V., T. Wu and D. Holscher, Near-infrared CCD imaging - possibilities for
noninvasive and contactless 2D mapping of dermal venous hemodynamics,
Proceedings of SPIE, 3923, 2-9, 2000.
Bonner R. F., R. Nossal, S. Havlin and G. H. Weiss, Model for photon migration in
turbid biological media, Journal of the Optical Society of America A, 4, (3), 423-
432, 1987.
Bourgeois B. W. J., Design of Pulse Oximeters, Chapter 5, Ed. J. G. Webster, Taylor
and Francis Group, New York, 1997.
Bozkurt A. and B. Onaral, Safety assessment of near infrared light emitting diodes
for diffuse optical measurements, Biomedical Engineering Online, 3, (9), 2004.
British Standards, BS EN 60825-1, Safety of laser products, 1994.
Brooks R. A. and G. Di Chiro, Principles of computer assisted tomography (CAT)
in radiographic and radioisotopic imaging, Physics in Medicine and Biology, 21,
(5), 689-732, 1976.
Bunn H. F., Hemoglobin: molecular, genetic and clinical aspects, Saunders,
Philadelphia, 1986.
Chan F. C., M. J. Hayes and P. R. Smith, Venous Pulse Oximetry, United Kingdom
Patent: PCT/GB2003/000427, 2003.
Cheung P., K. Gauglitz, S. Hunsaker, S. Prosser, D. Wagner and R. Smith,
Apparatus for the automatic calibration of signal employed in pulse oximetry,
United States Patent: 5259381, 1989a.
Cheung P., K. Gauglitz, L. Mason, S. Prosser, R. Smith, D. Wagner and S.
Hunsaker, Feedback controlled method and apparatus for processing signals used in
oximetry, United States Patent: 4819646, 1989b.
Chung C. and H. M. McNamara, Fetal pulse oximetry aparatus and method of use,
United States Patent: 5005573, 1993.
185

References
Clark S. A., Design of Pulse Oximeters, Chapter 1, Ed. J. G. Webster, Taylor and
Francis Group, New York, 1997.
Clayton D., R. Webb, A. Ralston, D. Duthie and W. Runciman, A comparison of the
performance of 20 pulse oximeters under conditions of poor perfusion, Anaesthesia,
46, (1), 3-10, 1991a.
Clayton D. G., R. K. Webb, A. C. Ralston, D. Duthie and W. B. Runciman, Pulse
oximeter probes. A comparison between finger, nose, ear and forehead probes under
conditions of poor perfusion, Anaesthesia, 46, (4), 260-5, 1991b.
Colak S., M. van der Mark, G. Hooft, J. Hoogenraad, E. van der Linden and F.
Kuijpers, Clinical optical tomography and NIR spectroscopy for breast cancer
detection, IEEE Journal of Selected Topics in Quantum Electronics, 5, (4), 1143-
1158, 1999.
Cope M., The development of a near infrared spectroscopy system and its
application for non invasive monitoring of cereberal blood flow and tissue
oxygenation in the newborn infant, Ph.D. thesis, University College London, 1991.
Coyle S., Near-infrared spectroscopy for brain computer interfacing, Ph.D. thesis,
National University of Ireland, Maynooth, 2005.
Coyle S., T. Ward, C. Markham and G. McDarby, On the suitability of near-infrared
(NIR) systems for next-generation brain-computer interfaces, Physiological
Measurement, 25, (4), 815-822, 2004.
Coyle S., T. Ward, C. Markham, B. Roche, G. McDarby and S. McLoone, The use
of near-infrared spectroscopy in measuring general autonomic arousal, In
proceedings of World Congress on Medical Physics and Biomedical Engineering,
2003.
Curtis H. and N. S. Barnes, Biology, 5th edition, Worth, New York, 1989.
de Kock J., K. Reynolds, L. Tarassenko and J. Moyle, The effect of varying LED
intensity on pulse oximitery accuracy, Journal of Medical Engineering and
Technology, 15, (3), 111-116, 1991.
186

References
de Kock J., L. Tarassenko, C. J. Glynn and A. R. Hill, Reflectance pulse oximetry
measurements from the retinal fundus, IEEE Transactions on Biomedical
Engineering, 40, (8), 817-823, 1993.
Dempsey M. and B. Condon, Thermal injuries associated with MRI, Clinical
Radiology, 56, 457-465, 2001.
DeNobile J., P. Guzzetta and K. Patterson, Pulse oximetry as a means of assessing
bowel viability, Journal of Surgical Research, 48, 21-23, 1990.
Diamond J., Guns, Germs and Steel, Chatto and Windus, London, 1997.
Elwell C., A practical users guide to near infrared spectroscopy, UCL
Reprographics, London, 1995.
Farmer J., Design of Pulse Oximeters, Chapter 3, Ed. J. G. Webster, Taylor and
Francis Group, New York, 1997.
Fazan V. P., C. T. Borges, J. H. Da Silva, A. G. Caetano and O. A. Filho, Superficial
palmar arch: an arterial diameter study, Journal of Anatomy, 204, (4), 307-311,
2004.
Fine I. and A. Wienreb, Multiple scattering effect in transmission oximetry, Medical
and Biological Engineering and Computing, 33, 709-712, 1995.
Fukui Y., Y. Ajichi and E. Okada, Monte Carlo prediction of near-infrared light
propagation in realistic adult and neonatal head models, Applied Optics, 42, (16),
2881-2887, 2003.
Henyey L. G. and J. L. Greenstein, Diffuse radiation in the galaxy, Astrophysical
Journal, 93, 70-83, 1941.
Herman G. T., Image Reconstruction from Projections: The Fundamentals of
Computerized Tomography, Academic Press, 1980.
Hiraoka M., M. Firbank, M. Essenpreist, M. Cope, S. Arridge, P. van der Zee and
D. Deply, A Monte Carlo investigation of optical pathlength in inhomogeneous
187

References
tissue and its applications to near-infrared spectroscopy, Physics in Medicine and
Biology, 38, 1859-1876, 1993.
Horak W., Risk assessment of light emitting diodes, Laser Institute of America, 11,
(1), 21-26, 1999.
Hulsbusch M. and V. Blazek, Contactless mapping of rhythmical phenomena in
tissue perfusion using PPGI, In proceedings of SPIE, 4683, 110-117, 2002.
Humphreys K., C. Markham and T. Ward, A CMOS camera-based system for
clinical photoplethysmographic applications, In proceedings of SPIE, 5823, 88-95,
2005a.
Humphreys K., T. Ward and C. Markham, A CMOS camera-based pulse oximetry
imaging system, In proceedings of IEEE Engineering in Medicine and Biology
Society Conference, 2005b.
Humphreys K., T. Ward and C. Markham, A CMOS camera-based system for non-
contact pulse oximetry imaging, In proceedings of International Federation for
Medical and Biological Engineering Conference, 11, 2005c.
Humphreys K., T. Ward and C. Markham, Noncontact simultaneous dual
wavelength photoplethysmography: A further step toward noncontact pulse
oximetry, Review of Scientific Instruments, 78, (4), 2007.
ICNIRP, Guidelines on limits of exposure to laser radiation of wavelengths between
180 nm and 1,000 microm. International Commission on Non-Ionizing Radiation
Protection, Health Physics, 71, (5), 804-819, 1996.
International Comission on Non-Ionizing Radiation Protection, Guidelines on limits
of exposure to broad-band incoherent optical radiation (0.38 to 3 µm), 1997.
International Comission on Non-Ionizing Radiation Protection, Revision of the
guidelines on limits of exposure to laser radiation between 400 nm and 1.4 µm,
2000.
188

References
Irwin M., M. Thorniley, C. Dore and C. Green, Near infrared spectroscopy: a non-
invasive monitor of the perfusion and oxygenation within the microcirculation of
limbs and flaps, Applied Optics, 48, (1), 14-22, 1995.
Ito Y., R. P. Kennan, E. Watanabe and H. Koizumi, Assessment of heating effects in
skin during continuous wave near infrared spectroscopy, Journal of Biomedical
Optics, 5, (4), 383-390, 2000.
Jobsis-vanderVliet F., Discovery of the near-infrared window into the body and the
early development of near-infrared spectroscopy, Journal of Biomedical Optics, 4,
(4), 392-396, 1999.
Joyce W., K. Walsh, J. Gough, T. Gorey and J. Fitzpatrick, Pulse oximetry: a new
non-invasive assessment of peripheral arterial occulsive disease, British Journal of
Surgery, 77, 115-117, 1990.
Julien C., The enigma of Mayer waves: Facts and models, Cardiovascular
Research, 70, (1), 12-21, 2006.
Kelleher J., Pulse oximetry, Journal of Clinical Monitoring, 5, 37-62, 1989.
Kelman G. R., Digital computer subroutine for the conversion of oxygen tension
into saturation, Journal of Applied Physiology, 21, (4), 1375-6, 1966.
Kyriacou P. A., S. Powell, R. M. Langford and D. P. Jones, Esophageal pulse
oximetry utilizing reflectance photoplethysmography, IEEE Transactions on
Biomedical Engineering, 49, (11), 1360-1368, 2002.
Kyriacou P. A., S. L. Powell, D. P. Jones and R. M. Langford, Evaluation of
oesophageal pulse oximetry in patients undergoing cardiothoracic surgery,
Anaesthesia, 58, (5), 422-427, 2003.
Lerner J. M., Imaging spectrometer fundamentals for researchers in the biosciences-
-a tutorial, Cytometry A, 69, (8), 712-734, 2006.
Liebman F., J. Pearl and S. Bango, The electrical conductance properties of blood in
motion, Physics in Medicine and Biology, 7, 177-194, 1962.
189

References
Lindsey L. A., J. D. Watson and A. A. Quaba, Pulse oximetry in postoperative
monitoring of free muscle flaps, British Journal of Plastic Surgery, 44, (1), 27-29,
1991.
Lohman B., O. Boric-Lubecke, V. M. Lubecke, P. W. Ong and M. M. Sondhi, A
digital signal processor for Doppler radar sensing of vital signs, IEEE Engineering
in Medicine and Biology Magazine, 21, (5), 161-164, 2002.
Maguire M., Non-invasive pulse transit time measurement - A potentially valuable
medical measurant or a clinical curiosity?, M.Eng.Sc. thesis, National University
of Ireland, Maynooth, 2004.
Mannheimer P., J. Casciana, M. Fein and S. Nierlich, Wavelength selection for low-
saturation pulse oximetery, IEEE Transactions on Biomedical Engineering, 44, (3),
148-158, 1997.
Marble D., D. Burns and P. Cheung, Diffusion-based model of pulse oximetry: in
vitro and in vivo comparison, Applied Optics, 33, (7), 1279-1285, 1994.
Matsui T., S. Gotoh, I. Arai, H. Hattori, M. Fujita, K. Obara, K. Masuoka, S.
Nakamura, B. Takase, M. Ishihara and M. Kikuchi, Noncontact vital sign
monitoring system for isolation unit (casualty care system), Military Medicine, 171,
(7), 639-643, 2006.
Mendelson Y. and J. Kent, Variations in optical absorption spectra of adult and fetal
hemoglobins and its effect on pulse oximetry, IEEE Transactions on Biomedical
Engineering, 36, (8), 844-848, 1989.
Mendelson Y. and B. Ochs, Noninvasive pulse oximetry utilizing skin reflectance
photoplethysmography, IEEE Transactions on Biomedical Engineering, 35, (10),
798-805, 1988.
Millikan G., The oximeter: an instrument for measuring continuously oxygen
saturation of arterial blood in man, Review of Scientific Instruments, 13, 434-444,
1942.
190

References
Millikan G., J. Pappenheimer, A. Rawson and J. Hervey, Continuous measurement
of oxygen saturation in man, American Journal of Physiology, 133, 390, 1941.
Mower W. R., G. Myers, E. L. Nicklin, K. T. Kearin, L. J. Baraff and C. Sachs,
Pulse oximetry as a fifth vital sign in emergency geriatric assessment, Academic
Emergency Medicine, 5, (9), 858-865, 1998.
Mower W. R., C. Sachs, E. L. Nicklin and L. J. Baraff, Pulse oximetry as a fifth
pediatric vital sign, Pediatrics, 99, (5), 681-686, 1997.
Moyle J., Pulse Oximitery, BMJ Publishing Group, London, 1994.
Munley A., M. Sik and A. Shaw, A test object for assessing pulse oximeters, Lancet,
i, 1048-1049, 1989.
Nakamura T., K. Fukuda, K. Hayakawa, I. Aoki, K. Matasumoto, T. Senkine, H.
Ueda and Y. Shimizu, Mechanism of burn injury during magnetic resonance
imaging (MRI) - simple loops can induce heat injury, Frontiers of Medical and
Biological Engineering, 11, (2), 117-129, 2001.
Neff T. A., Routine oximetry. A fifth vital sign?, Chest, 94, (2), 227, 1988.
New W., Pulse oximetry, Journal of Clinical Monitoring, 1, (2), 126-129, 1985.
New W. and J. Corenman, Calibrated optical oximeter probe, United States Patent:
4700708, 1987.
New W. and J. Corenman, Calibrated optical pulse oximeter probe, United States
Patent: 4770179, 1988.
Nijboer J. and J. Dorlas, Comparison of plethysmograms taken from finger and
pinna during anaesthesia, British Journal of Anaesthesia, 57, (5), 531-534, 1985.
Niwayama M., H. Murata and S. Shinohara, Noncontact tissue oxygenation
measurement using near-infrared spectroscopy, Review of Scientific Instruments, 77,
(7), 2006.
191

References
Nunn J. F., Applied respiratory physiology, 3rd edition, Butterworth, London, 1987.
Okada E., M. Firbank, M. Schweiger, S. Arridge, M. Cope and D. Delpy,
Theoretical and experimental investigation of the near-infrared light propagation in
a model of the adult head, Applied Optics, 36, 21-31, 1997.
Pallas-Areny R. and J. G. Webster, Sensors and Signal Conditioning, Wiley, New
York, 1991.
Palreddy S., Design of Pulse Oximeters, Chapter 9, Ed. J. G. Webster, Taylor and
Francis Group, New York, 1997.
Paranjape K. S., Design of Pulse Oximeters, Chapter 8, Ed. J. G. Webster, Taylor
and Francis Group, New York, 1997.
Patterson M., B. Wilson and D. Wyman, The propagation of optical radiation in
tissue I. Models of radiation transport and their application, Lasers in Medical
Science, 6, 155-168, 1990.
Payne J. and J. Severinghaus, Pulse Oximetry, Springer, New York, 1986.
Pologe J., Pulse oximetry: technical aspects of machine design, International
Anesthesiology Clinics, 25, (3), 137-153, 1987.
Potratz R., Condensed oximeter system with noise reduction software, United
States Patent: 5351685, 1994.
Prahl S., M. Keijzer, S. Jacques and A. Welch, A Monte Carlo model of light
propagation in tissue, SPIE Inistitute Series, IS 5, 102-111, 1989.
Reddy M. V. S., Design of Pulse Oximeters, Chapter 7, Ed. J. G. Webster, Taylor
and Francis Group, New York, 1997.
Reuss J. L., Multilayer modeling of reflectance pulse oximetry, IEEE Transactions
on Biomedical Engineering, 52, (2), 153-159, 2005.
192

References
Reynolds K., J. de Kock, L. Tarassenko and J. Moyle, Temperature dependence of
LED and its theoretical effect on pulse oximetry, British Journal of Anaesthesia, 67,
1991.
Reynolds K., J. Moyle, L. Gale, M. Skyes and C. Hahn, In vitro performance test
system for pulse oximeters, Medical and Biological Engineering and Computing,
30, 629-635, 1992.
Reynolds K. J., E. Palayiwa, J. T. Moyle, M. K. Sykes and C. E. Hahn, The effect of
dyshemoglobins on pulse oximetry: Part I, Theoretical approach and Part II,
Experimental results using an in vitro test system, Journal of Clinical Monitoring,
9, (2), 81-90, 1993.
Rolfe P., In vivo near-infrared spectroscopy, Biomedical Engineering Annual
Review, 2, 715-754, 2000.
Schibli E. G., S. S. Yee and V. M. Krishnan, An electronic circuit for red/infrared
oximeters, IEEE Transactions on Biomedical Engineering, 25, (1), 94-96, 1978.
Schmitt J. M., R. Webber, L. and E. C. Walker, Pulse oximeter for diagnosis of
dental pulp pathology, United States Patent: 5040539, 1991.
Schowalter J. S., Design of Pulse Oximeters, Chapter 10, Ed. J. G. Webster, Taylor
and Francis Group, New York, 1997a.
Schowalter J. S., Design of Pulse Oximeters, Chapter 6, Ed. J. G. Webster, Taylor
and Francis Group, New York, 1997b.
Seidler D., M. M. Hirschl and G. Roeggla, Limitations of pulse oximetry, Lancet,
341, (8860), 1600-1, 1993.
Severinghaus J., History of blood gas analysis, International Anesthesiology
Clinics, 25, (4), 1-225, 1987a.
Severinghaus J., History, status and future of pulse oximetry, Advances in
Experimental Medicine and Biology, 220, 3-8, 1987b.
193

References
Severinghaus J. and P. Astrup, History of blood gas analysis. I. The development of
electrochemistry, Journal of Clinical Monitoring, 1, (3), 180-192, 1985a.
Severinghaus J. and P. Astrup, History of blood gas analysis. II. pH and acid-base
balance measurements, Journal of Clinical Monitoring, 1, (4), 259-277, 1985b.
Severinghaus J. and P. Astrup, History of blood gas analysis. III. Carbon dioxide
tension, Journal of Clinical Monitoring, 2, (1), 60-73, 1986a.
Severinghaus J. and P. Astrup, History of blood gas analysis. IV. Leland Clark's
oxygen electrode, Journal of Clinical Monitoring, 2, (2), 125-139, 1986b.
Severinghaus J. and P. Astrup, History of blood gas analysis. V. Oxygen
measurement, Journal of Clinical Monitoring, 2, (3), 174-189, 1986c.
Severinghaus J. and P. Astrup, History of blood gas analysis. VI. Oximetry, Journal
of Clinical Monitoring, 2, (4), 270-288, 1986d.
Severinghaus J. and Y. Honda, History of blood gas analysis. VII. Pulse oximetry,
Journal of Clinical Monitoring, 3, (2), 135-138, 1987.
Severinghaus J., K. Naifeh and S. Koh, Errors in 14 pulse oximeters during
profound hypoxia, Journal of Clinical Monitoring, 5, 72-81, 1989.
Shapiro B., R. Harrison, R. Cane and R. Templin, Clinical Application of Blood
Gases, 4th edition, Year Book Medical, Chicago, 1989.
Sowa M., L. Leonardi, J. Payette, J. Fish and H. Mantsch, Near infrared
spectroscopic assessment of hemodynamic changes in the early post-burn period,
Burns, 27, 241-249, 2001.
Sowa M., J. Mansfield, G. Scarth and H. Mantsch, Noninvasive assessment of
regional and temporal variations in tissueoxygenation by near-infrared spectroscopy
and imaging, Applied Spectroscopy, 51, (2), 143-152, 1997.
194

References
Sowa M., J. Payette, M. Hewko and H. Mantsch, Visible near infrared multispectral
imaging of the rat dorsal skin flap, Journal of Biomedical Optics, 4, (4), 474-481,
1999a.
Sowa M., J. Payette and H. Mantsch, Near-infrared spectroscopic assessment of
tissue hydration following surgery, Journal of Surgical Research, 86, 62-69, 1999b.
Splinter R. and B. A. Hooper, An Introduction to Biomedical Optics, Taylor and
Francis, New York, 2007.
Squire J., Instrument for measuring the quantity of blood and its degree of
oxygenation in the web of the hand, Clinical Science, 4, 331-339, 1940.
Steinke J. and A. Shepard, Role of light scattering in whole blood oximetry, IEEE
Transactions on Biomedical Engineering, 33, 294-301, 1986.
Stranc M. F., M. G. Sowa, B. Abdulrauf and H. H. Mantsch, Assessment of tissue
viability using near-infrared spectroscopy, British Journal of Plastic Surgery, 51,
(3), 210-217, 1998.
Strangman G., M. A. Franceschini and D. A. Boas, Factors affecting the accuracy of
near-infrared spectroscopy concentration calculations for focal changes in
oxygenation parameters, NeuroImage, 18, (4), 865-879, 2003.
Taylor M. and J. Whitman, The accuracy of pulse oximiters, Anaesthesia, 43, 229-
232, 1988.
Tungjitkusolmun S., Design of Pulse Oximeters, Chapter 11, Ed. J. G. Webster,
Taylor and Francis Group, New York, 1997.
Twersky V., Absorption and multiple scattering in biological suspensions, Journal
of the Optical Society of America, 60, 1084-1093, 1970.
Uenoyama M., T. Matsui, K. Yamada, S. Suzuki, B. Takase, M. Ishihara and M.
Kawakami, Non-contact respiratory monitoring system using a ceiling-attached
microwave antenna, Medical and Biological Engineering and Computing, 44, (9),
835-840, 2006.
195

References
United States Navy, United States Navy Diving Manual: Volume 4, United States
Government Printing, 1994.
Varshni Y., Temperature dependence of the energy gap in semiconductors, Physica,
34, 1967.
Vegfors M., L. Lindberg, P. Oberg and C. Lennmarken, Accuracy of pulse
oximetry at various haematocrits and during haemolysis in an in vitro model,
Medical and Biological Engineering and Computing, 31, 135-41, 1993.
Visser K., R. lamberts, H. Korsten and W. Zijlstra, Observations of blood flow
related to impedance changes, Pflügers Archiv : European Journal of Physiology,
366, 289-291, 1976.
Webb R. K., A. C. Ralston and W. B. Runciman, Potential errors in pulse oximetry.
II. Effects of changes in saturation and signal quality, Anaesthesia, 46, (3), 207-12,
1991.
Wieben O., Design of Pulse Oximeters, Chapter 4, Ed. J. G. Webster, Taylor and
Francis Group, New York, 1997.
Wieringa F., F. Mastik and A. Van Der Steen, Contactless multiple wavelength
photoplethysmographic imaging: a first step toward "SpO2 Camera" technology,
Annals of Biomedical Engineering, 33, (8), 1034-1041, 2005.
Wieringa F. P., F. Mastik, F. J. Cate, H. A. Neumann and A. F. van der Steen,
Remote non-invasive stereoscopic imaging of blood vessels: first in-vivo results of
a new multispectral contrast enhancement technology, Annals of Biomedical
Engineering, 34, (12), 1870-1878, 2006.
Wood E. and J. Geraci, Photoelectric determination of arterial saturation in man,
The Journal of Laboratory and Clinical Medicine, 34, 387-401, 1949.
Wukitsch M., Pulse oximitery: Historical review of Ohmeda functional analysis,
Journal of Clinical Monitoring and Computing, 4, 161-166, 1987.
196

References
Wukitsch M., M. Petterson, D. Tobler and J. Pologe, Pulse oximitery: analysis of
theory, technology and practice, Journal of Clinical Monitoring, 1988, (4), 290-301,
1988.
Young D., C. Jewkes, M. Spittal, C. Blogg, J. Weissman and D. Gradwell,
Response time of pulse oximeters assessed using acute decompression, Anesthesia
and Analgesia, 74, (2), 189-195, 1992.
Yount J., Device and procedures for in vitro calibration of pulse oximetry monitors,
United States Patent: 4834532, 1989.
Yuanqing L., G. Lech, S. Nioka, X. Intes and B. Chance, Noninvasive, low-noise,
fast imaging of blood volume and deoxygenation changes in muscles using light-
emitting diode continuous-wave imager, Review of Scientific Instruments, 73, (8),
3065-3074, 2002.
Zeman H., G. Lovhoiden and C. Vrancken, The clinical evaluation of vein contrast
enhancement, In proceedings of IEEE Engineering in Medicine and Biology Society
Conference, 2004.
Zijlstra W., Fundamentals and applications of oximetry, 2nd edition, Van Gorcum,
Assen, 1953.
Zijlstra W., A Manual of Reflection Oximetry, Van Gorcum, Assen, 1958.
Zwart A., A. Buursma, B. Oeseburg and W. Zijlstra, Determination of hemoglobin
derivatives with the IL-282 CO-oximeter as compared with a manual
spectrophotometric five wavelength method, Clinical Chemistry, 27, (11), 1903-
1906, 1981.
197
Related Documents