26 th NATIONAL RJ\DIO SCIENCE CONFERENCE (NRSC2009) March 17-19,2009, Faculty of Engineering, Future Univ., Egypt BicAT_Plus: An Automatic Comparative Tool For Bi/Clustering of Gene Expression Data Obtained Using Microarrays Fadhl M. Al-Akwaa'", Mohamed H. Ali 4 , Vasser M. Kadah 2 ,3 IBiomedical Eng. Dept., Univ. of Science & Technology, Sana'a, Yemen (E-mail f alakw a!alk-space.org) 2 Biomed ical Engineering Department, Cairo University, Giza , Egypt 3Center for Informatics Sciences, Nile University, Egypt "Computer Science School, Nottingham University, Nottingham, United Kingdom Abstract In the last few years the gene expression microarray technology has become a central tool in the field of functional genomics in which the expression levels of thousands of gene s in a biological sample are determ ined in a single experiment. Several clustering and biclustering methods have been introduced to analyze the gene expre ssion data by identifying the similar pattern s and group ing gene s into subsets that share biological significance. However, it is not clear how the different methods compare with each other with respect to the biological relevance of the biclusters and clusters as well as with other characteristics such as robustness and predictability. This research describes the development of an autom atic comparative tool called BieA T pl us that was designed to help researchers in evaluating the results of different bi/c1ustering methods, compare the results against each others and allow viewing the comparison results via convenient graphical displays. BieAT plus incorporates a reasonabl e biological comparative methodology based on the enrichment of the output bi/c1usters with gene ontology functional categories. No exact algorithm can be considered the optimum one. Instead, bi/clustering algor ithms can be used as integrated techniques to highlight the most enriched biclusters that help biologists to draw biological predict ion about the unkno wn genes. 1. Introduction One ofth e main research areas of bioinformatics is functional genomics; which focuses on the interactions and function s of each gene and its products (mRNA, protein) through the whole genome (the entire genetics sequences encoded in the DNA and responsible for the hereditary information). In order to identify the function s of certain gene, we should be able to capture the gene expressions which describe how the genetic information converted to a functional gene product through the transcription and translation processes. Functional genomics uses microarrays technology to measure the genes expressions levels under certain conditions and environmental limitations. In the last few years, Microarray has become a central tool in biological research, consequently, the corresponding data analysis becomes one of the important work disciplines in bioinformatics. The analysis of microarrays data poses a large number of exploratory statistical aspects including clustering and biclustering algorithms which help to identify similar patterns in gene expression data and group genes and conditions into subsets that share biological significance. There are several bi/clustering methods that have been proposed to achieve this targ et (see [I] for a survey) , but the question is: which algorithm is better? And do some algorithms have advantages over others. Generally, comparing different bi/clustering algorithms is not straightforward as they diff er in strategies, approaches, time compl icity, number of parameters and prediction ability. They are strongl y influenced by user-selected parameter values. For these reasons, the quality of bi/clustering results is also often considered more important than the required computation time. Although there are some analytical comparative studies to evaluate the traditional clustering algorithms [2-4], for biclustering; no such extensive comparison exist even after initial trails have been taken[5].ln the end, biological merit is the main criterion for evaluation and comparison between the various bi/clustering methods. SicAT [6] is a common biclustering analysis toolbox in which most important bi/c1ustering algorithms like k-rneans, SOM, HCL, Birnax [5], OPSM [7], X-motif [8],CC[9], and ISA [10] were implemented, see Figure I. We have developed a comparative tool "Bicat plus" that includes the biological comparative methodology and to be as an extension to the SicAT program. The Goal of BieATy lus is to enable researchers and biologists to compare between the different bi/c1ustering methods based on set of biological merits and draw conclusion on the biological meaning of the results. Also BieA( 'plus help researcher in comparing and evaluating the algorithms results mult iple times acco rding to the user selected parameter values as well as the required biologic al perspecti ve on various datasets . BieATy lus has many features added to SicAT which could be summarized in the following: 26'hNATIONAL RADIO SCIENCE CONFERENCE, NRSC'2009 Future University, 5'"Compound, New Cairo, Egypt, March 17 - 19, 2009 Authorized licensed use limited to: Emory University. Downloaded on October 1, 2009 at 06:18 from IEEE Xplore. Restrictions apply.

Welcome message from author
This document is posted to help you gain knowledge. Please leave a comment to let me know what you think about it! Share it to your friends and learn new things together.
Transcript

26th NATIONAL RJ\DIO SCIENCE CONFERENCE (NRSC2009)
~ ~~ March 17-19,2009, Faculty of Engineering, Future Univ., Egypt
BicAT_Plus: An Automatic Comparative Tool For Bi/Clusteringof Gene Expression Data Obtained Using Microarrays
Fadhl M. Al-Akwaa'", Mohamed H. Ali4, Vasser M. Kadah2
,3
IBiomedical Eng. Dept., Univ. of Science & Technology, Sana' a, Yemen (E-mail f alakw a!alk-space .org)2 Biomed ical Engineering Departme nt, Cairo University, Giza , Egypt
3Center for Inform atics Sciences, Ni le University, Egypt"Computer Science School, Nottingham Universi ty, Nottingham, United Kingdom
Abstract
In the last few years the gene expressi on microarray technology has become a central tool in the fi eld offunctional genomics in which the expression levels of thousands of gene s in a biological sample are determ inedin a single exper iment. Several clustering and biclustering methods have been introduced to analyze the geneexpression data by identifying the similar pattern s and group ing gene s into subsets that share biologicalsignificance. However, it is not clear how the different methods compare with each other with respect to thebiolog ical relevance of the biclusters and clusters as well as with other characteristics such as robustness andpredictabil ity. This research describes the development of an autom atic comparative tool called BieAT plus thatwas designed to help researche rs in evaluating the result s of different bi/c1ustering methods, compare the resultsagainst each others and allow viewing the comparison results via convenient graphical displays. BieAT plusincorporates a reasonabl e biologi cal comparat ive methodology based on the enrichment of the output bi/c1usterswith gene ontology functional categories. No exact algorithm can be considere d the optimum one. Instead,bi/clu stering algor ithms can be used as integrated techniques to highlight the most enr iched biclusters that helpbiolog ists to draw biological predict ion about the unkno wn genes.
1. Introduction
One ofthe main research areas of bioinformatics is functional genomics; which focuses on the interactionsand function s of each gene and its products (mRNA, prot ein) through the whol e genome (the entire geneticssequences encoded in the DNA and respon sible for the hereditary information). In order to identify the function sof certain gene, we should be able to captu re the gene expressions which describe how the genetic informationconverted to a funct ional gene product through the transcription and translation processes. Functional genom icsuses microarrays technology to measure the genes expressions levels under certain conditions andenvironmental limitat ions. In the last few years, Microarray has become a central tool in biological research,consequently, the corresponding data analysis becom es one of the important work disciplines in bioinformatics.The analysis of microarrays data poses a large numb er of exploratory statistical aspects including clustering andbiclustering algorithms which help to identify similar patterns in gene expression data and group genes andconditions into subsets that share biological significance. There are several bi/clustering method s that have beenpropo sed to achieve this targ et (see [I] for a survey) , but the question is: whi ch algorithm is better? And dosome algor ithms have advantages over others . Generally, comparing different bi/clustering algorithms is notstraightforward as they differ in strategies, approaches, time compl icity, number of parameters and predictionability. They are strongl y influenced by user-select ed param eter values. For these reasons, the quality ofbi/clustering result s is also often considered more impo rtant than the requ ired computation time. Although the reare some analytical comparative studies to evaluate the traditional cluster ing algorithms [2-4] , for biclu stering;no such extensive comparison exist even after initial trails have been taken[5].ln the end, biolog ical merit is themain criterion for eva luation and comparison between the various bi/clustering methods. SicAT [6] is acommon biclustering analysis toolbo x in which most important bi/c1ustering algorithms like k-rneans, SOM ,HCL, Birnax [5], OPSM [7], X-moti f [8],CC[9], and ISA [10] were implemented, see Figure I. We havedeveloped a comparat ive tool "Bicatplus" that includes the biological comparative methodology and to be as anextension to the SicAT program. The Goal of BieATy lus is to enable researchers and biolog ists to comparebetween the diffe rent bi/c1ustering methods based on set of biological merit s and draw conclusion on thebiolog ical meaning of the results. Also BieA( 'p lus help researcher in comparing and evaluating the algorithmsresults mult iple times acco rding to the user selected parameter values as well as the required biologic alperspecti ve on various datasets . BieATy lus has many features added to SicAT which could be summarized inthe following:
26'hNATIONAL RADIO SCIENCE CONFE RENCE, NRSC'2009Future University, 5'"Compound, New Cairo, Egypt, March 17 - 19, 2009
Authorized licensed use limited to: Emory University. Downloaded on October 1, 2009 at 06:18 from IEEE Xplore. Restrictions apply.
26U1NATIONAL RADIO SCIENCE CONFERENCE (NRSC2009)
~ ~~ March 17-19,2009, Faculty of Engineering, Future Univ., Egypt
a. Adding more algorit hms to the BicAT tool in orde r to have one software package that emplo ys most ofthe commonly used bi/c1ustering algorithms. The additional algorithms are MSBE constantbiclustering and MSBE additi ve biclustering .
b. Extending the BicAT to perform functional analysis using the three subontologies or categories of GO(biological process, molecul ar function and cellular component) and visualizing the enriched GOterms per each bi/c1uster in a separate histogram.
c. Evaluating the quality of each bi/c1uster ing algorithm results after applying the GO function al analysisand displaying the percentage of the enriched biclusters at the standard P-values (signific ance levels)which are: 0.00001 ,0.00005 ,0.000 I,0.0005,0.00 I,0.005,0.0 I and 0.05 .
d. Comparing between the different bi/c1ustering algorithms according to the percentage of the functionallyenriched bi/c1usters at the required significance levels, the selected GO category and with certainfiltration cr iteria for the GO terms.
e. Evaluating and comparing the results of external bi/c1uster ing algorithms (not included in the BicAT pluscurrent version).This gives the BicAT plus the advantage to be a generic tool that doesn't depend onthe emplo yed method s only. For example; it can be used to evaluate the quality of the new algorithmsintroduc ed to the field and compare against the existing ones.
f. Displaying the analysis and comparison results using graphical and statistical charts visualizations inmultiple modes (20 and 3D).
~ BicAT
File Preprocess Run Tools Vlew Help
o
'.i
esslon\ltevr~ ~ Display Biclusterin BiMax .. :Ft.1al=r.:::lx.:::"'e:::W-.'!'=~~~~~¥i~!,?;-:1'~ ~ Dataset Bictusterlng CC
'l' Clo. - .o ~~clusteflng ISA
D ~CIUS1erjno xMotifs
D ~Iclusterlng OPSM
'l' Cl Blcl Clustering HCl
0- L:]A Clustering K·means&~ Searc resu, C] Fitterresults
, L:] Fitter result of l O, F,O
DID: 214, sze:90 (45,2)
DID: 6, see :88 (22,4)
DID: 180, sze: 86 (43,2)
D10: 191, s iZe: 86 (43,2)
D ID: 30, siZe: 66 (33,2)
DID: 3, siZe: 64 (32,2)
D ID: 131, siZe: 60 (30,2)
DID: 75, see: 50 (25,2)
D ID: 80, see 46 (23,2)
D10 : 239,siZe : 42 (21,2)
10 : 162 s ee : 40 0
Dtsplay \riew Workflow
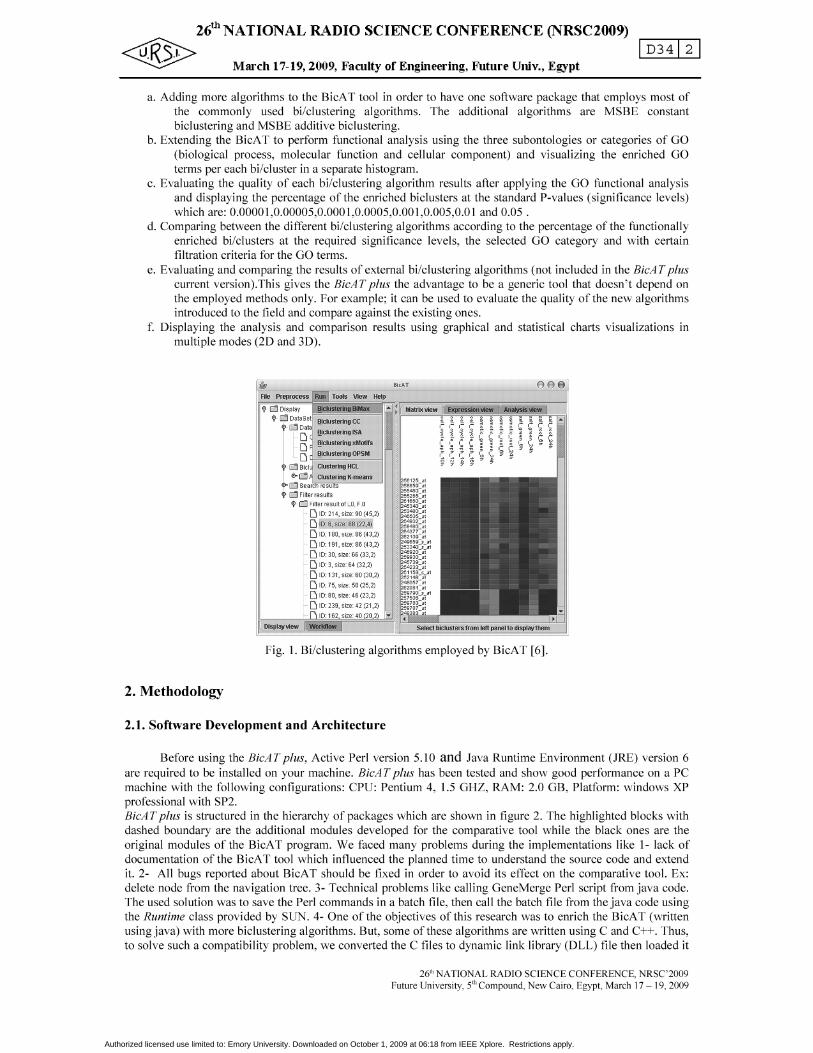
Fig. I. Bi/c1ustering algor ithms employed by BicAT [6] .
2. Methodology
2.1. Software Development and Architecture
Before using the RicAT plus , Act ive Perl version 5.10 and Java Runtime Environment (.IRE) version 6are required to be installed on your machine. RicAT plus has been tested and show good perform ance on a PCmach ine with the following configuration s: CPU: Pentium 4, 1.5 GHZ, RAM: 2.0 GB, Platform : windows XPprofessional with SP2.RicAT plus is structured in the hierarchy of packages which are shown in figure 2. The highl ighted blocks withdashed boundary are the additional modu les developed for the comparative too l while the black ones are theoriginal module s of the BicAT program . We faced many problems during the implementations like 1- lack ofdocumentation of the BicAT tool which influenced the planned time to understand the source code and extendit. 2- All bugs reported about BicAT should be fi xed in orde r to avoid its effect on the comparative tool. Ex:delete node from the navigation tree . 3- Technical problem s like call ing GeneMerge Perl script from java code .The used solution was to save the Perl comm ands in a batch file, then call the batch file from the java code usingthe Runtime class provided by SUN. 4- One of the objectives of this research was to enrich the BicAT (writtenusing java) with more biclustering algorithms. But, some of these algor ithms are written using C and C++. Thus,to solve such a compatibility problem , we converted the C tiles to dynamic link library (DLL) tile then loaded it
26'hNATIONAL RADIO SCIENCE CONFE RENCE, NRSC'2009Future University, 5'hCompound, New Cairo, Egypt, March 17 - 19, 2009
Authorized licensed use limited to: Emory University. Downloaded on October 1, 2009 at 06:18 from IEEE Xplore. Restrictions apply.

26t1lNATIONAL R.i\.DIO SCIENCE CONFERENCE (NRSC2009)
~ ~~ March 17-19~ 2009~ Faculty of Engineering, Future Univ., Egypt
to the system class path library. Another possible solution was to use the Java native interface (JNI) to call the Cfiles.
bieat.gui
BicatGui
Dataset I
Mat rices: input,discrete, preprocessed.
List of resune:bi/ctaaers. fiters,searches
I LoadData
I Preprocessor
bieat.gui.windCNV
I Ru nDi alog_algo
run algorithm
I Arguments_alga
I RunMachine_algo I
post-p--oeess
bieat.gui
Pi cturePane
Graphi cPane
bieat.util
~
(1)
Fig. 2. The general design of the BicAT plus. Dashed block for the comparative tool packages and classes.The black entities are the original packages and interfaces of the BicAT program. Modified from [11].
2.2. GO Overrepresentation Programs
Many programs like: BINGO[12], FUNCAT[13], GeneMerge[14] and FuncAssociate[15] were used toinvestigate whether the set of genes discovered by bi-clustering/clustering methods present significantenrichment with respect to a specific GO annotation provided by Gene Ontology Consortium[16]. BicAT Plusused GeneMerge program as the most popular GO program. GeneMerge provides a statistical test for assessingthe enrichment of each GO term in the sample test. The basic question answered by this test is as follows: whensampling X genes (test set) out of N genes (reference set, either a graph or an annotation), what is the probabilitythat x or more of these genes belong to a functional category C shared by n of the N genes in the reference set?The hyper geometric test, in which sampling occurs without replacement, answers this question in the form of Pvalue. Its counterpart with replacement, the binomial test, provides only an approximate P-value, but requiresless calculation time.
2.3. Comparative methodologies based on GO
BicATplus provides reasonable method for comparing the results of different bi/clustering algorithms by:
2.3.1 identifying the percentage of enriched or overrepresented biclusters with one or more GO term permultiple significance levels (p-values) for each algorithm.
P l+· h d bi I . ifi I I Number of enriched biclusters at this levelercentage OJ enrzc e zc uster szgnz zcance eve == ------------------total number of biclusters
The definition of significance depends on the user selection of threshold p-values. A bi/cluster is said to besignificantly overrepresented (enriched) with a functional category if the p-value of this functional category islower than the preset threshold P-value [17, 5]. The results are displayed using a histogram for the entirecompared algorithms at the different preset significance levels, and the algorithm which gives higher proportionof enriched bi/clusters per all significance levels is considered to be the optimum one as it does groupeffectively the genes sharing similar functions in the same bi/cluster.
2.3.2 Estimate Algorithms predictability power to recover interested pattern Genes whose transcription isresponsive to a variety of stresses have been implicated in a general yeast response to stress. Other geneexpression responses appear to be specific to particular environmental conditions. BicAT plus make the user to
26th NATIONAL RADIO SCIENCE CONFERENCE, NRSC'2009Future University, 5th Compound, New Cairo, Egypt, March 17 - 19, 2009
Authorized licensed use limited to: Emory University. Downloaded on October 1, 2009 at 06:18 from IEEE Xplore. Restrictions apply.

26tl1NATIONAL Rt\.DIO SCIENCE CONFERENCE (NRSC2009)
~ ~~ March 17-19,2009, Faculty of Engineering, Future Univ., Egypt
compare the perdictibil ity power of bilclusters algorithms to interested pattern defined by the user see table 2 foran example .
2.4. Comparison Process Steps
The following process diagram shown in Figure 3 summarizes the required steps by the user to comparebetween the different algorithms using the Si cAT plus.
1- download BicATy lus from our site http://home .k-space.org/FADLIDownload s/BicAT_plus.zip.2- Load Gene Expression Data to Si cAT plus then run the selected five prominent bi/clustering methods
with setting parameters as table II3- Run GO comparison tool in the SicAT plus and add the available bilclustering algorithms to the
compared list as shown in Figure[4] .4. Select the on of the available GO category e.g. biological process, molecular function and cellularcomponents.5. Select the P-values e.g. 0.00001, 0.0001, 0.01, 0.005, and 0.05.6. Press compare button.7. Press compari son menu, Functional enrichment and select 20 or 3D charts see Figure 5.
load Gene
The comparison
resultsare
displayed using
statistical
graphical charts
I. Selectthe compared
bi/clustersresults 1.Add
...... externa lalgorithmsresultsyou
want toinclude (if exists)
Fig. 3. SicAT Plus Comparison process steps.
Table I. Default Parameter settings of the compared bi/clustering methods.The definition s of these parameters are listed in their original publications ([ I0],[9],[ 18]) respectively.
Bi/cIusteringAlgorithmISACC
OPSMBiVisuK-means
,,-_-. f_P.oh : IGO . ... P ..h : I
[-' ':'=:~-_.
Parameter settings
t. - 2.0, t, - 2.0, seeds - 500
0 = 0.5, 0. = 1.2, M = 1001= 100
E = 0.82, N, = 10, N, = 5, Po = 25K=I OO
IIQIG]IQ
Fig. 4. SicA T Plus Comparison Dialog
26'hNATIONAL RADIO SCIENCE CONFERENCE, NRSC 2009Future University, 5'"Compound, New Cairo, Egypt, March 17 - 19, 2009
Authorized licensed use limited to: Emory University. Downloaded on October 1, 2009 at 06:18 from IEEE Xplore. Restrictions apply.

26th NATIONAL R.J\.DIO SCIENCE CONFERENCE (NRSC2009)
~ ~~ March 17-19, 2009, Faculty of Engineering, Future Unlv., Egypt
File preprocess Run FlIuc1ionalAnalysis ccmsere Tools View Aboln
No of Enriched Functiona l Classes : 4
00 :0006406 mRNAexportfrom nucleus percentage ofEnrichement= 29 3%• 00 :0006401 rRNAexportnom nucleus percentage of Enrichement= 346 %• 0 0:0006409 tRNAexportfrom nucleus percentage of Enrichemen1= 33.3%. 0 0:0006999 nuclear pore organization and biogenesiS percentageo fE nrichemenl=36.0%
.. Mdlr ixview Expless ion viewlisplay
::l OataSetO"' (jOataOisPlav'? (j 8icluster resul1s
o- ClAlI biclusters I ConstantBi (1)1,
V (jAlI bicluslerslAddlliveBi (T)I,L
[)ID:O,size 441(21,21)
[)ID:l,size418(22,l9j
D ID:2,size:255(17,15)
[)ID:3,size196(14,14)
[)ID: 4,size196(14,14)
DID:5,size182(13,1 4)
[)ID:6,Sile182(13,1 4)
t (jAllbiclusters/ISA(63)/,L2
D 0 : 0, size 1360 136,1
D mt.sne: 1270(127,10)
[)ID:2,Size1206(134,9)
[)ID:3,Size:1197(133,9l
DID: 4,Size1177(107,11)
[) ms.sne:1080 (135,8l
DID:6,sizel080(120,9)
DID:7,Size:l0S0(135,8l
[)ID:8,Sizel0S0(135,8)
DID:9,sizel080(135,8)
DID:l0,Sizel080(135,8l
DID:l1,Silel072(134,13)
D m.tz.see: 1040(104,10)
D m.ta.sze: 1026(114,9)
DID:1 4,size10013(112,9) ....
,/.'
Analysisview Func1ionview Comparison view
Bi/Cluster Functional Analys isp-valuetllleshold : l .0E.5
/.'
(2)
Fig. 5. Function al analysis results of the selected bi/cluster. Each column represents an enriched GO functionalclass. The height of the column is propor tional to the significance of this enr ichment
3. Results and Discussion
The above comparison steps is performed on the gene expression data of S. eerevisiae provided by Gasch [19].The datase t contains 2993 genes and 173 cond itions of diverse environmental transitions such as temperatureshocks, am ino ac id starvation, and nitrogen source deplet ion. This dataset is freely avai lable from [20] . For eachbi/clustering algorithm we used the default parameters as authors recommend in their public ations. See Table I.
3.1 The percentage of enriched function
After applying the above steps on Gasch data , BieAT plus produc e the histogram shown in figure I. Bycomparing Figure 6 and Figure 3 in [5] , we found that the percentage of enriched biclusters for the match edalgorithms are almost the same. This does validate the results of the proposed comparative tool. Investigatingboth figures, we observed that OPSM algorithm gave a high portion of funct ionally enriched biclusters at allsignific ance levels (from 85% to 100 %) . Next to OPSM , ISA and Bimax show relatively high portions ofenriched biclusters.In order to evaluate the ability of the algorithms to group the maximum number of genes whose expressionpatterns are similar and sharing the same GO category, we use the filtration criteria developed in thecomparative tool by neglecting those bi/clusters which have study fraction less than 25%. The study fraction ofa GO term is the fra ction of genes in the study set (bicluster) with this term.
S d fi. ,-r GO No of genes sharing the GO term in a bicluster 100
tu y raction oj a term = xtotal number of genes in this bicluster
Figure 7 shows that OPSM and ISA have highly enriched biclusters/clu sters that have large number of genes pereach GO catego ry. On the other hand, Bivisu biclusters are strongly affected by this filtration and they containsa lower number of genes per each category. This filtration will help in identifying the powerful and most reliablealgorithms which are able to group maximum numbers of genes sharing same funct ions in one cluster.
3.2 The predictability power to recover interested pattern
The user could compare bi/clusters algor ithms based on which of them could recover defined pattern like whichone of them could recover clusters which have response to the conditions applied in Gasch experiments. InTable 2, the difference between the biclusters/clusters contents were summar ized. Although OPSM show highpercentag e level of enr iched biclusters (as shown in Figures. 2 and 3), its biclusters do not contain any gene swithin any GO category response to Gasch experiments. The k-rneans and Bivisu c1uster/b icluster results
26'hNATIONAL RADIO SCIENCE CONFERENCE, NRSC' 2009Future University, 5'"Compound, New Cairo, Egypt, March 17 - 19, 2009
Authorized licensed use limited to: Emory University. Downloaded on October 1, 2009 at 06:18 from IEEE Xplore. Restrictions apply.

26th NATIONAL RJ\.DIO SCIENCE CONFERENCE (NRSC2009)
~ ~~ March 17-19,2009, Faculty of Engineering, Future Univ., Egypt
distinguished a unique GO category, which is GO:0000304 (response to singlet oxygen) , and GO:0042542(response to hydrogen peroxide) The powerful usage of these bi/cluster algorithms is significantly appeared inGO:0006995 "cellular response to nitrogen starvation" where these algorithms were able to discover 4 out of 5annotated genes without any prior biological information or on desk experiments.
4. Conclusions
We have introduced the BieAT plus with reasonable comparative methodology based on the Gene Ontology. Tothe best of our knowledge such an automatic comparison tool of the various bi/clustering algorithms has notbeen available in the literature . BieAT plus is an open source tool written in java swing and it has a wellstructured design that can be extended easily to employ more comparative methodologies that help biologists toextract the best results of each algorithm and interpret these results to useful biological meaning. In other words,the algorithms that show good quality of results (per the dataset) can be used to provide a simple means ofgaining leads to the functions of many genes for which information is not available currently (unannotatedgenes) .Using BieAT plus, we can identify the highly enriched bi/clusters of the whole compared algorithms . This mightbe quite helpful in solving the dimensionality reduction problem of the Gene Regulatory Network constructionfrom the gene expression data. This problem originates from the relatively few time points (conditions orsamples) with respect to the large number of genes in the microarray dataset.
.= ....;;;;;.-,...-= """*...... ...._ -;> .-.......; ....,-_ __••- •__ __•• • j
,_.,0_ ·_
~;;;~~~
.o~;~,;K~~g:::::~::,:~
il;§:§~~l'In~~~~~~..
. ..;..~.._,.._,..'-'-
Fig. 6. Percentage ofbiclusters significantly enriched by GO Biological Proces s category (8 eerevisiae) for thefive selected biclusterin methods and K-means at different significance levels p.
Fig. 7. Percentage of significantly enriched biclusters by GO Biological Process category by setting the allowedminimum number of genes per each GO category to 10 and the study fraction to large than 50%.
Table 2Gene Ontolog y category per number of annotated genes of the Bicluster/cluster algorithm results for the
experimental condition on Gasch Experiments[ 19].GO Term I (number of K-means CC (SA Bivisu OPSMannotated genes)GO:0042493 4 5 7 6 0Response to drug I (118)GO:0006970response to osmotic stress I (83) 3 5 6 3 0GO:0006979response to oxidative stress I 2 7 II 0 0(79)GO:0046686response to cadmium ion 1(102) 2 3 2 2 0GO:0043330response to exogenous dsRNA I 2 3 2 2 0(7)
26'hNATIONAL RADIO SCIENCE CO NFERENCE, NRSC' 2009Future University, 5'"Compound, New Cairo, Egypt, March 17 - 19, 2009
Authorized licensed use limited to: Emory University. Downloaded on October 1, 2009 at 06:18 from IEEE Xplore. Restrictions apply.

26U1NATIONAL R.t\DIO SCIENCE CONFERENCE (NRSC2009)
<®1> ~. Mar ch 17-19,2009, Faculty of Engineering, Future Univ., Egypt
GO :0046685 2 0 2 2 0response to arsenic 1(77)GO:0006950 9 II 16 2 0response to stress 1(532)GO :0009408 3 0 2 2 0response to heat 1(24)GO:0009409 0 0 2 0 0response to co ld 1(7)G O:0009267ce llular response to starv atio n 1 0 2 0 0 0(44)GO :0006995ce llular response to nitrogen 4 4 4 0 0starvation 1(5)GO :0042149ce llular respo nse to glucose 0 2 0 0 0starvation 1(5)GO:0009651response to sa lt stress 1(15) 2 7 0 0 0G O:0042542response to hydrogen peroxide 0 0 0 2 01(5)GO :0006974respon se to DNA damage 0 22 0 3 0stimulus 1(240)GO:0000304response to sing let oxygen 1(4) 2 0 0 0 0
AcknowledgmentsThe autho rs thank S. Barkow and C. I. Castillo-Davis for the BicAT Toolbox and GeneMerge Program respectively.Fadhl Al-Akwaa was supported by The University of Science &Tec hnology, Sana 'a - Yemen .
References
[ I] S. C. Made ira and A. L. Olive ira, "Bicluster ing algorithms for biological data analysis: a survey," IEEE/ACMTrans Comput Bioi Bioinform, vol. I , pp. 24 - 45, 2004.
[2] K. Y. Yeung , D. R. Hayner, an d W. L. Ruzzo, "Val idating clu ster ing for gene expression data,"Bioirformatics, vol. 17, pp . 309-3 18, April I , 200 I.
[3] S. Datta and S. Datta, "Com parisons and vali dation of statistica l clu stering tec hniq ues for microarray geneexpression data," Bloirformatics, vol. 19, pp. 459-466, March 1, 2003.
[4] F. Azuaje, "A clu ster vali dity framework for ge nome ex pression data," Bioirfo rmatics, vol. 18, pp. 3 19320, February I , 200 2
[5] A. Prelic, S. Bleuler, P. Zimmermann, A. Wille, P. Buhlmann, W. Gruissem, L. Hennig, L. Thiele, and E. Zitzler,"A Systematic comparison and evaluation of biclustering methods for gene expre ssion data," Bioinformatics, vol.22, pp. 11 22 - 1129, 2006.
[6] S. Barkow, S. Bleuler, A. Prelic, P. Zimme rmann, and E. Zitzler , "BicAT: a biclustering analysis toolbox,"Bioinformatics, vol. 22, pp. 1282-1283, May 15, 2006
[7] A. Ben-Dor, B. Chor, R. Karp, and Z. Yakhin i, "Discovering local structure in gene expres sion data: the orderpreserving submatrix problem," Journal ofComp utational Biology, vol. 10, pp. 373 - 384, 2003.
[8] T. M. Murali and K. S, "Extracting conserved gene expression motifs from gene expression data. ." Pac. Symp.Biocomput. vol. 8, pp. 77-88, 2003
[9] Y. Cheng and G. M. Church, "Bic luster ing of expressi on data," Proceedings of8th International Conference onIntelligent Systems for Mol ecular Biology, pp. 93 - 103, 2000.
[10] J. lhmels, G. Friedlander, S. Bergmann, O. Sarig, Y. Ziv, and N. Barkai, "Revealing modular organization inthe yeast transcriptional network," Nature Gene tics , vol. 31, pp. 370 - 377, 2002.
[ I I] http ://www.tik.ee.ethz .ch/sop/bicat/?page=devel opersGuide .php[12] S. Maere, K. Heymans, and M. Kuiper, "BiNGO: a Cytoscape plugin to assess overrepresentation of Gene
Ontology categories in Biologic al Networks," Bioinfo rmatics, vol. 21, pp. 3448-3449, 2005 .
26'hNATION AL RADIO SCIENCE CO NFERENCE, NRSC' 2009Future University, Soh Compou nd, New Ca iro, Egypt, March 17 - 19, 2009
Authorized licensed use limited to: Emory University. Downloaded on October 1, 2009 at 06:18 from IEEE Xplore. Restrictions apply.

26tl1NATIONAL Rt\DIO SCIENCE CONFERENCE (NRSC2009)
~ ~~ March 17-19,2009, Faculty of Engineering, Future Univ., Egypt
[13] A. Ruepp, A. Zollner , D. Maier, K. Alberrnann, 1. Hani, M. Mokrejs, I. Tetko, U. Guldener, G. Mannhaupt,M. Munsterkotter, and H. W. Mewes, ''The FunCat, a functional annotat ion scheme for systematic classificat ionof proteins from whole genornes," Nucl. Acids Res., vol. 32, pp. 5539-5545 ,2004.
[14] C. I. Castillo-Davis and D. L. Hartl, "GeneMerge - post-genom ic analysis, data mining, and hypothesistesting," Bioinformatics, vol. 19, pp. 891 - 892, 2003.
[15] G. F. Berriz, O. D. King, B. Bryant, C. Sander, and F. P. Roth, "Characterizing gene sets withFuncAssociate," Bioinfo rmatics, vol. 19, pp. 2502-2504, December 12, 2003.
[16] M. Ashburner , C. A. Ball, 1. A. Blake, D. Bolsteing, H. Butler, 1. M. Cherry, A. P. Davis, K. Dolinski, S. S.Dwight, J. T. Eppig, M. A. Harris, D. P. Hill, L. Issel-Tarver, A. Kasarskis, S. Lewis, 1. C. Matese, 1. E.Richardson, M. Ringwald, G. M. Rubin, and G. Sherlock, "Gene Ontology: tool for the unification of biology.The Gene Ontology Consortium," Nature Genetics, vol. 25, pp. 25 - 29, 2000.
[17] X. Liu and L. Wang, "Computing the maximum similarity bi-clusters of gene expression data,"Bioinformatics, vol. 23, pp. 50-56, January I, 2007.
[18] K.-O. Cheng, N.-F. Law, W.-c. Siu, and A. Liew, "Identification of coherent patterns in gene expressiondata using an efficient biclustering algorithm and parallel coordinate visualization," BMC Bioinformatics, vol.9,p. 210, 2008.
[19] A. P. Gasch, P. T. Spellman, C. M. Kao, O. Carrnel-Harel, M. B. Eisen, G. Storz, D. Botstein, and P. O.Brown, "Genomic Expression Programs in the Response of Yeast Cells to Environmental Changes," Mol. Bioi.Cell, vol. II , pp. 4241-4257, December 1,2000.
[20] http://genome-www.stanford.edu/yeast stress/
26'hNATIONAL RADIO SCIENCE CONFE RENCE, NRSC'2009Future University, S,. Compound, New Cairo, Egypt, March 17 - 19, 2009
Authorized licensed use limited to: Emory University. Downloaded on October 1, 2009 at 06:18 from IEEE Xplore. Restrictions apply.
Related Documents