sustainability Article Dimensions of Urban Blight in Emerging Southern Cities: A Case Study of Accra-Ghana Sally Adofowaa Mireku 1,2, *, Zaid Abubakari 3 and Javier Martinez 2 Citation: Mireku, S.A.; Abubakari, Z.; Martinez, J. Dimensions of Urban Blight in Emerging Southern Cities: A Case Study of Accra-Ghana. Sustainability 2021, 13, 8399. https:// doi.org/10.3390/su13158399 Academic Editor: Pierfrancesco De Paola Received: 4 June 2021 Accepted: 16 July 2021 Published: 28 July 2021 Publisher’s Note: MDPI stays neutral with regard to jurisdictional claims in published maps and institutional affil- iations. Copyright: © 2021 by the authors. Licensee MDPI, Basel, Switzerland. This article is an open access article distributed under the terms and conditions of the Creative Commons Attribution (CC BY) license (https:// creativecommons.org/licenses/by/ 4.0/). 1 AnL Valuation and Property Consult, Kanda, Accra P.O. Box YK 627, Ghana 2 Department of Urban Planning and Management, Faculty of Geo-Information Science and Earth Observation (ITC), University of Twente, P.O. Box 217, 7500 AE Enschede, The Netherlands; [email protected] 3 Faculty of Planning and Land Management, SDD University of Business and Integrated Development Studies, Wa P.O. Box WA64, Ghana; [email protected] * Correspondence: [email protected] Abstract: Urban blight functions inversely to city development and often leads to cities’ deterioration in terms of physical beauty and functionality. While the underlying causes of urban blight in the context of the global north are mainly known in the literature to be population loss, economic decline, deindustrialisation and suburbanisation, there is a research gap regarding the root causes of urban blight in the global south, specifically in prime areas. Given the differences in the property rights regimes and economic growth trajectories between the global north and south, the underlying reasons for urban blight cannot be assumed to be the same. This study, thus, employed a qualitative method and case study approach to ascertain in-depth contextual reasons and effects for urban blight in a prime area, East Legon, Accra-Ghana. Beyond economic reasons, the study found that socio-cultural practices of landholding and land transfer in Ghana play an essential role in how blighted properties emerge. In the quest to preserve cultural heritage/identity, successors of old family houses (the ancestral roots) do their best to stay in them without selling or redeveloping them. The findings highlight the less obvious but relevant functions that blighted properties play in the city core at the micro level of individual families in fostering social cohesion and alleviating the need to pay higher rents. Thus, in the global south, we conclude that there is a need to pay attention to the less obvious roles that so-called blighted properties perform and to move beyond the default negative perception that blighted properties are entirely problematic. Keywords: urban blight; prime area; customary land tenure; socio-cultural values; Sub-Saharan Africa; Ghana 1. Introduction In recent decades, due to the increasing urbanisation and economic development, the demand for urban properties for various purposes, such as residential, commercial and industrial, has increased steadily. However, this increasing demand is hardly uni- form across the city [1]. Prime urban areas are characterised by high property values, quality neighbourhoods and modernised developments. Nevertheless, some prime areas simultaneously experience urban blight in the form of vacant plots of land, abandoned structures, littered sites and degraded buildings, leading to the deterioration of cities in terms of physical beauty and functionality [2,3]. Urban blight is described by Weaver [4] as underinvestment in real property. This incidence of blight in the city presents an interesting dilemma where properties in prime areas, despite having great potential that can support useful developments, lie underused. The phenomenon of urban blight dates back from cities in the global north, especially the United States of America (USA), United Kingdom (UK), and Germany, among others, after the industrial revolution era in the 19th–20th centuries. The incidence of the industrial Sustainability 2021, 13, 8399. https://doi.org/10.3390/su13158399 https://www.mdpi.com/journal/sustainability

Welcome message from author
This document is posted to help you gain knowledge. Please leave a comment to let me know what you think about it! Share it to your friends and learn new things together.
Transcript
sustainability
Article
Dimensions of Urban Blight in Emerging Southern Cities:A Case Study of Accra-Ghana
Sally Adofowaa Mireku 1,2,*, Zaid Abubakari 3 and Javier Martinez 2
�����������������
Citation: Mireku, S.A.; Abubakari,
Z.; Martinez, J. Dimensions of Urban
Blight in Emerging Southern Cities:
A Case Study of Accra-Ghana.
Sustainability 2021, 13, 8399. https://
doi.org/10.3390/su13158399
Academic Editor: Pierfrancesco De
Paola
Received: 4 June 2021
Accepted: 16 July 2021
Published: 28 July 2021
Publisher’s Note: MDPI stays neutral
with regard to jurisdictional claims in
published maps and institutional affil-
iations.
Copyright: © 2021 by the authors.
Licensee MDPI, Basel, Switzerland.
This article is an open access article
distributed under the terms and
conditions of the Creative Commons
Attribution (CC BY) license (https://
creativecommons.org/licenses/by/
4.0/).
1 AnL Valuation and Property Consult, Kanda, Accra P.O. Box YK 627, Ghana2 Department of Urban Planning and Management, Faculty of Geo-Information Science and Earth
Observation (ITC), University of Twente, P.O. Box 217, 7500 AE Enschede, The Netherlands;[email protected]
3 Faculty of Planning and Land Management, SDD University of Business and Integrated DevelopmentStudies, Wa P.O. Box WA64, Ghana; [email protected]
* Correspondence: [email protected]
Abstract: Urban blight functions inversely to city development and often leads to cities’ deteriorationin terms of physical beauty and functionality. While the underlying causes of urban blight in thecontext of the global north are mainly known in the literature to be population loss, economicdecline, deindustrialisation and suburbanisation, there is a research gap regarding the root causes ofurban blight in the global south, specifically in prime areas. Given the differences in the propertyrights regimes and economic growth trajectories between the global north and south, the underlyingreasons for urban blight cannot be assumed to be the same. This study, thus, employed a qualitativemethod and case study approach to ascertain in-depth contextual reasons and effects for urbanblight in a prime area, East Legon, Accra-Ghana. Beyond economic reasons, the study found thatsocio-cultural practices of landholding and land transfer in Ghana play an essential role in howblighted properties emerge. In the quest to preserve cultural heritage/identity, successors of oldfamily houses (the ancestral roots) do their best to stay in them without selling or redeveloping them.The findings highlight the less obvious but relevant functions that blighted properties play in the citycore at the micro level of individual families in fostering social cohesion and alleviating the needto pay higher rents. Thus, in the global south, we conclude that there is a need to pay attention tothe less obvious roles that so-called blighted properties perform and to move beyond the defaultnegative perception that blighted properties are entirely problematic.
Keywords: urban blight; prime area; customary land tenure; socio-cultural values; Sub-SaharanAfrica; Ghana
1. Introduction
In recent decades, due to the increasing urbanisation and economic development,the demand for urban properties for various purposes, such as residential, commercialand industrial, has increased steadily. However, this increasing demand is hardly uni-form across the city [1]. Prime urban areas are characterised by high property values,quality neighbourhoods and modernised developments. Nevertheless, some prime areassimultaneously experience urban blight in the form of vacant plots of land, abandonedstructures, littered sites and degraded buildings, leading to the deterioration of cities interms of physical beauty and functionality [2,3]. Urban blight is described by Weaver [4] asunderinvestment in real property. This incidence of blight in the city presents an interestingdilemma where properties in prime areas, despite having great potential that can supportuseful developments, lie underused.
The phenomenon of urban blight dates back from cities in the global north, especiallythe United States of America (USA), United Kingdom (UK), and Germany, among others,after the industrial revolution era in the 19th–20th centuries. The incidence of the industrial
Sustainability 2021, 13, 8399. https://doi.org/10.3390/su13158399 https://www.mdpi.com/journal/sustainability
Sustainability 2021, 13, 8399 2 of 24
revolution in the 19th century caused an urban population boom where people migratedto the urban cities due to employment in manufacturing industries [5,6]. The subsequenteconomic decline resulted in urban cities becoming economically vulnerable, with indus-tries collapsing, businesses decreasing and people losing their jobs [6]. Ultimately, thesecities experienced physical and functional stagnation as real property, mainly of a resi-dential and commercial type, became obsolete, with high vacancy ratios and a decline inmaintenance [3]. Although several studies have investigated the main causes of urbanblight in the global north to be population loss, deindustrialisation, economic declineand sub-urbanisation, few of such studies exist in the global south, predominantly inSub-Saharan Africa (SSA). In SSA, land holdings and use practices are not separate entitiesfrom people and their belief systems but are constitutive and embedded in customary landtenure systems [7,8].
Different terminologies are used in describing cities’ deterioration. For this study,the nuances of urban blight; urban decline, shrinkage and decay have been fostered intoa mutual communication notion, “urban blight”. This is because urban blight is a knownconcept in Ghana’s urban land use policy. The current Land Use and Spatial Planning Act2016 (Act 925) provides detailed descriptions of the criteria and the roles of the DistrictAssemblies in tackling urban blight [9].
Specifically in Accra, Ghana’s capital city, Appiahene-Gyamfi [10] argues that thecity is knotted with cultural values; familistic, social lifestyles; and modernisation. Whilesome stakeholders/actors attribute economic value to prime areas, others perceive urbanspaces/properties differently, which do not match the modernised area [11,12]. Apparently,these unmatched properties, viewed as blight, are unevenly distributed within prime areas.While there is the possibility to leverage these blighted properties for the provision ofmodern housing or commercial development, some remain in the same conditions formany years for unknown reasons. Thus, the main question posed by this study is “how canthe existence of distributed pockets of urban blight in a prime area in Accra-Ghana be explained?”.The specific objectives are to determine the distribution of blighted properties in EastLegon and ascertain the reasons from key stakeholders. This paper is structured as follows:Section 2 delves into the theoretical underpinnings and nuances of urban blight, as well asthe perception of values attached to urban spaces. Section 3 describes the methodology.The results are presented in Section 4 and discussed in Section 5. Conclusions are drawn inSection 6.
2. Urban Blight and Value Systems2.1. The Phenomenon of Urban Blight
The genesis of urban blight can be traced to the United States of America (USA).According to Gordon [3], use of the term occurred as early as 1918 in Philadelphia, wherea planner described blight as an unbefitting district. This notwithstanding, different statesin the USA fashioned their urban blight description based on peculiarities or uniqueness intheir jurisdiction. For instance, Missouri state pronounced urban blight as overcrowding,inadequate light, ventilation and lack of sanitary facilities in an area, whereas New Jerseydescribed urban blight to be abandoned industrial use; substandard, unsafe properties;and vacant lots. Additionally, California state added defective designs, either interior orexterior, to their urban blight description [3].
In the United Kingdom (UK), it was revealed by Haase et al. [13] that urban blightoccurred in major commercial and industrial hub cities, such as Newcastle, Manchester,Liverpool, Birmingham and Glasgow. These cities experienced a population decreaseand economic decline caused by the collapse of well-patronised commercial activities andauxiliary industries. Subsequently, there was suburbanisation, leading to the abandonmentof industrialised cities. Additionally, Germany’s case was likened to that of the UnitedKingdom (UK), which also evolved in the 1980s [14,15]. There was out-migration anddeindustrialisation, resulting in population changes in cities. Nevertheless, in other partsof Europe such as Poland and Romania, the cause of urban blight was quite different.
Sustainability 2021, 13, 8399 3 of 24
According to Haase et al [13], urban blight in Poland and Romania resulted from a decline inthe natural population change, high death rates and ageing of the population in the country.
From the global south perspective, however, existing literature reveals that in LatinAmerican cities—Sao Paulo in Brazil and Guadalajara in Mexico—the causes of urbanblight were similar to the global north. It was reported by Audirac et al. [16] that thecauses of urban blight in these areas result from suburbanisation, deindustrialisation, andpopulation loss. Similarly, in Africa, the most prominent cause of urban blight was thesuburbanisation in South Africa in 1994. This was caused by a complex racial structurewhere a formerly white neighbourhood, Hillbrow, experienced an abandonment of housesby white people. Subsequently, the area was occupied by immigrants with low-incomestatus who could not maintain the high standard of the area [17,18]. Furthermore, a studyconducted by Reckien and Martinez-Fernandez [14] presented social factors to be thedriving force for cities’ blight in the Sub-Saharan African (SSA) region. The social factorsgiven were hunger and epidemics like Human Immunodeficiency Virus Infection andAcquired Immunodeficiency Syndrome (HIV/AIDS). Nevertheless, no thorough expla-nations of the social factors were classified in their study. Many urban cities have issuesrelating to land use and development in Sub-Saharan Africa [19], yet little knowledgeexists regarding the emergence of urban blight. Urban blight is likened to the acceleratedgrowth of urbanisation, which is primarily caused by a high birth rate in urban cities andrural-urban migration. Notably, most of these urban cities were previously indigenoussettlements [20]. Although urbanisation is good and has resulted in modern land useand development in African cities, rapid urbanisation, on the other hand, has resulted inunsustainable development where high population growth is not matching the existingurban infrastructure, especially housing [21,22]. Subsequently, the inadequate housinginfrastructure has triggered the development of illegal settlements, leading to poor neigh-bourhoods that lack social amenities like water, toilet facilities and garbage bins, amongothers [22]. Neighbourhoods that lack basic infrastructure and are in disorder are alsoregarded as urban blight [3,23,24].
In Ghana, the enforcement of land use policies and laws is tackled by the localgovernment. However, according to Cobbinah and Aboagye [20], the local governmentsdo not have complete control over the enforcement due to the role played by traditionalauthorities in regulating and managing customary lands. They further explained thatthere is an inadequate collaboration between local governments and traditional authorities.Additionally, the current Land Use and Spatial Planning Act 2016 (Act 925) specifies thecriteria for District Assemblies determining blighted properties, irrespective of the landtenure system, as either customary or statutory. Therefore, these criteria, stipulated inSection 103 of Act 925, set the basis and measures for identifying blighted properties in thisstudy. They include:
a. “Irregularity of plots or parcels,b. Inadequacy of street in the vicinity,c. Lack of access to plots or habitable dwelling within the area,d. Diversity of existing use which makes development control difficult or impossible,e. Incompatibility with:
i. The existing or proposed useii. The spatial development framework andiii. The structure or local plan,
f. Adverse impact on the environment,g. Overcrowding leading to unhealthy population density,h. Lack of sanitation, drainage or appropriate service,i. High incidence of crime which has been confirmed to be attributable to the type of
development andj. Safety or restriction to other authorised users”

Sustainability 2021, 13, 8399 4 of 24
As characterised by Act 925 [9], several commentators have also categorised urbanblight from different perspectives. Such characterisation efforts enable a more globalunderstanding of what urban blight could be, as well as the dynamics of its manifestationand nature. These are presented in the following section.
2.2. The Nuances of Urban Blight
There is a large body of literature on the deterioration of urban cities with diverseterminologies. The terminologies used in describing cities’ deterioration differ from placeto place, including the descriptions used by urban scholars such as city shrinkage, urbandecay, urban decline, brownfields, or urban blight. However, whilst, on the one hand,Reckien and Martinez-Fernandez [14] assert that these terminologies may mean the samething with regards to cities’ physical characteristics and functioning, Haase et al. [25], onthe other hand, argue that the emphasis and concepts of these terminologies are developedin diverse contexts, times, theoretical frameworks, and empirical backgrounds. Often,deterioration is studied at different geographical levels, either at the city or neighbourhoodlevel. Urban blight is described in terms of real properties and/or urban spaces. Specifically,real properties consider the land and the buildings, while urban spaces are related to entireneighbourhood or city levels. According to Albers [26] in the history of urban planning, thechanging attitudes of the population, which usually means the perspectives and prioritiesranging between neglect and attention, affect the urban fabric, its beauty and landscape.Notably, this manifests in both the global north and south. In the global north, after theindustrial revolution era, businesses declined and people lost their jobs. Subsequently,neighbourhoods became less attractive, experiencing physical and functional stagnation.Residences and commercial buildings have become obsolete, with high vacancy ratiosand less maintenance culture by landlords due to low profits [1]. Livingston et al. [27]argue that there is a lack of inadequate effectiveness from local governments in satisfyingthe needs of such deteriorated neighbourhoods. Despite the level of deterioration, someresidents may remain in the area as a result of low income. In the global south, on the otherhand, Getis [21] argues that the deterioration of cities is partly due to rapid urbanisation.Inadequate housing infrastructure has triggered the development of unauthorised andillegal structures leading to poor neighbourhoods that lack basic social amenities such aswater and toilet facilities [28]. Consequently, urban blight deteriorates cities’ beauty andlandscape [29,30]. The nuances of blight regarding different conditions, physical states,and uses and developments in urban settings, which are deemed contextual, are illustratedin Table 1.
Table 1. A summary of the nuances of urban blight.
The Nuances of Urban Blight Description & Sources from Literature
An idea with regards to the useof real property
Urban blight is described as an idea in the minds of variousstakeholders concerning the condition, use and function ofreal property [21,22].
The lack of basic urbaninfrastructure
Urban blight is an element that is caused by a lack ofinfrastructure [3,22].
Neighbourhood disorder/lackof physical beauty
Many abandoned and deteriorated buildings in thearea [23–25].
Results in physical stagnationThe attributes of urban blight are visually demeaning andaesthetically depressing. This could lead to stagnation of landuse and development in an area [30].
A contributing factor to slumUrban blight is an element that results in a slum [3].Additionally, Breger [2] emphasises that historically, slumswere regarded as blighted areas.
Sustainability 2021, 13, 8399 5 of 24
Table 1. Cont.
The Nuances of Urban Blight Description & Sources from Literature
Comparable to urbandecline/shrinkage
Weaver and Bagchi-Sen [31], Miekley [32] and Hoekveld [33]believe that the leading causes of urban blight from the globalnorth perspective, such as poverty, unemployment, andvacancy, align with urban factors for decline/shrinkage.
The initial stage of urban decay
The severe phase of urban blight is used to describe urbandecay’s commencement [2]. Urban decay as explained byFabiyi [34] is the neglect of the built environment symbolisedby poor urban dwellers unable to repair their old structures.
Authors’ construct (2019).
Urban transformation programmes such as urban renewal and regeneration havebeen developed to reduce urban blight [3]. In the 21st century, however, the SustainableDevelopment Goals (SDG) framework has been established by the United Nations to guidedevelopmental efforts between the years 2015 to 2030 [35]. According to De Vries andVoß [36], a greater percentage of the Sustainable Development Goals (SDG) is relatedto urban land, yet contemporary land management practices are fraught with issues ofvaried value systems. The level of utilisation of urban spaces thus differs regarding values,perceptions, priorities and reasoning [12]. The next section tackles the perception of values(economic, social and cultural) attached to urban spaces. While economic and social valuesare common in both the global north and south, in the global south, especially Sub-SaharanAfrica (SSA), socio-cultural values are embedded in the land tenure systems, which makesthe property rights regime unique and different from that of the global north.
2.3. The Perception of Values Attached to Urban Spaces
Values attached to urban spaces are discussed in this study because the issues of urbanblight may be influenced by varying priorities and perceptions by stakeholders/actors.According to Galster [37], the four main actors who make use of an area are households,property owners, business holders and the local government. The households use theneighbourhood through the occupation of residential units. Additionally, the surroundingenvironments, like recreational facilities, add some form of residential satisfaction andquality to the use of the neighbourhood. Business holders, on the other hand, occupynon-residential facilities yet obtain some monetary value in the form of profit. As wellas this, property owners occupy residential properties themselves or rent real property.Lastly, local governments mainly consume areas through tax revenues and provision ofsocial amenities.
The explanations of the diverse values of the global north and south are described asfollows: predominantly in the global north, the primary values attached to real propertiesare economic and social. Economic value is mainly associated with urban investment,where three of the aforementioned stakeholders of an area—business holders, local gov-ernment and some of the property owners—make certain financial gains from the area.Somerville et al [38] emphasise that the economic structure of a country, real estate market,policies, and the level and nature of public goods and services determine the economicfabric of an area. Additionally, Galster [37] highlights that most of the residential neighbour-hoods in the global north are established through large-scale construction. Nonetheless,the changes that occur afterwards are a result of how stakeholders attach value to the area.Hidalgo and Bernardo [39] therefore argue that the type and level of attachment placed onneighbourhoods and real properties differ in degrees and dimensions. When the level ofsocial values exceed that of economic values, then the attractiveness of the neighbourhoodand needs satisfaction are relatively assessed in comparison with other neighbourhoods byfinancially inclined stakeholders [40]. Ultimately, the decisions taken by wealthy actorsaffect the economic growth and development of the area, as well as the provision of publicresources and services like recreational facilities by the local government. Others who
Sustainability 2021, 13, 8399 6 of 24
normally remain in deteriorated areas are those who attach social values to their urbanspaces [41]. According to Scannell and Gifford [42], there are varied explanations forplace and social attachment due to the cross-cutting nature of the notion in the fields ofpsychology, urban studies and environmental studies. In urban studies, however, placeattachments are regarded as a strong emotional bond and sense of place that a groupor an individual may have concerning a neighbourhood or a real property [41,42]. Thesocial values, as inferred by researchers, are emotional bonds and affections developedover time in an area that results in strong networks and cohesion [42–44]. Additionally,Livingston et al. [41] and Johnston [44] agree that social value is a collective attachment toa place by homogenous people with common backgrounds. Instances of community attach-ment to places in the global north are native settlements such as Maori in New Zealand,Aboriginals in Australia, and Canadian and American Indians. These people believe theirspaces are imbued with the spirit of their ancestors (spiritual identity), thus the need forheritage conservation. While the aforementioned assertion is not different for the globalsouth, specifically in Sub-Saharan Africa (SSA), customary land tenure systems play a sig-nificant role, making up about ninety percent (90%) of landholdings in the region. Asalready mentioned, land holdings and use practices are not a separate entity from peopleand their belief systems but are constitutive and embedded in customary land tenuresystems [7,8].
The conception of land in Sub-Saharan Africa (SSA) is nuanced and transcends thephysical land per se. As described by Elias [45], land in Africa belongs to the living, thedead and the unborn. Sometimes, land is seen as a deity and entity from which peoplederive spiritual identity. A study by Abubakari et al. [8] in the Upper East region ofGhana explicates such spiritual connections with land where the earth priest (Tendaana)pacifies and sanctifies land allocations and transfers. Under customary tenure, the rightto use land in a particular manner is contingent on one’s gender, birth order and positionwithin the social group [8]. Essentially, land is not disconnected from people, but the twoare conflated and hardly separable. The transcendence in the conception of land makescustomary law and practices reflect the exigencies of specific communities, although thereare commonalities as well [30,31]. Thus, customary practices are not a coherent set ofstable rules that apply uniformly across communities but evolve within and vary acrosscommunities [7]. From a system perspective, the embodiment of customary rules canbe likened to a complex adaptive system whereby the actors (members) and the system(customary system) itself evolve, adapt and shape each other in a constantly evolvingmanner [46–48]. Customary lands are not only characterised by a communality in themanner they are held, but they are also characterised by an evolved set of norms andpractices. Such norms and practices define membership and associated rights of land use,restrictions and responsibilities. Members usually have usufructuary interests (superiorrights) and are given portions for their usage and livelihoods such as farming but sometimeswithout rights of disposition [49]. Although urbanisation, modernisation and economicdevelopment have resulted in increasing demand for properties in urban areas, suchtrends are still somewhat influenced by the resilient customary rules and belief systems.Landowners within cities still hold on to their beliefs and practices because of the continuityand preservation of their culture. According to Arko-Adjei [46], customary land tenuresystems are usually unwritten, yet they are passed from one generation to another. Insum, the relationship between people with respect to land is governed by a continuouslyevolving set of rules, which are known within the social groups in which they are practiced.Distinct from statutory rules of tenure, customary rules of tenure are neither written norconsciously formulated at one point in time and are normally enforced within local circles.In the case of Ghana, where the constitution recognises customary law, this provides roomfor forum shopping and strategic choice making on the part of members [50].
Sustainability 2021, 13, 8399 7 of 24
3. Methodology
This study uses a qualitative research strategy coupled with a case study approachbecause the study aims to understand the contextual reasons for urban blight in Sub-Saharan Africa (SSA) in the case of Ghana (see Appendix A for analytical framework).According to Yin [51], the niche of a case study approach is to investigate a contemporaryphenomenon that is labelled as “the case” in the real world. This research approach enablesin-depth understanding of the pertinent contextual circumstances associated with the case.The choice of Ghana makes the study an interesting one to be investigated in SSA. This isbecause Ghana is the first SSA country to ascertain independence from colonisation in 1957and thus the premier country to gain full control of urban planning and land managementby an aboriginal government [52]. Additionally, the concept of urban blight is known inGhana’s urban policy, Land Use and Spatial Planning Act 2016 (Act 925), as previouslymentioned. The research will provide a contextual understanding of urban blight to assistcity planners and government agencies in operationalising urban policies.
3.1. The Study Area
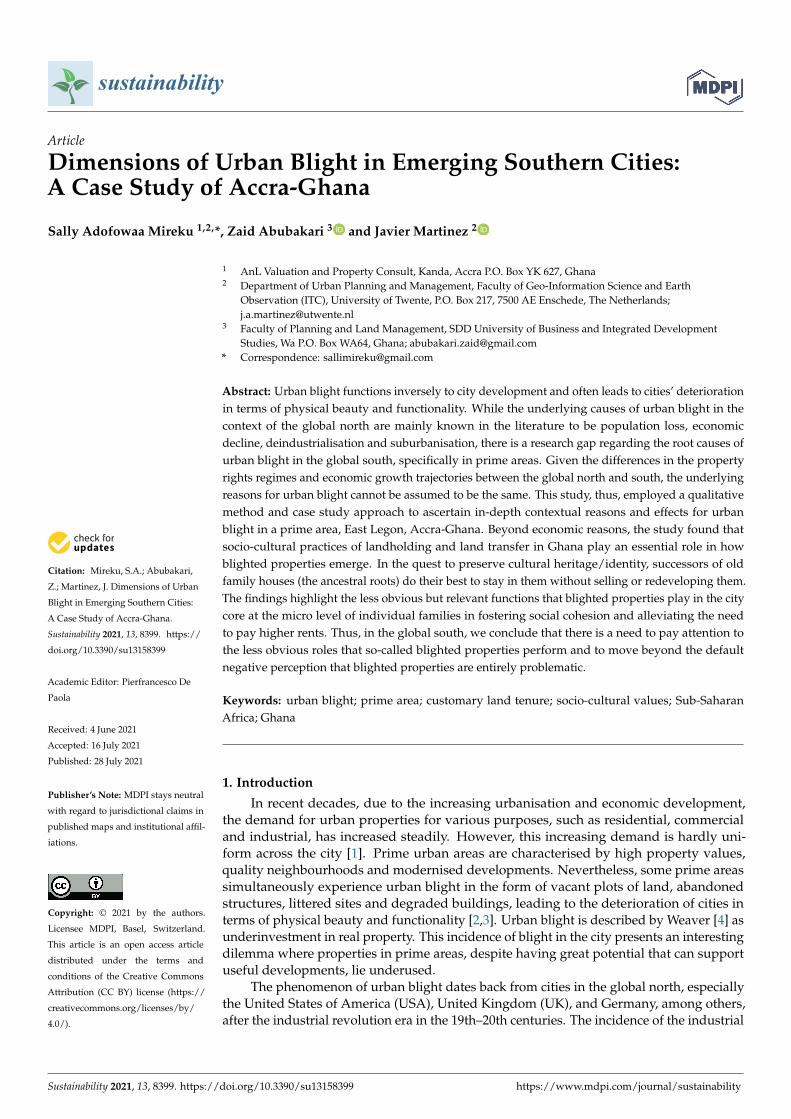
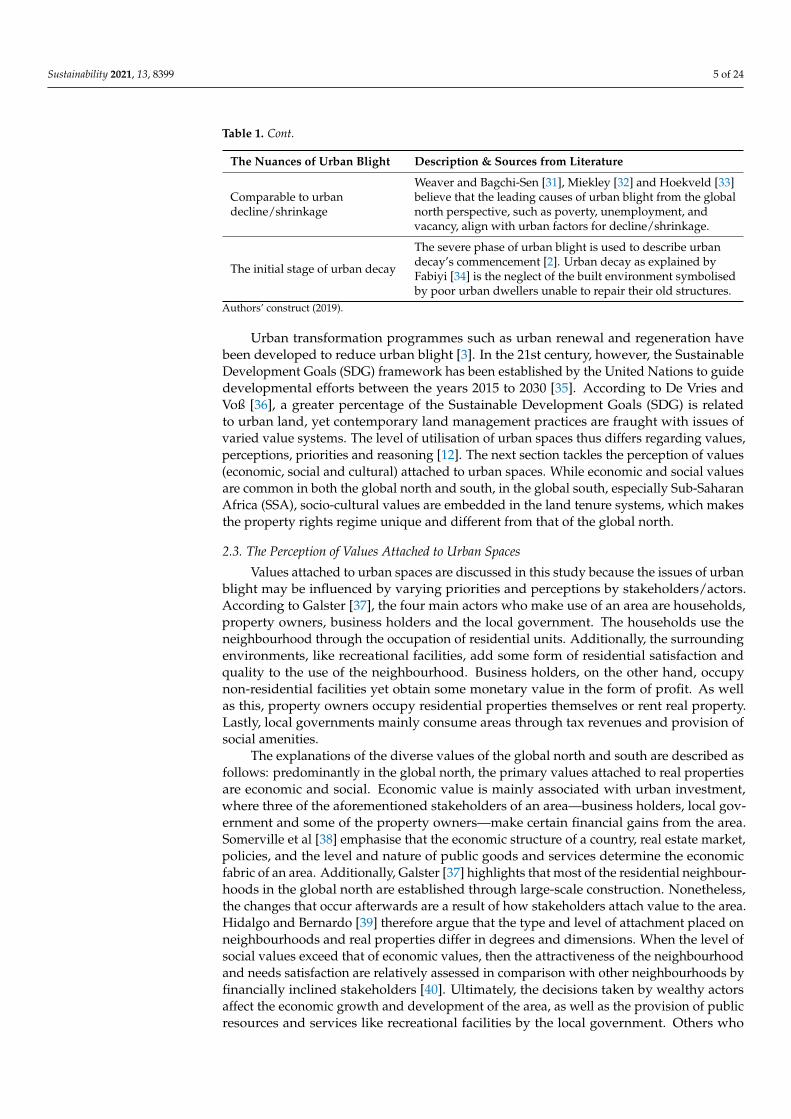
This study is conducted in East Legon, a first-class suburb of Accra. The area measuresapproximately 4.95 square kilometres and falls under the Ayawaso West Municipal As-sembly (AWMA), as shown in Figure 1. It is classified as a first-class area by the Assemblymainly due to good infrastructural facilities, such as roads, water, and electricity, inclusiveof modern developments and major commercial activities. Additionally, it is recognisedas one of Accra’s most expensive areas, with an influx of international businesses andexpatriates [53]. Despite being noted as an affluent area with a high demand for urbanspace, the area is experiencing blight, and some areas have been in the same condition formany years [54]. To understand the nature of urban blight in East Legon, the study wasconducted in phases. These are described in the next section.
Sustainability 2021, 13, x FOR PEER REVIEW 8 of 27
Figure 1. Map of East Legon, Accra-Ghana. Source: Esri Topographical Map and Land Use and Spatial Planning Author-
ity.
Figure 1. Map of East Legon, Accra-Ghana. Source: Esri Topographical Map and Land Use and Spatial Planning Authority.
3.2. Criteria for Identifying Blighted Properties
To identify blighted properties within East Legon, we used a two-stage criteria. Thefirst stage entails definition and characterisation of urban blight, which paves a wayfor the second stage, a visual selection process based on the outcomes of the first stage.
Sustainability 2021, 13, 8399 8 of 24
In the first stage, we traced the characteristics of urban blight from the existing locallaw: Land Use and Spatial Planning Act 2016 (Act 925), as cited earlier in Section 2.1.Characterising urban blight according to the laws of Ghana is necessary to understand thecase of Accra as a typical emerging southern city. A global characterisation would otherwisenot match the local characteristics and thus have the tendency to blur or misrepresentthe local reality/context of how urban blight is understood. We, however, acknowledgethat a comparison between local and global perspectives is imperative to position ourstudy within the discourse on urban blight. Thus, based on the characteristics of urbanblight stipulated in Section 103 of the Land Use and Spatial Planning Act 2016 (Act 925),we categorised the characteristics into four forms of urban blight according to commondescriptions found in literature [23,32,55]. These categorised forms of blight are shown inTable 2.
Table 2. A summary of the criteria for selecting blighted properties in this study.
No. Categorised Forms ofBlight
Criteria According to the Land Use andSpatial Planning Act 2016 (Act 925)
(a)Cluster of disordered
settlements
“Irregularity of plots or parcels”
“Lack of access to plots or habitable dwelling within the area”
“Safety or restriction to the other authorised users”
“Overcrowding leading to unhealthy population density”
“Lack of sanitation, drainage or appropriate service”
(b)Vacant
plot/undeveloped land“Safety or restriction to the other authorised users”
“Adverse impact on the environment”
(c)Single dilapidated
(degraded) property
“Incompatibility with the existing or proposed use; the spatialdevelopment framework; and the structure or local plan”
“Diversity of existing use which makes development controldifficult or impossible”
“Safety or restriction to the other authorised users”
“High incidence of crime which has been confirmed to beattributable to the type of development”
(d) Uncompleted buildings
“Adverse impact on the environment”
“High incidence of crime which has been confirmed to beattributable to the type of development”
In the second stage, we used the categorised forms of blight to identify blightedproperties within East Legon using a virtual neighbourhood audit technique on the GoogleEarth aerial image. Neighbourhood audit on the general land use of an area could bereliably conducted with Google street view since the viewer is given a virtual feeling ofabout 15 m resolution [56]. However, the limitations of this remote observation were thefact that it could only provide the spatial perspective of the blighted properties, whichwas significantly dependent on the spatial resolution. Furthermore, the coverage wasconstrained because not all the streets and landed properties in the area could be viewed inthe aerial images in 3D. Additionally, Pratomo et al. [57] argue that there are uncertaintiesregarding the spatial analysis of blighted areas because of non-observable indicators suchas land tenure. Additionally, Kohli, Sliuzas, and Stein [58] acknowledge that the accuracyof remote sensing techniques for city deterioration requires some level of tacit knowledge.Thus, we augmented the Google Street view with tacit knowledge of the study area andphysical inspections (field investigations).
First, different spots of each category of blight were visually detected on the Googleimage of the study area using visual image interpretation elements such as pattern, shape,and location/association. According to Bakx et al. [59], pattern depicts the spatial arrange-

Sustainability 2021, 13, 8399 9 of 24
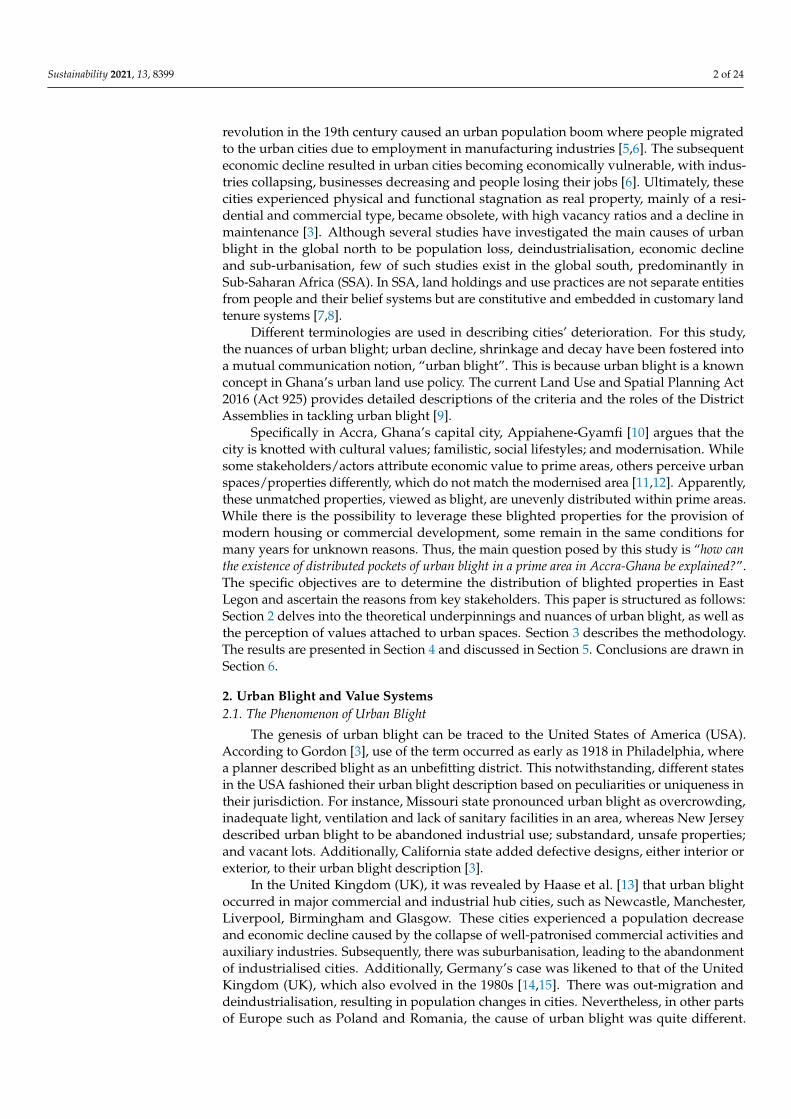
ments of the buildings where there is repetition of form, style, or relationships; shape takesinto consideration the two or three-dimensional projection of the property with GoogleStreet view; association takes into account the relationship between recognisable featuresand other structures. In this study, we used the element of shape to identify uncompletedstructures within the study area; we also used the association of the blighted property withregards to its surroundings to determine single dilapidated/degraded and uncompletedbuildings. Finally, we used pattern and location to determine clusters of disordered settle-ments and vacant plots, respectively. The four categorised forms of blight are illustratedin Figures 2–5 in the subsequent segment. However, during the field visits, some of theproperties initially identified as blight were being developed into ultra-modern structures.This enabled us to further narrow our selection to properties that truly match the differentforms of blight, as categorised in Table 2.
3.2.1. The Aerial Views of the Four Forms of Urban BlightCluster of Disordered Settlements
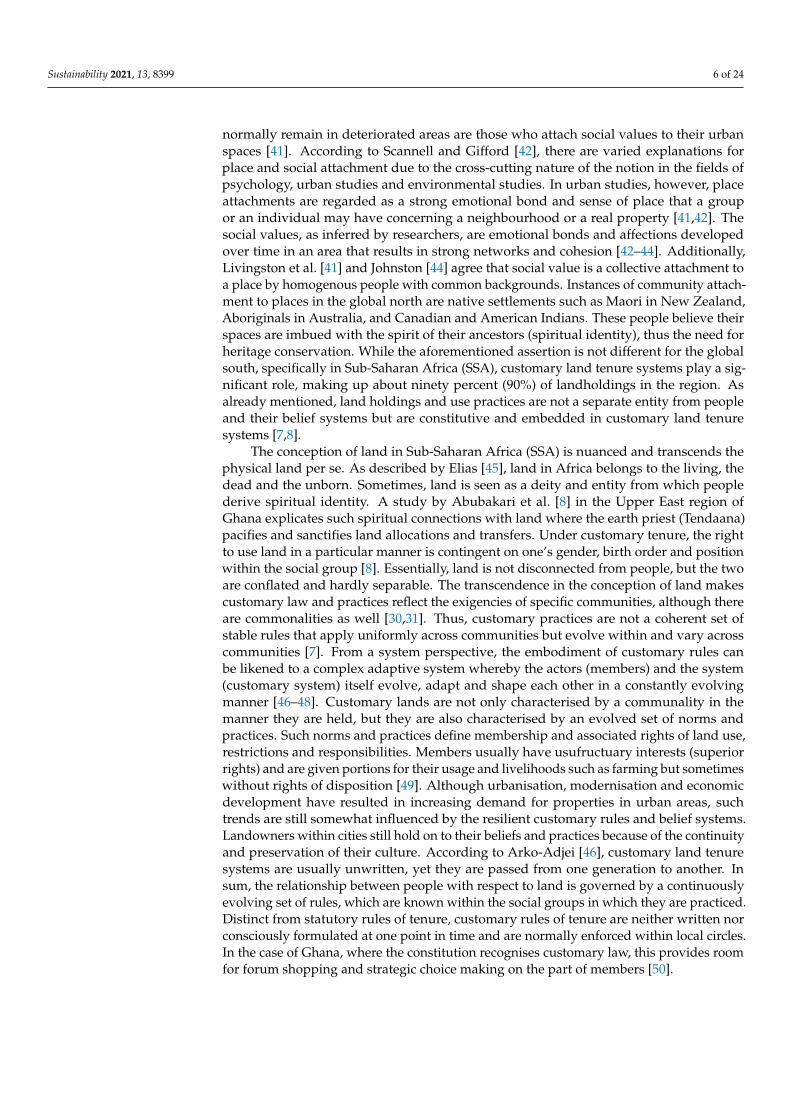
Figure 2 illustrates an aerial view of clusters of disordered settlements with blue dots.The selection of this form of urban blight is based on irregularity of plots, overcrowdingand lack of access to habitable dwellings.
Sustainability 2021, 13, x FOR PEER REVIEW 9 of 25
Earth aerial image. Neighbourhood audit on the general land use of an area could be reli-
ably conducted with Google street view since the viewer is given a virtual feeling of about
15 m resolution [56]. However, the limitations of this remote observation were the fact
that it could only provide the spatial perspective of the blighted properties, which was
significantly dependent on the spatial resolution. Furthermore, the coverage was con-
strained because not all the streets and landed properties in the area could be viewed in
the aerial images in 3D. Additionally, Pratomo et al. [57] argue that there are uncertainties
regarding the spatial analysis of blighted areas because of non-observable indicators such
as land tenure. Additionally, Kohli, Sliuzas, and Stein [58] acknowledge that the accuracy
of remote sensing techniques for city deterioration requires some level of tacit knowledge.
Thus, we augmented the Google Street view with tacit knowledge of the study area and
physical inspections (field investigations).
First, different spots of each category of blight were visually detected on the Google
image of the study area using visual image interpretation elements such as pattern, shape,
and location/association. According to Bakx et al. [59], pattern depicts the spatial arrange-
ments of the buildings where there is repetition of form, style, or relationships; shape takes
into consideration the two or three-dimensional projection of the property with Google
Street view; association takes into account the relationship between recognisable features
and other structures. In this study, we used the element of shape to identify uncompleted
structures within the study area; we also used the association of the blighted property
with regards to its surroundings to determine single dilapidated/degraded and uncom-
pleted buildings. Finally, we used pattern and location to determine clusters of disordered
settlements and vacant plots, respectively. The four categorised forms of blight are illus-
trated in Figures 2–5 in the subsequent segment. However, during the field visits, some of
the properties initially identified as blight were being developed into ultra-modern struc-
tures. This enabled us to further narrow our selection to properties that truly match the
different forms of blight, as categorised in Table 2.
3.2.1. The Aerial Views of the Four Forms of Urban Blight
Cluster of Disordered Settlements
Figure 2 illustrates an aerial view of clusters of disordered settlements with blue dots.
The selection of this form of urban blight is based on irregularity of plots, overcrowding
and lack of access to habitable dwellings.
Figure 2. Aerial view of cluster of disordered settlements. Source: Google Earth 2018 and parcel plan
from Land Use and Spatial Planning Authority.
Vacant Plot of Land
Figure 2. Aerial view of cluster of disordered settlements. Source: Google Earth 2018 and parcel planfrom Land Use and Spatial Planning Authority.
Vacant Plot of Land
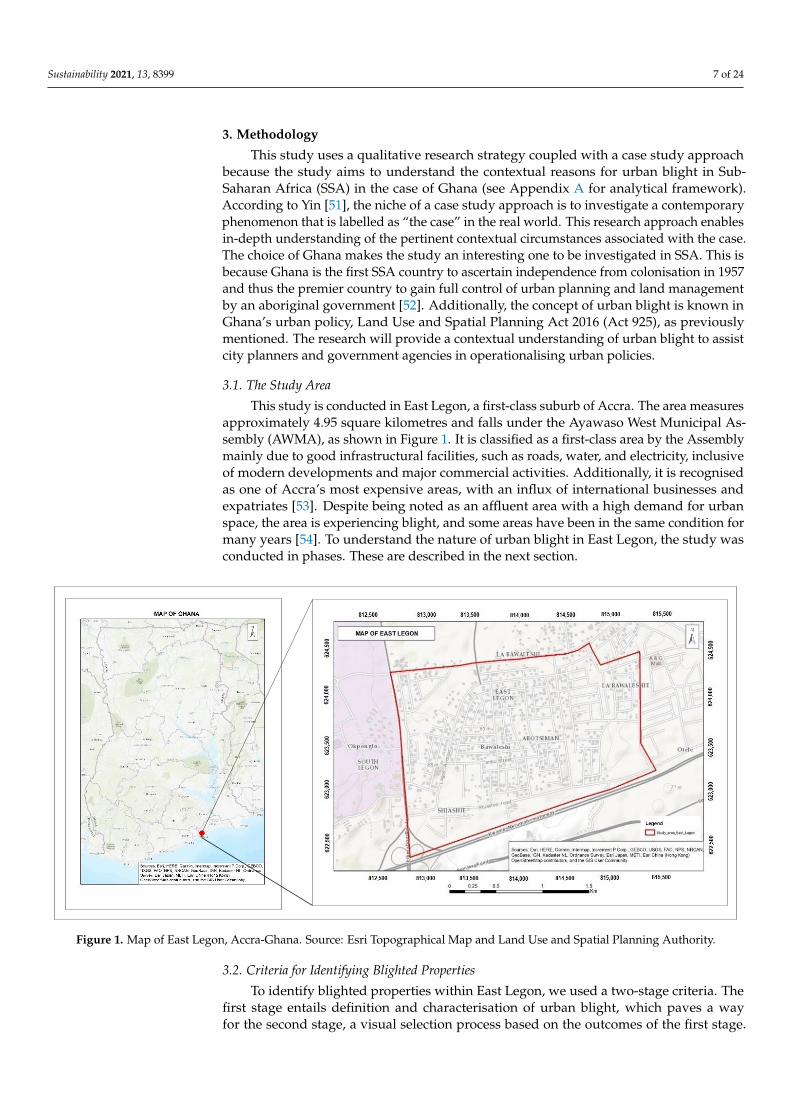
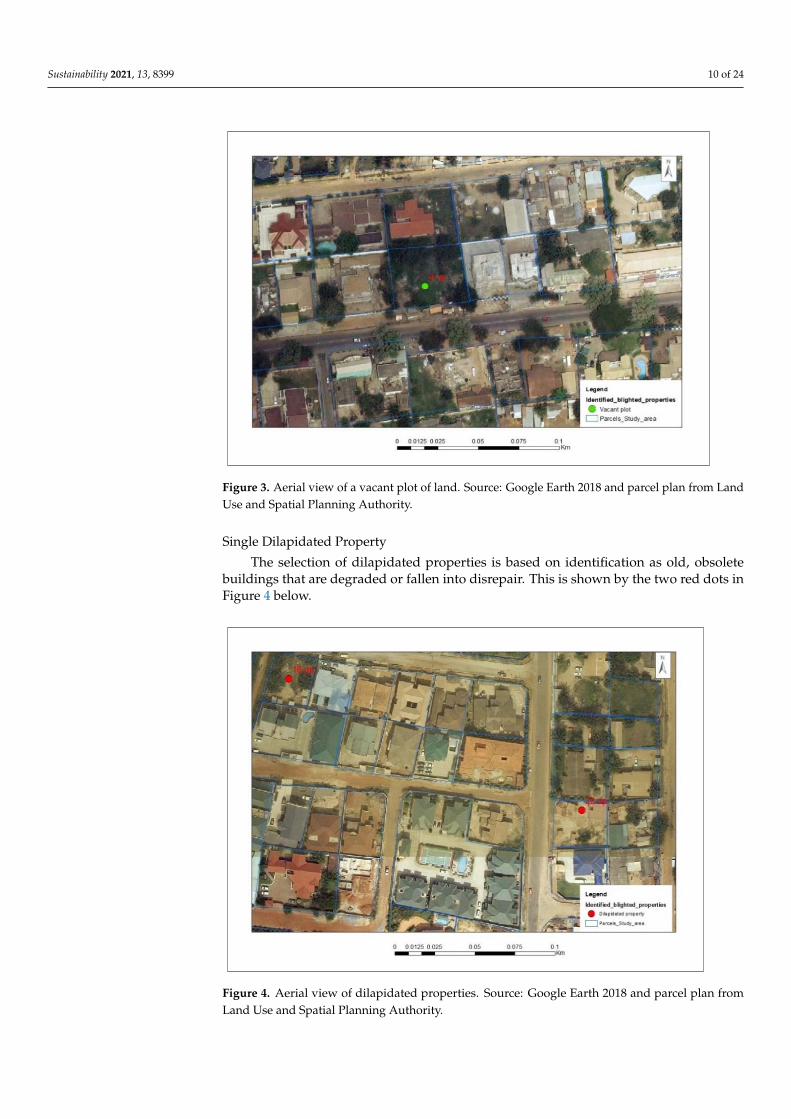
The aerial view of a vacant plot of land surrounded by well-developed properties isshown in Figure 3 with a green dot. The criterion for the selection of vacant plots of land istheir undeveloped nature.
Sustainability 2021, 13, 8399 10 of 24
Sustainability 2021, 13, x FOR PEER REVIEW 10 of 25
The aerial view of a vacant plot of land surrounded by well-developed properties is
shown in Figure 3 with a green dot. The criterion for the selection of vacant plots of land
is their undeveloped nature.
Figure 3. Aerial view of a vacant plot of land. Source: Google Earth 2018 and parcel plan from Land
Use and Spatial Planning Authority.
Single Dilapidated Property
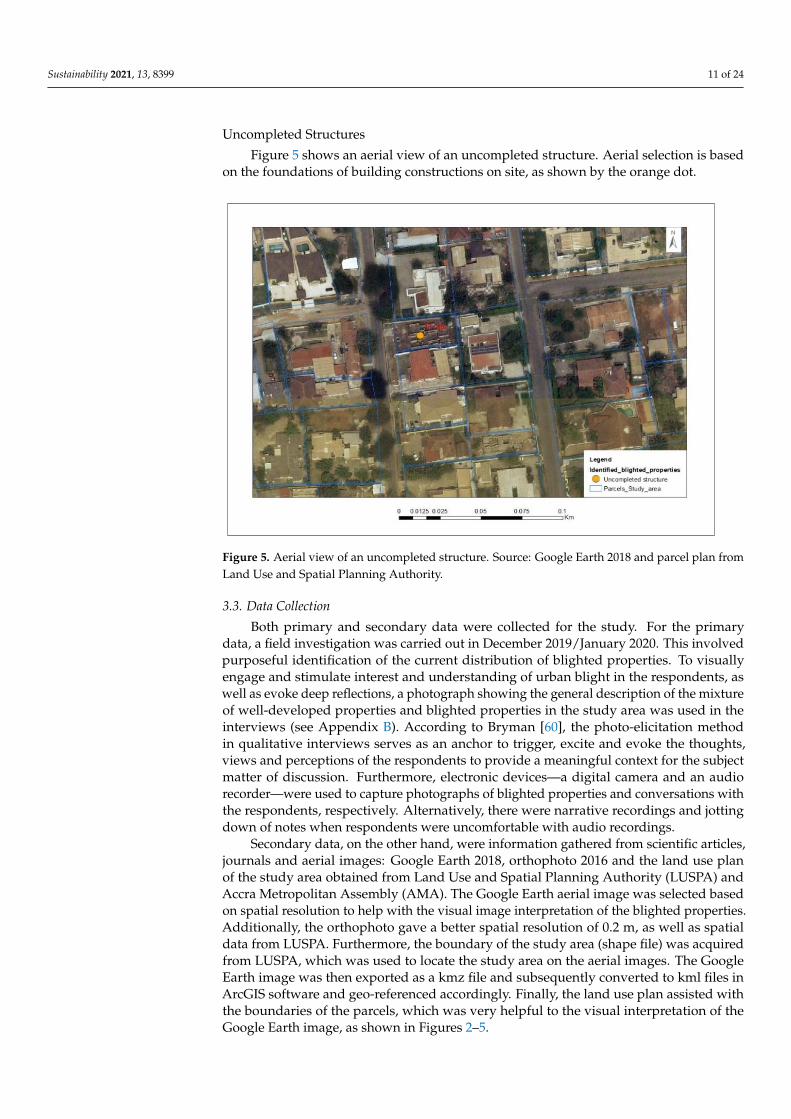
The selection of dilapidated properties is based on identification as old, obsolete
buildings that are degraded or fallen into disrepair. This is shown by the two red dots in
Figure 4 below.
Figure 4. Aerial view of dilapidated properties. Source: Google Earth 2018 and parcel plan from
Land Use and Spatial Planning Authority.
Uncompleted Structures
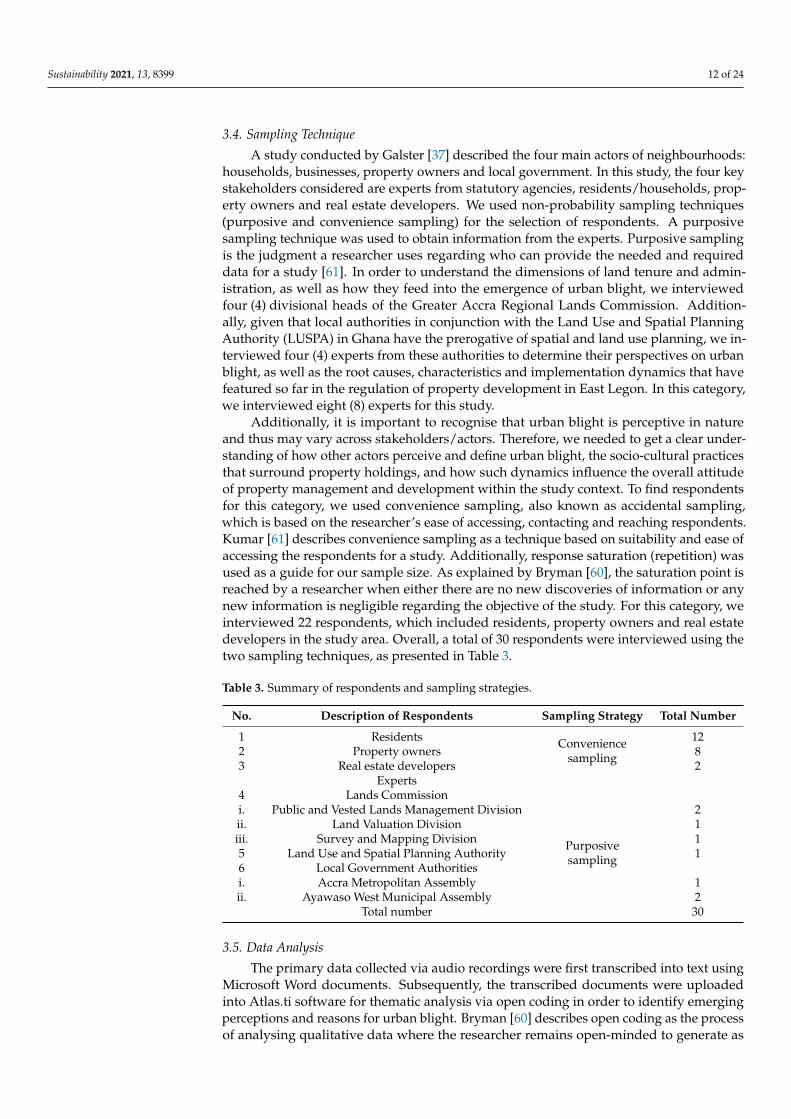
Figure 5 shows an aerial view of an uncompleted structure. Aerial selection is based
on the foundations of building constructions on site, as shown by the orange dot.
Figure 3. Aerial view of a vacant plot of land. Source: Google Earth 2018 and parcel plan from LandUse and Spatial Planning Authority.
Single Dilapidated Property
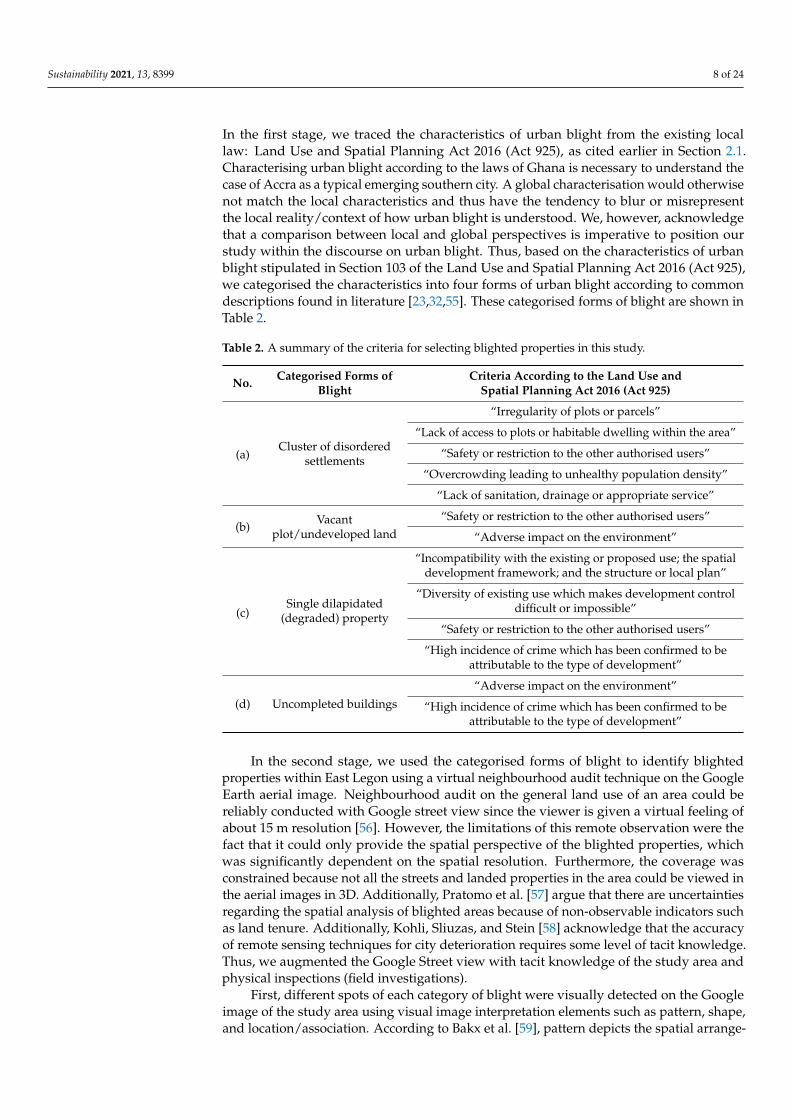
The selection of dilapidated properties is based on identification as old, obsoletebuildings that are degraded or fallen into disrepair. This is shown by the two red dots inFigure 4 below.
Sustainability 2021, 13, x FOR PEER REVIEW 10 of 25
The aerial view of a vacant plot of land surrounded by well-developed properties is
shown in Figure 3 with a green dot. The criterion for the selection of vacant plots of land
is their undeveloped nature.
Figure 3. Aerial view of a vacant plot of land. Source: Google Earth 2018 and parcel plan from Land
Use and Spatial Planning Authority.
Single Dilapidated Property
The selection of dilapidated properties is based on identification as old, obsolete
buildings that are degraded or fallen into disrepair. This is shown by the two red dots in
Figure 4 below.
Figure 4. Aerial view of dilapidated properties. Source: Google Earth 2018 and parcel plan from
Land Use and Spatial Planning Authority.
Uncompleted Structures
Figure 5 shows an aerial view of an uncompleted structure. Aerial selection is based
on the foundations of building constructions on site, as shown by the orange dot.
Figure 4. Aerial view of dilapidated properties. Source: Google Earth 2018 and parcel plan fromLand Use and Spatial Planning Authority.
Sustainability 2021, 13, 8399 11 of 24
Uncompleted Structures
Figure 5 shows an aerial view of an uncompleted structure. Aerial selection is basedon the foundations of building constructions on site, as shown by the orange dot.
Sustainability 2021, 13, x FOR PEER REVIEW 11 of 25
Figure 5. Aerial view of an uncompleted structure. Source: Google Earth 2018 and parcel plan from
Land Use and Spatial Planning Authority.
3.3. Data Collection
Both primary and secondary data were collected for the study. For the primary data,
a field investigation was carried out in December 2019/January 2020. This involved pur-
poseful identification of the current distribution of blighted properties. To visually engage
and stimulate interest and understanding of urban blight in the respondents, as well as
evoke deep reflections, a photograph showing the general description of the mixture of
well-developed properties and blighted properties in the study area was used in the in-
terviews (see Appendix B). According to Bryman [60], the photo-elicitation method in
qualitative interviews serves as an anchor to trigger, excite and evoke the thoughts, views
and perceptions of the respondents to provide a meaningful context for the subject matter
of discussion. Furthermore, electronic devices—a digital camera and an audio recorder—
were used to capture photographs of blighted properties and conversations with the re-
spondents, respectively. Alternatively, there were narrative recordings and jotting down
of notes when respondents were uncomfortable with audio recordings.
Secondary data, on the other hand, were information gathered from scientific articles,
journals and aerial images: Google Earth 2018, orthophoto 2016 and the land use plan of
the study area obtained from Land Use and Spatial Planning Authority (LUSPA) and Ac-
cra Metropolitan Assembly (AMA). The Google Earth aerial image was selected based on
spatial resolution to help with the visual image interpretation of the blighted properties.
Additionally, the orthophoto gave a better spatial resolution of 0.2 m, as well as spatial
data from LUSPA. Furthermore, the boundary of the study area (shape file) was acquired
from LUSPA, which was used to locate the study area on the aerial images. The Google
Earth image was then exported as a kmz file and subsequently converted to kml files in
ArcGIS software and geo-referenced accordingly. Finally, the land use plan assisted with
the boundaries of the parcels, which was very helpful to the visual interpretation of the
Google Earth image, as shown in Figures 2–5.
3.4. Sampling Technique
A study conducted by Galster [37] described the four main actors of neighbourhoods:
households, businesses, property owners and local government. In this study, the four
key stakeholders considered are experts from statutory agencies, residents/households,
property owners and real estate developers. We used non-probability sampling tech-
Figure 5. Aerial view of an uncompleted structure. Source: Google Earth 2018 and parcel plan fromLand Use and Spatial Planning Authority.
3.3. Data Collection
Both primary and secondary data were collected for the study. For the primarydata, a field investigation was carried out in December 2019/January 2020. This involvedpurposeful identification of the current distribution of blighted properties. To visuallyengage and stimulate interest and understanding of urban blight in the respondents, aswell as evoke deep reflections, a photograph showing the general description of the mixtureof well-developed properties and blighted properties in the study area was used in theinterviews (see Appendix B). According to Bryman [60], the photo-elicitation methodin qualitative interviews serves as an anchor to trigger, excite and evoke the thoughts,views and perceptions of the respondents to provide a meaningful context for the subjectmatter of discussion. Furthermore, electronic devices—a digital camera and an audiorecorder—were used to capture photographs of blighted properties and conversations withthe respondents, respectively. Alternatively, there were narrative recordings and jottingdown of notes when respondents were uncomfortable with audio recordings.
Secondary data, on the other hand, were information gathered from scientific articles,journals and aerial images: Google Earth 2018, orthophoto 2016 and the land use planof the study area obtained from Land Use and Spatial Planning Authority (LUSPA) andAccra Metropolitan Assembly (AMA). The Google Earth aerial image was selected basedon spatial resolution to help with the visual image interpretation of the blighted properties.Additionally, the orthophoto gave a better spatial resolution of 0.2 m, as well as spatialdata from LUSPA. Furthermore, the boundary of the study area (shape file) was acquiredfrom LUSPA, which was used to locate the study area on the aerial images. The GoogleEarth image was then exported as a kmz file and subsequently converted to kml files inArcGIS software and geo-referenced accordingly. Finally, the land use plan assisted withthe boundaries of the parcels, which was very helpful to the visual interpretation of theGoogle Earth image, as shown in Figures 2–5.
Sustainability 2021, 13, 8399 12 of 24
3.4. Sampling Technique
A study conducted by Galster [37] described the four main actors of neighbourhoods:households, businesses, property owners and local government. In this study, the four keystakeholders considered are experts from statutory agencies, residents/households, prop-erty owners and real estate developers. We used non-probability sampling techniques(purposive and convenience sampling) for the selection of respondents. A purposivesampling technique was used to obtain information from the experts. Purposive samplingis the judgment a researcher uses regarding who can provide the needed and requireddata for a study [61]. In order to understand the dimensions of land tenure and admin-istration, as well as how they feed into the emergence of urban blight, we interviewedfour (4) divisional heads of the Greater Accra Regional Lands Commission. Addition-ally, given that local authorities in conjunction with the Land Use and Spatial PlanningAuthority (LUSPA) in Ghana have the prerogative of spatial and land use planning, we in-terviewed four (4) experts from these authorities to determine their perspectives on urbanblight, as well as the root causes, characteristics and implementation dynamics that havefeatured so far in the regulation of property development in East Legon. In this category,we interviewed eight (8) experts for this study.
Additionally, it is important to recognise that urban blight is perceptive in natureand thus may vary across stakeholders/actors. Therefore, we needed to get a clear under-standing of how other actors perceive and define urban blight, the socio-cultural practicesthat surround property holdings, and how such dynamics influence the overall attitudeof property management and development within the study context. To find respondentsfor this category, we used convenience sampling, also known as accidental sampling,which is based on the researcher’s ease of accessing, contacting and reaching respondents.Kumar [61] describes convenience sampling as a technique based on suitability and ease ofaccessing the respondents for a study. Additionally, response saturation (repetition) wasused as a guide for our sample size. As explained by Bryman [60], the saturation point isreached by a researcher when either there are no new discoveries of information or anynew information is negligible regarding the objective of the study. For this category, weinterviewed 22 respondents, which included residents, property owners and real estatedevelopers in the study area. Overall, a total of 30 respondents were interviewed using thetwo sampling techniques, as presented in Table 3.
Table 3. Summary of respondents and sampling strategies.
No. Description of Respondents Sampling Strategy Total Number
1 Residents Conveniencesampling
122 Property owners 83 Real estate developers 2
Experts4 Lands Commission
Purposivesampling
i. Public and Vested Lands Management Division 2ii. Land Valuation Division 1iii. Survey and Mapping Division 15 Land Use and Spatial Planning Authority 16 Local Government Authoritiesi. Accra Metropolitan Assembly 1ii. Ayawaso West Municipal Assembly 2
Total number 30
3.5. Data Analysis
The primary data collected via audio recordings were first transcribed into text usingMicrosoft Word documents. Subsequently, the transcribed documents were uploadedinto Atlas.ti software for thematic analysis via open coding in order to identify emergingperceptions and reasons for urban blight. Bryman [60] describes open coding as the processof analysing qualitative data where the researcher remains open-minded to generate as
Sustainability 2021, 13, 8399 13 of 24
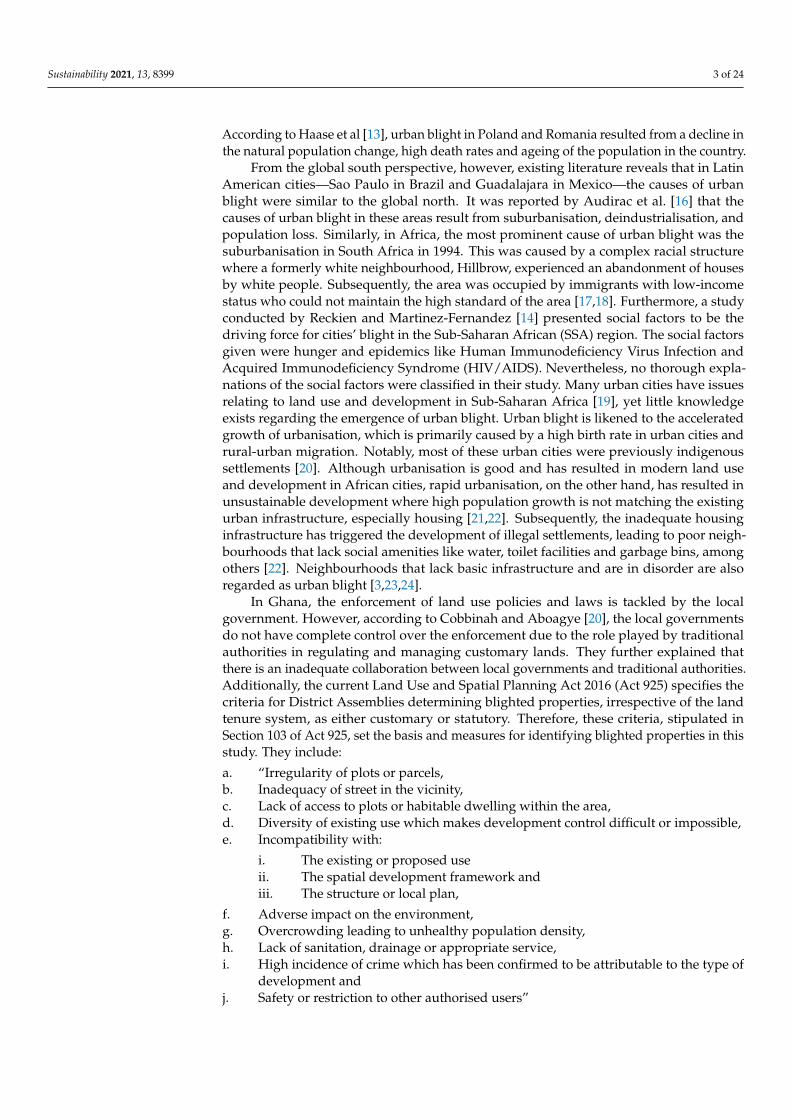
many ideas as possible as well as make meaning out of the data collected by breakingdown, comparing and categorising the data into themes. Additionally, the secondary dataobtained from the land-use plan (local plan) and the aerial images were used to generatemaps using ArcGIS software, as illustrated in Figures 2–6.
Sustainability 2021, 13, x FOR PEER REVIEW 13 of 25
3.5. Data Analysis
The primary data collected via audio recordings were first transcribed into text using
Microsoft Word documents. Subsequently, the transcribed documents were uploaded
into Atlas.ti software for thematic analysis via open coding in order to identify emerging
perceptions and reasons for urban blight. Bryman [60] describes open coding as the pro-
cess of analysing qualitative data where the researcher remains open-minded to generate
as many ideas as possible as well as make meaning out of the data collected by breaking
down, comparing and categorising the data into themes. Additionally, the secondary data
obtained from the land-use plan (local plan) and the aerial images were used to generate
maps using ArcGIS software, as illustrated in Figures 2–6.
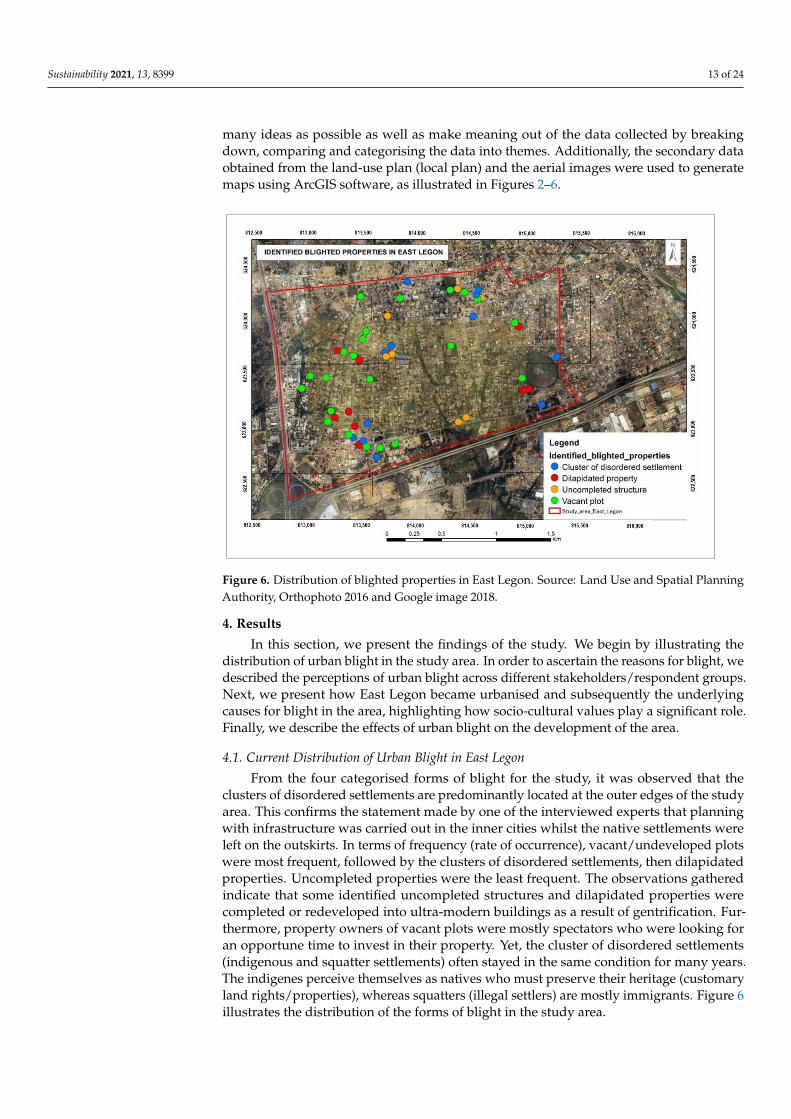
Figure 6. Distribution of blighted properties in East Legon. Source: Land Use and Spatial Planning
Authority, Orthophoto 2016 and Google image 2018.
4. Results
In this section, we present the findings of the study. We begin by illustrating the dis-
tribution of urban blight in the study area. In order to ascertain the reasons for blight, we
described the perceptions of urban blight across different stakeholders/respondent
groups. Next, we present how East Legon became urbanised and subsequently the under-
lying causes for blight in the area, highlighting how socio-cultural values play a significant
role. Finally, we describe the effects of urban blight on the development of the area.
4.1. Current Distribution of Urban Blight in East Legon
From the four categorised forms of blight for the study, it was observed that the clus-
ters of disordered settlements are predominantly located at the outer edges of the study
area. This confirms the statement made by one of the interviewed experts that planning
with infrastructure was carried out in the inner cities whilst the native settlements were
left on the outskirts. In terms of frequency (rate of occurrence), vacant/undeveloped plots
were most frequent, followed by the clusters of disordered settlements, then dilapidated
properties. Uncompleted properties were the least frequent. The observations gathered
indicate that some identified uncompleted structures and dilapidated properties were
completed or redeveloped into ultra-modern buildings as a result of gentrification. Fur-
thermore, property owners of vacant plots were mostly spectators who were looking for
Figure 6. Distribution of blighted properties in East Legon. Source: Land Use and Spatial PlanningAuthority, Orthophoto 2016 and Google image 2018.
4. Results
In this section, we present the findings of the study. We begin by illustrating thedistribution of urban blight in the study area. In order to ascertain the reasons for blight, wedescribed the perceptions of urban blight across different stakeholders/respondent groups.Next, we present how East Legon became urbanised and subsequently the underlyingcauses for blight in the area, highlighting how socio-cultural values play a significant role.Finally, we describe the effects of urban blight on the development of the area.
4.1. Current Distribution of Urban Blight in East Legon
From the four categorised forms of blight for the study, it was observed that theclusters of disordered settlements are predominantly located at the outer edges of the studyarea. This confirms the statement made by one of the interviewed experts that planningwith infrastructure was carried out in the inner cities whilst the native settlements wereleft on the outskirts. In terms of frequency (rate of occurrence), vacant/undeveloped plotswere most frequent, followed by the clusters of disordered settlements, then dilapidatedproperties. Uncompleted properties were the least frequent. The observations gatheredindicate that some identified uncompleted structures and dilapidated properties werecompleted or redeveloped into ultra-modern buildings as a result of gentrification. Fur-thermore, property owners of vacant plots were mostly spectators who were looking foran opportune time to invest in their property. Yet, the cluster of disordered settlements(indigenous and squatter settlements) often stayed in the same condition for many years.The indigenes perceive themselves as natives who must preserve their heritage (customaryland rights/properties), whereas squatters (illegal settlers) are mostly immigrants. Figure 6illustrates the distribution of the forms of blight in the study area.
Sustainability 2021, 13, 8399 14 of 24
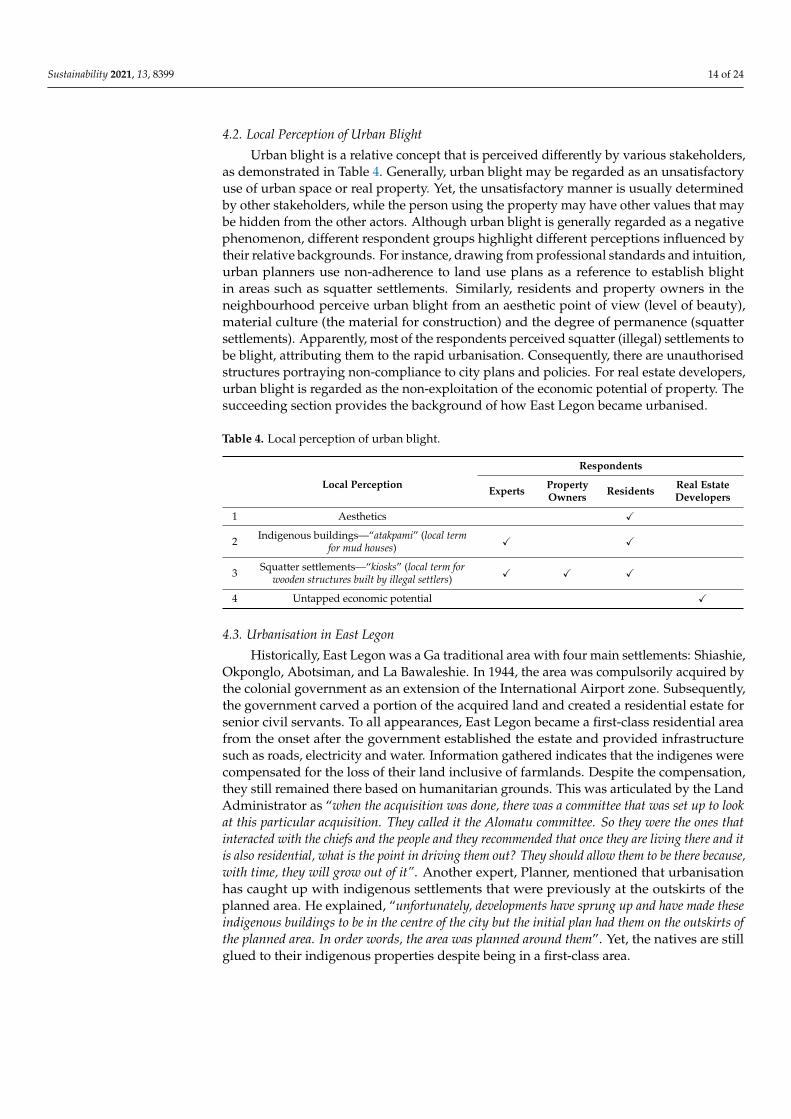
4.2. Local Perception of Urban Blight
Urban blight is a relative concept that is perceived differently by various stakeholders,as demonstrated in Table 4. Generally, urban blight may be regarded as an unsatisfactoryuse of urban space or real property. Yet, the unsatisfactory manner is usually determinedby other stakeholders, while the person using the property may have other values that maybe hidden from the other actors. Although urban blight is generally regarded as a negativephenomenon, different respondent groups highlight different perceptions influenced bytheir relative backgrounds. For instance, drawing from professional standards and intuition,urban planners use non-adherence to land use plans as a reference to establish blightin areas such as squatter settlements. Similarly, residents and property owners in theneighbourhood perceive urban blight from an aesthetic point of view (level of beauty),material culture (the material for construction) and the degree of permanence (squattersettlements). Apparently, most of the respondents perceived squatter (illegal) settlements tobe blight, attributing them to the rapid urbanisation. Consequently, there are unauthorisedstructures portraying non-compliance to city plans and policies. For real estate developers,urban blight is regarded as the non-exploitation of the economic potential of property. Thesucceeding section provides the background of how East Legon became urbanised.
Table 4. Local perception of urban blight.
Local Perception
Respondents
Experts PropertyOwners Residents Real Estate
Developers
1 Aesthetics X
2 Indigenous buildings—“atakpami” (local termfor mud houses) X X
3 Squatter settlements—“kiosks” (local term forwooden structures built by illegal settlers) X X X
4 Untapped economic potential X
4.3. Urbanisation in East Legon
Historically, East Legon was a Ga traditional area with four main settlements: Shiashie,Okponglo, Abotsiman, and La Bawaleshie. In 1944, the area was compulsorily acquired bythe colonial government as an extension of the International Airport zone. Subsequently,the government carved a portion of the acquired land and created a residential estate forsenior civil servants. To all appearances, East Legon became a first-class residential areafrom the onset after the government established the estate and provided infrastructuresuch as roads, electricity and water. Information gathered indicates that the indigenes werecompensated for the loss of their land inclusive of farmlands. Despite the compensation,they still remained there based on humanitarian grounds. This was articulated by the LandAdministrator as “when the acquisition was done, there was a committee that was set up to lookat this particular acquisition. They called it the Alomatu committee. So they were the ones thatinteracted with the chiefs and the people and they recommended that once they are living there and itis also residential, what is the point in driving them out? They should allow them to be there because,with time, they will grow out of it”. Another expert, Planner, mentioned that urbanisationhas caught up with indigenous settlements that were previously at the outskirts of theplanned area. He explained, “unfortunately, developments have sprung up and have made theseindigenous buildings to be in the centre of the city but the initial plan had them on the outskirts ofthe planned area. In order words, the area was planned around them”. Yet, the natives are stillglued to their indigenous properties despite being in a first-class area.
Sustainability 2021, 13, 8399 15 of 24
4.4. The Underlying Reasons for Urban Blight in East Legon4.4.1. Socio-Cultural Values Attached to Real Property
Socio-cultural values are expressed with deep emotions and intense feelings. Theyconcern traditional and emotional attachments that are not monetary based. It was also es-tablished that some properties were named after their ancestors, which had to be preservedfor future generations. As it was aptly put by one respondent, “We have stayed in what ourgreat grandparents built for us. We are also supposed to leave a legacy for generations to come”.Another indigene explained, “When the property is there, it is immovable . . . anyone who knowsthe family and wants to trace the family can easily do that because of the property such as somebodywho has travelled overseas, he can easily locate the family”. Traditionally, it is believed that realproperty provides the family lineage and ancestral background of a person. Additionally,people hold on to property as a result of the lasting memories established there. Onerespondent said, “This building was put up by our grandmother . . . So we have to preserve hermemory for now”. Furthermore, it was recognised that some properties serve as a bolster forlife where family members could live, work and go about their daily activities with lessstress and traffic than living in the outskirts. As expressed by one respondent; “they can bein town and transact their activities and businesses, have a place to lay their heads and start lifebefore they go and find their own places . . . development is good but money came to meet humanbeings. We value human beings and their livelihood, where they will lay their heads, go to workrather than somebody giving you money to take your property”.
4.4.2. Customary Land Control Versus Weak Enforcement of Urban Policies
The spontaneous growth of urban areas without guiding layouts and land use planshas resulted in urban blight. Experts have expressed concerns that not much can beachieved by enforcing urban policies in native settlements termed as “city villages”. Theseindigenes were the customary land owners and first occupants before the formal planningof areas. Invariably, their settlements are often considered as spontaneous growth, althoughtraditional authorities play a critical role in the land use of their jurisdictions. Thus, land useand developments are ahead of planning in most parts of Ghana. Additionally, the studydiscovered that there are no strict measures for the implementation of urban policies, onlyeviction and clearing of squatters (illegal settlers). Rapid urbanisation has caused a massiveinflux of immigrants into the capital city, Accra. Whenever these squatters are evicted fromtheir unplanned dwellings and the cleared space is left undeveloped, the squatters alwaysgo back to settle there. According to the expert, there was one such experience in early2018: “You know there are recalcitrant people. Even when we cleared them, two (2) to three (3) dayslater we realized some of them were putting up table tops, containers and kiosks that we had brokendown. So whoever is there now, no one has permitted them”. Apparently, after clearing the placein 2018, as at the time of the data collection in December 2019/January 2020, the squatterswere still there.
4.4.3. Land Disputes
The land disputes were mainly associated with inadequate transparency regardingland ownerships. Ghana is characterised by a dual system of land tenure: statutory andcustomary land tenure systems. Most often, conflicting land ownership rights arise amongindividuals, family members, traditional authorities and government institutions, eitherbetween people in the same group or through the involvement of different parties indifferent groups. Eventually, these conflicts result in litigation, creating a huge backlogof land cases in court, some of which have remained unsettled for many years. The LandAdministrator gave an example where the Shiashie family in East Legon instituted a legalcase against the Lands Commission for granting leasehold titles to their land. In April 1999,the High Court ruled the case and granted ownership in favour of the Shiashie family.Subsequently, an appeal was made by the Lands Commission in June 2013, and the casewas overturned and ruled in favour of the Lands Commission. The latter judgment wasbased on evidence provided by the Lands Commission regarding the Certificate of Title

Sustainability 2021, 13, 8399 16 of 24
for compulsory land acquisition under the Public Lands Ordinance (CAP 34) in 1944.Apparently, for fourteen (14) years of litigation, court orders such as injunctions wereplaced on land use and development in the areas under contention. Ultimately, blightedproperties were left in their blighted conditions, especially the vacant/undeveloped plotsand uncompleted structures.
4.4.4. Hybrid Land Tenure and Administration
The process and structures involved in managing and disseminating informationabout the rights and use of land in Ghana are seen to be ineffective by most respondents.Land administration functions cut across both state and non-state (customary) actors. Thereis a binary distinction in the levels of recording across state and customary land. Whilecustomary land tenure system covers about seventy eight percent (78%) of the total landin Ghana, they vary regarding their practices and are mostly undocumented [46,62]. Thelandholding types under customary land tenure systems in Ghana are family, stool andskin. For the study area, the land ownership is both statutory and customary (familylandholding). Due to the inadequate land records, it is difficult to establish certainty ofownership that allows room for fraud and also hinders land transfer. A resident expressedher experience where, in the process of purchasing a blighted property in East Legon,she had to conduct a search at the Lands Commission to ascertain true ownership butnever reached an outcome, so she abandoned it, and to date, the property is still ina blighted condition. She stated, “Land ownership and proof of ownership is difficult in Ghana. . . obtaining information on the ownership alone can take years . . . the whole process is socumbersome”. Additionally, customary land owners in East Legon (families) are discouragedfrom regularsing their interest in the land. Explanations for this unwillingness lie in themechanisms of land rights translation by the Lands Commission. In these processes,the usufructuary rights (superior rights) of families are truncated to leasehold rights,which requires them to pay ground rents (periodic payment of money as a tenant) to theGovernment.
4.4.5. Economic Reasons
Finance is a requisite for property development. While some property owners needcapital for the development of their properties, others, such as speculators, are expectingan opportune time to make financial gains from their properties. In the period of waiting,some do not keep their properties in a good state, and they end up becoming blight. Others,on the other hand, choose caretakers or squatters for safety. However, for the indigenousbuildings, the question that was asked was, whose responsibility is it to provide capitalto develop family property? The indigenous buildings in East Legon are predominantlyfamily properties managed by a family head. By virtue of being a family member, eachperson has the opportunity to use the property. Nevertheless, regarding developmentand maintenance, as was stated by one expert, “The tragedy of the commons happens. Whoshould connect his resources into redeveloping the family property?”. It was found that somefamily members with financial capabilities act independently and prefer acquiring personalproperties for their nuclear family since any investment made on family land automaticallybecomes family property per the laws of Ghana.
4.5. Effects of Urban Blight on Land Use and Development in the Study Area4.5.1. Positive Effects
Instituting the Historical and Cultural Background of the AreaFor the customary landowners, preserving their culture is the main focus. As men-
tioned earlier, East Legon was hitherto a Ga traditional area. It is believed that mosturbanised areas in Accra have indigenous settlements as part of the urban setting. Anexpert explained, “When we take every urban settlement, you see the indigenous settlements aspart of it . . . you know these villages have always existed”. To all appearances, the indigenouspeople have settled to maintain their way of living. One resident responded, “They see

Sustainability 2021, 13, 8399 17 of 24
themselves as they are the owners of the land and they have been there for this long time. It is theirproperty so they take it to be a normal phenomenon so even if you want to develop the place, theywon’t contribute or participate to make it fruitful. They will just say, after all, we have been herealready and we are okay”. Consequently, there is a clear purpose to the present generationholding the land as stewards and leaving a legacy for future generations.
Establishment of Security
For the indigenes and some squatters, the properties, despite their condition, providesecurity. Security was expressed as a state of well-being and safety. It was discovered thatblighted areas are comfortable with less competition. Additionally, the blighted propertieskeep a low profile and do not expose wealth. Some property owners mentioned thatone way to safeguard properties is to keep the exterior of the residence very simple. Hestated, “People look at the exterior of your house to see if there is something valuable. If you look atthis building, you will think that there is nothing valuable inside”. Furthermore, some squatterslive in blighted properties to save money for future investments. One of them revealed,“Most of us, not to say we cannot hire a house. For instance, I cannot hire a house but take moneysay two years advance, Two Thousand, Four Hundred Ghana Cedis (GHC2, 400.00). How muchwill I use to purchase land? I can use part of the money to buy my own land . . . So it is more likewe are also building so we don’t want to make more expenses”.
Companionship
Residents in blighted areas feel friendliness among themselves. Some of the respon-dents expressed that the well-developed properties have fence walls, secured gates withbarbed wires, and dogs to deter strangers. Others have security guards and watchmen whowould question you whenever you get close to their properties. A resident lamented, “Butwhat we see is they only think of themselves and fence their property leaving the others”. However,with the blighted areas, there are no such hindrances. They could visit friends without anyimpediments establishing attachments. An expert explained, “So in terms of people in thesesettlements, there is some connection, some attachment and it is difficult to be broken”.
4.5.2. Negative EffectsAesthetics
Aesthetics concerns the attractiveness of a building. Most of the respondents describedwell-developed properties and gated communities as pleasant, whereas blighted ones wereregarded as being in a poor state. A resident mentioned, “They don’t make the area beautiful. . . but when you get to the gated communities, the buildings alone and the uniformity speak forthemselves that it is a beautiful area . . . it makes the area nice and attractive”. Therefore, blightedproperties deface the brightness and stunning design of the entire area.
Underutilisation of Properties
Underutilisation was described in terms of the economic potential of a property. Thisnegative effect affects some experts, residents, and real estate developers. The expertsmentioned that area classification forms the foundation for property rate. Property rateis described by Asiama [63] as an assessed value of tax levied on real estate propertiesby the local government authorities. Although East Legon is classified as a first-classresidential area, not all properties qualify as such. Thus, it was reported by the experts thatthe revenue generated from blighted properties is low, which means that the propertiesare being underutilised despite having high economic potential. Additionally, it wasdiscovered that blighted properties could reduce the value of adjoining properties ina good state. An example given was the sale of a residential property, which, although ina good state, did not command the actual market price as a result of an adjoining blightedproperty.

Sustainability 2021, 13, 8399 18 of 24
Social Inequality and Tension
Inequalities create tension between two groups: those in well-established develop-ments and others. This affects residents and property owners. It was discovered thatthere is lack of cordial relationships between the two groups. One respondent stated,“There is no uniformity because you see the clear demarcations between the rich and the poor”.Notably, a master–servant relationship is established between the two groups. Anotherperson responded, “You realise that most of these people serve as servants for the rich people”.Furthermore, experts and property owners explained the tendency of privacy intrusion;when a well-developed property, like a high-rise structure, adjoins a blighted one whichis a single storey, there could be privacy invasion. An expert explained, “You have doneyour three bedrooms residential property which is like 30 years old and the next one close to you isa high-rise structure. They are looking into your house and whatever you are doing, they can see”.
Pollution
Air and noise pollution were relatively higher in blighted areas which affects the resi-dents and property owners. This leads to improper waste disposal which contaminates theenvironment and affects the residents’ health. One respondent explained; “these squatterscreate a lot of mess around”. Additionally, some vacant plots were considered unkemptwith filth where people dump refuse. Furthermore, some residents and property ownerscomplained of the squatters causing noise pollution through loud music and dance in theevenings. A property owner gave an articulate account of his experience; “where there aresquatters . . . . . . . . . .they can really disturb when they play their music. The others come aroundand dance and have fun. You cannot complain because of democracy and they are also the majority.At times you will be in the room and feel the vibration. This has a negative effect on us”.
Insecurity
Some of the respondents stated that there was some level of insecurity in the area,whereas others compared East Legon to other areas. In comparison, East Legon is moresecured. Nevertheless, it was observed that the well-established areas within East Legonare secured. The information gathered indicates that some blighted properties could serveas hotspots for criminal activities. Again, a resident shared his experience: “In this stretch,there are thieves around. Personally, we experienced theft of African clothes that were put in a locker.Security in this area is low. They can jump from that spot to my place. The rich only secure theirplaces with security men and guards”.
5. Discussion
This section reflects and juxtaposes the results of the study with the reviewed literature.Substantial comparison is made between the global north and south. Additionally, theimplications of the results of the study on urban land use and policies are considered.
5.1. Urbanisation and Distribution of Blight
Urban blight is generally regarded as a negative phenomenon. However, carefulreflection on the evolution of urban blight in the global north and south, particularly inthe study area, shows an inverse correlation. In the north, a vibrant area was transformedinto a deteriorated one [3,5,20,21], whereas in the south, urbanisation transformed anindigenous area and caused the native settlements to be regarded as blight because theydo not fit the contemporary setting. Again, rapid urbanisation has resulted in squatter(illegal/unauthorised) settlements due to inadequate housing infrastructure, coupled withlack of social amenities [21]. These relationships are not limited to Ghana but more broadlyreflect the character of urban development in Sub-Saharan Africa (SSA) [20,64]. The studyfound that in the history of urban development in SSA, urban cities were once nativesettlements, which concurs with the assertions made by Cobbinah and Aboagye [20]and Clarke [65]. Yet, the cities are planned in an ad hoc manner, where infrastructureis provided in certain areas only by neglecting the native settlements. Additionally, the

Sustainability 2021, 13, 8399 19 of 24
distribution of blight, as illustrated in Figure 6, confirms this, where clusters of disorderedsettlements (indigenous and squatter settlements) are predominantly at the outer edgesof the study area. Again, in terms of frequency, vacant/undeveloped plots were themost prominent, indicating a high degree of land speculation in the area. Furthermore,uncompleted buildings were the least prominent, and it was observed that some identifiedblighted properties were being redeveloped. Consequently, the ideas of urban renewal andgentrification have heightened the transformation of existing developments and so-calledblighted properties into ultra-modern facilities. These ultra-modern facilities have becomethe standard of development for existing buildings to be regarded as blight. Carefulexamination plays an important role in policy development and implementation, with theintention of providing a cosmopolitan community with infrastructure, especially in nativesettlements. However, there should be strict measures to deter the formation of illegalsettlements.
5.2. Reasons for Urban Blight
The primary similarity between the cause of blight in both the global north and southis economic factors. However, economic reasons manifest differently. While in the north,economic factors normally manifest on a macro scale, such as the collapse of industries andbusinesses transforming vibrant cities into abandoned ones, in the south, as in the currentstudy, economic factors largely manifest at the micro level of individual property holders,where, due to lack of finances, properties are not upgraded or left to deteriorate relativeto their surroundings. This agrees with the observations made by Crankshaw et al. [17]and Weaver et al. [31] in their studies in South Africa and North England, respectively,suggesting that low-income residents do not maintain a good neighbourhood, whichleads to physical stagnation. Another dimension of blight influenced by economic factoris the deterioration of the city landscape resulting from land speculation. Weak landadministration coupled with land disputes have caused the property market to be poorlyregulated, with some speculators waiting for an opportune time to invest in their propertyand therefore not keeping their properties in good condition. Instead, they prefer to occupytheir land with squatters as a form of security against adverse claim and encroachment.This therefore confirms the argument made by De Soto [66] that property owners in thesouth are more engrossed in securing their properties by relying on local arrangements.
Additionally, property ownership and/or holdings in the global south are predomi-nantly shrouded in socio-cultural values. As explained by researchers such as Chimhowu [7],Abubakari et al. [8] and Arko-Adjei [46], socio-cultural values have deep roots that notonly regulate the interactions between people but also between people and land. Theconception of property in many parts of Sub-Saharan Africa (SSA) as a communal entitymakes property inseparable from people and also highlights its relevance in establishingone’s identity. This resonates with the study of Abubakari et al. [8], which indicates thatpeople trace their identity over time through land. The north, however, is predominantlybranded with social values, especially in low-income neighbourhoods where place at-tachment is established with mutual dependencies on other residents. Additionally, theglobal north is characterised by few native settlements such as Maori in New Zealand,Aboriginals in Australia, and American and Canadian Indians [42,43]. These northernnative settlements are typically concerned with heritage conservation regarding the spiritof their ancestors rather than embedded socio-cultural values in land ownership and use.Apparently, landholdings are predominantly statutory based.
Furthermore, the global south is characterised by fragmented and complex tenuresystems. Woven layers of subsisting land rights enable different people or parties (forexample, traditional authorities versus government) to lay conflicting claims to landconcurrently. The pluralistic land tenure systems provide avenues for encroachmentgiven the weak capacity on the part of planning authorities [20]. A greater percentage ofland, specifically in the Sub-Saharan Africa (SSA) area, is under the customary land tenuresystem, which is largely undocumented, creating forums for fraud and inefficiency of the

Sustainability 2021, 13, 8399 20 of 24
property market [7,66]. Additionally, customary landholders are deterred from registeringor regularising their interests because of the conversion from freehold to leasehold bythe state land agencies. This confirms the claim made by Abubakari et al. [67] that theformal Land Administration System does not recognise the customary freehold, andhence a greater percentage of the property owners are not documented, leading to landdisputes. However, in the global north, Zevenbergen [68] highlights that security of tenureis guaranteed either through deeds or land title registration.
5.3. Effects of Urban Blight
The main positive effect for both the north and south is place attachment wherecommunity bonds and social networks are established [42–44]. Yet, in the south, culturalvalues are mainly attached to properties [46,49]. Properties are inseparable from peoplewhere there is an intended purpose of leaving a legacy for future generations [46]. Theintention behind this is that the people (future generations) will not lose their identity [8],thus preserving the cultural background of the area. Additionally, the study found thatsome squatters rented kiosks in order to save and establish their own residences. This,however, assigns a positive attribute to squatters, which is not frequently found in lit-erature. On the other hand, the predominant negative effect of blight in the north ishigh criminal activities [14,23], whereas in the south, a dent on aesthetics is the main con-cern. This confirms the arguments made by Kleinhans et al. [43] and Galster [37] thatblighted properties are usually stigmatised when the occupants of blighted properties areless recognised in terms of social status, causing tensions and social imbalances betweenresidents/households.
6. Conclusions
Urban blight is a relative concept that is perceived differently by various actors. Whileurban blight in the global north has been discussed largely from the point of view of itsnegativity in the broader scheme of city planning and infrastructure development [2,3], thecase of East Legon and the global south depict a mixed scenario where urban blight servesa dual function. Whereas urban blight deteriorates the city landscape on a broader level,it also serves the function of promoting cultural heritage for families. More importantly,urban blight in the global south is more nuanced and demonstrates high relativity inwhat might be considered a blighted property, depending on perspective and purpose.As an emerging trend in developing countries, urban planners and city authorities, inpursuit of city gentrification, promote the development of ultra-modern edifices in nativeneighbourhoods, which often renders the existing buildings unfit by emerging and contem-porary standards. Such induced urban blight not only redefines a criterion for developmentbut, in so doing, opens up cultural homogeneity to heterogeneity and cosmopolitanism.Therefore, in the global south, maintaining a balance between the way of life of a peopleand emerging global trends of gentrification is essential as the majority of the populationare economically vulnerable. It is thus important to identify the significant functionsthat so-called blighted properties perform within the city core and how such functionsstrengthen general standards of living and social cohesion. Recognising subtle positivefunctions in the context of southern cities is crucial in shaping the overall discourse onsouthern urbanism. The limitation to this study is that the customary land tenure for thisstudy (family landholding type) may not apply to all areas. Customary practices are nota coherent set of stable rules that can be applied uniformly across communities but evolvewithin and vary across communities [7]. Thus, the influence of land tenure systems onblight may differ because of the pluralistic and varied land tenure systems and practices inthe global south. For further studies, the results of this study can be extrapolated to otherareas (either within Sub-Saharan Africa or any southern city) with different characteristics,since land tenure systems vary from place to place. Additionally, a study on the roleof urban blight and neighbourhood governance in achieving a balance of value systemsshould be conducted.
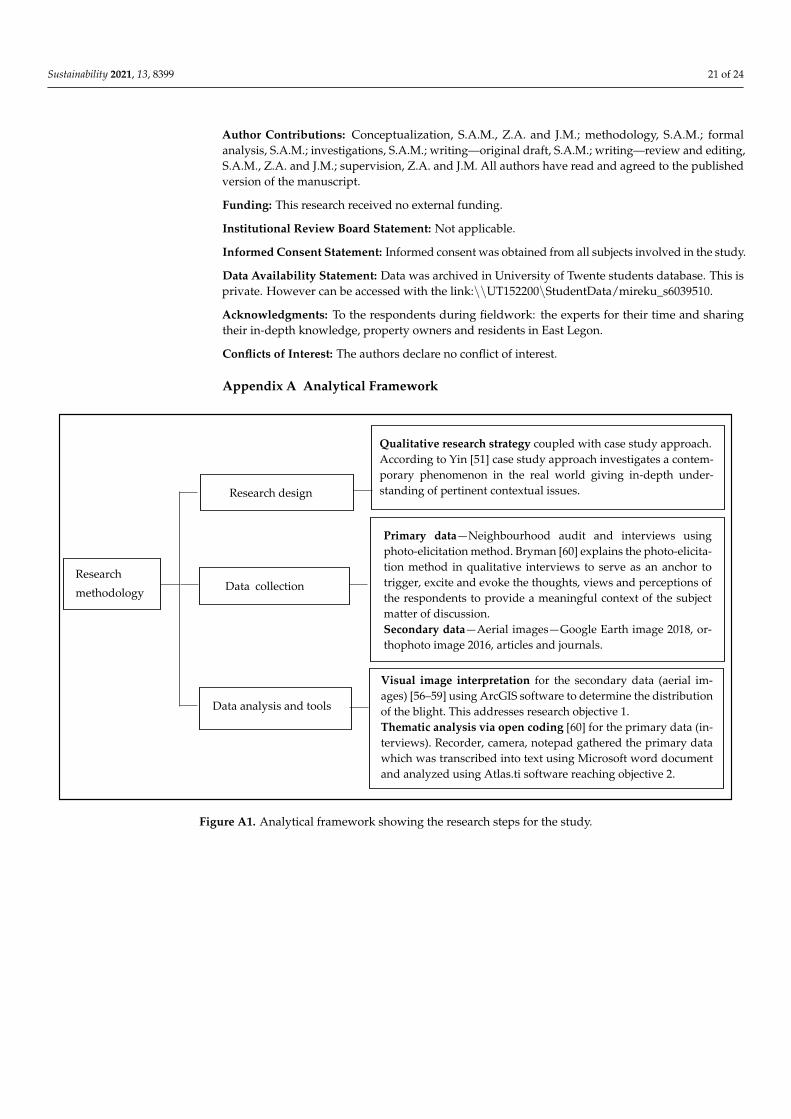
Sustainability 2021, 13, 8399 21 of 24
Author Contributions: Conceptualization, S.A.M., Z.A. and J.M.; methodology, S.A.M.; formalanalysis, S.A.M.; investigations, S.A.M.; writing—original draft, S.A.M.; writing—review and editing,S.A.M., Z.A. and J.M.; supervision, Z.A. and J.M. All authors have read and agreed to the publishedversion of the manuscript.
Funding: This research received no external funding.
Institutional Review Board Statement: Not applicable.
Informed Consent Statement: Informed consent was obtained from all subjects involved in the study.
Data Availability Statement: Data was archived in University of Twente students database. This isprivate. However can be accessed with the link:\\UT152200\StudentData/mireku_s6039510.
Acknowledgments: To the respondents during fieldwork: the experts for their time and sharingtheir in-depth knowledge, property owners and residents in East Legon.
Conflicts of Interest: The authors declare no conflict of interest.
Appendix A Analytical Framework
Sustainability 2021, 13, x FOR PEER REVIEW 22 of 25
Figure A1. Analytical framework showing the research steps for the study.
Qualitative research strategy coupled with case study approach.
According to Yin [51] case study approach investigates a contem-
porary phenomenon in the real world giving in-depth under-
standing of pertinent contextual issues.
Visual image interpretation for the secondary data (aerial im-
ages) [56–59] using ArcGIS software to determine the distribution
of the blight. This addresses research objective 1.
Thematic analysis via open coding [60] for the primary data (in-
terviews). Recorder, camera, notepad gathered the primary data
which was transcribed into text using Microsoft word document
and analyzed using Atlas.ti software reaching objective 2.
Research
methodology
Data analysis and tools
Data collection
Research design
Primary data—Neighbourhood audit and interviews using
photo-elicitation method. Bryman [60] explains the photo-elicita-
tion method in qualitative interviews to serve as an anchor to
trigger, excite and evoke the thoughts, views and perceptions of
the respondents to provide a meaningful context of the subject
matter of discussion.
Secondary data—Aerial images—Google Earth image 2018, or-
thophoto image 2016, articles and journals.
Figure A1. Analytical framework showing the research steps for the study.
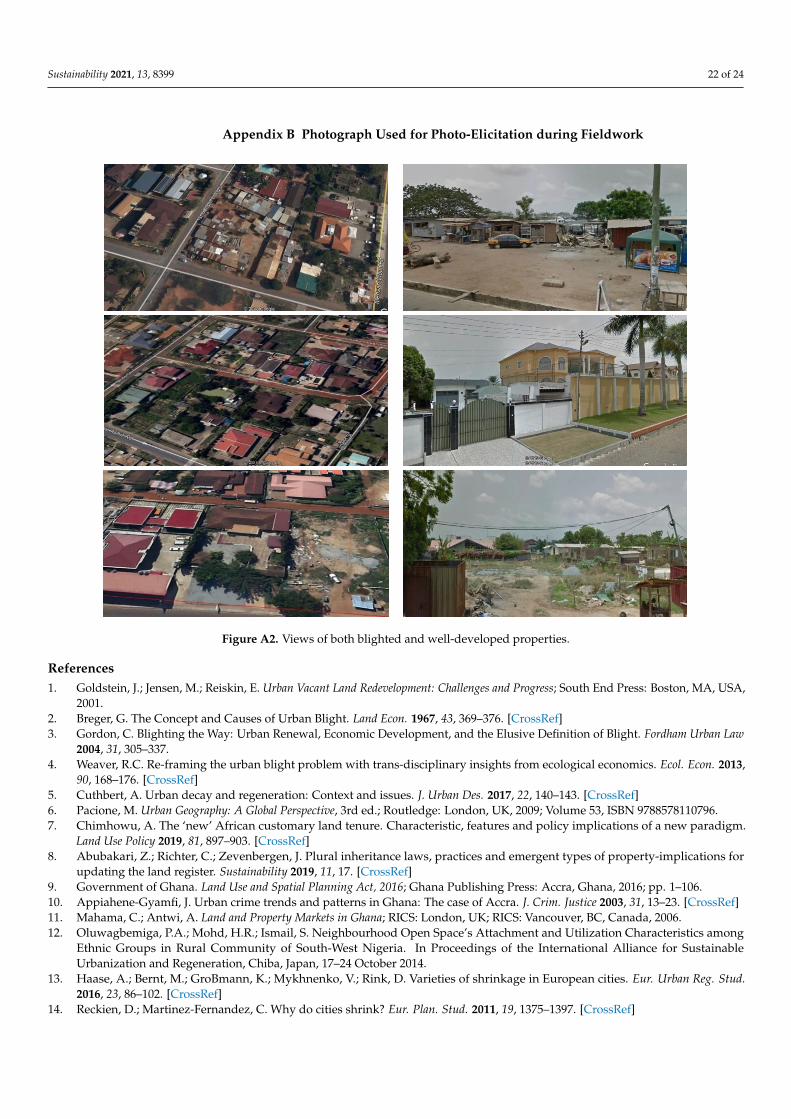
Sustainability 2021, 13, 8399 22 of 24
Appendix B Photograph Used for Photo-Elicitation during Fieldwork
Sustainability 2021, 13, x FOR PEER REVIEW 23 of 25
Appendix B Photograph Used for Photo-Elicitation during Fieldwork
Figure A2. Views of both blighted and well-developed properties.
References
1. Goldstein, J.; Jensen, M.; Reiskin, E. Urban Vacant Land Redevelopment: Challenges and Progress; South End Press: Boston, MA,
USA, 2001.
2. Breger, G. The Concept and Causes of Urban Blight. Land Econ. 1967, 43, 369–376.
3. Gordon, C. Blighting the Way: Urban Renewal, Economic Development, and the Elusive Definition of Blight. Fordham Urban
Law 2004, 31, 305–337.
4. Weaver, R.C. Re-framing the urban blight problem with trans-disciplinary insights from ecological economics. Ecol. Econ. 2013,
90, 168–176.
5. Cuthbert, A. Urban decay and regeneration: Context and issues. J. Urban Des. 2017, 22, 140–143.
6. Pacione, M. Urban Geography: A Global Perspective, 3rd ed.; Routledge: London, UK, 2009; Volume 53, ISBN 9788578110796.
7. Chimhowu, A. The ‘new’ African customary land tenure. Characteristic, features and policy implications of a new paradigm.
Land Use Policy 2019, 81, 897–903.
8. Abubakari, Z.; Richter, C.; Zevenbergen, J. Plural inheritance laws, practices and emergent types of property-implications for
updating the land register. Sustainability 2019, 11, 17.
9. Government of Ghana. Land Use and Spatial Planning Act, 2016; Ghana Publishing Press: Accra, Ghana, 2016; pp. 1–106.
10. Appiahene-Gyamfi, J. Urban crime trends and patterns in Ghana: The case of Accra. J. Crim. Justice 2003, 31, 13–23.
11. Mahama, C.; Antwi, A. Land and Property Markets in Ghana; RICS: London, UK; Vancouver, BC, Canada, 2006;.
Figure A2. Views of both blighted and well-developed properties.
References1. Goldstein, J.; Jensen, M.; Reiskin, E. Urban Vacant Land Redevelopment: Challenges and Progress; South End Press: Boston, MA, USA,
2001.2. Breger, G. The Concept and Causes of Urban Blight. Land Econ. 1967, 43, 369–376. [CrossRef]3. Gordon, C. Blighting the Way: Urban Renewal, Economic Development, and the Elusive Definition of Blight. Fordham Urban Law
2004, 31, 305–337.4. Weaver, R.C. Re-framing the urban blight problem with trans-disciplinary insights from ecological economics. Ecol. Econ. 2013,
90, 168–176. [CrossRef]5. Cuthbert, A. Urban decay and regeneration: Context and issues. J. Urban Des. 2017, 22, 140–143. [CrossRef]6. Pacione, M. Urban Geography: A Global Perspective, 3rd ed.; Routledge: London, UK, 2009; Volume 53, ISBN 9788578110796.7. Chimhowu, A. The ‘new’ African customary land tenure. Characteristic, features and policy implications of a new paradigm.
Land Use Policy 2019, 81, 897–903. [CrossRef]8. Abubakari, Z.; Richter, C.; Zevenbergen, J. Plural inheritance laws, practices and emergent types of property-implications for
updating the land register. Sustainability 2019, 11, 17. [CrossRef]9. Government of Ghana. Land Use and Spatial Planning Act, 2016; Ghana Publishing Press: Accra, Ghana, 2016; pp. 1–106.10. Appiahene-Gyamfi, J. Urban crime trends and patterns in Ghana: The case of Accra. J. Crim. Justice 2003, 31, 13–23. [CrossRef]11. Mahama, C.; Antwi, A. Land and Property Markets in Ghana; RICS: London, UK; RICS: Vancouver, BC, Canada, 2006.12. Oluwagbemiga, P.A.; Mohd, H.R.; Ismail, S. Neighbourhood Open Space’s Attachment and Utilization Characteristics among
Ethnic Groups in Rural Community of South-West Nigeria. In Proceedings of the International Alliance for SustainableUrbanization and Regeneration, Chiba, Japan, 17–24 October 2014.
13. Haase, A.; Bernt, M.; GroBmann, K.; Mykhnenko, V.; Rink, D. Varieties of shrinkage in European cities. Eur. Urban Reg. Stud.2016, 23, 86–102. [CrossRef]
14. Reckien, D.; Martinez-Fernandez, C. Why do cities shrink? Eur. Plan. Stud. 2011, 19, 1375–1397. [CrossRef]

Sustainability 2021, 13, 8399 23 of 24
15. Nelle, A.; Großmann, K.; Haase, D.; Kabisch, S.; Rink, D.; Wolff, M. Urban shrinkage in Germany: An entangled web of conditions,debates and policies. Cities 2017, 69, 116–123. [CrossRef]
16. Audirac, I.; Cunningham-Sabot, E.; Fol, S.; Moraes, S.T. Declining Suburbs in Europe and Latin America. Int. J. Urban Reg. Res.2012, 36, 226–244. [CrossRef]
17. Crankshaw, O.; White, C. Racial Desegregation and Inner City Decay in Johannesburg. Int. J. Urban Reg. Res. 1995, 19, 622–638.[CrossRef]
18. Morris, A. The Desegregation of Hillbrow, Johannesburg, 1978–1982. Urban Stud. 1994, 31, 821–834. [CrossRef]19. Asabere, P.K. The Determinants of Land Values Values in an African City: The Case of Accra, Ghana. Land Econ. 1981, 57, 385–397.
[CrossRef]20. Cobbinah, P.B.; Aboagye, H.N. A Ghanaian twist to urban sprawl. Land Use Policy 2017, 61, 231–241. [CrossRef]21. Getis, A. Analytically derived neighborhoods in a rapidly growing West African city: The case of Accra, Ghana. Habitat Int. 2015,
45, 126–134. [CrossRef] [PubMed]22. Cobbinah, P.B.; Erdiaw-Kwasie, M.O.; Amoateng, P. Africa’s urbanisation: Implications for sustainable development. Cities 2015,
47, 62–72. [CrossRef]23. Ross, C.E.; Mirowsky, J. Disorder and Decay: The Concept and Measurement of Perceived Neighborhood Disorder. Urban Aff.
Rev. 1999, 34, 412–432. [CrossRef]24. Hosseini, A.; Pourahmad, A.; Taeeb, A.; Amini, M.; Behvandi, S. Renewal strategies and neighborhood participation on urban
blight. Int. J. Sustain. Built Environ. 2017, 6, 113–121. [CrossRef]25. Haase, A.; Rink, D.; Grossmann, K.; Bernt, M.; Mykhnenko, V. Conceptualizing urban shrinkage. Environ. Plan. A 2014, 46,
1519–1534. [CrossRef]26. Albers, G. Urban development, maintenance and conservation: Planning in Germany—Values in transition. Plan. Perspect. 2006,
21, 45–65. [CrossRef]27. Livingston, M.; Bailey, N.; Kearns, A. Neighbourhood attachment in deprived areas: Evidence from the north of England. House
Built Environ. 2010, 25, 409–427. [CrossRef]28. Cobbinah, P.B.; Erdiaw-Kwasie, M.O.; Amoateng, P. Rethinking sustainable development within the framework of poverty and
urbanisation in developing countries. Environ. Dev. 2015, 13, 18–32. [CrossRef]29. Amirtahmasebi, R.; Orloff, M.; Wahba, S.; Altman, A. Regenerating Urban Land; Internation Bank for Reconstruction and
Development/The Word Bank: Washington, DC, USA, 2016; ISBN 9781464804731.30. Bales, K. Determinants in the perceptions of visual blight. Hum. Ecol. 1985, 13, 371–387. [CrossRef]31. Weaver, R.C.; Bagchi-Sen, S. Spatial analysis of urban decline: The geography of blight. Appl. Geogr. 2013, 40, 61–70. [CrossRef]32. Miekley, A. Counting Broken Windows: The Pursuit of an Objective Measurement of Blight; University of Cincinnati: Cincinnati, OH, USA,
2008.33. Hoekveld, J.J. Understanding Spatial Differentiation in Urban Decline Levels. Eur. Plan. Stud. 2014, 22, 362–382. [CrossRef]34. Fabiyi, O.O. Analysis of Urban Decay from Low Resolution Satellite Remote Sensing Data: Example from Organic City in Nigeria.
Int. J. Dev. Manag. Rev. 2011, 6, 172–189.35. UN-HABITAT. Sustainable Cities and Communities—SDG Goal 11, Monitoring Framework; UN-HABITAT: Nairobi, Kenya, 2016.36. De Vries, W.T.; Voß, W. Economic Versus Social Values in Land and Property Management: Two Sides of the Same Coin?
Raumforsch. Raumordn. Spat. Res. Plan. 2018, 76, 381–394. [CrossRef]37. Galster, G. On the Nature of Neighbourhood. Urban Stud. 2001, 38, 2111–2124. [CrossRef]38. Somerville, P.; Van Beckhoven, E.; Van Kempen, R. The decline and rise of neighbourhoods: The importance of neighbourhood
governance. Eur. J. Hous. Policy 2009, 9, 25–44. [CrossRef]39. Hidalgo, C.M.; Bernardo, H. Place Attachment: Conceptual and Empirical Questions. J. Environ. Psychol. 2001, 21, 273–281.
[CrossRef]40. Hay, R. Sense of Place in Developmental Context. Environ. Psychol. 1998, 18, 5–29. [CrossRef]41. Livingston, M.; Bailey, N.; Kearns, A. People’s Attachment to Place—The Influence of Neighbourhood Deprivation; Joseph Rowntree
Foundation: York, UK, 2008.42. Scannell, L.; Gifford, R. Defining place attachment: A tripartite organizing framework. J. Environ. Psychol. 2010, 30, 1–10.
[CrossRef]43. Kleinhans, R.; Priemus, H.; Engbersen, G. Understanding Social Capital in Recently Restructured Urban Neighbourhoods: Two
Case Studies in Rotterdam. Urban Stud. 2007, 44, 1069–1091. [CrossRef]44. Johnston, C. What Is Social Value; Technical publications: Canberra, Australia, 1992; Volume 3.45. Elias, T.O. The Nature of African Customary Law; Manchester United Press: Manchester, UK, 1956.46. Arko-Adjei, A. Adapting Land Administration to the Institutional Framework of Customary Tenure. Ph.D. Thesis, University of
Twente, Enschede, The Netherlands, 2011.47. Ubink, J.M.; Quan, J.F. How to combine tradition and modernity? Regulating customary land management in Ghana. Land Use
Policy 2008, 25, 198–213. [CrossRef]48. Mends, T. Customary Land Tenure and Urbanizarion with Case Study on the Peri-Urban Area of Accra, Ghana; International Institute for
Geo-Information Science and Earth Observation: Enschede, The Netherlands, 2006.

Sustainability 2021, 13, 8399 24 of 24
49. Kingwill, R.A. The Map Is not the Territory: Law and Custom in ‘African Freehold’: A South African Case Study. Ph.D. Thesis,University of the Western Cape, Cape Town, South Africa, 2013.
50. Abubakari, Z.; Richter, C.; Zevenbergen, J. Making space legible across three normative frames: The (non-) registration ofinherited land in Ghana. Geoforum 2020, 108, 217–226. [CrossRef]
51. Yin, R. Getting Started: How to Know Whether and When to Use the Case Study as a Research Method. In Case StudyResearch Design and Methods; Knight, V., Young, J., Koscielak, K., Bauhaus, B., Dickens, G., Eds.; Sage Publications, Inc.:Thousand Oakst, CA, USA, 2014; pp. 1–25.
52. Berry, S. Property, Authority and Citizenship: Land Claims, Politics and the Dynamics of Social Division in West Africa. Dev.Change 2009, 40, 23–45. [CrossRef]
53. Anim-Odame, W.K.; Key, T.; Stevenson, S. Measures of real estate values from land registration and valuation systems in emergingeconomies: The case of Ghana. J. Real Estate Lit. 2009, 17, 63–84. [CrossRef]
54. Arguello, M.E.J.; Ayele, B.M.; Blaustein, S.M. The Millennium Cities Initiative: Accra; Earth Institute: Accra, Ghana, 2015.55. Ross, L.H. Housing code enforcement and urban decline. J. Afford. Hous. Community Dev. Law 1996, 6, 29–46.56. Clarke, P.; Ailshire, J.; Melendez, R.; Bader, M.; Morenoff, J. Using Google Earth to conduct a neighbourhood audit: Reliability of
a virtual audit instrument. Health Place 2010, 16, 1224–1229. [CrossRef]57. Pratomo, J.; Kuffer, M.; Martinez, J.; Kohli, D. Coupling uncertainties with accuracy assessment in object-based slum detections,
case Study: Jakarta, Indonesia. Remote Sens. 2017, 9, 164.58. Kohli, D.; Sliuzas, R.; Stein, A. Urban slum detection using texture and spatial metrics derived from satellite imagery. J. Spat. Sci.
2016, 61, 405–426. [CrossRef]59. Bakx, W.; Janssen, L.; Schetselaar, E.; Tempfli, K.; Tolpekin, V.; Westinga, E. Image Analysis. In The Core of GIScience: A Process
Based Approach; Tolpekin, V., Stein, A., Eds.; Faculty of Geo-Information Science and Earth Observation (ITC), University ofTwente: Enschede, The Netherlands, 2013; pp. 205–225.
60. Bryman, A. Social Research Methods, 4th ed.; Oxford University Press Inc.: New York, NY, USA, 2012; Volume 112.61. Kumar, R. Sampling. In Research Methodology; Sage Publications Limited: London, UK, 2005; pp. 164–184.62. Gyapong, P. Assessing Customary Land Tenure Institutions for Land Administration in Ghana: Good Governance Perspective (Case
Study of Gbawe, Greater Accra, Ghana); International Institute for Geo-Information Science and Earth Observation (ITC):Enschede, The Netherlands, 2009.
63. Asiama, S. Land as a source of revenue mobilisation for local authorities in Ghana. J. Sci. Technol. 2006, 26, 116–123. [CrossRef]64. Siiba, A.; Adams, E.A.; Cobbinah, P.B. Chieftaincy and sustainable urban land use planning in Yendi, Ghana: Towards congruence.
Cities 2018, 73, 96–105. [CrossRef]65. Clarke, J.I. The Growth of Capital Cities in Africa. Africa Spectr. 1971, 6, 33–40.66. De Soto, H. The Mystery of Capital: Why Capitalism Triumphs in the West and Fails Everywhere Else; Black Swan, Ed.; Bantam Press:
London, UK, 2000.67. Abubakari, Z.; Richter, C.; Zevenbergen, J. Exploring the “implementation gap” in land registration: How it happens that Ghana’s
official registry contains mainly leaseholds. Land Use Policy 2018, 78, 539–554. [CrossRef]68. Zevenbergen, J. Systems of Land Registration. Asp. Eff. 2002, 15–199.
Related Documents