Welcome message from author
This document is posted to help you gain knowledge. Please leave a comment to let me know what you think about it! Share it to your friends and learn new things together.
Transcript


1
Dimensions of Belonging:
Relationships between Police Identity Checks and National Identity
Mélanie Terrasse Princeton University
ABSTRACT
Researchers in many countries have identified important racial differences in rates of routine civilian-police
interactions such as identity checks or stop and frisk. By stopping individuals with certain demographic traits
over others, state policemen symbolically reinforce a particular social and national order. In countries with
salient ethnonational boundaries, such actions may have consequences on individuals trying to situate
themselves with regards to the nation. How are frequent police identity checks associated with different
dimensions of national identity? Using the nationally representative Trajectoires et Origines survey, I examine
this relationship among the general French population and among immigrants of the first and second
generation specifically. Using three dimensions of national identity, self-perceived French identity (“I feel
French”), other-perceived French identity (“Others see me as French”) and self-perceived immigrant origin
(“I feel *origin*”), I find that experiencing frequent identity checks is associated with a small decrease in
one’s likelihood of identifying as French, a small increase in one’s likelihood of identifying with their
immigrant origin, and a moderate increase in one’s likelihood of believing that others do not see them as
French. The present study thus suggests that some dimensions of national identity may be more vulnerable
to context of reception and perceived discrimination than others, whereas other dimensions may be more
responsive to other factors such as jus soli understandings of nationality.
Keywords: Police, discrimination, national identity, France, immigration
INTRODUCTION
In 2005, riots erupted across France following the accidental electrocution of two teenagers
being chased by the police in a disadvantaged suburb of Paris. In her analysis of these events,
Echchaibi (2007) argues that the second-generation immigrant protestors “who burned cars and set
schools and businesses on fire claimed they did so not because they have no desire to integrate, but
mostly because their decrepit banlieues [suburbs] often remind them that the universalist ideals—
liberté, égalité, fraternité—they have imbibed since their first schooling day do not apply to them.”
French Universalist discourse states that all citizens will be treated the same way in the eyes of the
state, regardless of origin, race or religion (Jennings 2000). Under these principles, any policies or
state practices on the basis of race or ethnicity would be in direct opposition to France’s civic model.
Despite this official stance, researchers in France have isolated the existence of racial bias in police
identity checks (a practice colloquially known as délit de faciès) (Jobard, Lamberth and Névanen,
2012).
Scholars studying the new punitive turn in the United States and Europe have emphasized
the symbolic role of law enforcement in relation to the state, as an increasing number of laws and
practices target marginal populations and/or ethnic minorities (see Stuart et al. 2015). In the French
context, where national origin constitutes a salient symbolic boundary, individuals experiencing
differential treatment by police agents on the ground may see this as the reinforcement of a
particular social and national order (Fassin, 2012). I chose police identity checks as opportunities for
the engagement between established members of French society—police officers—and first or
second generation immigrants in the process of adjusting to the receiving context.
The coming together of such individuals may allow us to further understand mechanisms
that increase or reduce feelings of belonging in the national community. Previous studies have
2
examined the negative psychological effects of differential police contact (Sampson and Bush 1998;
Brayne 2013; Menjivar and Abrego 2012). Few studies, however, aim to directly connect police
interactions with questions of national identity. When studies do examine national identity in relation
to (perceived) discrimination, they often use binary outcomes implying that an increase in foreign
identity is associated with a corresponding decrease in French identity, and vice-versa (Branscombe
et al. 1999; Jasinskaja-Lahti, Liebkind, and Solheim 2009). Sociological research on immigration, in
contrast, brings attention to the complex ways in which context of reception and self- and others’
understandings of ethnic and national identity interact (Portes and Zhou 1993; Alba and Nee 1997;
Waters 1994).In the present study, I ask the following questions: is there a relationship between the
experience of frequent police identity checks and national identity? If so, how does this relationship
vary across different dimensions of national identity?
This study aims to contribute to previous literature in three novel ways. First and foremost,
this study examines the relationship between the experience of identity checks and national identity
using logistic regression and coarsened exact matching. Secondly, it makes use of the Trajectoires et
Origines (TeO) survey, the only French survey to oversample immigrants of the first and second
generation in addition to French respondents, thus allowing for more fine-grained comparisons
across immigrant origin and generation. Lastly, it takes advantage of the TeO survey’s multiple
questions relating to national belonging, in order to examine multiple dimensions of national
identity.
Using three different dimensions of national identity – self-perceived French identity (“I feel
French”), other-perceived French identity (“Others see me as French”) and self-perceived
immigrant origin (“I feel *origin*”), I find that experiencing frequent identity checks is associated
with a slight decrease in one’s likelihood of identifying as French, a slight increase in one’s
likelihood of identifying with their immigrant origin, but most especially a substantial increase in
one’s likelihood of believing that others do not see them as French. I also find differences across
immigrant generation that reveal the importance of jus soli understandings in stabilizing national
identity. First-generation immigrants exhibit a weaker association between identity checks and their
immigrant identity compared to their French identity, whereas the opposite is true of second-
generation immigrants. This study thus aims to delve deeper into the relationship between context
of reception and the different facets of belonging in a host society.
THEORETICAL AND EMPIRICAL BACKGROUND
Scholars have identified a “punitive turn” in the United States and Europe since the 1980s,
during which marginal individuals and behaviors have increasingly become formally criminalized (for
a review, see Stuart et al. 2015). The state plays an important role in shaping the discourse of who
belongs, for example through laws aimed at regulating public spaces or immigration (Calavita, 2007).
Regulations of public space often target the actions of “homeless people, minorities, individuals with
alcohol and substance abuse histories, and those engaged in informal economic enterprise” (Stuart et
al. 2015, 239). Many cities have prohibited behaviors such as begging, sleeping and loitering in public
spaces (Tosi 2007; Johnsen and Fitzpatrick 2010; Stuart 2013). Studying the criminal justice system
in France, Pager (2008) found a strong association between the proportion of immigrant residents
and severity of criminal justice interventions at the local level. Immigration itself has become
increasingly criminalized, with a large rise in deportations and biometric methods increasing the
surveillance of even documented migrants in the United States (Stumpf 2006; Menjivar and Abrego
3
2012). These trends are mirrored in France, where the number of deportations went from 9,000 in
2001, to 33,000 in 2011 (L’Express.fr 2012).
For marginalized groups, these forms of “legal violence” are “embedded in legal practices,
sanctioned, actively implemented through formal procedures, and legitimated—and consequently
seen as ‘normal’ and natural because it ‘is the law’” (Menjivar and Abrego 2013, 1387). As marginal
groups increasingly come in contact with penal institutions and are labeled as worthy of suspicion,
popular narratives of particular groups as dangerous and fraudulent are strengthened, in turn
affecting the views of state bureaucrats in charge of controlling suspicious behavior. Unequal
targeting through police identity checks thus could be seen as a “reproduction of the social order”,
serving to “remind people of their place in relation to the state” (Fassin 2013, 71).
Ethnic Boundaries in France
In 2008, France had a population of 5.3 million immigrants and 6.7 million children of immigrants (half of whom have one French parent), or 18% of the total population (Pan Ké Shon and Verdugo 2014). There has been a shift in the origin of first generation immigrants in France in recent years. In 1968, European immigrants made up two thirds of first generation migrants on French territory, compared to only one third of the immigrant population today (Pan Ké Shon and Verdugo 2014).
Studies of ethnic boundaries in France have looked at official integration policies or instances of unequal treatment across groups on the ground, revealing important contradictions between the two. In the eyes of the French state and as frequently reiterated by French politicians, policies on race, ethnicity or culture are to avoid in the interest of a unified nation and to prevent political fragmentation along ethnic lines. The lack of official recognition of any religious or ethnic group on the part of the French state means that, in the public sphere, citizens must relinquish these affiliations in favor of French civic values (Jennings 2000). The absence of any ethnic or religious classifications in the French national census, unlike that of many other Western developed countries, is a revealing and consequential example of this French colorblind stance (Blum and Guérin 2008; Jugé and Perez 2006; Amiraux and Simon 2006). Despite this emphasis on individual equality bereft of ethnic affiliations, many studies show that French nationalism in popular discourse contains important cultural undertones of what it means to be French. France’s citizenship policy has been described as a prime example of jus solis citizenship, where citizenship is voluntary and territory-based, in contrast with a jus sanguinis descent-based view of citizenship and nationhood. However, as Brubaker (1992) argues, conceptions of jus solis and sanguinis should be treated as ideal-types and are rarely encountered in their purest form. At many times in its history, France instituted jus sanguinis or a combination of jus sanguinis and jus solis requirements for citizenship (Weil 2002). In his study of symbolic boundaries towards immigrants in Europe, Bail (2008) found that French respondents, along with respondents from Britain and Germany, ascribed greater importance on average to linguistic and cultural boundaries.
Studies demonstrating the presence of discrimination against immigrants and ethnic minorities in many areas of French life also challenge the official French discourse of national inclusion (Zauberman 1998). In a nationally representative survey, Brinbaum, Safi and Simon (n.d.) find that immigrants report the most instances of discrimination, with second generation migrants and visible ethnic minorities more likely to report it. They also find that for immigrants, discrimination most often occurs in school or on the job market. In an audit study of two French labor markets, Duguet el al. (2007) found that resumes signaling Moroccan nationality and Moroccan-sounding names have to be sent out to three and seven times more jobs than resumes with French sounding names to obtain a job interview for waiter and accountant jobs, respectively.

4
When it comes to ethnic minorities’ interactions with police in France, recent studies also reveal important inequalities across demographic profiles.
Identity Checks and Demographics of Suspicion
In the context of police work, many studies have found that visible ethnic minorities are
proportionally more frequently stopped by police than the majority population (Fagan 2004, Medina
Ariza 2014, Epp et al. 2014, Miller et al. 2008). In France specifically, only a handful of studies have
empirically examined inequalities in contact with police. In the European EU-midis survey, French
respondents have the highest rates of having their identity checked by police in the past 12 months,
with Subsaharan and North African immigrants reporting the highest rates of identity checks.
Subsaharan immigrants in France have the lowest rates of the entire European survey when it comes
to stating that the police treated them with respect (Jobard et al. 2012). Fassin’s (2013) ethnography
of police work in a disadvantaged neighborhood in France shows that a specific profile of
individuals are repeatedly stopped and asked for their papers in the areas he studied. These are
typically young men, often known by police, and of ethnically foreign phenotype. Finally, in a
quantitative study of five public transit hubs in the Parisian region, Jobard et al. (2012) observed the
proportion of individuals being stopped by police for an identity check across perceived ethnicity,
age, gender, and clothing style. They found that Blacks and Maghrebis were more likely to be
stopped relative to their overall proportion in the research sites, and that women and individuals
appearing to be over thirty were significantly less likely to be stopped. They also found that a "hip-
hop" clothing style was associated with a greater likelihood of being stopped. The authors conclude
that disparities in identity checks by police reveal discrimination by perceived ethnicity, but also
through indirect factors such as clothing that are distributed in a way that exacerbates ethnic
differences in stop rates. While the above French studies highlight demographic inequalities in police
contact, another important part of the picture concerns the spatial distribution of suspicion and
corresponding police activity.
The Spatial Distribution of Police Work In many national contexts, suspicion is spatially as well as demographically distributed
depending on levels of segregation between groups. Quantitative studies have indeed found spatial
differences in policing patterns by neighborhood characteristics (Smith 1986, Klinger 1997, Fagan
and Davies 2000.) Fagan, Jeffrey and Davies’s empirical examination of NYPD stop and frisk
activity (2000) suggests that neighborhood characteristics such as racial composition, poverty levels,
and extent of social disorganization are better predictors of police activity than physical and social
disorder as advanced by broken windows theory (Wilson and Kelling, 1982). Despite large
differences in the extent of disadvantage and segregation between the two contexts, popular
discourse has drawn sensationalistic comparisons between disadvantaged neighborhoods in France
and American ghettos. The words “les quartiers” (neighborhoods) or “la banlieue” (suburb) itself
have become euphemisms to characterize low-income neighborhoods in the periphery of cities with
a high proportion of immigrants (first or second generation, and perhaps beyond) (Tissot, 2006).
These areas often include high-rise social housing projects built after World War II, some of which
have a nationally or regionally infamous reputation. In 1996, the government created the designation
of urban sensitives zones (zones urbaines sensibles, or ZUS), urban areas characterized by high rates of
social precariousness such as unemployment and single-parent families to prioritize urban policy

5
measures in such zones. The banlieues are often the subject of popular debate, described as places of
anomie and lacking social fabric, characterized by “disorder, delinquency, violence, insecurity”
(Philifert 2006, 89).
In his ethnography of a French special police unit in a public housing project, Fassin (2013)
finds that policemen themselves often employ martial and racialized language to characterize these
neighborhoods, viewing them as dangerous “jungles” in need of conquest (47). Despite greater
feelings of insecurity in urban sensitive zones compared to the rest of France, property crime rates
are lower in these disadvantaged neighborhoods than in surrounding cities (Fassin 2013). Violent
crimes are only moderately more frequent than in surrounding cities (13.0 crimes per 100,000
residents compared to 11.6), much of the differential being explained by reported cases of resisting
arrests and violent interactions with police officers. The demographic make- up of such
neighborhoods, with a high proportion of young people gives rise to the particular stigmatization of
young Arab or Black males from disadvantaged neighborhoods. The term “neighborhood youth”
(“jeunes des quartiers”) demonstrates the confluence of spatial, age-related, gendered and ethnic
connotations, referring specifically to young (often male) adolescents of North-African origin from
the banlieues (Tribalat 1999; Body-Gendrot 2005; Tissot 2006). Both in France and other countries,
studies therefore find that the unequal distribution of police interactions across demographic and
spatial profiles compounds to overwhelmingly target particular groups.
Policemen as Street-level Representatives of the State
As the ones managing individual’s initial contacts with law enforcement and the criminal
justice system, police agents on the ground produce and reproduce boundaries between law-abiding,
trustworthy citizens, and those engaging in deviant behavior (Lipsky 1980). As described by Lipsky
(1980) in his analysis of street-level bureaucrats, the “routines they establish, and the devices they
invent to cope with uncertainties and work pressures, effectively become the public policies they
carry out” (1980, xiii). In charge of enforcing national law, police agents shape the implementation
of official laws on the ground and their implications.
As in the United States, the French state has turned to quantification and technology to
rationalize its enforcement of law and order (Ogien 2010). The maintenance of crime and
performance statistics enabling comparisons across time and place pressures police departments to
compete for better performance indicators, as low performing units may be singled out and high
performing ones are often rewarded with bonuses (Mouhanna 2009). As such, patrolling officers
engaging in stop and frisk can raise their performance numbers through immigration checks or drug
seizures, cases that are opened and closed as soon as the identity check and/or search reveals an
infraction of the law (Fassin 2013). This performance structure gives rise to organizational incentives
for identity checks (which legally can be performed on preventative grounds).
Policemen work to enforce laws drafted by the state, but also use the law as a tool to pursue
their own bureaucratic goals. Fassin (2013, 72) describes a situation where a French policeman brags
to his coworkers about his use of a 1942 law prohibiting spitting on the ground (due to endemic
tuberculosis at the time) as a way to fine banlieue youth and charge them with resisting the police if
they protest the citation. Thus, in personally enacting the laws of the state on the ground, they
“implicitly mediate aspects of the constitutional relationship of citizens to the state by determining
who has access to state benefits and assigning statuses or labels” (Lipsky 1980, 4).

6
Psychological Dynamics of National Identity
Those who experience greater and/or differential police contact may come to interpret their
experiences as symbolizing one’s different relationship to the police, and therefore to the state.
Many studies have linked negative police interactions to “legal cynicism” towards society’s rules and
who they apply to (Sampson and Bartusch, 1998), and “system avoidance” (Brayne 2013), a
reluctance to participate in activities supervised by the state. The experience of legal violence by
agents of the state, due to its symbolic nature, can also lead the individuals subjected to it to
internalize its message and self-depreciate, for example as certain undocumented immigrants accept
the idea that they have no rights (Menjivar and Abrego 2012).
In a country where a salient symbolic boundary is often defined in ethnonational terms,
police interactions may affect one’s feelings of citizenship and national identity. Studies examining
the psychological implications of discrimination among marginalized groups often employ binary
outcomes of identification to assess the consequences of discrimination. Expanding on social
identity theory (Tajfel 1974), Skrobanek (2009) argues that discrimination as a mechanism prevents
individuals in a disadvantaged group from obtaining access to social, cultural, and economic capital,
which will, in turn, inhibit them from realizing a positive social identity. The Rejection-Identification
Model (RIM) states that discrimination and rejection from the in-group will lead out-group members
to identify more closely with the minority group in order to minimize the socio-psychological harm
of rejection from the majority (Branscombe et al. 1999). In contrast, the Rejection-Disidentification
Model (RDIM) posits that it is national disidentification that mediates out-group hostility and in-
group identification rather than ethnic self-definition (Jasinskaja-Lahti, Liebkind, & Solheim, 2009).
However, empirical findings on the orientation of ethnic minorities towards their group
identification or mainstream values suggest that often times individual do not wholly reject
mainstream values and that these concepts possess many dimensions. In the case of France, Simon
(2012) finds that a majority of immigrants identify as French, even when they do not possess French
citizenship. This is the case even when individuals of foreign origin also report ascribing to a specific
ethnic identity. Simon concludes that despite the nation’s official rejection of multiculturalism, a
pattern of dual national allegiance strongly emerges among immigrants in France.
Additionally, theories of reactive ethnicity do not explicitly examine the role of the state and
institutions as mediators of this identity process. It is important to consider the ways in which the
state itself may prevent individuals from being perceived as a part of the national community
regardless of personal inclinations, through particular immigration and integration policies for
example, but also more subtle discriminatory policies related to housing laws, law enforcement, etc.
State actions and laws can be understood within the context of racial projects, defined by Omi and
Winant (1994) as “an interpretation, representation, or explanation of racial dynamics, and an effort
to reorganize and redistribute resources along particular racial lines”. Prevailing notions of race and
ethnicity can have subtle but real consequences within formal state institutions such as the criminal
justice system, citizenship laws, and schools (for a review see Saperstein, Penner and Light 2013).
Not only are these processes themselves important, but institutional discrimination may be
interpreted more strongly than other kinds of discrimination by individuals of the minority group,
especially in nations in which official discourses posit the state as all inclusive.
The relationship between discrimination and national identity can be interpreted within the
framework of acculturation theory (Phinney 1990). This perspective first highlighted the straight-line
assimilation process of European immigrants in the United States as the typical inter-generational

7
process of acculturation (Gans 1982). Acculturation theory examines how individuals in a minority
group “relate to their own group as a subset of the larger society” (Phinney 1990: 501). Berry et al.
(1990) introduce a model with four possible outcomes of minority group identity: integration or
biculturalism, where individuals strongly identify with both groups; marginality when one identifies
with neither group; and assimilation or separation, respectively, if individuals from the minority
group identify exclusively with the majority or minority group. Berry et al. introduce more
complexity into understandings of identity but only focus on self-perceived identity, without taking
into account dimensions of identity that may mediate how an individual chooses to identify.
The more diverse outcomes of recent immigrant groups have prompted scholars to think of
integration as a more complex and dynamic process, mediated by socioeconomic, ethnic and cultural
differences at the individual and ecological levels (Portes and Zhou, 1993; Alba and Nee, 1997,
Waters, 1994). Specifically, experiences understood as discriminatory may first be interpreted as a
sign of how others identify the individual, which then may be translated into personal ways of
identifying with one group or another. Portes and Zhou (1993) emphasize the importance of context
of reception and skin color in shaping the integration pathways of immigrants. Similarly, Waters
(1994) shows that West Indian immigrants face deep questions of identity as they learn how to
position themselves in relation to African Americans, the ethnic group into which others tend to
assign them by default. These studies therefore emphasize on the important role of others’
perceptions of ethnic and/or national identity in shaping outcomes for immigrants.
Lastly, individuals’ different dimensions of identity may be more or less salient and malleable
depending on context, leading to different relationships between daily experiences and facets of
national identity. For example, immigrants who have just arrived in the host country may still be
attempting to situate themselves with regards to Frenchness, whereas children of immigrants may try
doing the same thing with regards to their parents’ origin. For these reasons, I chose to include three
dimensions of national identity in this study: self-perceived French identity, self-perceived immigrant
identity, and other-perceived French identity.
THE PRESENT STUDY
Data
Trajectoires et Origines (TeO) is a French survey conducted by the National Institute for
Demographic Studies (INED) and the National Institute of Statistics and Economic Studies
(INSEE) in 2008. The study’s sampling frame consisted of individuals in the 2007 census. The study
had five specific subsamples: first generation immigrants, French overseas territories (DOM) natives,
2nd generation immigrants, children of DOM natives, and a reference sample representative of the
overall French population. Particular national origins were oversampled, namely Turkey, Subsaharan
Africa and Southeast Asia. The overall sample consists of 21,761 individuals, with a 61% response
rate. This data is unique in that it is the first survey to representatively sample second-generation
immigrants in France. The data was collected through in-person computer assisted interview, usually
at the respondent’s place of residence. The interview lasted 65 minutes on average, and covered a
variety of topics, including “education, work life, family life, housing, health, social relations [and]
citizenship.”
Variables

8
Dependent Variables
Self-perceived French Identity. Respondents were asked whether they agreed or disagreed
with the following statement “I Feel French”, on a 4-point Likert scale composed of “Strongly
disagree”, “Somewhat disagree”, “Somewhat agree”, “Strongly agree”. I then collapsed the variable
into two categories of agree (1) and disagree (0).
Other-perceived French Identity. Respondents were asked whether they agreed or
disagreed with the following statement “Others See Me As French”, on a 4-point Likert scale
composed of “Strongly disagree”, “Somewhat disagree”, “Somewhat agree”, “Strongly agree”. I then
collapsed the variable into two categories of agree (1) and disagree (0).
Self-perceived Immigrant Identity. If applicable, respondents were asked whether they
agreed or disagreed with the following statement “I Feel *Origin*”, on a 4-point Likert scale
composed of “Strongly disagree”, “Somewhat disagree”, “Somewhat agree”, “Strongly agree”. The
respondent’s country of origin was inputted in the question based on previous answers. For
immigrants of the second generation, the mother’s country of origin was inputted. I then collapsed
the variable into two categories of agree (1) and disagree (0).
Independent Variables
Frequency of Identity Checks. Respondents were asked: “In the past 12 months, how
many times have the police or gendarmerie checked your identity?” A note for the interviewer to read
after any hesitation on the part of the respondent stated “Do not count compulsory checks: airport,
border controls, entry of an official building, etc.” Respondents could choose between the following
answers: “Never”, “Once”, “Multiple times”, “Refuse to answer”, “Don’t know”. The latter two
categories were coded as missing and the former three were retained.
Immigrant Origin and Generation. Respondents were coded into nine categories
corresponding to their national region of origin (France, Asia, Africa, Europe and Maghreb), and
whether they were first or second generation immigrants, if applicable. Respondents who were from
the above five regions were coded as missing, as other immigrant origins were not present in great
enough numbers in the sample to allow for subgroup analyses. To code the variable, respondents
were asked about their country of birth as well as both parents’ country of birth. Those who
reported being born in France and of French parents were coded as being French. Those who
reported being born abroad were coded with their corresponding nationality of origin and as first-
generation immigrants. Lastly, those reporting being born in France of foreign parents were coded
with their parents’ corresponding region of origin and as second generation immigrants. If the
respondents’ parents were of different regions of origin, I selected the immigrant parent’s origin if
the other parent was born in France, or the mother’s region of origin if both parents were
immigrants of different regions (n=307).
Control Variables. I also included in the model a set of demographic variables to control
for gender, age, age squared, employment status, highest diploma obtained, and neighborhood
measures of immigrant proportion and unemployment rate based on data from the French census
using IRIS regions, a geographical categorization aiming to represent individual neighborhoods of
homogenous composition with a population of approximately 2,000 residents per IRIS.1
1 http://www.insee.fr/fr/methodes/default.asp?page=zonages/iris.htm

9
Method
In this second part of the paper, I first show descriptive statistics by immigrant origin and
generation. In order to compare the association between frequency of identity checks and national
identity measures in a multivariate model, I then performed logistic regression with the same
independent variables and controls on self-perceived and other-perceived French identity. To
facilitate interpretation, I then compare the adjusted risk difference across categories of the
independent variable (frequency of identity checks) on average for the entire sample, and by
immigrant origin and generation at selected representative values.
In order to add self-perceived immigrant origin as my third dependent variable, I separately
performed logistic regression on the subsample of immigrant respondents (first and second
generation). I once again examine the adjusted risk difference of frequent identity checks on all three
dependent variables for the entire sample, and by immigrant origin and generation at selected
representative values.
Lastly, I perform coarsened exact matching (CEM) on my sample to attempt to identify the
causal effect of frequent identity checks on self-perceived immigrant identity, self-perceived French
identity, and other-perceived French identity.
FINDINGS
Descriptive Statistics
Table 1 shows the characteristics of the sample by immigrant origin group and religion. In
terms of education, we can observe that African immigrants of the first generation have much
higher rates of education than the rest of the sample, and African immigrants of the second
generation are slightly more educated than the French population. Other immigrants from the first
generation have close to a third of respondents without any diploma, and other second generation
immigrants have similar levels of education as French respondents. Among all origin groups, the
unemployment rate is highest for Maghrebi immigrants of both generations. Second generation
immigrants with the exception of Europeans are more likely to be students than the rest of the
sample, likely because second generation immigrants are on average younger than the rest of the
sample. Immigrants of both generations (with the exception of Europeans) tend to live in
neighborhoods with a greater unemployment rate than do French respondents. They also,
predictably, live in neighborhoods with a higher proportion of immigrants. A greater proportion of
second-generation immigrant respondents report experiencing multiple police stops in the past year.
However, age differences are likely to partly explain these differences.
When it comes to feeling French, first generation immigrants in the sample consistently
report lower rates of agreement, ranging from 62.3 percent to 72.5 percent of first generation
respondents within the same origin group compared to 98.3 percent of French respondents. The
only exception is in the case of first-generation DOM-TOM respondents, suggesting the salience of
French nationality in the country’s overseas territories, as 93.1 percent of respondents in this
category report feeling French. A wide majority of second-generation immigrants report feeling
French, with 92.7 to 96.7 percent of second generation immigrants agreeing with the statement
across regions of origin. 97.4 percent of French respondents believe that others see them as French,
while the majority of first-generation African (46.6 percent), Asian (38.1 percent) and Maghrebi (40.5
percent) immigrants disagreeing with the statement. With the exception of European immigrants,
10
immigrants of the second generation also show sizably lower rates of agreeing that others see them
as French compared to French respondents, ranging from 62.8 to 77.6 percent of respondents
across origin groups. We can therefore already see a gap between second generation immigrants self-
perceived and other-perceived French nationality. Lastly, we can see that the majority of immigrants
identify with their country of origin as well, but that second-generation immigrants show slightly
lower rates of agreement than the first generation. As previously shown by Simon (2012) using the
same dataset, a pattern of possible dual national allegiance emerges for most immigrants, despite an
important proportion of immigrants not believing that others perceive them as French. It is however
possible that other variables such as age may vary across immigrant origin and generation groups in
a way that makes interpretation difficult through solely descriptive statistics. In order to examine the
explanatory power of each variable more clearly and assessing the relationship between identity
checks and national identity, I now turn to multivariate logistic regression models for each of my
three dependent variables.

11
FranceAfrica, 1st
gen.
Africa, 2nd
gen.
Asia, 1st
gen.
Asia, 2nd
gen.
DomTom,
1st gen.
DomTom,
2nd gen.
Europe, 1st
gen.
Europe, 2nd
gen.
Maghreb,
1st gen.
Maghreb,
2nd gen.
N 2992 712 344 1977 1119 697 641 2384 3485 2183 2814
Controls
Male Cat. 1411 (47.2) 333 (46.8) 181 (52.6) 1001 (50.6) 561 (50.1) 324 (46.5) 303 (47.3) 1052 (44.1) 1710 (49.1) 1051 (48.1) 1256 (44.6)
Age Cont. 38.53 (11.61) 41.43 (10.64) 26.75 (8.76) 39.83 (10.56) 24.66 (6.08) 41.06 (11.03) 28.11 (7.57) 45.07 (10.19) 34.52 (9.35) 41.63 (10.88) 30.15 (8.62)
Highest Diploma Cat.
None 343 (11.5) 119 (17.0) 18 ( 5.2) 706 (36.6) 143 (12.8) 189 (27.1) 55 ( 8.6) 768 (32.4) 427 (12.3) 754 (37.1) 414 (14.7)
Brevet 249 ( 8.3) 52 ( 7.4) 24 ( 7.0) 207 (10.7) 108 ( 9.7) 74 (10.6) 53 ( 8.3) 152 ( 6.4) 265 ( 7.6) 211 (10.4) 299 (10.6)
CAP-BEP 849 (28.4) 45 ( 6.4) 41 (11.9) 225 (11.7) 199 (17.8) 170 (24.4) 149 (23.2) 465 (19.6) 931 (26.7) 338 (16.7) 620 (22.0)
Bac Pro 366 (12.2) 46 ( 6.6) 46 (13.4) 105 ( 5.4) 149 (13.3) 62 ( 8.9) 102 (15.9) 162 ( 6.8) 432 (12.4) 88 ( 4.3) 399 (14.2)
Bac 256 ( 8.6) 105 (15.0) 92 (26.7) 231 (12.0) 179 (16.0) 47 ( 6.7) 84 (13.1) 190 ( 8.0) 336 ( 9.6) 151 ( 7.4) 313 (11.1)
Bac +2 410 (13.7) 54 ( 7.7) 40 (11.6) 147 ( 7.6) 130 (11.6) 67 ( 9.6) 97 (15.1) 157 ( 6.6) 490 (14.1) 169 ( 8.3) 328 (11.7)
Over Bac +2 518 (17.3) 279 (39.9) 83 (24.1) 306 (15.9) 211 (18.9) 88 (12.6) 101 (15.8) 477 (20.1) 603 (17.3) 319 (15.7) 441 (15.7)
Employment Status Cat.
Employed 2228 (74.5) 490 (68.8) 172 (50.0) 1250 (63.2) 521 (46.6) 550 (78.9) 402 (62.7) 1746 (73.2) 2699 (77.4) 1299 (59.5) 1639 (58.2)
Retired 110 ( 3.7) 10 ( 1.4) 0 ( 0.0) 13 ( 0.7) 0 ( 0.0) 28 ( 4.0) 0 ( 0.0) 104 ( 4.4) 13 ( 0.4) 27 ( 1.2) 2 ( 0.1)
Stay at home 130 ( 4.3) 70 ( 9.8) 10 ( 2.9) 337 (17.0) 59 ( 5.3) 21 ( 3.0) 16 ( 2.5) 224 ( 9.4) 129 ( 3.7) 389 (17.8) 178 ( 6.3)
Student 246 ( 8.2) 44 ( 6.2) 135 (39.2) 84 ( 4.2) 385 (34.4) 36 ( 5.2) 146 (22.8) 52 ( 2.2) 350 (10.0) 79 ( 3.6) 515 (18.3)
Unemployed 212 ( 7.1) 76 (10.7) 24 ( 7.0) 221 (11.2) 139 (12.4) 45 ( 6.5) 72 (11.2) 177 ( 7.4) 239 ( 6.9) 302 (13.8) 418 (14.9)
Other 66 ( 2.2) 22 ( 3.1) 3 ( 0.9) 72 ( 3.6) 15 ( 1.3) 17 ( 2.4) 5 ( 0.8) 81 ( 3.4) 55 ( 1.6) 87 ( 4.0) 62 ( 2.2)
Neighborhood Measures Cont.
% Unemployed 14.06 (15.35) 19.97 (19.87) 19.39 (19.34) 26.63 (22.82) 23.36 (21.83) 21.82 (20.72) 21.71 (20.76) 15.69 (16.72) 15.64 (16.68) 31.46 (23.68) 26.64 (22.75)
% Immigrants 10.27 (16.17) 31.73 (24.93) 25.98 (24.42) 36.44 (24.36) 30.73 (24.70) 32.51 (25.06) 31.47 (25.10) 22.06 (23.06) 17.53 (20.93) 34.52 (24.55) 28.21 (24.52)
Identity Checks in Past Year Cat.
Zero 2167 (72.4) 570 (80.2) 241 (70.3) 1543 (78.2) 750 (67.1) 512 (73.6) 432 (67.4) 1911 (80.2) 2516 (72.2) 1711 (78.5) 1873 (66.7)
One 458 (15.3) 74 (10.4) 39 (11.4) 217 (11.0) 163 (14.6) 89 (12.8) 88 (13.7) 266 (11.2) 489 (14.0) 236 (10.8) 351 (12.5)
Two or More 367 (12.3) 67 ( 9.4) 63 (18.4) 212 (10.8) 205 (18.3) 95 (13.6) 121 (18.9) 205 ( 8.6) 478 (13.7) 232 (10.6) 586 (20.9)
Dependent Variable
I feel French - Agree Cont. 2929 (98.3) 486 (70.0) 324 (95.6) 1188 (62.3) 969 (87.7) 644 (93.1) 615 (96.7) 1461 (62.7) 3312 (95.7) 1537 (72.5) 2573 (92.7)
Others see me as French Cont. 2869 (97.4) 313 (46.6) 260 (77.6) 703 (38.1) 676 (63.4) 385 (58.9) 429 (70.6) 1358 (60.7) 3134 (91.3) 820 (40.5) 1705 (62.8)
I feel *Origin* Cont. N/A 555 (79.2) 132 (56.7) 1514 (77.6) 701 (73.0) 629 (91.8) 347 (79.4) 1761 (75.5) 1329 (57.5) 1781 (83.1) 1389 (63.9)
Statistics for categorical variables: N (%)
continous variables: Mean (SD)
Table 1: Sample descriptive statistics by immigrant region of origin and generation

12
Analysis
Models 1 and 2 in Table 2 examine the likelihood of agreeing with the statements “I feel
French” (Model 1) and “Others see me as French” (Model 2), using demographic variables,
neighborhood variables, immigrant origin and generation, and number of identity checks
experienced as predictors. Both models show that respondents who reported experiencing more
than one identity check by police in the past year were statistically significantly less likely than
respondents reporting no identity checks in the past year to agree with both statements.
Because odds ratios cannot be compared across models when using logistic regression, I
computed the adjusted risk difference between reporting zero identity checks, and reporting one or
more than one on my two dependent variables. The adjusted risk difference (ARD) shows the
difference of average predicted probabilities of the outcome (here, the two measures of national
belonging) between two values of the variable of interest (in this case, frequency of identity checks).
The ARD, also often called the excess risk, attributable risk or average treatment effect, is often used
in epidemiology studies to describe differences in the occurrence of a condition between two
groups, for example the difference in cancer rates for smokers and non-smokers. Measures based on
relative risk allow for an easier and more intuitive interpretation of logistic regression results than
odds ratios, which are often used in logistic regression but falsely interpreted as risk ratios in samples
where the outcome of interest is common (Katz, 2006). In the context of the present study, it allows
me to compare the substantive size of the association between number of identity checks and my
two dependent variables. By doing so, I am able to examine whether there is a stronger association
between the number of identity checks experienced and the respondent’s own feelings of
Frenchness, or their perceptions of whether others see them as French. For example, if I find an
adjusted risk difference of -.05 between zero identity checks and multiple identity checks for Model
1 (with a dependent variable measuring self-perceived French identity), this means that based on
Model 1, respondents reporting multiple identity checks in the past year are 5 percentage points less
likely to agree with the statement “I feel French” than respondents who reported zero identity
checks in the past year. To compute ARDs, I used Norton et al.’s (2012) adjrr command in Stata,
derived from Kleinman and Norton’s formula (2009).

13
Table 2: Logistic Regression of Frequency of Identity Checks on French identity measures
Model 1 Model 2
Predictors (all shown below)
DV: "I feel French" DV: "Others see me as French"
Male 1.164 (0.179) 1.238 (0.140)
Age 0.866* (0.054) 0.828*** (0.043)
Age squared 1.002* (0.001) 1.003*** (0.001)
Educational level 1.065* (0.033) 1.086*** (0.026)
Employment Status
Employed (Ref.) 1.000 1.000
Unemployed 0.556* (0.135) 0.631* (0.121)
Student 0.635 (0.159) 0.801 (0.132)
Stay at home 0.489*** (0.083) 0.581*** (0.094)
Other 0.440 (0.245) 1.076 (0.471)
Neighborhood measures
% Unemployed 0.999 (0.003) 0.992*** (0.002)
% 1st gen. immigrants 0.996* (0.002) 0.991*** (0.002)
Immigrant Origin & Generation
France (Ref.) 1.000 1.000
Africa, 1st gen. 0.081*** (0.018) 0.043*** (0.010)
Africa, 2nd gen. 0.700 (0.337) 0.100*** (0.030)
Asia, 1st gen. 0.039*** (0.006) 0.021*** (0.004)
Asia, 2nd gen. 0.300*** (0.066) 0.074*** (0.014)
DOM-TOM, 1st gen. 0.324*** (0.084) 0.059*** (0.010)
DOM-TOM, 2nd gen. 0.936 (0.275) 0.095*** (0.017)
Europe, 1st gen. 0.033*** (0.006) 0.050*** (0.008)
Europe, 2nd gen. 0.538** (0.107) 0.347*** (0.056)
Maghreb, 1st gen. 0.086*** (0.015) 0.037*** (0.006)
Maghreb, 2nd gen. 0.553** (0.110) 0.124*** (0.019)
Number of Identity checks experienced in past year No stops (Ref.) 1.000 1.000
One stop 1.056 (0.184) 0.812 (0.114)
Two or more stops 0.400*** (0.092) 0.384*** (0.063)
Observations 15839 15477
Pseudo R-squared 0.236 0.299
Odds ratios; Standard errors in parentheses
* p<0.05 ** p<0.01 *** p<0.001
14
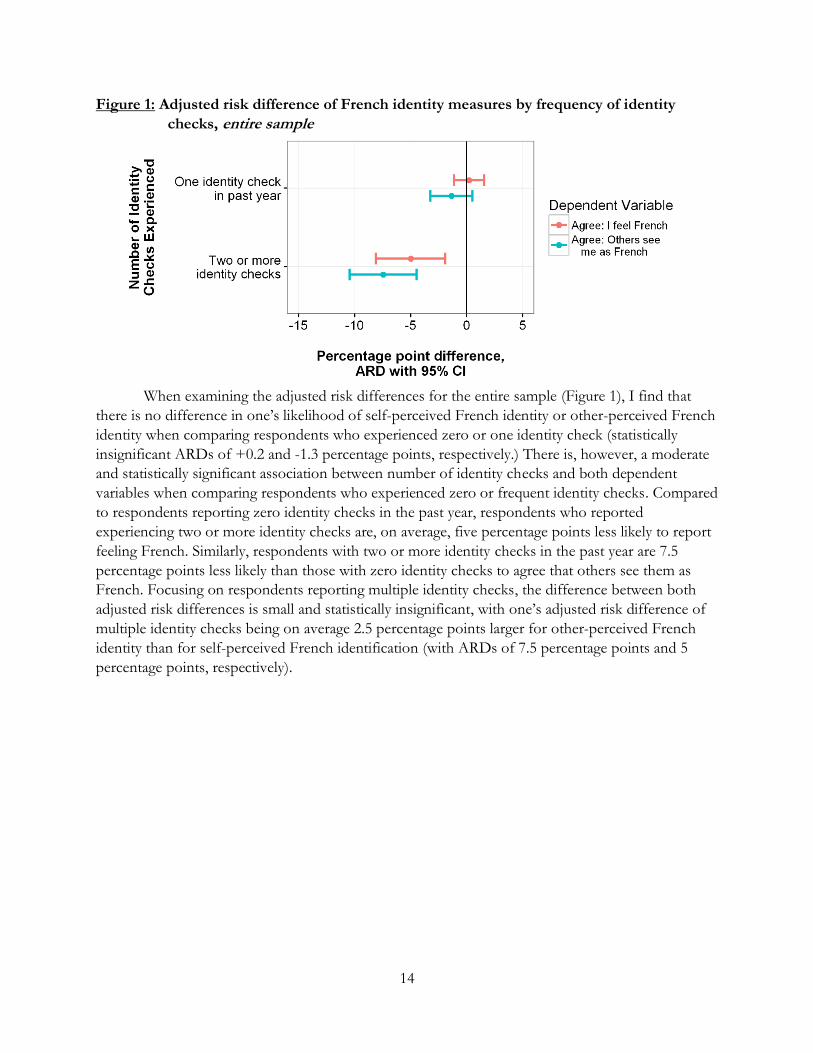
Figure 1: Adjusted risk difference of French identity measures by frequency of identity
checks, entire sample
When examining the adjusted risk differences for the entire sample (Figure 1), I find that
there is no difference in one’s likelihood of self-perceived French identity or other-perceived French
identity when comparing respondents who experienced zero or one identity check (statistically
insignificant ARDs of +0.2 and -1.3 percentage points, respectively.) There is, however, a moderate
and statistically significant association between number of identity checks and both dependent
variables when comparing respondents who experienced zero or frequent identity checks. Compared
to respondents reporting zero identity checks in the past year, respondents who reported
experiencing two or more identity checks are, on average, five percentage points less likely to report
feeling French. Similarly, respondents with two or more identity checks in the past year are 7.5
percentage points less likely than those with zero identity checks to agree that others see them as
French. Focusing on respondents reporting multiple identity checks, the difference between both
adjusted risk differences is small and statistically insignificant, with one’s adjusted risk difference of
multiple identity checks being on average 2.5 percentage points larger for other-perceived French
identity than for self-perceived French identification (with ARDs of 7.5 percentage points and 5
percentage points, respectively).
15
Figure 2: Adjusted risk difference of French identity measures by frequency of identity
checks, at age 25, employed, prof. baccaleaureate, average neighborhood measures,
entire sample
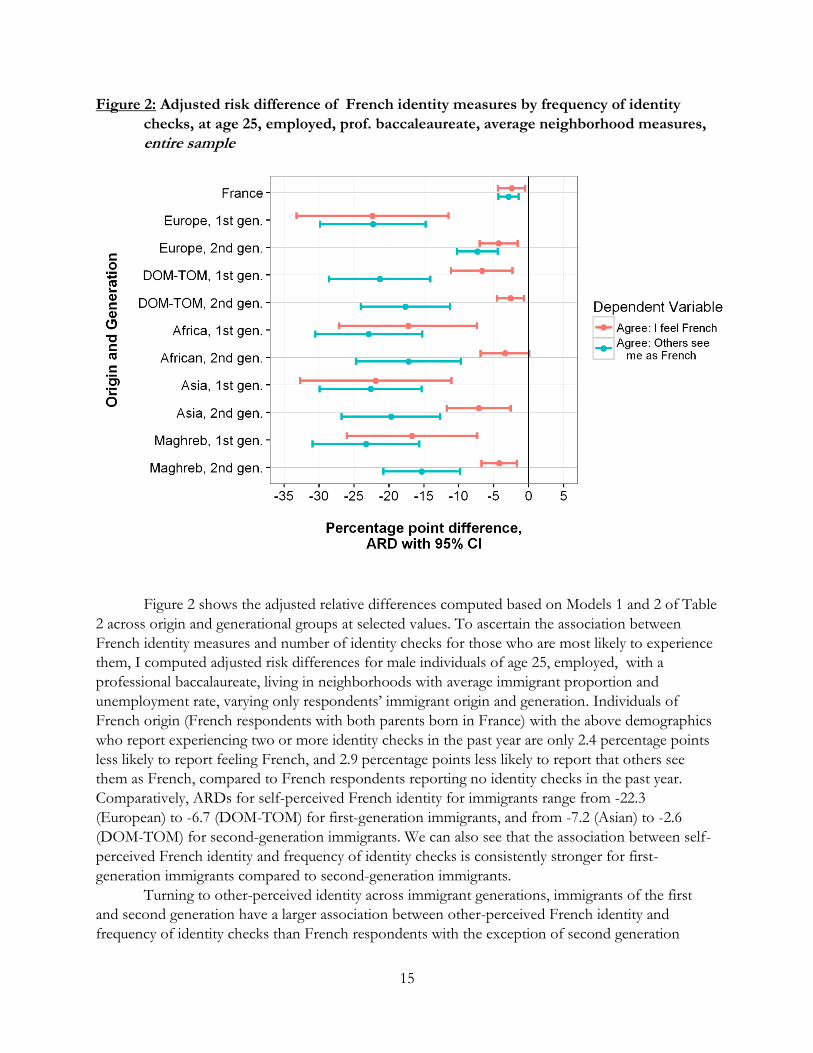
Figure 2 shows the adjusted relative differences computed based on Models 1 and 2 of Table
2 across origin and generational groups at selected values. To ascertain the association between
French identity measures and number of identity checks for those who are most likely to experience
them, I computed adjusted risk differences for male individuals of age 25, employed, with a
professional baccalaureate, living in neighborhoods with average immigrant proportion and
unemployment rate, varying only respondents’ immigrant origin and generation. Individuals of
French origin (French respondents with both parents born in France) with the above demographics
who report experiencing two or more identity checks in the past year are only 2.4 percentage points
less likely to report feeling French, and 2.9 percentage points less likely to report that others see
them as French, compared to French respondents reporting no identity checks in the past year.
Comparatively, ARDs for self-perceived French identity for immigrants range from -22.3
(European) to -6.7 (DOM-TOM) for first-generation immigrants, and from -7.2 (Asian) to -2.6
(DOM-TOM) for second-generation immigrants. We can also see that the association between self-
perceived French identity and frequency of identity checks is consistently stronger for first-
generation immigrants compared to second-generation immigrants.
Turning to other-perceived identity across immigrant generations, immigrants of the first
and second generation have a larger association between other-perceived French identity and
frequency of identity checks than French respondents with the exception of second generation
16
European immigrants. This latter exception suggests the possible role of phenotypical or at the very
least visible differences of nationality in the interpretation of frequent identity checks, as second-
generation European immigrants plausibly are the least likely to be visibly defined as immigrants
among individuals of foreign origin. Finally, the strength of the association between other-perceived
French identity and experiencing two or more identity checks is consistently lower for second-
generation immigrants than for first-generation immigrants, but many of these differences are not
statistically significant, and their substantive size is smaller than when comparing differences in self-
perceived French identity ARDs across generations.
Figure 3: Adjusted risk difference of national identity measures by frequency of identity
checks, immigrants only
In order to further examine different dimensions of immigrant identity, Figure 3 displays the
ARDs of self-perceived (“I feel French”) and other-perceived (“Others see me as French”) French
identity as well as self-perceived immigrant identity (“I feel *Origin). Once again, there are no
statistical differences for the three dependent variables between immigrant respondents reporting
zero or one identity check. However, compared to those reporting zero identity checks, immigrants
with two or more identity checks are 4.4 percentage points less likely to report feeling French, 12.0
percentage points less likely to report that others see them as French, and 5.1 percentage points
more likely to report feeling of their other national origin. We can therefore see that although there
is a statistically significant association between experiencing two identity checks or more and
measures of self-perceived identity, there is a consistently stronger association for the other-
perceived dependent variable. This suggests that frequent identity checks may lead immigrants to
question how others see them to a greater effect than to question their own perceived identity,
although causal statements cannot be verified with this observational dataset.

17
Figure 4: Adjusted risk difference of French identity measures by frequency of identity
checks, at age 25, employed, prof. baccaleaureate, average neighborhood
measures, immigrants only
Still examining the subsample of immigrant respondents, Figure 4 shows the adjusted risk
differences of experiencing two or more identity checks for the three dependent measures of
national identity, across immigrant origin and generation. Since these results are computed from a
different logistic regression model from Table 2, this time only including immigrants, we can see that
the sizes of ARDs in this model are smaller than those shown in Figure 2, but that differences across
generations and origin groups still hold. When it comes to self-perceived immigrant identity, second
generation respondents are slightly more likely to have a greater probability of identifying with their
immigrant origin, but none of these differences are statistically differences. Nonetheless, this
suggests that reactive identity as a result of frequent identity checks may operate by leading second
generation migrants to emphasize their foreign origin rather than reject their French origin, whereas
the opposite trend appears for first-generation immigrants.
Robustness Check: Coarsened Exact Matching
In order to examine a possible causal relationship between frequent police identity checks
and national identity measures, I performed coarsened exact matching (CEM). This simple and
intuitive matching method requires coding covariates (continuous and categorical) into coarsened
categories that retain substantive meanings, and organize respondents into strata (Iacus, King, and
Porro. 2011). Within each strata, individuals have the same coarsened values for each covariate.

18
Coarsened exact matching requires specifying the matching procedure a priori and then refining
based on sample size (while retaining meaningful coarsened categories). This places emphasis on
reducing bias in the bias-variance trade-off, but leaves room for adjusting the variance. CEM then
matches data points within each stratum across treatment groups, dropping all strata for which there
is no treatment or control equivalent.
Table 3 Comparison of number of treated and control units for the raw data, the first and
second CEM matching procedure
N Control
No police stops
in past year
N Treated
One police
stop
N Treated
More than one
stop
L1
Measure of
Imbalance
Raw 15,812 2,806 3,118 0.764
CEM, pair 1 4867 1848 - 0.565
CEM, pair 2 4206 - 1939 0.653
Because my treatment, frequency of police stops, is multichotomous, I perform CEM in two
stages. For both matching pairs, I match respondents according the age, gender, education status,
immigrant origin and generation, and neighborhood rates of immigration and unemployment. In
pair 1, I compare the effect of not experiencing any police identity checks in the past year to
experiencing one. In pair 2, I retain the same control group of zero police stops, but changing the
treatment to experiencing multiple police identity checks in the past year. Differences in L1, a
comparative measure of imbalance, shows that coarsened exact matching increases the level of
balance at the cost of substantial decrease in sample size (see Table 3).
19
Figure 5: Adjusted risk difference of French identity measures by frequency of identity
checks, matched and unmatched samples
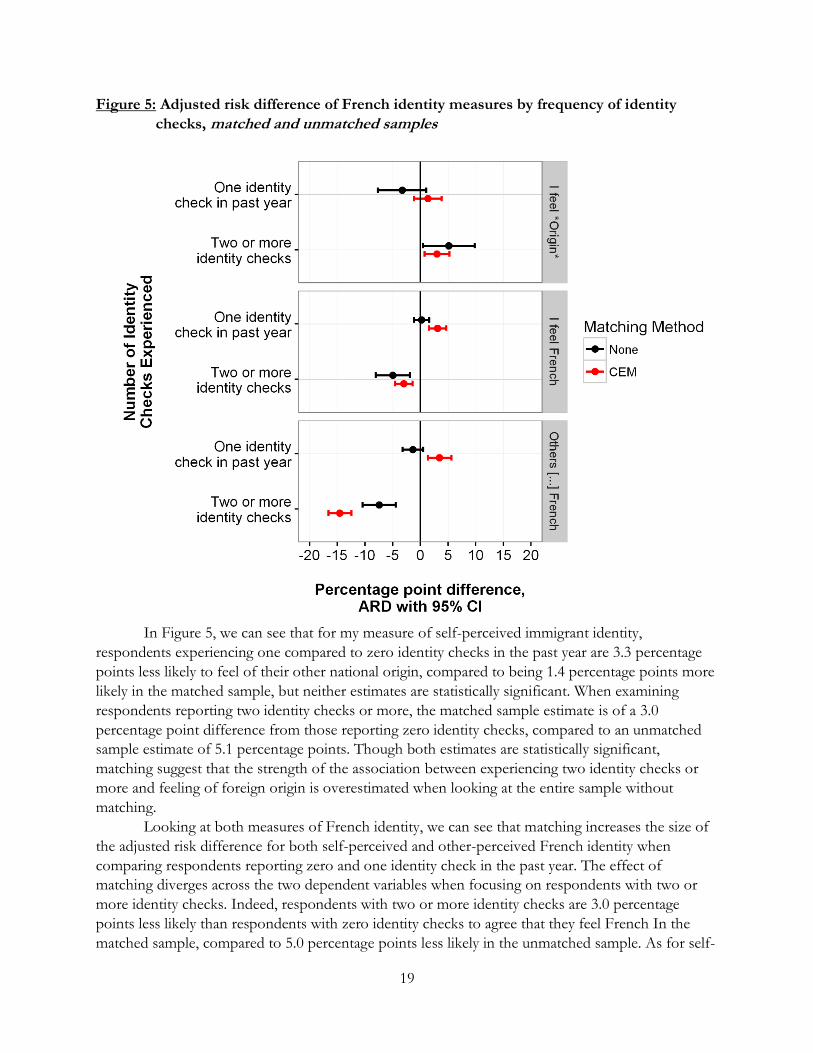
In Figure 5, we can see that for my measure of self-perceived immigrant identity,
respondents experiencing one compared to zero identity checks in the past year are 3.3 percentage
points less likely to feel of their other national origin, compared to being 1.4 percentage points more
likely in the matched sample, but neither estimates are statistically significant. When examining
respondents reporting two identity checks or more, the matched sample estimate is of a 3.0
percentage point difference from those reporting zero identity checks, compared to an unmatched
sample estimate of 5.1 percentage points. Though both estimates are statistically significant,
matching suggest that the strength of the association between experiencing two identity checks or
more and feeling of foreign origin is overestimated when looking at the entire sample without
matching.
Looking at both measures of French identity, we can see that matching increases the size of
the adjusted risk difference for both self-perceived and other-perceived French identity when
comparing respondents reporting zero and one identity check in the past year. The effect of
matching diverges across the two dependent variables when focusing on respondents with two or
more identity checks. Indeed, respondents with two or more identity checks are 3.0 percentage
points less likely than respondents with zero identity checks to agree that they feel French In the
matched sample, compared to 5.0 percentage points less likely in the unmatched sample. As for self-

20
perceived immigrant identity, coarsened exact matching seems to decrease the size of the risk
difference for self-perceived French identity. For other-perceived French identity however,
matching increases the absolute size of the risk difference, from a negative 7.5 percentage point
difference between respondents with zero and two or more identity checks, to a negative 14.6
percentage point difference. These findings confirm what is shown in previous figures: that the
magnitude of the association between other-perceived French identity and frequent identity checks
is greater than when looking at the two self-perceived dependent measures of national identity.
DISCUSSION
While the majority of immigrants in this study’s sample (especially second-generation
immigrants) reporting feeling French, a sizeable proportion of them also do not believe that others
do not see them as French. Examining the likelihood of self-perceived and other-perceived French
identity by origin group, I find that for immigrant respondents, the dependent variable that is most
strongly associated with the experience of frequent identity checks is their belief that others
perceived them as French. This finding is reinforced by the use of coarsened exact matching to
examine differences in French identity across respondents of similar demographic profiles. While
the use of observational data does not allow me to completely rule out reverse causality and/or
omitted variable bias, these findings suggest a stronger effect of frequent identity checks on other-
perceived French identity compared to self-perceived identity. Even without presuming causation in
this particular direction, these findings show that different dimensions of national identity have
varying relationships with day-to-day symbolic experiences such as police identity checks. Moreover,
this study suggests that the majority of immigrants maintain a territory-based view of national
identity that is less strongly tied to experiences in the host society than other dimensions of identity
such as descent-based national identity and other-perceived national identity. Such findings point to
the importance of immigrant generation (and country of birth) as an important mediator of ethnic
identity, as identification and rejection dynamics likely do not operate in the same way for foreign-
born immigrants compared to their children. This study therefore highlights the need for more
research into the different dimensions of national identity and their relationship to experiences in
the host society.
References
Alba, R. D., & Nee, V. (2003). Remaking the American mainstream: Assimilation and contemporary immigration. Cambridge, MA: Harvard University Press.
Amiraux, Valérie and Patrick Simon. (2006). “There are no Minorities Here: Cultures of Scholarship and Public Debate on Immigrants and Integration in France.” International Journal of Comparative Sociology. 47(3-4): 191-215.
Bail, C. a. (2008). The Configuration of Symbolic Boundaries against Immigrants in Europe. American Sociological Review, 73(1), 37–59.
Berry, J. (1997). “Immigration, acculturation and adaptation.” Applied Psychology: An International Review. 46:5-68.
Blum, Alain and France Guérin-Pace. (2008). “From Measuring Integration to Fighting Discrimination: The Illusion of ‘Ethnic Statistics’.” French Politics, Culture & Society. 26(1): 45-61.
Body-Gendrot, S. (2005). Les musulmans et les instruments de l’intégration: la police-approche comparative. Musulmans de France et d’Europe, Paris, CNRS …, 1–25.

21
Branscombe, N. R., Schmitt, M. T., & Harvey, R. D. (1999). Perceiving pervasive discrimination among African Americans: Implications for group identification and well-being. Journal of Personality and Social Psychology, 77(1), 135–149.
Brayne, Sarah. “Surveillance and System Avoidance: Criminal Justice Contact and Institutional Attachment.” American Sociological Review. 79(3): 367-391.
Brinbaum, Y., & Safi, M. (n.d.). Les discriminations en France : entre perception et expérience. Brubaker, Rogers. (1992). Citizenship and Nationhood in France and Germany. Cambridge, MA:
Harvard University Press. Calavita K. 2007. Immigration law, race, and identity. Annu. Rev. Law Soc. Sci. 3(1):1–20 Duguet. Emmanuel, Noam Leandri, Yannick L’Horty, Pascale Petit. (2007). “Discriminations à
l’enbauche: Un testing sur les jeunes des banlieues d’ile-de-France.” Centre d’analyse stratégique : Rapports et documents.
Echchaibi, N. 2007. “Beur FM and the Suburban Riots in France”. Journal of Intercultural Studies. 28(3), 301-316.
Epp, C. R., Maynard-Moody, S., & Haider-Markel, D. P. (2014). Pulled over: How police stops define race and citizenship.
Fagan, J. (2004). An Analysis of the NYPD’s Stop-and-Frisk Policy in the Context of Claims of Racial Bias. Columbia Public Law & Legal Theory Working Papers, (05).
Fagan, J., & Davies, G. (2000). Street stops and broken windows: Terry, race, and disorder in New York City. Fordham Urb. LJ, 28(2).
Fassin, D. 2013. Enforcing order: An ethnography of urban policing (English ed.). Cambridge, UK: Polity Press.
Gans, Herbert. 1982 The Urban Villagers: Group and Class in the Life of Italian-Americans. 1962. Reprint. New York: The Free Press.
Iacus, Stefano M, Gary King, and Giuseppe Porro. 2011. “Causal Inference Without Balance Checking: Coarsened Exact Matching.” Political Analysis.
Jasinskaja-Lahti, I., Liebkind, K., & Solheim, E. (2009). To Identify or Not To Identify? National Disidentification as an Alternative Reaction to Perceived Ethnic Discrimination. Applied Psychology, 58(1), 105–128.
Jennings, J. (2000). Citizenship, Republicanism and Multiculturalism in Contemporary France. British Journal of Political Science, 30(4), 575–598.
Jobard, F., Lévy, R., Lamberth, J., & Névanen, S. (2012). Mesurer les discriminations selon l’apparence : une analyse des contrôles d'identité à Paris. Population, 67(3), 423.
Johnsen, S., & Fitzpatrick, S. (2010). Revanchist Sanitisation or Coercive Care? The Use of Enforcement to Combat Begging, Street Drinking and Rough Sleeping in England. Urban Studies, 47(8), 1703–1723.
Jugé, Tony S. and Michael P. Perez. (2006). “The Modern Colonial Politics of Citizenship and Whiteness in France.” Social Identities. 12(2): 187-212.
Kleinman, L. C., & Norton, E. C. (2009). What’s the Risk? A Simple Approach for Estimating Adjusted Risk Measures from Nonlinear Models Including Logistic Regression. Health Services Research, 44(1), 288–302. http://doi.org/10.1111/j.1475-6773.2008.00900.x
Klinger, D. A. (1997). Negotiating order in patrol work: An ecological theory of police response to deviance. Criminology, 35(2), 277–306.
L’Express.fr. 2012. “Plus de reconduites à la frontière en 2012 qu'en 2011, selon le cabinet de Valls.” L’Express.
Lipsky, M. (1980). Street-level bureaucracy: Dilemmas of the individual in public services. New York: Russell Sage Foundation.
22
Medina Ariza, J. J. (2014). Police-initiated contacts: young people, ethnicity, and the “usual suspects.” Policing and Society, 24(2), 208–223.
Menjívar, C., & Abrego, L. J. (2013). Legal Violence : Immigration Law and the Lives of Central American Immigrants. American Journal of Sociology, 117(5), 1380–1421.
Miller, J., Gounev, P., Pap, a. L., Wagman, D., Balogi, a., Bezlov, T., … Vargha, L. (2008). Racism and Police Stops: Adapting US and British Debates to Continental Europe. European Journal of Criminology, 5(2), 161–191.
Mouhannna, C. (2009). Politique du chiffre et police des étrangers. Plein Droit, 82(3), 3. Norton, Edward C, Morgen M. Miller, and Lawrence C. Kleinman. 2012. “Computing adjusted risk
ratios and risk differences in Stata.” The Stata Journal. Ogien, A. (2010). La valeur sociale du chiffre. La quantification de l’action publique entre
performance et démocratie. Revue Française de Socio-Économie, (5), 19–40. Omi, M., & Winant, H. (1994). Racial formation in the United States: From the 1960s to the 1990s.
New York: Routledge. Pager, D. (2008). The Republican ideal?: National minorities and the criminal justice system in
contemporary France. Punishment & Society, 10(4), 375–400. Philifert, Pascale. (2006). « Quand the politique parle du quartier ». in Bacque, M.-H., Guerin-Pace,
F., & Authier, J.-Y. Le quartier. Paris: La Découverte. Phinney, J. S. (1990). Ethnic identity in adolescents and adults: review of research. Psychological
Bulletin, 108(3), 499–514. Portes, a., & Zhou, M. (1993). The New Second Generation: Segmented Assimilation and its
Variants. The ANNALS of the American Academy of Political and Social Science, 530(1), 74–96.
Sampson, Robert J. and Dawn J. Bartusch. 1998. “Legal Cynicism and (Subcultural?) Tolerance of Deviance: The Neighborhood Context of Racial Differences.” Law and Society Review 32:777–804.
Saperstein, A., Penner, A. M., & Light, R. (2013). Racial Formation in Perspective: Connecting Individuals, Institutions, and Power Relations. Annual Review of Sociology, 39(1), 359–378.
Shon, Jl Pan Ké, and Gregory Verdugo. (2014). “Forty Years of Immigrant Segregation in France, 1968-2007: How Different Is the New Immigration?” 52(8062):823–40.
Simon, P. (2012). Contested Citizenship in France : The Republican Politics of Identity and Integration, 203–217.
Skrobanek, J. (2009). Perceived Discrimination, Ethnic Identity and the (Re-) Ethnicisation of Youth with a Turkish Ethnic Background in Germany. Journal of Ethnic and Migration Studies, 35(4), 535–554.
Smith, D. A. (1986). The Neighborhood Context of Police Behavior. Crime and Justice, 8(1986), 313–341.
Stuart, Forrest, Amada Arment and Melissa Osborne. 2015. “Legal Control of Marginal Groups.” Annual Review of Law and Social Science. 11: 235-254.
Tajfel, H. (1974). Social identity and intergroup behaviour. Social Science Information, 13(2), 65–93. Tissot, Sylvie (2006). « Sociologie urbaine et politique de la ville : retour sur une rencontre autour des
quartiers d’exit ». in Bacque, M.-H., Guerin-Pace, F., & Authier, J.-Y. Le quartier. Paris: La Découverte.
Tosi, A. (2007). Homelessness and the Control of Public Space – Criminalising the Poor ? European Journal of Homelessness, 1, 224–235.
Tribalat, Michèle. 1999. Dreux, voyage au cœur du malaise français. Paris, Syros.

23
Waters, M. C. (1999). Black identities: West Indian immigrant dreams and American realities. New York: Russell Sage Foundation.
Weil, P. (2002). Qu'est-ce qu'un Franc ais?: Histoire de la nationalite franc aise depuis la Revolution. Paris: Grasset.
Wilson, J., & Kelling, G. (1982). Broken windows. Atlantic Monthly, (March), 1–9. Zauberman, R. (1998). Gendarmerie et gens du voyage en région parisienne. Cahiers Internationaux
de Sociologie, 105, 415–438.
Related Documents