Intelligent Systems Conference 2018 6-7 September 2018 | London, UK Dimensionality Reduction and Pattern Recognition of Flow Regime Using Acoustic Data Nafiseh Vahabi Department of Electronic and Electrical Engineering University College London UK, London Email: [email protected] Dr. David R. Selviah Department of Electronic and Electrical Engineering University College London UK, London Email: [email protected] Abstract—In this study we investigated the novel application of Principle Component Analysis (PCA) in order to reduce the dimensionality of acoustic data. The acoustic data are recorded by fibre optic distributed acoustic sensors which are attached along 4000 (m) pipe with frequency of 10 (kHz) and for a period of 24 hours. Data are collected from distributed acoustic sensors are very large and we need to identify the area that contains the most informative signals. The algorithm is applied to water, oil and gas dataset. We aimed to form the smaller dataset which preserves the pattern of original dataset but it is more efficient and less expensive for further analysis. The result of this study will lead to automation of multiphase flow pattern recognition for oil and gas industry application. Index Terms—Feature extraction, Principle component analy- sis (PCA), Signal processing, Dimension reduction I. I NTRODUCTION Monitoring in-well flow was a fundamental subject for oil industry to manage the oil field. Flow surveillance can help identify the region of unusual condition in the pipes to optimise and maximise the oil production [1]. Furthermore, effective flow monitoring results in low cost intervention which means material cost savings are achievable by the oil companies. Flow regime recognition techniques and devices became even more desirable for oil and gas industries as the they need to separate unprocessed multiphase flow materi- als [2]. In addition, receiving real time flow information in downhole flow for injection wells enables the changing of the injection rate appropriately which improves the reservoir life time and efficiency of oil producers. The other potential applications are leak detection, monitoring the condition of flow control devices in downhole and identifying the gas breakthrough [3]. Many investigations performed and techniques developed by experts to overcome the challenge exists to process oil and gas data [4]. The ultrasonic techniques are one of the popular methods for measuring the flow meter and to extract the required information from the flow in the oil industry [4]. These methods have the advantage of inexpensive, non- invasive and robust although the signal needs to calibrate before any measurement is taken. Artificial Neural Network (ANN) is proposed as an alternative solution to overcome the difficulties of prior methods because it improves the precision of flow measurement and in some cases no pre-processing is required [6], [7]. Ultrasonic attenuation data fed into the neural network for training and learning the multiphase flow pattern. In recent work [8] the use of Artificial Neural network with dual energy fan-beam gamma-ray attenuation technique increased the accuracy of oil, gas and water classification with mean absolute error of less than 5.68% . They used radial basis function to train the ANN and classify the flow regime by selecting just four features. The methodology was developed to recognise the pattern in gamma-ray pulse height distributions using ANN to identify the flow regime in multiphase flow [9]. This method has also been developed using ANN to describe the details of two phase flow regimes [10]. The network trained by Levenberg-Marquardt algorithm is based on the competing forces occurring within the multiphase flow. A similar procedure was followed by another research group [11] when they developed a new multiphase flow metering device for real time multi phase flow classification.Their device used multilayer Neural Network to process the signals which the neural network trained by using the parameters in physical models of multiphase fluid. Although the few challenges for oil and gas processing has been addressed by mainly developing new sensors and applying Artificial Intelligence algorithms for pattern recog- nition in multiphase flow, but these techniques have their drawbacks. The sensors produce a lot of data, Big Data, which is sometimes complex and requires an expensive storage and process resources. The big data complexity refers to its Volume, Variety, Verac- ity and Velocity [12]. There are key challenges for processing big data such as; data quality, data validation, data cleansing, feature engineering, high dimensionality, data reduction, data representation, distributed data sources, data sampling, real time analysis, scalability of algorithms, data visualisation, par- allel and distributed data processing, decision making and data discovery. Therefore, the different methodologies developed to handle the complexity of Big data depend on the application [13]. The number of technique are increasing and the demand for processing and storing Big Data arises Cloud computing, quantum computing and bio-inspired computing are just a few examples of these technologies [13], [14]. IEEE 1 | Page

Welcome message from author
This document is posted to help you gain knowledge. Please leave a comment to let me know what you think about it! Share it to your friends and learn new things together.
Transcript
Intelligent Systems Conference 20186-7 September 2018 | London, UK
Dimensionality Reduction and Pattern Recognitionof Flow Regime Using Acoustic Data
Nafiseh VahabiDepartment of Electronic
and Electrical EngineeringUniversity College London
UK, LondonEmail: [email protected]
Dr. David R. SelviahDepartment of Electronicand Electrical Engineering
University College LondonUK, London
Email: [email protected]
Abstract—In this study we investigated the novel applicationof Principle Component Analysis (PCA) in order to reduce thedimensionality of acoustic data. The acoustic data are recordedby fibre optic distributed acoustic sensors which are attachedalong 4000 (m) pipe with frequency of 10 (kHz) and for a periodof 24 hours. Data are collected from distributed acoustic sensorsare very large and we need to identify the area that contains themost informative signals. The algorithm is applied to water, oiland gas dataset. We aimed to form the smaller dataset whichpreserves the pattern of original dataset but it is more efficientand less expensive for further analysis. The result of this studywill lead to automation of multiphase flow pattern recognitionfor oil and gas industry application.
Index Terms—Feature extraction, Principle component analy-sis (PCA), Signal processing, Dimension reduction
I. INTRODUCTION
Monitoring in-well flow was a fundamental subject foroil industry to manage the oil field. Flow surveillance canhelp identify the region of unusual condition in the pipes tooptimise and maximise the oil production [1]. Furthermore,effective flow monitoring results in low cost interventionwhich means material cost savings are achievable by the oilcompanies. Flow regime recognition techniques and devicesbecame even more desirable for oil and gas industries as thethey need to separate unprocessed multiphase flow materi-als [2]. In addition, receiving real time flow information indownhole flow for injection wells enables the changing ofthe injection rate appropriately which improves the reservoirlife time and efficiency of oil producers. The other potentialapplications are leak detection, monitoring the condition offlow control devices in downhole and identifying the gasbreakthrough [3].
Many investigations performed and techniques developedby experts to overcome the challenge exists to process oiland gas data [4]. The ultrasonic techniques are one of thepopular methods for measuring the flow meter and to extractthe required information from the flow in the oil industry[4]. These methods have the advantage of inexpensive, non-invasive and robust although the signal needs to calibratebefore any measurement is taken. Artificial Neural Network(ANN) is proposed as an alternative solution to overcome thedifficulties of prior methods because it improves the precision
of flow measurement and in some cases no pre-processingis required [6], [7]. Ultrasonic attenuation data fed into theneural network for training and learning the multiphase flowpattern. In recent work [8] the use of Artificial Neural networkwith dual energy fan-beam gamma-ray attenuation techniqueincreased the accuracy of oil, gas and water classification withmean absolute error of less than 5.68% . They used radial basisfunction to train the ANN and classify the flow regime byselecting just four features. The methodology was developed torecognise the pattern in gamma-ray pulse height distributionsusing ANN to identify the flow regime in multiphase flow [9].This method has also been developed using ANN to describethe details of two phase flow regimes [10]. The networktrained by Levenberg-Marquardt algorithm is based on thecompeting forces occurring within the multiphase flow. Asimilar procedure was followed by another research group [11]when they developed a new multiphase flow metering devicefor real time multi phase flow classification.Their device usedmultilayer Neural Network to process the signals which theneural network trained by using the parameters in physicalmodels of multiphase fluid.
Although the few challenges for oil and gas processinghas been addressed by mainly developing new sensors andapplying Artificial Intelligence algorithms for pattern recog-nition in multiphase flow, but these techniques have theirdrawbacks. The sensors produce a lot of data, Big Data, whichis sometimes complex and requires an expensive storage andprocess resources.
The big data complexity refers to its Volume, Variety, Verac-ity and Velocity [12]. There are key challenges for processingbig data such as; data quality, data validation, data cleansing,feature engineering, high dimensionality, data reduction, datarepresentation, distributed data sources, data sampling, realtime analysis, scalability of algorithms, data visualisation, par-allel and distributed data processing, decision making and datadiscovery. Therefore, the different methodologies developed tohandle the complexity of Big data depend on the application[13]. The number of technique are increasing and the demandfor processing and storing Big Data arises Cloud computing,quantum computing and bio-inspired computing are just a fewexamples of these technologies [13], [14].
IEEE 1 | P a g e
Intelligent Systems Conference 20186-7 September 2018 | London, UK
TABLE ITHE PROPERTIES OF PIPES
Well Type Packer True Vertical Depth(m) Length Optical (m)Oil 2600 3000Gas 2700 3500
Water 2400 3200
Our data collection starts by running an optical fibre downa well alongside a pipe carrying a fluid, and it is attached tothat pipe at several points. Then a laser pulse is sent downthe optical fibre and it reflects from non-uniformities in theglas [5] from every point along the fibre. As the fluid mixturetravels through the pipe its motion is very turbulent and itgenerates a noisy sound. This sound affects the light pulse sothat when it is received at the surface again, the sound can berecorded from every depth as if it was an array of thousandsof microphones about a meter or less apart, all along the wellpipe over a distance of thousands of meters. The pipe acts likean acoustic wave guide tending to guide sound waves up anddown the pipe. The sound is recorded continuously at eachmicrophone and this results in a very large amount of datarecorded each day, typically 48 Terabytes.
In this study the novel application of principle componentanalysis is presented. The focus on this work is investigatingthe effect of reducing the dimensionality of the acoustic dataprior to any other further analysis. The result of this study willlead to the automation the multiphase flow pattern recognitionfor oil and gas industry application.
II. EXPERIMENTAL DATA
The dataset was collected from distributed acoustic sensorswhich attached along 4235 (m) of pipes with one meter apart.Data is collected with 10 kHz spatial frequency from oil, waterand gas pipes. Table I provides the details of each pipeline suchas the length of optical fibre for each pipe [3]. The PackerTrue Vertical Depth is the vertical distance from a final depthto a point at the surface which is usually less than the opticalfibre length. The other parameters of the pipes such as theirdiameter and pipe material are not considered in this study.Also, the optical characteristics (single or multiphase opticalfibre), the position of the optical fibre and sensor’s parametersare not included in this research.
III. METHODOLOGY AND RESULT
1) Principle Componet Analysis: Principle ComponentAnalysis (PCA) is an unsupervised technique which reducethe dimensionality of data by finding the new variable that arelinear combination of the variable in the dataset. Therefore thealgorithm maximises the variance of uncorrelated variablescalled principle components [15]. PCA simplifies the datastructure by selecting the significant data points [17]. In ourapplication we aim to find out which part of the data setbest describes the information so PCA reduces the dimensionof acoustic data. Fig. ?? shows three dimensional data withdistance and time in x and y axis respectively and acousticenergy in z axis. Therefore, the PCA applied on our high
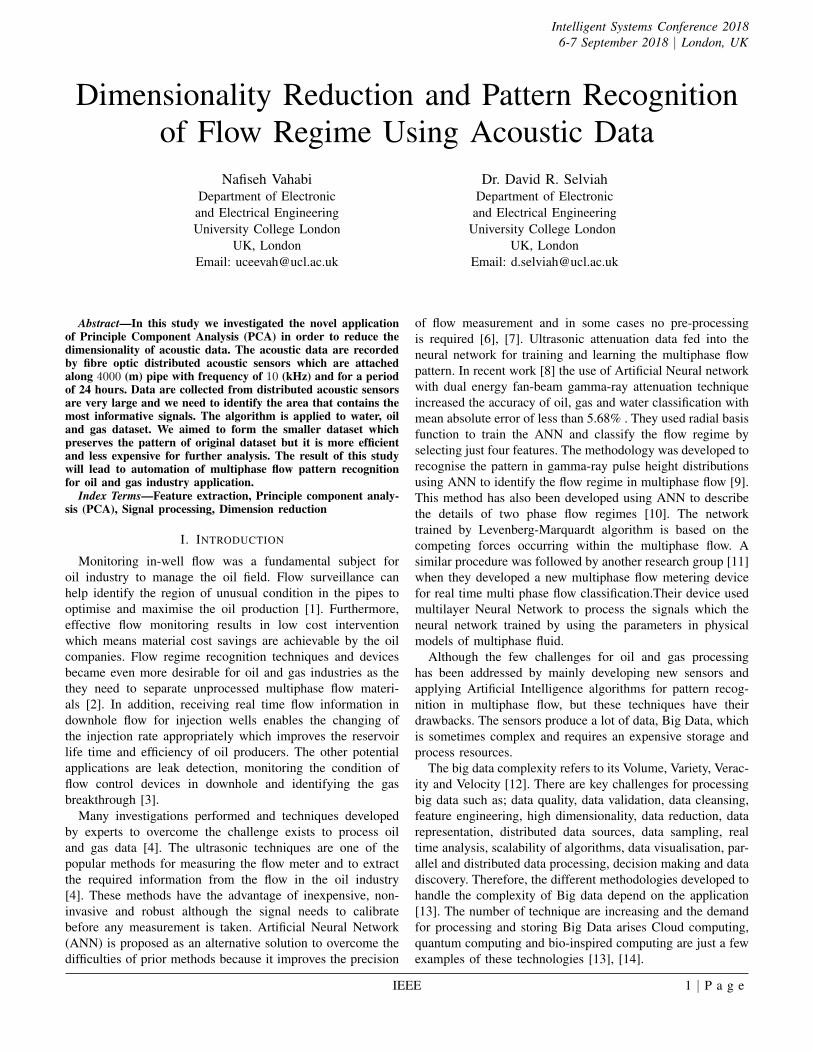
Fig. 1. Time vs distance data set.
dimensional dataset both with regards to distance and also withregards to time. The first step in PCA algorithm to standardizethe original dataset by using Eq. 1.
X =x− µσ
(1)
Fig. 2. Eigenvalues. The strenght of 4000 eigenvalues which each corre-sponded with 4000 feature vectors is shown.
Where X , x, µ and σ are normalised signal, input signal,mean of all data set and standard deviation of data set respec-tively. This follows by calculating the Covariance matrix (Eq.2) and finding the eigenvalues and eigenvectors of covariancematrix by solving the Eq. 3. If the dataset is n dimension thecovariance matrix is n × n. The Eq. 2 shows the covariancematrix for 2 dimensional data set [16].
IEEE 2 | P a g e
Intelligent Systems Conference 20186-7 September 2018 | London, UK
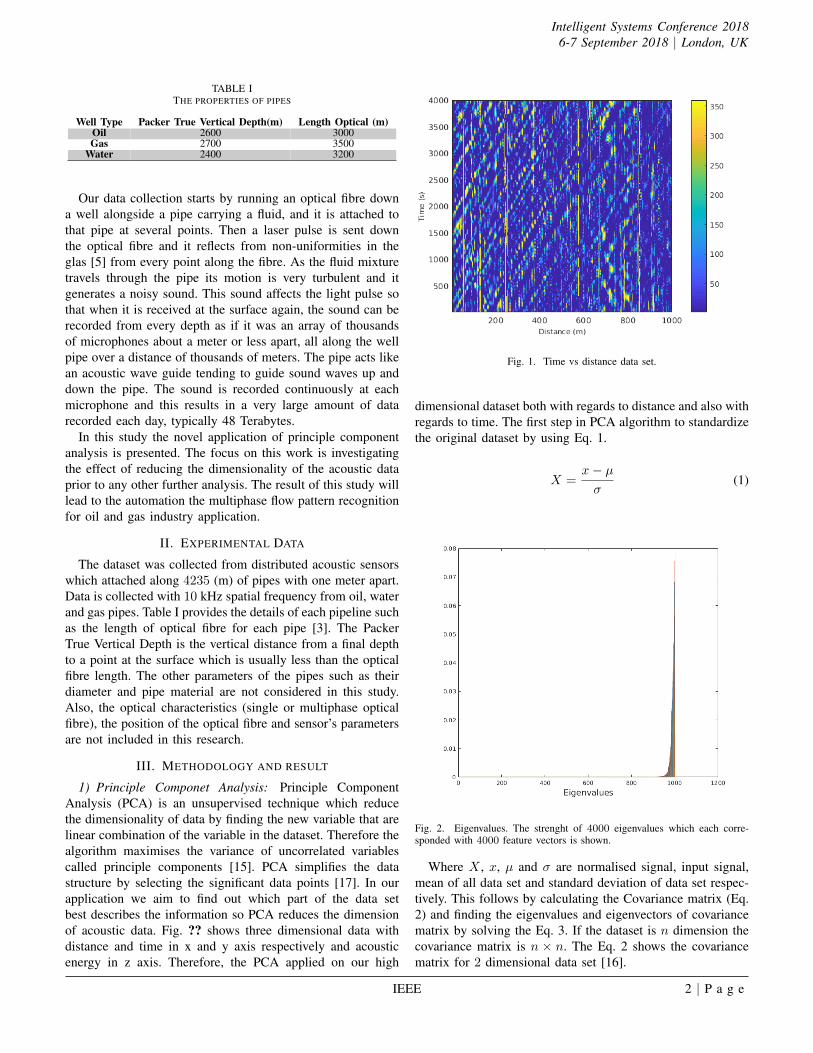
(a) Acoustic energy verces distance (water pipe)
(b) Variance of eigenvalue
Fig. 3. PCA result for water dataset with regards to distance. PCA applied towater dataset to reduce the dimensionality with regards to distance (a). Thefirst fifty eigenvalues (b) plotted, however the eigenvelues are very small afterthe 23rd one.
A =
[V ar(X1) Cov(X1, X2)
Cov(X2, X1) V ar(X2)
](2)
Where A is the covariance matrix, X1 and X2 are datasetbelong to first and second dimension of dataset.
det(δI −A) = 0 (3)
Where A and I have the same dimension and I is an identitymatrix. The condition to solve the Eq. 3 is (δI − A)v = 0where δ is eigenvalue and v is eigenvector. The larger eigen-values related to more significant component of the data orprinciple component. Therefore we can form our featuresvector by choosing the number the principle component whichin our case we selected the first 50 (Eq. 4). The eigen values
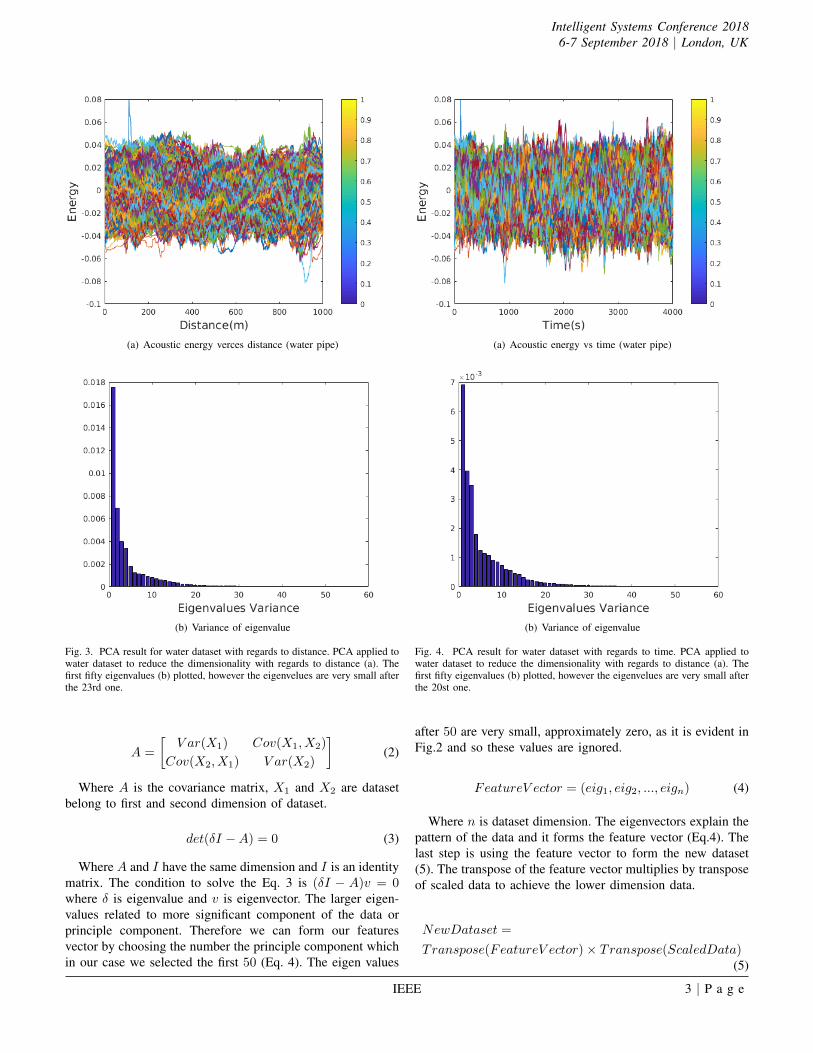
(a) Acoustic energy vs time (water pipe)
(b) Variance of eigenvalue
Fig. 4. PCA result for water dataset with regards to time. PCA applied towater dataset to reduce the dimensionality with regards to distance (a). Thefirst fifty eigenvalues (b) plotted, however the eigenvelues are very small afterthe 20st one.
after 50 are very small, approximately zero, as it is evident inFig.2 and so these values are ignored.
FeatureV ector = (eig1, eig2, ..., eign) (4)
Where n is dataset dimension. The eigenvectors explain thepattern of the data and it forms the feature vector (Eq.4). Thelast step is using the feature vector to form the new dataset(5). The transpose of the feature vector multiplies by transposeof scaled data to achieve the lower dimension data.
NewDataset =
Transpose(FeatureV ector)× Transpose(ScaledData)(5)
IEEE 3 | P a g e
Intelligent Systems Conference 20186-7 September 2018 | London, UK
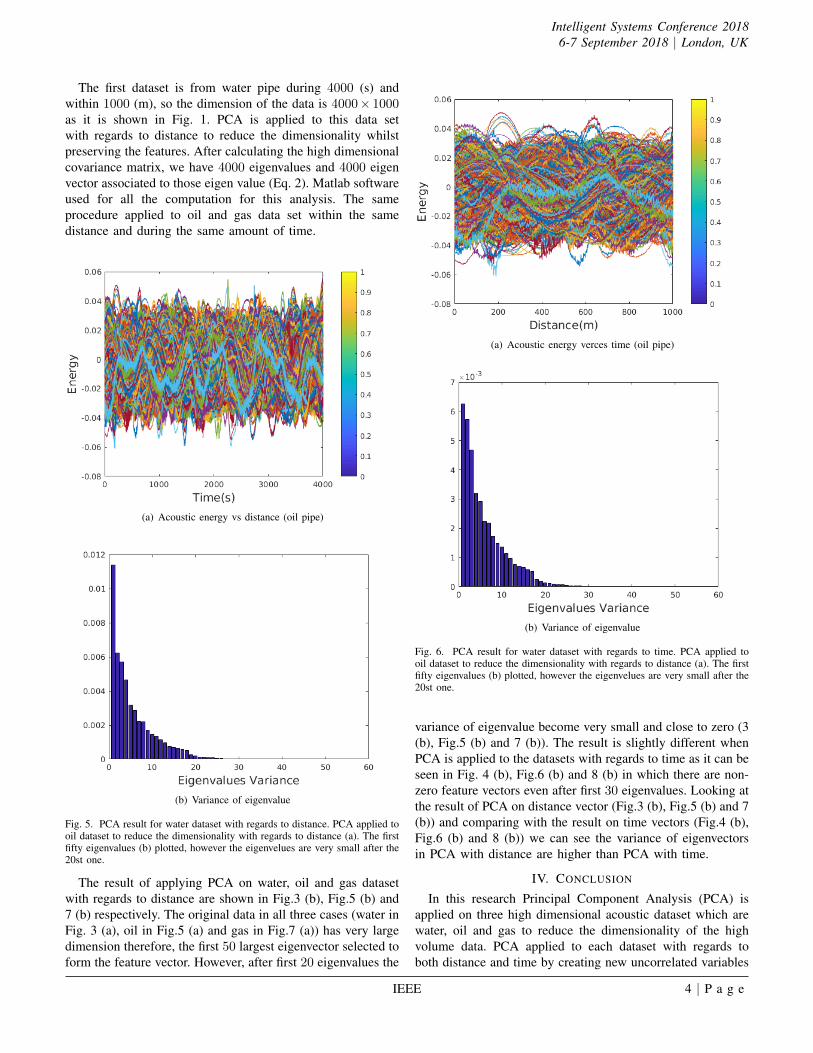
The first dataset is from water pipe during 4000 (s) andwithin 1000 (m), so the dimension of the data is 4000× 1000as it is shown in Fig. 1. PCA is applied to this data setwith regards to distance to reduce the dimensionality whilstpreserving the features. After calculating the high dimensionalcovariance matrix, we have 4000 eigenvalues and 4000 eigenvector associated to those eigen value (Eq. 2). Matlab softwareused for all the computation for this analysis. The sameprocedure applied to oil and gas data set within the samedistance and during the same amount of time.
(a) Acoustic energy vs distance (oil pipe)
(b) Variance of eigenvalue
Fig. 5. PCA result for water dataset with regards to distance. PCA applied tooil dataset to reduce the dimensionality with regards to distance (a). The firstfifty eigenvalues (b) plotted, however the eigenvelues are very small after the20st one.
The result of applying PCA on water, oil and gas datasetwith regards to distance are shown in Fig.3 (b), Fig.5 (b) and7 (b) respectively. The original data in all three cases (water inFig. 3 (a), oil in Fig.5 (a) and gas in Fig.7 (a)) has very largedimension therefore, the first 50 largest eigenvector selected toform the feature vector. However, after first 20 eigenvalues the
(a) Acoustic energy verces time (oil pipe)
(b) Variance of eigenvalue
Fig. 6. PCA result for water dataset with regards to time. PCA applied tooil dataset to reduce the dimensionality with regards to distance (a). The firstfifty eigenvalues (b) plotted, however the eigenvelues are very small after the20st one.
variance of eigenvalue become very small and close to zero (3(b), Fig.5 (b) and 7 (b)). The result is slightly different whenPCA is applied to the datasets with regards to time as it can beseen in Fig. 4 (b), Fig.6 (b) and 8 (b) in which there are non-zero feature vectors even after first 30 eigenvalues. Looking atthe result of PCA on distance vector (Fig.3 (b), Fig.5 (b) and 7(b)) and comparing with the result on time vectors (Fig.4 (b),Fig.6 (b) and 8 (b)) we can see the variance of eigenvectorsin PCA with distance are higher than PCA with time.
IV. CONCLUSION
In this research Principal Component Analysis (PCA) isapplied on three high dimensional acoustic dataset which arewater, oil and gas to reduce the dimensionality of the highvolume data. PCA applied to each dataset with regards toboth distance and time by creating new uncorrelated variables
IEEE 4 | P a g e
Intelligent Systems Conference 20186-7 September 2018 | London, UK
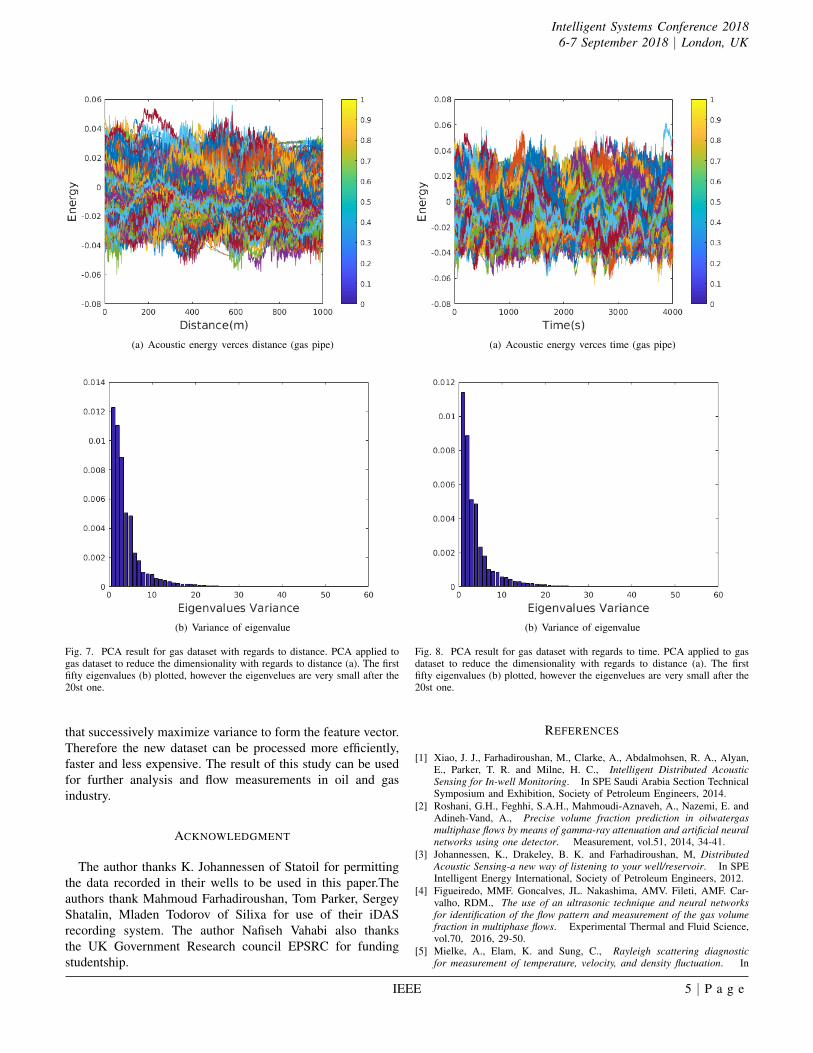
(a) Acoustic energy verces distance (gas pipe)
(b) Variance of eigenvalue
Fig. 7. PCA result for gas dataset with regards to distance. PCA applied togas dataset to reduce the dimensionality with regards to distance (a). The firstfifty eigenvalues (b) plotted, however the eigenvelues are very small after the20st one.
that successively maximize variance to form the feature vector.Therefore the new dataset can be processed more efficiently,faster and less expensive. The result of this study can be usedfor further analysis and flow measurements in oil and gasindustry.
ACKNOWLEDGMENT
The author thanks K. Johannessen of Statoil for permittingthe data recorded in their wells to be used in this paper.Theauthors thank Mahmoud Farhadiroushan, Tom Parker, SergeyShatalin, Mladen Todorov of Silixa for use of their iDASrecording system. The author Nafiseh Vahabi also thanksthe UK Government Research council EPSRC for fundingstudentship.
(a) Acoustic energy verces time (gas pipe)
(b) Variance of eigenvalue
Fig. 8. PCA result for gas dataset with regards to time. PCA applied to gasdataset to reduce the dimensionality with regards to distance (a). The firstfifty eigenvalues (b) plotted, however the eigenvelues are very small after the20st one.
REFERENCES
[1] Xiao, J. J., Farhadiroushan, M., Clarke, A., Abdalmohsen, R. A., Alyan,E., Parker, T. R. and Milne, H. C., Intelligent Distributed AcousticSensing for In-well Monitoring. In SPE Saudi Arabia Section TechnicalSymposium and Exhibition, Society of Petroleum Engineers, 2014.
[2] Roshani, G.H., Feghhi, S.A.H., Mahmoudi-Aznaveh, A., Nazemi, E. andAdineh-Vand, A., Precise volume fraction prediction in oilwatergasmultiphase flows by means of gamma-ray attenuation and artificial neuralnetworks using one detector. Measurement, vol.51, 2014, 34-41.
[3] Johannessen, K., Drakeley, B. K. and Farhadiroushan, M, DistributedAcoustic Sensing-a new way of listening to your well/reservoir. In SPEIntelligent Energy International, Society of Petroleum Engineers, 2012.
[4] Figueiredo, MMF. Goncalves, JL. Nakashima, AMV. Fileti, AMF. Car-valho, RDM., The use of an ultrasonic technique and neural networksfor identification of the flow pattern and measurement of the gas volumefraction in multiphase flows. Experimental Thermal and Fluid Science,vol.70, 2016, 29-50.
[5] Mielke, A., Elam, K. and Sung, C., Rayleigh scattering diagnosticfor measurement of temperature, velocity, and density fluctuation. In
IEEE 5 | P a g e
Intelligent Systems Conference 20186-7 September 2018 | London, UK
44th AIAA Aerospace Sciences Meeting and Exhibit, IEEE Transactionson, 2006, 9-12.
[6] Bishop, C.M., Novelty detection and neural network validation. IEEProceedings-Vision, Image and Signal processing, vol.144, no.4 1994,217-222.
[7] Al-Naser, M., Elshafei, M. and Al-Sarkhi, A., Artificial neural networkapplication for multiphase flow patterns detection: A new approach.Journal of Petroleum Science and Engineering, vol.145, no.4 2016, 548-564.
[8] Roshani, GH., Nazemi, E. and Roshani, MM., Intelligent recognition ofgas-oil-water three-phase flow regime and determination of volume frac-tion using radial basis function. Flow Measurement and Instrumentation,vol.54, 2017, 39-45.
[9] C.M. Salgado, C.M.N.A. Pereira, R. Schirru, L.E.B. Brandao., Flowregime identi- fication and volume fraction prediction in multiphaseflows by means of gamma-ray attenuation and artificial neural networks.Progress in Nuclear Energy, vol.54, no.6 2010, 555562.
[10] E.H. Inoue, R.D.M. Carvalho, V. Estevam, A.C. Bannwart, A.M.F.Fileti., Development of a Neural Network for the Identification of Mul-tiphase Flow Patterns. 14th International Conference on IntelligentSystems and Control (ISC 2013) 2013.
[11] Meribout, M., Al-Rawahi, N. Z., Ahmed M., Al-Bimani, A., Al-Busaidi, K., Meribout, A., A multisensor intelligent device for real-time multiphase flow metering in oil fields. IEEE Transactions onInstrumentation and Measurement, vol.59, no.6 2010, 1507-1519.
[12] Najafabadi, M. M., Villanustre, F., Khoshgoftaar, T. M., Seliya, N., Wald,R., and Muharemagic, E., Deep learning applications and challengesin big data analytics. Journal of Big Data, vol.1, no.1 2015, .
[13] Chen, C.P. and Zhang, C.Y., Data-intensive applications, challenges,techniques and technologies: A survey on Big Data. InformationSciences 275, vol.1 2014, 314-347.
[14] Poria, S., Cambria, E., Hussain, A. and Huang, G.B., Towards anintelligent framework for multimodal affective data analysis. NeuralNetworks, vol.63 2015, 104-116.
[15] Jolliffe, I.T. and Cadima, J., Principal component analysis: a review andrecent developments. Phil. Trans. R. Soc. A, 374(2065), p.20150202,2016.
[16] Bro, R. and Smilde, A.K., Principal component analysis. AnalyticalMethods, vol.6, no.9 2014.
[17] Li, K., Hu, C., Liu, G. and Xue, W., Building’s electricity consump-tion prediction using optimized artificial neural networks and principalcomponent analysis. Energy and Buildings, vol.108, 106-113, 2015.
IEEE 6 | P a g e
Related Documents