Dimension reduction : PCA and Clustering Christopher Workman Center for Biological Sequence Analysis DTU

Dimension reduction : PCA and Clustering Christopher Workman Center for Biological Sequence Analysis DTU.
Dec 21, 2015
Welcome message from author
This document is posted to help you gain knowledge. Please leave a comment to let me know what you think about it! Share it to your friends and learn new things together.
Transcript
Dimension reduction :PCA and Clustering
Christopher WorkmanCenter for Biological Sequence Analysis
DTU
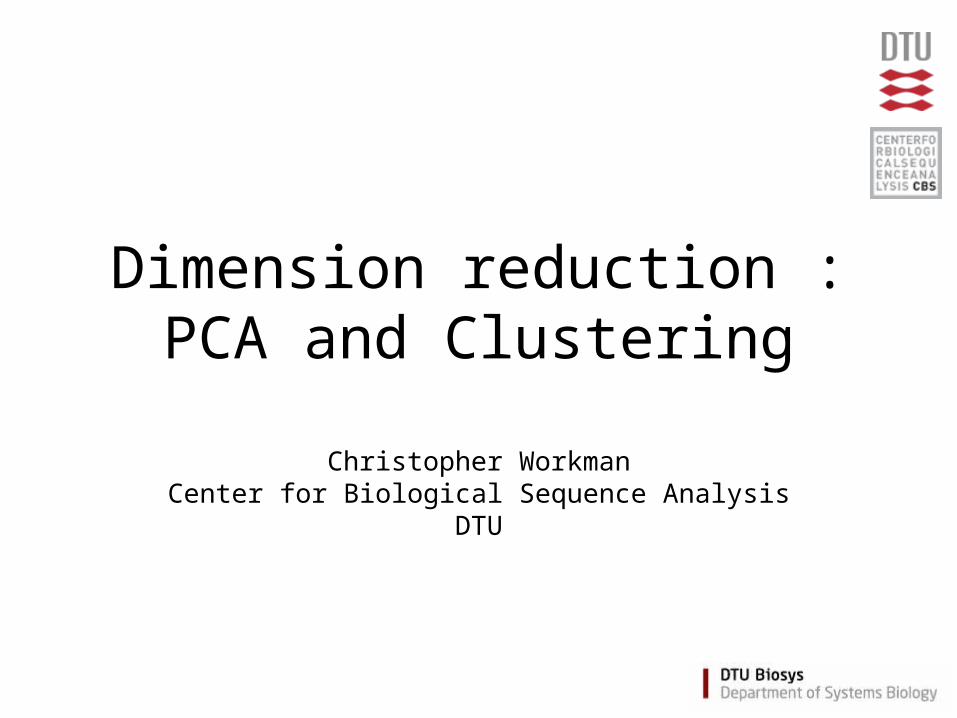
Sample PreparationHybridization
Sample PreparationHybridization
Array designProbe designArray designProbe design
QuestionExperimental Design
QuestionExperimental Design
Buy Chip/ArrayBuy Chip/Array
Statistical AnalysisFit to Model (time series)
Statistical AnalysisFit to Model (time series)
Expression IndexCalculationExpression IndexCalculation
Advanced Data Analysis
Clustering PCA Classification Promoter Analysis
Meta analysis Survival analysis Regulatory Network
Advanced Data Analysis
Clustering PCA Classification Promoter Analysis
Meta analysis Survival analysis Regulatory Network
NormalizationNormalization
Image analysisImage analysis
The DNA Array Analysis PipelineThe DNA Array Analysis Pipeline
ComparableGene Expression Data
ComparableGene Expression Data
What is Principal Component Analysis (PCA)?
• Numerical method• Dimensionality reduction technique• Primarily for visualization of arrays/samples• ”Unsupervised” method used to explore the
intrinsic variability of the data w.r.t. the independent variables (factors) in the study
• Note: Dependent variables are those that are observed to change in response to independent variables. Independent variables are deliberately manipulated to invoke changes in the dependent variables.
PCA
• Performs a rotation of the data that maximizes the variance in the new axes
• Projects high dimensional data into a low dimensional sub-space (visualized in 2-3 dims)
• Often captures much of the total data variation in a few dimensions (< 5)
• Exact solutions require a fully determined system (matrix with full rank) – i.e. A “square” matrix with independent rows
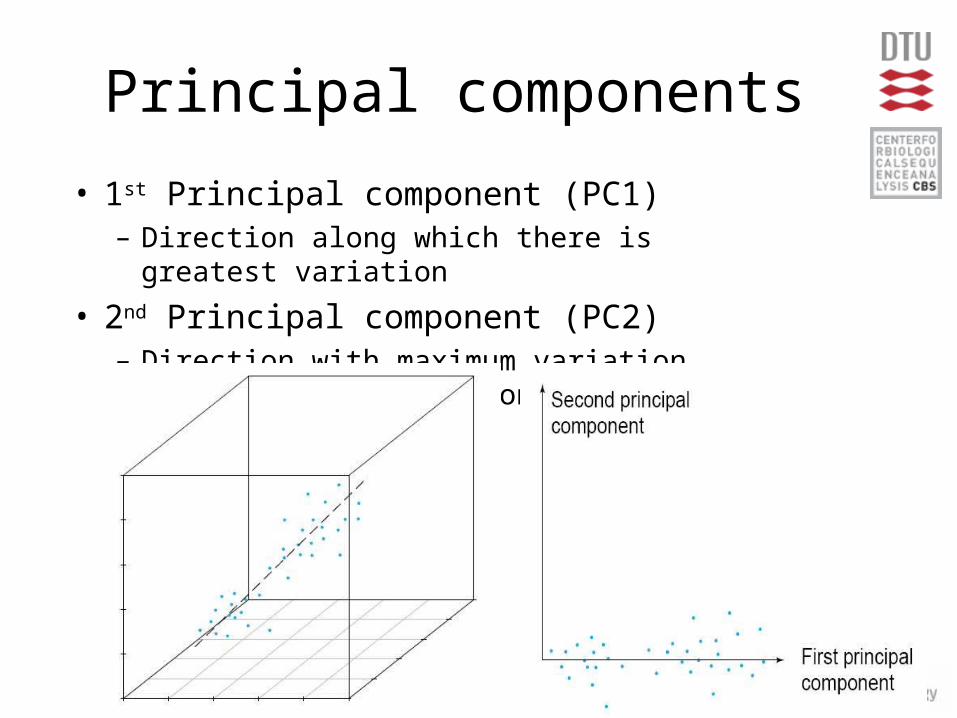
Principal components
• 1st Principal component (PC1)– Direction along which there is greatest variation
• 2nd Principal component (PC2)– Direction with maximum variation left in data,
orthogonal to PC1
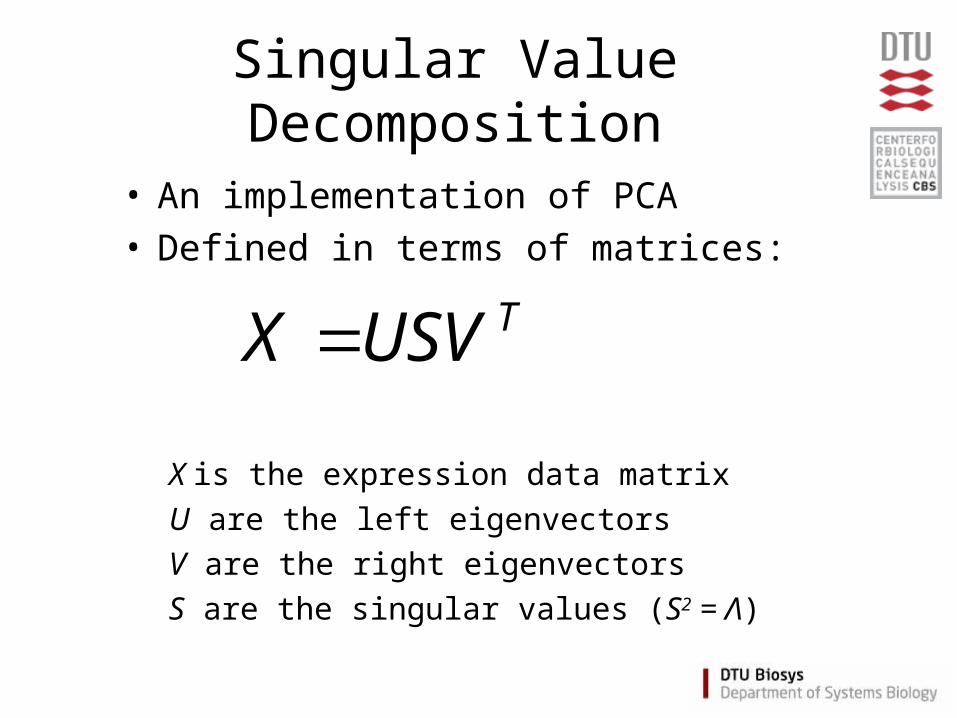
Singular Value Decomposition
• An implementation of PCA • Defined in terms of matrices:
X is the expression data matrix
U are the left eigenvectors
V are the right eigenvectors
S are the singular values (S2 = Λ)
TUSVX
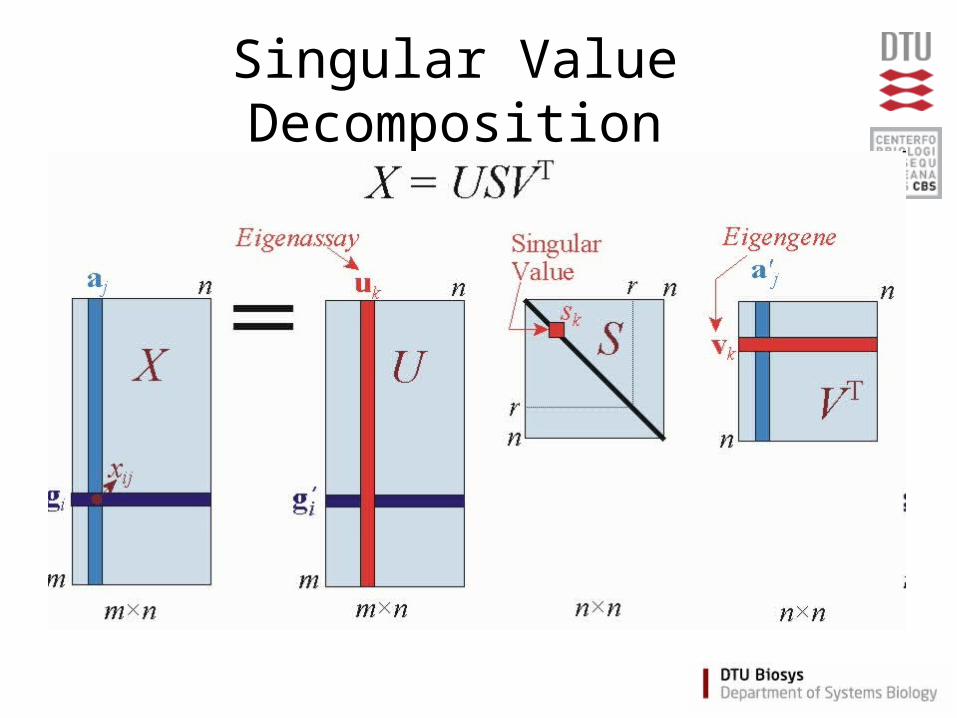
Singular Value Decomposition
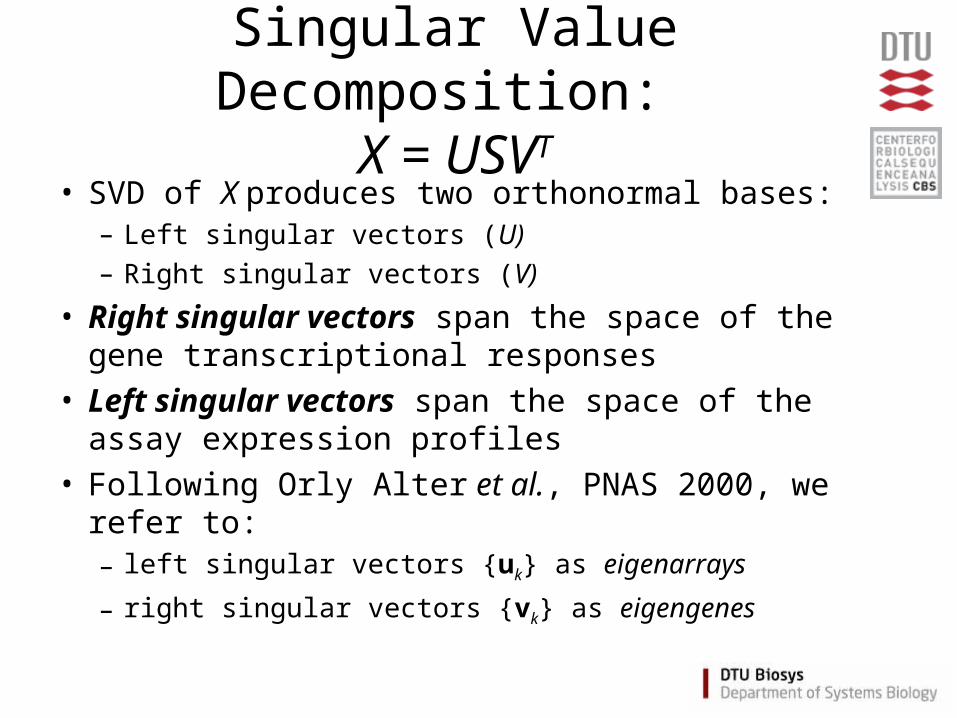
Singular Value Decomposition: X = USVT
• SVD of X produces two orthonormal bases:– Left singular vectors (U) – Right singular vectors (V)
• Right singular vectors span the space of the gene transcriptional responses
• Left singular vectors span the space of the assay expression profiles
• Following Orly Alter et al., PNAS 2000, we refer to:– left singular vectors {uk} as eigenarrays
– right singular vectors {vk} as eigengenes
Singular Value Decomposition
• Requirements:– No missing values– “Centered” observations, i.e. normalize
data such that each gene has mean = 0
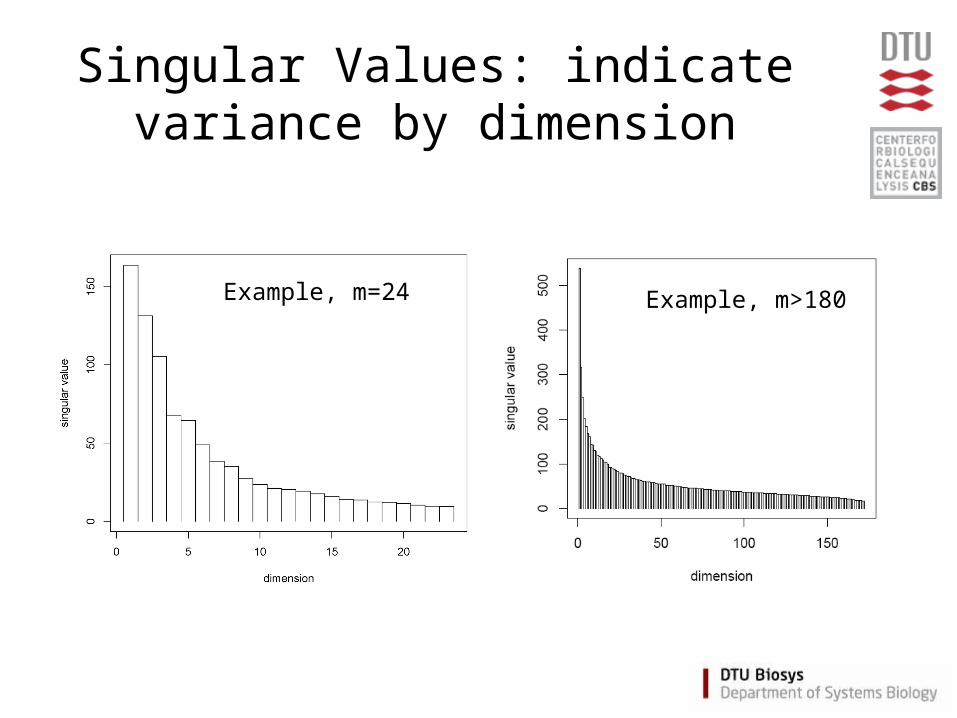
Singular Values: indicate variance by dimension
Example, m=24 Example, m>180
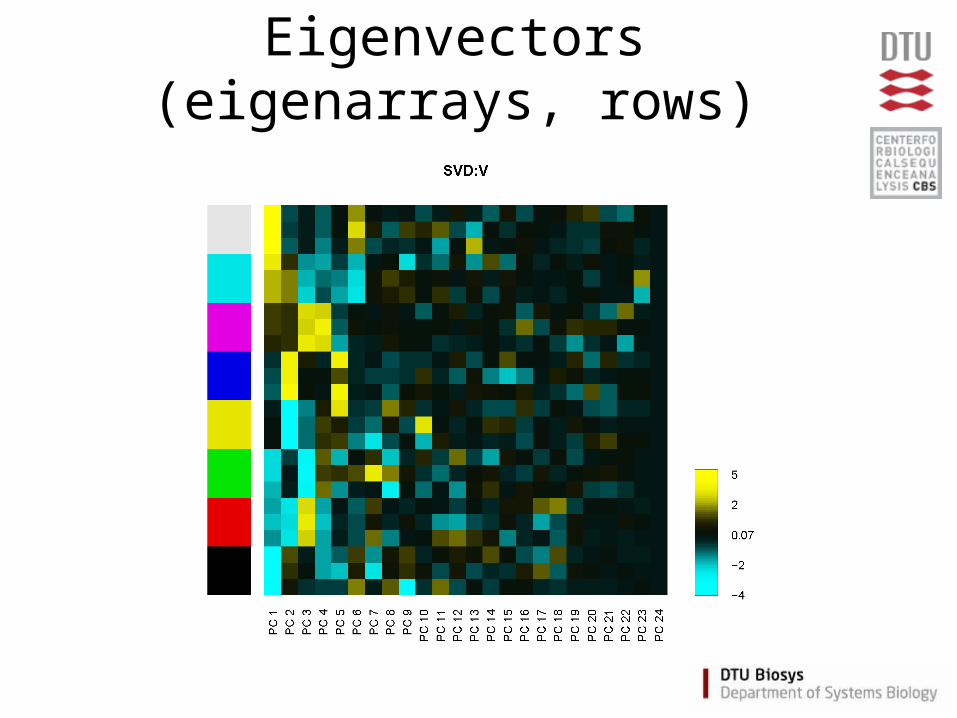
Eigenvectors (eigenarrays, rows)
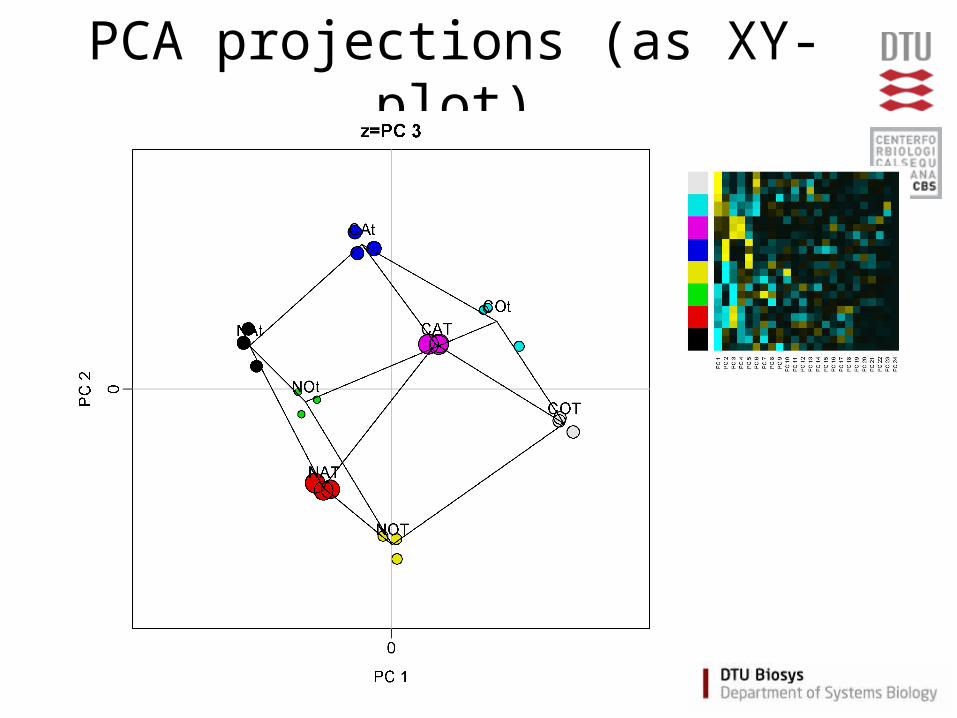
PCA projections (as XY-plot)
Related methods
• Factor Analysis*• Multidimensional scaling (MDS)• Generalized multidimensional scaling (GMDS)• Semantic mapping• Isomap• Independent component analysis (ICA)
* Factor analysis is often confused with PCA though the two methods are related but distinct. Factor analysis is equivalent to PCA if the error terms in the factor analysis model are assumed to all have the same variance.
Why do we cluster?
• Organize observed data into meaningful structures
• Summarize large data sets• Used when we have no a priori hypotheses
• Optimization:– Minimize within cluster distances– Maximize between cluster distances
Many types of clustering methods
• Method:– K-class– Hierarchical, e.g. UPGMA
• Agglomerative (bottom-up)• Divisive (top-down)
– Graph theoretic
• Information used:– Supervised vs unsupervised
• Final description of the items:– Partitioning vs non-partitioning– fuzzy, multi-class
Hierarchical clustering
• Representation of all pair-wise distances
• Parameters: none (distance measure)
• Results:– One large cluster– Hierarchical tree (dendrogram)
• Deterministic
Hierarchical clustering – UPGMA Algorithm
• Assign each item to its own cluster
• Join the nearest clusters
• Re-estimate the distance between clusters
• Repeat for 1 to n
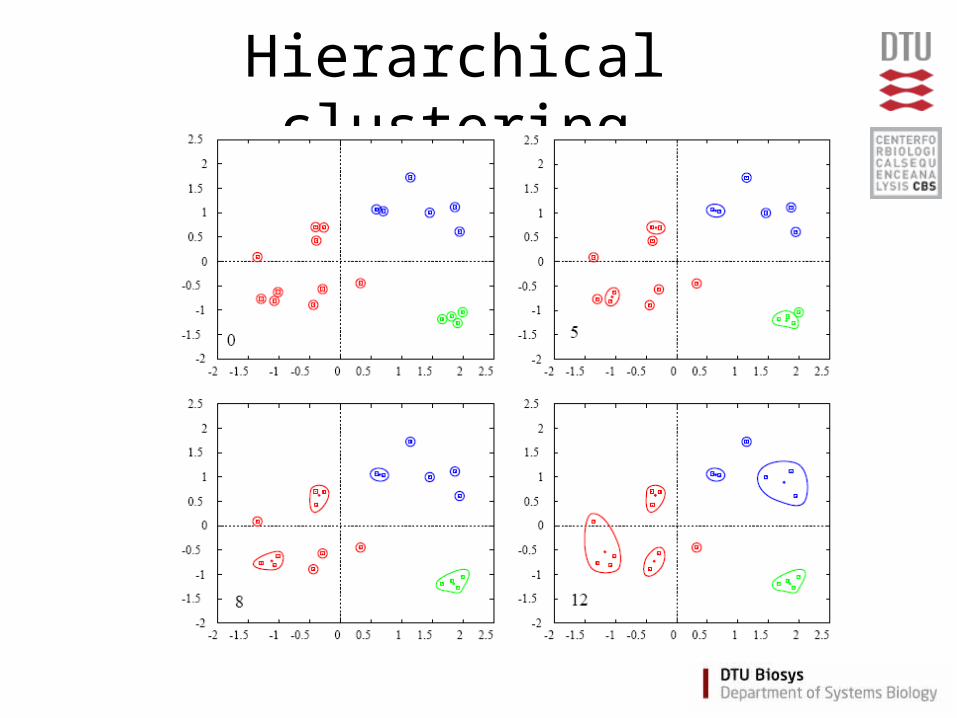
Hierarchical clustering
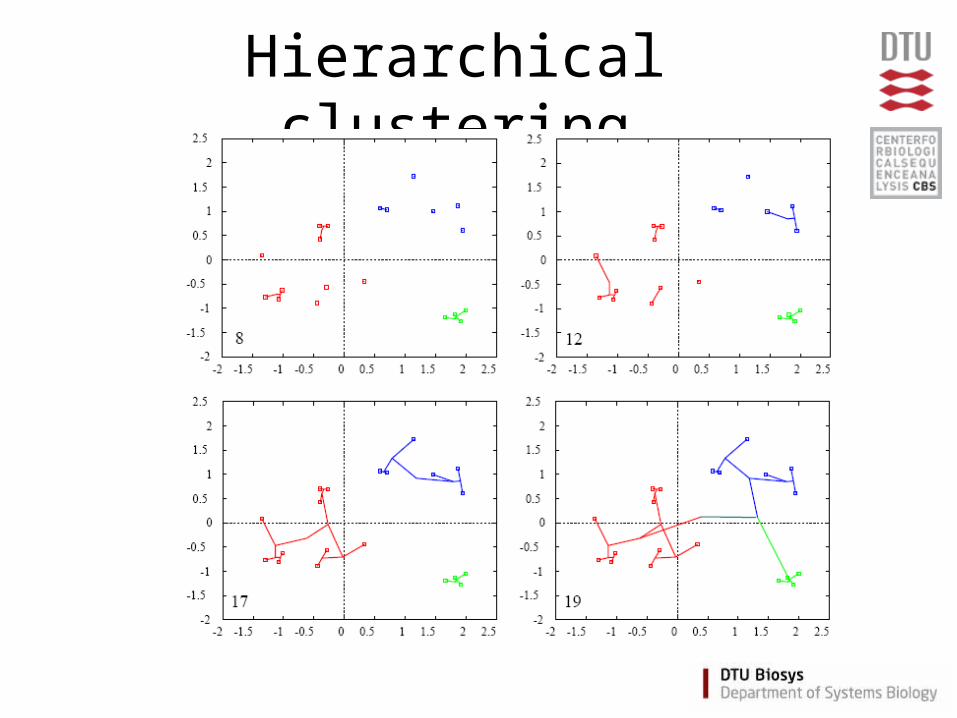
Hierarchical clustering
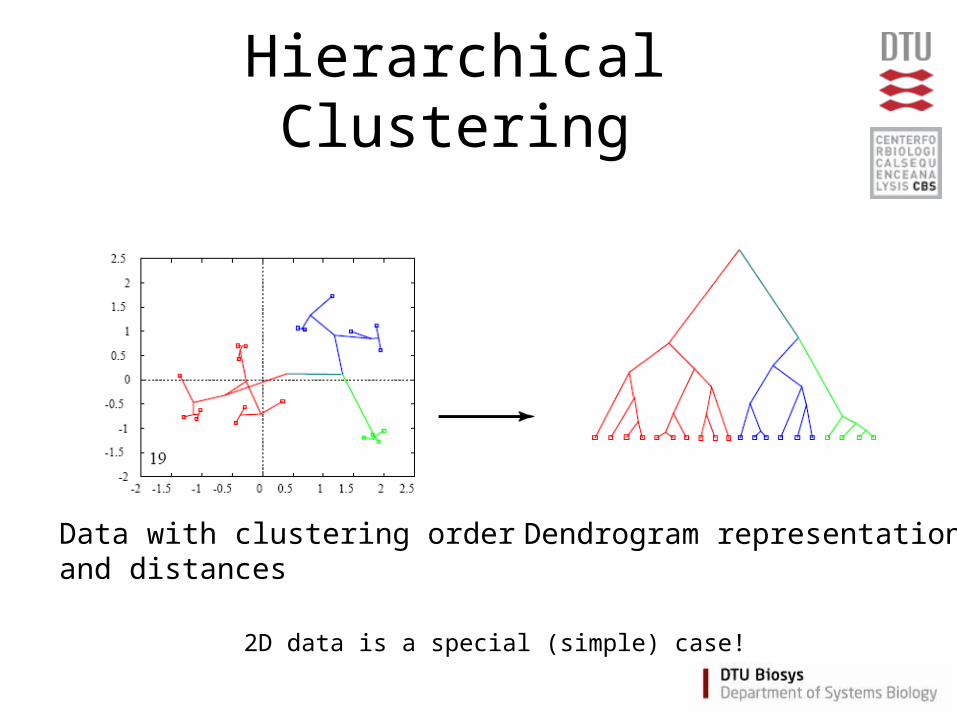
Hierarchical Clustering
Data with clustering orderand distances
Dendrogram representation
2D data is a special (simple) case!
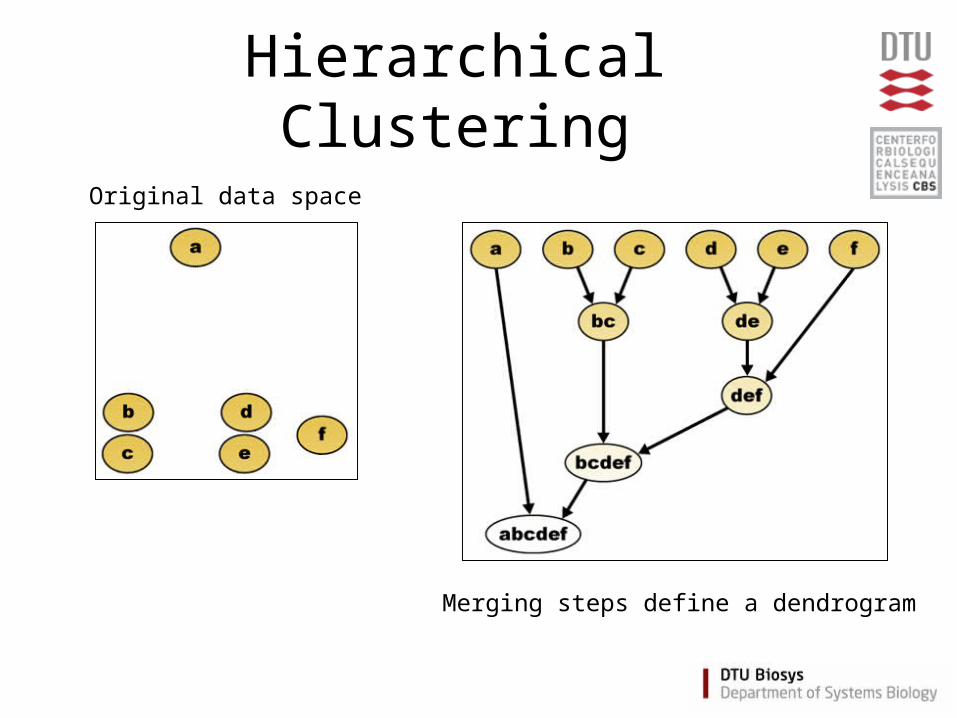
Hierarchical Clustering
Original data space
Merging steps define a dendrogram
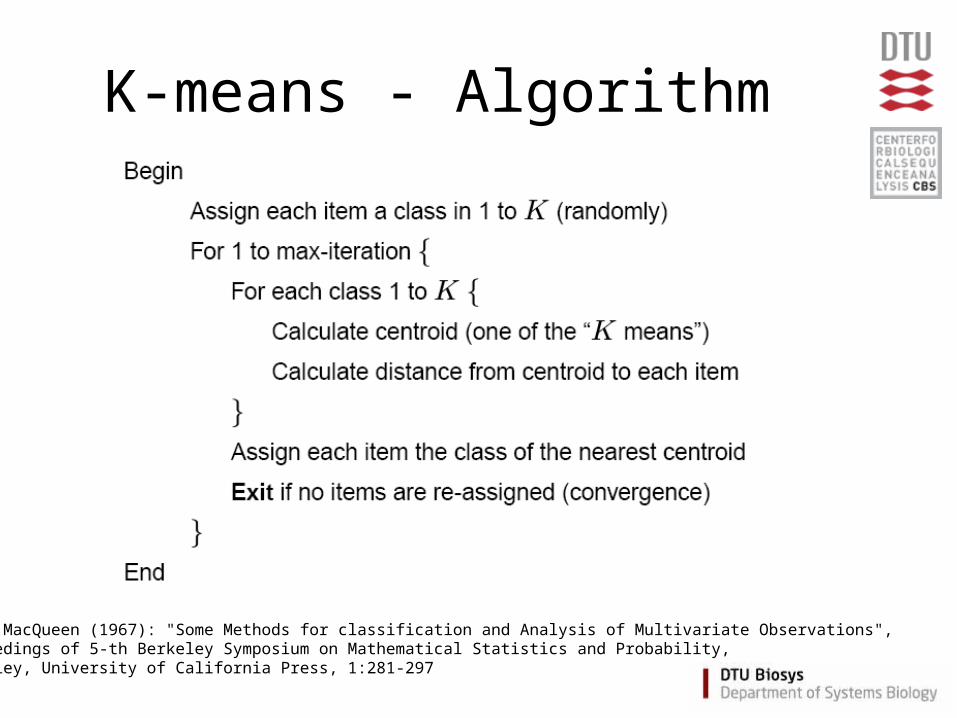
K-means - Algorithm
J. B. MacQueen (1967): "Some Methods for classification and Analysis of Multivariate Observations", Proceedings of 5-th Berkeley Symposium on Mathematical Statistics and Probability, Berkeley, University of California Press, 1:281-297
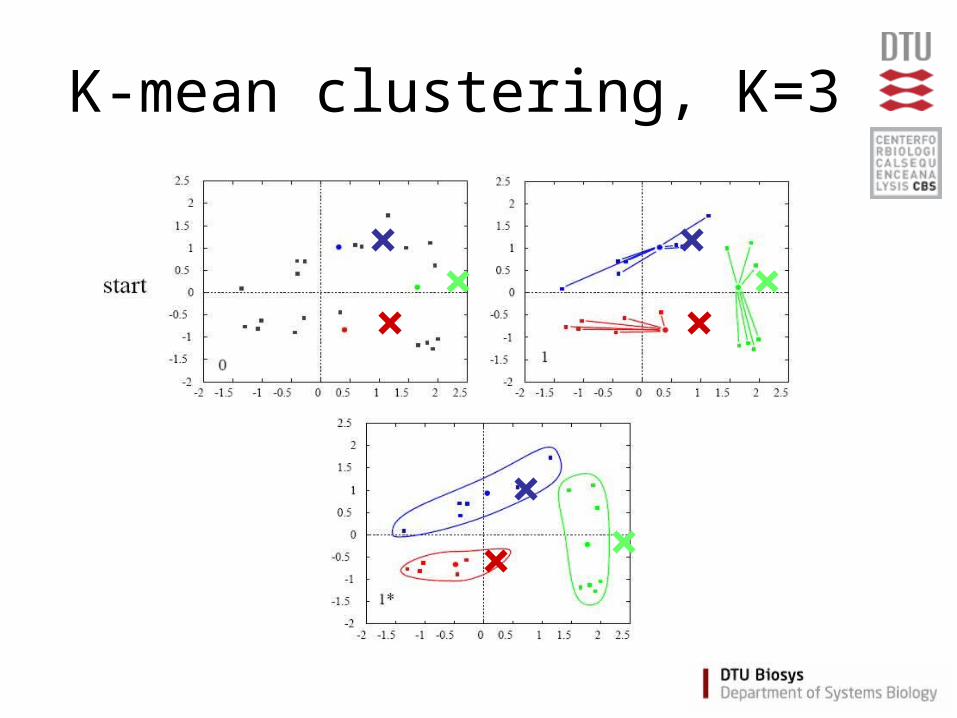
K-mean clustering, K=3
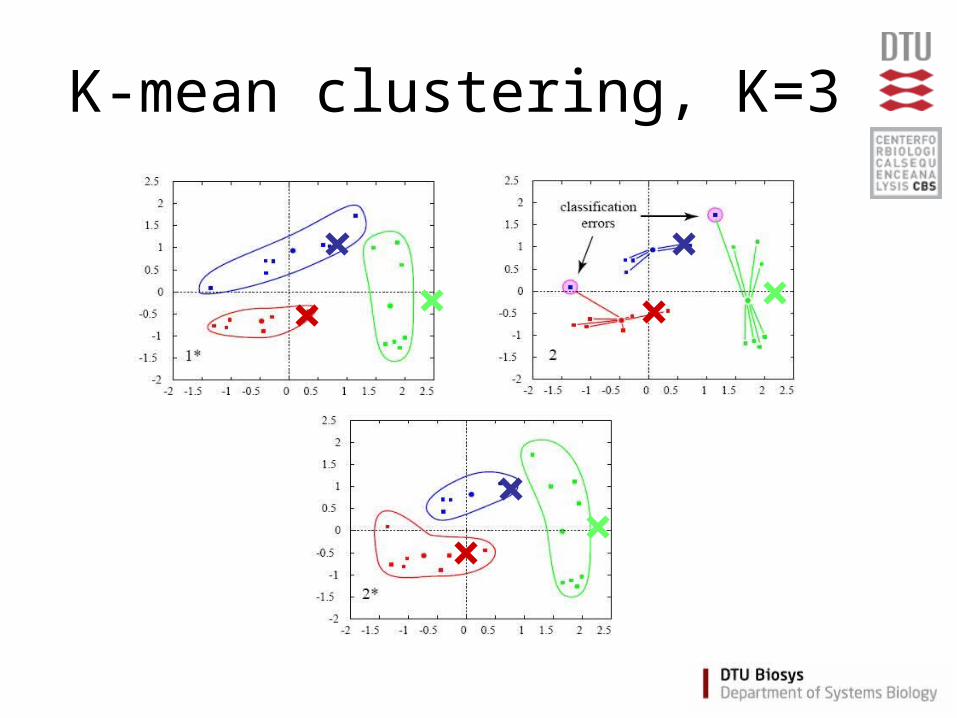
K-mean clustering, K=3
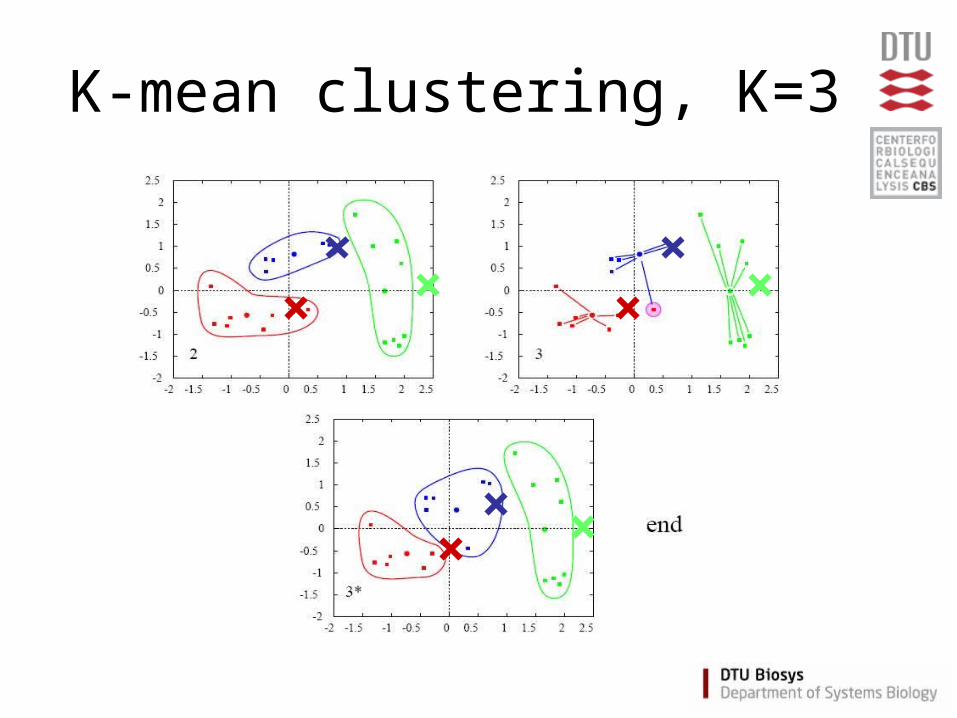
K-mean clustering, K=3
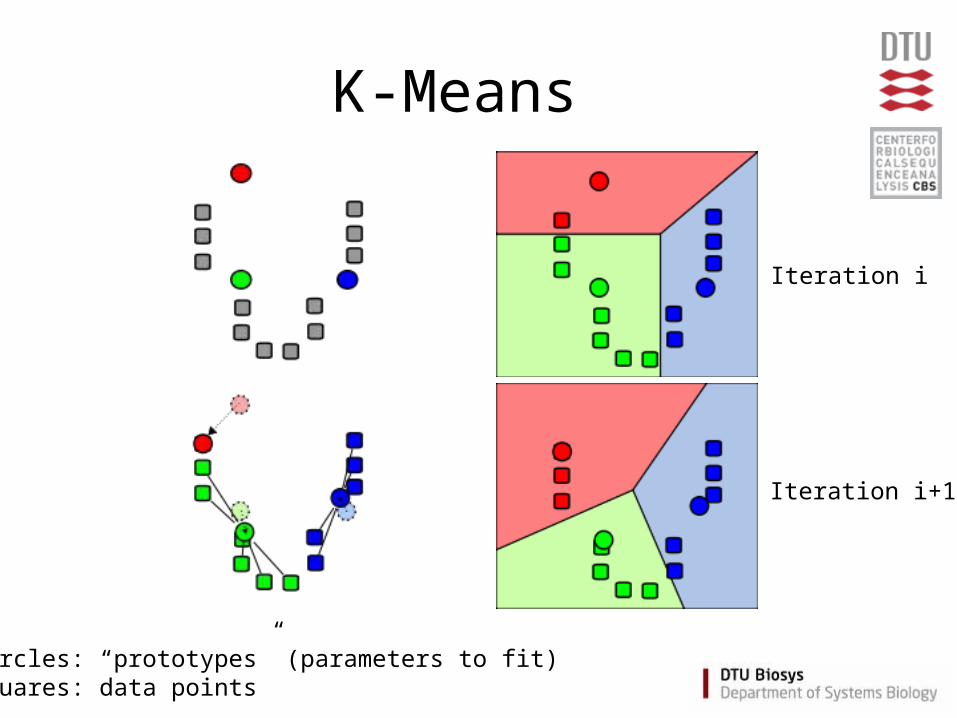
K-Means
Iteration i
Iteration i+1
Circles: “prototypes” (parameters to fit)Squares: data points
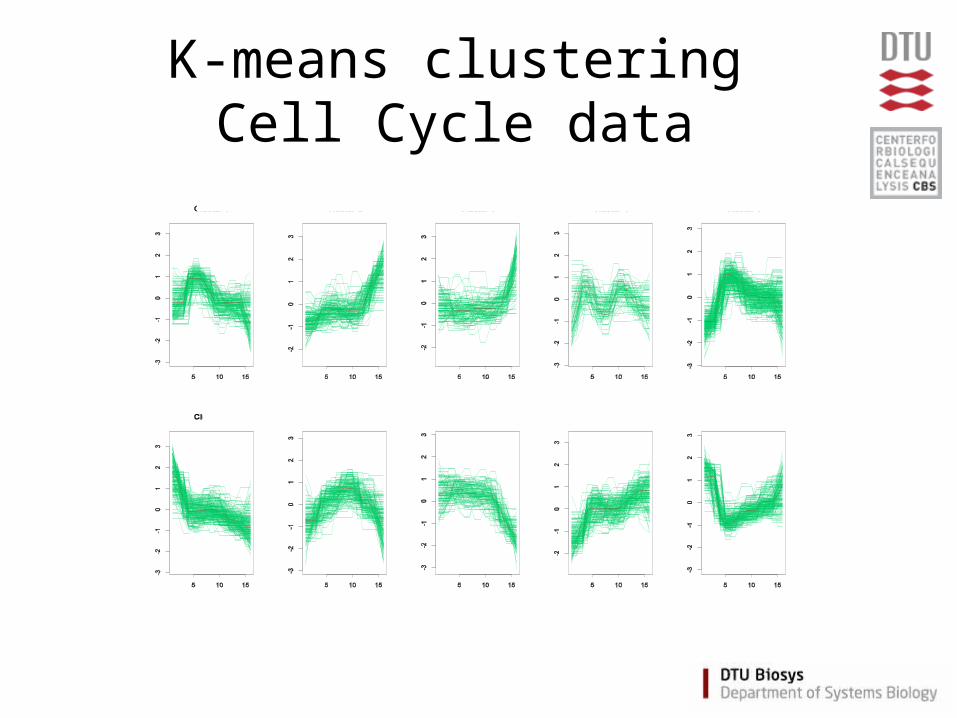
K-means clusteringCell Cycle data
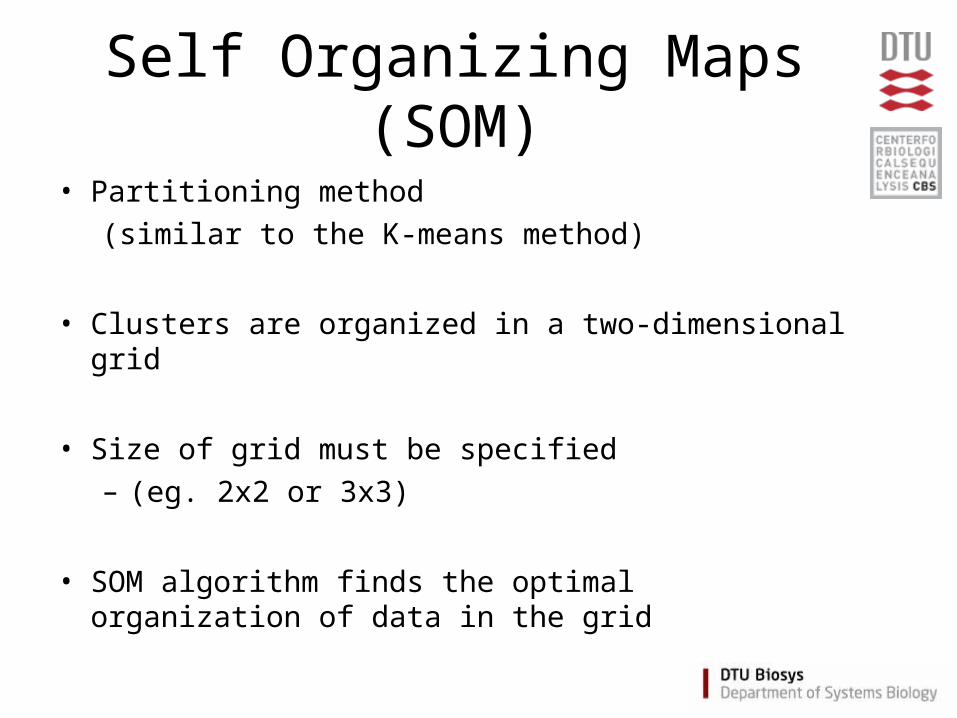
Self Organizing Maps (SOM)
• Partitioning method
(similar to the K-means method)
• Clusters are organized in a two-dimensional grid
• Size of grid must be specified– (eg. 2x2 or 3x3)
• SOM algorithm finds the optimal organization of data in the grid
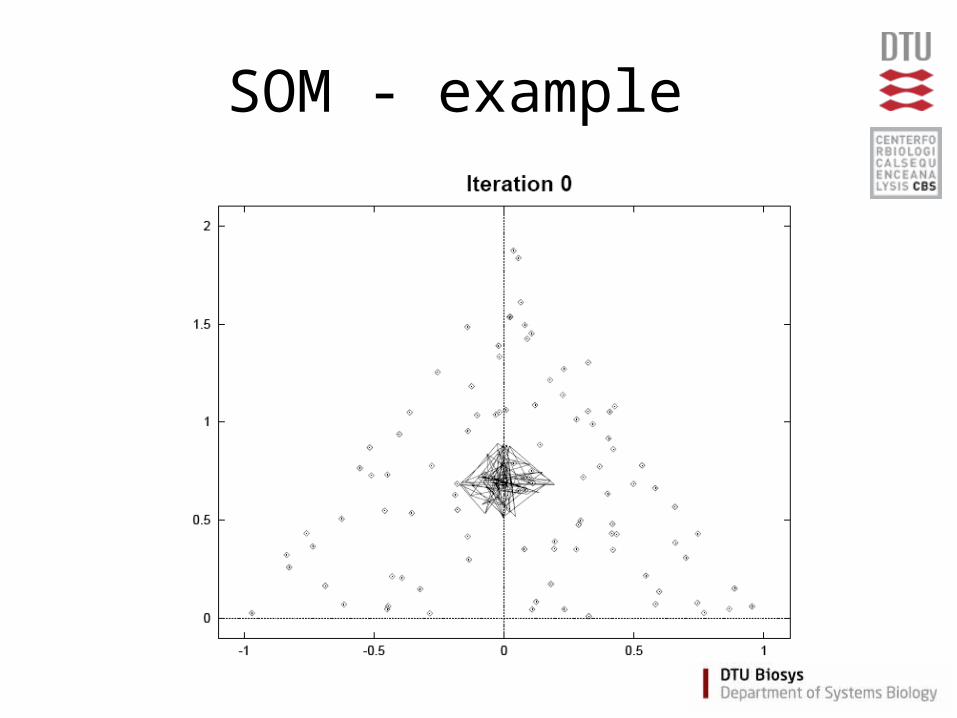
SOM - example

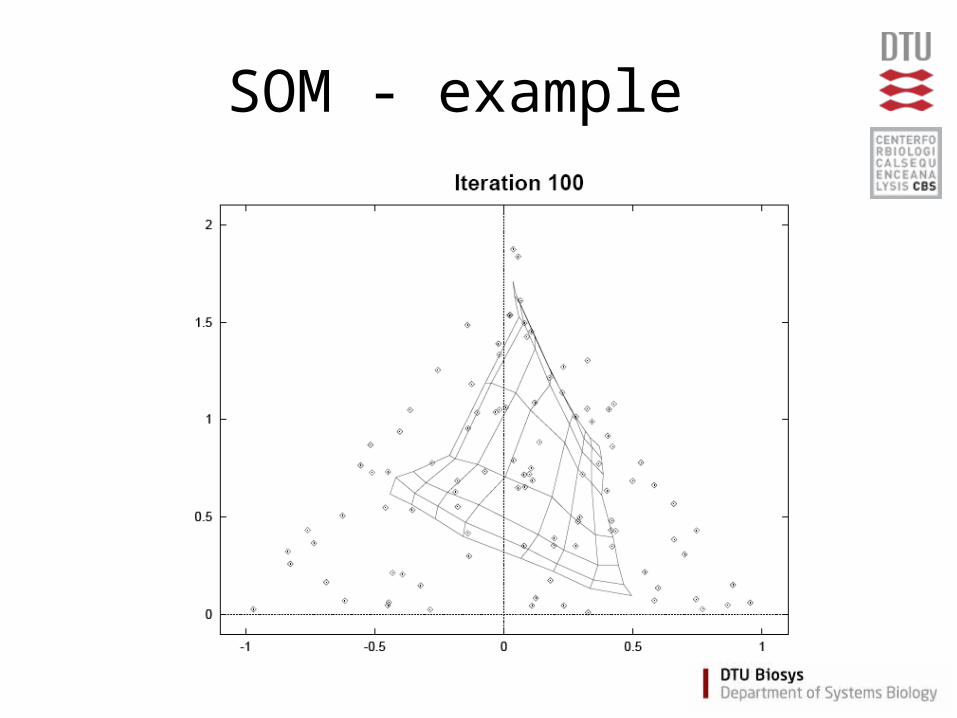
SOM - example
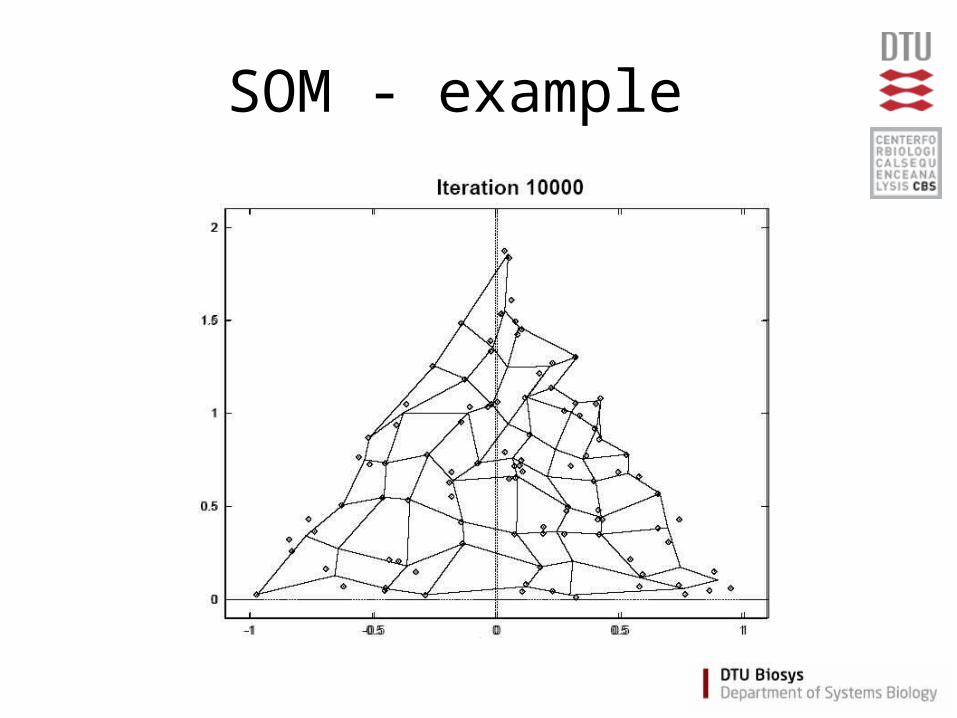
SOM - example

SOM - example
SOM - example
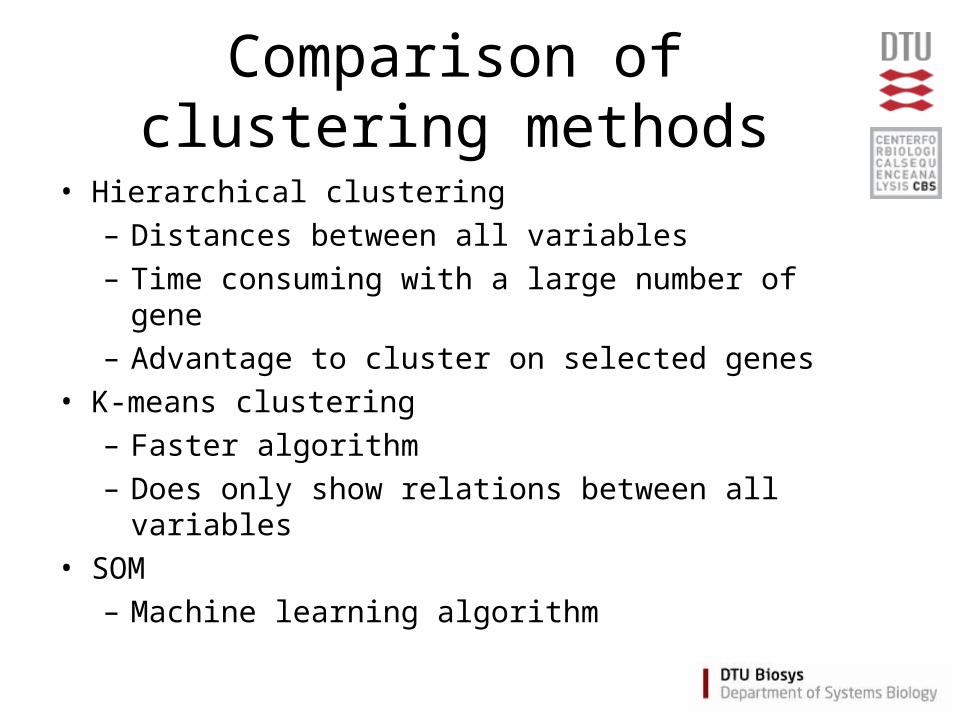
Comparison of clustering methods
• Hierarchical clustering– Distances between all variables– Time consuming with a large number of gene– Advantage to cluster on selected genes
• K-means clustering– Faster algorithm– Does only show relations between all variables
• SOM– Machine learning algorithm
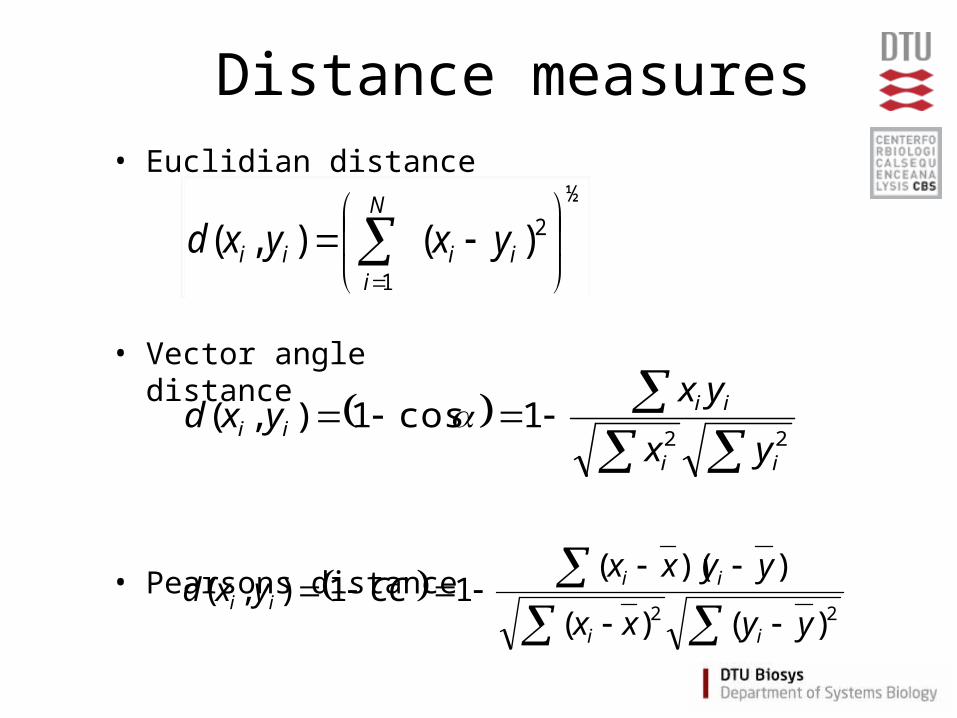
Distance measures• Euclidian distance
• Vector angle distance
• Pearsons distance
½
2
1
)(),(
ii
N
iii yxyxd
22
1cos1),(ii
iiii
yx
yxyxd
22 )()(
))((11),(
yyxx
yyxxCCyxd
ii
iiii
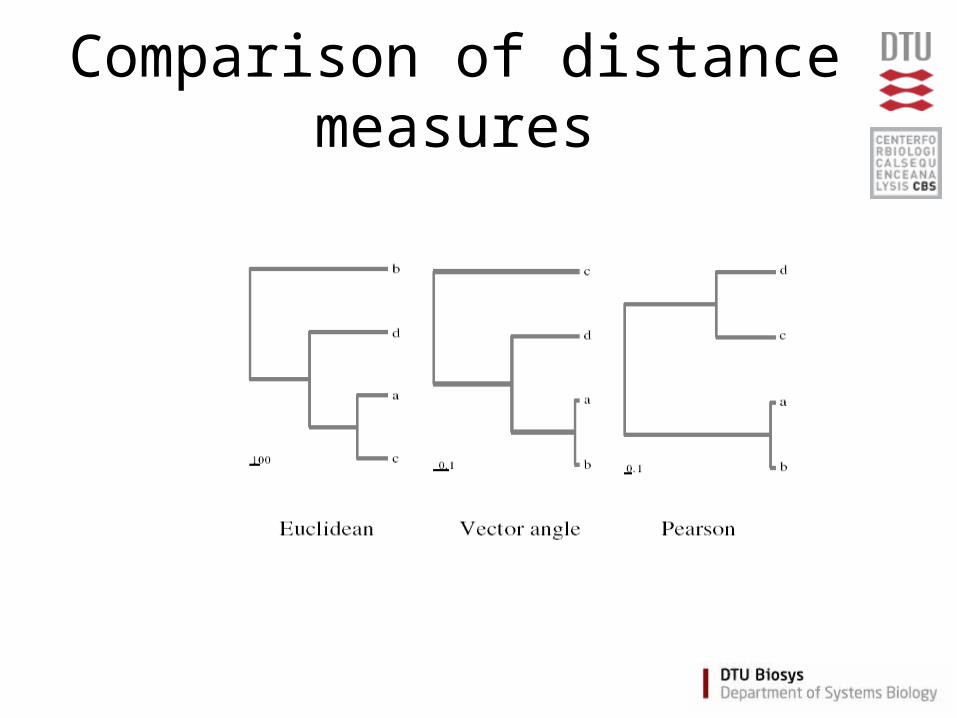
Comparison of distance measures
Summary
• Dimension reduction important to visualize data
• Methods:– Principal Component Analysis– Clustering
• Hierarchical• K-means• Self organizing maps
(distance measure important)
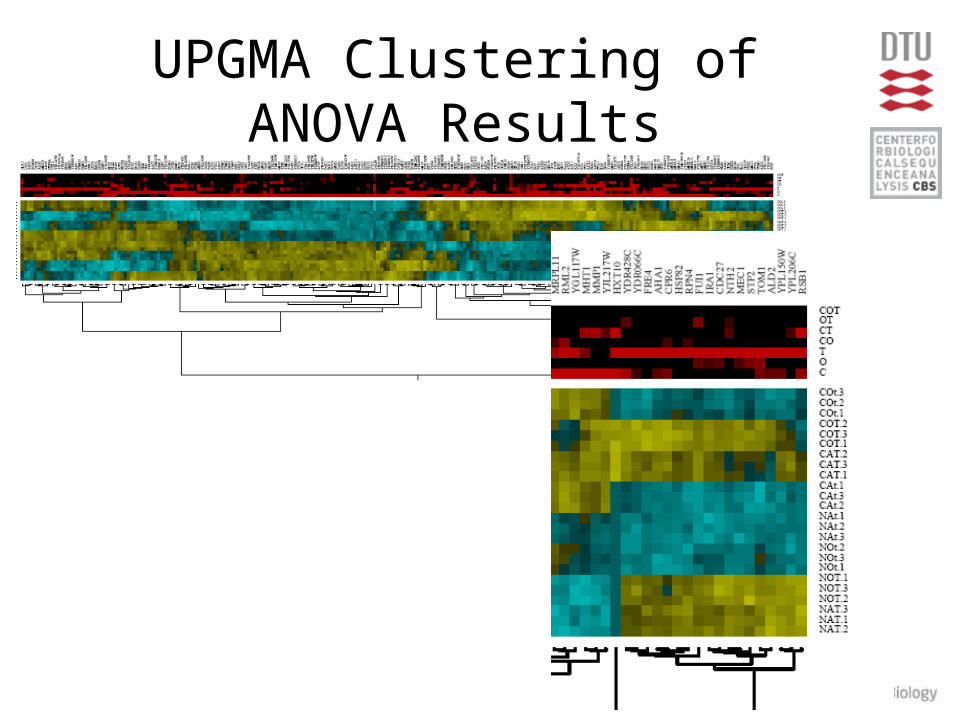
UPGMA Clustering of ANOVA Results
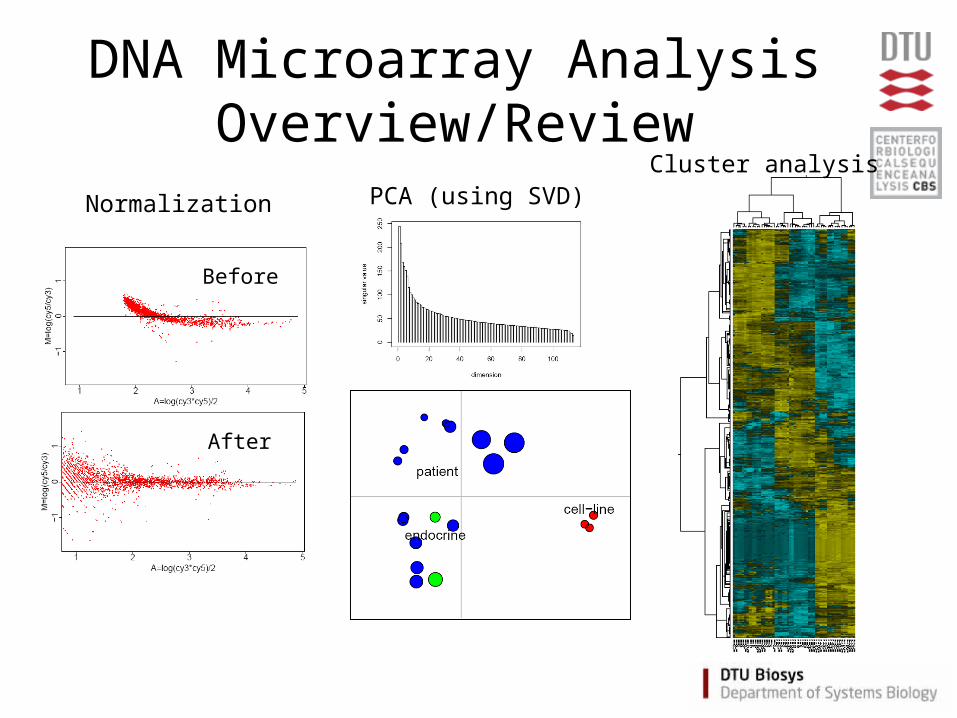
DNA Microarray Analysis Overview/Review
PCA (using SVD)Cluster analysis
Normalization
Before
After
Related Documents