© 2007 Royal Statistical Society 1369–7412/07/69329 J. R. Statist. Soc. B (2007) 69, Part 3, pp. 329–346 Dimension reduction and coefficient estimation in multivariate linear regression Ming Yuan and Ali Ekici, Georgia Institute of Technology, Atlanta, USA Zhaosong Lu Carnegie Mellon University, Pittsburgh, USA and Renato Monteiro Georgia Institute of Technology, Atlanta, USA [Received March 2006. Revised November 2006] Summary. We introduce a general formulation for dimension reduction and coefficient esti- mation in the multivariate linear model. We argue that many of the existing methods that are commonly used in practice can be formulated in this framework and have various restrictions. We continue to propose a new method that is more flexible and more generally applicable. The method proposed can be formulated as a novel penalized least squares estimate. The penalty that we employ is the coefficient matrix’s Ky Fan norm. Such a penalty encourages the sparsity among singular values and at the same time gives shrinkage coefficient estimates and thus conducts dimension reduction and coefficient estimation simultaneously in the multivariate linear model.We also propose a generalized cross-validation type of criterion for the selection of the tuning parameter in the penalized least squares. Simulations and an application in financial econometrics demonstrate competitive performance of the new method. An extension to the non-parametric factor model is also discussed. Keywords: Conic programming; Dimension reduction; Group variable selection; Ky Fan norm; Penalized likelihood 1. Introduction Multivariate linear regressions are routinely used in chemometrics, econometrics, financial engi- neering, psychometrics and many other areas of applications to model the predictive rela- tionships of multiple related responses on a set of predictors. In general multivariate linear regression, we have n observations on q responses y = .y 1 ,..., y q / and p explanatory variables x = .x 1 ,..., x p / , and Y = XB + E .1/ where Y = .y 1 ,..., y n / is an n × q matrix, X = .x 1 ,..., x n / is an n × p matrix, B is a p × q coefficient matrix, E = .e 1 ,..., e n / is the regression noise and the es are independently sampled from N .0, Σ/. Throughout the paper, we centre each input variable so that there is no intercept in equation (1) and also scale each input variable so that the observed standard deviation is 1. Address for correspondence: Ming Yuan, School of Industrial and Systems Engineering, Georgia Institute of Technology, 755 Ferst Drive North West, Atlanta, GA 30332-0205, USA. E-mail: [email protected]

Welcome message from author
This document is posted to help you gain knowledge. Please leave a comment to let me know what you think about it! Share it to your friends and learn new things together.
Transcript

© 2007 Royal Statistical Society 1369–7412/07/69329
J. R. Statist. Soc. B (2007)69, Part 3, pp. 329–346
Dimension reduction and coefficient estimation inmultivariate linear regression
Ming Yuan and Ali Ekici,
Georgia Institute of Technology, Atlanta, USA
Zhaosong Lu
Carnegie Mellon University, Pittsburgh, USA
and Renato Monteiro
Georgia Institute of Technology, Atlanta, USA
[Received March 2006. Revised November 2006]
Summary. We introduce a general formulation for dimension reduction and coefficient esti-mation in the multivariate linear model. We argue that many of the existing methods that arecommonly used in practice can be formulated in this framework and have various restrictions.We continue to propose a new method that is more flexible and more generally applicable.The method proposed can be formulated as a novel penalized least squares estimate. Thepenalty that we employ is the coefficient matrix’s Ky Fan norm. Such a penalty encourages thesparsity among singular values and at the same time gives shrinkage coefficient estimates andthus conducts dimension reduction and coefficient estimation simultaneously in the multivariatelinear model.We also propose a generalized cross-validation type of criterion for the selection ofthe tuning parameter in the penalized least squares. Simulations and an application in financialeconometrics demonstrate competitive performance of the new method. An extension to thenon-parametric factor model is also discussed.
Keywords: Conic programming; Dimension reduction; Group variable selection; Ky Fan norm;Penalized likelihood
1. Introduction
Multivariate linear regressions are routinely used in chemometrics, econometrics, financial engi-neering, psychometrics and many other areas of applications to model the predictive rela-tionships of multiple related responses on a set of predictors. In general multivariate linearregression, we have n observations on q responses y = .y1, . . . , yq/′ and p explanatory variablesx = .x1, . . . , xp/′, and
Y =XB+E .1/
where Y = .y1, . . . , yn/′ is an n × q matrix, X = .x1, . . . , xn/′ is an n × p matrix, B is a p × q
coefficient matrix, E= .e1, . . . , en/′ is the regression noise and the es are independently sampledfrom N .0, Σ/. Throughout the paper, we centre each input variable so that there is no interceptin equation (1) and also scale each input variable so that the observed standard deviation is 1.
Address for correspondence: Ming Yuan, School of Industrial and Systems Engineering, Georgia Institute ofTechnology, 755 Ferst Drive North West, Atlanta, GA 30332-0205, USA.E-mail: [email protected]

330 M.Yuan, A. Ekici, Z. Lu and R. Monteiro
The standard approach to estimating the coefficient matrix B is by means of ordinary leastsquares or maximum likelihood estimation methods (Anderson, 2003). The resulting estimatesare equivalent to regressing each response on the explanatory variables separately. Clearly suchestimates may perform suboptimally since they do not utilize the information that the responsesare related. It is also well known that this type of estimate performs poorly in the presence ofhighly correlated explanatory variables or when p is relatively large.
A large number of methods have been proposed to overcome these problems. Most of thesemethods are based on dimension reduction. A particularly attractive family of methods is lin-ear factor regression in which the response Y is regressed against a small number of linearlytransformed predictors, which are often referred to as factors. These methods can be expressedin the following way:
Y =FΩ+E, .2/
where F =XΓ, Γ is a p× r matrix for some r �min.p, q/ and Ω is an r ×q matrix. The columnsof F , Fj.j =1, . . . , r/, represent the so-called factors. Clearly equation (2) is an alternative repre-sentation of equation (1) in that B=ΓΩ, and the dimension of the estimation problem reduces asr decreases. Estimation in the linear factor regression most often proceeds in two steps: the fac-tors, or equivalently Γ, are first estimated and then Ω is estimated by least squares for equation(2). Many popular methods including canonical correlation (Hotelling, 1935, 1936), reducedrank (Anderson, 1951; Izenman, 1975; Reinsel and Velu, 1998), principal components (Massy,1965), partial least squares (Wold, 1975) and joint continuum regression (Brooks and Stone,1994) among others can all be formulated in the form of linear factor regression. They differ inthe way in which the factors are determined.
It is obviously of great importance to be able to determine the number of factors, r, forequation (2). For smaller numbers of factors, a more accurate estimate is expected since thereare fewer free parameters. But too few factors may not be sufficient to describe the predictiverelationships. In all of the aforementioned methods, the number of factors, r, is chosen in aseparate step from the estimation of equation (2) through either hypothesis testing or cross-validation. The coefficient matrix is typically estimated on the basis of the number of factorsselected. Because of its discrete nature, this type of procedure can be very unstable in the senseof Breiman (1996): small changes in the data can result in very different estimates.
There are also other approaches to improve on the least squares method. Variable selectionand ridge regression are among the most popular. Both types of method are most often studiedin the special case of equation (1) when q = 1, which amounts to classical linear regression.In recent years, considerable effort has also been devoted to the more general situations withq > 1 (Frank and Friedman, 1993; Bedrick and Tsai, 1994; Fujikoshi and Satoh, 1997; Brownet al., 1998, 1999, 2002; Turlach et al., 2005; Lutz and Bühlmann, 2006). Variable selection ismost powerful when there are many redundant predictors that are common to all responses,which can be unrealistic in many applications of the multivariate linear model (Reinsel and Velu,1998). Ridge regression, however, oftentimes cannot offer easily interpretable models becauseit does not perform dimension reduction and all elements of the estimated coefficient matrix aretypically non-zero.
In this paper, we propose a new technique for estimating the coefficient matrix that com-bines and retains the advantages of the existing methods. To achieve parsimonious models withenhanced interpretability, we introduce a formulation which is similar to but more general thanthe linear factor regression (2). Instead of estimating the coefficient matrix in multiple steps,as would be done in traditional linear factor regression methods, we simultaneously choosethe number of factors, determine the factors and estimate the factor loadings Ω. Similarly to

Multivariate Linear Regression 331
ridge regression, the method proposed can be formulated as a penalized least squares estimate.The penalty that we employ is the coefficient matrix’s Ky Fan norm defined as the sum of itssingular values. Such a penalty encourages sparsity among singular values and at the same timegives shrinkage coefficient estimates and thus conducts dimension reduction and estimationsimultaneously in the multivariate linear model.
The rest of the paper is organized as follows. The methodology proposed is introduced in thenext section. An algorithm for solving the optimization problem in our formulation is relegatedto Appendix A. Our algorithm takes advantage of recent advances in convex optimization byderiving an equivalent second-order cone program of the optimization problem in our formu-lation, which is readily solvable by using standard software. We consider the special case oforthogonal design in Section 3 to understand the new estimate better. A generalized cross-vali-dation (GCV) type of statistic is introduced in Section 4 to choose the optimal tuning parameterfor the method proposed. Simulations and a real data example are given in Sections 5 and 6 toillustrate the methodology. The method can also be extended to the non-parametric situation.In particular, we consider an extension to the vector additive model in Section 7. We concludewith some discussions in Section 8.
2. Factor estimation and selection
Denote by Yj, Bj and Ej the jth columns of Y , B and E respectively. From equation (1), the jthresponse can be modelled by
Yj =XBj +Ej,
where Bj ∈Rp, j =1, . . . , q. The basic idea of dimension reduction is that the regression coeffi-cients B1, B2, . . . , Bq actually come from a linear space B of dimension lower than p. A gen-eral dimension reduction approach consists of two main ingredients: a set of basis elements{η1, . . . , ηp} for Rp, and a subset A of {1, . . . , p} such that B ⊆ span{ηi : i∈A} where span{·}stands for the linear space spanned by a set of vectors. Both variable selection and the linearfactor model (2) can be formulated in this framework. In variable selection ηs are known, i.e.ηi = ei, where ei is the ith column of Ip; and we want to estimate A. In the case of linear factorregression, the ith factor is given by Fi =Xηi where ηs are estimated in a separate step, and Atakes the form {1, 2, . . . , r} where r is to be estimated. Because of this connection, we shall referto the estimation of ηs as factor estimation and the identification of A as factor selection. Inthis paper, we propose a procedure that imposes fewer restrictions than variable selection andlinear factor regression by allowing both ηs and A to be estimated simultaneously.
To develop ideas, we start with factor selection and assume that {η1, . . . , ηp} are known upto a permutation. With a slight abuse of notation, write F = .F1, . . . , Fp/ where Fi =Xηi; then
Y =FΩ+E, .3/
where Ω is a p×q matrix such that .η1, . . . , ηp/Ω=B. Now factor selection for equation (1) canbe cast as a variable selection problem for equation (3). As pointed out by Turlach et al. (2005),a family of estimates for this can be obtained by
min[tr{.Y −FΩ/W.Y −FΩ/′}] subject top∑
i=1‖ωi‖α � t, .4/
where W is a weight matrix, ωi is the ith row of Ω, t �0 is a regularization parameter and ‖·‖α
is the lα-norm for some α�1, i.e.
‖ωi‖α = .Ωαi1 + . . . +Ωα
iq/1=α:

332 M.Yuan, A. Ekici, Z. Lu and R. Monteiro
Common choices of the weight matrix include Σ−1 and I. To fix ideas, in the rest of the paperwe shall assume that W = I.
It is clear that expression (4) reduces to the popular lasso (Tibshirani, 1996) when q = 1.Similarly to the lasso, if t is appropriately chosen, minimizing expression (4) yields a shrink-age estimate that is sparse in the sense that some of the ωis will be set to 0. Consequently,the ith factor will be included in the final estimate if and only if ωi is non-zero. Therefore,factor selection and coefficient estimation are done simultaneously. Two most obvious choicesfor α are α= 2 and α=∞. The former has been studied by Bakin (1999) and Yuan and Lin(2006) whereas the latter has been discussed in Turlach et al. (2005). In this paper, we shallchoose α=2. The advantage of this choice in the current setting will become clear in our laterdiscussion. α=2 is appealing also because it allows the estimate from expression (4) to be invari-ant to any orthogonal transformation of the responses, which can be useful in many practicalsituations.
To use expression (4), we need to obtain ηs first. Similarly to variable selection, factor selec-tion is most powerful if all responses can be predicted by a small subset of common factors.Ideally, we want {η1, . . . , ηp} to contain a set of basis of B to allow the sparsest representationof B in the factor space. This is typically not so for the existing linear factor regression methods.For example, in principal components regression, the factors are chosen to be the principalcomponents of the predictors, which may not necessarily contain the basis of B. In our method,we choose ηs to be the eigenvectors of BB′. Clearly this set of basis contains the basis of B.Interestingly, we can proceed even without actually estimating the factors if this choice is to bemade in conjunction with α=2. To elaborate on this, write U = .η1, . . . , ηp/. The singular valuedecomposition of B can be expressed as B =UDV ′ for some q × q orthonormal matrix V anda p × q matrix D such that Dij = 0 for any i �= j and Dii =σi.B/ where σi.·/ represents the ithlargest singular value of a matrix. Now Ω=DV ′ and ωi =σi.B/Vi where Vi is the ith column ofV , which implies that ‖ωi‖2 =σi.B/. Therefore, expression (4) with α=2 gives
min[tr{.Y −XB/.Y −XB/′}] subject tomin.p,q/∑
i=1σi.B/� t, .5/
where Σmin.p,q/i=1 σi.B/ is known as the Ky Fan (p or q) norm of B. Clearly no knowledge of ηs is
required in expression (5) and we shall use the minimizer of expression (5) as our final estimateof B. In Appendix A, we show that expression (5) is equivalent to a conic program and can becomputed efficiently. The penalty that we employed in expression (5) encourages the sparsityamong the singular values of B and at the same time gives shrinkage estimates for U and V ;it thus conducts dimension reduction and estimation simultaneously in the multivariate linearmodel. Once the estimate of B is available, the basis ηs can be obtained as its left singular vectorsU. Therefore, we can also compute the factors Fi =Xηi, as well as the factor loadings Ω=DV .
The proposed estimate defined as the minimizer of expression (5) is closely connected withseveral other popular methods. In particular, expression (5), reduced rank regression and ridgeregression can all be viewed as the minimizer of
tr{.Y −XB/.Y −XB/′} subject to{∑
i
σαi .B/
}1=α� t .6/
with difference choices of α.Ridge regression defined as the minimizer of
tr{.Y −XB/.Y −XB/′}+λ tr.B′B/

Multivariate Linear Regression 333
corresponds to α=2 because tr.B′B/=Σ σ2i .B/. It is well known that ridge regression provides a
shrinkage estimate that often outperforms least squares. The estimate proposed, correspondingto α=1, enjoys a similar shrinkage property. To illustrate, consider the special case when thereis only one response. In this case, σ1.B/ = .B′B/1=2, and therefore expression (5) can now beexpressed as
min[tr{.Y −XB/.Y −XB/′}] subject to .B′B/1=2 � t,
which is nothing other than the usual ridge regression.Reduced rank regression is another special case of expression (6) with α=0+. Both expression
(5) and reduced rank regression set some of the singular values of B to 0 and lead to estimateswith reduced ranks. Compared with reduced rank regression, the new method shrinks the sin-gular values smoothly and is more stable. Note that the reduced rank regression estimate differsfrom the least squares estimate only in its singular values (Reinsel and Velu, 1998). Since theleast squares estimate behaves poorly in overfitted or highly correlated settings, reduced rankregression may suffer in such situations as well. In contrast, the new method gives a shrinkageestimate that overcomes this problem.
3. Orthogonal design
To understand further the statistical properties of the method proposed, we consider the specialcase of orthogonal design. The following lemma gives an explicit expression for the minimizerof expression (5) in this situation.
Lemma 1. Let ULSDLSV LS be the singular value decomposition of the least squares estimateBLS. Then, under the orthogonal design where X′X=nI, the minimizer of expression (5) is
B= ULSD.V LS/′,
where Dij = 0 if i �= j, Dii = max.DLSii −λ, 0/ and λ� 0 is a constant such that Σi Dii = min.t,
ΣDLSii /.
Proof. Expression (5) can be equivalently written in a Lagrange form:
Qn.B/= 12
tr{.Y −XB/.Y −XB/′}+nλmin.p,q/∑
i=1σi.B/, .7/
for some λ> 0. Simple algebra yields
tr{.Y −XB/.Y −XB/′}= tr{.Y −XB/′.Y −XB/}= tr{.Y −XB
LS/′.Y −XB
LS/}+ tr{.B
LS −B/′X′X.BLS −B/}
= tr{.Y −XBLS
/′.Y −XBLS
/}+n tr{.BLS −B/′.BLS −B/}: .8/
Together with the fact that tr.B′B/=Σi σ2i .B/, equation (7) equals
12
q∑i=1
σ2i .B/− tr.B′BLS
/+λq∑
i=1σi.B/,
up to constants not depending on B. Now an application of von Neumann’s trace inequalityyields
tr.B′BLS/�∑
σi.B/DLSii

334 M.Yuan, A. Ekici, Z. Lu and R. Monteiro
Therefore,
Qn.B/� 12
q∑i=1
σ2i .B/−∑σi.B/D
LSii +λ
q∑i=1
σi.B/: .9/
Note that σi.B/�0. The right-hand side of inequality (9) is minimized at
σi.B/=max.DLSii −λ, 0/, i=1, . . . , q:
The proof is now completed by noting that B achieves the lower bound for Qn. �
This closed form minimizer of expression (5) allows a better understanding of our estimate.Specifically, the following lemma indicates that we can always find an appropriate tuning param-eter such that the non-zero singular values of B are consistently estimated and the rest are setto 0 with probability 1.
Lemma 2. Suppose that max.p, q/ = o.n/. Under the orthogonal design, if λ→ 0 in such afashion that max.p, q/=n=o.λ2/, then |σi.B/−σi.B/|→p 0 if σi.B/ > 0 and P{σi.B/=0}→1if σi.B/=0.
Proof. Note that
BLS = .X′X/−1X′Y
=X′.XB+E/=n
=B+X′E=n:
Since X′X = nI and the rows of E are independent observations from N .0, Σ/, each entry ofX′EΣ−1=2=
√n follows N .0, 1/ and is independent of each other. Applying the result from John-
stone (2001), we have
σ1.X′EΣ−1=2=n/∼ .√
p+√q/=
√n:
Therefore,
σ1
(X′E
n
)�σ1
(X′EΣ−1=2
n
)σ1.Σ1=2/∼σ
1=21 .Σ/
√p+√
q√n
:
Now an application of theorem 3.3.16 of Horn and Johnson (1991) yields
|σi.B/−σi.BLS
/|�σ1
(X′E
n
)
=Op
(√p+√
q√n
): .10/
Therefore, if λ → 0 at a slower rate than the right-hand side of equation (10), the proposedestimate can provide consistent estimates of the non-zero singular values of B and at the sametime shrink the rest of the singular values to 0. �
Lemma 1 also indicates that the singular values of the method proposed are shrunk in asimilar fashion to the lasso under orthogonal designs. The lasso has proved highly successfulin various studies, particularly when the predictors are correlated and p is large relatively tothe sample size. In Section 5, we show that the estimate proposed is very successful in similarsituations as well.
Multivariate Linear Regression 335
4. Tuning
Like any other regularization method, it is important to be able to choose a good tuning param-eter t in expression (5). One common method that is used in practice is cross-validation, whichof course can be computationally demanding in large scale problems. In this section, we developa GCV (Golub et al., 1979) type of statistic for determining t.
We first characterize the equivalence between expression (5) and its Lagrange form (7), sinceit is easier to work with equation (7) in deriving our GCV-type statistic. Denote B the minimizerof expression (5) and UDV ′ its singular value decomposition. Note that expression (5) is equiv-alent to equation (7) and we can always find a λ such that B is also the minimizer of equation(7). The following lemma explicitly describes the relationship between t and λ.
Lemma 3. Write di = Dii for i=1, . . . , min.p, q/. For any t �Σi di, the minimizer of equation(7) coincides with the minimizer of expression (5), B, if
nλ= 1
card.di > 0/
∑di>0
.X′iYi − X′
iXidi/ .11/
where card.·/ stands for the cardinality of a set, Yi is the ith column of Y =YU and Xi is the ithcolumn of X=XV .
Proof. Note that
min.p,q/∑i=1
σi.B/=min.p,q/∑
i=1Dii
=p∑
i=1σi.BKB
′/
= tr.BKB′/,
where
K = ∑Dii>0
1
Dii
ViV′i ,
and Vi is the ith column of V . Therefore, B is also the minimizer of
12 tr{.Y −XB/.Y −XB/′}+nλ tr.BKB′/: .12/
From expression (12), d is the minimizer of
12
min.p,q/∑i=1
.Yi − Xidi/2 +nλ
min.p,q/∑i=1
di, .13/
subject to the constraint that di � 0. The first-order optimality condition for expression (13)yields
nλ= X′iYi − X′
iXidi,
for any di > 0. The proof is now completed by taking an average of the above expression overall is such that di > 0. �
Since B is the minimizer of expression (12), it can be expressed as
B= .X′X+2nλK/−1X′Y:

336 M.Yuan, A. Ekici, Z. Lu and R. Monteiro
Neglecting the fact that W also depends on B, we can define the hat matrix for expression (12)as X.X′X+2nλK/−1X′ and the degrees of freedom as
df.t/=q tr{X.X′X+2nλK/−1X′}:
Now the GCV score is given by
GCV.t/= tr{.Y −XB/.Y −XB/′}qp−df.t/
, .14/
and we choose a tuning parameter by minimizing GCV.t/.Summing up, an implementation of our estimate which chooses the tuning parameter auto-
matically is as follows.
Step 1: for each candidate t-value
(a) compute the minimizer of expression (5) (denote the solution B.t//,(b) evaluate λ by using equation (11) and(c) compute the GCV score (14).
Step 2: denote tÅ the minimizer of the GCV score that is obtained in step 1. Return B.tÅ/ asthe estimate of B.
5. Simulation
In this section, we compare the finite sample performance of the proposed estimate with severalother popular approaches for multivariate linear regression. The methods that we comparedinclude the following:
(a) FES, the method proposed for factor estimation and selection with the tuning parameterselected by GCV;
(b) OLS, the ordinary least square estimate .X′X/−1X′Y ;(c) CW, the curd and whey with GCV procedure that was developed by Breiman and Fried-
man (1997);(d) RRR, reduced rank regression with the rank selected by tenfold cross-validation;(e) PLS, two-block partial least squares (Wold, 1975) with the number of components selected
by tenfold cross-validation;(f) PCR, principal components regression (Massy, 1965) with the number of components
selected by tenfold cross-validation;(g) RR, ridge regression with the tuning parameter selected by tenfold cross-validation;(h) CAIC, forward selection using the corrected Akaike information criterion that was pro-
posed by Bedrick and Tsai (1994). The corrected Akaike information criterion for aspecific submodel of model (1) is defined as
n ln |Σ|+ n.n+k/q
n−k −q−1+nq ln.2π/,
where k is the number of predictors included in the submodel and Σ is the maximumlikelihood estimate of Σ under the submodel.
We compare these methods in terms of the model error. The model error of an estimate B isgiven by
ME.B/= .B−B/′V.B−B/,
where V =E.X′X/ is the population covariance matrix of X.
Multivariate Linear Regression 337
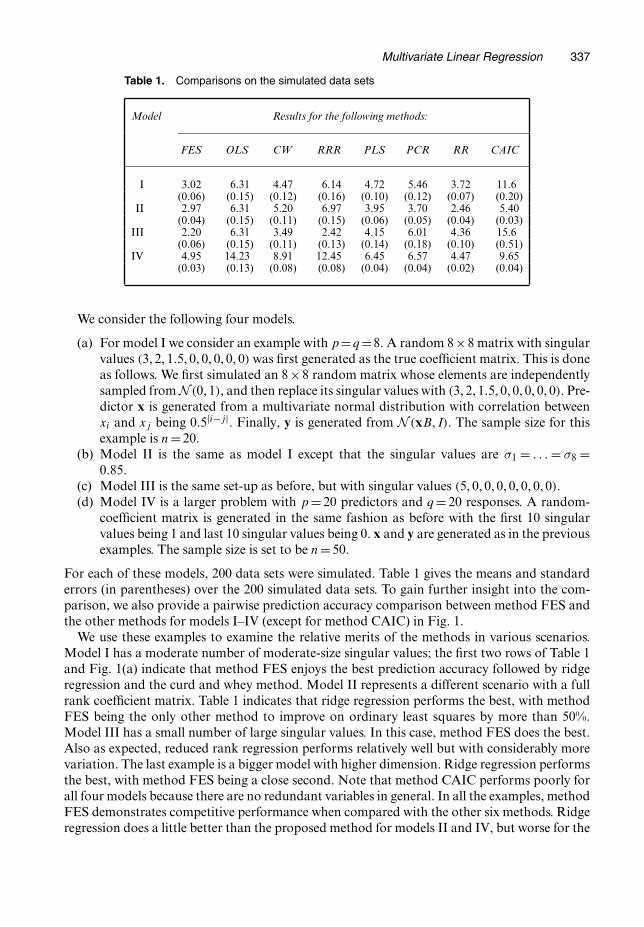
Table 1. Comparisons on the simulated data sets
Model Results for the following methods:
FES OLS CW RRR PLS PCR RR CAIC
I 3.02 6.31 4.47 6.14 4.72 5.46 3.72 11.6(0.06) (0.15) (0.12) (0.16) (0.10) (0.12) (0.07) (0.20)
II 2.97 6.31 5.20 6.97 3.95 3.70 2.46 5.40(0.04) (0.15) (0.11) (0.15) (0.06) (0.05) (0.04) (0.03)
III 2.20 6.31 3.49 2.42 4.15 6.01 4.36 15.6(0.06) (0.15) (0.11) (0.13) (0.14) (0.18) (0.10) (0.51)
IV 4.95 14.23 8.91 12.45 6.45 6.57 4.47 9.65(0.03) (0.13) (0.08) (0.08) (0.04) (0.04) (0.02) (0.04)
We consider the following four models.
(a) For model I we consider an example with p=q=8. A random 8×8 matrix with singularvalues .3, 2, 1:5, 0, 0, 0, 0, 0/ was first generated as the true coefficient matrix. This is doneas follows. We first simulated an 8×8 random matrix whose elements are independentlysampled from N .0, 1/, and then replace its singular values with .3, 2, 1:5, 0, 0, 0, 0, 0/. Pre-dictor x is generated from a multivariate normal distribution with correlation betweenxi and xj being 0:5|i−j|. Finally, y is generated from N .xB, I/. The sample size for thisexample is n=20.
(b) Model II is the same as model I except that the singular values are σ1 = . . . = σ8 =0:85.
(c) Model III is the same set-up as before, but with singular values .5, 0, 0, 0, 0, 0, 0, 0/.(d) Model IV is a larger problem with p = 20 predictors and q = 20 responses. A random-
coefficient matrix is generated in the same fashion as before with the first 10 singularvalues being 1 and last 10 singular values being 0. x and y are generated as in the previousexamples. The sample size is set to be n=50.
For each of these models, 200 data sets were simulated. Table 1 gives the means and standarderrors (in parentheses) over the 200 simulated data sets. To gain further insight into the com-parison, we also provide a pairwise prediction accuracy comparison between method FES andthe other methods for models I–IV (except for method CAIC) in Fig. 1.
We use these examples to examine the relative merits of the methods in various scenarios.Model I has a moderate number of moderate-size singular values; the first two rows of Table 1and Fig. 1(a) indicate that method FES enjoys the best prediction accuracy followed by ridgeregression and the curd and whey method. Model II represents a different scenario with a fullrank coefficient matrix. Table 1 indicates that ridge regression performs the best, with methodFES being the only other method to improve on ordinary least squares by more than 50%.Model III has a small number of large singular values. In this case, method FES does the best.Also as expected, reduced rank regression performs relatively well but with considerably morevariation. The last example is a bigger model with higher dimension. Ridge regression performsthe best, with method FES being a close second. Note that method CAIC performs poorly forall four models because there are no redundant variables in general. In all the examples, methodFES demonstrates competitive performance when compared with the other six methods. Ridgeregression does a little better than the proposed method for models II and IV, but worse for the

338 M.Yuan, A. Ekici, Z. Lu and R. Monteiro
s d o h t e M r e h t (a) (b) (c) (d)
O
FE
S
5 1 0 1 5
I l e d o M S L O
5 1 0 1 5
510
15 I I l e d o M
S L O
5 1 0 1 5
510
I I I l e d o M S L O
0 2 5 1 0 1 5
510
20 V I l e d o M
S L O
0 1 8 6 4 2
24
68
I l e d o M W C
0 1 8 6 4 2 2
46
8
I I l e d o M W C
0 1 8 6 4 2
2468
I I I l e d o M W C
2 1 0 1 8 6 4
46
812
V I l e d o M W C
5 1 0 1 5
5 10
5
10
I l e d o M R R R
5 1 0 1 5
510
15 I I l e d o M
R R R
2 1 0 1 8 6 4 2
26
10 I I I l e d o M
R R R
5 1 0 1 5
510
15 V I l e d o M
R R R
0 1 8 6 4 2
2468
I l e d o M S L P
8 6 4 2
24
68
I I l e d o M S L P
0 1 5
510
I I I l e d o M S L P
8 7 6 5 4
45
67
8
V I l e d o M S L P
0 1 8 6 4 2
24
68
I l e d o M R C P
8 6 4 2
24
68
I I l e d o M R C P
5 1 0 1 5
510
I I I l e d o M R C P
8 7 6 5 4
45
67
8
V I l e d o M R C P
6 5 4 3 2 1
1 5
3
I l e d o M R R
5 4 3 2
23
45
I I l e d o M R R
2 1 0 1 8 6 4 2
26
10
I I I l e d o M R R
0 . 6 5 . 5 0 . 5 5 . 4 0 . 4 5 . 3
3.5
5.0
V I l e d o M R R
Fig. 1. Pairwise model error comparison between model FES and the other methods
other two models. It is worth pointing out that, when compared with ridge regression, methodFES also has the further advantage of producing interpretable models.
6. Application
To demonstrate the utility of the method proposed, we now consider a real example in finan-cial econometrics. The multivariate linear model has a wide range of applications in finance,because portfolios, one of the main objects in financial studies, are typically generated fromvector-valued processes. A particularly important task in financial econometrics is to predictthe future returns of assets on the basis of their historical performance. Vector autoregressivemodels are often used for this (Reinsel, 1997). Let yt be the vector of returns at time t. The vectorautoregressive model with order 1 is given by
yt =yt−1B+E: .15/
Clearly model (15) is a special case of the multivariate linear model. Accurate estimation of B
in model (15) leads to good forecasts which, in turn, can serve as instruments for efficient port-folio allocation and revealing opportunities for arbitrage. Also important is the identificationof the factors in model (15), which can to help construct bench-mark portfolios or to diversifyinvestments.
To illustrate our method, we applied model (15) to the stock prices in 2004 of the 10 lar-gest American companies ranked by Fortune magazine on the basis of their 2003 revenue. We

Multivariate Linear Regression 339
6420
0.0
0.5
1.0
1.5
2.0
2.5
mroN naF yK
Sin
gula
r V
alue
0.25.10.15.00.0
22.0
22.5
23.0
23.5
mroN naF yK
GC
V S
core
(a) (b)
Fig. 2. Solution paths for the stocks example
excluded Chevron in the analysis because its stock price dropped nearly a half in the 38th weekof the year, which indicates the non-stationarity of its return process. We fit model (15) to theweekly log-returns of the stocks for the first half of the year and use the data from the secondhalf of the year to evaluate the predictive performance.
We first apply the proposed factor estimation and selection method on the training data.Fig. 2(a) gives the trajectory of the singular values of our proposed method as the Ky Fan normof B increases and Fig. 2(b) depicts the GCV curve. The vertical line in Fig. 2(a) correspondsto the Ky Fan norm that was selected by GCV.
In this example, GCV retains four non-zero singular values for B. Recall that the factors areestimated by the left singular vectors of the regression coefficient matrix estimate. The corres-ponding loadings of the four selected factors are given in Table 2.
It is of great interest to understand the meaning of these four factors. From expression (15), thefactors summarize the asset return history in predicting the future returns. Classical investmenttheory indicates that the market index is a good summary of the asset prices and should lie inthe factor space. To approximate the market index, we picked the Standard and Poors indexS&P500 and the Nasdaq Stock Market index NASDAQ. To check whether their returns approx-imately fall into the factor space that is estimated from the stock data, we constructed theirlinear projections in the estimated four-dimensional factor space. The log-returns of S&P500and NASDAQ in the year of 2004 together with their approximations are given in Fig. 3. Bothapproximations track the actual log-return processes fairly well. This exercise confirms that the

340 M.Yuan, A. Ekici, Z. Lu and R. Monteiro
Table 2. Factor loadings for the stocks example
Company Loadings for the following factors:
1 2 3 4
Walmart −0.47 −0.42 −0.30 0.19Exxon 0.20 −0.68 0.07 −0.40GM 0.05 0.19 −0.61 −0.31Ford 0.18 0.22 −0.42 −0.13GE −0.35 0.13 −0.03 −0.44ConocoPhillips 0.42 0.04 0.05 −0.52Citigroup −0.45 0.13 −0.26 −0.17IBM −0.24 0.43 0.49 −0.21AIG −0.38 −0.22 0.22 −0.39
−0.
03−
0.01
0.01
−
0.06
−0.
020.
02
0.03
lo
g re
turn
50 40 30 20 10 0 Week
50 40 30 20 10 0 Week
(a)
(b)
log
retu
rn
Fig. 3. (a) S&P500 and (b) NASDAQ indices ( ) together with their approximations in the factor space(. . . . . . .)
factors that are revealed by our method are indeed meaningful and should provide insight intofurther studies of the dynamics of the financial market.
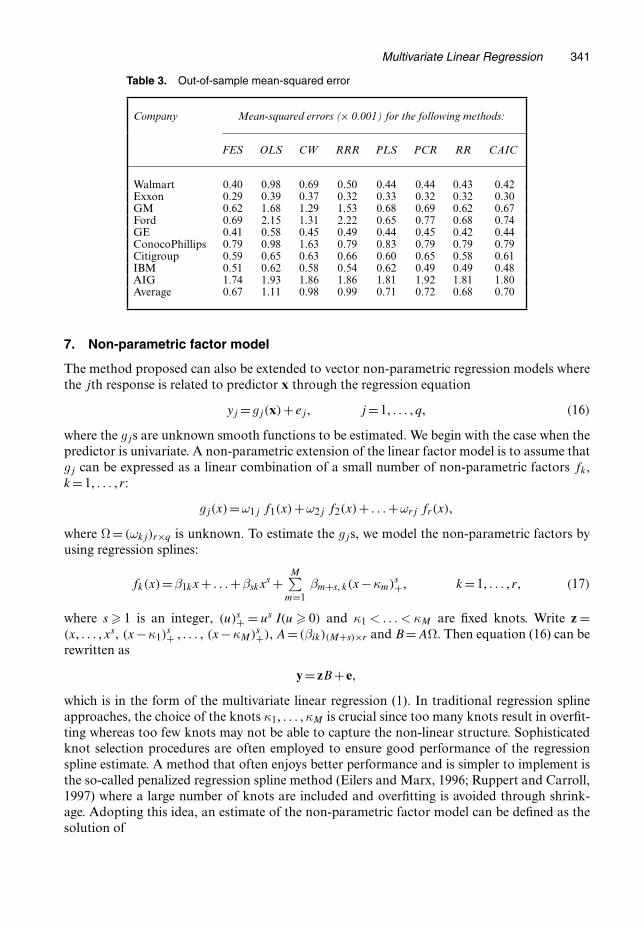
To compare further the method proposed with the other methods from the last section, wecompare their prediction errors on the data from the second half of the year. For each individualstock, we reported the averaged predictive squared error of the forecast. We also reported theprediction error averaged over all nine stocks. The prediction performances are summarized inTable 3. The method proposed clearly provides better prediction than the other methods in thisexample.
Multivariate Linear Regression 341
Table 3. Out-of-sample mean-squared error
Company Mean-squared errors (× 0.001) for the following methods:
FES OLS CW RRR PLS PCR RR CAIC
Walmart 0.40 0.98 0.69 0.50 0.44 0.44 0.43 0.42Exxon 0.29 0.39 0.37 0.32 0.33 0.32 0.32 0.30GM 0.62 1.68 1.29 1.53 0.68 0.69 0.62 0.67Ford 0.69 2.15 1.31 2.22 0.65 0.77 0.68 0.74GE 0.41 0.58 0.45 0.49 0.44 0.45 0.42 0.44ConocoPhillips 0.79 0.98 1.63 0.79 0.83 0.79 0.79 0.79Citigroup 0.59 0.65 0.63 0.66 0.60 0.65 0.58 0.61IBM 0.51 0.62 0.58 0.54 0.62 0.49 0.49 0.48AIG 1.74 1.93 1.86 1.86 1.81 1.92 1.81 1.80Average 0.67 1.11 0.98 0.99 0.71 0.72 0.68 0.70
7. Non-parametric factor model
The method proposed can also be extended to vector non-parametric regression models wherethe jth response is related to predictor x through the regression equation
yj =gj.x/+ ej, j =1, . . . , q, .16/
where the gjs are unknown smooth functions to be estimated. We begin with the case when thepredictor is univariate. A non-parametric extension of the linear factor model is to assume thatgj can be expressed as a linear combination of a small number of non-parametric factors fk,k =1, . . . , r:
gj.x/=ω1j f1.x/+ω2j f2.x/+ . . . +ωrj fr.x/,
where Ω= .ωkj/r×q is unknown. To estimate the gjs, we model the non-parametric factors byusing regression splines:
fk.x/=β1kx+ . . . +βskxs +M∑
m=1βm+s, k.x−κm/s
+, k =1, . . . , r, .17/
where s � 1 is an integer, .u/s+ = us I.u � 0/ and κ1 < . . . < κM are fixed knots. Write z =.x, . . . , xs, .x−κ1/s+ , . . . , .x−κM/s+/, A= .βik/.M+s/×r and B=AΩ. Then equation (16) can berewritten as
y = zB+ e,
which is in the form of the multivariate linear regression (1). In traditional regression splineapproaches, the choice of the knots κ1, . . . , κM is crucial since too many knots result in overfit-ting whereas too few knots may not be able to capture the non-linear structure. Sophisticatedknot selection procedures are often employed to ensure good performance of the regressionspline estimate. A method that often enjoys better performance and is simpler to implement isthe so-called penalized regression spline method (Eilers and Marx, 1996; Ruppert and Carroll,1997) where a large number of knots are included and overfitting is avoided through shrink-age. Adopting this idea, an estimate of the non-parametric factor model can be defined as thesolution of

342 M.Yuan, A. Ekici, Z. Lu and R. Monteiro
minB
[tr{.Y −ZB/.Y −ZB/′}] subject tor∑
k=1
(M+s∑i=1
β2ik
)1=2
� t, .18/
where Y = .y1, . . . , yn/′ and Z = .z1, . . . , zn/′. For identifiability, we further assume that A′A=ΩΩ′ = Ir. Then expression (18) is equivalent to
minB
[tr{.Y −ZB/.Y −ZB/′}] subject to∑i
σi.B/� t, .19/
which is of the same form as expression (5) and can also be solved by using the algorithm thatis provided in Appendix A.
In most practical situations, the predictors are multivariate. To alleviate the ‘curse of dimen-sionality’, additive models (Hastie and Tibshirani, 1990) are commonly used where multivariatefunctions gj are written as
gj.x/=gj1.x1/+ . . . +gjp.xp/, j =1, . . . , q: .20/
Here gj1, . . ., gjp are univariate functions. Consider a non-parametric factor model for eachcomponent on the right-hand side of equation (20):
gji.xi/=ω.i/1j fi1.xi/+ω
.i/2j fi2.xi/+ . . . +ω
.i/rij
firi .xi/, .21/
where
fik.xi/=β.i/1k xi + . . . +β
.i/sk xs
i +M∑
m=1β
.i/m+s,k.xi −κ.i/
m /s+, k =1, . . . , ri:
Denote zi = .xi, . . . , xsi , .xi − κ
.i/1 /s+, . . . , .xi − κ
.i/M /s+/, Ai = .β
.i/jk /.M+s/×r, Ωi = .ω
.i/jk / and Bi =
AiΩi. Then a non-parametric factor model for multivariate predictors can be given as
y = z1B1 + . . . + zpBp + e:
Similarly to expression (19), we define our estimate of the Bis as the solution of
minB1,:::,Bp
[tr{.Y −ZB/.Y −ZB/′}] subject to∑j
σj.Bi/� ti, j = i, . . . , p, .22/
where Z= .Z1, . . . , Zp/ and B= .B′1, . . . , B′
p/′. Using the algorithm that is presented in AppendixA, expression (22) can be solved in an iterative fashion.
Step 1: initialize Bi =0, i=1, . . . , p.Step 2: for i=1, . . . , p,
(a) compute YÅ =Y −Z1B1 − . . . −Zi−1Bi−1 −Zi+1Bi+1 − . . . −ZpBp and(b) update Bi by minimizing tr{.YÅ −ZiBi/.Y
Å −ZiBi/′} subject to Σj σj.Bi/� ti.
Step 3: repeat step 2 until B does not change.
To illustrate, we reanalyse the biochemical data from Smith et al. (1962). The data con-tain chemical measurements on several characteristics of 33 individual samples of men’s urinespecimens. There are five response variables: pigment creatinine, concentrations of phosphate,phosphorus, creatinine and choline. The goal of the analysis is to relate these responses to threepredictors: the weight of the subject, volume and specific gravity. Reinsel and Velu (1998) pos-tulated a multivariate linear model to analyse the data. A non-parametric extension such asequation (21) could be more powerful if non-linear effects of the predictors are suspected. Forthis, we model the effect of each of the predictors by equation (17) with s = 2 and M = 5. The

Multivariate Linear Regression 343
x
f(x)
1.0 1.5 2.0 2.5 3.0 3.5
1.0 1.5 2.0 2.5 3.0 3.5
1.0 1.5 2.0 2.5 3.0 3.5
1.0 1.5 2.0 2.5 3.0 3.5
1.0 1.5 2.0 2.5 1.0 1.5 2.0 2.5
1.0 1.5 2.0 2.5
1.0 1.5 2.0 2.5
1.0 1.5 2.0 2.5
1.0 1.5 2.0 2.5
3.0 3.5
−1
0
0−
1−
2−
3
12
3choline (mg/ml) ~ 100(gravity–1)
creatinine (mg/ml) ~ 100(gravity–1) creatinine (mg/ml) ~ volume (ml/100)
4321
−2
−1
01
2
0.0
0.5
4321
−0.
50.
51.
0
0.0
0.5
1.0
0.0
0.5
1.0
0.0
0.5
1.0
−0.
20.
20.
6
4321
−0.
50.
00.
5
−0.
10.
10.
3
4321
−0.
40.
00.
4
−1.
5−0.
50.
5
4321
−2−
10
1
−4
−2
0
choline (mg/ml) ~ volume (ml/100) choline (mg/ml) ~ weight (lbs/100)
phosphate (mg/ml) ~ 100(gravity–1) phosphate (mg/ml) ~ volume (ml/100)
phosphorus (mg/ml) ~ 100(gravity–1) phosphorus (mg/ml) ~ volume (ml/100)
pigment creatinine ~ 100(gravity–1) pigment creatinine ~ volume (ml/100)
creatinine (mg/ml) ~ weight (lbs/100)
phosphate (mg/ml) ~ weight (lbs/100)
phosphorus (mg/ml) ~ weight (lbs/100)
pigment creatinine ~ weight (lbs/100)
Fig. 4. Fitted components for the biochemistry data
knots are chosen to be equally spaced quantiles of the corresponding covariate. A practical issuein using this method is the choice of tuning parameters t1, . . . , tp. We adopted a strategy thatis commonly used in smoothing spline models when there are multiple tuning parameters: ti istuned at step 2(b) in each iteration by using the GCV criterion that was developed before. Fig. 4shows the estimated effect of each predictor on each response. Clear departure from a linearassumption can be observed.
8. Discussion
In this paper, we introduced a general formulation for dimension reduction and coefficient esti-mation in the multivariate linear model. On the basis of this formulation, we proposed a newmethod for shrinkage and dimension reduction. The method has connection with many existingmethods but has been demonstrated to enjoy considerably better performance. We also extendedthe method to a non-parametric model for predicting multiple responses. The implementationof our method takes advantage of recent advances in convex optimization.
Linear factor regression reduces the dimensionality of the estimating problem and oftenleads to models with enhanced interpretability. However, it can be unstable because of the dis-crete nature of selecting the number of factors. Also, the factors are often constructed in anad hoc fashion and may not allow sufficient dimension reduction. In contrast, ridge regressionoften enjoys superior prediction accuracy because it leads to a shrinkage estimate, but it doesnot provide easily interpretable models. Our method combines and retains the advantages of
344 M.Yuan, A. Ekici, Z. Lu and R. Monteiro
both approaches. Formulated as a penalized least squares estimate, the method proposed gives ashrinkage estimate with reduced ranks. We demonstrated by numerical examples that the methodproposed enjoys competitive performance when compared with other popular methods.
The penalty that we employed is the coefficient matrix’s Ky Fan norm, which shares somesimilar characteristics with the absolute value constraints that are used by the lasso in the spe-cial case of orthogonal designs as illustrated in Section 3. Such similarity and the encouragingresults that were reported here suggest that this penalty may prove useful in other statisticalproblems where a matrix of high dimension is to be estimated.
Acknowledgement
Yuan’s research was supported in part by National Science Foundation grant DMS-0624841.
Appendix A: Algorithm for solving expression (5)
To solve expression (5), we take advantage of the recent advance in convex optimization. We show thatexpression (5) is equivalent to a second-order cone program and can be solved by using standard solverssuch as SDPT3 (Tütüncü et al., 2003).
Let us first introduce some notation. Denote by Lm the m-dimensional second-order cone:
Lm ={x = .x1, . . . , xm/∈Rm : x1 �√.x2
2 + . . . +x2m/}:
Write Rm+ = {x = .x1, . . . , xm/′ : xi � 0, i = 1, . . . , m} and X � 0 to indicate that the symmetric matrix X is
positive semidefinite. Also for an n×n symmetric matrix X, define the vectorization operator svec as
svec.X/= .X11, X21√
2, X22, . . . , Xn1√
2, . . . , Xn,n−1√
2, Xnn/′:
SDPT3 can solve problems of the form
minXs
j ,xqi ,xl
{ns∑
j=1tr.Cs
jXsj/+
nq∑i=1
.cqi /′xq
i + .cl/′xl
}
such that
ns∑j=1
.Asj/
′svec.Xsj/+
nq∑i=1
.Aqi /
′xqi + .Al/′xl =b, Xs
j �0 ∀j, xqi ∈Lqi ∀i, xl ∈Rnl+ , .23/
where Csj is a symmetric matrix of the same dimension as Xs
j , cqi is a qi-dimensional vector, cl is an
nl-dimensional vector and the dimensions of matrices A and vector b are clear from the context.Next we show that expression (5) can be equivalently written in the form of problem (23). Similarly to
equation (8), the objective function of expression (5) can be rewritten as
tr{.B− BLS
/′X′X.B− BLS
/}= tr.C′C/
up to a constant free of B where C =Λ1=2Q.B − BLS
/ and Q′ΛQ is the eigenvalue decomposition of X′X.By the definition of the second-order cone, expression (5) can be equivalently written as
minM,C,B
.M/
such that
.M, C11, . . . , C1q, C21, . . . , Cpq/′ ∈Lpq+1,
q∑i=1
σi.B/� t, C =Λ1=2Q.B− BLS
/:
Using the Schur complement lemma (Ben-Tal and Nemirovski, 2001), the constraintΣ σi.B/=Σ σi.QB/� tis equivalent to

Multivariate Linear Regression 345
min.p,q/∑i=1
μi.A/� t
where μi.A/ is the ith eigenvalue of A and
A=( 0 .QB/′
.QB/ 0
):
Together with formula (4.2.2) of Ben-Tal and Nemirovski (2001), page 147, this constraint is also equivalentto
qs+ tr.Z/� t,
Z −(
0 .Λ−1=2C +QBLS
/′
.Λ−1=2C +QBLS
/ 0
)+ sI �0,
Z �0:
Now, expression (5) is equivalent to
minM,C,s,Z1,Z2
.M/
subject to
q.s1 − s2/+ tr.Z1/+ s3 = t,
Z2 −Z1 +( 0 .Λ−1=2C/′
.Λ−1=2C/ 0
)− .s1 − s2/I =
(0 −.QB
LS/′
−.QBLS
/ 0
),
Z1, Z2 �0,
.M, C11, . . . , C1q, C21, . . . , Cpq/′ ∈Lpq+1,
s ∈R3+,
which is readily computable by using SDPT3.When W �= I, the objective function becomes
tr{.Y −XB/W.Y −XB/′}:
A slight modification needs to be made to the above derivation. In this case, the objective function can berewritten as
tr{.B− BLS
/′X′X.B− BLS
/W}up to a constant that is free of B. Let PΔP ′ be the eigenvalue decomposition of W and define
C =Λ1=2Q.B− BLS
/PΔ1=2:
Similar arguments lead to the following equivalent conic program:
minM,C,s,Z1,Z2
.M/
subject to
q.s1 − s2/+ tr.Z1/+ s3 = t,
Z2 −Z1 +( 0 .Λ−1=2CΔ−1=2/′
.Λ−1=2CΔ−1=2/ 0
)− .s1 − s2/I =
(0 −.QB
LSP/′
−.QBLS
P/ 0
),
Z1, Z2 �0,
.M, C11, . . . , C1q, C21, . . . , Cpq/′ ∈Lpq+1,
s ∈R3+:

346 M.Yuan, A. Ekici, Z. Lu and R. Monteiro
References
Anderson, T. (1951) Estimating linear restrictions on regression coefficients for multivariate normal distributions.Ann. Math. Statist., 22, 327–351.
Anderson, T. (2003) An Introduction to Multivariate Statistical Analysis, 3rd edn. New York: Wiley.Bakin, S. (1999) Adaptive regression and model selection in data mining problems. PhD Thesis. Australian
National University, Canberra.Bedrick, E. and Tsai, C. (1994) Model selection for multivariate regression in small samples. Biometrics, 50,
226–231.Ben-Tal, A. and Nemirovski, A. (2001) Lectures on Modern Convex Optimization: Analysis, Algorithms, Engi-
neering Applications. Philadelphia: Society for Industrial and Applied Mathematics.Breiman, L. (1996) Heuristics of instability and stabilization in model selection. Ann. Statist., 24, 2350–2383.Breiman, L. and Friedman, J. H. (1997) Predicting multivariate responses in multiple linear regression (with
discussion). J. R. Statist. Soc. B, 59, 3–54.Brooks, R. and Stone, M. (1994) Joint continuum regression for multiple predictands. J. Am. Statist. Ass., 89,
1374–1377.Brown, P., Fearn, T. and Vannucci, M. (1999) The choice of variables in multivariate regression: a non-conjugate
Bayesian decision theory approach. Biometrika, 86, 635–648.Brown, P. J., Vannucci, M. and Fearn, T. (1998) Multivariate Bayesian variable selection and prediction. J. R.
Statist. Soc. B, 60, 627–641.Brown, P. J., Vannucci, M. and Fearn, T. (2002) Bayes model averaging with selection of regressors. J. R. Statist.
Soc. B, 64, 519–536.Eilers, P. and Marx, B. (1996) Flexible smoothing with B-splines and penalties (with discussion). Statist. Sci., 11,
89–121.Frank, I. and Friedman, J. (1993) A statistical view of some chemometrics regression tools (with discussion).
Technometrics, 35, 109–148.Fujikoshi, Y. and Satoh, K. (1997) Modified AIC and Cp in multivariate linear regression. Biometrika, 84, 707–716.Golub, G., Heath, M. and Wahba, G. (1979) Generalized cross validation as a method for choosing a good ridge
parameter. Technometrics, 21, 215–224.Hastie, T. and Tibshirani, R. (1990) Generalized Additive Models. London: Chapman and Hall.Horn, R. and Johnson, C. (1991) Topics in Matrix Analysis. Cambridge: Cambridge University Press.Hotelling, H. (1935) The most predictable criterion. J. Educ. Psychol., 26, 139–142.Hotelling, H. (1936) Relations between two sets of variables. Biometrika, 28, 321–377.Izenman, A. (1975) Reduced-rank regression for the multivariate linear model. J. Multiv. Anal., 5, 248–264.Johnstone, I. (2001) On the distribution of the largest eigenvalue in principal components analysis. Ann. Statist.,
29, 295–327.Lutz, R. and Bühlmann, P. (2006) Boosting for high-multivariate responses in high-dimensional linear regression.
Statist. Sin., 16, 471–494.Massy, W. (1965) Principal components regression with exploratory statistical research. J. Am. Statist. Ass., 60,
234–246.Reinsel, G. (1997) Elements of Multivariate Time Series Analysis, 2nd edn. New York: Springer.Reinsel, G. and Velu, R. (1998) Multivariate Reduced-rank Regression: Theory and Applications. New York:
Springer.Ruppert, D. and Carroll, R. (1997) Penalized regression splines. Technical Report. Cornell University, Ithaca.Smith, H., Gnanadesikan, R. and Hughes, J. (1962) Multivariate analysis of variance (ANOVA). Biometrics, 18,
22–41.Tibshirani, R. (1996) Regression shrinkage and selection via the lasso. J. R. Statist. Soc. B, 58, 267–288.Turlach, B., Venables, W. and Wright, S. (2005) Simultaneous variable selection. Technometrics, 47, 349–363.Tütüncü, R., Toh, K. and Todd, M. (2003) Solving semidefinite-quadratic-linear programs using SDPT3. Math.
Progrmmng, 95, 189–217.Wold, H. (1975) Soft modeling by latent variables: the nonlinear iterative partial least squares approach. In
Perspectives in Probability and Statistics: Papers in Honour of M. S. Bartlett (ed. J. Gani). New York: AcademicPress.
Yuan, M. and Lin, Y. (2006) Model selection and estimation in regression with grouped variables. J. R. Statist.Soc. B, 68, 49–67.
Related Documents


