Dilip Buildcon Galloping Giant!!! Sr. Analyst: Shravan Shah Associate: Maulik Shah Tel: +9122 6176 4849 Tel: +9122 6176 4875 E-mail: [email protected] E-mail: [email protected] April 10, 2017

Welcome message from author
This document is posted to help you gain knowledge. Please leave a comment to let me know what you think about it! Share it to your friends and learn new things together.
Transcript
Dilip Buildcon
Galloping Giant!!!
Sr. Analyst: Shravan Shah Associate: Maulik Shah
Tel: +9122 6176 4849 Tel: +9122 6176 4875
E-mail: [email protected] E-mail: [email protected]
April 10, 2017
April 10, 2017 2
Init
iati
ng
Co
vera
ge
Galloping Giant!!!
DBL with its differentiated business model that lays on project selection and
execution with operational efficiency, is all set to emerge as one of the prime
infrastructure players in India. It focuses on road and Govt projects with
equipment ownership, skilled manpower, minimal sub-contracting, and
backward integration. It has a presence in 13 states of India and is one of
the leading private sector road focused EPC player. Owing to a large fleet
of ~8,500 equipment, DBL has emerged has one of the best project
executors in India, having successfully completed ~90% projects before
time and winning ̀ 3.3bn early completion bonus during FY13-17. We expect
DBL to witness traction in revenue, best EBITDA margin among peers,
superior net profit margin, comfortable working capital, robust order inflow
and order book, robust FCFF, declining leverage, and improving healthy
return ratios (RoE and RoCE) over FY17-19E. We initiate DBL with a BUY
rating.
Strong inflow and robust order book enhances revenue visibility
With FY17E order inflow and order book at the historic level of ~`115.4bn/
~`173.3bn (3.5x FY17E) and fresh inflow of `70 bn expected in FY18E/
FY19E each, will improve revenue visibility for DBL.
Strong execution momentum to continue led by excellent capability
We expect DBL’s revenue to grow at a healthy CAGR of 18.7% over FY17-
19E driven by the continuation of execution momentum and pick-up in
execution on orders won (`115.4bn) in FY17. We expect a sharp jump in
Mining revenue over FY17-19E (~14% revenue share in FY18E-19E vs. 2%
in FY17E).
Best EBITDA margin among its peers led by operational efficiency
DBL will continue to enjoy best EBITDA margin (17.8% in FY18E and
FY19E) among its peers, due to operational efficiency which is led by large
fleet of modern equipment, excellent in-house execution capabilities.
Strong OCF, improving NWC, lower capex to reduce leverage
DBL’s Net D:E to decline to 1x by FY19E vs. 2.2x/ 1.3x for FY16/ FY17E led
by 28.1% adj. PAT CAGR, strong OCF of `16.7bn (FY18E+FY19E), limited
capex (`3 bn) and robust FCFF of `13.9bn (FY18E+FY19E).
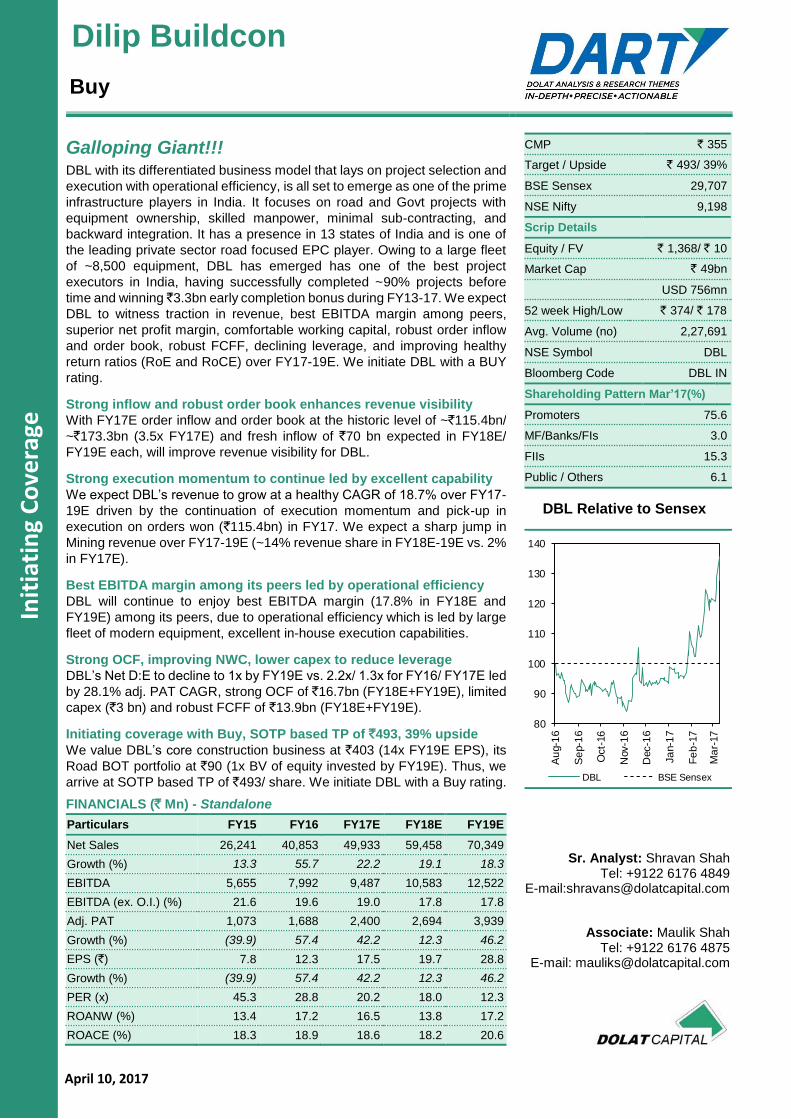
Initiating coverage with Buy, SOTP based TP of `493, 39% upside
We value DBL’s core construction business at `403 (14x FY19E EPS), its
Road BOT portfolio at `90 (1x BV of equity invested by FY19E). Thus, we
arrive at SOTP based TP of `493/ share. We initiate DBL with a Buy rating.
FINANCIALS (` Mn) - Standalone
Particulars FY15 FY16 FY17E FY18E FY19E
Net Sales 26,241 40,853 49,933 59,458 70,349
Growth (%) 13.3 55.7 22.2 19.1 18.3
EBITDA 5,655 7,992 9,487 10,583 12,522
EBITDA (ex. O.I.) (%) 21.6 19.6 19.0 17.8 17.8
Adj. PAT 1,073 1,688 2,400 2,694 3,939
Growth (%) (39.9) 57.4 42.2 12.3 46.2
EPS (`) 7.8 12.3 17.5 19.7 28.8
Growth (%) (39.9) 57.4 42.2 12.3 46.2
PER (x) 45.3 28.8 20.2 18.0 12.3
ROANW (%) 13.4 17.2 16.5 13.8 17.2
ROACE (%) 18.3 18.9 18.6 18.2 20.6
CMP ` 355
Target / Upside ` 493/ 39%
BSE Sensex 29,707
NSE Nifty 9,198
Scrip Details
Equity / FV ` 1,368/ ` 10
Market Cap ` 49bn
USD 756mn
52 week High/Low ` 374/ ` 178
Avg. Volume (no) 2,27,691
NSE Symbol DBL
Bloomberg Code DBL IN
Shareholding Pattern Mar’17(%)
Promoters 75.6
MF/Banks/FIs 3.0
FIIs 15.3
Public / Others 6.1
DBL Relative to Sensex
Sr. Analyst: Shravan Shah Tel: +9122 6176 4849
E-mail:[email protected] [email protected]
Associate: Maulik Shah Tel: +9122 6176 4875
E-mail: [email protected]
80
90
100
110
120
130
140A
ug-1
6
Se
p-1
6
Oct-
16
Nov-1
6
Dec-1
6
Ja
n-1
7
Fe
b-1
7
Ma
r-17
DBL BSE Sensex
Dilip Buildcon
Buy
April 10, 2017
April 10, 2017 4
Investment thesis
▪ With historic highest inflows of ~`115.4bn
(FY17E), resulting spike in order book to
~`173.3bn (FY17E) not only provides 3.5x FY17E
revenue visibility but also expected to drive robust
revenue growth (18.7% CAGR over FY17-19E).
▪ Differentiated business model along with proven
execution capabilities leading to sustenance of
highest EBITDA margin among peers, DBL is
expected to clock strong adj. PAT CAGR (28.1%
over FY17-19E).
▪ DBL is expected to generate robust operating
cash, FCFF leading to a reduction in leverage.
Catalyst
▪ Further expansion in its valuation multiples due to
early project completion bonus (as it earned in last
five years), positively impacting its profitability.
▪ Recovery of `3.3 bn from two private clients.
Company Background
DBL, started in 1988 and listed 11 August, 2016, has
emerged as a leading diversified private sector EPC
player with a presence in various infrastructure
segments such as Roads and Highways, Irrigation,
Urban development, and Mining.
With a modern construction fleet of ~8,500 equipment with GPS tracking backed by a large trained employee base of ~25,000, DBL has emerged as one of the best project executors in India with successfully completing 90% projects on/ before time and earning `3.3 bn as early completion bonus during last five
years.
DBL also has a portfolio of 24 BOT projects with total project cost of ~`106 bn, out of which, 14 are
operational projects (2 became operational in Mar’17 and 12 were operational till FY16) and 10 are under development projects including recently bagged 6 HAM (Hybrid Annuity) projects.
Risk
▪ If DBL is unable to bring equity partner in its BOT
portfolio, it may adversely affect its debt, interest
cost and profitability.
▪ Any delay in order inflow and execution, further
rise in NWC cycle and under utilisation of large
fleet of equipment and manpower may adversely
affect its profitability.
Assumptions FY17E FY18E FY19E
Order inflow (` bn) 115.4 70.0 70.0
Revenue growth (%) 22.2 19.1 18.3
EBITDA growth (%) 18.7 11.6 18.3
Adj. PAT growth (%) 42.2 12.3 46.2
EBITDA margin (%) 19.0 17.8 17.8
Tax rate (%) 5.4 31.0 31.0
Capex (` bn) 4.0 1.5 1.5
Gross debt (` bn) 24.6 25.6 24.8
NWC days 158 142 128
Event
May'17 Q4FY17 results
April 10, 2017 5
Investment Thesis
Strong inflow and robust order book enhances revenue visibility DBL was successful in its strategy to build a sustainable business model by not only
growing, but also diversifying both geographically and segmentally its order book. It
also effectively raised its exposure towards Govt. clients (96%) from just 22.9%
(FY13).
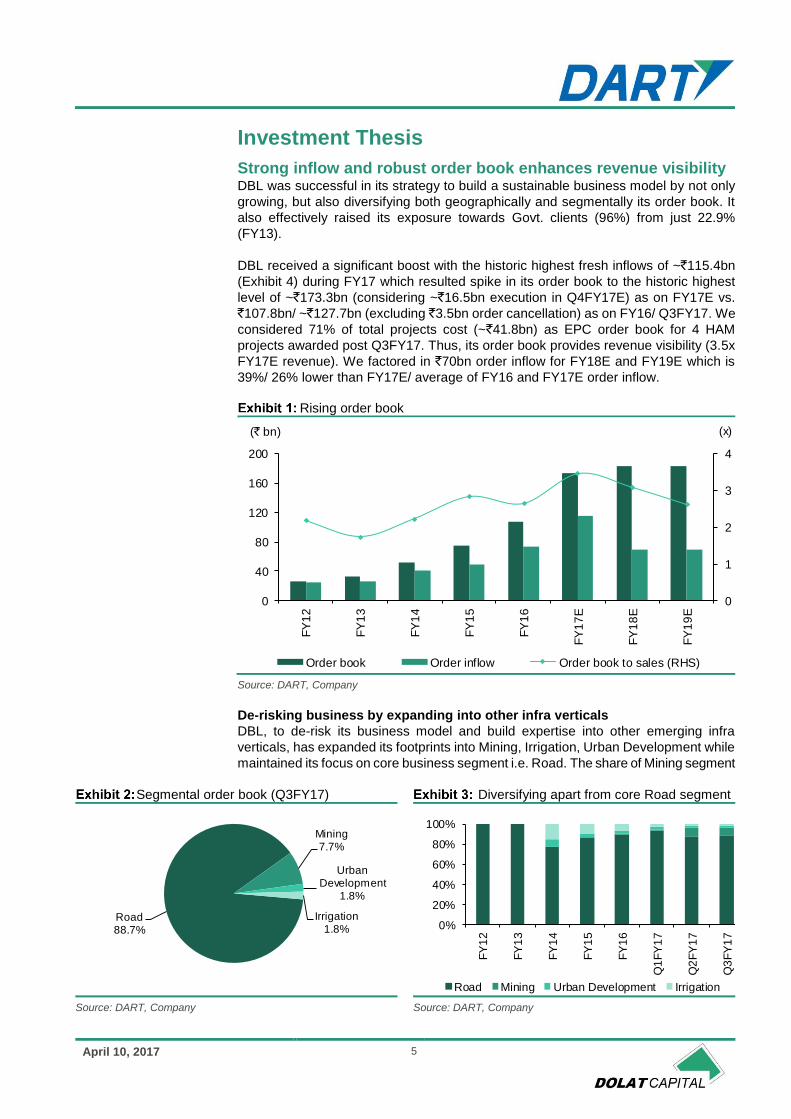
DBL received a significant boost with the historic highest fresh inflows of ~`115.4bn
(Exhibit 4) during FY17 which resulted spike in its order book to the historic highest
level of ~`173.3bn (considering ~`16.5bn execution in Q4FY17E) as on FY17E vs.
`107.8bn/ ~`127.7bn (excluding `3.5bn order cancellation) as on FY16/ Q3FY17. We
considered 71% of total projects cost (~`41.8bn) as EPC order book for 4 HAM
projects awarded post Q3FY17. Thus, its order book provides revenue visibility (3.5x
FY17E revenue). We factored in `70bn order inflow for FY18E and FY19E which is
39%/ 26% lower than FY17E/ average of FY16 and FY17E order inflow.
Rising order book
Source: DART, Company
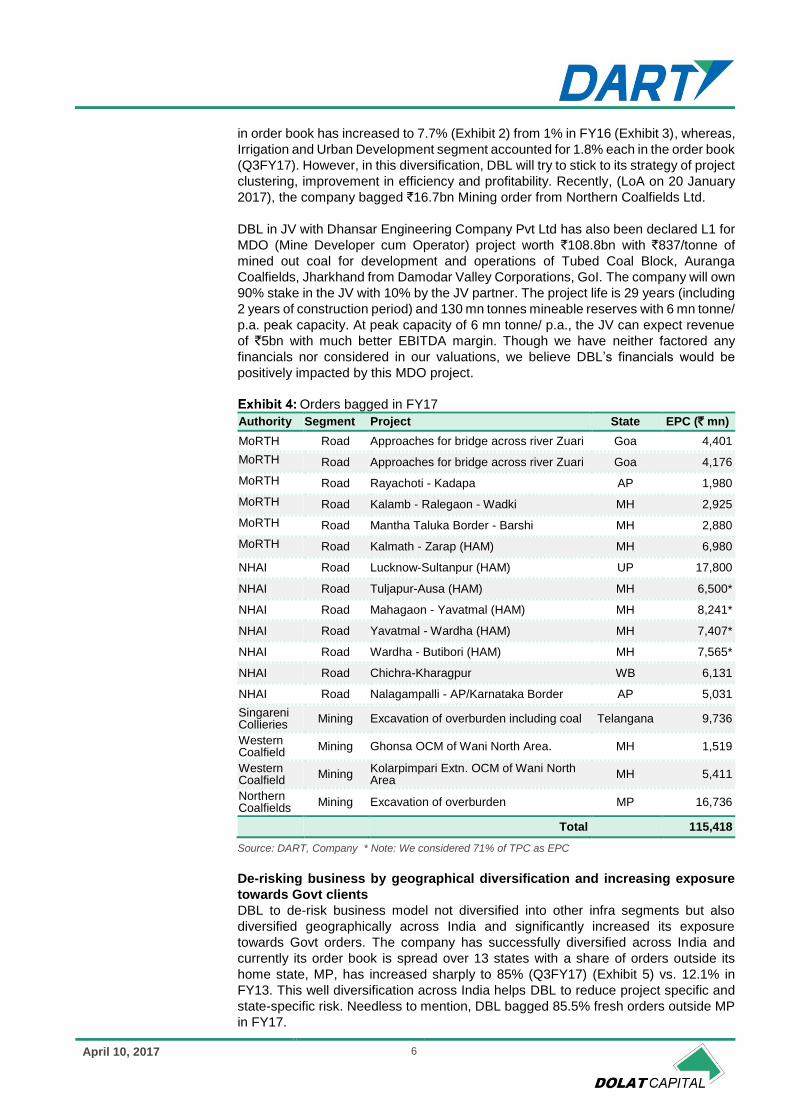
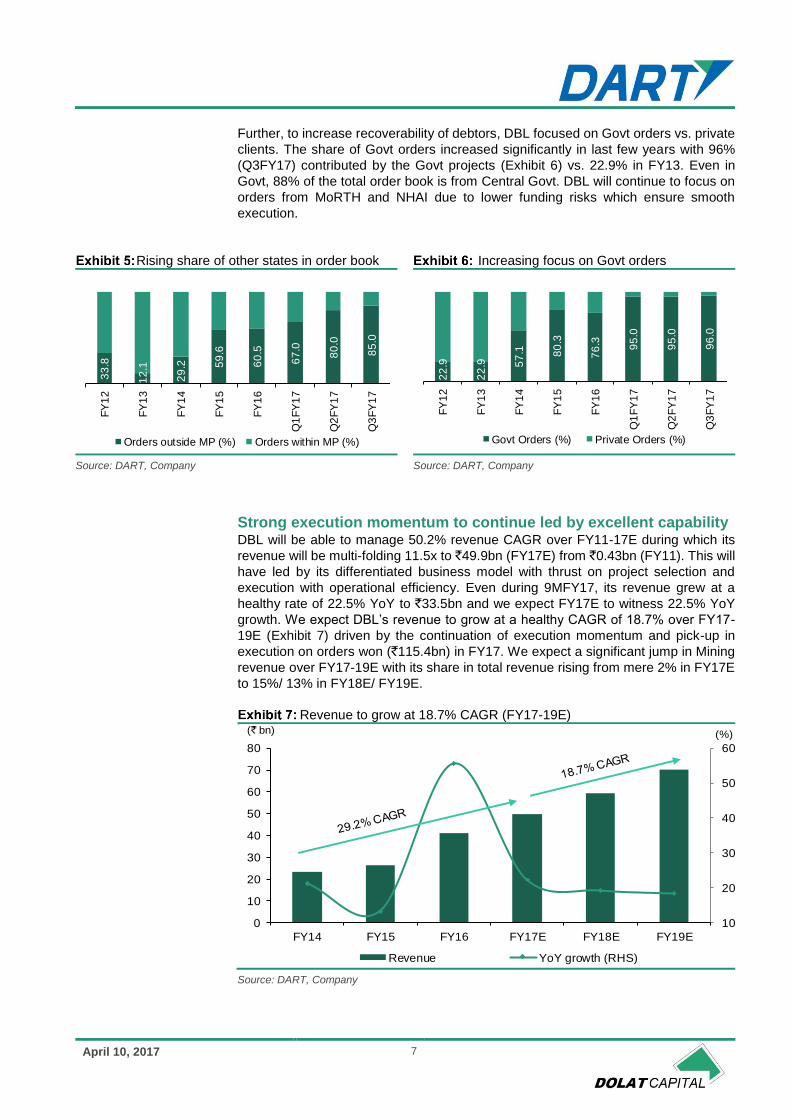
De-risking business by expanding into other infra verticals
DBL, to de-risk its business model and build expertise into other emerging infra
verticals, has expanded its footprints into Mining, Irrigation, Urban Development while
maintained its focus on core business segment i.e. Road. The share of Mining segment
Segmental order book (Q3FY17) Diversifying apart from core Road segment
Source: DART, Company Source: DART, Company
0
1
2
3
4
0
40
80
120
160
200
FY
12
FY
13
FY
14
FY
15
FY
16
FY
17
E
FY
18
E
FY
19
E
(x)(` bn)
Order book Order inflow Order book to sales (RHS)
Road88.7%
Mining7.7%
Urban Development
1.8%
Irrigation1.8% 0%
20%
40%
60%
80%
100%
FY
12
FY
13
FY
14
FY
15
FY
16
Q1
FY
17
Q2
FY
17
Q3
FY
17
Road Mining Urban Development Irrigation
April 10, 2017 6
in order book has increased to 7.7% (Exhibit 2) from 1% in FY16 (Exhibit 3), whereas,
Irrigation and Urban Development segment accounted for 1.8% each in the order book
(Q3FY17). However, in this diversification, DBL will try to stick to its strategy of project
clustering, improvement in efficiency and profitability. Recently, (LoA on 20 January
2017), the company bagged `16.7bn Mining order from Northern Coalfields Ltd.
DBL in JV with Dhansar Engineering Company Pvt Ltd has also been declared L1 for
MDO (Mine Developer cum Operator) project worth `108.8bn with `837/tonne of
mined out coal for development and operations of Tubed Coal Block, Auranga
Coalfields, Jharkhand from Damodar Valley Corporations, GoI. The company will own
90% stake in the JV with 10% by the JV partner. The project life is 29 years (including
2 years of construction period) and 130 mn tonnes mineable reserves with 6 mn tonne/
p.a. peak capacity. At peak capacity of 6 mn tonne/ p.a., the JV can expect revenue
of `5bn with much better EBITDA margin. Though we have neither factored any
financials nor considered in our valuations, we believe DBL’s financials would be
positively impacted by this MDO project.
Orders bagged in FY17
Authority Segment Project State EPC (` mn)
MoRTH Road Approaches for bridge across river Zuari Goa 4,401
MoRTH Road Approaches for bridge across river Zuari Goa 4,176
MoRTH Road Rayachoti - Kadapa AP 1,980
MoRTH Road Kalamb - Ralegaon - Wadki MH 2,925
MoRTH Road Mantha Taluka Border - Barshi MH 2,880
MoRTH Road Kalmath - Zarap (HAM) MH 6,980
NHAI Road Lucknow-Sultanpur (HAM) UP 17,800
NHAI Road Tuljapur-Ausa (HAM) MH 6,500*
NHAI Road Mahagaon - Yavatmal (HAM) MH 8,241*
NHAI Road Yavatmal - Wardha (HAM) MH 7,407*
NHAI Road Wardha - Butibori (HAM) MH 7,565*
NHAI Road Chichra-Kharagpur WB 6,131
NHAI Road Nalagampalli - AP/Karnataka Border AP 5,031
Singareni Collieries
Mining Excavation of overburden including coal Telangana 9,736
Western Coalfield
Mining Ghonsa OCM of Wani North Area. MH 1,519
Western Coalfield
Mining Kolarpimpari Extn. OCM of Wani North Area
MH 5,411
Northern Coalfields
Mining Excavation of overburden MP 16,736
Total 115,418
Source: DART, Company * Note: We considered 71% of TPC as EPC
De-risking business by geographical diversification and increasing exposure
towards Govt clients
DBL to de-risk business model not diversified into other infra segments but also
diversified geographically across India and significantly increased its exposure
towards Govt orders. The company has successfully diversified across India and
currently its order book is spread over 13 states with a share of orders outside its
home state, MP, has increased sharply to 85% (Q3FY17) (Exhibit 5) vs. 12.1% in
FY13. This well diversification across India helps DBL to reduce project specific and
state-specific risk. Needless to mention, DBL bagged 85.5% fresh orders outside MP
in FY17.
April 10, 2017 7
Further, to increase recoverability of debtors, DBL focused on Govt orders vs. private
clients. The share of Govt orders increased significantly in last few years with 96%
(Q3FY17) contributed by the Govt projects (Exhibit 6) vs. 22.9% in FY13. Even in
Govt, 88% of the total order book is from Central Govt. DBL will continue to focus on
orders from MoRTH and NHAI due to lower funding risks which ensure smooth
execution.
Rising share of other states in order book Increasing focus on Govt orders
Source: DART, Company Source: DART, Company
Strong execution momentum to continue led by excellent capability DBL will be able to manage 50.2% revenue CAGR over FY11-17E during which its
revenue will be multi-folding 11.5x to `49.9bn (FY17E) from `0.43bn (FY11). This will
have led by its differentiated business model with thrust on project selection and
execution with operational efficiency. Even during 9MFY17, its revenue grew at a
healthy rate of 22.5% YoY to `33.5bn and we expect FY17E to witness 22.5% YoY
growth. We expect DBL’s revenue to grow at a healthy CAGR of 18.7% over FY17-
19E (Exhibit 7) driven by the continuation of execution momentum and pick-up in
execution on orders won (`115.4bn) in FY17. We expect a significant jump in Mining
revenue over FY17-19E with its share in total revenue rising from mere 2% in FY17E
to 15%/ 13% in FY18E/ FY19E.
Revenue to grow at 18.7% CAGR (FY17-19E)
Source: DART, Company
33
.8
12
.1
29
.2 59
.6
60
.5
67
.0
80
.0
85
.0
FY
12
FY
13
FY
14
FY
15
FY
16
Q1
FY
17
Q2
FY
17
Q3
FY
17
Orders outside MP (%) Orders within MP (%)2
2.9
22
.9 57
.1 80
.3
76
.3 95
.0
95
.0
96
.0
FY
12
FY
13
FY
14
FY
15
FY
16
Q1
FY
17
Q2
FY
17
Q3
FY
17
Govt Orders (%) Private Orders (%)
10
20
30
40
50
60
0
10
20
30
40
50
60
70
80
FY14 FY15 FY16 FY17E FY18E FY19E
Revenue YoY growth (RHS)
(` bn) (%)
April 10, 2017 8
DBL is likely to continue to focus on the Road segment due to its proven execution
track record in the segment and the ability to identify profitable road projects to drive
its revenue growth. Moreover, due to its vast experience of working in various states,
owned equipment, backward integration, excellent project execution capability and
well defined project selection and monitoring, the company would be able to execute
most of its projects on time or ahead of schedule.
Early completion bonus
(` mn) FY13 FY14 FY15 FY16 FY17 Total
From BOT projects 394 585 483 457 515 2,434
From EPC projects 140 0 0 142 582 868
Total 534 585 483 599 1,097* 3,303
As % of revenue 2.8 2.5 1.8 1.5 2.2
Source: DART, Company *Note: Announced so far
Early completion bonus in FY17
(` mn) Bonus (` mn)
Actual completion
days
Early completion
days
Project cost (` mn)
Length (kms)
Hata – Dargawon 154 329 400 1,011 64
Patan - Rehli 362 356 374 2,613 87
Total bonus from BOT projects 515 3,624 151
Jabalpur-Patan-Shahpura 27 539 190 900 39
Adoni to Madhavaram via Mantralayam section 49 627 102 1,641 55
Mandla to Pindari 57 544 185 1,908 106
Rewa-Sidhi (NH-75E) 78 619 111 2,600 58
Jarwal - Bahraich 87 623 107 2,610 50
Sidhi-Tikhri (MDR-45-2), Kyothi Katra Lalgaon (MDR-43-02), Mauganj-Katra (MDR-43-04)
72 385 254 1,449 96
Badnagar - Sundarabad 49 580 150 1,620 95
Kanti - Shahdol - Anuppur - MP/Chattisgarh Border 102 630 100 3,402 92
Jabalpur- Mandla-Chilpi 60 630 100 2,011 22
Total bonus from EPC projects 582 18,140 613
Total bonus from all projects 1,097* 21,764 763
Source: DART, Company *Note: Announced so far
DBL earned ̀ 2.2bn (Exhibit 8) as early completion bonus during FY13-16 which stood
at an average 2.2% of revenue. Even during FY17, the company so far announced
the highest ̀ 1.1bn (Exhibit 9) in a year as early completion bonus for 11 projects worth
`21.8bn totaling 763 kms. The key point to note here that out of 11 projects 9 were
EPC projects contributing 53% vs. 12.8% (for FY13-16) of total early completion
bonus. We believe, the company is likely to continue this trend in coming years,
however, we have not factored in any early completion bonus in our valuation.
April 10, 2017 9
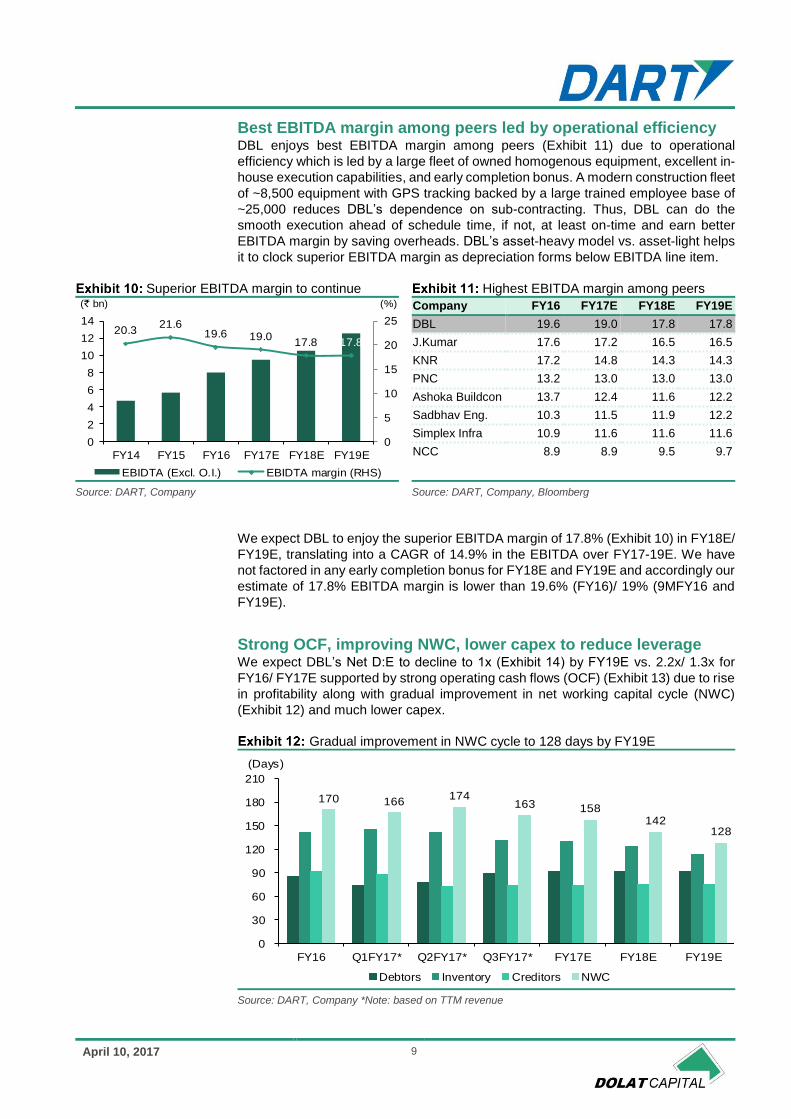
Best EBITDA margin among peers led by operational efficiency DBL enjoys best EBITDA margin among peers (Exhibit 11) due to operational
efficiency which is led by a large fleet of owned homogenous equipment, excellent in-
house execution capabilities, and early completion bonus. A modern construction fleet
of ~8,500 equipment with GPS tracking backed by a large trained employee base of
~25,000 reduces DBL’s dependence on sub-contracting. Thus, DBL can do the
smooth execution ahead of schedule time, if not, at least on-time and earn better
EBITDA margin by saving overheads. DBL’s asset-heavy model vs. asset-light helps
it to clock superior EBITDA margin as depreciation forms below EBITDA line item.
Superior EBITDA margin to continue Highest EBITDA margin among peers
Company FY16 FY17E FY18E FY19E
DBL 19.6 19.0 17.8 17.8
J.Kumar 17.6 17.2 16.5 16.5
KNR 17.2 14.8 14.3 14.3
PNC 13.2 13.0 13.0 13.0
Ashoka Buildcon 13.7 12.4 11.6 12.2
Sadbhav Eng. 10.3 11.5 11.9 12.2
Simplex Infra 10.9 11.6 11.6 11.6
NCC 8.9 8.9 9.5 9.7
Source: DART, Company Source: DART, Company, Bloomberg
We expect DBL to enjoy the superior EBITDA margin of 17.8% (Exhibit 10) in FY18E/
FY19E, translating into a CAGR of 14.9% in the EBITDA over FY17-19E. We have
not factored in any early completion bonus for FY18E and FY19E and accordingly our
estimate of 17.8% EBITDA margin is lower than 19.6% (FY16)/ 19% (9MFY16 and
FY19E).
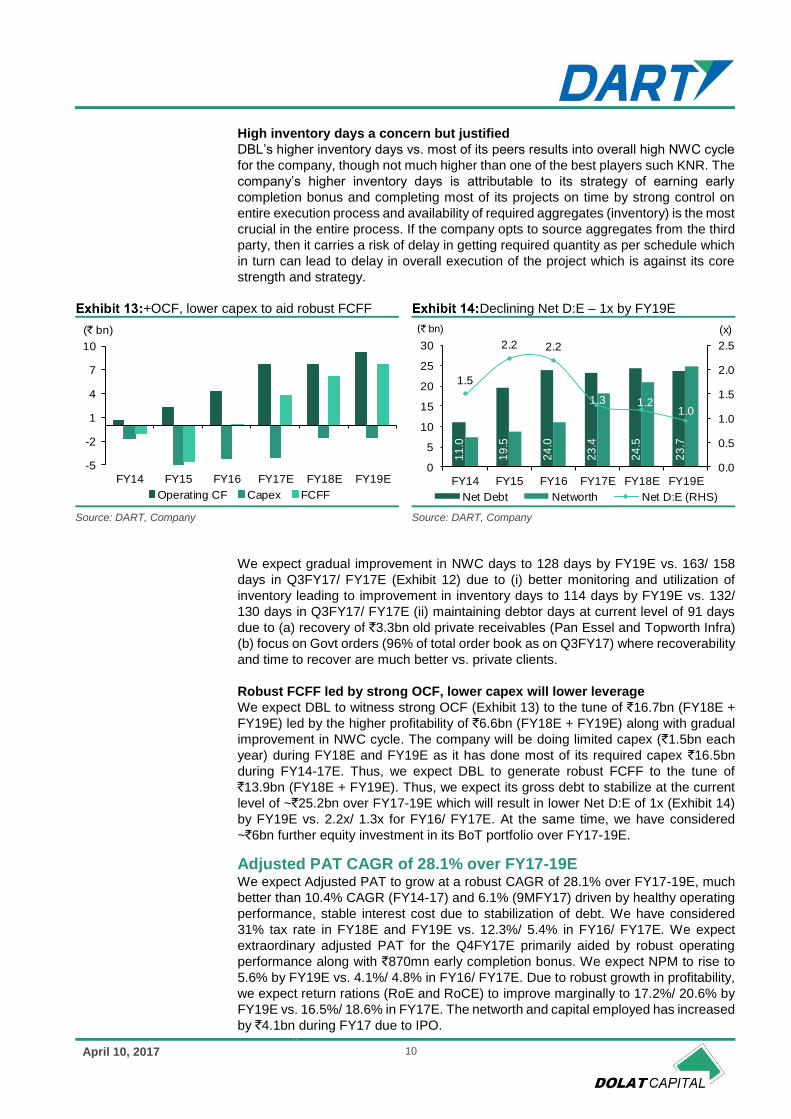
Strong OCF, improving NWC, lower capex to reduce leverage We expect DBL’s Net D:E to decline to 1x (Exhibit 14) by FY19E vs. 2.2x/ 1.3x for
FY16/ FY17E supported by strong operating cash flows (OCF) (Exhibit 13) due to rise
in profitability along with gradual improvement in net working capital cycle (NWC)
(Exhibit 12) and much lower capex.
Gradual improvement in NWC cycle to 128 days by FY19E
Source: DART, Company *Note: based on TTM revenue
20.321.6
19.6 19.017.8 17.8
0
5
10
15
20
25
0
2
4
6
8
10
12
14
FY14 FY15 FY16 FY17E FY18E FY19E
EBIDTA (Excl. O.I.) EBIDTA margin (RHS)
(` bn) (%)
170 166 174
163 158 142
128
0
30
60
90
120
150
180
210
FY16 Q1FY17* Q2FY17* Q3FY17* FY17E FY18E FY19E
(Days)
Debtors Inventory Creditors NWC
April 10, 2017 10
High inventory days a concern but justified
DBL’s higher inventory days vs. most of its peers results into overall high NWC cycle
for the company, though not much higher than one of the best players such KNR. The
company’s higher inventory days is attributable to its strategy of earning early
completion bonus and completing most of its projects on time by strong control on
entire execution process and availability of required aggregates (inventory) is the most
crucial in the entire process. If the company opts to source aggregates from the third
party, then it carries a risk of delay in getting required quantity as per schedule which
in turn can lead to delay in overall execution of the project which is against its core
strength and strategy.
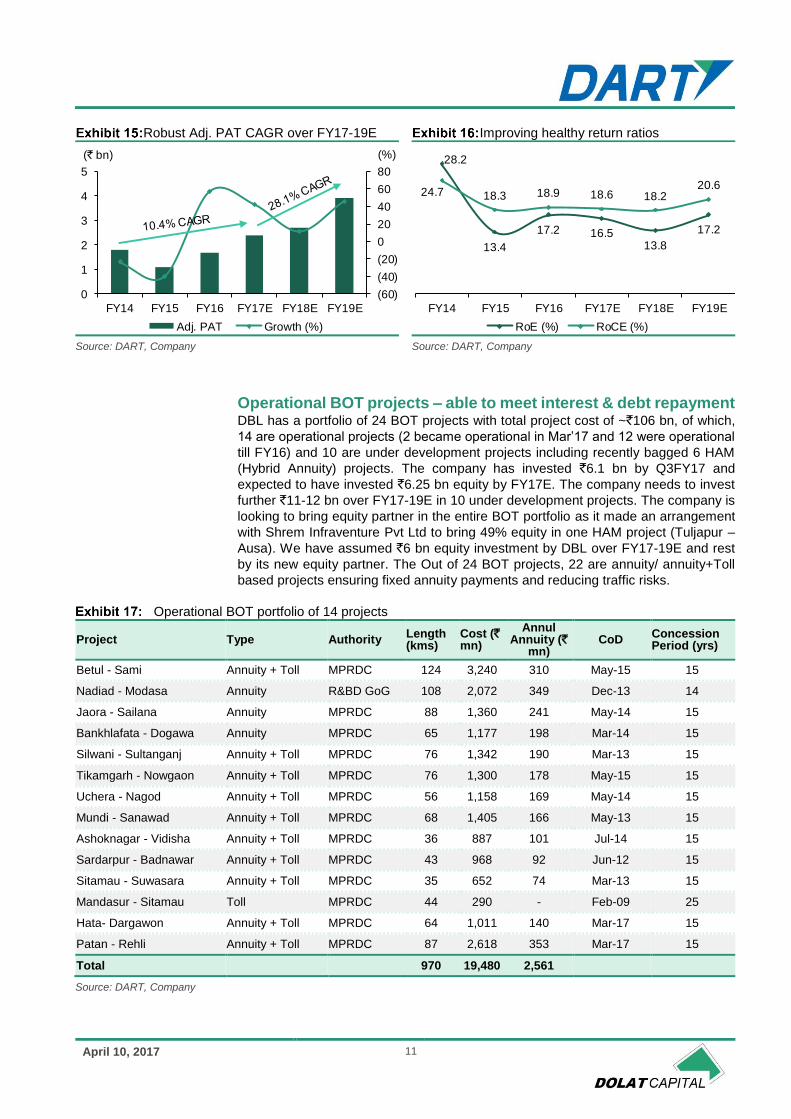
+OCF, lower capex to aid robust FCFF Declining Net D:E – 1x by FY19E
Source: DART, Company Source: DART, Company
We expect gradual improvement in NWC days to 128 days by FY19E vs. 163/ 158
days in Q3FY17/ FY17E (Exhibit 12) due to (i) better monitoring and utilization of
inventory leading to improvement in inventory days to 114 days by FY19E vs. 132/
130 days in Q3FY17/ FY17E (ii) maintaining debtor days at current level of 91 days
due to (a) recovery of `3.3bn old private receivables (Pan Essel and Topworth Infra)
(b) focus on Govt orders (96% of total order book as on Q3FY17) where recoverability
and time to recover are much better vs. private clients.
Robust FCFF led by strong OCF, lower capex will lower leverage
We expect DBL to witness strong OCF (Exhibit 13) to the tune of `16.7bn (FY18E +
FY19E) led by the higher profitability of `6.6bn (FY18E + FY19E) along with gradual
improvement in NWC cycle. The company will be doing limited capex (`1.5bn each
year) during FY18E and FY19E as it has done most of its required capex `16.5bn
during FY14-17E. Thus, we expect DBL to generate robust FCFF to the tune of
`13.9bn (FY18E + FY19E). Thus, we expect its gross debt to stabilize at the current
level of ~`25.2bn over FY17-19E which will result in lower Net D:E of 1x (Exhibit 14)
by FY19E vs. 2.2x/ 1.3x for FY16/ FY17E. At the same time, we have considered
~`6bn further equity investment in its BoT portfolio over FY17-19E.
Adjusted PAT CAGR of 28.1% over FY17-19E We expect Adjusted PAT to grow at a robust CAGR of 28.1% over FY17-19E, much
better than 10.4% CAGR (FY14-17) and 6.1% (9MFY17) driven by healthy operating
performance, stable interest cost due to stabilization of debt. We have considered
31% tax rate in FY18E and FY19E vs. 12.3%/ 5.4% in FY16/ FY17E. We expect
extraordinary adjusted PAT for the Q4FY17E primarily aided by robust operating
performance along with `870mn early completion bonus. We expect NPM to rise to
5.6% by FY19E vs. 4.1%/ 4.8% in FY16/ FY17E. Due to robust growth in profitability,
we expect return rations (RoE and RoCE) to improve marginally to 17.2%/ 20.6% by
FY19E vs. 16.5%/ 18.6% in FY17E. The networth and capital employed has increased
by `4.1bn during FY17 due to IPO.
-5
-2
1
4
7
10
FY14 FY15 FY16 FY17E FY18E FY19E
(` bn)
Operating CF Capex FCFF
11
.0
19
.5
24
.0
23
.4
24
.5
23
.7
1.5
2.2 2.2
1.3 1.21.0
0.0
0.5
1.0
1.5
2.0
2.5
0
5
10
15
20
25
30
FY14 FY15 FY16 FY17E FY18E FY19E
(x)
Net Debt Networth Net D:E (RHS)
(` bn)
April 10, 2017 11
Robust Adj. PAT CAGR over FY17-19E Improving healthy return ratios
Source: DART, Company Source: DART, Company
Operational BOT projects – able to meet interest & debt repayment DBL has a portfolio of 24 BOT projects with total project cost of ~`106 bn, of which,
14 are operational projects (2 became operational in Mar’17 and 12 were operational
till FY16) and 10 are under development projects including recently bagged 6 HAM
(Hybrid Annuity) projects. The company has invested `6.1 bn by Q3FY17 and
expected to have invested `6.25 bn equity by FY17E. The company needs to invest
further `11-12 bn over FY17-19E in 10 under development projects. The company is
looking to bring equity partner in the entire BOT portfolio as it made an arrangement
with Shrem Infraventure Pvt Ltd to bring 49% equity in one HAM project (Tuljapur –
Ausa). We have assumed `6 bn equity investment by DBL over FY17-19E and rest
by its new equity partner. The Out of 24 BOT projects, 22 are annuity/ annuity+Toll
based projects ensuring fixed annuity payments and reducing traffic risks.
Operational BOT portfolio of 14 projects
Project Type Authority Length (kms)
Cost (` mn)
Annul Annuity (`
mn) CoD
Concession Period (yrs)
Betul - Sami Annuity + Toll MPRDC 124 3,240 310 May-15 15
Nadiad - Modasa Annuity R&BD GoG 108 2,072 349 Dec-13 14
Jaora - Sailana Annuity MPRDC 88 1,360 241 May-14 15
Bankhlafata - Dogawa Annuity MPRDC 65 1,177 198 Mar-14 15
Silwani - Sultanganj Annuity + Toll MPRDC 76 1,342 190 Mar-13 15
Tikamgarh - Nowgaon Annuity + Toll MPRDC 76 1,300 178 May-15 15
Uchera - Nagod Annuity + Toll MPRDC 56 1,158 169 May-14 15
Mundi - Sanawad Annuity + Toll MPRDC 68 1,405 166 May-13 15
Ashoknagar - Vidisha Annuity + Toll MPRDC 36 887 101 Jul-14 15
Sardarpur - Badnawar Annuity + Toll MPRDC 43 968 92 Jun-12 15
Sitamau - Suwasara Annuity + Toll MPRDC 35 652 74 Mar-13 15
Mandasur - Sitamau Toll MPRDC 44 290 - Feb-09 25
Hata- Dargawon Annuity + Toll MPRDC 64 1,011 140 Mar-17 15
Patan - Rehli Annuity + Toll MPRDC 87 2,618 353 Mar-17 15
Total 970 19,480 2,561
Source: DART, Company
(60)
(40)
(20)
0
20
40
60
80
0
1
2
3
4
5
FY14 FY15 FY16 FY17E FY18E FY19E
(%)(` bn)
Adj. PAT Growth (%)
28.2
13.4
17.2 16.513.8
17.2
24.7 18.3 18.9 18.6 18.220.6
FY14 FY15 FY16 FY17E FY18E FY19E
RoE (%) RoCE (%)
April 10, 2017 12
The total annual annuity on 14 operational projects stands at `2.6 bn. 12 BOT projects
which were operational till FY16 earned `2.1 bn annuity out of total BOT revenue of
`2.7 bn in FY16 and generated cash profit (PAT + Depreciation) of `774 mn post
interest cost of `1.3 bn. This implies that the portfolio of 12 operational projects are
not only well-funded but also able to meet its interest and debt repayment.
Under development BOT projects – expect CoD ahead of time DBL has a portfolio of 10 BOT projects which are at various stages of under
development including recently bagged 6 HAM projects with total project cost of
~`86.4 bn. Out of 10 projects 9 are annuity based. We expect DBL to achieve CoD
for all the projects before schedule date as it did in the 14 are operational BOT
projects.
Under development BOT portfolio of 10 projects
Project Type Authority Length (kms)
Cost (` mn)
Annul Annuity (` mn)
Concession Period (yrs)
Guna - Biora Toll NHAI 94 9,010 - 26
Mundargi - Harapanahalli Annuity KRDCL 51 1,790 355 10
Hassan - Periyapatna Annuity KRDCL 74 2,546 526 10
Hirekerur - Ranibennur Annuity KRDCL 56 1,984 392 10
Luknow - Sultanpur HAM NHAI 123 20,160 - 18
Kalmath - Zarap HAM MoRHTH 44 9,140 - 15
Tuljapur - Ausa HAM NHAI 67 9,110 - 17
Mahagaon - Yavatmal HAM NHAI 80 11,606 - 17.5
Yavatmal - Wardha HAM NHAI 65 10,433 - 17.5
Wardha - Butibori HAM NHAI 59 10,655 - 17.5
Total 713 86,434 1,273
Source: DART, Company
Rational bidding by DBL in 6 HAM projects bagged by it
Project (a) Authority
Estimated Cost (` bn)
(b) Bid Cost (` bn)
(c) NPV (` bn)
% Diff b/w (b) & (a)
% Diff b/w (c) & L2
No of bidders
Luknow - Sultanpur 16.6 20.2 17.3 21.3 (7.0) 7
Kalmath - Zarap 6.5 9.1 8.3 39.8 (2.6) 2
Tuljapur - Ausa 9.1 9.1 8.1 0.7 (8.2) 5
Mahagaon - Yavatmal 11.0 11.6 10.3 5.7 (7.7) 7
Yavatmal - Wardha 9.9 10.4 9.3 5.6 (5.3) 8
Wardha - Butibori 10.3 10.7 9.5 3.4 (1.5) 5
Source: DART, Company
SAP implementation – a positive strategy DBL has started implementation of SAP S4 HANA in collaboration with IBM where
IBM will implement 11 modules of SAP which will cover all major operations of the
company. This process will take 6-8 months to start operating. The company expects
further improvement in operational efficiency and profitability post operationalization
of SAP.
April 10, 2017 13
Valuation: Initiating coverage with BUY rating We expect DBL to witness traction in revenue, best EBITDA margin among peers
(Exhibit 11), superior net profit margin, comfortable working capital, robust order
inflow and order book, robust FCFF (Exhibit 13), declining leverage, and improving
healthy return ratios (RoE and RoCE) over FY17-19E. We like DBL’s differentiated
business model with thrust on project selection and execution with operational
efficiency. Earning early project completion bonuses as it did in last five years (Exhibit
8 & 9) along with improvement in NWC cycle and a decline in leverage will act as key
positive triggers. An equity partner in its BOT portfolio at a higher valuation than 1x
BV will also act as a positive trigger. This, coupled with a reasonable valuation of 9.2x
FY19E EPS (excluding Road BoTs), makes the stock attractive.
DBL has a very short period of comparable historical 1-year forward valuation
multiples such as P/E, EV/EBITDA and P/B as it got listed on 11 August, 2016. With
better revenue CAGR over FY17-19E vs. some of its large peers like NCC, Simplex
Infra and Sadbhav Engineering, best EBITDA margin compared to peers, slightly
better return ratios (RoE and RoCE) compared to peers’ average (Exhibit 21) and
excellent execution capabilities resulting into early completion bonuses, the company
should be able to command a marginally higher PE multiple compared to its peers’
average.
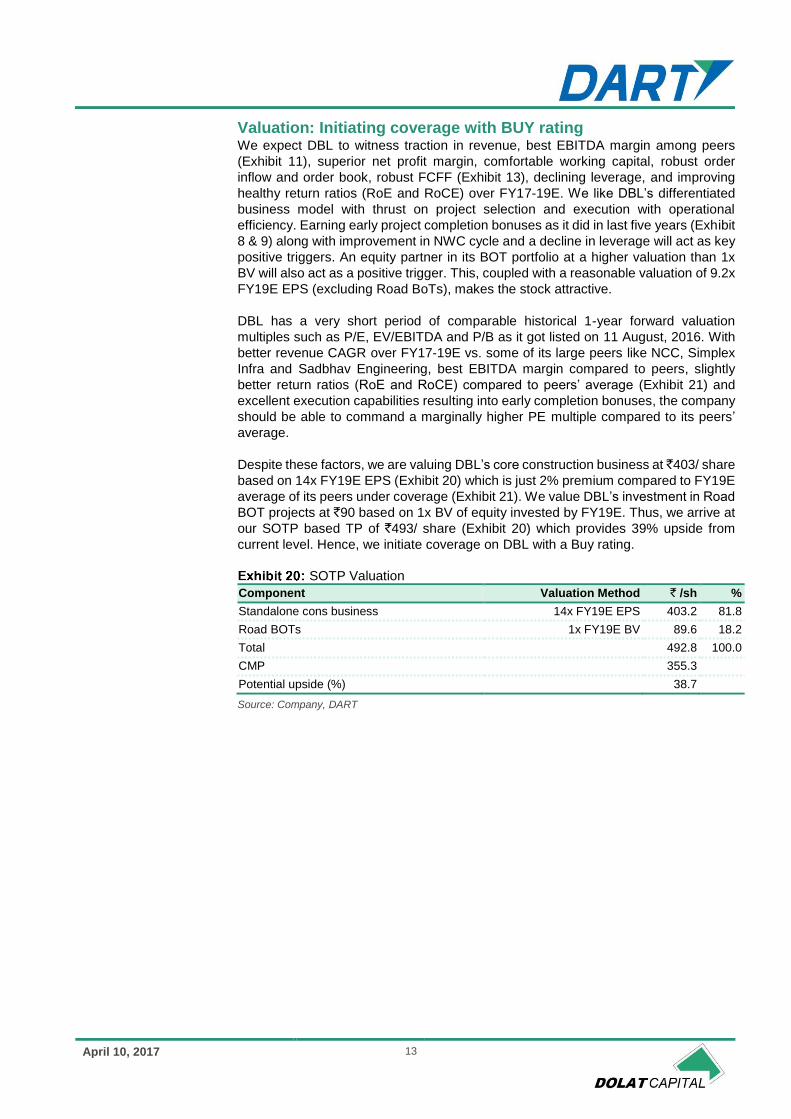
Despite these factors, we are valuing DBL’s core construction business at ̀ 403/ share
based on 14x FY19E EPS (Exhibit 20) which is just 2% premium compared to FY19E
average of its peers under coverage (Exhibit 21). We value DBL’s investment in Road
BOT projects at `90 based on 1x BV of equity invested by FY19E. Thus, we arrive at
our SOTP based TP of `493/ share (Exhibit 20) which provides 39% upside from
current level. Hence, we initiate coverage on DBL with a Buy rating.
SOTP Valuation
Component Valuation Method ` /sh %
Standalone cons business 14x FY19E EPS 403.2 81.8
Road BOTs 1x FY19E BV 89.6 18.2
Total 492.8 100.0
CMP 355.3
Potential upside (%) 38.7
Source: Company, DART
April 10, 2017 14
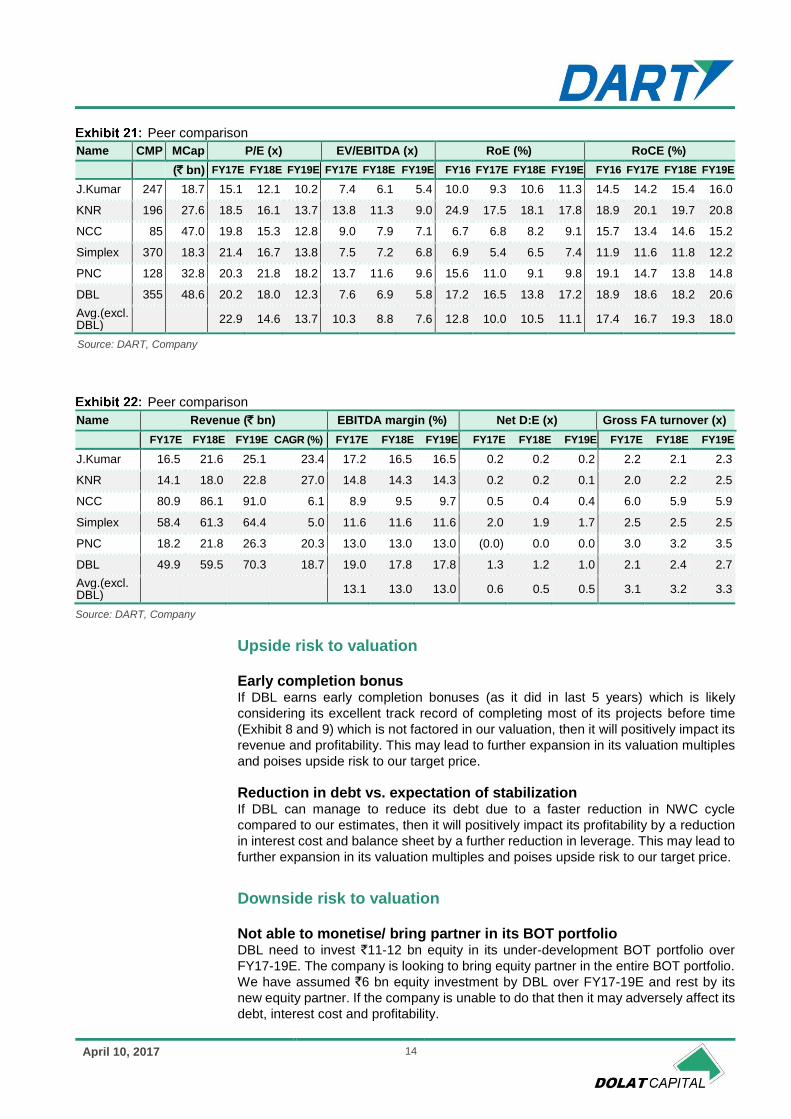
Peer comparison
Name CMP MCap P/E (x) EV/EBITDA (x) RoE (%) RoCE (%)
(` bn) FY17E FY18E FY19E FY17E FY18E FY19E FY16 FY17E FY18E FY19E FY16 FY17E FY18E FY19E
J.Kumar 247 18.7 15.1 12.1 10.2 7.4 6.1 5.4 10.0 9.3 10.6 11.3 14.5 14.2 15.4 16.0
KNR 196 27.6 18.5 16.1 13.7 13.8 11.3 9.0 24.9 17.5 18.1 17.8 18.9 20.1 19.7 20.8
NCC 85 47.0 19.8 15.3 12.8 9.0 7.9 7.1 6.7 6.8 8.2 9.1 15.7 13.4 14.6 15.2
Simplex 370 18.3 21.4 16.7 13.8 7.5 7.2 6.8 6.9 5.4 6.5 7.4 11.9 11.6 11.8 12.2
PNC 128 32.8 20.3 21.8 18.2 13.7 11.6 9.6 15.6 11.0 9.1 9.8 19.1 14.7 13.8 14.8
DBL 355 48.6 20.2 18.0 12.3 7.6 6.9 5.8 17.2 16.5 13.8 17.2 18.9 18.6 18.2 20.6
Avg.(excl. DBL)
22.9 14.6 13.7 10.3 8.8 7.6 12.8 10.0 10.5 11.1 17.4 16.7 19.3 18.0
Source: DART, Company
Peer comparison
Name Revenue (` bn) EBITDA margin (%) Net D:E (x) Gross FA turnover (x)
FY17E FY18E FY19E CAGR (%) FY17E FY18E FY19E FY17E FY18E FY19E FY17E FY18E FY19E
J.Kumar 16.5 21.6 25.1 23.4 17.2 16.5 16.5 0.2 0.2 0.2 2.2 2.1 2.3
KNR 14.1 18.0 22.8 27.0 14.8 14.3 14.3 0.2 0.2 0.1 2.0 2.2 2.5
NCC 80.9 86.1 91.0 6.1 8.9 9.5 9.7 0.5 0.4 0.4 6.0 5.9 5.9
Simplex 58.4 61.3 64.4 5.0 11.6 11.6 11.6 2.0 1.9 1.7 2.5 2.5 2.5
PNC 18.2 21.8 26.3 20.3 13.0 13.0 13.0 (0.0) 0.0 0.0 3.0 3.2 3.5
DBL 49.9 59.5 70.3 18.7 19.0 17.8 17.8 1.3 1.2 1.0 2.1 2.4 2.7
Avg.(excl. DBL)
13.1 13.0 13.0 0.6 0.5 0.5 3.1 3.2 3.3
Source: DART, Company
Upside risk to valuation Early completion bonus If DBL earns early completion bonuses (as it did in last 5 years) which is likely
considering its excellent track record of completing most of its projects before time
(Exhibit 8 and 9) which is not factored in our valuation, then it will positively impact its
revenue and profitability. This may lead to further expansion in its valuation multiples
and poises upside risk to our target price.
Reduction in debt vs. expectation of stabilization If DBL can manage to reduce its debt due to a faster reduction in NWC cycle
compared to our estimates, then it will positively impact its profitability by a reduction
in interest cost and balance sheet by a further reduction in leverage. This may lead to
further expansion in its valuation multiples and poises upside risk to our target price.
Downside risk to valuation Not able to monetise/ bring partner in its BOT portfolio DBL need to invest `11-12 bn equity in its under-development BOT portfolio over
FY17-19E. The company is looking to bring equity partner in the entire BOT portfolio.
We have assumed `6 bn equity investment by DBL over FY17-19E and rest by its
new equity partner. If the company is unable to do that then it may adversely affect its
debt, interest cost and profitability.
April 10, 2017 15
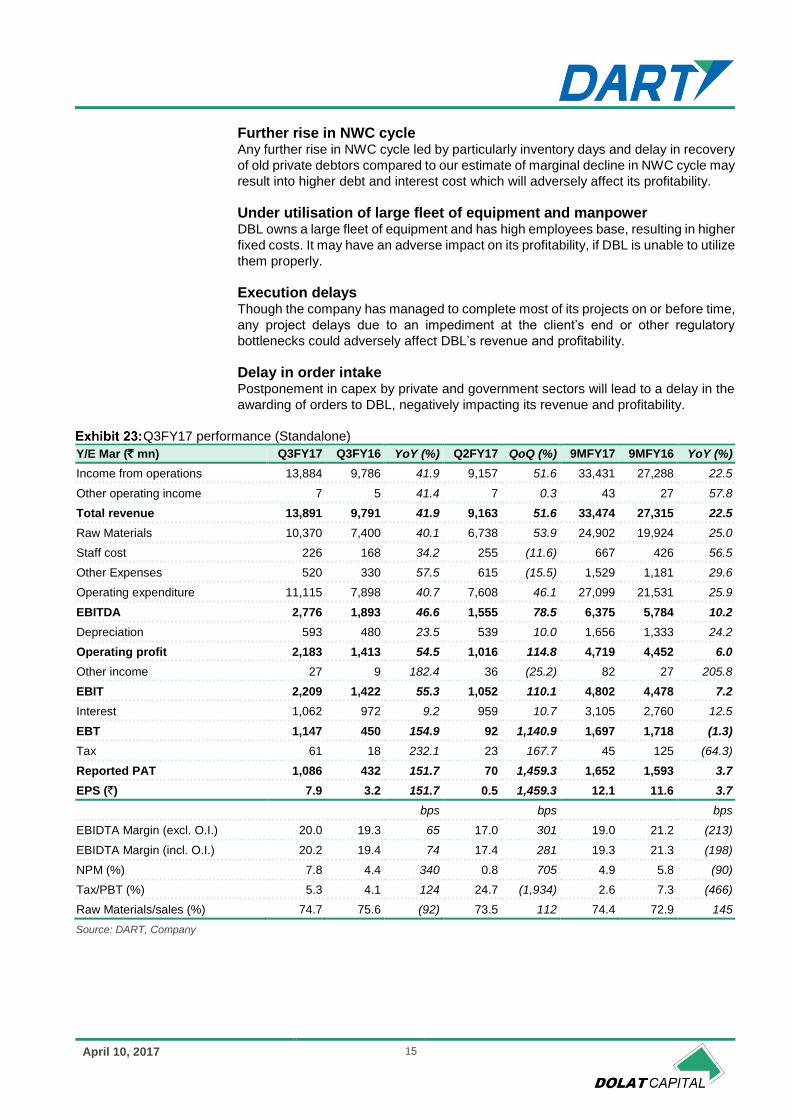
Further rise in NWC cycle Any further rise in NWC cycle led by particularly inventory days and delay in recovery
of old private debtors compared to our estimate of marginal decline in NWC cycle may
result into higher debt and interest cost which will adversely affect its profitability.
Under utilisation of large fleet of equipment and manpower DBL owns a large fleet of equipment and has high employees base, resulting in higher
fixed costs. It may have an adverse impact on its profitability, if DBL is unable to utilize
them properly.
Execution delays Though the company has managed to complete most of its projects on or before time,
any project delays due to an impediment at the client’s end or other regulatory
bottlenecks could adversely affect DBL’s revenue and profitability.
Delay in order intake Postponement in capex by private and government sectors will lead to a delay in the
awarding of orders to DBL, negatively impacting its revenue and profitability.
Q3FY17 performance (Standalone)
Y/E Mar (` mn) Q3FY17 Q3FY16 YoY (%) Q2FY17 QoQ (%) 9MFY17 9MFY16 YoY (%)
Income from operations 13,884 9,786 41.9 9,157 51.6 33,431 27,288 22.5
Other operating income 7 5 41.4 7 0.3 43 27 57.8
Total revenue 13,891 9,791 41.9 9,163 51.6 33,474 27,315 22.5
Raw Materials 10,370 7,400 40.1 6,738 53.9 24,902 19,924 25.0
Staff cost 226 168 34.2 255 (11.6) 667 426 56.5
Other Expenses 520 330 57.5 615 (15.5) 1,529 1,181 29.6
Operating expenditure 11,115 7,898 40.7 7,608 46.1 27,099 21,531 25.9
EBITDA 2,776 1,893 46.6 1,555 78.5 6,375 5,784 10.2
Depreciation 593 480 23.5 539 10.0 1,656 1,333 24.2
Operating profit 2,183 1,413 54.5 1,016 114.8 4,719 4,452 6.0
Other income 27 9 182.4 36 (25.2) 82 27 205.8
EBIT 2,209 1,422 55.3 1,052 110.1 4,802 4,478 7.2
Interest 1,062 972 9.2 959 10.7 3,105 2,760 12.5
EBT 1,147 450 154.9 92 1,140.9 1,697 1,718 (1.3)
Tax 61 18 232.1 23 167.7 45 125 (64.3)
Reported PAT 1,086 432 151.7 70 1,459.3 1,652 1,593 3.7
EPS (`) 7.9 3.2 151.7 0.5 1,459.3 12.1 11.6 3.7
bps bps bps
EBIDTA Margin (excl. O.I.) 20.0 19.3 65 17.0 301 19.0 21.2 (213)
EBIDTA Margin (incl. O.I.) 20.2 19.4 74 17.4 281 19.3 21.3 (198)
NPM (%) 7.8 4.4 340 0.8 705 4.9 5.8 (90)
Tax/PBT (%) 5.3 4.1 124 24.7 (1,934) 2.6 7.3 (466)
Raw Materials/sales (%) 74.7 75.6 (92) 73.5 112 74.4 72.9 145
Source: DART, Company
April 10, 2017 16
Annexure I: About the Company
DBL, started in 1988 and listed on 11 August 2016, has emerged as a leading
diversified private sector EPC player with a presence in various infrastructure
segments such as Roads and Highways, Irrigation, Urban development, and Mining.
The company’s core expertise lies in the areas of Roads and Highways. DBL has
excellent track record of completing 8,000 road lane kms (5,612 lane kms in last five
years) over 100+ projects spread across India. Currently, the company is working on
~54 projects across the Road (8,422 lane kms), Irrigation, Urban development and
Mining spread across 13 states in India.
DBL has emerged has one of the best project executors in India with successfully
completing 90% projects on/ before time and earning `3.3 bn as early completion
bonus during last five years. The company recently bagged MDO (Mine Developer
cum Operator) project worth `108.8bn in the state of Jharkhand. A modern
construction fleet of ~8,500 equipment with GPS tracking backed by a large trained
employee base of ~25,000 not only reduces DBL’s dependence on sub-contracting
but also drive timely execution with best margins among peers. DBL received a
significant boost with the highest fresh inflows of ~`115.4 bn during FY17 which
resulted spike in its order book to the historic highest level of ~`173.3 bn (FY17E). As
at Q3FY17, out of total order book of `127.7 bn Road accounted for 88% whereas
Mining, Irrigation and Urban Development contributed 8%, 2% and 2%, respectively.
At the same time 96% order book was from Govt clients. The company’s revenue/
EBITDA/ PAT grew at very robust CAGR of 50%/ 51%/ 35% during FY11-17E.
DBL has a portfolio of 24 BOT projects with total project cost of ~`106 bn, out of which
14 are operational projects (2 became operational in Mar’17 and 12 were operational
till FY16) and 10 are under development projects including recently bagged 6 HAM
(Hybrid Annuity) projects.
Annexure II: Management
Name Designation
Dilip Suryavanshi Chairman & Managing Director
Devendra Jain Whole-time Director & Chief Executive Officer
Mrs. Seema Suryavanshi Women & Whole-time Director
Aditya Vijay Singh Independent Director
Naval Jawharlal Totla Independent Director
Ashwini Verma Independent Director
Amogh Kumar Gupta Independent Director
Satish Chandra Pandey Independent Director
Vaibhav Rawat Chief Financial Officer
Vijay Chhibber Independent Director
Abhishek Shrivastava Company Secretary & Compliance Officer
Source: Company, DART
Dilip Suryavanshi is the Chairman and Managing Director, holds a Bachelor’s
Degree in Civil Engineering from the University of Jabalpur and has over 32 years of
experience in the construction business. He is currently the President of the Madhya
Pradesh Builders Association. As the Managing Director of DBL, he liaises with
various departments of the government and supervises process including tendering,
bidding, and planning the projects.
April 10, 2017 17
Seema Suryavanshi is an Executive Director, holds a Bachelor’s Degree in Arts
(honors) from Ranchi Women's College, Ranchi and has over 17 years of experience
in the construction business. She actively participates in finance, investment, and
various Company affairs as a coordinator between execution and administrative wing
of DBL.
Devendra Jain, an Executive Director and Chief Executive Officer, holds a Bachelor’s
Degree in Civil Engineering from Vikram University, Ujjain and has over 17 years of
experience in the construction business. He looks after project implementation along
with the quality of work and ensures timely completion of the projects undertaken by
our Company.
April 10, 2017 18
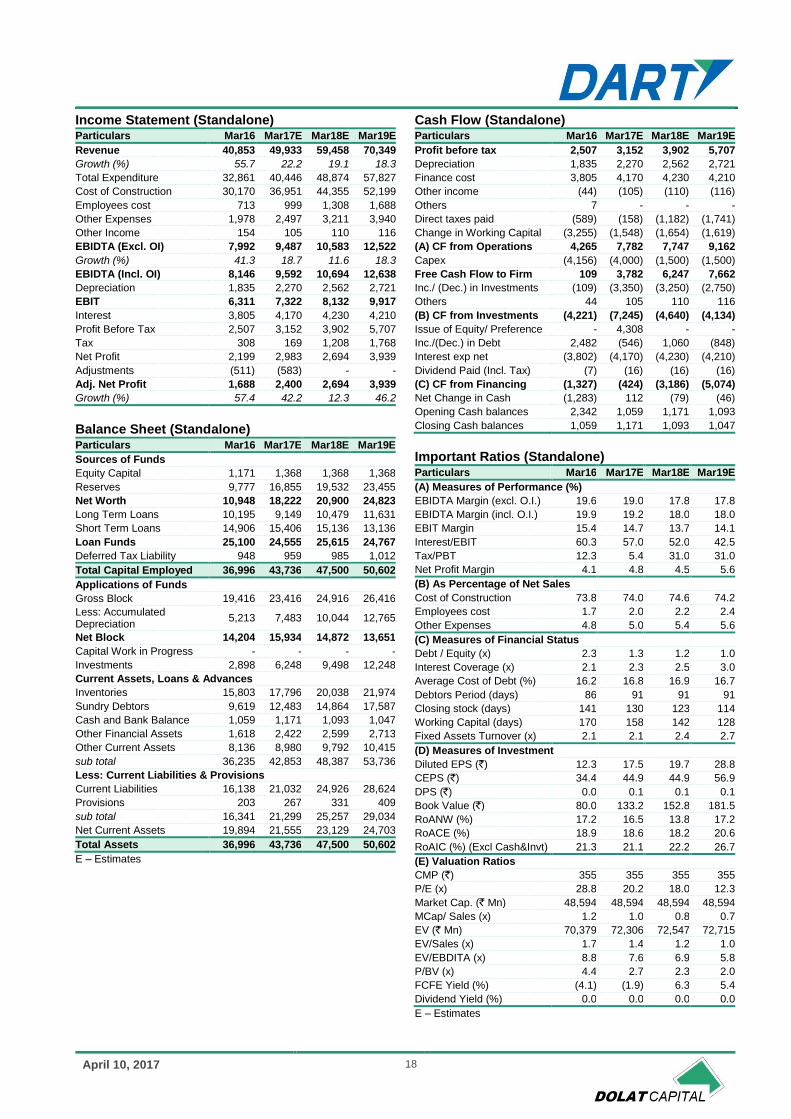
Income Statement (Standalone) Particulars Mar16 Mar17E Mar18E Mar19E
Revenue 40,853 49,933 59,458 70,349
Growth (%) 55.7 22.2 19.1 18.3
Total Expenditure 32,861 40,446 48,874 57,827
Cost of Construction 30,170 36,951 44,355 52,199
Employees cost 713 999 1,308 1,688
Other Expenses 1,978 2,497 3,211 3,940
Other Income 154 105 110 116
EBIDTA (Excl. OI) 7,992 9,487 10,583 12,522
Growth (%) 41.3 18.7 11.6 18.3
EBIDTA (Incl. OI) 8,146 9,592 10,694 12,638
Depreciation 1,835 2,270 2,562 2,721
EBIT 6,311 7,322 8,132 9,917
Interest 3,805 4,170 4,230 4,210
Profit Before Tax 2,507 3,152 3,902 5,707
Tax 308 169 1,208 1,768
Net Profit 2,199 2,983 2,694 3,939
Adjustments (511) (583) - -
Adj. Net Profit 1,688 2,400 2,694 3,939
Growth (%) 57.4 42.2 12.3 46.2
Balance Sheet (Standalone) Particulars Mar16 Mar17E Mar18E Mar19E
Sources of Funds
Equity Capital 1,171 1,368 1,368 1,368
Reserves 9,777 16,855 19,532 23,455
Net Worth 10,948 18,222 20,900 24,823
Long Term Loans 10,195 9,149 10,479 11,631
Short Term Loans 14,906 15,406 15,136 13,136
Loan Funds 25,100 24,555 25,615 24,767
Deferred Tax Liability 948 959 985 1,012
Total Capital Employed 36,996 43,736 47,500 50,602
Applications of Funds
Gross Block 19,416 23,416 24,916 26,416
Less: Accumulated Depreciation
5,213 7,483 10,044 12,765
Net Block 14,204 15,934 14,872 13,651
Capital Work in Progress - - - -
Investments 2,898 6,248 9,498 12,248
Current Assets, Loans & Advances
Inventories 15,803 17,796 20,038 21,974
Sundry Debtors 9,619 12,483 14,864 17,587
Cash and Bank Balance 1,059 1,171 1,093 1,047
Other Financial Assets 1,618 2,422 2,599 2,713
Other Current Assets 8,136 8,980 9,792 10,415
sub total 36,235 42,853 48,387 53,736
Less: Current Liabilities & Provisions
Current Liabilities 16,138 21,032 24,926 28,624
Provisions 203 267 331 409
sub total 16,341 21,299 25,257 29,034
Net Current Assets 19,894 21,555 23,129 24,703
Total Assets 36,996 43,736 47,500 50,602
E – Estimates
Cash Flow (Standalone) Particulars Mar16 Mar17E Mar18E Mar19E
Profit before tax 2,507 3,152 3,902 5,707
Depreciation 1,835 2,270 2,562 2,721
Finance cost 3,805 4,170 4,230 4,210
Other income (44) (105) (110) (116)
Others 7 - - -
Direct taxes paid (589) (158) (1,182) (1,741)
Change in Working Capital (3,255) (1,548) (1,654) (1,619)
(A) CF from Operations 4,265 7,782 7,747 9,162
Capex (4,156) (4,000) (1,500) (1,500)
Free Cash Flow to Firm 109 3,782 6,247 7,662
Inc./ (Dec.) in Investments (109) (3,350) (3,250) (2,750)
Others 44 105 110 116
(B) CF from Investments (4,221) (7,245) (4,640) (4,134)
Issue of Equity/ Preference - 4,308 - -
Inc./(Dec.) in Debt 2,482 (546) 1,060 (848)
Interest exp net (3,802) (4,170) (4,230) (4,210)
Dividend Paid (Incl. Tax) (7) (16) (16) (16)
(C) CF from Financing (1,327) (424) (3,186) (5,074)
Net Change in Cash (1,283) 112 (79) (46)
Opening Cash balances 2,342 1,059 1,171 1,093
Closing Cash balances 1,059 1,171 1,093 1,047
Important Ratios (Standalone) Particulars Mar16 Mar17E Mar18E Mar19E
(A) Measures of Performance (%)
EBIDTA Margin (excl. O.I.) 19.6 19.0 17.8 17.8
EBIDTA Margin (incl. O.I.) 19.9 19.2 18.0 18.0
EBIT Margin 15.4 14.7 13.7 14.1
Interest/EBIT 60.3 57.0 52.0 42.5
Tax/PBT 12.3 5.4 31.0 31.0
Net Profit Margin 4.1 4.8 4.5 5.6
(B) As Percentage of Net Sales
Cost of Construction 73.8 74.0 74.6 74.2
Employees cost 1.7 2.0 2.2 2.4
Other Expenses 4.8 5.0 5.4 5.6
(C) Measures of Financial Status
Debt / Equity (x) 2.3 1.3 1.2 1.0
Interest Coverage (x) 2.1 2.3 2.5 3.0
Average Cost of Debt (%) 16.2 16.8 16.9 16.7
Debtors Period (days) 86 91 91 91
Closing stock (days) 141 130 123 114
Working Capital (days) 170 158 142 128
Fixed Assets Turnover (x) 2.1 2.1 2.4 2.7
(D) Measures of Investment
Diluted EPS (`) 12.3 17.5 19.7 28.8
CEPS (`) 34.4 44.9 44.9 56.9
DPS (`) 0.0 0.1 0.1 0.1
Book Value (`) 80.0 133.2 152.8 181.5
RoANW (%) 17.2 16.5 13.8 17.2
RoACE (%) 18.9 18.6 18.2 20.6
RoAIC (%) (Excl Cash&Invt) 21.3 21.1 22.2 26.7
(E) Valuation Ratios
CMP (`) 355 355 355 355
P/E (x) 28.8 20.2 18.0 12.3
Market Cap. (` Mn) 48,594 48,594 48,594 48,594
MCap/ Sales (x) 1.2 1.0 0.8 0.7
EV (` Mn) 70,379 72,306 72,547 72,715
EV/Sales (x) 1.7 1.4 1.2 1.0
EV/EBDITA (x) 8.8 7.6 6.9 5.8
P/BV (x) 4.4 2.7 2.3 2.0
FCFE Yield (%) (4.1) (1.9) 6.3 5.4
Dividend Yield (%) 0.0 0.0 0.0 0.0
E – Estimates
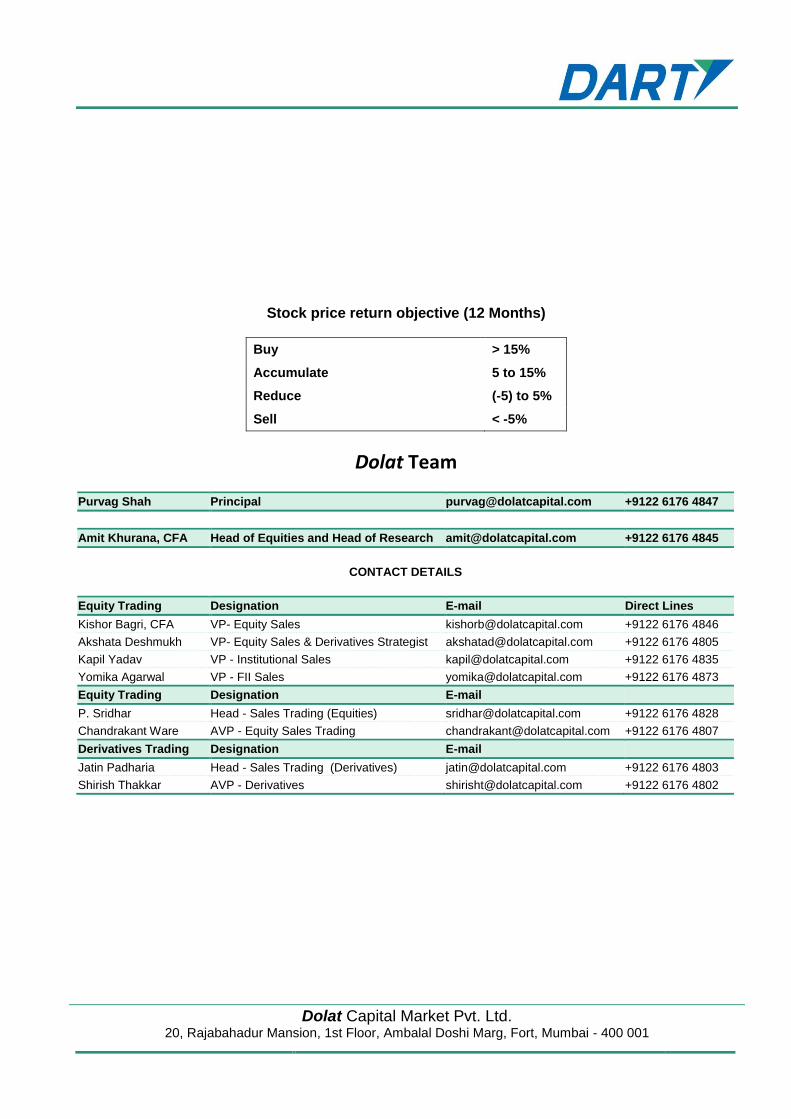
Stock price return objective (12 Months)
Buy > 15%
Accumulate 5 to 15%
Reduce (-5) to 5%
Sell < -5%
Dolat Team
Purvag Shah Principal [email protected] +9122 6176 4847
Amit Khurana, CFA Head of Equities and Head of Research [email protected] +9122 6176 4845
CONTACT DETAILS
Equity Trading Designation E-mail Direct Lines
Kishor Bagri, CFA VP- Equity Sales [email protected] +9122 6176 4846
Akshata Deshmukh VP- Equity Sales & Derivatives Strategist [email protected] +9122 6176 4805
Kapil Yadav VP - Institutional Sales [email protected] +9122 6176 4835
Yomika Agarwal VP - FII Sales [email protected] +9122 6176 4873
Equity Trading Designation E-mail
P. Sridhar Head - Sales Trading (Equities) [email protected] +9122 6176 4828
Chandrakant Ware AVP - Equity Sales Trading [email protected] +9122 6176 4807
Derivatives Trading Designation E-mail
Jatin Padharia Head - Sales Trading (Derivatives) [email protected] +9122 6176 4803
Shirish Thakkar AVP - Derivatives [email protected] +9122 6176 4802
Dolat Capital Market Pvt. Ltd. 20, Rajabahadur Mansion, 1st Floor, Ambalal Doshi Marg, Fort, Mumbai - 400 001
Our Research reports are also available on Reuters, Thomson Publishers, DowJones and Bloomberg (DCML <GO>)
Dolat Capital Market Pvt. Ltd.
Corporate Identity Number: U65990MH1993PTC075189 Member: BSE Limited and National Stock Exchange of India Limited.
SEBI Registration No: BSE - INB010710052 & INF010710052, NSE - INB230710031& INF230710031, Research: INH000000685 Registered office: “DOLAT” Plot 60B, East West Road No. 2, JVPD Scheme, Vile Parle (West), Mumbai-400 049.
Board: +9122 40969700 | Fax: +9122 22651278 | Email: [email protected] | www.dolatcapital.com
Analyst(s) Certification The research analyst(s), with respect to each issuer and its securities covered by them in this research report, certify that: All of the views expressed in this research report accurately reflect his or her or their personal views about all of the issuers and their securities; and No part of his or her or their compensation was, is, or will be directly or indirectly related to the specific recommendations or views expressed in this research report.
I. Analyst(s) and Associate (S) holding in the Stock(s): (Nil)
II. Disclaimer: This research report has been prepared by Dolat Capital Market Pvt. Limited to provide information about the company(ies) and sector(s), if any, covered in the report and may be distributed by it and/or its affiliated company(ies) solely for the purpose of information of the select recipient of this report. This report and/or any part thereof, may not be duplicated in any form and/or reproduced or redistributed without the prior written consent of Dolat Capital Market Pvt. Limited. This report has been prepared independent of the companies covered herein. Dolat Capital Market Pvt. Limited and its affiliated companies are part of a multi-service, integrated investment banking, brokerage and financing group. Dolat Capital Market Pvt. Limited and/or its affiliated company(ies) might have provided or may provide services in respect of managing offerings of securities, corporate finance, investment banking, mergers & acquisitions, financing or any other advisory services to the company(ies) covered herein. Dolat Capital Market Pvt. Limited and/or its affiliated company(ies) might have received or may receive compensation from the company(ies) mentioned in this report for rendering any of the above services. Research analysts and sales persons of Dolat Capital Market Pvt. Limited may provide important inputs to its affiliated company(ies) associated with it. While reasonable care has been taken in the preparation of this report, it does not purport to be a complete description of the securities, markets or developments referred to herein, and Dolat Capital Market Pvt. Limited does not warrant its accuracy or completeness. Dolat Capital Market Pvt. Limited may not be in any way responsible for any loss or damage that may arise to any person from any inadvertent error in the information contained in this report. This report is provided for information only and is not an investment advice and must not alone be taken as the basis for an investment decision. The investment discussed or views expressed herein may not be suitable for all investors. The user assumes the entire risk of any use made of this information. The information contained herein may be changed without notice and Dolat Capital Market Pvt. Limited reserves the right to make modifications and alterations to this statement as they may deem fit from time to time. Dolat Capital Market Pvt. Limited and its affiliated company(ies), their directors and employees may; (a) from time to time, have a long or short position in, and buy or sell the securities of the company(ies) mentioned herein or (b) be engaged in any other transaction involving such securities and earn brokerage or other compensation or act as a market maker in the financial instruments of the company(ies) discussed herein or act as an advisor or lender/borrower to such company(ies) or may have any other potential conflict of interests with respect to any recommendation and other related information and opinions. This report is neither an offer nor solicitation of an offer to buy and/or sell any securities mentioned herein and/or not an official confirmation of any transaction. This report is not directed or intended for distribution to, or use by any person or entity who is a citizen or resident of or located in any locality, state, country or other jurisdiction, where such distribution, publication, availability or use would be contrary to law, regulation or which would subject Dolat Capital Market Pvt. Limited and/or its affiliated company(ies) to any registration or licensing requirement within such jurisdiction. The securities described herein may or may not be eligible for sale in all jurisdictions or to a certain category of investors. Persons in whose possession this report may come, are required to inform themselves of and to observe such restrictions.
For U.S. Entity/ persons only: This research report is a product of Dolat Capital Market Pvt Ltd, which is the employer of the research analyst(s) who has prepared the research report. The research analyst(s) preparing the research report is/are resident outside the United States (U.S.) and are not associated persons of any U.S. regulated broker-dealer and therefore the analyst(s) is/are not subject to supervision by a U.S. broker-dealer, and is/are not required to satisfy the regulatory licensing requirements of FINRA or required to otherwise comply with U.S. rules or regulations regarding, among other things, communications with a subject company, public appearances and trading securities held by a research analyst account.
This report is intended for distribution by Dolat Capital Market Pvt Ltd only to "Major Institutional Investors" as defined by Rule 15a-6(b)(4) of the U.S. Securities and Exchange Act, 1934 (the Exchange Act) and interpretations thereof by U.S. Securities and Exchange Commission (SEC) in reliance on Rule 15a 6(a)(2). If the recipient of this report is not a Major Institutional Investor as specified above, then it should not act upon this report and return the same to the sender. Further, this report may not be copied, duplicated and/or transmitted onward to any U.S. person or entity.
In reliance on the exemption from registration provided by Rule 15a-6 of the Exchange Act and interpretations thereof by the SEC in order to conduct certain business with Major Institutional Investors, Dolat Capital Market Pvt Ltd has entered into an agreement with a U.S. registered broker-dealer Ltd Marco Polo Securities Inc. ("Marco Polo"). Transactions in securities discussed in this research report should be effected through Marco Polo or another U.S. registered broker dealer/Entity as informed by Dolat Capital Market Pvt Ltd from time to time.
Related Documents


![Untitled-1 [] logistics sevepl sri adhikari brothers — television network ltd windlass tm dilip buildcon ltd. pr ati bha committed to excel shree ram group of 9ndustries ' ...](https://static.cupdf.com/doc/110x72/5af62d8d7f8b9a190c8f5933/untitled-1-logistics-sevepl-sri-adhikari-brothers-television-network-ltd.jpg)


