University of California, San Diego UCSD-CER-06-07 Center for Energy Research University of California, San Diego 9500 Gilman Drive La Jolla, CA 92093-0420 DIII-D Edge Physics and Disruptions FY04-06 Progress Report J. A. Boedo, C. Holland, E. Hollmann, R. Moyer, D. Rudakov and G. R. Tynan June 2006

Welcome message from author
This document is posted to help you gain knowledge. Please leave a comment to let me know what you think about it! Share it to your friends and learn new things together.
Transcript
University of California, San Diego UCSD-CER-06-07
Center for Energy ResearchUniversity of California, San Diego9500 Gilman DriveLa Jolla, CA 92093-0420
DIII-D Edge Physics and DisruptionsFY04-06 Progress Report
J. A. Boedo, C. Holland, E. Hollmann, R. Moyer, D.Rudakov and G. R. Tynan
June 2006
DIII-D EDGE PHYSICS AND DISRUPTIONS
FY04-06 PROGRESS REPORT
J.A. BOEDO, C. HOLLAND, E. HOLLMANN, R. MOYER,
D. RUDAKOV, G.R. TYNAN
JACOBS SCHOOL OF ENGINEERING
UNIVERSITY OF CALIFORNIA, SAN DIEGO
9500 GILMAN DR.
LA JOLLA CALIFORNIA, 92093-0417
PRINCIPAL INVESTIGATORS
Dr. Richard A. Moyer (858) 455-2275 [email protected]
Dr. Jose A. Boedo (858) 455-2832 [email protected]
Prof. George R. Tynan (858) 534-9724 [email protected]
Mechanical and Aerospace Engineering Department
and
Center for Energy Research
Campus Mailcode 0417
JUNE 2006
Section 1 – Executive Summary
DIII-D Edge Physics and Disruptions 1– 2
DIII-D Edge Physics and Disruptions
1. Executive Summary
The UCSD Collaboration at DIII-D seeks to understand and control the coupling of the core plasma to the plasma-facing components through the edge and scrape-off layer plasma boundary under steady-state conditions, and during ELM and disruption transients. This research supports
the DIII-D Program Mission to “establish the scientific basis for the optimization of the tokamak
approach to fusion energy production” [Project: 2003], and impacts the following DIII-D Program elements:
• Stability Science: Physics of disruptions, disruption mitigation, ELMs, and associated MHD processes
• Transport Research: Basic turbulence and fluctuation-driven transport physics L-H transition physics and transport barrier formation
• Boundary Research Scrape-off layer scaling, flows, drifts, and transport Validation of boundary turbulence and transport modeling Physics of radiation-enhanced divertor plasmas Plasma-wall interactions (erosion/redeposition, diagnostic
mirror lifetimes, tritium retention, and dust)
• ITER Thrust IT-1: ELM control with edge resonant magnetic perturbations (RMPs) ELM control with pellet pacing (small edge pellets) Physics of ELM-free (e.g. QH-mode) and small ELM regimes
• ITER Thrust IT-2 ELM Control with edge RMPs in Hybrid discharges
• Science Thrust SC-1 Physics of H-mode pedestal height and width
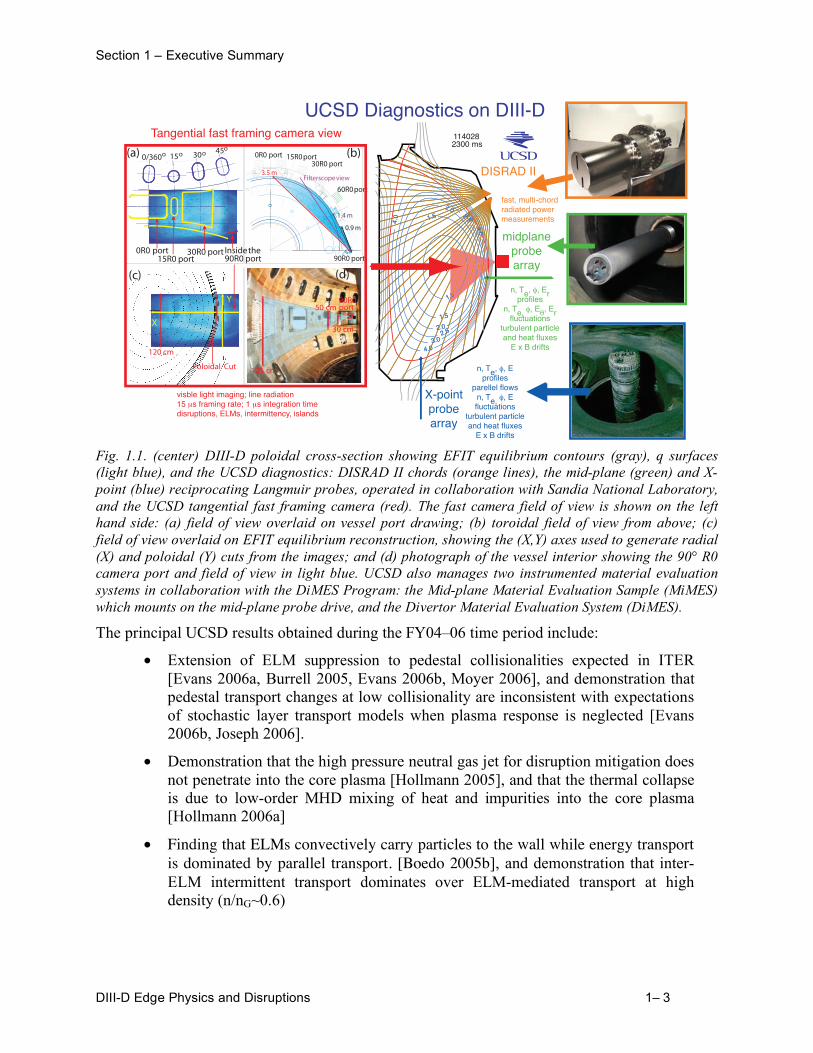
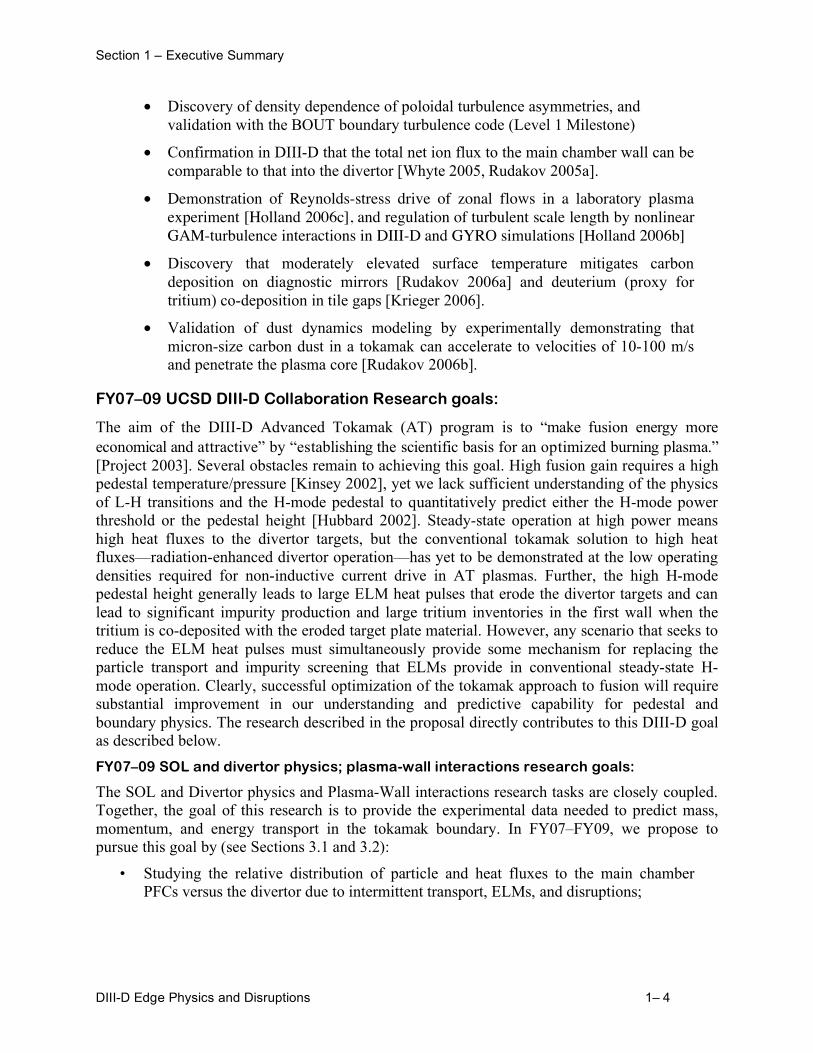
UCSD maintains unique capabilities for performing this research (Fig. 1.1), including high resolution measurements of plasma profiles, electric fields, flows, and turbulent transport at the outboard mid-plane and in the lower divertor using reciprocating Langmuir probe arrays; high speed, multi-chord fast radiated power measurements (DISRAD II); fast framing camera for imaging disruption mitigation gas jets, ELMs, and edge phenomena; operation of the Divertor Material Evaluation System (DiMES) and Mid-plane Material Evaluation Sample (MiMES) systems for studying plasma-wall interactions under a GA sub-contract; access to UCSD probe measurements from the NSTX spherical tokamak for multi-machine comparisons (e.g. aspect ratio scaling); and state-of-the-art boundary plasma modeling capabilities both within this project and in collaboration with GA, LLNL, and UCSD modeling groups (2D edge transport, turbulence, 3D magnetic topology, stochastic transport, and dust transport).
To address these research elements, the UCSD Collaboration at DIII-D is organized into five research areas: plasma-wall interactions; SOL and divertor physics, L-H transition and pedestal physics; ELMs and ELM control; and disruptions and disruption mitigation. This collaboration supports the work of 7 scientists, and provides support for 5 scientific and technical FTEs at DIII-D. In addition, this research leverages the efforts of another 3.5 scientific FTEs who are supported by other theory and confinement systems research grants at DIII-D and NSTX, and also benefits from collaboration with the UCSD PISCES Plasma-Materials Interaction and Edge Physics Program and the UCSD Fusion Theory Program.
Section 1 – Executive Summary
DIII-D Edge Physics and Disruptions 1– 3
1.0
1.5
1.5
2.0
2.0
2.5
2.5 3.0
3.0 4.0
4.0
4.0
1.0
1.5
1.5
2.0
2.0
2.5
2.5 3.0
3.0 4.0
4.0
4.0
1140282300 ms
Tangential fast framing camera view
UCSD Diagnostics on DIII-D
visble light imaging; line radiation15 μs framing rate; 1 μs integration timedisruptions, ELMs, intermittency, islands
DISRAD II
fast, multi-chordradiated powermeasurements
midplaneprobearray
n, Te, φ, Erprofiles
n, Te, φ, Eθ, Erfluctuations
turbulent particleand heat fluxes
E x B drifts
X-pointprobearray
n, Te, φ, Eprofiles
parellel flowsn, Te, φ, Efluctuations
turbulent particleand heat fluxes
E x B drifts
}
Insidethe90R0 port
30R0 port0R0 port90R0 port
1.4m
0.9m
3.5m30R0 port
15R0port0R0 port
15R0 port
(a) (b)0/360o 15o 30o 45o
60R0port
90R0port
(c) (d)
125 cm
50 cm
30 cm
120 cm
X
Y
Poloidal Cut
Filterscopeview
.0.0.0
Fig. 1.1. (center) DIII-D poloidal cross-section showing EFIT equilibrium contours (gray), q surfaces
(light blue), and the UCSD diagnostics: DISRAD II chords (orange lines), the mid-plane (green) and X-
point (blue) reciprocating Langmuir probes, operated in collaboration with Sandia National Laboratory,
and the UCSD tangential fast framing camera (red). The fast camera field of view is shown on the left
hand side: (a) field of view overlaid on vessel port drawing; (b) toroidal field of view from above; (c)
field of view overlaid on EFIT equilibrium reconstruction, showing the (X,Y) axes used to generate radial
(X) and poloidal (Y) cuts from the images; and (d) photograph of the vessel interior showing the 90° R0
camera port and field of view in light blue. UCSD also manages two instrumented material evaluation
systems in collaboration with the DiMES Program: the Mid-plane Material Evaluation Sample (MiMES)
which mounts on the mid-plane probe drive, and the Divertor Material Evaluation System (DiMES).
The principal UCSD results obtained during the FY04–06 time period include:
• Extension of ELM suppression to pedestal collisionalities expected in ITER [Evans 2006a, Burrell 2005, Evans 2006b, Moyer 2006], and demonstration that pedestal transport changes at low collisionality are inconsistent with expectations of stochastic layer transport models when plasma response is neglected [Evans 2006b, Joseph 2006].
• Demonstration that the high pressure neutral gas jet for disruption mitigation does not penetrate into the core plasma [Hollmann 2005], and that the thermal collapse is due to low-order MHD mixing of heat and impurities into the core plasma [Hollmann 2006a]
• Finding that ELMs convectively carry particles to the wall while energy transport is dominated by parallel transport. [Boedo 2005b], and demonstration that inter-
ELM intermittent transport dominates over ELM-mediated transport at high density (n/nG~0.6)
Section 1 – Executive Summary
DIII-D Edge Physics and Disruptions 1– 4
• Discovery of density dependence of poloidal turbulence asymmetries, and validation with the BOUT boundary turbulence code (Level 1 Milestone)
• Confirmation in DIII-D that the total net ion flux to the main chamber wall can be comparable to that into the divertor [Whyte 2005, Rudakov 2005a].
• Demonstration of Reynolds-stress drive of zonal flows in a laboratory plasma experiment [Holland 2006c], and regulation of turbulent scale length by nonlinear GAM-turbulence interactions in DIII-D and GYRO simulations [Holland 2006b]
• Discovery that moderately elevated surface temperature mitigates carbon deposition on diagnostic mirrors [Rudakov 2006a] and deuterium (proxy for tritium) co-deposition in tile gaps [Krieger 2006].
• Validation of dust dynamics modeling by experimentally demonstrating that micron-size carbon dust in a tokamak can accelerate to velocities of 10-100 m/s and penetrate the plasma core [Rudakov 2006b].
FY07–09 UCSD DIII-D Collaboration Research goals:
The aim of the DIII-D Advanced Tokamak (AT) program is to “make fusion energy more
economical and attractive” by “establishing the scientific basis for an optimized burning plasma.” [Project 2003]. Several obstacles remain to achieving this goal. High fusion gain requires a high pedestal temperature/pressure [Kinsey 2002], yet we lack sufficient understanding of the physics of L-H transitions and the H-mode pedestal to quantitatively predict either the H-mode power threshold or the pedestal height [Hubbard 2002]. Steady-state operation at high power means high heat fluxes to the divertor targets, but the conventional tokamak solution to high heat fluxes—radiation-enhanced divertor operation—has yet to be demonstrated at the low operating densities required for non-inductive current drive in AT plasmas. Further, the high H-mode pedestal height generally leads to large ELM heat pulses that erode the divertor targets and can lead to significant impurity production and large tritium inventories in the first wall when the tritium is co-deposited with the eroded target plate material. However, any scenario that seeks to reduce the ELM heat pulses must simultaneously provide some mechanism for replacing the particle transport and impurity screening that ELMs provide in conventional steady-state H-mode operation. Clearly, successful optimization of the tokamak approach to fusion will require substantial improvement in our understanding and predictive capability for pedestal and boundary physics. The research described in the proposal directly contributes to this DIII-D goal as described below.
FY07–09 SOL and divertor physics; plasma-wall interactions research goals:
The SOL and Divertor physics and Plasma-Wall interactions research tasks are closely coupled. Together, the goal of this research is to provide the experimental data needed to predict mass, momentum, and energy transport in the tokamak boundary. In FY07–FY09, we propose to pursue this goal by (see Sections 3.1 and 3.2):
• Studying the relative distribution of particle and heat fluxes to the main chamber PFCs versus the divertor due to intermittent transport, ELMs, and disruptions;
Section 1 – Executive Summary
DIII-D Edge Physics and Disruptions 1– 5
• Investigating the use of elevated surface temperatures to control co-deposition that limits diagnostic first mirror lifetime and increases deuterium (tritium proxy) inventory in tile gaps;
• Studying dust production and transport for validating dust transport models;
• Studying poloidal asymmetries in boundary fluctuations and their coupling to boundary flows;
• Separating the effects of collisionality and density on boundary turbulence, transport and ELM behavior by using a combination of auxiliary heating and active pumping; and
• Validating the coupled UEDGE/BOUT boundary turbulence and transport codes.
FY07–09 L-H transition and H-mode pedestal physics research goals:
The primary goal of this task is uncover the role zonal flows play in determining the saturation level of edge turbulence and associated transport, and identification of the trigger mechanism(s) of the L-H transition, and the mechanism governing the saturation of the edge pedestal. We will design and implement new probe detectors on the UCSD probe systems, and continue our collaboration with the UW-BES group to meet these goals. In FY07–FY09, we propose to address these urgent ITER needs by (see Section 3.3):
• Studying L-H transition dynamics by measuring the electrostatic and magnetic Reynolds stresses across the L-H transition using new probe hardware;
• Investigating the physics governing the height and width of the H-mode pedestal;
• Using analytic theory and the gyrokinetic code GYRO [Candy 2003] to quantify the scalings of zonal flow damping rates with edge parameters, and compare these rates against those used in edge fluid simulations;
• Developing virtual diagnostics, and then use with theory to compare simulation results against experimental measurements of zonal flows and their regulation of edge plasma turbulence; and
• Combining probe measurements with zonal flow velocity measurements from Beam Emission Spectroscopy to quantify the nonlinear drive of the “ambient” zonal flows distinct from the equilibrium shear flow.
FY07–09 ELM dynamics and control research goals:
The impulsive heat loads to the divertor targets from ELMs in ITER are predicted to severely limit the target plate lifetimes [Federici 2003]. Consequently, considerable focus has been placed on understanding how the ELM dynamics affect the impulsive loading. This research may provide an acceptable scheme for control of the ELM-induced heat loads in ITER, by guiding optimization of ELM control techniques (e.g. edge RMPs, pellet pacing), or providing access to ELM-free or small-ELM operating regimes (such as QH-mode) with acceptable core plasma performance. The recent success in using edge RMPs to eliminate ELMs at DIII-D motivates us to extend an existing collaboration with GA to develop analytic and numerical models describing the interactions between small-scale drift-wave turbulence and magnetic islands. This research will develop a self-consistent model of the effects of
Section 1 – Executive Summary
DIII-D Edge Physics and Disruptions 1– 6
spatially non-uniform turbulent transport on island evolution and saturation, which can then be used to better understand the effects of RMPs on the turbulence.
In FY07–FY09, we propose to address this urgent ITER need by (see Section 3.4):
• Studying ELM dynamics, and particle and heat pulse propagation in the boundary using the UCSD reciprocating probes, fast bolometry (DISRAD II), and fast tangential camera;
• Studying ELM stability and control using edge RMPs, pellet pacing, and quasi coherent modes;
• Studying how magnetostatic fields modify edge turbulence in DIII-D; and
• Developing models of the interactions between small-scale drift turbulence and magnetic islands in collaboration with GA.
FY07–09 Disruptions and disruption mitigation research goals:
The DIII-D Program seeks “to provide the scientific and technical basis for the detection and
avoidance of disruptions, and the mitigation of disruption caused damage, in burning plasma
experiments (BPX)” [Project 2003]. This work is essential because the uncontrolled loss of the plasma energy content which occurs during a disruption can damage or destroy internal plasma-
facing components in a burning plasma experiment such as ITER. “Therefore all efforts must be
made to avoid disruptions, and if these efforts fail, to mitigate the damage to the point where
plasma operations are not severely affected” [Project 2003]. The primary goal of this task is to evaluate the effectiveness of HPJ for disruption mitigation in ITER; secondary goals include the study of first wall heat loads during unmitigated disruptions and the preliminary evaluation of alternate disruption mitigation schemes. In FY07–FY09, we propose to support these DIII-D Program goals by (Section 3.5):
• Improving fast time response radiated power measurements (DISRAD II) for characterizing and understanding the physics of disruptions and disruption mitigation with high pressure gas jets (HPJs), ELMs, and other fast boundary transients;
• Collaborating with GA to improve the SXR diagnostic with switchable filtering to allow fast radiated power tomography to study impurity transport during disruptions;
• Using the new UCSD fast tangential camera to study HPJ propagation and penetration;
• Extending the pressure range of HPJ experiments in collaboration with ORNL, aimed at scaling HPJ to ITER and other next-step devices;
• Understanding the role of MHD-induced mixing in gas jet penetration;
• Developing predictive models for the power deposited on PFCs during disruptions;
• Developing diagnostics for in-situ characterization of runaway electrons; and
• Beginning evaluation of the potential effectiveness of alternative disruption mitigation concepts like non-conducting liquid jets or large cryogenic pellets.
Relationship of the proposed research to the DIII-D program and ITER:
Section 1 – Executive Summary
DIII-D Edge Physics and Disruptions 1– 7
The UCSD Collaboration at DIII-D directly impacts several critical ITER needs. UCSD has led pioneering research at DIII-D into the mitigation of disruption halo currents and thermal stresses, with high pressure noble gas jets [Whyte 2003]. UCSD and GA scientists have also pioneered the use of edge resonant magnetic perturbations to eliminate ELMs and the associated heat impulses to PFCs, a second area of critical interest to ITER. In FY07-09 these results will be extended to the ITER shape, rotation, and edge safety factor while developing the physics understanding needed to extrapolate these results to ITER. UCSD also conducts important ITER-relevant research on the distribution of power and particle fluxes to the main chamber wall and divertor due to intermittent edge transport, ELMs, and disruptions, and is investigating the fundamental physics governing the rate of edge plasma transport, L-H transition trigger physics, and edge pedestal saturation. Finally, several critical issues pertaining to plasma-wall interactions are being addressed by UCSD, including: erosion of main chamber PFCs due to
intermittent edge transport, ELMs, and disruptions; retention of tritium in tile gaps [Krieger 2006]; dust production and transport [Rudakov 2006b]; and the survivability of diagnostic mirrors placed near the plasma edge [Rudakov 2006a]. In February 2006, the DIII-D Physics Advisory Committee (DIII-D PAC) completed a review of the DIII-D research program’s near and long-term goals and strongly endorsed the UCSD research goals because of their high level of importance for ITER.
This Project Narrative for renewal of the UCSD Collaboration at DIII-D is organized as follows. Section 2 provides a Progress Report for the FY05–FY06 period, and is followed by the proposed work for FY07–FY09 in Section 3. The biographical sketches of the principal investigators are given in Section 4, and statements of current and pending support are found in Section 5. Section 6 provides a summary of the Facilities and Resources that are available to the project, while Section 7 provides the required Assurances and Certifications. Section 8 contains supporting letters from collaborating groups and individuals.
Section 2 – Progress Report
DIII-D Edge Physics and Disruptions 2- 1
DIII-D Edge Physics and Disruptions
2. Progress Report for FY05–FY06
The scientific goal of the UCSD DIII-D Collaboration is to understand the coupling of the core plasma to the plasma-facing components through the plasma boundary (edge and scrape-off layer), develop the means to control type-I ELMs, and mitigate disruptions. To achieve these goals, UCSD scientists study the transport of particles, momentum, energy, and radiation from the plasma core to the plasma-facing components under normal (e.g. L-mode, H-mode, and ELMs), and off-normal (e.g. disruptions) operating conditions. The results of this research for FY05–FY06 are summarized in this section, which is organized as shown in Table 2.1.
Section Research Area
2.1 Plasma-Wall Interactions
2.2 SOL and Divertor Physics
2.3 L-H Transition and Pedestal Physics
2.4 ELM Dynamics and Control
2.5 Disruptions and Disruption Mitigation
2.6 Diagnostic Development
Prior to this renewal cycle, Professor Tynan directed DIII-D research funded under a separate grant. As part of this renewal, UCSD is proposing that these two grants be combined into a single DIII-D grant for the period FY07–FY09. This change will provide better integration of the UCSD efforts at DIII-D.
2.1 Plasma-wall interactions
Plasma interaction with the main chamber Plasma Facing Components (PFCs) is of critical importance for next-step fusion devices such as ITER, and should be minimized in order to prevent damage to the first wall elements and core plasma contamination with impurities. Recent experiments on Alcator C-Mod, DIII-D, JET, AUG, and other devices, as well as modeling of the tokamak edge plasmas, have shown that under certain conditions plasma contact with the main chamber wall may be significant - even when the distance to the wall is large compared with the density decay length at the separatrix. Transient increases of particle and heat fluxes to the main chamber PFCs due to intermittent transport events, ELMs and disruptions are of particular concern.
2.1.1. Particle and heat fluxes to the PFCs
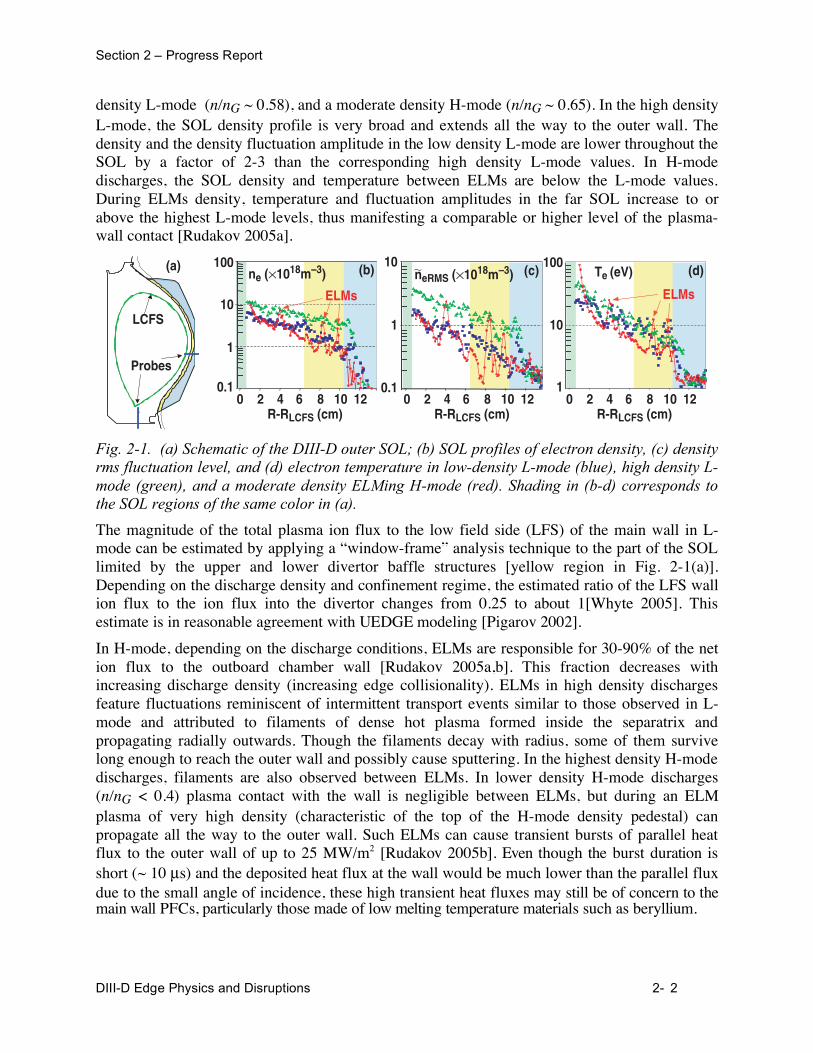
Far Scrape-Off Layer (SOL) and near-wall plasma parameters in DIII-D depend strongly on the discharge parameters and confinement regime [Rudakov 2005a,b]. In L-mode discharges cross-field transport increases with the average discharge density and flattens the far SOL profiles, thus increasing plasma contact with the low field side (LFS) main chamber wall. Fig. 2-1 shows SOL profiles [versus the distance from the last closed flux surface (LCFS)] of the density, density root-mean-square fluctuation level, and temperature obtained by the mid-plane reciprocating probe in three lower single null (LSN) discharges: a low-density L-mode (n/nG ~ 0.36), a high
Section 2 – Progress Report
DIII-D Edge Physics and Disruptions 2- 2
density L-mode (n/nG ~ 0.58), and a moderate density H-mode (n/nG ~ 0.65). In the high density L-mode, the SOL density profile is very broad and extends all the way to the outer wall. The density and the density fluctuation amplitude in the low density L-mode are lower throughout the SOL by a factor of 2-3 than the corresponding high density L-mode values. In H-mode discharges, the SOL density and temperature between ELMs are below the L-mode values. During ELMs density, temperature and fluctuation amplitudes in the far SOL increase to or above the highest L-mode levels, thus manifesting a comparable or higher level of the plasma-wall contact [Rudakov 2005a].
(c)~
LCFS
(a) 100ne (×1018m–3) neRMS (×1018m–3) Te (eV)(b) (d)
ELMs ELMs10
1
100
10
10.10 2 4 6
R-RLCFS (cm)8 10 12 0
0.1
1
10
2 4 6R-RLCFS (cm)
8 10 12 0 2 4 6R-RLCFS (cm)
8 10 12
Probes
Fig. 2-1. (a) Schematic of the DIII-D outer SOL; (b) SOL profiles of electron density, (c) density
rms fluctuation level, and (d) electron temperature in low-density L-mode (blue), high density L-
mode (green), and a moderate density ELMing H-mode (red). Shading in (b-d) corresponds to
the SOL regions of the same color in (a).
The magnitude of the total plasma ion flux to the low field side (LFS) of the main wall in L-mode can be estimated by applying a “window-frame” analysis technique to the part of the SOL limited by the upper and lower divertor baffle structures [yellow region in Fig. 2-1(a)]. Depending on the discharge density and confinement regime, the estimated ratio of the LFS wall ion flux to the ion flux into the divertor changes from 0.25 to about 1[Whyte 2005]. This estimate is in reasonable agreement with UEDGE modeling [Pigarov 2002].
In H-mode, depending on the discharge conditions, ELMs are responsible for 30-90% of the net ion flux to the outboard chamber wall [Rudakov 2005a,b]. This fraction decreases with increasing discharge density (increasing edge collisionality). ELMs in high density discharges feature fluctuations reminiscent of intermittent transport events similar to those observed in L-mode and attributed to filaments of dense hot plasma formed inside the separatrix and propagating radially outwards. Though the filaments decay with radius, some of them survive long enough to reach the outer wall and possibly cause sputtering. In the highest density H-mode discharges, filaments are also observed between ELMs. In lower density H-mode discharges (n/nG < 0.4) plasma contact with the wall is negligible between ELMs, but during an ELM plasma of very high density (characteristic of the top of the H-mode density pedestal) can propagate all the way to the outer wall. Such ELMs can cause transient bursts of parallel heat flux to the outer wall of up to 25 MW/m2 [Rudakov 2005b]. Even though the burst duration is short (~ 10 μs) and the deposited heat flux at the wall would be much lower than the parallel flux due to the small angle of incidence, these high transient heat fluxes may still be of concern to the main wall PFCs, particularly those made of low melting temperature materials such as beryllium.
Section 2 – Progress Report
DIII-D Edge Physics and Disruptions 2- 3
High levels of plasma interaction with the main wall PFCs during ELMs in low density H-mode discharges have been recently confirmed by the new UCSD fast-framing camera data installed on DIIID, which shows areas of intense local recycling due to ELM impact at the outer wall. The observed interaction has a complicated spatio-temporal pattern yet to be fully understood and which will be investigated in the FY07-09 period.
The mid-plane reciprocating probe was also operated in a stationary mode to monitor the near-wall plasma conditions during disruptions. Transient bursts of the plasma density up to 2 1018
m-3 and electron temperature in excess of 100 eV were observed well within the outer wall shadow [Hollmann 2005]. Further characterization of the particle and heat fluxes to the main chamber PFCs will continue in FY07-FY09.
2.1.2 Molecular deuterium fluxes into the DIII-D SOL
The first measurements of the molecular deuterium fueling fluxes into the DIII-D edge region were made using passive spectroscopy in FY06. These measurements confirmed that deuteron emission from the vessel walls is dominantly in the form of D2 (as opposed to D), consistent with expectations for cold graphite. D2 flux measurements in detached divertor operation indicated that molecular ion formation and recombination might form an important particle sink in strongly detached divertor legs.
2.1.3 Modeling the effect of wall reflections on filterscope signals
Filterscope signals are commonly used in a variety of tokamak experiments to interpret recycling during transient events such as ELMs. Visible light reflections off the chamber walls could cause significant misinterpretation of filterscope data. To evaluate this effect in DIII-D and C-MOD, detailed measurements of the reflection coefficients as a function of wavelength and angle where measured for DIII-D (graphite) and C-MOD (molybdenum) tiles. Ray-tracing programs were written to estimate the effect of the tile reflectivities on measured data. It was found that the effect of reflections is small in the divertor region, but can be significant for some view chords in the main chamber region due to near-specular reflections of the bright divertor legs into the filterscope view chord.
2.1.4 Leveraging DiMES plasma-material interactions research
The Far SOL and plasma interaction with PFCs task is conducted in close collaboration with the plasma-wall interactions research in the DiMES (Divertor Material Evaluation System) research program. The Far SOL task leader, D. Rudakov, is also the DiMES Experimental Coordinator at DIII-D. This arrangement leverages the funding from both projects in this ITER critical research area of the inteface between the SOL plasma and the first wall of the device. In FY05, a record number of DiMES sample exposures and experiments were conducted in DIII-D, including:
Tile Gap experiments: Tritium co-deposition with carbon leading to unacceptably high tritium inventory is widely recognized as one of the most critical problems for ITER. Gaps between PFCs present potentially the most troublesome region for tritium retention. UCSD scientists participated as a part of an international team in studies of carbon deposition and deuterium co-deposition (as a proxy for tritium) in a simulated tile gap under detached divertor conditions. A DiMES sample with a gap 2 mm wide and 15 mm deep was exposed to L-mode plasmas first at room temperature then at 200º C. At the elevated temperature deuterium co-deposition in the gap was reduced an order of magnitude [Kreiger 2006] and net carbon erosion at a rate of 3 nm/s was measured at the plasma-facing surface of the sample.
Section 2 – Progress Report
DIII-D Edge Physics and Disruptions 2- 4
Mirror DiMES experiments: Deterioration of plasma-facing diagnostic mirrors due to erosion, deposition and particle implantation is potentially a very serious problem for ITER. First tests of molybdenum mirrors in DIII-D divertor were performed under deposition-dominated conditions like those expected in the ITER divertor. Two sets of mirrors recessed 2 cm below the divertor floor in the private flux region were exposed to a series of identical lower single null ELMy H-mode discharges [Rudakov 2006a]. The first set of mirrors was maintained at room temperature during the exposure and exhibited carbon deposition at a maximum rate of 3 nm/sec. The second set was exposed at elevated temperature between 140ºC and 80oC. Carbon deposition on the heated mirrors was fully suppressed and the degradation of their optical reflectivity was minimized.
Dust DiMES experiments: Dust can be a serious safety and operational concern in the next generation of fusion devices including ITER. Migration of carbon dust in a tokamak environment was studied by introducing about 30 mg of micron-size dust flakes in the lower divertor of DIII-D using DiMES [Rudakov 2006b]. In two separate experiments dust was exposed to strikepoint sweeps of high power lower-single-null discharges in an ELMing H-mode regime. When the outer strike point passed over the dust holder, 1-2% of the total dust carbon content (equivalent to a few million of dust particles) penetrated the plasma core, raising the core carbon density by a factor of 2-3. Individual dust particles were observed moving at velocities of 10–100m/s, predominantly in the toroidal direction consistent with the ion drag force. The observed behavior of the dust is in qualitative agreement with modeling by the DustT code developed at UCSD [Pigarov 2005].
2.2 SOL and Divertor Physics
In FY05, UCSD completed a DIII-D Milestone on boundary turbulence which focused on several key aspects of transport in the SOL and divertor: 1) density and radial dependencies of the turbulence, 2) poloidal asymmetry of the turbulence, and 3) intermittent character of the turbulence. These results have been compiled into an experimental database for validating the BOUT fluid boundary turbulence code [Xu 2000].
2.2.1 Validation of the BOUT boundary turbulence code
There are four main predictions from BOUT simulations that have been checked experimentally (Fig 2.2):
• the outboard mid-plane fluctuations will increase with density,
• the rms levels of turbulence vary strongly with radius in the edge/SOL,
• the poloidal asymmetries will increase with density (the X-point and plasma crown levels will decrease relative to the mid-plane levels), and
• the turbulence has an intermittent character that increases with density.
With these predictions in mind, experiments were performed where the discharge density was varied from n/nG of 0.1 to 0.6 in L-mode. Since some discharges transitioned into H-mode, some data was also obtained for those plasmas.
Section 2 – Progress Report
DIII-D Edge Physics and Disruptions 2- 5
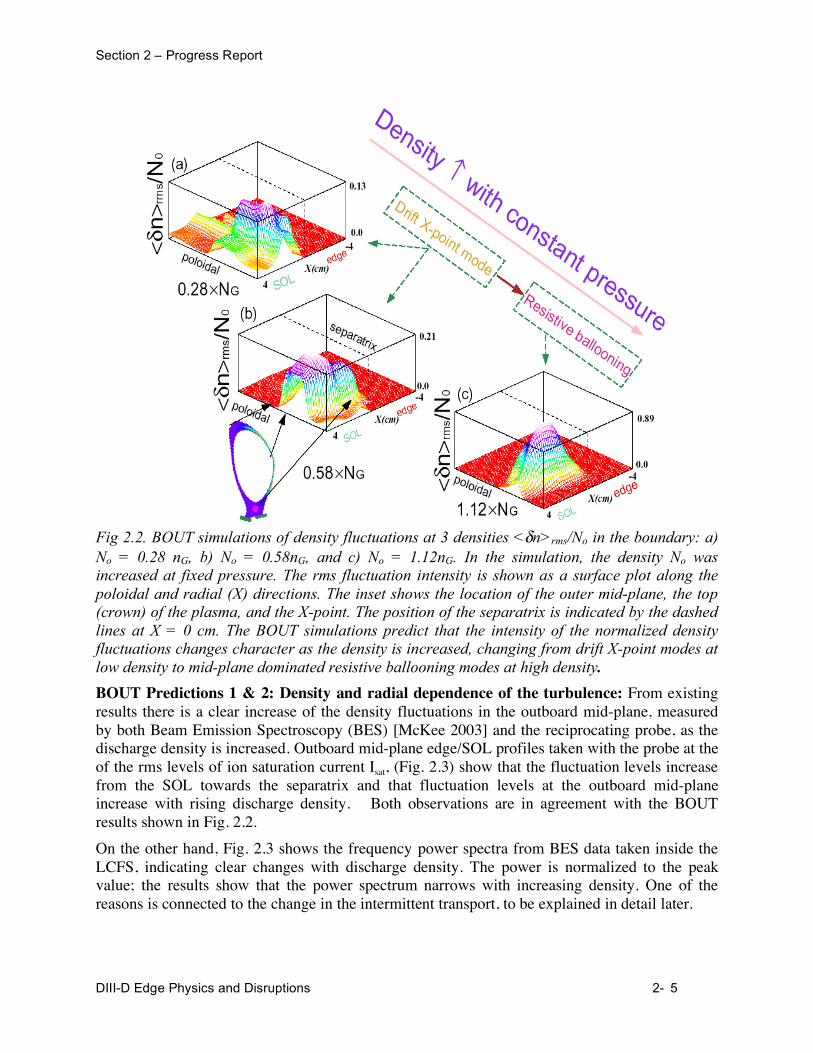
Fig 2.2. BOUT simulations of density fluctuations at 3 densities < n>rms/No in the boundary: a)
No = 0.28 nG, b) No = 0.58nG, and c) No = 1.12nG. In the simulation, the density No was
increased at fixed pressure. The rms fluctuation intensity is shown as a surface plot along the
poloidal and radial (X) directions. The inset shows the location of the outer mid-plane, the top
(crown) of the plasma, and the X-point. The position of the separatrix is indicated by the dashed
lines at X = 0 cm. The BOUT simulations predict that the intensity of the normalized density
fluctuations changes character as the density is increased, changing from drift X-point modes at
low density to mid-plane dominated resistive ballooning modes at high density.
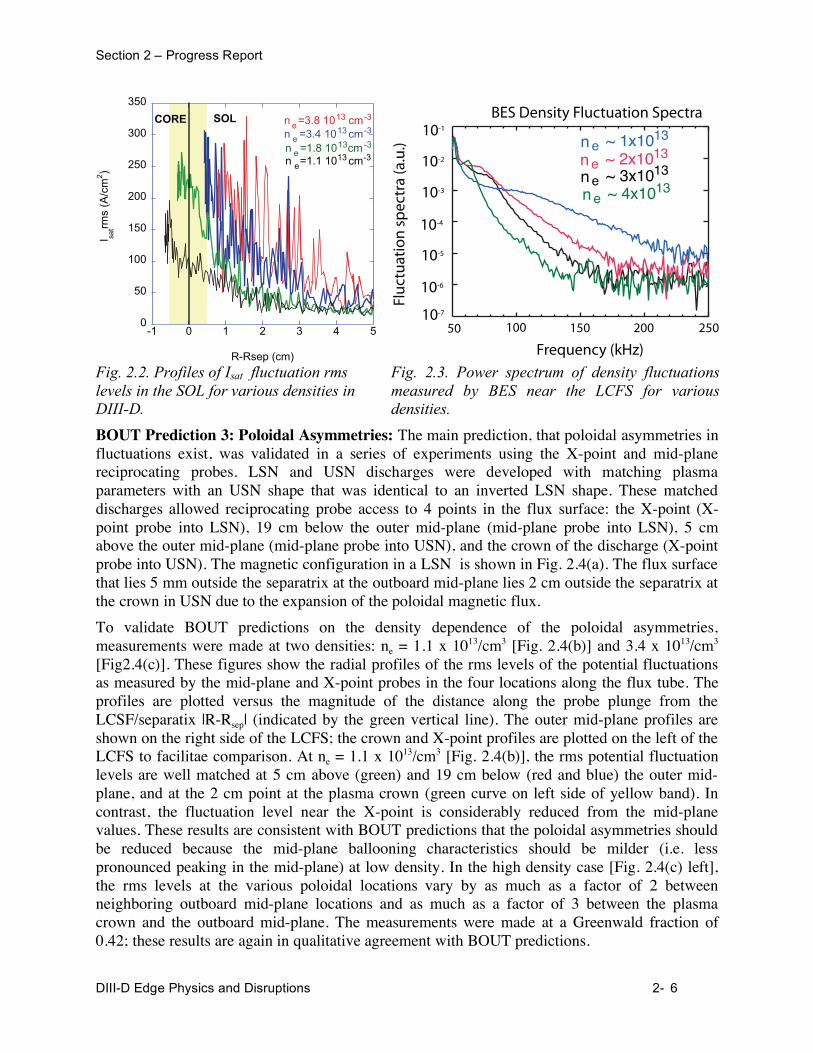
BOUT Predictions 1 & 2: Density and radial dependence of the turbulence: From existing results there is a clear increase of the density fluctuations in the outboard mid-plane, measured by both Beam Emission Spectroscopy (BES) [McKee 2003] and the reciprocating probe, as the discharge density is increased. Outboard mid-plane edge/SOL profiles taken with the probe at the of the rms levels of ion saturation current Isat, (Fig. 2.3) show that the fluctuation levels increase from the SOL towards the separatrix and that fluctuation levels at the outboard mid-plane increase with rising discharge density. Both observations are in agreement with the BOUT results shown in Fig. 2.2.
On the other hand, Fig. 2.3 shows the frequency power spectra from BES data taken inside the LCFS, indicating clear changes with discharge density. The power is normalized to the peak value; the results show that the power spectrum narrows with increasing density. One of the reasons is connected to the change in the intermittent transport, to be explained in detail later.
Section 2 – Progress Report
DIII-D Edge Physics and Disruptions 2- 6
0
50
100
150
200
250
300
350
-1 0 1 2 3 4 5
I satrm
s (A
/cm
2 )
R-Rsep (cm)
n e =3.8 1013 cm-3
n e =3.4 1013 cm-3
n e =1.8 1013 cm -3
n e=1.1 1013 cm-3
SOLCORE
n ~ 1x10¹³e
n ~ 2x10¹³e
n ~ 3x10¹³e
n ~ 4x10¹³e
Frequency (kHz)
50 100 150 200 250
BES Density Fluctuation Spectra
Flu
ctu
atio
n s
pec
tra
(a.u
.)
10-1
10-2
10-3
10-4
10-5
10-6
10-7
Fig. 2.2. Profiles of Isat fluctuation rms
levels in the SOL for various densities in
DIII-D.
Fig. 2.3. Power spectrum of density fluctuations
measured by BES near the LCFS for various
densities.
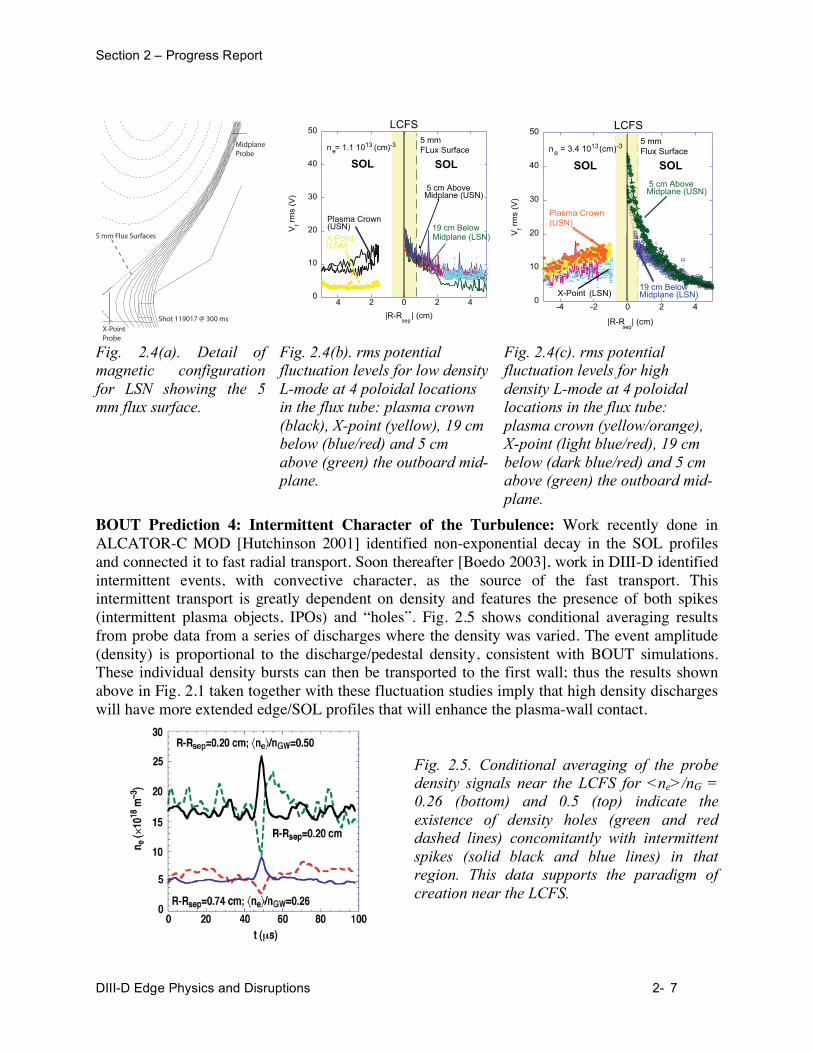
BOUT Prediction 3: Poloidal Asymmetries: The main prediction, that poloidal asymmetries in fluctuations exist, was validated in a series of experiments using the X-point and mid-plane reciprocating probes. LSN and USN discharges were developed with matching plasma parameters with an USN shape that was identical to an inverted LSN shape. These matched discharges allowed reciprocating probe access to 4 points in the flux surface: the X-point (X-point probe into LSN), 19 cm below the outer mid-plane (mid-plane probe into LSN), 5 cm above the outer mid-plane (mid-plane probe into USN), and the crown of the discharge (X-point probe into USN). The magnetic configuration in a LSN is shown in Fig. 2.4(a). The flux surface that lies 5 mm outside the separatrix at the outboard mid-plane lies 2 cm outside the separatrix at the crown in USN due to the expansion of the poloidal magnetic flux.
To validate BOUT predictions on the density dependence of the poloidal asymmetries, measurements were made at two densities: ne = 1.1 x 10¹³/cm3 [Fig. 2.4(b)] and 3.4 x 10¹³/cm3
[Fig2.4(c)]. These figures show the radial profiles of the rms levels of the potential fluctuations as measured by the mid-plane and X-point probes in the four locations along the flux tube. The profiles are plotted versus the magnitude of the distance along the probe plunge from the LCSF/separatix |R-Rsep| (indicated by the green vertical line). The outer mid-plane profiles are shown on the right side of the LCFS; the crown and X-point profiles are plotted on the left of the LCFS to facilitae comparison. At ne = 1.1 x 10¹³/cm3 [Fig. 2.4(b)], the rms potential fluctuation levels are well matched at 5 cm above (green) and 19 cm below (red and blue) the outer mid-plane, and at the 2 cm point at the plasma crown (green curve on left side of yellow band). In contrast, the fluctuation level near the X-point is considerably reduced from the mid-plane values. These results are consistent with BOUT predictions that the poloidal asymmetries should be reduced because the mid-plane ballooning characteristics should be milder (i.e. less pronounced peaking in the mid-plane) at low density. In the high density case [Fig. 2.4(c) left], the rms levels at the various poloidal locations vary by as much as a factor of 2 between neighboring outboard mid-plane locations and as much as a factor of 3 between the plasma crown and the outboard mid-plane. The measurements were made at a Greenwald fraction of 0.42; these results are again in qualitative agreement with BOUT predictions.
Section 2 – Progress Report
DIII-D Edge Physics and Disruptions 2- 7
Shot 119017 @ 300 ms
5 mm Flux Surfaces
X-PointProbe
MidplaneProbe
0
10
20
30
40
50
4 2 0 2 4V
f rm
s (V
)
|R-Rsep
| (cm)
SOL SOL
5 cm AboveMidplane (USN)
19 cm BelowMidplane (LSN)
Plasma Crown(USN)
X-Point(LSN)
ne= 1.1 1013 (cm -3)5 mmFLux Surface
LCFS
0
10
20
30
40
50
-4 -2 0 2 4
Vf r
ms
(V)
|R-Rsep
| (cm)
Plasma Crown(USN)
X-Point (LSN)19 cm BelowMidplane (LSN)
5 cm AboveMidplane (USN)
ne = 3.4 1013 (cm -3)5 mmFlux Surface
LCFS
SOL SOL
Fig. 2.4(a). Detail of
magnetic configuration
for LSN showing the 5
mm flux surface.
Fig. 2.4(b). rms potential
fluctuation levels for low density
L-mode at 4 poloidal locations
in the flux tube: plasma crown
(black), X-point (yellow), 19 cm
below (blue/red) and 5 cm
above (green) the outboard mid-
plane.
Fig. 2.4(c). rms potential
fluctuation levels for high
density L-mode at 4 poloidal
locations in the flux tube:
plasma crown (yellow/orange),
X-point (light blue/red), 19 cm
below (dark blue/red) and 5 cm
above (green) the outboard mid-
plane.
BOUT Prediction 4: Intermittent Character of the Turbulence: Work recently done in ALCATOR-C MOD [Hutchinson 2001] identified non-exponential decay in the SOL profiles and connected it to fast radial transport. Soon thereafter [Boedo 2003], work in DIII-D identified intermittent events, with convective character, as the source of the fast transport. This intermittent transport is greatly dependent on density and features the presence of both spikes (intermittent plasma objects, IPOs) and “holes”. Fig. 2.5 shows conditional averaging results from probe data from a series of discharges where the density was varied. The event amplitude (density) is proportional to the discharge/pedestal density, consistent with BOUT simulations. These individual density bursts can then be transported to the first wall; thus the results shown above in Fig. 2.1 taken together with these fluctuation studies imply that high density discharges will have more extended edge/SOL profiles that will enhance the plasma-wall contact.
Fig. 2.5. Conditional averaging of the probe
density signals near the LCFS for <ne>/nG =
0.26 (bottom) and 0.5 (top) indicate the
existence of density holes (green and red
dashed lines) concomitantly with intermittent
spikes (solid black and blue lines) in that
region. This data supports the paradigm of
creation near the LCFS.
Section 2 – Progress Report
DIII-D Edge Physics and Disruptions 2- 8
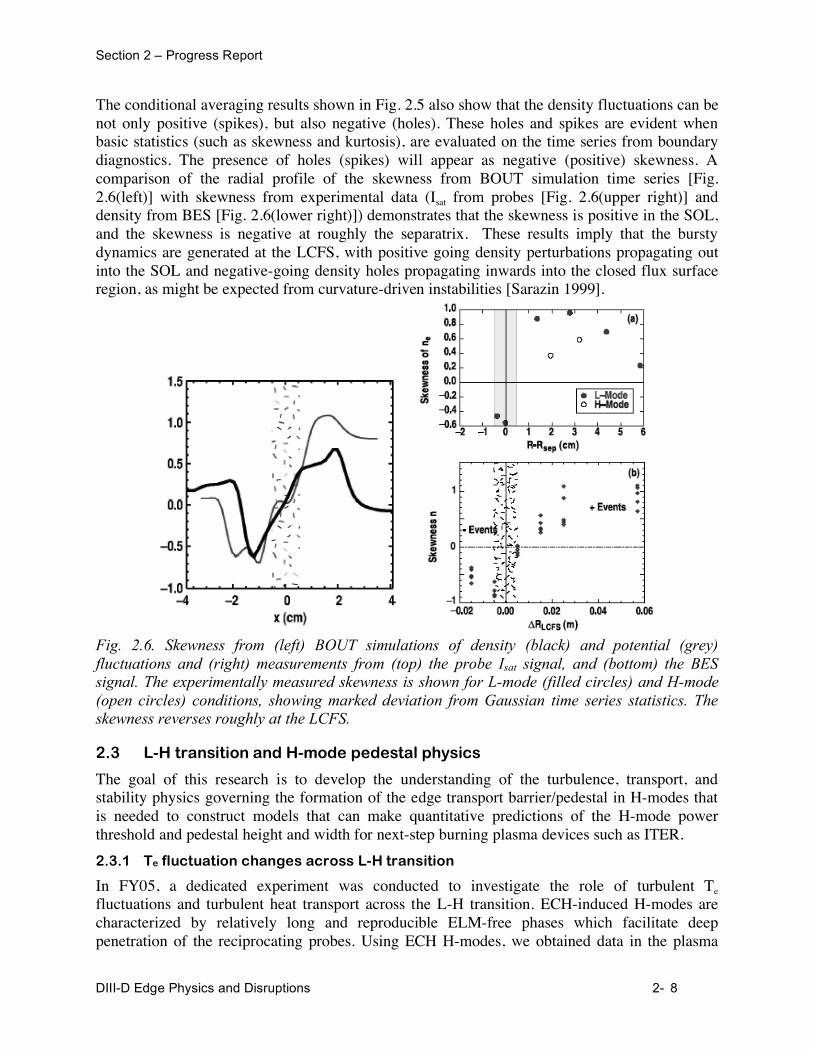
The conditional averaging results shown in Fig. 2.5 also show that the density fluctuations can be not only positive (spikes), but also negative (holes). These holes and spikes are evident when basic statistics (such as skewness and kurtosis), are evaluated on the time series from boundary diagnostics. The presence of holes (spikes) will appear as negative (positive) skewness. A comparison of the radial profile of the skewness from BOUT simulation time series [Fig. 2.6(left)] with skewness from experimental data (Isat from probes [Fig. 2.6(upper right)] and density from BES [Fig. 2.6(lower right)]) demonstrates that the skewness is positive in the SOL, and the skewness is negative at roughly the separatrix. These results imply that the bursty dynamics are generated at the LCFS, with positive going density perturbations propagating out into the SOL and negative-going density holes propagating inwards into the closed flux surface region, as might be expected from curvature-driven instabilities [Sarazin 1999].
Fig. 2.6. Skewness from (left) BOUT simulations of density (black) and potential (grey)
fluctuations and (right) measurements from (top) the probe Isat signal, and (bottom) the BES
signal. The experimentally measured skewness is shown for L-mode (filled circles) and H-mode
(open circles) conditions, showing marked deviation from Gaussian time series statistics. The
skewness reverses roughly at the LCFS.
2.3 L-H transition and H-mode pedestal physics
The goal of this research is to develop the understanding of the turbulence, transport, and stability physics governing the formation of the edge transport barrier/pedestal in H-modes that is needed to construct models that can make quantitative predictions of the H-mode power threshold and pedestal height and width for next-step burning plasma devices such as ITER.
2.3.1 Te fluctuation changes across L-H transition
In FY05, a dedicated experiment was conducted to investigate the role of turbulent Te fluctuations and turbulent heat transport across the L-H transition. ECH-induced H-modes are characterized by relatively long and reproducible ELM-free phases which facilitate deep penetration of the reciprocating probes. Using ECH H-modes, we obtained data in the plasma
Section 2 – Progress Report
DIII-D Edge Physics and Disruptions 2- 9
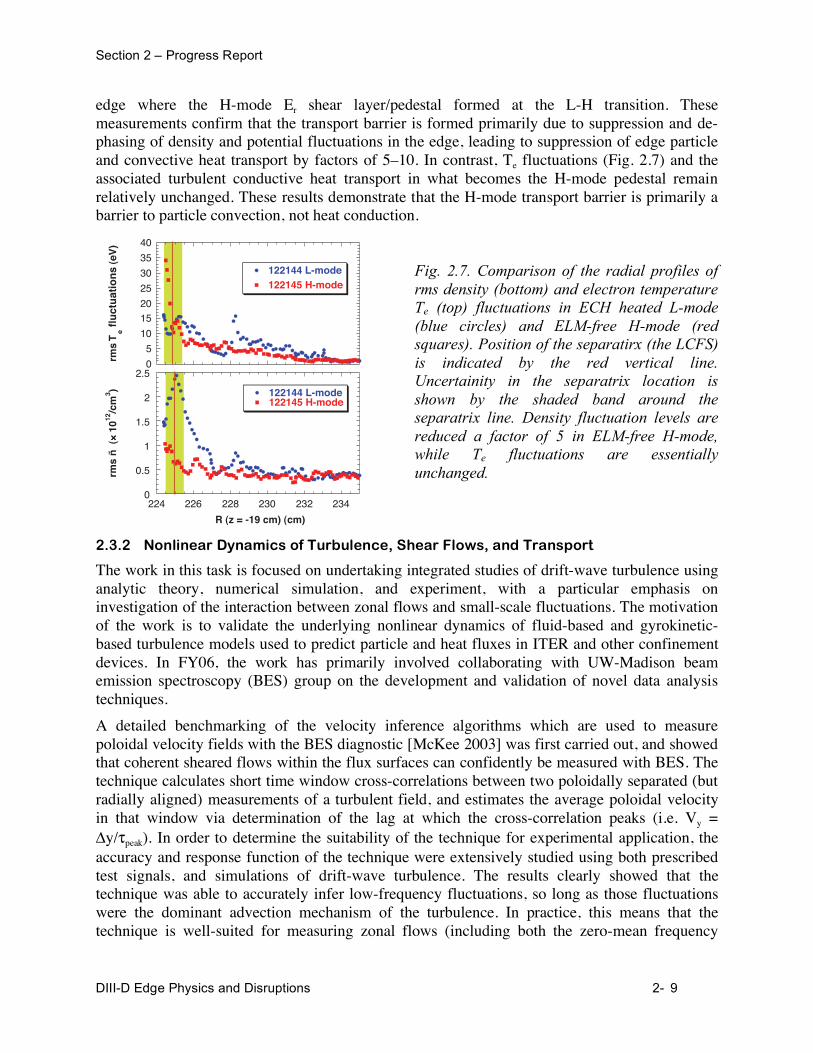
edge where the H-mode Er shear layer/pedestal formed at the L-H transition. These measurements confirm that the transport barrier is formed primarily due to suppression and de-phasing of density and potential fluctuations in the edge, leading to suppression of edge particle and convective heat transport by factors of 5–10. In contrast, Te fluctuations (Fig. 2.7) and the associated turbulent conductive heat transport in what becomes the H-mode pedestal remain relatively unchanged. These results demonstrate that the H-mode transport barrier is primarily a barrier to particle convection, not heat conduction.
0
5
10
1520
25
30
35
40
122144 L-mode122145 H-mode
rms
Te f
luct
uat
ion
s (e
V)
0
0.5
1
1.5
2
2.5
224 226 228 230 232 234
122144 L-mode122145 H-mode
rms
ñ (××××
1012
/cm
3 )
R (z = -19 cm) (cm)
Fig. 2.7. Comparison of the radial profiles of
rms density (bottom) and electron temperature
Te (top) fluctuations in ECH heated L-mode
(blue circles) and ELM-free H-mode (red
squares). Position of the separatirx (the LCFS)
is indicated by the red vertical line.
Uncertainity in the separatrix location is
shown by the shaded band around the
separatrix line. Density fluctuation levels are
reduced a factor of 5 in ELM-free H-mode,
while Te fluctuations are essentially
unchanged.
2.3.2 Nonlinear Dynamics of Turbulence, Shear Flows, and Transport
The work in this task is focused on undertaking integrated studies of drift-wave turbulence using analytic theory, numerical simulation, and experiment, with a particular emphasis on investigation of the interaction between zonal flows and small-scale fluctuations. The motivation of the work is to validate the underlying nonlinear dynamics of fluid-based and gyrokinetic-based turbulence models used to predict particle and heat fluxes in ITER and other confinement devices. In FY06, the work has primarily involved collaborating with UW-Madison beam emission spectroscopy (BES) group on the development and validation of novel data analysis techniques.
A detailed benchmarking of the velocity inference algorithms which are used to measure poloidal velocity fields with the BES diagnostic [McKee 2003] was first carried out, and showed that coherent sheared flows within the flux surfaces can confidently be measured with BES. The technique calculates short time window cross-correlations between two poloidally separated (but radially aligned) measurements of a turbulent field, and estimates the average poloidal velocity in that window via determination of the lag at which the cross-correlation peaks (i.e. Vy =
y/ peak). In order to determine the suitability of the technique for experimental application, the accuracy and response function of the technique were extensively studied using both prescribed test signals, and simulations of drift-wave turbulence. The results clearly showed that the technique was able to accurately infer low-frequency fluctuations, so long as those fluctuations were the dominant advection mechanism of the turbulence. In practice, this means that the technique is well-suited for measuring zonal flows (including both the zero-mean frequency
Section 2 – Progress Report
DIII-D Edge Physics and Disruptions 2- 10
component as well as the low but finite frequency geodesic acoustic modes (GAMs) [Hinton 1999]). The results allow for the technique to be applied with confidence in zonal flow measurements in DIII-D.
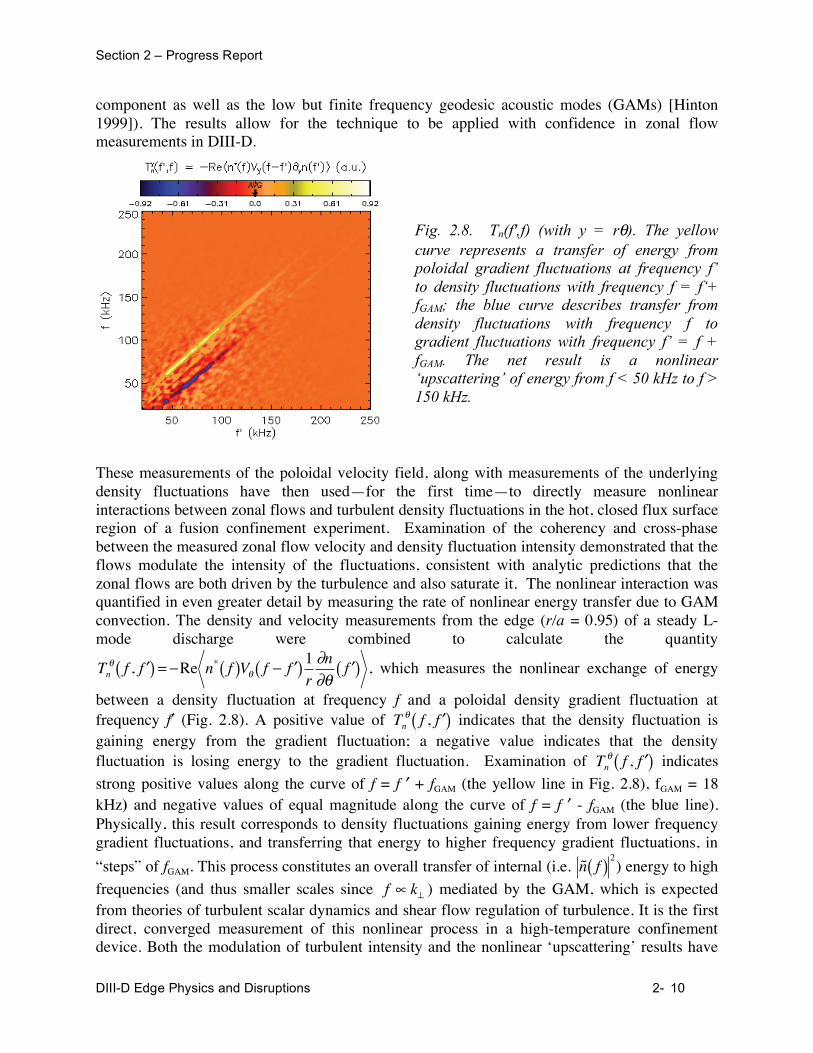
Fig. 2.8. Tn(f',f) (with y = r ). The yellow
curve represents a transfer of energy from
poloidal gradient fluctuations at frequency f’
to density fluctuations with frequency f = f‘+
fGAM; the blue curve describes transfer from
density fluctuations with frequency f to
gradient fluctuations with frequency f’ = f +
fGAM. The net result is a nonlinear
‘upscattering’ of energy from f < 50 kHz to f >
150 kHz.
These measurements of the poloidal velocity field, along with measurements of the underlying density fluctuations have then used—for the first time—to directly measure nonlinear interactions between zonal flows and turbulent density fluctuations in the hot, closed flux surface region of a fusion confinement experiment. Examination of the coherency and cross-phase between the measured zonal flow velocity and density fluctuation intensity demonstrated that the flows modulate the intensity of the fluctuations, consistent with analytic predictions that the zonal flows are both driven by the turbulence and also saturate it. The nonlinear interaction was quantified in even greater detail by measuring the rate of nonlinear energy transfer due to GAM convection. The density and velocity measurements from the edge (r/a = 0.95) of a steady L-mode discharge were combined to calculate the quantity
Tn f , f ( ) = Re n* f( )V f f ( )1
r
n f ( ) , which measures the nonlinear exchange of energy
between a density fluctuation at frequency f and a poloidal density gradient fluctuation at frequency f (Fig. 2.8). A positive value of Tn f , f ( ) indicates that the density fluctuation is gaining energy from the gradient fluctuation; a negative value indicates that the density fluctuation is losing energy to the gradient fluctuation. Examination of Tn f , f ( ) indicates
strong positive values along the curve of f = f + fGAM (the yellow line in Fig. 2.8), fGAM = 18 kHz) and negative values of equal magnitude along the curve of f = f - fGAM (the blue line). Physically, this result corresponds to density fluctuations gaining energy from lower frequency gradient fluctuations, and transferring that energy to higher frequency gradient fluctuations, in
“steps” of fGAM. This process constitutes an overall transfer of internal (i.e. ˜ n f( )2) energy to high
frequencies (and thus smaller scales since f k ) mediated by the GAM, which is expected from theories of turbulent scalar dynamics and shear flow regulation of turbulence. It is the first direct, converged measurement of this nonlinear process in a high-temperature confinement device. Both the modulation of turbulent intensity and the nonlinear ‘upscattering’ results have
Section 2 – Progress Report
DIII-D Edge Physics and Disruptions 2- 11
been qualitatively reproduced in a GYRO simulation of core plasma parameters (where the long-time stability of the code allows for converged estimates of the nonlinear energy transfer in frequency space). These results represent an unprecedented level of comparison between simulation and measurement of drift-wave turbulence in a high-performance tokamak, and both provide essential experimental support for the model. The results also highlight the need for more detailed theory and simulation of edge plasmas, in order to facilitate more direct code-experiment comparisons, since existing gyrokinetic models neglect crucial edge-related effects. Simulations of edge plasmas are currently underway using the GYRO simulation, and will be studied extensively in the upcoming year.
We have also worked with the BES group to investigate in dynamics of fluctuations across the L-H transition. Initial results have shown that the normalized RMS fluctuation level I/I (where I is the fluctuating D intensity measured by the BES, which is generally proportional to density) is rapidly suppressed at the transition, followed by a period of slow growth; however, the fluctuations were not observed to return to L-mode levels by the time ELMs began. The turbulence was also found to be significantly anisotropic across the pedestal in both L and H-modes. These issues are being studied in detail as a part of the dissertation research of a UW graduate student.
In addition to these turbulence studies at DIII-D, a complimentary study on the generation of zonal flows by plasma turbulence was conducted using the CSDX (Controlled Shear Decorrelation Experiment) device at UCSD. In this work, a direct measurement of the turbulent force balance has generated the first complete experimental evidence for a linearly stable shear flow driven by the turbulent Reynolds stress in a magnetized plasma. This result provides necessary experimental support for the analytic prediction of turbulent shear flow generation (as opposed to the DIII-D work above, which addresses the effects of the zonal flows upon the turbulence), and has been presented at multiple conferences, and published in Physical Review Letters [Holland 2006c] and a special issue of Plasma Physics and Controlled Fusion on experimental studies of drift-wave zonal flow interactions [Tynan 2006].
2.3.3 Effects of RMPs on turbulence and the H-mode power threshold
The long, reproducible ELM-free phases of ECH H-modes provided an ideal plasma for investigating the effects of RMPs on the edge Er, turbulence, and fluctuation-driven transport. During the ELM-free phase, the core plasma density rises continuously until the ECH is cutoff and a back transition to L-mode occurs. Edge resonant, n=3 RMPs from the I-coil were applied during the ELM-free phase in an effort to limit the density rise and extend the duration of the ELM-free phase. Density fluctuations in the plasma edge, measured by phase contrast imaging, showed a significant broadening in the fluctuation power spectrum (consistent with a change in the Er-induced Doppler shift) and an increase in the overall fluctuation level at the turn-on of the I-coil pulse. This strong effect on density fluctuations is consistent with observations in ELM control experiments at low collisionality which also show a broadening of the density fluctuation profile and an increase in the overall fluctuation level during the n = 3 I-coil pulse.
The impact of n = 3 edge resonant RMPs from the I-coil on the H-mode power threshold was also studied in a series of LSN discharges. By increasing the neutral beam modulation in small steps, the H-mode power threshold was measured to be between 0.25 and 0.5 of a single source (0.6–1.2 MW). Adding an n = 3 RMP from the I-coil in the L-mode inhibited the L-H transition, even when the neutral beam power was increased to 4 full sources (10 MW). These data are
Section 2 – Progress Report
DIII-D Edge Physics and Disruptions 2- 12
being used to study the coupling among the pedestal profiles, rotation and radial electric field Er, turbulence and transport.
2.4 ELM dynamics and control
2.4.1 ELM dynamics and transport
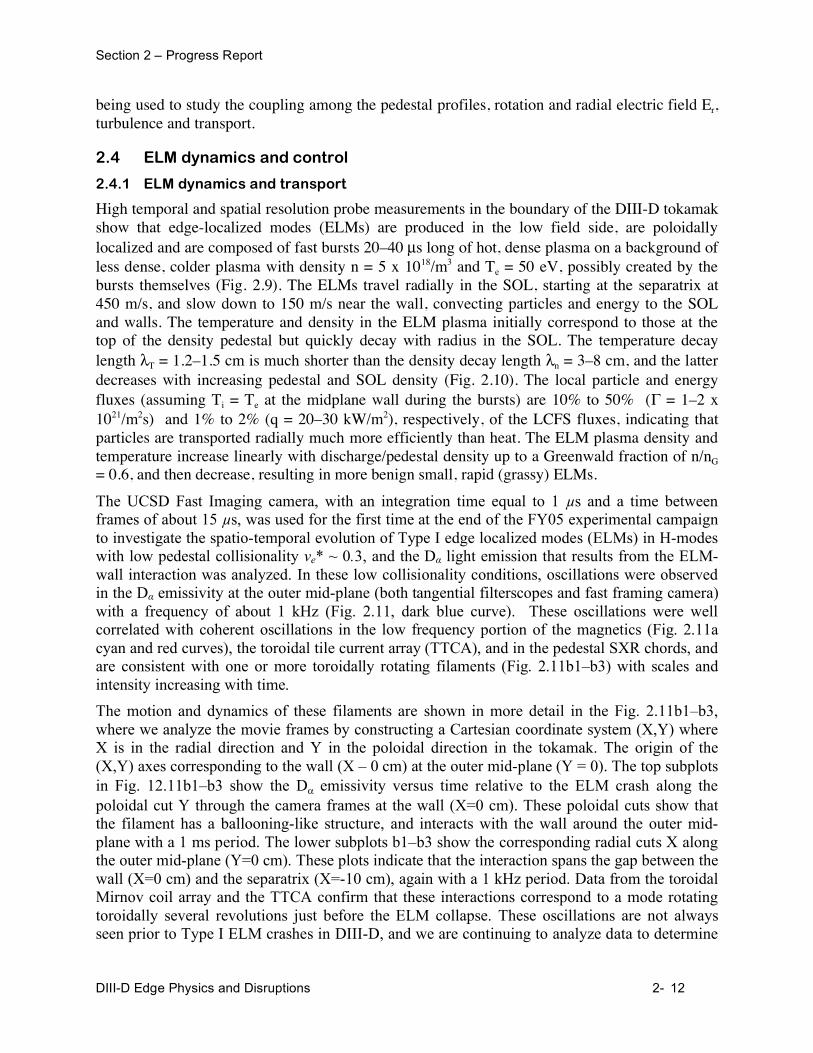
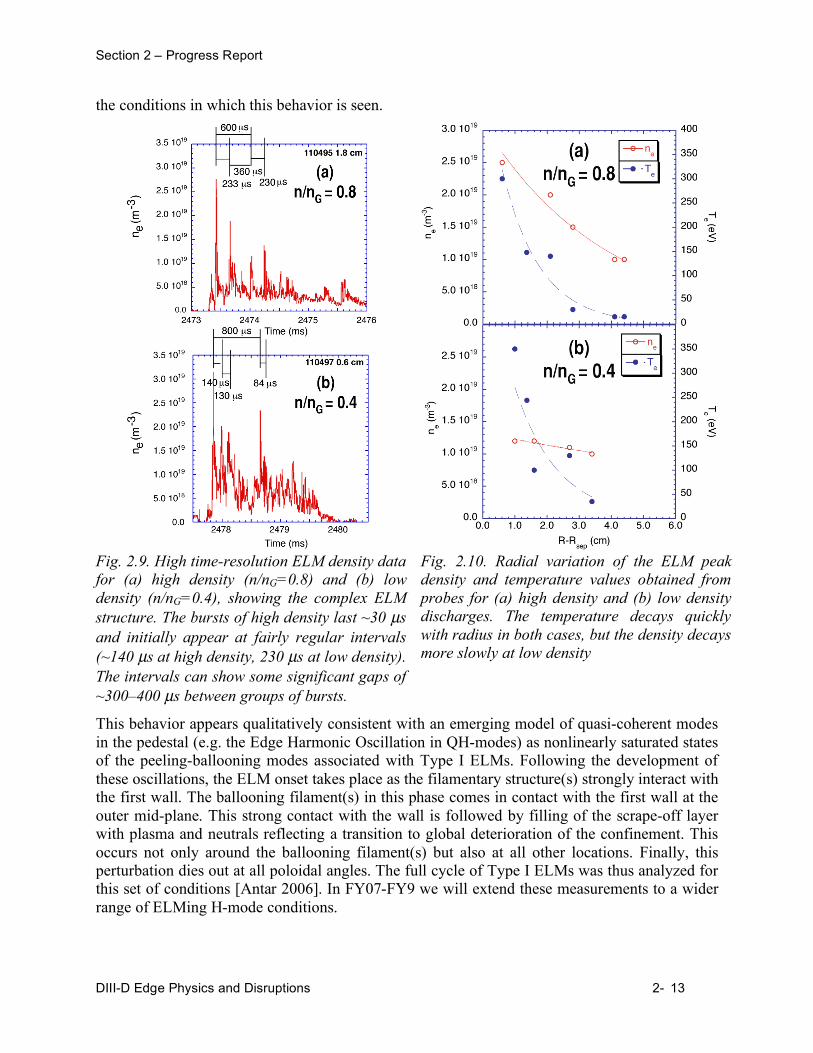
High temporal and spatial resolution probe measurements in the boundary of the DIII-D tokamak show that edge-localized modes (ELMs) are produced in the low field side, are poloidally localized and are composed of fast bursts 20–40 μs long of hot, dense plasma on a background of less dense, colder plasma with density n = 5 x 10¹⁸/m3 and Te = 50 eV, possibly created by the bursts themselves (Fig. 2.9). The ELMs travel radially in the SOL, starting at the separatrix at 450 m/s, and slow down to 150 m/s near the wall, convecting particles and energy to the SOL and walls. The temperature and density in the ELM plasma initially correspond to those at the top of the density pedestal but quickly decay with radius in the SOL. The temperature decay length T = 1.2–1.5 cm is much shorter than the density decay length n = 3–8 cm, and the latter decreases with increasing pedestal and SOL density (Fig. 2.10). The local particle and energy fluxes (assuming Ti = Te at the midplane wall during the bursts) are 10% to 50% ( = 1–2 x 10²¹/m2s) and 1% to 2% (q = 20–30 kW/m2), respectively, of the LCFS fluxes, indicating that particles are transported radially much more efficiently than heat. The ELM plasma density and temperature increase linearly with discharge/pedestal density up to a Greenwald fraction of n/nG = 0.6, and then decrease, resulting in more benign small, rapid (grassy) ELMs.
The UCSD Fast Imaging camera, with an integration time equal to 1 s and a time between
frames of about 15 s, was used for the first time at the end of the FY05 experimental campaign
to investigate the spatio-temporal evolution of Type I edge localized modes (ELMs) in H-modes
with low pedestal collisionality e* ~ 0.3, and the D light emission that results from the ELM-
wall interaction was analyzed. In these low collisionality conditions, oscillations were observed
in the D emissivity at the outer mid-plane (both tangential filterscopes and fast framing camera)
with a frequency of about 1 kHz (Fig. 2.11, dark blue curve). These oscillations were well
correlated with coherent oscillations in the low frequency portion of the magnetics (Fig. 2.11a
cyan and red curves), the toroidal tile current array (TTCA), and in the pedestal SXR chords, and
are consistent with one or more toroidally rotating filaments (Fig. 2.11b1–b3) with scales and
intensity increasing with time.
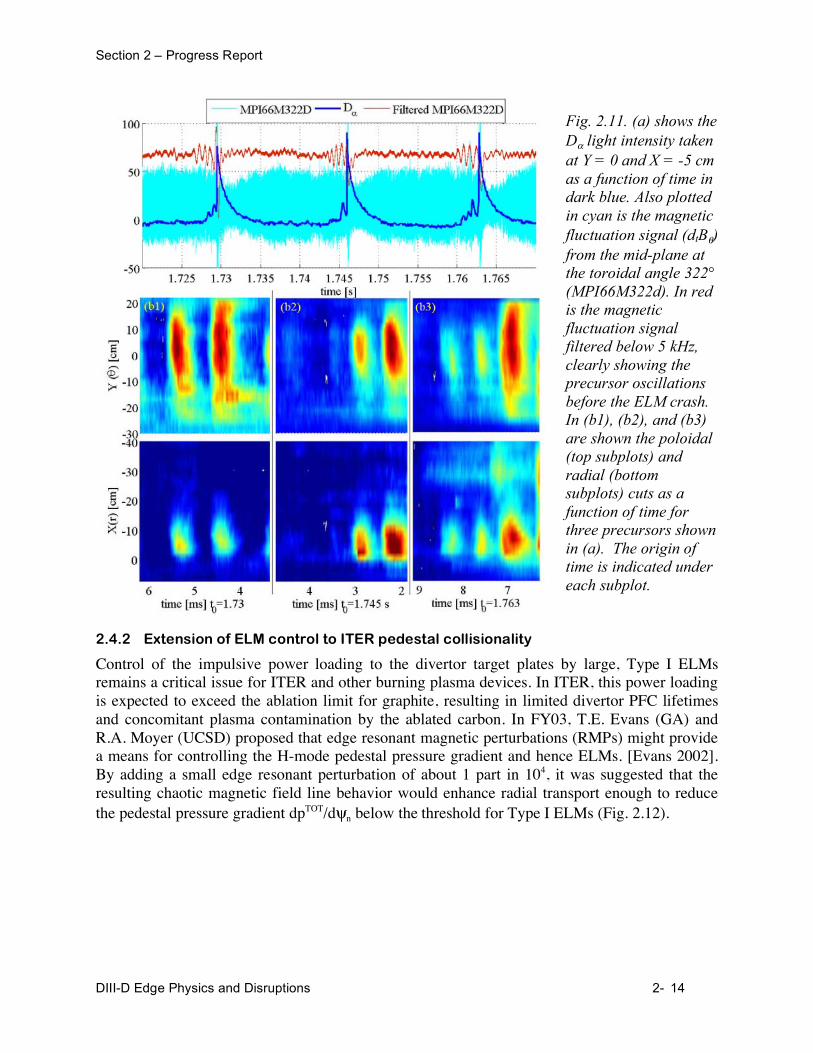
The motion and dynamics of these filaments are shown in more detail in the Fig. 2.11b1–b3,
where we analyze the movie frames by constructing a Cartesian coordinate system (X,Y) where
X is in the radial direction and Y in the poloidal direction in the tokamak. The origin of the
(X,Y) axes corresponding to the wall (X – 0 cm) at the outer mid-plane (Y = 0). The top subplots
in Fig. 12.11b1–b3 show the D emissivity versus time relative to the ELM crash along the
poloidal cut Y through the camera frames at the wall (X=0 cm). These poloidal cuts show that
the filament has a ballooning-like structure, and interacts with the wall around the outer mid-
plane with a 1 ms period. The lower subplots b1–b3 show the corresponding radial cuts X along
the outer mid-plane (Y=0 cm). These plots indicate that the interaction spans the gap between the
wall (X=0 cm) and the separatrix (X=-10 cm), again with a 1 kHz period. Data from the toroidal
Mirnov coil array and the TTCA confirm that these interactions correspond to a mode rotating
toroidally several revolutions just before the ELM collapse. These oscillations are not always
seen prior to Type I ELM crashes in DIII-D, and we are continuing to analyze data to determine
Section 2 – Progress Report
DIII-D Edge Physics and Disruptions 2- 13
the conditions in which this behavior is seen.
Fig. 2.9. High time-resolution ELM density data
for (a) high density (n/nG=0.8) and (b) low
density (n/nG=0.4), showing the complex ELM
structure. The bursts of high density last ~30 μs
and initially appear at fairly regular intervals
(~140 μs at high density, 230 μs at low density).
The intervals can show some significant gaps of
~300–400 μs between groups of bursts.
Fig. 2.10. Radial variation of the ELM peak
density and temperature values obtained from
probes for (a) high density and (b) low density
discharges. The temperature decays quickly
with radius in both cases, but the density decays
more slowly at low density
This behavior appears qualitatively consistent with an emerging model of quasi-coherent modes
in the pedestal (e.g. the Edge Harmonic Oscillation in QH-modes) as nonlinearly saturated states
of the peeling-ballooning modes associated with Type I ELMs. Following the development of
these oscillations, the ELM onset takes place as the filamentary structure(s) strongly interact with
the first wall. The ballooning filament(s) in this phase comes in contact with the first wall at the
outer mid-plane. This strong contact with the wall is followed by filling of the scrape-off layer
with plasma and neutrals reflecting a transition to global deterioration of the confinement. This
occurs not only around the ballooning filament(s) but also at all other locations. Finally, this
perturbation dies out at all poloidal angles. The full cycle of Type I ELMs was thus analyzed for
this set of conditions [Antar 2006]. In FY07-FY9 we will extend these measurements to a wider
range of ELMing H-mode conditions.
Section 2 – Progress Report
DIII-D Edge Physics and Disruptions 2- 14
Fig. 2.11. (a) shows the
D light intensity taken
at Y = 0 and X = -5 cm
as a function of time in
dark blue. Also plotted
in cyan is the magnetic
fluctuation signal (dtB )
from the mid-plane at
the toroidal angle 322°
(MPI66M322d). In red
is the magnetic
fluctuation signal
filtered below 5 kHz,
clearly showing the
precursor oscillations
before the ELM crash.
In (b1), (b2), and (b3)
are shown the poloidal
(top subplots) and
radial (bottom
subplots) cuts as a
function of time for
three precursors shown
in (a). The origin of
time is indicated under
each subplot.
2.4.2 Extension of ELM control to ITER pedestal collisionality
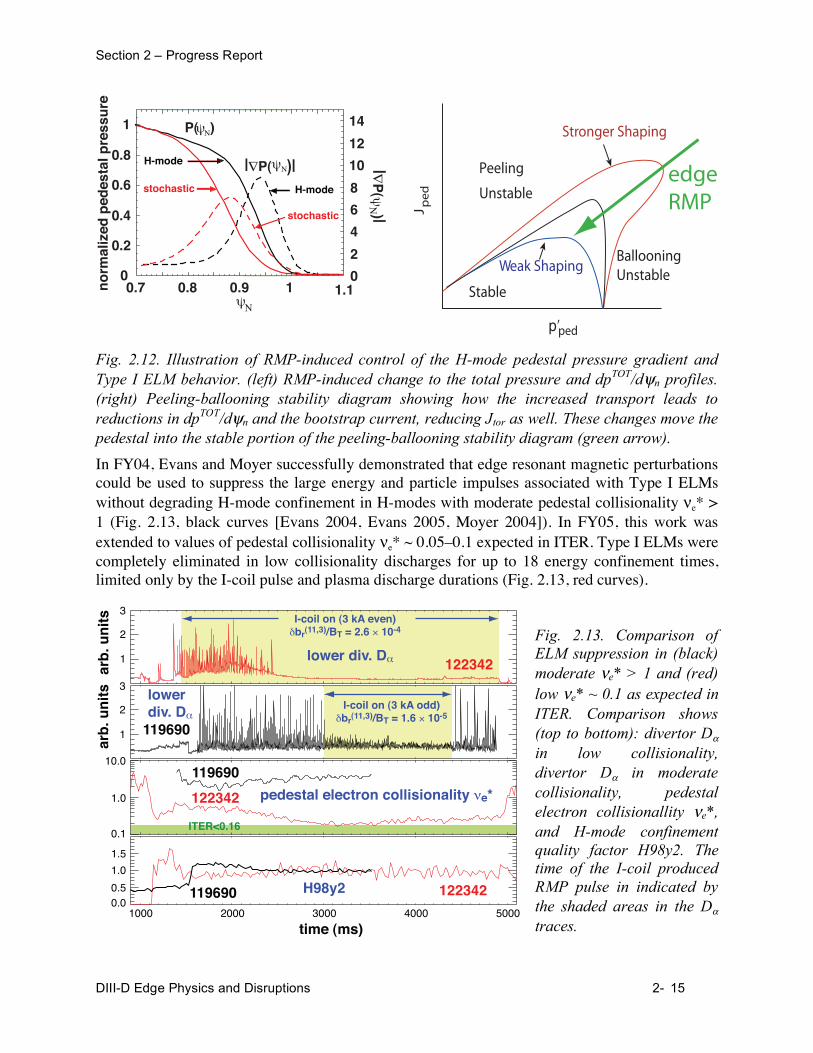
Control of the impulsive power loading to the divertor target plates by large, Type I ELMs remains a critical issue for ITER and other burning plasma devices. In ITER, this power loading is expected to exceed the ablation limit for graphite, resulting in limited divertor PFC lifetimes and concomitant plasma contamination by the ablated carbon. In FY03, T.E. Evans (GA) and R.A. Moyer (UCSD) proposed that edge resonant magnetic perturbations (RMPs) might provide a means for controlling the H-mode pedestal pressure gradient and hence ELMs. [Evans 2002]. By adding a small edge resonant perturbation of about 1 part in 104, it was suggested that the resulting chaotic magnetic field line behavior would enhance radial transport enough to reduce the pedestal pressure gradient dpTOT/d n below the threshold for Type I ELMs (Fig. 2.12).
Section 2 – Progress Report
DIII-D Edge Physics and Disruptions 2- 15
0
0.2
0.4
0.6
0.8
1
0
2
4
6
8
10
12
14
0.7 0.8 0.9 1 1.1no
rmal
ized
ped
esta
l pre
ssu
re
|∇P
(ψΝ )|
ψΝ
|∇P(ψΝ)|
P(ψΝ)
H-mode
stochastic
H-mode
stochastic
Peeling
Unstable
Stronger Shaping
BallooningUnstableWeak Shaping
Stable
p ped
J ped
edgeRMP
Fig. 2.12. Illustration of RMP-induced control of the H-mode pedestal pressure gradient and
Type I ELM behavior. (left) RMP-induced change to the total pressure and dpTOT
/d n profiles.
(right) Peeling-ballooning stability diagram showing how the increased transport leads to
reductions in dpTOT
/d n and the bootstrap current, reducing Jtor as well. These changes move the
pedestal into the stable portion of the peeling-ballooning stability diagram (green arrow).
In FY04, Evans and Moyer successfully demonstrated that edge resonant magnetic perturbations could be used to suppress the large energy and particle impulses associated with Type I ELMs without degrading H-mode confinement in H-modes with moderate pedestal collisionality e* > 1 (Fig. 2.13, black curves [Evans 2004, Evans 2005, Moyer 2004]). In FY05, this work was extended to values of pedestal collisionality e* ~ 0.05–0.1 expected in ITER. Type I ELMs were completely eliminated in low collisionality discharges for up to 18 energy confinement times, limited only by the I-coil pulse and plasma discharge durations (Fig. 2.13, red curves).
1
2
3
0.1
1.0
10.0
1000 2000 3000 4000 50000.00.5
1.0
1.5
1
2
3
arb
. un
its
arb
. un
its
lower div. Dα
lowerdiv. Dα
pedestal electron collisionality νe*
H98y2
122342
122342
122342
119690
119690
119690
time (ms)
I-coil on (3 kA even)δbr(11,3)/BT = 2.6 × 10⁻⁴
I-coil on (3 kA odd)δbr(11,3)/BT = 1.6 × 10⁻⁵
ITER<0.16
Fig. 2.13. Comparison of
ELM suppression in (black)
moderate e* > 1 and (red)
low e* ~ 0.1 as expected in
ITER. Comparison shows
(top to bottom): divertor D
in low collisionality,
divertor D in moderate
collisionality, pedestal
electron collisionallity e*,
and H-mode confinement
quality factor H98y2. The
time of the I-coil produced
RMP pulse in indicated by
the shaded areas in the D
traces.
Section 2 – Progress Report
DIII-D Edge Physics and Disruptions 2- 16
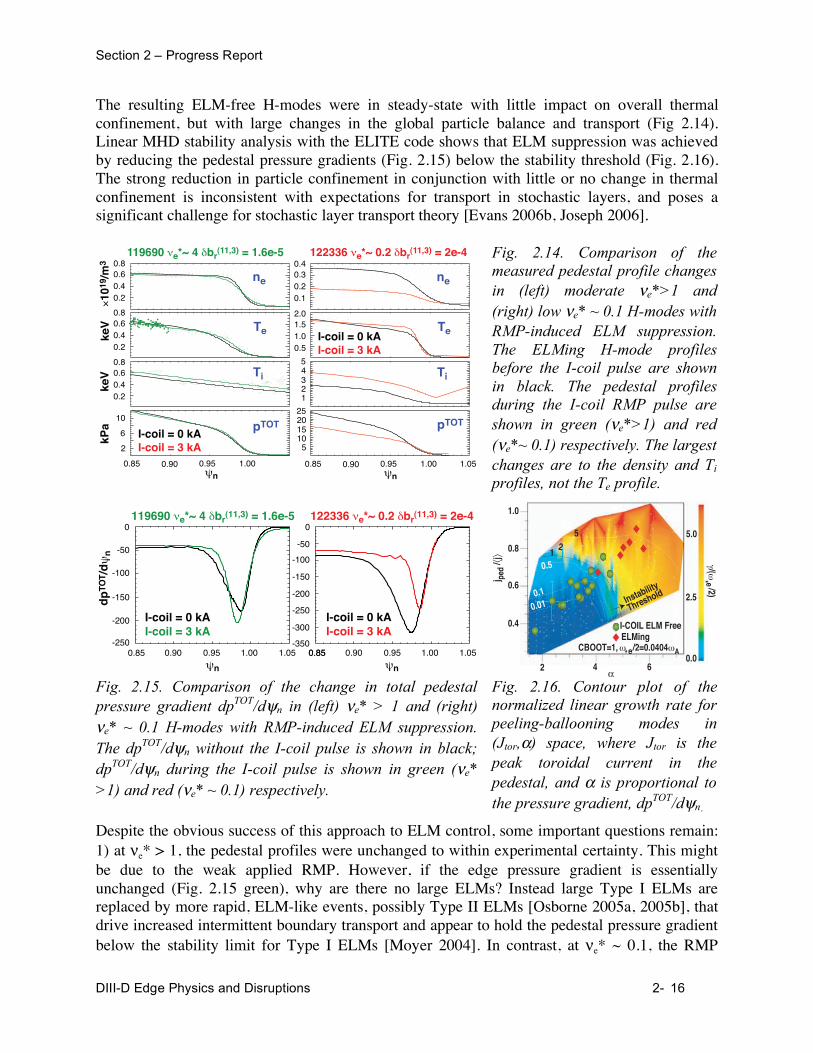
The resulting ELM-free H-modes were in steady-state with little impact on overall thermal confinement, but with large changes in the global particle balance and transport (Fig 2.14). Linear MHD stability analysis with the ELITE code shows that ELM suppression was achieved by reducing the pedestal pressure gradients (Fig. 2.15) below the stability threshold (Fig. 2.16). The strong reduction in particle confinement in conjunction with little or no change in thermal confinement is inconsistent with expectations for transport in stochastic layers, and poses a significant challenge for stochastic layer transport theory [Evans 2006b, Joseph 2006].
Ti
0.85 0.90 0.95 1.00 0.85 0.90 0.95 1.00 1.05ψn ψn
0.8
0.40.6
0.2
0.4
0.20.3
0.1×101
9 /m
3
0.8
0.40.6
0.2
keV
2.0
1.01.5
0.5
keV
0.8
0.40.6
0.2
4
23
1
5
6
2
10
kPa
20
1015
5
25
119690 νe*~ 4 δbr(11,3) = 1.6e-5 122336 νe*~ 0.2 δbr
(11,3) = 2e-4
I-coil = 0 kAI-coil = 3 kA
I-coil = 0 kAI-coil = 3 kA
ne
Te
pTOT
ne
Te
Ti
pTOT
Fig. 2.14. Comparison of the
measured pedestal profile changes
in (left) moderate e*>1 and
(right) low e* ~ 0.1 H-modes with
RMP-induced ELM suppression.
The ELMing H-mode profiles
before the I-coil pulse are shown
in black. The pedestal profiles
during the I-coil RMP pulse are
shown in green ( e*>1) and red
( e*~ 0.1) respectively. The largest
changes are to the density and Ti
profiles, not the Te profile.
0.85 0.90 0.95 1.00 1.05
ψn
0
-50
-100
-150
-200
-250
dp
TOT/dψ
n
0.85 0.90 0.95 1.00 1.05
ψn
0.85
0
-50
-100
-150
-200
-250
-300
-350
119690 νe*~ 4 δbr(11,3) = 1.6e-5 122336 νe*~ 0.2 δbr
(11,3) = 2e-4
I-coil = 0 kAI-coil = 3 kA
I-coil = 0 kAI-coil = 3 kA
52
10.5
0.1
0.01
ELMing
j ped
/j
2 4 6
1.0
0.8
0.6
0.4
0.0
2.5
5.0
/(* e /2)
Instability
Threshold
I-COIL ELM Free
CBOOT=1,*e/2=0.0404 A
Fig. 2.15. Comparison of the change in total pedestal
pressure gradient dpTOT
/d n in (left) e* > 1 and (right)
e* ~ 0.1 H-modes with RMP-induced ELM suppression.
The dpTOT
/d n without the I-coil pulse is shown in black;
dpTOT
/d n during the I-coil pulse is shown in green ( e*
>1) and red ( e* ~ 0.1) respectively.
Fig. 2.16. Contour plot of the
normalized linear growth rate for
peeling-ballooning modes in
(Jtor, ) space, where Jtor is the
peak toroidal current in the
pedestal, and is proportional to
the pressure gradient, dpTOT
/d n.
Despite the obvious success of this approach to ELM control, some important questions remain: 1) at e* > 1, the pedestal profiles were unchanged to within experimental certainty. This might be due to the weak applied RMP. However, if the edge pressure gradient is essentially unchanged (Fig. 2.15 green), why are there no large ELMs? Instead large Type I ELMs are replaced by more rapid, ELM-like events, possibly Type II ELMs [Osborne 2005a, 2005b], that drive increased intermittent boundary transport and appear to hold the pedestal pressure gradient below the stability limit for Type I ELMs [Moyer 2004]. In contrast, at e* ~ 0.1, the RMP
Section 2 – Progress Report
DIII-D Edge Physics and Disruptions 2- 17
reduces the pedestal pressure gradient as expected, but not due to changes in the Te profile as predicted by Rechester-Rosenbluth and quasi-linear theory [Evans 2006b]. Consequently, more work is needed to understand these results before they can be reliably extrapolated to ITER. However, it seems inescapable to conclude that at least some of the variation in ELM behavior in different operating conditions in a single device, and between different devices, may arise from the interaction of error fields with the magnetic topology, turbulence, transport and MHD stability of the pedestal [Moyer 2004]. In this more general sense, even if this approach to ELM control cannot be applied to ITER (e.g. because appropriate coils aren’t possible), this research should further our understanding of the relationship of ELM behavior to the complex coupling among magnetic topology and shape, turbulent transport and MHD stability, which might lead to alternative ELM control scenarios that would be more compatible with ITER.
2.4.3 Intermittency and turbulence changes during I-Coil operation:
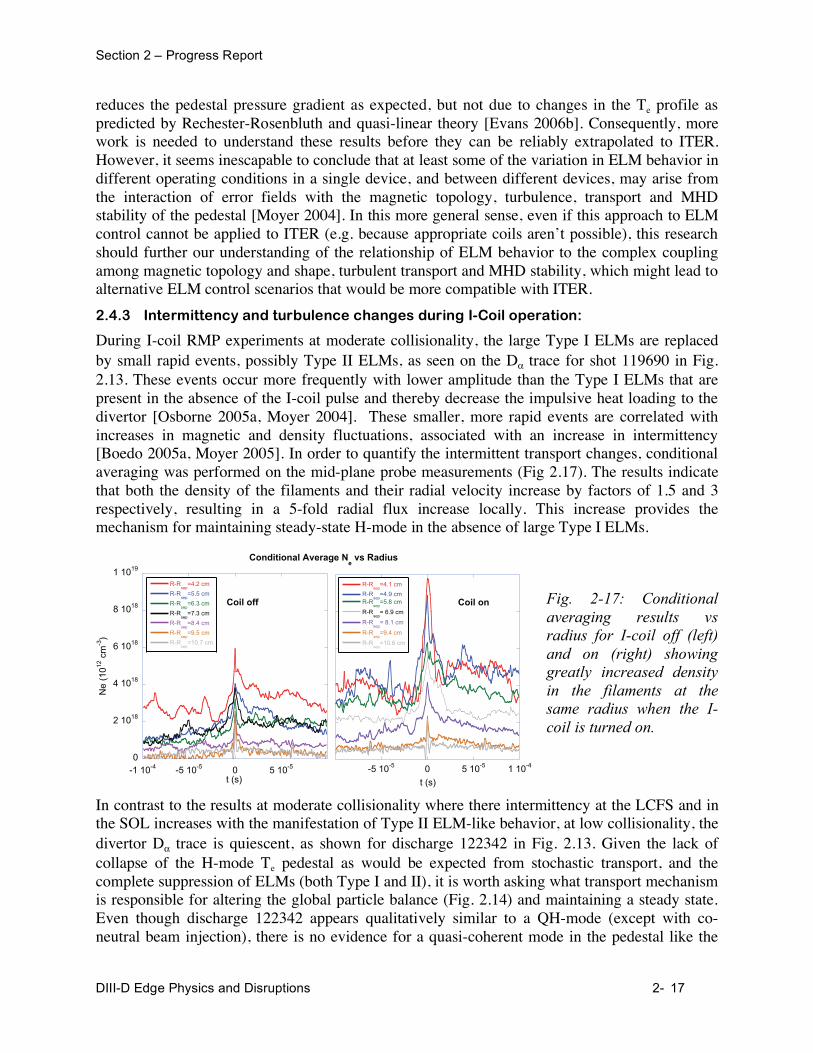
During I-coil RMP experiments at moderate collisionality, the large Type I ELMs are replaced by small rapid events, possibly Type II ELMs, as seen on the D trace for shot 119690 in Fig. 2.13. These events occur more frequently with lower amplitude than the Type I ELMs that are present in the absence of the I-coil pulse and thereby decrease the impulsive heat loading to the divertor [Osborne 2005a, Moyer 2004]. These smaller, more rapid events are correlated with increases in magnetic and density fluctuations, associated with an increase in intermittency [Boedo 2005a, Moyer 2005]. In order to quantify the intermittent transport changes, conditional averaging was performed on the mid-plane probe measurements (Fig 2.17). The results indicate that both the density of the filaments and their radial velocity increase by factors of 1.5 and 3 respectively, resulting in a 5-fold radial flux increase locally. This increase provides the mechanism for maintaining steady-state H-mode in the absence of large Type I ELMs.
0
2 1018
4 1018
6 1018
8 1018
1 1019
-1 10-4 -5 10-5 0 5 10-5
Conditional Average Ne vs Radius
R-Rsep
=4.2 cm
R-Rsep
=5.5 cm
R-Rsep
=6.3 cm
R-Rsep
=7.3 cm
R-Rsep
=8.4 cm
R-Rsep
=9.5 cm
R-Rsep
=10.7 cm
Ne
(1012
cm
-3)
t (s)-5 10-5 0 5 10-5 1 10-4
R-Rsep
=4.1 cm
R-Rsep
=5.8 cm
R-Rsep
= 6.9 cm
R-Rsep
= 8.1 cm
R-Rsep
=9.4 cm
R-Rsep
=10.6 cm
t (s)
R-Rsep
=4.9 cm
Coil off Coil on
Fig. 2-17: Conditional
averaging results vs
radius for I-coil off (left)
and on (right) showing
greatly increased density
in the filaments at the
same radius when the I-
coil is turned on.
In contrast to the results at moderate collisionality where there intermittency at the LCFS and in the SOL increases with the manifestation of Type II ELM-like behavior, at low collisionality, the divertor D trace is quiescent, as shown for discharge 122342 in Fig. 2.13. Given the lack of collapse of the H-mode Te pedestal as would be expected from stochastic transport, and the complete suppression of ELMs (both Type I and II), it is worth asking what transport mechanism is responsible for altering the global particle balance (Fig. 2.14) and maintaining a steady state. Even though discharge 122342 appears qualitatively similar to a QH-mode (except with co-neutral beam injection), there is no evidence for a quasi-coherent mode in the pedestal like the
Section 2 – Progress Report
DIII-D Edge Physics and Disruptions 2- 18
Edge Harmonic Oscillation in QH modes. Instead, the Far Infrared (FIR) coherent light scattering, reflectometry, and BES all measure an increase in the broadband fluctuation level when the ELM are suppressed [Boedo 2005, Moyer 2005, Zeng 2005, Moyer 2006, Boedo 2006]. This increase in electrostatic fluctuations may account for the departure from expectations of transport in a stochastic layer. In FY06-09, we will continue to explore this issue in subsequent experiments and in simulations of turbulence in stochastic layers [Reiser 2005, 2006]
2.4.4 Modeling self-consistent plasma response to RMPs:
Motivated by both the empirical success of the RMP ELM control experiments over a wide range of pedestal conditions (Fig. 2.13), and the unresolved issues concerning the level of stochastic layer transport, Evans and Moyer initiated a new theory research grant in April, 2005 for modeling the self-consistent plasma response to the applied I-coil magnetic perturbations [Joseph 2006]. Although supported by a separate research grant, this work is being carried out in close collaboration with the DIII-D and UCSD experimental research programs. In FY05 the field line integration code TRIP3D used for modeling the vacuum magnetic field from the combination of the axisymmetric equilibrium, and known sources of non-axisymmetric magnetic fields (error fields and perturbation coils) has been coupled to the E3D 3D Monte Carlo fluid heat transport code from MPI-Griefswald, Germany. The coupled TRIP3D/E3D code provides a virtual environment in which to investigate the relative roles of the various physics issues that govern the net particle and heat transport during RMP operation in DIII-D. This capability is being used by this grant to design experiments for FY06–09 which will further extend the RMP ELM suppression at ITER collisionality to ITER relevant rotation, shape, and edge safety factor, and which will help resolve the remaining physics questions.
2.5 Disruptions and Disruption Mitigation
2.5.1 Introduction
Wall damage due to disruptions in ITER is a significant concern, potentially limiting the
machine lifetime. Massive gas injection is attractive for fast shutdown of tokamak discharges in
the event of a disruption because it is quite straightforward to implement. This technique was
first successfully demonstrated on DIII-D [Taylor 1999] and has since implemented on other
tokamaks, such as Tore-Supra [Martin 2004], JT-60U [Bakhtiari 2002], and JET [Riccardo
2002]. Overall, the results have been very encouraging: repeatable, fast shutdowns are achieved
with no apparent negative consequences for subsequent discharges. Wall damage is minimal,
with large radiated power fractions, significantly reduced halo currents, and very low runaway
electron production [Whyte 2003].
In ITER, however, plasma conditions will be significantly different than in present tokamaks.
Plasma stored energies will be orders of magnitude larger than in present machines (~1 GJ as
opposed to ~ 1 MJ). Plasma dimensions will also be significantly larger, while the plasma
collisionality will be lower. Plasma current will be of order 10 larger than in present tokamaks,
leading to a longer current quench time and much greater danger of runaway electron
amplification. Additionally, the presence of gamma radiation from the walls of ITER will
continuously generate a seed electron population which can then lead to runaway electrons,
implying that runaway beams can be initiated very easily during disruptions [Rosenbluth 1996].
Because of these significant differences between ITER and present tokamaks, prediction of the
efficacy of massive gas injection for disruption mitigation in ITER is a significant experimental
Section 2 – Progress Report
DIII-D Edge Physics and Disruptions 2- 19
and theoretical challenge. Thus it is critical to obtain a clear physics-based understanding of
how gas-jet mitigation works, and how it may operate in ITER-scaled devices.
The main goal of the UCSD/DIII-D disruption collaboration is to evaluate the technique of
massive gas injection (MGI) as a potential technique for disruption mitigation in ITER. The main
focus in the 2003-2006 period has been to conduct experiments at DIII-D to build up
experimental understanding of the physics underlying MGI, with the eventual goal of developing
models to predict MGI performance in ITER. Significant progress has been made toward
understanding the important processes occurring in the MGI experiments. For example, it has
been shown that gas jet neutrals are stopped very easily at the plasma edge, and the subsequent
propagation of the MGI-initiated cold front has been shown to proceed in a relatively slow, semi-
diffusive fashion, punctuated by periods of explosive transport when the cold front reaches
rational q surfaces and destabilizes global low-order MHD modes. The final thermal quench
(TQ) central temperature collapse appears to proceed via a series of (m/n) = (1/1) reconnection
events which quickly cool away the edges of the central current channel. Finally, a large
broadening of the current channel out to q < 2 occurs after the TQ when the entire plasma profile
is uniformly cold. Overall, the MGI shutdown timescales appear to be set by the q profile of the
target plasma and the quantity and species of gas delivered to the plasma edge. Changes in the
gas jet nozzle geometry where performed but showed little effect on jet effectiveness,
demonstrating that neutral delivery rate, not aiming, sets the resulting MGI timescales. In the
following, we present key DIII-D results which demonstrate this physics picture.
2.5.2 Disruption experiments on DIII-D
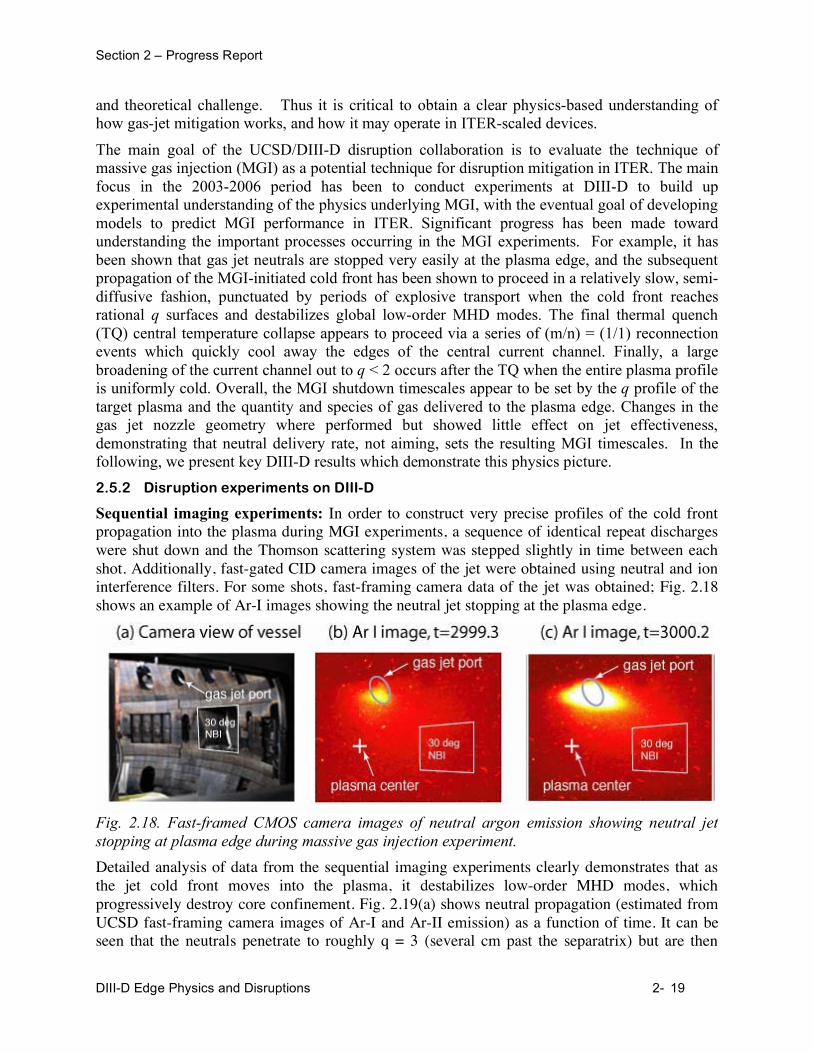
Sequential imaging experiments: In order to construct very precise profiles of the cold front propagation into the plasma during MGI experiments, a sequence of identical repeat discharges were shut down and the Thomson scattering system was stepped slightly in time between each shot. Additionally, fast-gated CID camera images of the jet were obtained using neutral and ion interference filters. For some shots, fast-framing camera data of the jet was obtained; Fig. 2.18 shows an example of Ar-I images showing the neutral jet stopping at the plasma edge.
Fig. 2.18. Fast-framed CMOS camera images of neutral argon emission showing neutral jet
stopping at plasma edge during massive gas injection experiment.
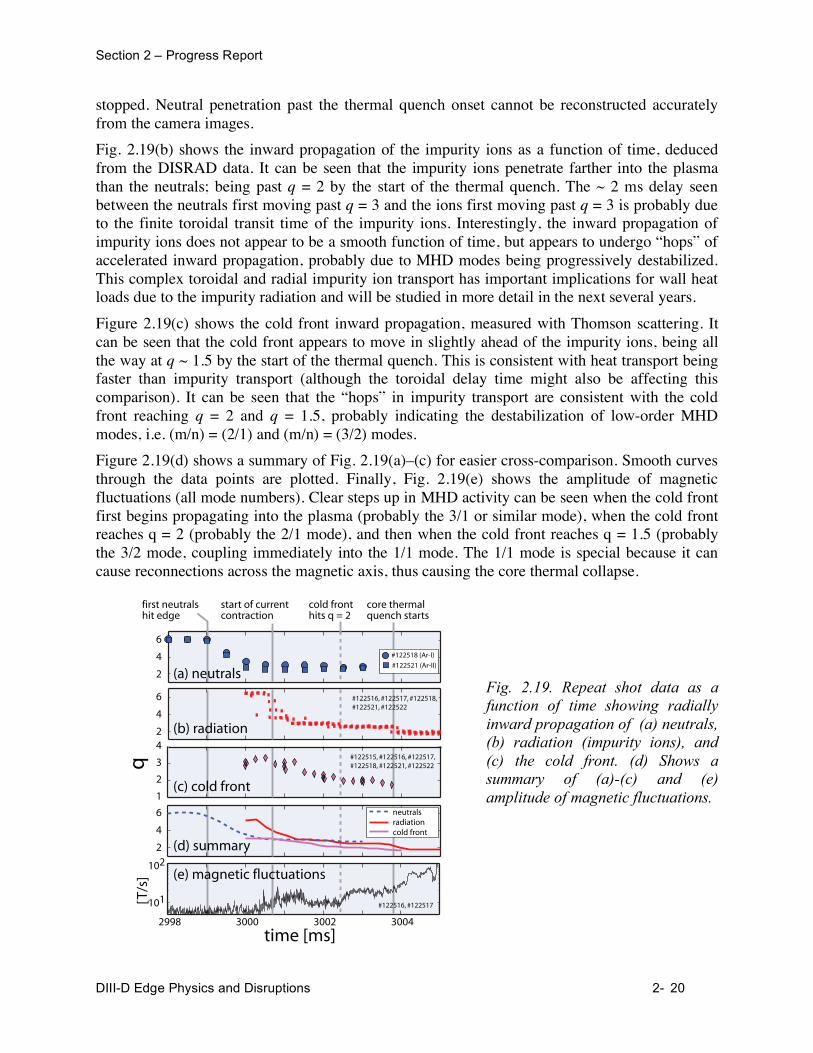
Detailed analysis of data from the sequential imaging experiments clearly demonstrates that as the jet cold front moves into the plasma, it destabilizes low-order MHD modes, which progressively destroy core confinement. Fig. 2.19(a) shows neutral propagation (estimated from UCSD fast-framing camera images of Ar-I and Ar-II emission) as a function of time. It can be seen that the neutrals penetrate to roughly q = 3 (several cm past the separatrix) but are then
Section 2 – Progress Report
DIII-D Edge Physics and Disruptions 2- 20
stopped. Neutral penetration past the thermal quench onset cannot be reconstructed accurately from the camera images.
Fig. 2.19(b) shows the inward propagation of the impurity ions as a function of time, deduced from the DISRAD data. It can be seen that the impurity ions penetrate farther into the plasma than the neutrals; being past q = 2 by the start of the thermal quench. The ~ 2 ms delay seen between the neutrals first moving past q = 3 and the ions first moving past q = 3 is probably due to the finite toroidal transit time of the impurity ions. Interestingly, the inward propagation of impurity ions does not appear to be a smooth function of time, but appears to undergo “hops” of accelerated inward propagation, probably due to MHD modes being progressively destabilized. This complex toroidal and radial impurity ion transport has important implications for wall heat loads due to the impurity radiation and will be studied in more detail in the next several years.
Figure 2.19(c) shows the cold front inward propagation, measured with Thomson scattering. It can be seen that the cold front appears to move in slightly ahead of the impurity ions, being all the way at q ~ 1.5 by the start of the thermal quench. This is consistent with heat transport being faster than impurity transport (although the toroidal delay time might also be affecting this comparison). It can be seen that the “hops” in impurity transport are consistent with the cold front reaching q = 2 and q = 1.5, probably indicating the destabilization of low-order MHD modes, i.e. (m/n) = (2/1) and (m/n) = (3/2) modes.
Figure 2.19(d) shows a summary of Fig. 2.19(a)–(c) for easier cross-comparison. Smooth curves through the data points are plotted. Finally, Fig. 2.19(e) shows the amplitude of magnetic fluctuations (all mode numbers). Clear steps up in MHD activity can be seen when the cold front first begins propagating into the plasma (probably the 3/1 or similar mode), when the cold front reaches q = 2 (probably the 2/1 mode), and then when the cold front reaches q = 1.5 (probably the 3/2 mode, coupling immediately into the 1/1 mode. The 1/1 mode is special because it can cause reconnections across the magnetic axis, thus causing the core thermal collapse.
#122516, #122517, #122518, #122521, #122522
#122515, #122516, #122517, #122518, #122521, #122522
2
4
6
2
4
6
2
4
6
2
3
4
1
102
101
2998 3000 3002 3004
[T/s
] q
#122516, #122517
(a) neutrals #122521 (Ar-II)
#122518 (Ar-I)
(b) radiation
(c) cold front
(d) summary
radiation neutrals
cold front
time [ms]
start of current contraction
cold front hits q = 2
core thermal quench starts
first neutrals hit edge
(e) magnetic fluctuations
Fig. 2.19. Repeat shot data as a
function of time showing radially
inward propagation of (a) neutrals,
(b) radiation (impurity ions), and
(c) the cold front. (d) Shows a
summary of (a)-(c) and (e)
amplitude of magnetic fluctuations.
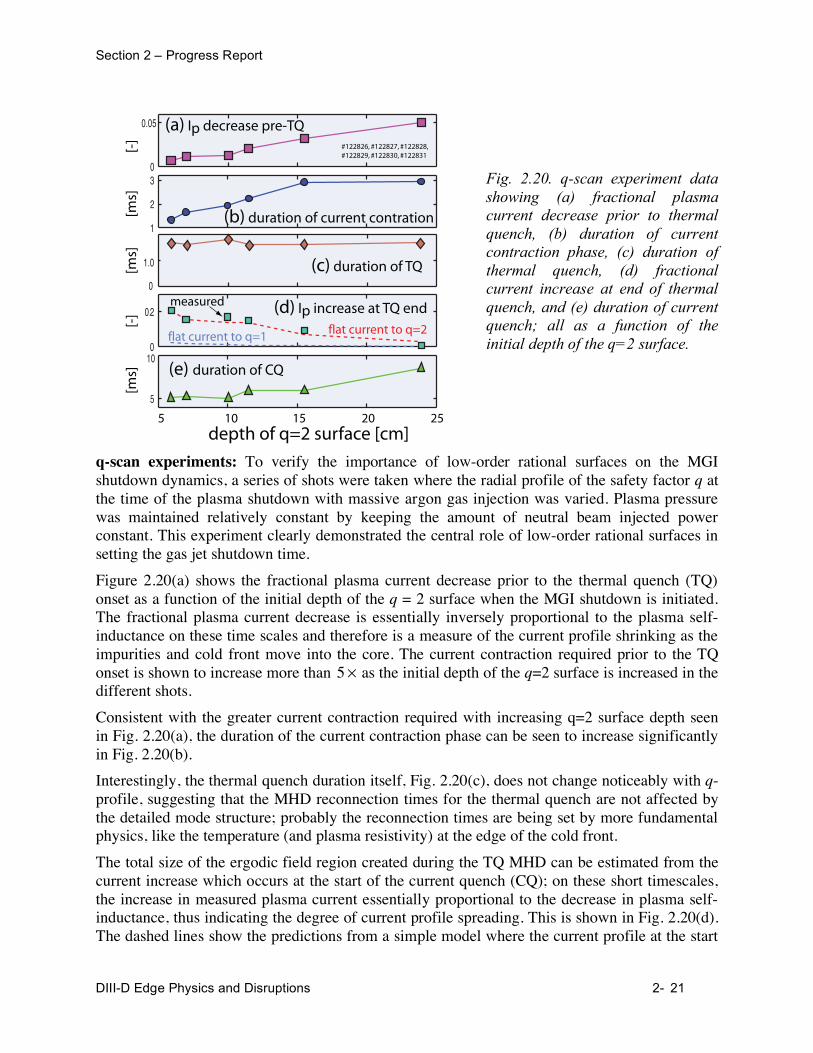
Section 2 – Progress Report
DIII-D Edge Physics and Disruptions 2- 21
5
#122826, #122827, #122828, #122829, #122830, #122831
depth of q=2 surface [cm] 15 20 25
(a) Ip decrease pre-TQ
(b) duration of current contration
(c) duration of TQ
[ms]
0
0.05
1
2
3
1.0
0
0. 2
5
10
10
(d) Ip increase at TQ end
(e) duration of CQ
[ms]
[m
s]
[-]
[-]
measured
flat current to q=2 flat current to q=1
0
Fig. 2.20. q-scan experiment data
showing (a) fractional plasma
current decrease prior to thermal
quench, (b) duration of current
contraction phase, (c) duration of
thermal quench, (d) fractional
current increase at end of thermal
quench, and (e) duration of current
quench; all as a function of the
initial depth of the q=2 surface.
q-scan experiments: To verify the importance of low-order rational surfaces on the MGI shutdown dynamics, a series of shots were taken where the radial profile of the safety factor q at the time of the plasma shutdown with massive argon gas injection was varied. Plasma pressure was maintained relatively constant by keeping the amount of neutral beam injected power constant. This experiment clearly demonstrated the central role of low-order rational surfaces in setting the gas jet shutdown time.
Figure 2.20(a) shows the fractional plasma current decrease prior to the thermal quench (TQ) onset as a function of the initial depth of the q = 2 surface when the MGI shutdown is initiated. The fractional plasma current decrease is essentially inversely proportional to the plasma self-inductance on these time scales and therefore is a measure of the current profile shrinking as the impurities and cold front move into the core. The current contraction required prior to the TQ onset is shown to increase more than 5 as the initial depth of the q=2 surface is increased in the different shots.
Consistent with the greater current contraction required with increasing q=2 surface depth seen in Fig. 2.20(a), the duration of the current contraction phase can be seen to increase significantly in Fig. 2.20(b).
Interestingly, the thermal quench duration itself, Fig. 2.20(c), does not change noticeably with q-profile, suggesting that the MHD reconnection times for the thermal quench are not affected by the detailed mode structure; probably the reconnection times are being set by more fundamental physics, like the temperature (and plasma resistivity) at the edge of the cold front.
The total size of the ergodic field region created during the TQ MHD can be estimated from the current increase which occurs at the start of the current quench (CQ); on these short timescales, the increase in measured plasma current essentially proportional to the decrease in plasma self-inductance, thus indicating the degree of current profile spreading. This is shown in Fig. 2.20(d). The dashed lines show the predictions from a simple model where the current profile at the start
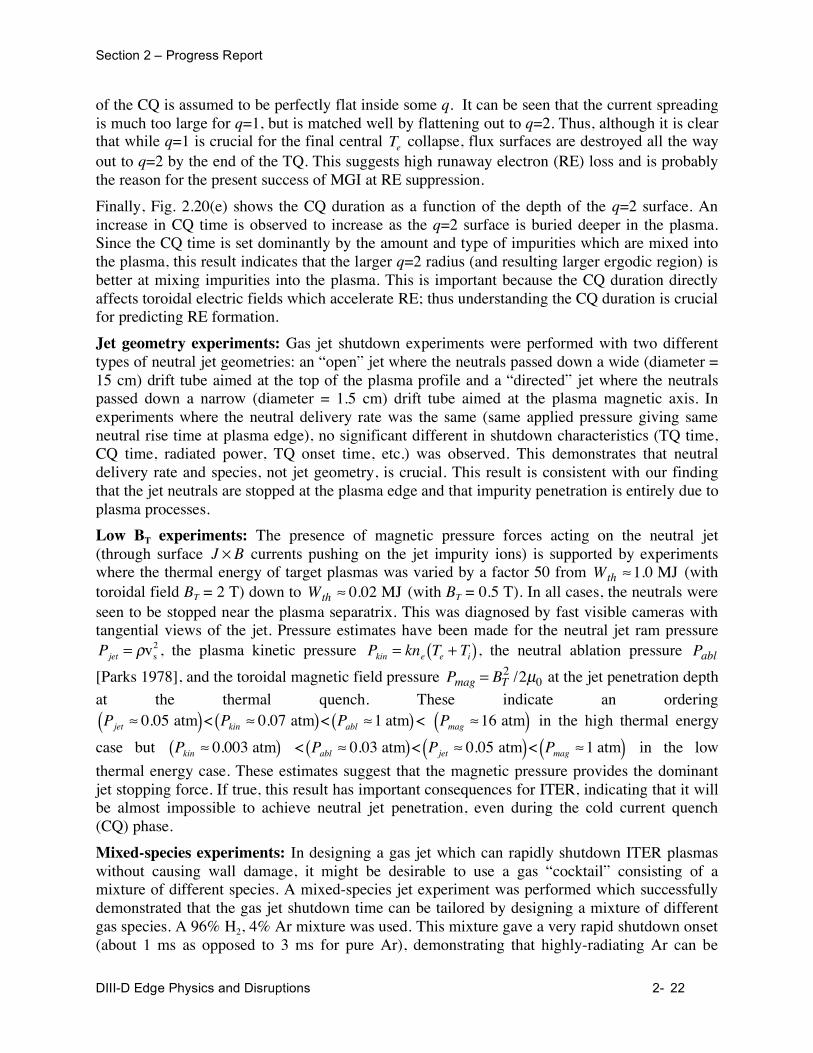
Section 2 – Progress Report
DIII-D Edge Physics and Disruptions 2- 22
of the CQ is assumed to be perfectly flat inside some q. It can be seen that the current spreading is much too large for q=1, but is matched well by flattening out to q=2. Thus, although it is clear that while q=1 is crucial for the final central Te collapse, flux surfaces are destroyed all the way out to q=2 by the end of the TQ. This suggests high runaway electron (RE) loss and is probably the reason for the present success of MGI at RE suppression.
Finally, Fig. 2.20(e) shows the CQ duration as a function of the depth of the q=2 surface. An increase in CQ time is observed to increase as the q=2 surface is buried deeper in the plasma. Since the CQ time is set dominantly by the amount and type of impurities which are mixed into the plasma, this result indicates that the larger q=2 radius (and resulting larger ergodic region) is better at mixing impurities into the plasma. This is important because the CQ duration directly affects toroidal electric fields which accelerate RE; thus understanding the CQ duration is crucial for predicting RE formation.
Jet geometry experiments: Gas jet shutdown experiments were performed with two different types of neutral jet geometries: an “open” jet where the neutrals passed down a wide (diameter = 15 cm) drift tube aimed at the top of the plasma profile and a “directed” jet where the neutrals passed down a narrow (diameter = 1.5 cm) drift tube aimed at the plasma magnetic axis. In experiments where the neutral delivery rate was the same (same applied pressure giving same neutral rise time at plasma edge), no significant different in shutdown characteristics (TQ time, CQ time, radiated power, TQ onset time, etc.) was observed. This demonstrates that neutral delivery rate and species, not jet geometry, is crucial. This result is consistent with our finding that the jet neutrals are stopped at the plasma edge and that impurity penetration is entirely due to plasma processes.
Low BT experiments: The presence of magnetic pressure forces acting on the neutral jet (through surface J B currents pushing on the jet impurity ions) is supported by experiments where the thermal energy of target plasmas was varied by a factor 50 from Wth 1.0 MJ (with toroidal field BT = 2 T) down to Wth 0.02 MJ (with BT = 0.5 T). In all cases, the neutrals were seen to be stopped near the plasma separatrix. This was diagnosed by fast visible cameras with tangential views of the jet. Pressure estimates have been made for the neutral jet ram pressure Pjet = vs
2 , the plasma kinetic pressure Pkin = kne Te + Ti( ), the neutral ablation pressure Pabl
[Parks 1978], and the toroidal magnetic field pressure Pmag = BT2 /2μ0 at the jet penetration depth
at the thermal quench. These indicate an ordering Pjet 0.05 atm( )< Pkin 0.07 atm( )< Pabl 1 atm( ) < Pmag 16 atm( ) in the high thermal energy
case but Pkin 0.003 atm( ) < Pabl 0.03 atm( )< Pjet 0.05 atm( )< Pmag 1 atm( ) in the low
thermal energy case. These estimates suggest that the magnetic pressure provides the dominant jet stopping force. If true, this result has important consequences for ITER, indicating that it will be almost impossible to achieve neutral jet penetration, even during the cold current quench (CQ) phase.
Mixed-species experiments: In designing a gas jet which can rapidly shutdown ITER plasmas without causing wall damage, it might be desirable to use a gas “cocktail” consisting of a mixture of different species. A mixed-species jet experiment was performed which successfully demonstrated that the gas jet shutdown time can be tailored by designing a mixture of different gas species. A 96% H2, 4% Ar mixture was used. This mixture gave a very rapid shutdown onset (about 1 ms as opposed to 3 ms for pure Ar), demonstrating that highly-radiating Ar can be
Section 2 – Progress Report
DIII-D Edge Physics and Disruptions 2- 23
entrained in the rapidly-moving H2 and was carried to the plasma edge rapidly.
2.6 Diagnostic development and upgrades:
In FY05 and during the DIII-D LTOA, UCSD staff implemented several new diagnostic measurements to support the DIII-D research program, including: fast Te measurements on the X-point probe in the lower divertor; turbulent particle flux measurements on the X-point probe; and commissioning of a new, fast-framing visible camera. In addition, UCSD staff undertook several diagnostic upgrades which will be completed as part of the LTOA in FY05 and FY06, including: extension of the X-point probe; upgrade of the DIII-D SXR poloidal arrays; and design of an airlock and MiMES sample holder for the mid-plane probe array. These diagnostic upgrades are described below.
2.6.1 Fast Te measurements in the lower divertor
Electron temperature fluctuation measurements with a bandwidth of up to 60 kHz have been added to the X-point probe. First results from the fast Te measurement capability on the X-point probe in the DIII-D lower divertor were obtained in FY05 before the beginning of the LTOA. The technique is based on detection of current harmonics of a DC-floating probe driven by a sine wave at 250 kHz. This probe upgrade will provide unique new time resolved information on electron temperature variations in the divertor and SOL, including across ELMs. In addition, this capability allows measurement of the turbulent particle flux in USN discharges, which is essential for the studies of poloidal asymmetries of the turbulent cross-field fluxes.
2.6.2 Fast imaging camera
A major advance in UCSD’s diagnostic capability at DIII-D was the addition in FY05 of a fast-framing CMOS visible light camera with a filter wheel mounted on a tangentially viewing port (see Fig. 1.1). The camera is a Phantom V7 with 12-bit resolution and 800x600 pixels. If the full frame is used, the frame-rate is 4,800 Hz. The shutter time can be as low as 1 μs. During the initial operation at the end of the FY05 run campaign, the camera was often used with a setup of 128x64 pixels at a frame-rate of 64 kHz. At this resolution up to 1.3 seconds can be continuously recorded. The optical fiber used to collect plasma light can rotate (+/- 15 degrees) horizontally, allowing imaging of plasma interactions with the outer as well as the inner wall. A vertical rotation (+/- 15 degrees) is also possible in addition to the vertical motion in order to view areas more toward the top or the bottom of the tokamak. In front of the camera a filter wheel is installed with two wheels with 10 filters per wheel. Available filters include H I, He I, He II, C I, CII, C III, Ar I, and Ar II that can be changed remotely between discharges. Although added primarily to study the penetration of the gas jet and subsequent MHD mixing in disruptions mitigated with massive gas jets, this camera also provides important high speed imaging capabilities for the study of ELMs, turbulence, and other boundary phenomena in DIII-D. The camera was mounted and commissioned in March 2005, six weeks before the end of operations for the LTOA. Significant amounts of data were acquired for several different experiments, including ELM physics and control, disruption mitigation, and boundary plasma physics.
• Disruption mitigation with massive gas jet: movies of the gas jet were acquired using four different filter setups in front of the camera. These movies support other diagnostics that indicate the gas jet doesn’t penetrate far into the plasma during the thermal quench.
Section 2 – Progress Report
DIII-D Edge Physics and Disruptions 2- 24
• Dust in DIII-D discharges: movies of dust during both normal tokamak operation and DIMES-dust experiments were acquired and analyzed.
• Pellet penetration: movies of pellets were acquired and analyzed for four discharges in collaboration with T. Jernigan and L. Baylor (ORNL). Results were obtained on the life-time and trajectories of the pellets.
• Divertor detachment with Ar injection: movies were acquired during experiments on divertor detachment with Argon gas puffing and are being analyzed.
• ELM dynamics: the first movies of ELMs showing the spatio-temporal dynamics were obtained during the last 6 weeks of the CY05 operational campaign, just prior to the start of the Long Torus Opening Activity. The movies were analyzed (see Section 2.4.1) and an article has been submitted for publication [Antar 2006].
Analysis of this initial fast imaging data is underway on these issues in collaboration with other DIII-D scientists
2.6.3 SXR imaging and runaway electron diagnostics
As part of the Long Torus Opening Activity (LTOA) at DIII-D, General Atomics is replacing the poloidal SXR arrays in DIII-D. The UCSD group is participating in the design of the upgraded soft x-ray array system, which is based on the existing UCSD “DISRAD” XUV array, but will feature a novel movable filter/pinhole system, giving it the ability to work as either an XUV array or as a SXR array.
A critical need for disruption mitigation research at DIII-D is real-time, in-situ runaway electron diagnostics. In FY05, task leader E. Hollmann collaborated with scientists from the TJ-II stellarator at CIEMAT to upgrade and operate the soft x-ray camera diagnostic. Interesting new data on the evolution of the radiation profile at various cutoff energies during high-density radiative collapses in stellarators was obtained. The experience gained from this collaboration will contribute to designing a runaway electron imaging diagnostic for DIII-D in the FY07-09 period.
2.6.4 X-point probe extension for the new divertor
As part of the DIII-D LTOA, the lower divertor has been modified to allow pumping of high triangularity plasma shapes. A new baffle plate was installed that effectively raised the outer half of the lower divertor floor by 11.3 cm over the old low floor level. In order to maintain the 25 cm stroke of the X-point probe over the new floor level, UCSD and Sandia National Laboratories collaborated on the design of a nipple-type extension to the X-point probe drive tube. With the nipple installed, the probe will have improved access to Upper Single Null and Inner Wall Limited plasma configurations compared to the old setup.
2.6.5 Upgrade of DIII-D SXR Poloidal Array
The UCSD group is participating in the design of an upgraded soft x-ray (SXR) array system being developed by GA for DIII-D. The upgrade is being based substantially on the existing UCSD DISRAD diagnostic, but will feature a novel movable filter/pinhole system, giving it the ability to work as either an AXUV array or as a SXR array.
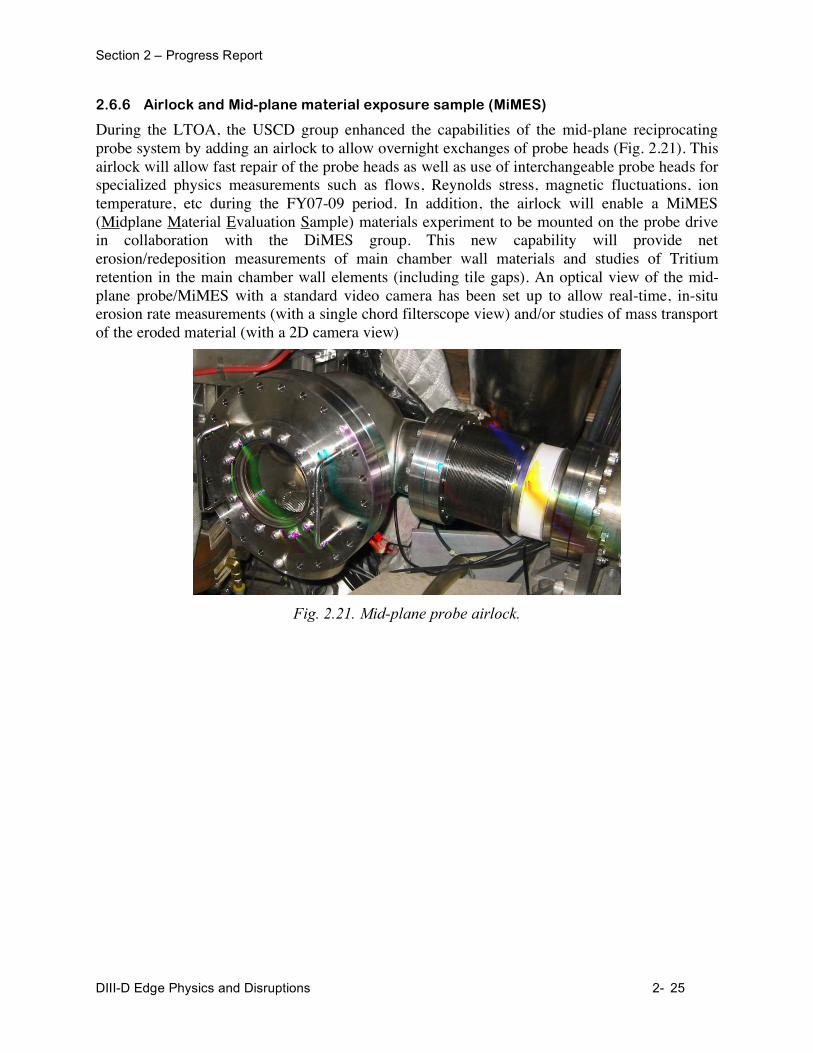
Section 2 – Progress Report
DIII-D Edge Physics and Disruptions 2- 25
2.6.6 Airlock and Mid-plane material exposure sample (MiMES)
During the LTOA, the USCD group enhanced the capabilities of the mid-plane reciprocating probe system by adding an airlock to allow overnight exchanges of probe heads (Fig. 2.21). This airlock will allow fast repair of the probe heads as well as use of interchangeable probe heads for specialized physics measurements such as flows, Reynolds stress, magnetic fluctuations, ion temperature, etc during the FY07-09 period. In addition, the airlock will enable a MiMES (Midplane Material Evaluation Sample) materials experiment to be mounted on the probe drive in collaboration with the DiMES group. This new capability will provide net erosion/redeposition measurements of main chamber wall materials and studies of Tritium retention in the main chamber wall elements (including tile gaps). An optical view of the mid-plane probe/MiMES with a standard video camera has been set up to allow real-time, in-situ erosion rate measurements (with a single chord filterscope view) and/or studies of mass transport of the eroded material (with a 2D camera view)
Fig. 2.21. Mid-plane probe airlock.
Related Documents