Video Games in the Cloud A disintermediated video game industry M15275IN2A – June 2015 – Report Synopsis Digital Entertainment This document is a part of our "Digital Entertainment" category which includes in 2015: - two datasets in Excel, - a state-of-the-art report in PowerPoint, - four market reports in Word, each with its synopsis in PowerPoint - Privileged access to our lead Media analysts

Welcome message from author
This document is posted to help you gain knowledge. Please leave a comment to let me know what you think about it! Share it to your friends and learn new things together.
Transcript
Video Games in the Cloud
A disintermediated video game industry
M15275IN2A – June 2015 – Report Synopsis
Digital Entertainment
This document is a part of our "Digital Entertainment" category which includes in 2015:
- two datasets in Excel,
- a state-of-the-art report in PowerPoint,
- four market reports in Word, each with its synopsis in PowerPoint
- Privileged access to our lead Media analysts

Copyright © IDATE 2015
I’m responsible for studies related to consumer electronics and video games industry
through changing uses, technology innovation, market analysis, business strategy, industrial
perspectives, forecasts and prospective issues.
2
Author: Laurent MICHAUD, Head of Consumer Electronics & Digital Entertainment Practice
I act as economic advisor for game companies and subcontractors working for video game industry.
I carry out techno-economic appraisals for innovation agencies and incubators on the issues of video gaming and multimedia content development.
I’m the originator of Game Summit, which takes place during the Digiworld Summit in November each year www.gamesummit.pro.
I hold a Master's degree in Economic and Financial Engineering.
Contents of the report Synopsis
Copyright © IDATE 2015
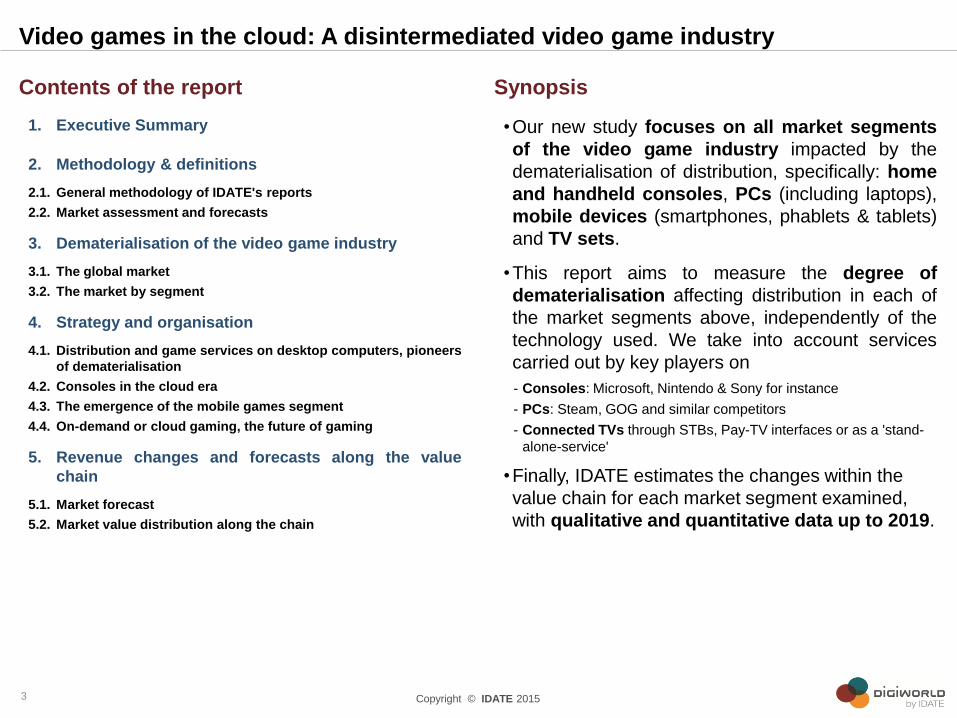
1. Executive Summary
2. Methodology & definitions
2.1. General methodology of IDATE's reports
2.2. Market assessment and forecasts
3. Dematerialisation of the video game industry
3.1. The global market
3.2. The market by segment
4. Strategy and organisation
4.1. Distribution and game services on desktop computers, pioneers
of dematerialisation
4.2. Consoles in the cloud era
4.3. The emergence of the mobile games segment
4.4. On-demand or cloud gaming, the future of gaming
5. Revenue changes and forecasts along the value
chain
5.1. Market forecast
5.2. Market value distribution along the chain
•Our new study focuses on all market segments
of the video game industry impacted by the
dematerialisation of distribution, specifically: home
and handheld consoles, PCs (including laptops),
mobile devices (smartphones, phablets & tablets)
and TV sets.
•This report aims to measure the degree of
dematerialisation affecting distribution in each of
the market segments above, independently of the
technology used. We take into account services
carried out by key players on
- Consoles: Microsoft, Nintendo & Sony for instance
- PCs: Steam, GOG and similar competitors
- Connected TVs through STBs, Pay-TV interfaces or as a 'stand-
alone-service'
•Finally, IDATE estimates the changes within the
value chain for each market segment examined,
with qualitative and quantitative data up to 2019.
Video games in the cloud: A disintermediated video game industry
3
Dematerialisation of the video game industry
A disintermediated video game industry
Copyright © IDATE 2015
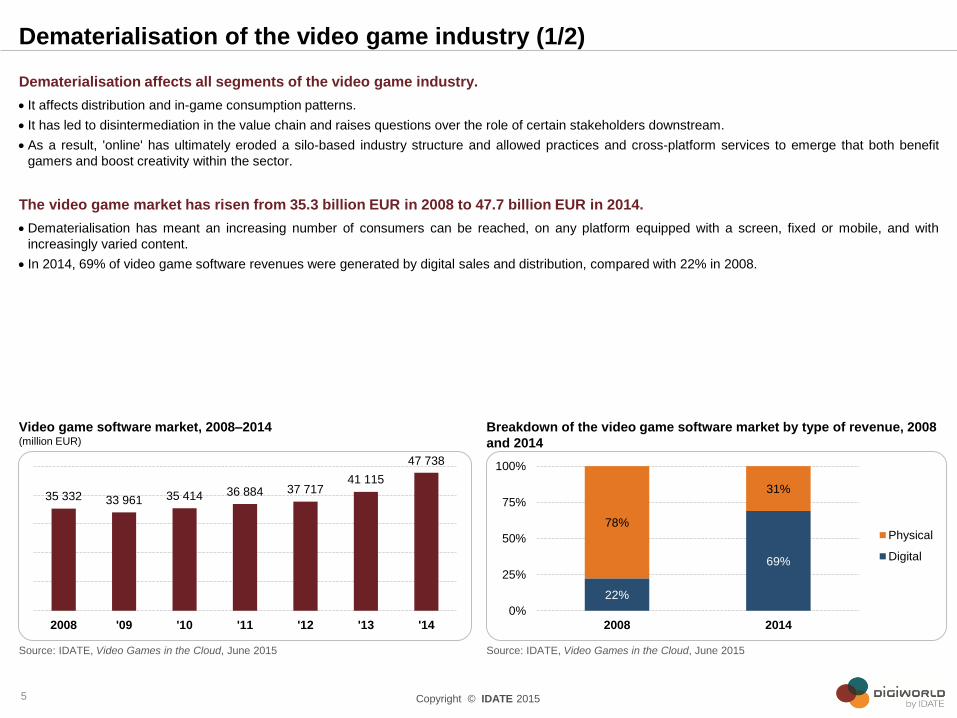
Dematerialisation affects all segments of the video game industry.
It affects distribution and in-game consumption patterns.
It has led to disintermediation in the value chain and raises questions over the role of certain stakeholders downstream.
As a result, 'online' has ultimately eroded a silo-based industry structure and allowed practices and cross-platform services to emerge that both benefit
gamers and boost creativity within the sector.
The video game market has risen from 35.3 billion EUR in 2008 to 47.7 billion EUR in 2014.
Dematerialisation has meant an increasing number of consumers can be reached, on any platform equipped with a screen, fixed or mobile, and with
increasingly varied content.
In 2014, 69% of video game software revenues were generated by digital sales and distribution, compared with 22% in 2008.
Source: IDATE, Video Games in the Cloud, June 2015
Breakdown of the video game software market by type of revenue, 2008
and 2014
Dematerialisation of the video game industry (1/2)
5
Source: IDATE, Video Games in the Cloud, June 2015
Video game software market, 2008–2014 (million EUR)
35 332 33 961 35 414 36 884 37 717 41 115
47 738
2008 '09 '10 '11 '12 '13 '14
22%
69%
78%
31%
0%
25%
50%
75%
100%
2008 2014
Physical
Digital
Copyright © IDATE 2015
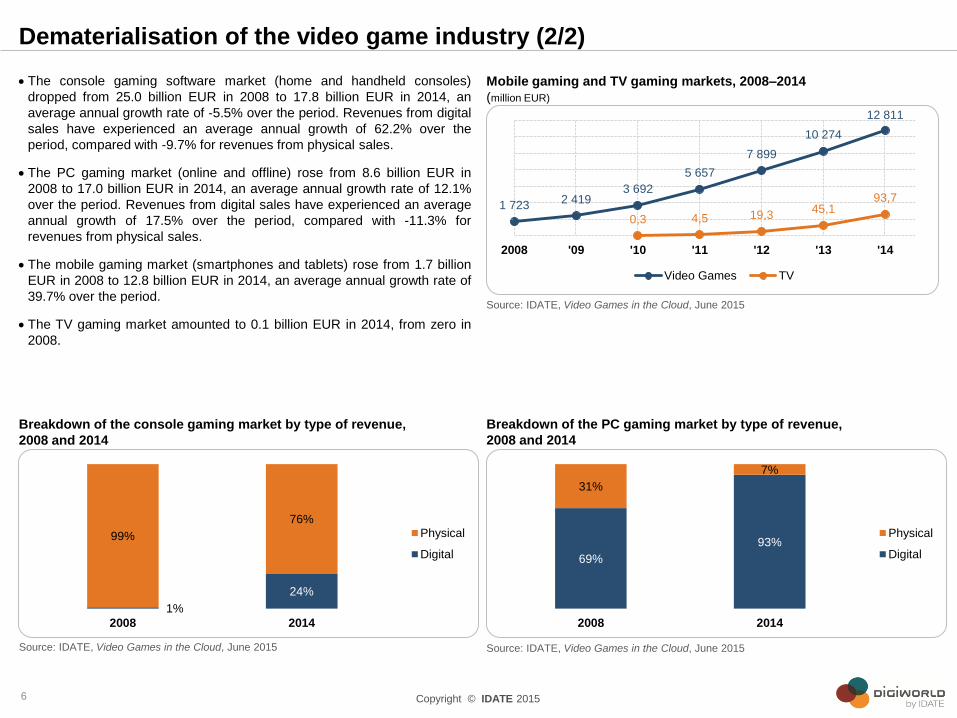
The console gaming software market (home and handheld consoles)
dropped from 25.0 billion EUR in 2008 to 17.8 billion EUR in 2014, an
average annual growth rate of -5.5% over the period. Revenues from digital
sales have experienced an average annual growth of 62.2% over the
period, compared with -9.7% for revenues from physical sales.
The PC gaming market (online and offline) rose from 8.6 billion EUR in
2008 to 17.0 billion EUR in 2014, an average annual growth rate of 12.1%
over the period. Revenues from digital sales have experienced an average
annual growth of 17.5% over the period, compared with -11.3% for
revenues from physical sales.
The mobile gaming market (smartphones and tablets) rose from 1.7 billion
EUR in 2008 to 12.8 billion EUR in 2014, an average annual growth rate of
39.7% over the period.
The TV gaming market amounted to 0.1 billion EUR in 2014, from zero in
2008.
Source: IDATE, Video Games in the Cloud, June 2015
Breakdown of the PC gaming market by type of revenue,
2008 and 2014
Dematerialisation of the video game industry (2/2)
6
Source: IDATE, Video Games in the Cloud, June 2015
Mobile gaming and TV gaming markets, 2008–2014
(million EUR)
Source: IDATE, Video Games in the Cloud, June 2015
Breakdown of the console gaming market by type of revenue,
2008 and 2014
1 723 2 419
3 692
5 657
7 899
10 274
12 811
0,3 4,5 19,3 45,1
93,7
0
500
0
2 000
4 000
6 000
8 000
10 000
12 000
14 000
2008 '09 '10 '11 '12 '13 '14
Video Games TV
1%
24%
99%
76%
2008 2014
Physical
Digital 69%
93%
31%
7%
2008 2014
Physical
Digital
Strategy and organisation
A disintermediated video game industry

Copyright © IDATE 2015
Dematerialisation and value displacement by market segment
Dematerialisation of video game market segments has moved value along the value chain and closer to players with a direct link to
their customers.
In the PC gaming segment, value creation seems to centre around digital retailers (Steam, GOG), aggregators (Big Fish Games), publishers (EA Origin,
NCSoft) and social networks.
In the mobile gaming segment, value creation seems to have moved towards app store owners (Apple, Android, Amazon).
On consoles, value creation is closer to the console manufacturers themselves.
On Smart TVs, anything is still possible between TV channels, the Internet giants and the proponents of a cross-platform ecosystem (e.g. Apple, Samsung,
LG, Sony).
Source: IDATE, Video Games in the Cloud, June 2015
Physical and digital PC gaming value chains
8
Copyright © IDATE 2015
PC gaming (1/3)
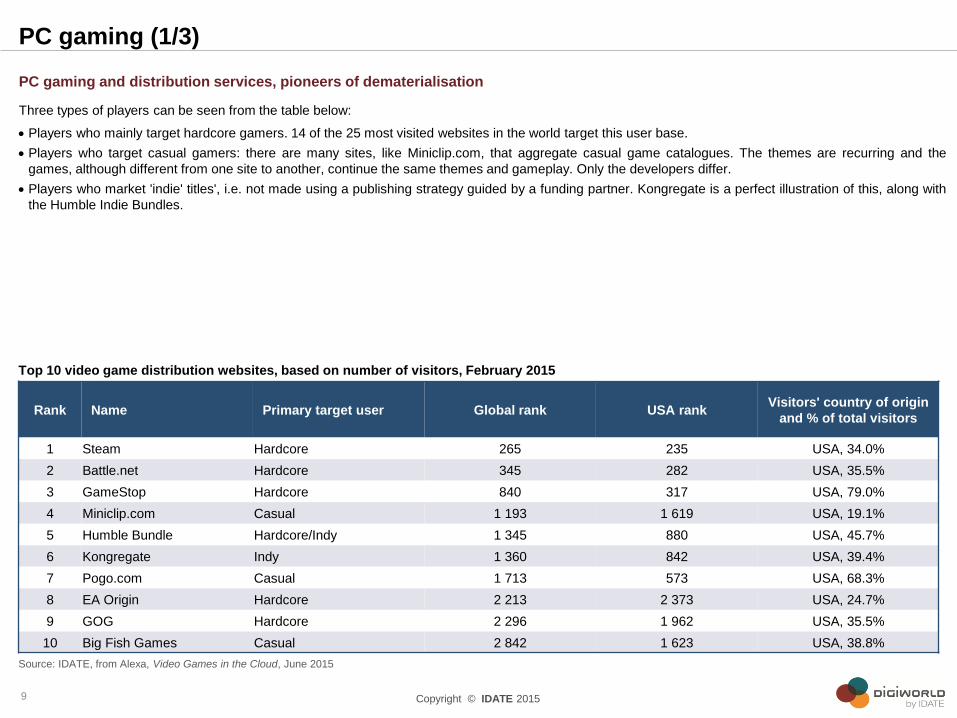
PC gaming and distribution services, pioneers of dematerialisation
Three types of players can be seen from the table below:
Players who mainly target hardcore gamers. 14 of the 25 most visited websites in the world target this user base.
Players who target casual gamers: there are many sites, like Miniclip.com, that aggregate casual game catalogues. The themes are recurring and the
games, although different from one site to another, continue the same themes and gameplay. Only the developers differ.
Players who market 'indie' titles', i.e. not made using a publishing strategy guided by a funding partner. Kongregate is a perfect illustration of this, along with
the Humble Indie Bundles.
Source: IDATE, from Alexa, Video Games in the Cloud, June 2015
Top 10 video game distribution websites, based on number of visitors, February 2015
Rank Name Primary target user Global rank USA rank Visitors' country of origin
and % of total visitors
1 Steam Hardcore 265 235 USA, 34.0%
2 Battle.net Hardcore 345 282 USA, 35.5%
3 GameStop Hardcore 840 317 USA, 79.0%
4 Miniclip.com Casual 1 193 1 619 USA, 19.1%
5 Humble Bundle Hardcore/Indy 1 345 880 USA, 45.7%
6 Kongregate Indy 1 360 842 USA, 39.4%
7 Pogo.com Casual 1 713 573 USA, 68.3%
8 EA Origin Hardcore 2 213 2 373 USA, 24.7%
9 GOG Hardcore 2 296 1 962 USA, 35.5%
10 Big Fish Games Casual 2 842 1 623 USA, 38.8%
9

Copyright © IDATE 2015
PC gaming (2/3)
Massively multiplayer gaming services
Massively multiplayer games (MM) are a very dynamic market segment. According to IDATE, revenues are estimated at nearly 8 billion EUR by late 2015,
45% of the online gaming segment, which itself is composed of social games (38% of online gaming revenue) and casual games (17% of online gaming
revenue).
The MM gaming market segment has seen three major changes in recent years.
- This segment has shifted significantly towards a Free-to-Play model over the last three years In the western hemisphere, World of Warcraft (Activision-
Blizzard) is essentially the only remaining MM game still to be based on a subscription.
- Most MM games use digital distribution. With its flagship title, even Blizzard has switched to this method of distribution.
- MM games have come to mobile platforms.
Asia occupies a unique place in the PC MMO landscape. Seven of the Top 10 games come from Chinese and South Korean companies. As a result, the
Chinese Web giant Tencent has become the world leader in the industry.
Breakdown of online video game revenues by type of game, 2015
Source: IDATE, Video Games in the Cloud, June 2015
12%
33%
17%
38%
Online… Premium Massively Multiplayer Free Massively Multiplayer Casual Social … Video Game Market
10
Copyright © IDATE 2015
PC gaming (3/3)
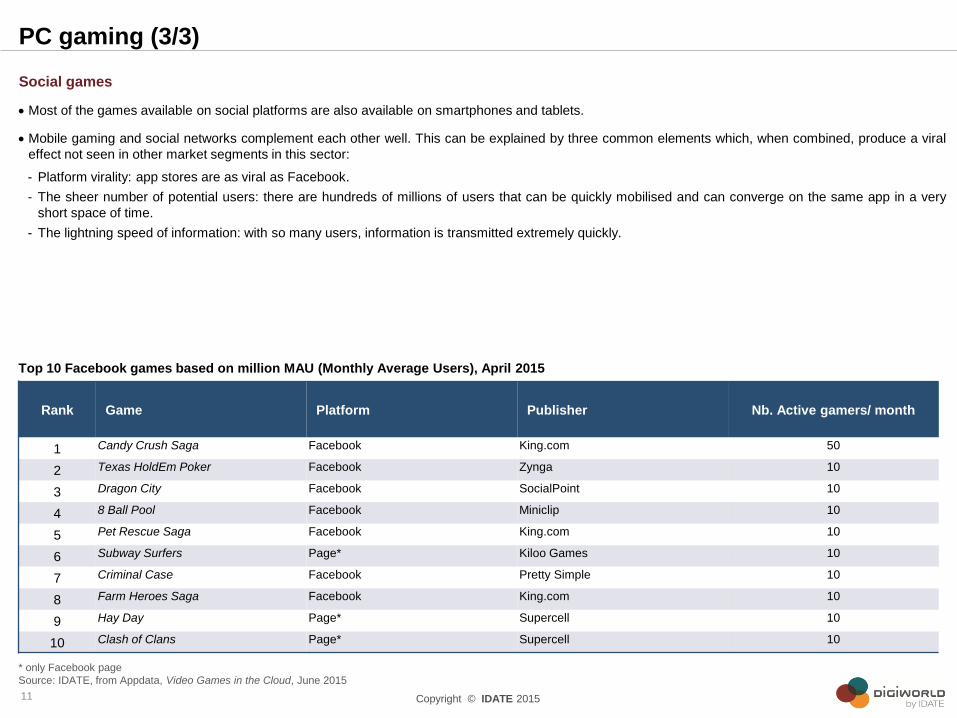
Social games
Most of the games available on social platforms are also available on smartphones and tablets.
Mobile gaming and social networks complement each other well. This can be explained by three common elements which, when combined, produce a viral
effect not seen in other market segments in this sector:
- Platform virality: app stores are as viral as Facebook.
- The sheer number of potential users: there are hundreds of millions of users that can be quickly mobilised and can converge on the same app in a very
short space of time.
- The lightning speed of information: with so many users, information is transmitted extremely quickly.
Top 10 Facebook games based on million MAU (Monthly Average Users), April 2015
* only Facebook page
Source: IDATE, from Appdata, Video Games in the Cloud, June 2015
Rank Game Platform Publisher Nb. Active gamers/ month
1 Candy Crush Saga Facebook King.com 50
2 Texas HoldEm Poker Facebook Zynga 10
3 Dragon City Facebook SocialPoint 10
4 8 Ball Pool Facebook Miniclip 10
5 Pet Rescue Saga Facebook King.com 10
6 Subway Surfers Page* Kiloo Games 10
7 Criminal Case Facebook Pretty Simple 10
8 Farm Heroes Saga Facebook King.com 10
9 Hay Day Page* Supercell 10
10 Clash of Clans Page* Supercell 10
11

Copyright © IDATE 2015
Console gaming
In terms of distribution
Most games sold for consoles are downloadable. Although Nintendo is still lagging behind on this front, Sony and Microsoft allow customers to download
their catalogue of AAA titles from their respective app stores, as well as indie titles.
In terms of consumption patterns:
Consoles are now 'social'. Console manufacturers learned what their gaming community wanted by looking at the success of social networks and games
publishers such as Zynga, King, Pretty Simple and EA. Their consoles are now equipped with sharing, trading and linking features.
The 8th console generation made the shift to dematerialisation by turning to the cloud for data storage and processing.
Using the cloud for storage provides a backup service of users' data and identity, user account management, etc.
Using the cloud for processing ensures optimal game performance and introduces a means of distributing content other than downloading or optical media
like Blu-ray.
Physical and digital console gaming value chains
Source: IDATE, Video Games in the Cloud, June 2015
12
Copyright © IDATE 2015
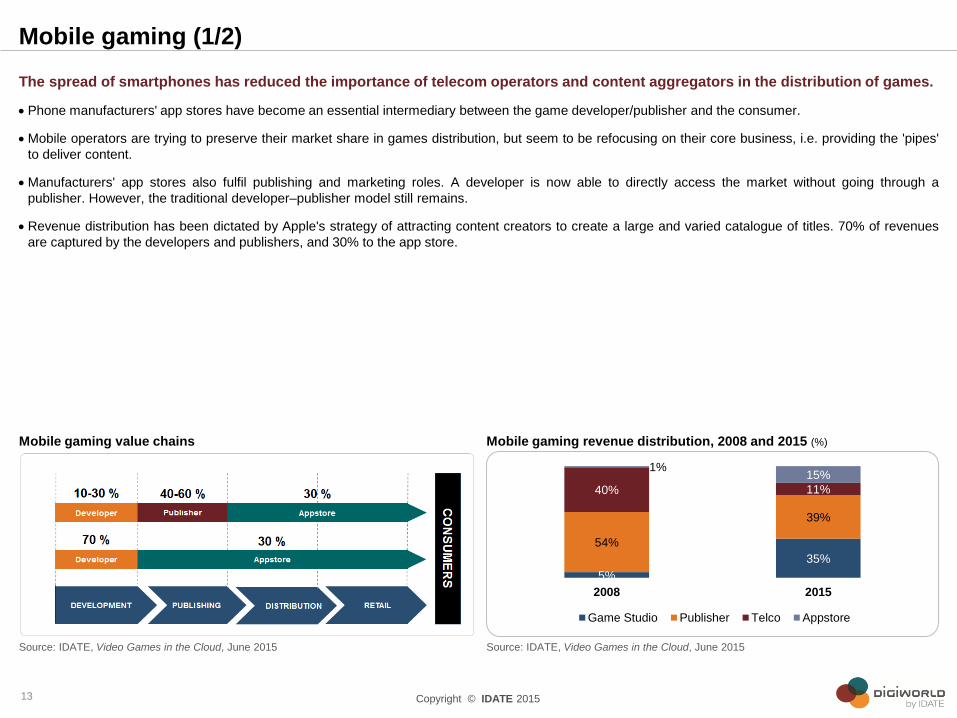
The spread of smartphones has reduced the importance of telecom operators and content aggregators in the distribution of games.
Phone manufacturers' app stores have become an essential intermediary between the game developer/publisher and the consumer.
Mobile operators are trying to preserve their market share in games distribution, but seem to be refocusing on their core business, i.e. providing the 'pipes'
to deliver content.
Manufacturers' app stores also fulfil publishing and marketing roles. A developer is now able to directly access the market without going through a
publisher. However, the traditional developer–publisher model still remains.
Revenue distribution has been dictated by Apple's strategy of attracting content creators to create a large and varied catalogue of titles. 70% of revenues
are captured by the developers and publishers, and 30% to the app store.
Source: IDATE, Video Games in the Cloud, June 2015
Mobile gaming revenue distribution, 2008 and 2015 (%)
Mobile gaming (1/2)
13
Source: IDATE, Video Games in the Cloud, June 2015
Mobile gaming value chains
5%
35%
54%
39%
40% 11%
1% 15%
2008 2015
Game Studio Publisher Telco Appstore
Copyright © IDATE 2015
Mobile gaming (2/2)
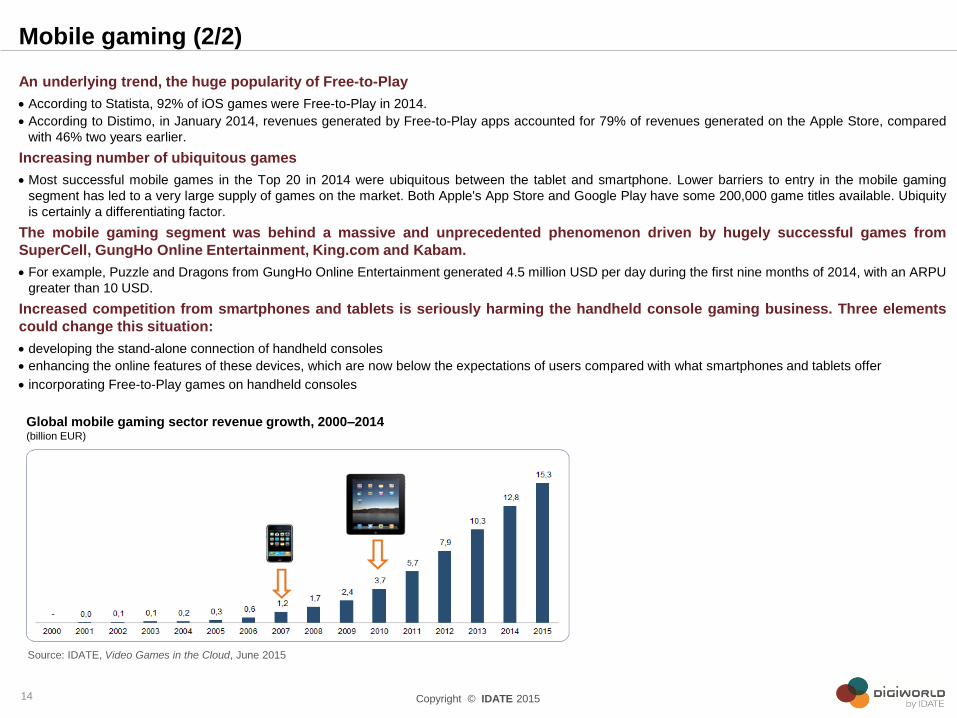
An underlying trend, the huge popularity of Free-to-Play
According to Statista, 92% of iOS games were Free-to-Play in 2014.
According to Distimo, in January 2014, revenues generated by Free-to-Play apps accounted for 79% of revenues generated on the Apple Store, compared
with 46% two years earlier.
Increasing number of ubiquitous games
Most successful mobile games in the Top 20 in 2014 were ubiquitous between the tablet and smartphone. Lower barriers to entry in the mobile gaming
segment has led to a very large supply of games on the market. Both Apple's App Store and Google Play have some 200,000 game titles available. Ubiquity
is certainly a differentiating factor.
The mobile gaming segment was behind a massive and unprecedented phenomenon driven by hugely successful games from
SuperCell, GungHo Online Entertainment, King.com and Kabam.
For example, Puzzle and Dragons from GungHo Online Entertainment generated 4.5 million USD per day during the first nine months of 2014, with an ARPU
greater than 10 USD.
Increased competition from smartphones and tablets is seriously harming the handheld console gaming business. Three elements
could change this situation:
developing the stand-alone connection of handheld consoles
enhancing the online features of these devices, which are now below the expectations of users compared with what smartphones and tablets offer
incorporating Free-to-Play games on handheld consoles
Global mobile gaming sector revenue growth, 2000–2014 (billion EUR)
Source: IDATE, Video Games in the Cloud, June 2015
14

Copyright © IDATE 2015
Internet service providers now offer video games through their set-top boxes. Their services fall into two categories:
Games downloaded onto the STB hard drive (IPTV Download). 40–60% of revenues are captured by the developer and publisher, and the rest goes to the
ISP.
Streaming games (IPTV Streaming). This is known as 'games on demand' or 'cloud gaming'. The game is hosted and stored on servers in the cloud. A
'Games on Demand Provider' (GoDP) is used as an intermediary. They are responsible for providing the software and hardware solution and putting
together a games catalogue, negotiated with publishers. The developer and the publisher capture 50% of the value, the GoDP 10–20% and the ISP 30–
40%.
The GoDP may also choose to offer an Over-The-Top cloud gaming service, meaning it can directly address users and bypass the
ISP managed service (OTT Streaming). Two scenarios are therefore possible:
The GoDP develops its own dedicated games console. This is what OnLive and G-Cluster have done.
The GoDP uses a connected device, such as a connected TV, existing games console, streaming box, etc.
Source: IDATE, Video Games in the Cloud, June 2015
The OTT video game value chain
Cloud gaming
15
Source: IDATE, Video Games in the Cloud, June 2015
The IPTV video game value chain
Copyright © IDATE 2015
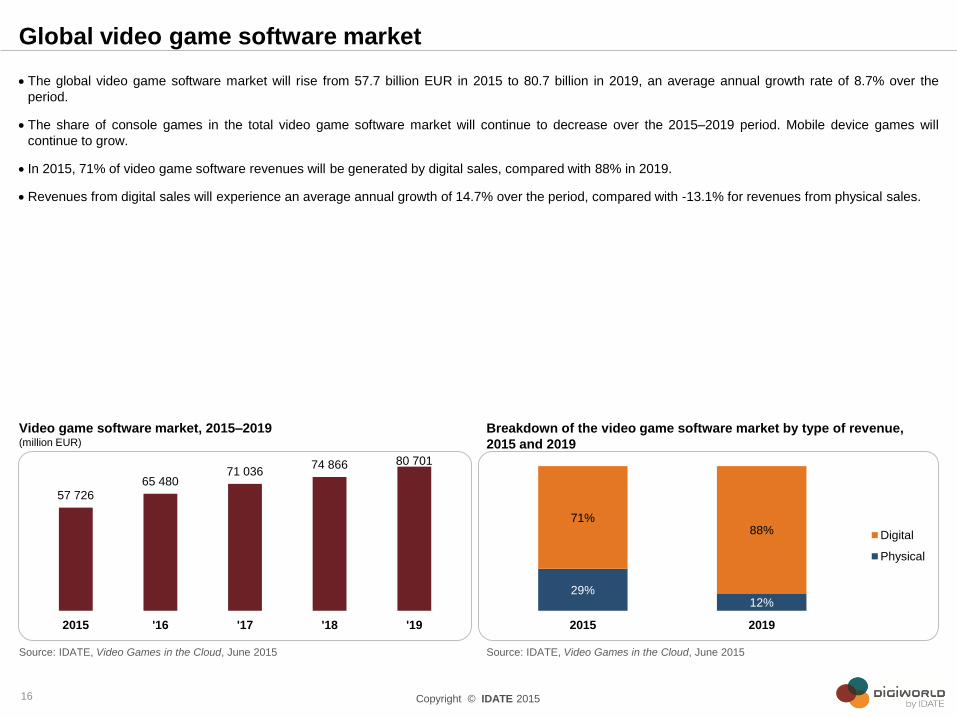
The global video game software market will rise from 57.7 billion EUR in 2015 to 80.7 billion in 2019, an average annual growth rate of 8.7% over the
period.
The share of console games in the total video game software market will continue to decrease over the 2015–2019 period. Mobile device games will
continue to grow.
In 2015, 71% of video game software revenues will be generated by digital sales, compared with 88% in 2019.
Revenues from digital sales will experience an average annual growth of 14.7% over the period, compared with -13.1% for revenues from physical sales.
Source: IDATE, Video Games in the Cloud, June 2015
Breakdown of the video game software market by type of revenue,
2015 and 2019
Global video game software market
16
Source: IDATE, Video Games in the Cloud, June 2015
Video game software market, 2015–2019 (million EUR)
57 726 65 480
71 036 74 866 80 701
2015 '16 '17 '18 '19
29% 12%
71% 88%
2015 2019
Digital
Physical

Copyright © IDATE 2015
From global video game market values, we can recreate revenues along the value chain year by year, from the developer and retailer to the various
intermediaries, according to the market segment.
With increasing rates of dematerialisation, which affects each link in the chain positively or negatively, we see that the benefits of this value redistribution
are felt higher up the chain, mainly by developers. Over the 2008–2019 period, this share will gain more than 20 points, from 5% to 26%.
The other link in the value chain to benefit from dematerialisation is retail sales. However, the players have changed. In 2008, retail sales consisted of
physical retailers. These days, although these same retailers have sometimes ridden the wave of dematerialisation by offering digital distribution (e.g.
Gamestop), the retail role is now dominated by digital distribution pure players, such as Apple, Amazon, Google and Steam.
Although the publishing link still captures the largest share of the sector's revenues over the period, retailers will catch up to it in terms of value and relative
share in 2019 as they increasingly benefit from the direct relationship with gamers/customers.
Publishers benefit from cyclical growth in the market, but their share of total revenues in the sector will gradually be reduced as developers take over more
publishing tasks.
Source: IDATE, Video Games in the Cloud, June 2015
Revenues earned by the various links in the video game market value
chain (%)
Impact of dematerialisation on value distribution
17
Source: IDATE, Video Games in the Cloud, June 2015
Revenues earned by the various links in the video game market value
chain (million EUR)
0
5 000
10 000
15 000
20 000
25 000
30 000
2008 '09 '10 '11 '12 '13 '14 '15 '16 '17 '18 '19
Developer Publisher Distributor
Retailer … revenue
0%
10%
20%
30%
40%
2008 '09 '10 '11 '12 '13 '14 '15 '16 '17 '18 '19
Developer Publisher Distributor
Retailer … revenue
Copyright © IDATE 2015
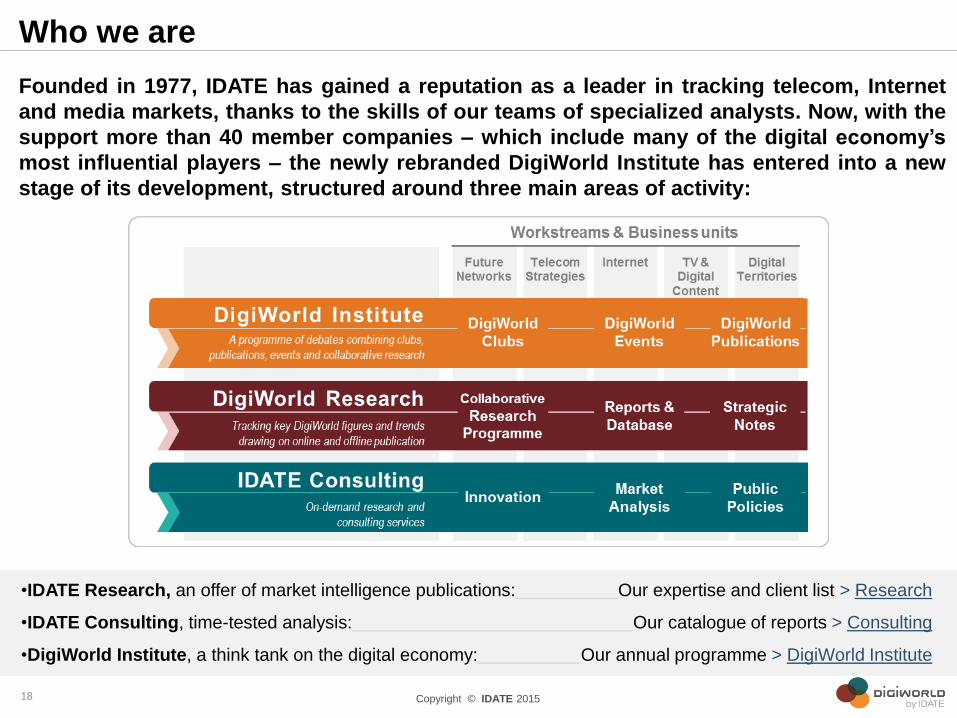
Who we are
Founded in 1977, IDATE has gained a reputation as a leader in tracking telecom, Internet
and media markets, thanks to the skills of our teams of specialized analysts. Now, with the
support more than 40 member companies – which include many of the digital economy’s
most influential players – the newly rebranded DigiWorld Institute has entered into a new
stage of its development, structured around three main areas of activity:
•IDATE Research, an offer of market intelligence publications: Our expertise and client list > Research
•IDATE Consulting, time-tested analysis: Our catalogue of reports > Consulting
•DigiWorld Institute, a think tank on the digital economy: Our annual programme > DigiWorld Institute
18
Related Documents