Walden University ScholarWorks Walden Dissertations and Doctoral Studies Walden Dissertations and Doctoral Studies Collection 2016 Digitally Immigrant Social Work Faculty: Technology Self-Efficacy and Practice Outcomes Ellen M. Belluomini Walden University Follow this and additional works at: hps://scholarworks.waldenu.edu/dissertations Part of the Social Work Commons is Dissertation is brought to you for free and open access by the Walden Dissertations and Doctoral Studies Collection at ScholarWorks. It has been accepted for inclusion in Walden Dissertations and Doctoral Studies by an authorized administrator of ScholarWorks. For more information, please contact [email protected].

Welcome message from author
This document is posted to help you gain knowledge. Please leave a comment to let me know what you think about it! Share it to your friends and learn new things together.
Transcript

Walden UniversityScholarWorks
Walden Dissertations and Doctoral Studies Walden Dissertations and Doctoral StudiesCollection
2016
Digitally Immigrant Social Work Faculty:Technology Self-Efficacy and Practice OutcomesEllen M. BelluominiWalden University
Follow this and additional works at: https://scholarworks.waldenu.edu/dissertations
Part of the Social Work Commons
This Dissertation is brought to you for free and open access by the Walden Dissertations and Doctoral Studies Collection at ScholarWorks. It has beenaccepted for inclusion in Walden Dissertations and Doctoral Studies by an authorized administrator of ScholarWorks. For more information, pleasecontact [email protected].

Walden University
College of Social and Behavioral Sciences
This is to certify that the doctoral dissertation by
Ellen Belluomini
has been found to be complete and satisfactory in all respects, and that any and all revisions required by the review committee have been made.
Review Committee Dr. Barbara Benoliel, Committee Chairperson, Human Services Faculty
Dr. Pamela Denning, Committee Member, Human Services Faculty Dr. Marie Caputi, University Reviewer, Human Services Faculty
Chief Academic Officer Eric Riedel, Ph.D.
Walden University 2016

Abstract
Digitally Immigrant Social Work Faculty: Technology Self-Efficacy and Practice
Outcomes
by
Ellen Belluomini
MA, University of Illinois, Chicago, 1993
BS, University of Wisconsin, LaCrosse, 1988
Dissertation Submitted in Partial Fulfillment
of the Requirements for the Degree of
Doctor of Philosophy
Human Services
Walden University
December 2016

Abstract
The problem addressed in this study was the lack of technology integration in social work
education to meet the needs of graduate social workers in the field. The bulk of research
focuses on the efficacy of online or blended learning but not on social work educators’
self efficacy in delivering technology literacy. This study explored whether social work
educators’ self efficacy is related to their using technology in curriculum and pedagogy.
Digital immigrant educators, defined as those over the age of thirty five, were chosen as
participants due to research identifying this group’s struggles in adjustment to technology
savvy younger students. The conceptual framework for this study was a synthesis of von
Bertalanffy’s general systems theory and Bandura’s self-efficacy to understand the
relationship between social work education and technology execution. For this concurrent
mixed methods grounded theory study, participants provided quantitative responses to the
Computer Technology Integration Survey on self-efficacy with additional questions
about technology integration in the classroom (n=396). Findings from the analysis
revealed a relationship between positive self-efficacy, the number of digital tools used in
the classroom, technology integration in pedagogy and curriculum, and teaching the
concept of a “digital divide” in class. The qualitative data from open ended questions
(n=260) and four individual interviews were analyzed using thematic content analysis.
Findings revealed themes related to inhibiting technology integration including; personal
motivation, time, and lack of institutional support. This study contributes to social change
by proposing a technology integration model for social work educators to used as an
innovative strategy for preparing future professionals in the practice of the social work.

Digitally Immigrant Social Work Faculty: Technology Self-Efficacy and Practice
Outcomes
by
Ellen Belluomini
MA, University of Illinois, Chicago, 1993
BS, University of Wisconsin, La Crosse, 1988
Dissertation Submitted in Partial Fulfillment
of the Requirements for the Degree of
Doctor of Philosophy
Human Services
Walden University
December 2016

Dedication
This dissertation is dedicated to my mother, Karen Holub, and daughter, Caitlin
Belluomini. My mother always strived to achieve higher education. She started with a
nursing degree, moving to a bachelor’s in nursing and a master’s in counseling. She was
the first member in her family to earn any degree. The example she set paved the way for
me to value education and pursue any endeavor I choose. She has been with me the entire
journey with unconditional love and support. Secondly, I dedicate this to my daughter
who taught me the meaning of love and opened my heart in ways I could not imagine.
My life and my purpose are woven with the threads created from raising this wonderful,
strong, intelligent, compassionate woman. She continues to educate me and push me
toward optimism and a passion for life lived. Lastly, I would like to acknowledge the
younger version of my father, the late Gary Holub. He believed in me when I needed him
the most, as father, protector, and champion. He is the reason I could begin my journey in
the field of social work. Because he was my knight at the exact right moment, I am a
social worker. I cannot express the deepness of my gratitude for the influence these
people gifted me with in my upbringing and adulthood.
I am grateful for so many people during my journey. Starting with my daughter’s
husband, Corey, and Travis, who are always there to be supportive and generous with
their time, strength, and love. My home support and prior wife Pat, and my step daughter
Olivia, who opens my heart even further, taught me about perseverance. They believed in
my journey and put up with the crazy schedules of working and studying. My brother,
Karl and friends Valerie, Julie, Mona, Amy, Jeff, Kathy, Melissa, and the many others

who taught me I must ask for help. Thank you Don and Karen for giving me help during
the times I could not see through the forest.
Acknowledgments
I gratefully acknowledge the faculty, Dr. Barbara Benoliel, Dr. Pamela Denning,
and Dr. Marie Caputi, whom without their support and guidance during these last
difficult years I might not have made it through the process. Walden University allowed
me to learn in an untraditional format enabling me to earn my PhD. Lastly, I would like
to acknowledge the countless experiences with the people whom social work has an
impact upon. Your stories and journeys are the source of my wisdom and inspiration.
Namaste (I honor your inner light) to you all.
i
Table of Contents
List of Tables ...................................................................................................................... vi
List of Figures ................................................................................................................... vii
Chapter 1: Introduction to the Study ................................................................................... 1
Background .................................................................................................................... 1
Problem Statement..………………………………………………………………..….5
Purpose Statement ......................................................................................................... 5
Conceptual Framework .................................................................................................. 6
Research Questions ........................................................................................................ 7
Quantitative Research Questions………………………………………………….7
Qualitative Research Questions ……………………………………………...…...8
Nature of the Study ........................................................................................................ 9
Definitions ................................................................................................................... 11
Assumptions ................................................................................................................ 12
Scope and Delimitations .............................................................................................. 12
Limitations ................................................................................................................... 12
Significance ................................................................................................................. 13
Summary ...................................................................................................................... 14
Chapter 2: Literature Review ............................................................................................. 15
Introduction .................................................................................................................. 15
Literature Search Strategy ........................................................................................... 16
Theoretical/Conceptual Framework ............................................................................ 17

ii
General Systems Theory ........................................................................................ 17
Self-Efficacy .......................................................................................................... 19
Literature Review Related to Key Variables and Concepts ........................................ 21
Digital Divide ........................................................................................................ 21
Digital Immigrants, Digital Natives, and Digital Citizens in Higher Education ... 23
Technology Research in Learning Environments .................................................. 27
Social Work Education’s Approach to Technology .............................................. 29
Implications for Integrating Technological Solutions in the Social Work Profession 35
Chapter 3: Research Method ............................................................................................. 40
Introduction .................................................................................................................. 40
Research Design and Rationale ................................................................................... 41
Research Questions ...................................................................................................... 43
Quantitative Research Questions ........................................................................... 43
Qualitative Research Questions ............................................................................. 44
Mixed Methods Design ................................................................................................ 44
Data Collection and Analysis ...................................................................................... 46
Role of the Researcher ................................................................................................. 47
Methodology ................................................................................................................ 48
Selection of Participants ........................................................................................ 49
Sample Size ........................................................................................................... 50
Instrumentation ............................................................................................................ 51
Quantitative Self-Efficacy Constructs ................................................................... 51

iii
Qualitative Components ........................................................................................ 52
Quantitative Components ...................................................................................... 52
Recruitment, Participation, and Data Collection ......................................................... 55
Qualitative Components ........................................................................................ 55
Quantitative Components ...................................................................................... 56
Data Analysis ............................................................................................................... 57
Quantitative Plan ................................................................................................... 57
Qualitative Plan ..................................................................................................... 60
Integration of Qualitative and Quantitative Data ................................................... 61
Ethical Procedures ....................................................................................................... 63
Summary ...................................................................................................................... 64
Chapter 4: Results .............................................................................................................. 65
Introduction .................................................................................................................. 65
Organization of Chapter 4 ........................................................................................... 66
Demographics .............................................................................................................. 66
Data Collection ............................................................................................................ 68
Variations in Data Collection ...................................................................................... 68
Data Analysis ............................................................................................................... 70
Factor Analysis of Survey Responses .................................................................... 70
Age and CTI Self-Efficacy .................................................................................... 70
Assumptions of Multiple Linear Regression ............................................................... 71
Research Questions ...................................................................................................... 72
iv
CTI Self-Efficacy and Technology Used in Instruction Methods ......................... 72
Relationship between CTI Self-Efficacy and Digital Options Instruction With
Students...................................................................................................... 74
CTI Self-Efficacy and Ability to Address Digital Divide With Students ............. 76
Qualitative Results ................................................................................................. 78
Process of Data Coding ......................................................................................... 79
Self-Identification of CTI Efficacy in Curriculum Development and
Pedagogy .................................................................................................... 81
Evidence of Trustworthiness ....................................................................................... 90
Adjustment of Data Analysis ....................................................................................... 91
Summary ...................................................................................................................... 92
Chapter 5: Discussion, Conclusions, and Recommendations ............................................ 93
Introduction .................................................................................................................. 93
Interpretation of the Findings ...................................................................................... 93
Limitations of the Study ............................................................................................ 101
Recommendations for Further Study ......................................................................... 103
Implications ............................................................................................................... 104
Conclusion ................................................................................................................. 105
References ........................................................................................................................ 107
Appendix A: Letter of Permission ................................................................................... 140
Appendix B: Computer Technology Integration Survey ................................................. 142
Appendix C: Letter to Directors of Social Work Programs ............................................ 154

v
Appendix E: MLR Output Q17 ....................................................................................... 157
Appendix F: MLR Output Q17........................................................................................ 159

vi
List of Tables
Data Analysis Matrix ............................................................................................................. 59
Completion of Survey by Age ............................................................................................... 67
Efficacy Factor Score Statistics ............................................................................................. 70
Independent Samples tTest for Equality of Mean Efficacy Factor Score by Age Group ...... 71
Coefficients of Digital Tools Used ........................................................................................ 73
Q41 Comment Frequency ...................................................................................................... 80
Q4 Current Age ...................................................................................................................... 81
Top 9 Frequencies of Open Coding of Q40 ........................................................................... 83
Identified Components of SWIM-T ..................................................................................... 100

vii
List of Figures
Figure 1. Technology acceptance model ........................................................................... 97
Figure 2. Social work integration model for technology (SWIM-T) ................................ 99
Figure 3. TAM overlay with SWIM-T ............................................................................ 100
1
Chapter 1: Introduction to the Study
Background
Advancing technologies affect the social, economic, and political fabric of
people’s lives in many ways. Innovation can further society’s goals, but it also leaves
certain sections of society behind. Over 45 years ago, economists Vatter and Will (1967)
recognized the importance advancing technologies would play with society’s ability to
alleviate poverty. A significant theme of the advancement of technology in their forecast
focused on the potential for an adverse impact of innovation on vulnerable populations.
This prediction about a technological divide accurately portrays the widening
divide between socioeconomic statuses in the 21st century (Hick, 2006; Kuilema, 2012;
Miller, Bunch-Harrison, Brumbaugh, Kutty, & FitzGerald, 2005; Wei & Hindman, 2011;
Zhang & Gutierrez, 2007). Since 1979, income inequity for those between the bottom
20% and the top 1% increased by 152% after taxes (Stone, Trisi, Sherman, & DeBot,
2014). The inequality created by technological gains in society needs to be addressed for
vulnerable populations by professionals to minimize the impact and advocate for change
(Kuilema, 2012; Watling, 2012). The social work profession is one discipline where
technological solutions for vulnerable populations can make a difference.
Social workers empower their client populations through an ethical code
addressing the well-being and empowerment of individuals (National Association of
Social Workers [NASW], 2005). The NASW and the Association of Social Work Boards
expanded this ethical code to include technology by creating specific standards of
practice in 2005. While the adoption of these standards is a positive step forward for the

2
human services professions, the standards lack specificity to practice guidelines and
instead reflect a conceptual approach (Mattison, 2012).
These first technology standards developed in the context of a generalist human
service practice, yet they have not been updated in 10 years (American Counseling
Association, 2011; American School Counselors Association, 2010; International
Association of Counseling Services, 2010; NAADAC, the Association for Addiction
Professionals, 2011; National Organization for Human Services, 1996). NASW started
the revision of the technological standards for future release in 2014. The failure to
consistently revise the professional technology standards by the social worker profession
exhibits a discrepancy in understanding the risks and benefits of technological
innovation, particularly since technology is advancing at such a rapid pace, warranting
consistent updating and revision.
The social work profession’s mission encompasses the value of fundamental
human rights of vulnerable and marginalized populations (NASW Delegate Assembly,
2008). Disparity and inequity in society is increasing, in part, due to the resource gap
created by technological advances (Kuilema, 2012; Wei & Hindman, 2011). The age,
ethnicity, and income of broadband users show significant disparities.
Pew Research’s Internet Project (2013) reported that half of adults 45 years old or
older do not have home broadband access (as cited in Zickuhr & Smith, 2013). Across
the board, ethnicity is a factor in the ability to connect to broadband at home. Data on
lack of a broadband connection among White (34%), Black (51%), and Hispanic (49%)
backgrounds revealed this to be a significant variant (as cited in Zickuhr & Smith, 2013).

3
Adults with incomes less than $30,000 reported a similar inequity with 46% of
low income households reporting no broadband connection in their home (as cited in
Zickuhr & Smith, 2013). These discrepancies in Internet access marginalize vulnerable
populations on an economic, social, and political basis, and yet practicing social workers
appear not to understand how barriers to technological access and processes impact the
lives of their clients (Mishna, Bogo, Root, Sawyer, & Khoury-Kassabri, 2012; Steyaert &
Gould, 2009; Strom-Gottfried, Thomas, & Anderson 2014; Watling, 2012).
Several reasons exist why the social work profession may be hesitant to increase
its reliance on technology in practice. One significant barrier to increasing social work
practitioners’ technological integration in their practices is the controversy over the
ethical dilemmas technological integration might create and the lack of direction from
accrediting bodies (Mattison, 2012; Strom-Gottfried et al., 2014; Thomas, & Anderson,
2014). The discourse about technology integration in social work practice and education
centered on the ethics and efficacy of digital solutions, yet researchers (Gelman &
Tosone, 2010; Harris & Birnbaum, 2014; Strom-Gottfried et al., 2014; Watling &
Crawford, 2010) reported that in general, social workers hesitated in embracing new
technologies. The movement in social work practice toward increasing integration of and
reliance on technological options to empower social work client populations can only
occur through education and research of students and professionals (Social Work Policy
Institution, 2013; Strom-Gottfried et al., 2014).
The Council on Social Work Education (CSWE) is the accrediting body for social
work educational programs in the United States. CSWE uses a competency-based
4
educational standard, requiring accredited programs to illustrate how social work students
gain competency in practice behaviors described in the CSWE Educational Policy and
Accreditation Standards (EPAS). Technology standards increased in the most recent
EPAS compared to prior years, with social work educational programs now being
required to interpret and implement technology into their curriculum in both their implicit
and explicit pedagogy (CSWE, 2015).
The 2015 CSWE EPAS included technology use in ethical and practice standards
(CSWE, 2015). For instance, institutions offering social work education must include
technology in context of “new knowledge, technology, and ideas that may have a bearing
on contemporary and future social work education, practice, and research” (CSWE, 2015,
p. 8). The social work discipline, both as a profession or educational system, is in the
early stages of addressing the impact of potential technological advancements on practice
(Lea & Callaghan, 2011; Mishna et al., 2012; Steyaert & Gould, 2009).
The development and uses of technology transcends culture and politics.
Evidence from researchers has supported the need for technology access and literacy of
all populations (Garrido, Sullivan, & Gordon, 2012). Economists have predicted a
negative economic impact on society if technology illiteracy continues (Tüzemen &
Willis, 2013). A deliberate technology agenda in social work education could begin to
address the inequities and barriers that inhibit vulnerable and marginalized populations
from integrating technology and technological innovations into key areas of their lives
(Garrido et al., 2012).

5
Problem Statement
Social work education cannot afford to lag behind in technology integration if the
profession’s mission is to be upheld. The rate of accelerating technological innovation in
society affects social, health, economic, and political outcomes in people’s lives (Allenby
& Sarewitz, 2011; De Marco, Robles, & Antino, 2014; Geana & Greiner, 2011; Sipior,
Ward, & Connolly, 2013). This rate of change in technological advances affects
vulnerable and marginalized populations negatively through relationships, physical
health, and economic inequality when these populations are not keeping pace with
technological innovation and advances (Hick, 2006; Kuilema, 2012; Miller, Bunch-
Harrison, Brumbaugh, Kutty, & FitzGerald, 2005; Wei & Hindman, 2011; Watling &
Crawford, 2010; Zhang & Gutierrez, 2007).
A major component of the social work profession’s mission is to address social
injustice and inequality, but I have not found evidence in the literature for direction in
how to include technological themes in social work education (Watling, 2012).
Technology innovation within society, but without integration into social work education
is a significant problem facing the profession.
Purpose Statement
Technological innovations permeate every system of society and affect each
individual in the United States in a range of ways. Each level of technological integration
brings with it an opportunity for inclusion or exclusion of resources for social work’s
client populations. Examples of exclusion can include lack of technology skills for
employment, isolation from family and friends who use technology, technology

6
generation gaps placing children at risk, reduction in economic representation in big data
for product development and sales, or an inability to connect with online resources and
discounted products.
There is an absence of social work educators in consolidating efforts to include
technological solutions in curriculum, pedagogical approaches, and practice strategies
(Ahmedani, Harold, Fitton, & Shifflet-Gibson, 2011; Hill & Ferguson, 2014; Watling,
2012). Social work educators do not consistently include technological practices as a
component of implicit and explicit curriculum in social work education (Quinn & Barth,
2014). Institutions of higher education continue to instruct in Industrial Age methods
instead of progressing to the Information Age (Aslan & Reigeluth, 2012). In my review
of the literature research, focusing social work educators’ efforts to address technological
implications in practice strategies, curriculum, or advocacy for digital equality with social
work students was largely absent from the literature. This study survey’s the self-efficacy
and practice behaviors of digitally immigrant social work educators (DISWE). A digital
immigrant refers to people who grew up without computers and internet access (Prensky,
2001a).
Conceptual Framework
One underlying framework used by social work education is general systems
theory (GST), particularly the contributions by von Bertalanffy (1968) and
Bronfenbrenner (1976, 1979). Von Bertalanffy (1968) defined GST as all components
together being greater than each individual component (p. 18). GST provides the

7
framework for exploring the relationship between DISWE and technology integration in
social work education and practice.
In a society where technology progresses at an accelerated rate, the examination
of social work practice competencies could determine the efficacy of the social work
education system as a whole (von Bertalanffy, 1968; Watling, 2012). Self-efficacy theory
tenets offer a way to recognize DISWE beliefs about their competency integrating
technological resources. Bandura (1977) defined self-efficacy as “a person’s awareness
of their knowledge” and mastery experience as “one where individuals defined their
experience in terms of ability” (Bandura, 1986, p. 194).
Self-efficacy of technology integration is a prime indicator of whether instructors
will integrate digital solutions in pedagogy and curriculum (Aydin & Boz, 2010).
Efficacy questions identified the DISWE level of computer technology integration (CTI)
in their pedagogical approach. In the exploration of curriculum development, I examined
(a) their level of self-efficacy in mastering technological innovations and (b) their belief
that behaviors in relation to technology use can transform social work client systems.
Research Questions
This study’s research questions were developed to combine technology self-
efficacy and technology behaviors involved in social work pedagogy. The qualitative and
quantitative research questions guided this mixed methods study.
Quantitative Research Questions
RQ1: What is the relationship between CTI self-efficacy of DISWE and the
number of technologies used in instruction methods?
8
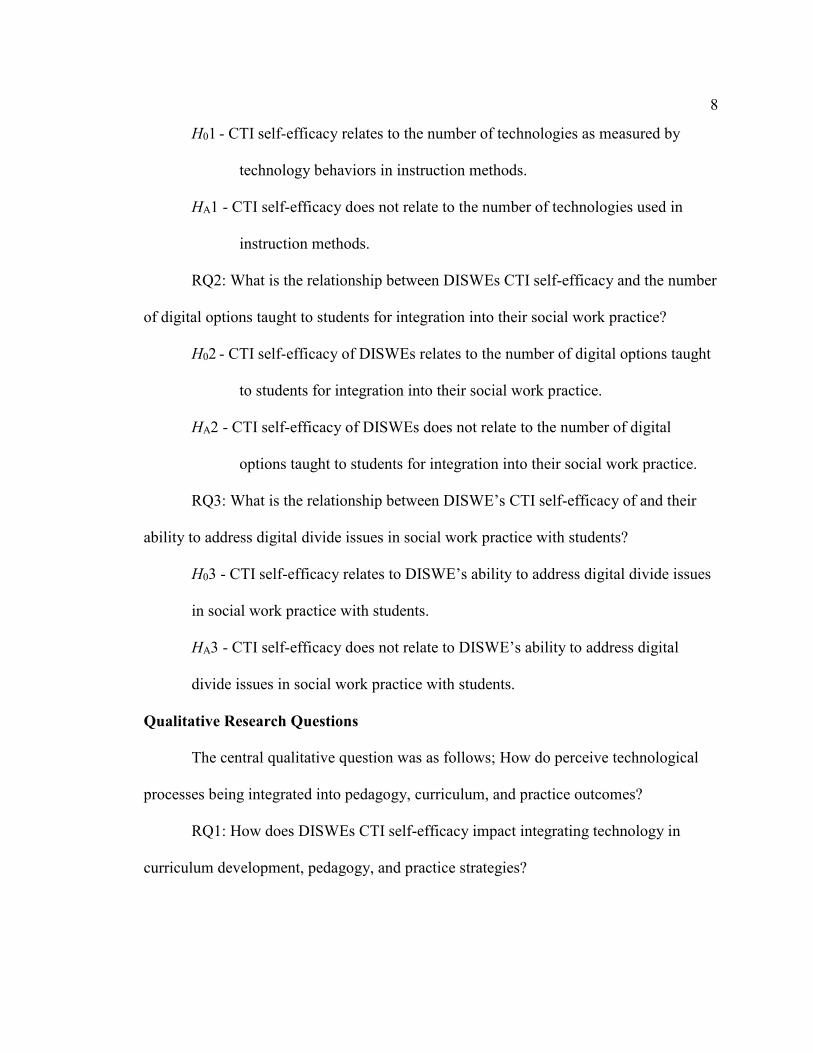
H01 - CTI self-efficacy relates to the number of technologies as measured by
technology behaviors in instruction methods.
HA1 - CTI self-efficacy does not relate to the number of technologies used in
instruction methods.
RQ2: What is the relationship between DISWEs CTI self-efficacy and the number
of digital options taught to students for integration into their social work practice?
H02 - CTI self-efficacy of DISWEs relates to the number of digital options taught
to students for integration into their social work practice.
HA2 - CTI self-efficacy of DISWEs does not relate to the number of digital
options taught to students for integration into their social work practice.
RQ3: What is the relationship between DISWE’s CTI self-efficacy of and their
ability to address digital divide issues in social work practice with students?
H03 - CTI self-efficacy relates to DISWE’s ability to address digital divide issues
in social work practice with students.
HA3 - CTI self-efficacy does not relate to DISWE’s ability to address digital
divide issues in social work practice with students.
Qualitative Research Questions
The central qualitative question was as follows; How do perceive technological
processes being integrated into pedagogy, curriculum, and practice outcomes?
RQ1: How does DISWEs CTI self-efficacy impact integrating technology in
curriculum development, pedagogy, and practice strategies?
9
RQ2: How does DISWEs CTI self-efficacy impact instruction of technological
resources for social work systems experiencing digital inequities?
Nature of the Study
The structure of this research was a mixed methods grounded study design
(Glaser & Strauss, 1967). Using the Charmaz’s (2006) constructivist grounded theory, I
explored DISWE self-efficacy with technology in the classroom and their integration of
technological solutions, addressing the concept of digital divide in social work courses.
The quantitative portion of this study included a closed-ended survey to measure self-
efficacy of DISWE in technology integration.
Additionally, I used the Wang, Ertmer, and Newby’s (2004) CTI survey as a self-
efficacy measure. I applied knowledge of the issues a digital divide in systems represents
in the exploration of the DISWE connection to their self-efficacy beliefs. After data
analysis, a model of understanding was the result in illustrating future avenues for
technology integration in social work education. Constructivist grounded theory provides
an opportunity to examine the experiences and relationships of DISWE as they explore
the meaning of technology development and execution (Charmaz, 2006). Representative
populations of social work faculty members who qualify as digital immigrants comprised
the sample for this study (Englander, 2012).
The participant sample was derived from approximately 88% or 5,190 full-time
DISWEs teaching at universities offering CSWE accredited social work degrees in the
United States (CSWE, 2012). The definition of digital immigrant status was any faculty
members born before 1985 (Prensky, 2001). Faculty member’s identification occurred

10
through a CSWE purchased database of social work educators who are members of
CSWE. The survey format is a convergent design model to explore qualitative and
quantitative portions of the survey simultaneously (Palinkas et al., 2011). I embedded
data with the results from the quantitative part to provide a complementary evaluation
with the qualitative portion (Palinkas et al., 2011). The results from each set of data
collection were used to explore hypothesis validity (Creswell, 2015).
This study involved a quantitative survey and one purposeful, qualitative
snowball sampling of four DISWE who volunteered to participate in a face-to-face
interview. Wang et al. (2004) developed the CTI survey to evaluate the self-efficacy of
teachers’ integration of technology in education. Additional survey questions about
specific technology integration behaviors provided a complementary evaluation.
Participants received three contacts for the initial survey consisting of an email
introducing the technology in social work practice self-efficacy survey (with a link to the
survey) and questions about technology integration in their curriculum.
In the qualitative interview, I explored the technology behaviors of four DISWE
who participated in answering the initial survey. The purpose of these interviews was to
provide a depth of understanding into strengths of and barriers to technology integration
experienced by DISWE. Through snowball sampling among social work educators
volunteering for interviews in the quantitative survey, I selected four DISWE for
additional evaluation. The qualitative portion of the study included three contacts with
study participants consisting of an introductory contact, a primary interview, and a follow
up face-to-face or Skype interview for data verification (Englander, 2012). The

11
interviews were completed at the office of the DISWE university or through a Skype
interview.
Definitions
The following section provides definitions of terms used in this study specific to
technology and social work practice.
Digital citizen: The definition of digital citizenship evolved to include the
normative values society uses for appropriate activities in their technology behavior
(Ribble & Baily, 2007, Chapter 1, para 4).
Digital divide: Watling (2012) redefined this term as an exclusionary
phenomenon where advancement of technology practices result in social, economic, and
educational disparities. The inequality of populations experiencing digital exclusion
results in a widening gap of resource distribution and oppression.
Digital immigrant: Prensky (2001a) first used this term to describe a person born
before 1980 who did not have access to the Internet or computers while growing up.
Digital literacy: Littlejohn, Beetham, and Mcgill (2012, p. 547) described the
technological critical thinking skills needed for advancement as new types of digital
formats evolve in society.
Digital native: Prensky (2001a) first described digital natives as persons born
after 1980 who had access to the Internet and computers while growing up. These people
are native speakers of technology.
Social media: Robins and Singer (2014, p. 387) identified technological advances
providing communication and information over the Internet to encompass social media.

12
Technology: Rogers (2003) described technology as a problem, solution,
outcome, or design providing acceptable stability in projected results. Each technology
consists of hardware and a software component to the relationship connecting the tool
and how the tool is used (Rogers, 2003, Location 529).
Assumptions
The basis for assumptions was participation of knowledgeable social workers and
their correct interpretation of the DISWE online survey. The self-efficacy constructs were
accurate measures of the technology beliefs in social work education. The data collected
from the quantitative portion support the qualitative inquiry. The participants responded
to the quantitative and qualitative questions to the best of their ability and from their
world view.
Scope and Delimitations
This study’s participant base consists of full-time DISWE born after 1985 from
CSWE accredited schools of social work (Prensky, 2001). The faculty sample was from
both bachelor’s and master’s level of social work educational programs. The
generalization of the findings from the sample determined the number of responses and
their relationship to the effect size criteria (Creswell & Clark, 2013).
Limitations
Several limitations may have affected the outcome of this study. This mixed
methods research required a particular effect size for the quantitative research portion. An
online questionnaire may have affected obtaining this effect size with the intended
population. Due to the technological nature of distribution, DISWF with email aversion
13
or distrust of online questionnaires may have hesitated to participate. Addressing email
avoidance was accomplished through engagement of social work program directors/deans
to encourage survey completion in faculty meetings.
I diffused distrust of online data sharing by using a familiar software
questionnaire program validated by higher education faculty. Qualtrics software, instead
of Survey Monkey, was the questionnaire for this purpose. Timing of the survey may
have affected the response rate since educator responsibilities vary at specific times of the
semester. The survey distribution occurred in the month of April to maximize
participation by reducing stress of beginning and ending courses.
Significance
In this study, I explored ways in which the self-efficacy of DISWE affected the
inclusion of technology in pedagogy for practice. Watling (2012) expanded the definition
of the term digital divide to include a critical analysis of exclusive digital practices in
society practices (p.127). The inclusion of this exclusivity analysis addressed the multiple
layers of disempowerment and marginalization occurring with each new digital practice.
Technology relevant curriculum prepared social workers for a creation of solutions,
addressing the digital oppression of their client populations. DISWE aware of their role in
changing the exclusivity of technology would work towards social change providing
curriculum addressing the levels of technology-created inequality.
The training of social workers through explicit and implicit technological
curriculum addresses the ethical mandate of the profession to practice with competence
and to advocate social justice (NASW Delegate Assembly, 2008). Digital exclusion
14
remains a critical problem, increasing the divide of socioeconomic status (Watling,
2012). Social workers practicing digital competencies can address the need of technology
inclusion policies and procedures for vulnerable and marginalized populations.
As CSWE’s (2015) introduction of new standards for technology integration in
social work education becomes operational, social work educators need to evaluate their
pedagogical content of instruction. The awareness of self-efficacy and implementation of
technology-based practices provide a framework for social work leaders to address
integration within their departments.
Summary
In this chapter, I discussed the background of why there needs to be significant
attention to research about the technology integration in social work education by
digitally immigrant faculty. Information in Chapter 2 provides a review of literature to
understand the theoretical framework and constructs associated with technology, society,
education, and social work. The third chapter encompasses the methodology used to
inform each hypothesis and research question. Chapter 4 includes a presentation of the
findings from the study with applicable supporting data. The fifth chapter’s findings
include an interpretation of the results integrating literature and theoretical frameworks
used for analysis. The dissertation ends with how these findings inform social change in
the education of social workers and recommendations for future research.

15
Chapter 2: Literature Review
Introduction
Chapter 1 provided an overview of this study’s purpose to develop a model
grounded in the data of how digital immigrants, teaching in MSW programs, integrate
technology into their pedagogy and curriculum for ethical practice. The basis of this
literature review is on the underpinnings of social work education’s relationship with
technology and the potential issues inadequate integration into curriculum poses for
social work populations.
This chapter has three sections. The first involves the strategy used for the
literature review. The second includes the theoretical framework for the study. The
relationship between von Bertalanffy’s (1968) GST and Bandura’s (1977) self-efficacy
principles connects the ability of social work education to integrate technology in
pedagogy and curriculum development. The thirdhas the significant constructs needed to
understand the effect advancing technologies have on society, education, and the social
work profession.
This review encompasses the digital divide’s impact on social work populations
and the need for informed activism. The focuses of this divide have the narrowed to
implications for social work education and practice. Exploration of generational
differences and the concept of digital citizenship include the distinct challenges and
strengths of technological integration in education. Research on technology and higher
education provides a foundation to understand social work educators’ approach to
technology integration.

16
Literature Search Strategy
The literature search strategy encompasses a multidisciplinary examination of
sources related to education, technological processes, and the impact of technology
innovation on society. Academic sources for this research included books, peer-reviewed
articles, Internet studies, dissertations, and online documents. I used Walden University’s
Online Library to access multidisciplinary, peer-reviewed materials from ERIC,
Education Research Complete, EBSCOHOST’s Academic Search Complete, Computer
and Applied Sciences Complete, Business Source Complete, ProQuest Central, and
Political Science Complete. Google searches provided a resource for Internet use of
statistics.
The keywords for use in collecting research included the following terms:
technology, information communication technology, high tech, digital, digital divide, and
literacy. Technological terms combined with the following words provided a broad
understanding of the research: citizenship, social work, education, global, economic,
diginomics, commerce, gap, employment, knowledge management, human services,
counseling, inequity, digital natives, digital immigrants, generational, security, law,
ethics, innovation, higher education, K-12, evidence-based practices, underserved,
marginalized, underprivileged, low-income, health, wellness, rights and responsibilities,
rate of change, apps, social media, skills, societal progress, problems, access, practice,
theory, assessments, tools, interventions, communication, advocacy, descriptive statistics,
big data, faculty, illiteracy, and etiquette.
17
The initial search for information about technology and social work started in the
summer of 2010. I conducted new searches on the same terms each subsequent year until
early 2015. As little as 4 years ago, research studies about the inclusion of technology in
social work education offered few results. Searching the EBSCO Academic Complete
database prior to the 2009 using the terms social work education, technology, and United
States yielded 48 peer reviewed articles compared to December of 2014 with 76 peer
reviewed articles (EBSCO, 2014; ProQuest, 2014). Upon closer inspection, only four of
these yielded results specific to social work practice and technology integration. The shift
in CSWE 2015 EPAs to include specific technology integration requirements provided a
new direction for social work programs and research.
Theoretical/Conceptual Framework
The literature for this study’s conceptual framework is two theories related to
technology application and competence, von Bertalanffy’s (1968) GST and Bandura
(1997) self-efficacy theory. This literature review is a synthesis of seminal research with
present applications connecting technology, self-efficacy, education, and social work
systems. Application of Bandura’s self-efficacy theory was for the evaluation of
technology pedagogy in social work education with integration of Rogers’s (2003)
diffusion of innovation model and Wang et al.’s (2004) Computer Technology
Integration Survey.
General Systems Theory
This grounding of the study’s mixed methods research was in the principles of the
theorist von Bertalanffy’s (1968) GST. GST is a systems approach to interpreting reality
18
as a system of connected components (von Bertalanffy, 1968, p.37). GST is a frame for
all types of human/nature interactions in a system based on the whole instead of through
individualization (von Bertalanffy, 1968). Integration of multiple disciplines, embracing
complexity, and connecting micro with macro levels provided the association between a
goal and the systems behavior (von Bertalanffy, 1968).
GST assumptions include connections of the environment and relationship aspects
from a physical, biological, social-cultural, and symbolic point of view (von Bertalanffy,
1968). GST is one of the significant theories used throughout social work education. The
idea of using systems started in the 1930s, but it was not specifically applied in social
work practice until the 1960s (Hudson, 2000). As technological options assimilated into
every level of societal functioning, GST is an appropriate lens for this study.
The advancement of technology and its connection to GST underlies the premise
of a systems methodology. Von Bertalanffy (1972) emphasized the necessity of a systems
approach in understanding the problems created by the interaction of technological
processes with the social, economic, and ecological systems in society. GST emphasizes
reality as a construct of systems and their interrelation. Technology is a system of a
physical nature and a process involving interrelations of conceptual systems.
The interaction between individuals’ reality and their relationship with a
technologically progressing society was a cultural process, including values, mores,
rituals, opportunities, and communities (von Bertalanffy, 1972). Utilization of
technological systems can be a gap or a bridge to adaptation within society. GST allowed

19
a broader context to the implications of assimilating technology into a holistic
examination of systems.
Self-Efficacy
The theory grounding the quantitative portion of this research is Bandura’s (1994)
principles of perceived self-efficacy. The definition of perceived self-efficacy is how an
individual perceives his or her ability to identify and maneuver through situations in his
or her environment. The concept of self-efficacy includes four judgments of self:
performance accomplishments, vicarious experiences, verbal persuasion, and emotional
arousal. These areas of self-judgment impact how people perceive their ability to change
(Bandura, 1986).
Higher education has been in a process of radical change due to the role disruptive
technologies play within the education system (Doughty, 2013). Technology adaptation
in instruction content and methods only occurred with a positive judgment of self. Self-
efficacy significantly affected higher education faculty’s adoption and integration of
technology in pedagogy (Lin & Chen, 2013).
Teaching efficacy and technology is a concept studied in many disciplines
throughout higher education (Chang, Lin, & Song, 2011; Cao, Ajjan, & Hong, 2013;
Downing & Dyment, 2013; Salajan, Welch, Peterson, & Ray, 2011; Ye, 2014). The
connection between self-influences and construction of environments impacted the
development of course content (Bandura, 1993; Lin & Chen, 2013). An assumption of
self-efficacy was that the relations of the beliefs people hold about their feelings, thinking
patterns, motivation, and behavior equated to a person’s ability to perform (Bandura,

20
1994). Low computer technology information self-efficacy created a barrier for
instructors in higher education (Efe, 2015; Kelly, 2014).
The basis of an instructor’s choice of curriculum for technology development was
their motivation and judgment of self-efficacy beliefs (Bandura, 1982; Wright, 2014).
Faculty who judged their CTI skills as exceeding their competency level avoided
exploring these interventions (Bandura, 1977; Rogers, 2003). Information
communication technology refers to new media devices such as smart phones, computers,
tablets, etc. (Ilharco, 2015). As more institutions created courses in an online learning
management system, the need for understanding technology integration in education
increased (Wright, 2014). A system of negative beliefs around technological
improvements in higher education would cripple any progress for the institution and their
student populations (Doughty, 2013).
The Bandurian (1986) self-efficacy theory augmented with the Rogerian (2003)
diffusion of innovation model identified the DISWE behavior in integration of
technology into the content and process of education. The Rogerian (2003) model
included supports for the connection between self-efficacy levels and implementation of
technology innovation. Lin and Chen (2013) developed a model where self-efficacy
affected innovation behavior in higher education instructors. Identifying the DISWE self-
efficacy through innovation confidence could link pedagogical ideals to behavior.
The range of self-efficacy beliefs for social work practitioners adds to the
controversies surrounding technology integration into social work. The Clinical Social
Work Association (CSWA) wrote a report on distance education efficacy for implicit and

21
explicit curriculum standards. The concerns of CSWA members centered on how
students learn explicit curriculum without direct contact with (a) professional identity, (b)
critical thinking skills, and (c) the context of person in environment training (CSWA,
2013, p. 6-7). The translation of technology usage into social work practice is an area
identified, but not addressed.
Hill and Ferguson (2014) identified the “loss of message control, blurring of
ethical and professional boundaries, problems with constantly changing technologies, and
the decrease in ability to maintain relationships long term” as significant problems social
workers associate with technological advances in the field (p. 5). Social work
practitioners expressed alarm over the quality of social work education and technology
integration. Privacy concerns affected both the clinician and the client’s confidentiality.
Videka and Goldstein (2012) identified privacy and confidentiality as a substantial
contemporary social work issue.
Literature Review Related to Key Variables and Concepts
Digital Divide
The social work profession is dedicated to addressing the fundamental challenges
created by societal disparities, stress, trauma, and inequity. The dilemmas of a changing
society create a need for the mission of social work. Social work is a profession growing
exponentially. The U.S. Department of Labor Bureau of Labor Statistics (2014) projected
a 19% growth in the profession within the next decade (para. 1). As the demand for social
workers grows, the educational system for the profession must adapt to meet the need for
technological practice. One area of significant growth within society is the information
22
brought upon by technological advances. These technological advances affect the
populations who social workers serve on various levels. The digital divide is a concept
addressing inequity of access, education, and resources in society (Watling, 2012).
Digital disparity is creating an increase of roadblocks for effective electronic
communication, economic opportunities, and knowledge gain for those without digital
resources (van Vokom, Stapley, & Amaturo, 2014; Watling, 2012; Wei & Hindman,
2011).
The definition of digital divide in research differs depending on the discipline and
phenomena being studied (Bruno, Esposito, Genovese, & Gwebu, 2011; Epstein, Nisbet,
& Gillespie, 2011). In 1995, Webber and Harmon, journalists at the Los Angeles Times,
asserted themselves as the initial source of the simplified term’s description being the
separation between people using technology and people not using technology (as cited in
Servon, 2002). The same year, Moore (1995) defined digital divide as the separation
between advocates and deniers of ICT value. The definition of digital divide shifted to a
question of access in the early 21st century, specifying the lack of access to broadband
Internet connection (Servon, 2002). Mossberger, Tolbert, and Hamilton (2012) identified
a second divide as difference in abilities using the Internet (p. 2495).
As technological processes progressed, the term’s definition expanded (Bruno et
al., 2011; Epstein et al., 2011). The digital divide’s current definition can include lack of
access to ICT, digital literacy deficiencies, the economic, political, and social
implications of an absent digital footprint, or inequities in the advantages technology
affords individuals with technology savvy skills (Epstein et al., 2011; Watling, 2012) .

23
Watling (2012) discussed the digital divide in terms of social work practice as
exclusive digital practices (p. 127). The broadest definition by Smith (2010) includes the
digital divide simply as the disparity between those who can use digital technology for
success and those who could not be successful with digital technology uses (para. 1). The
definition of digital divide for this study is as the gap experienced by one segment of
society not having access, education, or digital tools to experience the benefits of ICT
creating a divide in resources.
The research on digital disparities can be divided into seven specific gaps over
multiple disciplines: economic/socioeconomic, generational, global, health, political, and
social/ relationship (Bach, Shaffer, & Wolfson, 2013; Bruno et al., 2011; De Marco et al.,
2014; Kuilema, 2012; Lea & Callaghan, 2011; Mossberger et al. 2012; Sipior et al., 2013;
Smith, 2010; Stone et al. , 2014; Tüzemen & Willis, 2013; Watling, 2012; Watling &
Crawford, 2010; Wei & Hindman, 2011). Hilbert (2011) cautioned not to focus on access
or digital tools, but to view the digital divide as the need for the expected gains of
technology to be inclusive of all populations. If citizens are not part of the knowledge
economy, equality in a digital culture will continue to evade the disenfranchised (Bach et
al., 2013, p. 253).
Digital Immigrants, Digital Natives, and Digital Citizens in Higher Education
The advances in technology during the 21st century create generation gaps of
information more broadly than at any other time in history (Prensky, 2001a). The
population in the United States ranges from people who saw the invention of the
television and rotary phones to growing up with television access on mobile phones. Born

24
before the 1980s, digital immigrants’ introduction to ICT’s occurred later in life; whereas
digital natives are born into a digital world.
K to 12 quantitative educational research is particularly focused upon an effective
integration of technology in pedagogy and understanding learning behaviors of digital
natives (Guo, Dobson, & Petrina, 2008). The teaching model known as technological
pedagogical content knowledge (TPACK) connects technology integration to effective
instruction (Mishra & Koehler, 2006). TPACK is a well-researched framework to
increase technology instruction efficacy throughout secondary education garnering over
452 peer-reviewed articles in the EBSCO Host database alone. High school students, the
college students of tomorrow, evaluate their teachers on self-efficacy with technology
(Dornisch, 2013). Students advancing into higher education with a digitally enhanced
childhood differ in their approaches to learning from their digitally immigrant professors.
As digital natives become college bound, an emphasis on integration of
technology in pedagogical development is becoming a significant part of strategic
planning in higher education. Models using variations of GST prevail when
administrators from higher education plan technology integration into their universities
(Hope, 2014; O'Connor, McDonald, & Ruggiero, 2014; Sahay & Kumar, 2014).
Innovative educational professionals understand the necessity of change, but some
universities remain skeptical of technology’s place in education. Allen and Seaman
(2013) reported perceptions of chief academic leaders about online learning being critical
to their long-term strategic planning. Only 69.1% of academic leaders viewed online
learning as a perpetual goal.
25
Digital immigrants make the decisions about technology’s role in their university
even if they have low self-efficacy in using technology. These technology decisions
impact the future of their institution. Significant concerns exist about the future of higher
education and the role technology will place in these systems. Enrollment for online
courses increases every year with 32% or 6.7 million students using technology to meet
their educational needs (Allen & Seaman, 2013). Technology’s impact on higher
education will only continue to increase.
Most university faculty and administration fit the digital immigrant status of being
born before 1980. Translation of technology used outside of the classroom does not
necessarily translate to technology utilization in the classroom (Skidmore, Zientek,
Saxon, & Edmonson, 2014). Innovations in the last twenty years (most in the last decade)
for education include social networking, smartphones, tablets, webcams,
whiteboards/smart boards, learning management systems, and the list continues (Allen,
Bracey, & Pasquinig, 2012).
Seasoned educators receive education for integrating these technologies in their
classrooms if they seek out the information (Skidmore et al. 2014). Younger generations
of faculty embrace alternative technologies, where older generations remain hesitant to
develop new digital tools (Skidmore et al. 2014). This hesitancy creates a divide between
digital immigrant faculty and digital native learners.
Technology integration in social work education is explicitly discussed as a
needed area of improvement in research and understanding of digital natives (Ahmedani,
et al., 2011; Hill & Ferguson, 2014, Watling, 2012). While digital natives grow up in the

26
world filled with digital options, critical thinking about the uses of technology remains an
area of concern. The term digital native does not necessarily include competence in
digitally literacy. A continuum of ICT skills with digital natives exists with demographic
and socioeconomic status being factors in digital literacy and behavior (Federal
Communications Commission, 2012; Joiner et al. 2013; Mukherjee & Clark, 2012).
Digital natives primarily use ICT for entertainment and communication (Joiner et
al. 2013). Technological behaviors of digital natives do not equate to digital
responsibility in social work practice. Efficacious learning for digital natives in social
work education needs to include implementation of effective self-regulated learning skills
and the ability to validate knowledge in curriculum development (Green, Yu, &
Copeland, 2013; Nasah, DaCosta, Kinsell, & Seok, 2010).
Digital citizenship is an evolving term similar to the term digital divide. Schuler
(2003) initially introduced the term “digital citizen” through exploring the impact of
technological systems with people or digital citizens (para. 12). As technological progress
garnered momentum, other researchers expanded the meaning of a digital citizen. Ribble
and Bailey (2004) defined the concept of digital citizenship as acceptable behavior in the
utilization of technology. The definition of digital citizenship by researchers evolved to
include normative practices and digital behaviors parallel to societal etiquette.
Digital citizens exhibit nine digital competencies: access, commerce,
communication, literacy, etiquette, law, rights and responsibly, health and wellness, and
security (Ribble, 2012, para. 9-17). Research in digital citizenship of social work students
is absent from literature. Connecting DISWE technology self-efficacy with technology
27
and curriculum development is needed to explore the divide between digital natives and
digital immigrants in social work education.
Technology Research in Learning Environments
Technology is permeating every sector of societal functioning. No greater
example of this shift towards a technological system is the United States’ educational
system (Dornisch, 2013). The pace of this shift affects students and faculty in different
ways. Instructors born before 1980 teach technology-savvy students and experience
discomfort or anxiety when using technological processes in courses (Dornisch, 2013;
Pan & Franklin, 2011).
Students, on the other hand, while technology-savvy, may not exhibit the ability
to apply critical thinking to technology literacy (Murray & Pérez, 2014). An imbalance in
technology levels created a paradox between generations. Specifically, digital immigrants
intimidated by technological applications, yet complex problem solvers along with digital
natives immersed in technology. Furthermore, these immigrants were unable to connect
higher order learning with their digital skills (Murray & Pérez, 2014; Nasah, CaCosta,
Kinsell, & Seok, 2010).
Research in technology education continues to focus on the technological
methods of teaching, not in the practice of using this technology. Online learning efficacy
remains a predominant area of research for education (U.S. Department of Education,
2010). Educational studies support the effectiveness of online learning and face-to-face
instruction. Learning outcomes of blended learning surpass both online and face-to-face
pedagogy (Furlonger & Gencic, 2014; Means, et al., 2010; Safar & Alkhezzi, 2013).
28
The emphasis of technology research in social work continues along similar paths.
A concentration on instruction techniques and the effectiveness of online education
continues this pathway(Aguirre & Mitschke, 2011; East, LaMendola, & Alter, 2014; Fort
& Root, 2011). Even with the validation of evidence-based practices in learning online,
the focus of research continues to be concentrated on online instruction efficacy (U.S.
Department of Education, 2010).
Self-efficacy is a strong determinant of technology acceptance (Holden & Rada,
2011; Kelly, 2014). Teachers exhibit higher self-efficacy and better learning outcomes if
they differentiate their instruction methods (Dixon, Yssel, McConnell, & Hardin, 2014).
Self-efficacy and motivation of faculty members entwine in a complex reasoning to
include or reject online pedagogy (Edwards & Bone, 2012; Johnson et al., 2012;
Kirkwood & Price, 2013; Wright, 2014).
Quantitative investigations in education technology efficacy focus upon surveys
for student outcomes, faculty behavior, and attitudes. A literature review by Tsai,
Chuang, Liang and Tsai (2011) found most studies of self-efficacy and online learning
included a questionnaire or survey for measurement. Yet only a small portion of the
studies included mixed methods or a qualitative approach.
Mixed methods research provides a quantitative look at self-efficacy concepts.
Qualitative interviews offered explanations for their technology integration behaviors
(Wright, 2014). Qualitative researchers seek to understand the nature of integrating
technology with academic assessment and outcomes (Barberà, Layne, & Gunawardena,
2014; Martin, Parker, & Allred, 2013).

29
The discourse about online efficacy and assessment concerns continues
throughout higher education. A meta-analysis of online learning studies by the U.S.
Department of Education (2011) revealed similar outcomes for traditional and online
course delivery with blended learning exhibiting a minor advantage. A question
unanswered by academia remains: If a section of educators identified as digital
immigrants delay integrating digital tools, how do these same educators develop higher
order thinking skills of a digital world with students?
Social Work Education’s Approach to Technology
The use of technological advances for instruction of social work students has
evolved over the years. Twenty years ago social work education used card catalogues in
research, overhead projectors to supplement lectures, and the beginnings of computer
processing for typing papers. Researchers found role plays in class and field education
presented the best methods for integrating social work theories and practice (Dickson &
Mullan, 1990; Shorkey & Uebel, 2014; Vayda & Bogo, 1991). As technology advanced,
methods in how research is pursued changed from hours of reading microfilm in a
university library basement to Internet research database access at home. Global research
findings and practices are now accessible to all students with Internet access. (Sangeeta
Namdev, 2012).
The availability of digital tools and applications in education advanced
pedagogical options. Social work educators took the opportunity to expand options for
learning and assessment of students in practice situations (Shorkey & Uebel, 2014).
Audio/visual recordings and filmstrips for training and skill building became popular

30
starting in the 1970s. In this study during the late 20th century, the use of social work
audio/visual educational material effectiveness compared to other professional schools
was the results.
The social work profession did not create the uses of progressing technologies,
adopted by social work educators. Audio/visual material developed by other professions
(i.e., psychology, health fields) held an alternative for faculty of social work courses
(Shorkey & Uebel, 2014). Educators translated other professions’ content to reflect the
field of social work.
The next technological advance, interactive television, offered a new method of
course delivery: distance education. Social work education could be offered in rural areas
or communities too far away from colleges offering social work degrees (Horvath &
Mills, 2011). Distance education using interactive television and synchronous
communication in social work education has existed since the late 1990s. The prevalence
of interactive television remains prevalent today even with the more cost effective digital
options available (Quinn & Barth, 2014).
The switch to asynchronous learning remains a contentious debate between social
work educators. Outcome and assessment of online learning receive much attention in
research studies of education efficacy. Two decades of research on the effectiveness of
distance education versus on campus learners continues to reveal evidence of the validity
for each approach (Coe & Elliott, 1999; Cummings, Foels, & Chaffin, 2013; Freddolino,
& Sutherland, 2000; Petracchi & Morgenbesser, 1995; Pots, 2005; Forte & Root, 2011).
Even with the extensive research on the efficacy of online and blended learning, social
31
work educators remain focused on educational delivery methods instead of moving
forward to address technology innovation in practice (Shorkey & Uebel, 2014; Watling,
2012).
The state of social work education reflects a variety of options from virtual
experiences, online or blended learning, and the use of digital tools for educational
purposes (Dearnley, Taylor, Laxton, Rinomhota, & Nkosana-Nyawata, 2013; Reinsmith-
Jones, Kibbe, Crayton, & Campbell, 2015). Digital tools to enhance the classroom
experience include: (a) software programs, like Power Point and (b) hardware options
like smart boards, mobile devices, and classroom electronic simulators. The tools of
video posting of student counseling simulations on YouTube or in course management
systems make methods of evaluation such as the two-way mirror in a classroom almost
obsolete.
Even with the plethora of options technology provides for curriculum and
pedagogy for social work education, innovation is slow to be initiated (Watling, 2012).
Technology self-efficacy perceptions and a reliance on older technologies inhibit the
integration of technology uses by social work educators (Quinn & Barth, 2014). The
difficulty people experience with change is no different in the education arena.
Social work educators struggle with two major aspects of technology in the
classroom: integration of digital options into practice and the digitally native students’
relationship with technology (Cwikel, Savaya, Munford, & Desai, 2010; de Boer,
Campbell, & Hovey, 2011; Duncan-Daston, Hunter-Sloan, & Fullmer, 2013; Edmunds,
Thorpe, & Conole, 2012; Gelman, & Tosone, 2010; Watling, 2014). A study by Berzin

32
and O’Conner (2010) on how social work education needs to change in the school social
work setting exemplified a disconnection of technology education in a practice context.
Researchers identified multiple levels of change to school social work education.
Effective practice in a school setting uncovered one significant omission: any type of
technology issues related to students and systems.
Most bachelor and master schools of social work in the United States hold an
accreditation by the Council on Social Work Education (CSWE). Schools of social work
earn accreditation based upon four areas: program mission and goals, implicit and
explicit curriculum, and assessment. Implicit and explicit curricula and assessment form
the base for social work education certification (CSWE, 2008).
CSWE’s implicit curriculum referred to the “learning environment” in a school of
social work (CSWE, 2008). Studies on social work education’s use of implicit and
explicit curriculum rarely qualified technology as a component unless distance education
(Bogo & Wayne, 2013; Petracchi & Zastrow, 2010a; Petracchi & Zastrow, 2010b;
Peterson, Farmer, & Zippay, 2014; Quinn & Barth, 2014). The one area of implicit
content mentioned in the standard focuses on program processes and communication with
technology including hardware needs (Grady, Powers, Despard, & Naylor, 2011). Once
implicit curriculum became outlined, the focus of social work education efficacy turned
to the delivery of explicit curriculum.
Explicit curriculum refers to the flow of curriculum design through social work
courses, field placement, and delivery of content (CSWE, 2008). Explicit curriculum
studies failed to include technological integration as an area of practice or evaluation

33
(Miller, Tice, & Hall, 2011; Petracchi & Zastrow, 2010a). The lack of specific guidelines
in standards for technology in explicit curriculum teetered on the concept of digital
cultural ignorance.
Assessment, the last of the areas identified for an integrated curriculum design,
centered around the efficacy of learning and executing social work knowledge with
practice (CSWE, 2008; DeLong Hamilton et al., 2011; Williams & Bolland, 2011) The
review of literature for CSWE assessment practices revealed no references to technology,
except in the evaluation of online learning outcomes (Cummings, Foels, & Chaffin, 2013;
Forte & Root, 2011; Hash & Tower, 2010; Manion & Selfe, 2012; Means, et al., 2010).
The new 2015 CSWE accreditation standards include technology standards focused on
ethical standards in practice but not specifically as a needed function in implicit
curriculum development.
A literature search, initiated by this researcher, for criteria in social work
education, technology, and United States, an EBSCO complete/ProQuest Central, peer-
reviewed, gathered a macrocosm of research areas within the profession. The EBSCO
Complete/ProQuest Central search revealed four distinct categories of technology articles
for social work education: distance education, instruction methods, ethics, and
technology uses in social work practice. Division of research article topics based on the
most predominant content area avoided duplication of themes.
Efficacy of using technological instruction techniques in course delivery produced
58% of peer-reviewed articles. Online/blended education yielded 29% of the focus for
social work outcome efficacy. The last two categories of peer reviewed articles had a
34
focus on technology ethics and integrating technological practices into social work
curriculum, tied at 6.5% each. Research on technological practices focused on types of
technology integration in curriculum and practice at specific universities and a study on
technology content in social work education (Shorkey & Uebel, 2014; Youn, 2007). The
majority of studies in social work education center upon online efficacy and instruction
methods with the use of technology.
A review of research methods provides an indication of where educators focus the
importance of studies on technology and social work education. Mixed methods research
is a common design for social work education (Chaumba, 2013). Survey research and
qualitative information via groups or open-ended questions provided a broader view of
efficacy with online curriculum and pedagogy for social work education (Aguirre &
Mitschke, 2011; East et al., 2014; Fort & Root, 2011).
Efficacy survey results were a blended learning approach to social work education
and offered a more successful method to deliver content and improve learning outcomes
(Aguirre & Mitschke, 2011). Social work researchers (Aguirre & Mitschke, 2011; East,
Quinn, & Barth, 2014; LaMendola, & Alter, 2014; Fort & Root, 2011; Quinn & Barth,
2014; Vernon, Vakalahi, Pierce, Pittman-Munke, & Adkins, 2009; Watling & Crawford,
2010) recognized the need to develop research studies measuring technical development
of the profession and education. Two significant limitations in research include: (a) small
sample size in qualitative studies with limited reach, and (b) questions about the
definition of valid learning assessments with technology implementation (Allen &

35
Seaman, 2013; Allwardt, 2011; Cwikel et al., 2010; de Boer, Campbell, & Hovey, 2011;
East, LaMendola, & Alter, 2014; Friedline, Mann, & Lieberman, 2013).
A theme among administrators in social work programs centered on the difficulty
introducing innovation into closed systems (East et al., 2014). Only 36.7% of BSW
programs and 50.9% of MSW programs offered at least part of their program online
(CSWE, 2013). A drastic reduction of fully online degree programs offered resulted in
only 2.1% of BSW programs and 8.1% of MSW programs engaging in this format
(CSWE, 2013). Difficulty with faculty engagement in technology priorities surfaced as
the second most significant obstacle to innovation of technologies (East, LaMendola, &
Alter, 2014). Even with20 years of efficacy studies about social work distance education,
educators persisted in their hesitation to integrate social work and technology into an
online format (Vernon et al., 2009).
Implications for Integrating Technological Solutions in the Social Work Profession
Examples of digital evidence-based practices and technological solutions
increased as technology progresses in mainstream society. The most prolific example was
the United States Federal Government (Office of Management and Budget, General
Services Administration, Mobility Strategy Task Force, & Web Reform Task Force,
n.d.). The United States Federal Government created a Digital Government Strategy
addressing issues related to digital citizenship, resource access, and digital services
(Office of Management and Budget et al., n.d.).
Writers of this plan developed the needed infrastructure for citizens to use
technology effectively, such as work with applications to health, wellness, mental health,
36
economic access, and political education (USA.gov, 2014). Apps related to social work
practice were available, but lacked formal educational support in their use. The
disconnection between understanding the relevance of technology in social work practice
was apparent in continuing education requirements.
A condition of social work licensure in the United States is the accumulation of
Continuing Education Credits (CEUs) for every cycle’s certification procedure.
Continuing education topics mirrored the current interests of social workers in practice.
The NASW (2011) Continuing Education Portal topics did not include technology as a
specific category. Reviewing research on the needs of continuing education for social
workers provided results not addressing any areas of technological evidence based
practices, ethical issues connected to technology or technology based practice solutions
(Cochran & Landuyt, 2011; Congress, 2010; Quinn & Straussner, 2010; Weisenfluh &
Csikai, 2013).
Among those surveyed by Cochran and Landuyt (2011), cyber bullying and
Internet Addiction surfaced as hot topics in CEUs. Both of these topics reflected a
consequence of negative behavior in technology use. The lack of continuing education
for how to ethically integrate technology into social work practice was an issue.
Not unlike other professions, controversy exists for the ethical and appropriate
integration of new practices. Goldstein (2007) emphasized a micro approach of focusing
on clinical practices skills, while Videka’s (2012) macro level view evolved through
change and systems work toward an actualized profession. The dehumanization of social
work, a risk of dual relationships, privacy, confidentiality, inappropriate boundaries, and

37
concern about technology challengers in the field held significant influence over opinion
(Duncan-Daston et al., 2013; Goldstein, 2007; Hill & Ferguson, 2014; Judd, & Johnston,
2012; Strom-Gottfried et al., 2014).
Studies on the efficacy of learning social work theory and practice in an online
format do not support naysayers. Practice skills are the foundation of micro social work
practice, and some educators resisted a fully online instructional approach (Cummings,
Foels, & Chaffin, 2013; East, LaMendola, & Alter, 2014). Comparing traditional and
online coursework in social work education provided a gateway to understanding the
controversy (de Boer et al., 2011; East et al., 2014). Social work educational directors
and deans identified resistance to online education by faculty due to skepticism of
efficacy, lack of willingness to change, and a view of technology as a low priority (East
et al., 2014).
Recommendations for improvement of technological approaches in social work
practice included: (a) educational digital literacy for social workers in school and
practice, (b) an appreciation of generational differences in students, recognizing the
consequences a digital divide presents, (c) continuing ethics trainings, and (d) an
improvement in social work education strategies addressing technological advances
(Duncan-Daston et al., 2013; Eamon, Wu, Moroney, & Cundari, 2013; Goldstein, 2007;
Hill & Ferguson, 2014; Judd, & Johnston, 2012; Kay, 2011; Lin & Chen, 2013; Strom-
Gottfried et al., 2014). The dissonance between technology’s purpose and digital literacy
with faculty and students detracted from the advancement of the field.

38
Social work faculty and practitioners ran the risk of not appropriately
implementing technology, but students also brought varying skills in the implementation
of technology in assignments. Students not equipped with digital citizen qualities became
confused by the technology or software, hindering their ability to appropriately learn
from curriculum (Allwardt, 2011; Duncan-Daston et al., 2013; Judd & Johnston, 2012;
Kay, 2011). Digitally literate professors increased engagement and successful outcomes
with students experiencing digital divide problems.
Eamon et al. (2013) evaluated the need for social work educators to teach
technology related skills effectively to address the technology barriers prevalent for
clients needing public assistance. Addressing the technological divide gap in social work
pedagogy through technologically qualified instructors provided student guidance. The
increase of mutual learning through tensions of technological processes and generation
gaps was through detailed assignment specific rubrics (Eamon, Wu, Moroney, &
Cundari, 2013; Manion & Selfe, 2012; Lin & Chen, 2013).
Summary
While recommendations in current literature often included the need for
technology integration into social work education, the predominant focus of research was
on efficacy of instruction strategies. A literature search revealed the disconnection
between social work education and the integration of evidence-based practices or
processes involving technology. Using search engines from EBSCOhost and ProQuest
Central, no articles linked to how social work education addressed technological
integration of practice into the educational setting.
39
The need for educational integration of technological processes, literacy, and
applications for practice has been well documented globally (Cwikel et al., 2010; de
Boer et al., 2011; Duncan-Daston et al., 2013; Edmunds et al., 2012; Gelman, & Tosone,
2010; Watling, 2014). A division exists among researchers’ viewpoints in the United
States regarding technology practices. This division occurs between ethics and practice
considerations. Technology advances divide between descriptions of obstacles or tales in
cautionary areas of practice (Duncan-Daston et al., 2013; Goldstein, 2007; Hill &
Ferguson, 2014; Judd, & Johnston, 2012; Strom-Gottfried et al., 2014).
Self-efficacy of personal technology uses may include the biases in using
technological practices with social work populations (Bandura, 1977). The needs of the
profession may begin addressing the digital divide only by addressing the controversy
about technology through information, education, and validity.
The first chapter involved identifying a need for technology integration into social
work education. Results of the literature review continue to support this study’s purpose
in needing evaluation of technology’s role in social work education. The third chapter
identifies the process for collecting information to examine the efficacy of current
pedagogical and curriculum practices by social work educators.
40
Chapter 3: Research Method
Introduction
Vulnerable populations addressed by the social work profession experience
oppression and marginalization by the increasing digital divide in the United States
(Steyaert & Gould, 2009; Watling & Crawford, 2010; Wei & Hindman, 2011). In my
literature review, few studies addressed the behaviors of DISWE on integrating
technological principles and solutions in social work education (Watling, 2012).
The purpose of this mixed methods study had two goals:
1. The quantitative part of the study developed an understanding
about how DISWE view their self- efficacy with technologically
integrated learning (TIL).
2. Survey questions and the qualitative part of the study identified
how TIL is being used within social work education by DISWE.
The collection of quantitative data occurred by collecting survey questions for
demographics, technology beliefs and behavior, and TIL self-efficacy. The Computer
Technology Integration Survey (CTIS) was sent to all DISWE full-time faculty members
in the CSWE database of accredited universities for part of this measure. Determining the
awareness of DISWE TIL regarding interventions with social work populations expands
an understanding of the second goal through qualitative data. Survey data were informed
by the results of open ended questions and interviews.
A snowball sampling continued the data collection process for non-CSWE
members not represented in the purchased database. Qualitative data were collected using
41
two open ended questions in the survey and four in-depth, semi structured, face-to-face
(or Skype) interviews using snowball sampling. The qualitative data focused on the
second goal, to understand the details of DISWE’s use of TIL.
Research Design and Rationale
The design for this research started as a qualitative method study using grounded
theory for exploring digitally immigrant social work educators’ perception of technology
in social work education. As my research progressed, it was clear I needed to change both
the population and methodology. I expanded the population focus to be inclusive of all
social work educators instead of only faculty at the MSW level. Social work programs
have a unique advanced standing program for social work students with a BSW (CSWE,
2008). Advance standing placement is an inclusion of a student’s BSW education as
credit for the foundation year of MSW studies.
Many social work faculty members instruct at both foundation and advanced
levels (CSWE, 2012). Not including faculty members teaching in BSW programs might
affect the validity of this research because of their integral part of master’s level
preparation for advance standing students. I felt it appropriate to include all levels of
social work faculty members, adding to the ability for generalization with all DISWE
(CSWE, 2012; Johnson & Onwuegbuzie, 2009).
My rational for a methodology shift from qualitative to mixed methods occurred
to increase the validity of the study. The need for change became evident during the
literature review. Innovation in technology and its relation to social work education is a
complex topic needing more depth for validity of research results (Longhofer & Floersch,

42
2012; Rogers, 2003). One method over another does not provide adequate attention to
this research. Qualitative research alone is not generalizable to the behavior of all social
work educators (Creswell, 2015). A quantitative research method does not offer the
variety of personal perspectives technology integration presents.
Using a pragmatic mixed methods approach to researching technology integration
remains consistent with the exploration of conflicting philosophies for DISWE (Johnson
& Onwuegbuzie, 2009; Mishna et al., 2012; Steyaert & Gould, 2009). A mixed methods
approach provided participant enrichment and significance enhancement by increasing
the number of participants to maximize the data for interpretation (Greene, Caracelli, &
Graham, 1989; Onwuegbuzie & Leech, 2006). A mixed methods approach opened the
door to explore diverse world views or assumptions, even if they may conflict with one
another (Creswell, 2009). In this research, I explored behaviors and beliefs of DISWE in
their approach to technology integration practices of social work education.
Grounded theory underlies this mixed methods research to develop a model for
understanding the DISWE implementation of technology in social work education.
Grounded theory offers a pragmatic viewpoint in understanding how systems theory and
diffusion of innovation theory impact social work educators in their technology
integration (Bronfenbrenner, 1976; Charmaz, 2006; Johnson & Onwuegbuzie, 2009;
Rogers, 2003). Pragmatism and interpretive constructs offered by a grounded theory
approach support an encompassing perspective to the multidisciplinary theories social
work education provides to their students (Charmaz, 2006). This research, guided by

43
grounded theory principles, included identification of the roles of DISWE and how this
identification connects to the whole of technology integration in social work education.
The quantitative and qualitative results of this study concurrently provide
information to develop a model of understanding for integration of technology into social
work education. The quantitative method addresses standardized data collection of
demographics, close ended survey questions, and self-efficacy of DISWE integrating
technology while the qualitative method of open-ended questions and face-to-face
interviews offer an exploration of the theory-to-practice gap with social work students
(Johnson & Onwuegbuzie, 2009; Longhofer & Floersch, 2012).
Research Questions
Quantitative Research Questions
RQ1: What is the relationship between CTI self-efficacy of DISWE and the
number of technologies used in instruction methods?
H01: CTI self-efficacy relates to the number of technologies as measured
by technology behaviors in instruction methods.
HA1: CTI self-efficacy does not relate to the number of technologies used
in instruction methods.
RQ2: What is the relationship between DISWEs CTI self-efficacy and the number
of digital options taught to students for integration into their social work practice?
H02: CTI self-efficacy of DISWEs relates to the number of digital options
taught to students for integration into their social work practice.

44
HA2: CTI self-efficacy of DISWEs does not relate to the number of digital
options taught to students for integration into their social work practice.
RQ3: What is the relationship between CTI self-efficacy of DISWE and their
ability to address digital divide issues in social work practice with students?
H03: CTI self-efficacy relates to DISWE’s ability to address digital divide
issues in social work practice with students.
HA3: CTI self-efficacy does not relate to DISWE’s ability to address
digital divide issues in social work practice with students?
Qualitative Research Questions
The central qualitative question is as follows: How do DISWE perceive
technological processes being integrated into their approaches to pedagogy, curriculum,
and practice outcomes?
RQ1: How does DISWE’s CTI self-efficacy impact integrating technology in
curriculum development, pedagogy, and practice strategies?
RQ2: How does DISWE’s CTI self-efficacy impact instruction of technological
resources for social work systems experiencing digital inequities?
Mixed Methods Design
The central phenomenon explored in this study was how DISWE perceptions of
technology self-efficacy impact their integration of technology, in pedagogical
approaches and practice solutions, with students. This complementary mixed method
study had an embedded type of approach to gather data concurrently for support in the
findings of both designs. The non-experimental, quantitative, deductive method in this

45
study was a measure of the phenomenon of academic technology self-efficacy of MSW
faculty.
The analysis of quantitative survey data paralleled the qualitative analysis of
open-ended survey questions and face-to-face interviews (Collins, 2010). The results
from the convergent design analysis provide research with equal weight to each method’s
results (Creswell, 2009). The relationship between the samples consisted of an identical
sample for the survey and a nested sample for the face-to-face interviews (Collins, 2010).
Generalizations and transference of research results of an identical sample minimized
compromised findings. Results from the data collection informed the qualitative face-to-
face interviews throughout the research process (Charmaz, 2006; Glaser, & Strauss,
1967).
I chose a mixed method design over a qualitative design to explore the
phenomena of social work education and technology integration from multiple
perspectives. Triangulation of data offered validation of the research question from
different perspectives (Greene et al., 1989). The mixture of these methods added cross
validation during data analysis in describing meta inferences (Collins & Onwuegbuzie,
2013).
The CTI self-efficacy survey, open ended questions about the DISWE
approaches and beliefs about technology integration and face-to-face interviews offered a
complementary mixed methods opportunity (Hesse-Biber, 2010). The mixed methods
approach overlayed the concepts within the study to provide an enriched understanding of
46
the phenomenon with more depth than each design separately could contribute (Greene et
al., 1989).
Data Collection and Analysis
The data analysis for this study integrated quantitative and qualitative data aligned
with the research questions. The focus of the data analyzed from the survey was on
academic technology self-efficacy and technology behaviors, combined with the
interview questions. This focus made provision for triangulation of data, which increased
validity and reliability of the study (Greene et al., 1989). Each quantitative and qualitative
data set informed the other for a concurrent design (Creswell, 2014).
The statistical analysis of the CTIS helped draw conclusions from DISWE
perspectives through exploring the relationship between data points. The qualitative
portions added specific narrative to increase the understanding of the DISWE
perspectives on technology integration in their pedagogical approaches and offered
insight into the quantitative data. The data collected for this study drew benefits from a
larger sample size and developed the context for the DISWE relationships with
technology integration in social work education.
The use of a convergent design was to merge the data sets in order to validate the
findings of each method of collection (Creswell, 2014). The triangulation of data from
quantitative and qualitative methods provided credibility and internal validity in the
results of the research (Greene et al., 1989). The exploration of grounded theory
principles incolced data collection as a complex system of information gathering and
47
encouraging the development of ideas and concepts throughout the research process
(Charmaz, 2006).
Qualitative and quantitative data collected concurrently began the parallel process
of investigation. Mixing occurred after the data analysis stage. I merged the data to
combine the qualitative and quantitative results for interpretation (Creswell, 2011, p. 67).
Equal priority was given to each method in this data analysis phase. Methodological
triangulation of gathering, linking, and coding occurred throughout data collection for the
analysis phase separately between methods (Kuckartz, 2014). I merged coding of open-
ended questions with quantitative results at the final stage (Creswell, 2011).Later, I
merged closed questions with qualitative results after initial and focused coding phases
(Charmaz, 2006). After analysis of the inferences from both data sets, I performed a meta
inference process to integrate the results of both qualitative and quantitative collections
(Onwuegbuzie & Johnson, 2006).
Role of the Researcher
I have been a member of the social work educational community as a field
instructor, consultant, instructor, and practitioner for over 25 years. I am a social work
lecturer at Dominican University in their Graduate School of Social Work department. As
a practicing social worker and a digital immigrant in a digital age, I am aware of the
opportunities and risks technology may bring to the profession.
My role as a researcher required an unbiased attitude in the development of
questions for the qualitative section and analysis of the results (Creswell & Clark, 2013).
My numerous years of experience integrating technology, education, and social work

48
practice contributed to a bias of addressing the need for technology integration in the
profession. I screened my multiple professional relationships and personal experience as
a DISWE for bias.
As a social work field instructor for the past 20 years, I have had contact with
various social work educators in the Midwest. Similar to this scenario is my process to
obtain a full time faculty position in the Midwest. My applications and interviews for
social work positions by social work faculty in the last 3 years may have influenced
participants. The last is my involvement as a social worker in professional development. I
regularly meet social work educators as a presenter, conference attendee, student, as an
online presence with my social work blog and participation in online social work
communities. I did not have any power relationships within these contexts. As I am a
full-time instructor in a MSW program, the faculty within my program did not receive a
survey.
Prior relationships with social work faculty remained professional. Information
obtained through the survey process maintained anonymity in data analysis. I used a
snowball sampling to identify DISWE for qualitative interviews. A specific spot in the
survey provided an opportunity for DISWE to volunteer for the qualitative interview.
Methodology
This mixed methods study employed four data sets to evaluate hypotheses:
demographic data, survey questions, self-efficacy results, and face-to-face or Skype
interviews. Demographic data collected included basic identifying questions and
information about the DISWE current career status. The survey involved identification of

49
DISWE technological behaviors in the classroom through checklists. These survey
questions included types of technology used in the classroom and pedagogical behaviors
in technology integration.
Selection of Participants
The basis of participant selection included two inclusion criteria. The first
characteristic was the status of being a full-time faculty member at a BSW or MSW,
CSWE accredited university. Secondly, participants needed to be over age 35.At the time
of the study, full-time social work educators in the United States consisted of 5,031
faculty members (CSWE, 2012).
Prensky’s (2001a) date for the birth of a digital immigrant was prior to 1977.
Those born after 1977 did not qualify as digital immigrants. A digital immigrant was a
person who grew up before the widespread use of digital technology. Using CSWE
(2012) reporting data on social work programs, around 87% or 4,377 of full time faculty
members qualified as digital immigrants. This number was an estimate based on age
ranges from CSWE (2012) demographic categories.
Purposeful sampling informed the quantitative section and the theoretical
sampling. Theoretical sampling methods were an evaluation of the homogeneous
population of the hypothesis first, with data derived from this sampling compared to the
heterogeneous data results (Creswell, 2007). Participation contact occurred through
solicited email. A purchased list through CSWE established the list for social work
directors or deans and CSWE members.

50
I sent an email request of participation to each social work program director or
dean and CSWE faculty members for participation in the study. The participation request
included an appeal to forward the survey to colleagues not CSWE members, who
qualified as digital immigrants. Qualifying demographics for this study included a
birthdate before 1977 and holding a position as a full-time faculty member of any rank in
an accredited school of social work’s BSW or MSW program. The survey software
eliminated social work educators born after 1977.
In the initial email I identified digitally immigrant educators over the age of 35 to
participate in the study. A second measure, asking for a birth date in the survey software,
eliminated those born after 1977. The survey questions identified part-time faculty with a
request for faculty rank. Data for part-time educators who filled out the questionnaire, I
sorted into an isolated file, not used in analysis.
Sample Size
There were 5,031 full-time MSW and BSW educators in the United States
(CSWE, 2013). DISWF members account for 95%, or 4,221, of the BSW and MSW
faculty populations. Based on a sample size of 4,221 reported BSW and MSW faculty,
the sample size for ±5%, Precision Levels where Confidence Level was 95% and P=.5.
The sample size would be 352 participants by using a confidence level of 95%, a
confidence interval of 5 and the population of 4,221 eligible DISWF.
The open-ended questions of the survey and interviews represented the qualitative
sample size. Saturation of the open-ended questions occurred through analysis of
responses in 20-30 participants (Creswell, 2011; Onwuegbuzie & Leech, 2007b). I

51
selected these responses randomly with the use of SPSS. Using a nesting sampling
design, a self-identifying question elicited volunteers for four DISWE to participate in
thirty minute interviews face-to-face, through Skype or in person at their university
office.
Instrumentation
Quantitative Self-Efficacy Constructs
The CTI Survey (Wang et al., 2004) was a measure of the self-efficacy beliefs of
technology integration for teachers. Wang et al. (2004) developed and validated this tool
in a study to measure pre-service teachers’ self-efficacy with technology integration. I
obtained permission from the authors in the use and modification of the survey (See
Appendix A). I made modifications in the Likert scale, question phrasing, and a change
to the second factor scale to address technology integration in coursework. The tool
contained three sections: (a) demographic and deductive questions, (b)the CTI survey and
(c) open-ended questions. The Likert scale modifications changed from rating their level
of agreement:
SD = Strongly Disagree,
D = Disagree,
NAND = Neither Agree nor Disagree,
A = Agree,
SA = Strongly Agree
to a scale more aligned with the diffusion of innovation theory as described below:
Totally Agree: I am an innovator in this area of using technology (5)
52
Strongly Agree: I am an early adopter in this area of using technology (4)
Fairly Agree: I am in the early majority in this area of using technology (3)
Agree a little: I am in the late majority in this area of using technology (2)
Disagree: I am one of the last in this area of using technology (1)
Slight wording modification to address social work educators’ terminology
occurred in the fifteen factor one questions measuring computer technology capabilities
and strategies. The six factor two questions were measures of the social work educators’
self-efficacy with instruction of technology integration into social work practice,
clarifying the initial scale questions through external influences of computer technology
use. (See Appendix F for details of survey changes).
Qualitative Components
Online survey open-ended questions and four face-to-face interviews offered
qualitative data from the participants. I collected data in the interviews by using the
following tools: (a) an observation sheet, (b) interview protocol, (c) detailed notes, and
(d) a video and/or audio taping for later transcription. Concurrent face-to-face interviews
occurred during the collection of data from the online survey. I recruited interview
participants through a question within the Qualtrics survey about participation and a
snowball sampling from other social work educators. DISWE had the opportunity to meet
in person or through a video chat.
Quantitative Components
This section includes information about the instrument details used in the
collection of quantitative data. The selection of the Computer Technology Integration

53
Survey (CTIS) (See Appendix C) provided the self-efficacy measures based on sufficient
content validity of previous researcher studies (Al-Awidi & Alghazo, 2012; Crittenden,
2009; Farah, 2011; Haight, 2011; Krause, 2010; Wang et al., 2004). The CTIS
populations in each sample reflected higher education environments (Al-Awidi &
Alghazo, 2012; Crittenden, 2009; Farah, 2011; Haight, 2011; Krause, 2010; Wang et al.,
2004).
Instrument 1. A survey including demographic, descriptive, Likert style and closed
questions in validated participant status, provided identification of DISWE, their
professional social work educational criteria, and identified behavior integrating
technology in social work education. I collected these variables at the start of the self-
efficacy survey. These variables included: age, use of technology in the classroom,
teaching technology for use in practice, and education about the impact of the digital
divide. The establishment of content and construct validity were through distribution of
the survey questions to ten social work colleagues for participation and feedback
(Creswell & Plano Clark, 2011).
Feedback from colleagues identified several initial concerns in the survey. This
feedback offered suggestions for altered content, wording, survey structure and ease of
use. (See Appendix F for details of survey changes). Responses for the self-efficacy
survey reflected more definition of the concept.
Instrument 2. Wang, Ertmer, and Newby (2004) created the Computer Technology
Integration Survey (CTIS) by identifying the self-efficacy beliefs of teachers’ technology
integration. The identification of self-efficacy of teachers was through 21 positively

54
worded statements about confidence levels of technology integration. The establishment
of CTIS’s content validity was through a panel of six self-efficacy experts reviewing
literature to address definition appropriateness. Experts used a rating sheet for feedback
on each statement. The reliability calculated for this factor resulted in a .94 rating and
Cronbach’s alpha coefficients determined .94 reliability in the pre-test model (Wang et
al., 2004). The analysis of construct validity and reliability occurred through factor
analysis and reliability coefficients with acceptable measures for use in future research.
I received permission to use and slightly modify the CTIS from the study authors
(See Appendix A). I addressed issues of trustworthiness by using CTIS as a valid and
reliable tool (Tashakkori & Teddlie, 2003). I used the information from this research tool
in the Qualtrics online survey software for data collection.
The CTIS (Wang et al., 2004) had been previously published in measuring
educators’ technology self-efficacy beliefs. Farah (2011) examined the factors leading
teachers toward their self-efficacy with technology. The CTIS was useful in identifying
participants for the qualitative study. Haight (2011) completed a mixed methods study
investigating the technology self-efficacy of educators with the CTIS. The study
identified the lack of technology integration in the pedagogical practices of educators.
Al-Awidi and Alghazo, (2012) studied CTI self-efficacy of student teachers
before and after their practicums. Skoretz’s (2011) mixed methods study found
significant differences in CTI with educators when trained in computer literacy through
job development and grade level of teacher. Data analysis of the CTIS in these studies
supported the validity and reliability of the instrument (Al-Awidi & Alghazo, 2012;
55
Farah, 2011; Haight, 2011; Skoretz, 2011). These researchers’ focus identified the
connection between instructor CTI self-efficacy and their use in classrooms.
Recruitment, Participation, and Data Collection
I contacted the Counsel on Social Work Education (CSWE) to purchase the
CSWE Masterfile of current member email addresses. The current CSWE database had
2,147 members with contact information. I saved the database of potential participants on
a password protected computer. My email contact information through Walden
University’s email system disseminated the letters for participant recruitment. Each
CSWE member received these emails. Walden University and Dominican University in
Illinois did not receive requests due to a conflict of interest.
Qualitative Components
Participants obtained informed consent on their first contact with the online
survey system, Qualtrics. The consent form started the process of participation for the
survey. Participants did not progress further unless they electronically acknowledged
their interest. Participants were able to forward the survey to other DISWF through
snowball sampling.
Survey participants exited the study with the option to be sent a link to the
published results and an option to participate in the in person interview. The in-person
interview question included contact information for follow through with an interview. If
the volunteer for the study was not one of the four chosen, then I sent a thank you email
for their interest with information about not being selected for the in person interview.

56
Participant interviews took place either at the subject’s university or, if travel time
exceeded 60 minutes, through an online video call. The participants in the face-to-face
surveys received their transcripts for any feedback or clarification they wished to provide.
I sent each interview participant a note of appreciation note. Other than the follow- up,
the interview contact for internal validity, the option to obtain a link to the final
dissertation, or a participation denial/thank you, no follow- up took place with
participants (Zohroabi, 2013).
Quantitative Components
The quantitative data was electronically collected by the survey instrument,
Qualtrics (2014). Participants accessed the survey through a link in their study
recruitment email. The data obtained from the survey was downloaded to a password
protected computer for confidentiality. Data collection for the survey portion occurred
over one month to ensure an adequate window for participation during the academic
semester.
Participants completed the CTIS instrument, nominal and ordinal survey
questions, and open-ended questions in a 20–30 minute time frame. I established content
validity of the survey questions by developing and disseminating the tool in Qualtrics. I
distributed the initial survey to 10 social work colleagues, not eligible for participation in
the current study. Feedback from this test group became integrated into the final version
of the survey questions. The sample size was met in the month timeframe.
Three weeks into the data collection process, I identified four DISWE as
participants for the face-to-face or Skype interviews. I selected the interviewees for this

57
qualitative portion through purposeful sampling. A question on the survey allowed
participants to volunteer for an in-depth, open-ended interview. As there were no
volunteers, then a snowball sampling took place to obtain the interview participants. I
asked colleagues to identify DISWE educators, who would participate in an interview.
Interviews lasted between 30-40 minutes each. The recording of the qualitative
interviews were on either a voice recorder or a computer program. I stored interviews on
a password protected computer and a password protected cloud storage program,
Carbonite.
Data Analysis
Quantitative Plan
I examined the relationship of DISWE status and CTI self-efficacy with
technological behaviors in curriculum delivery methods, practice behaviors in pedagogy,
and the dissemination of digital disparity education of social work populations in the
classroom. The data analysis for this study included statistics from quantitative and
qualitative information. The data derived from DISWE responses to survey and interview
questions.
Quantitative analysis of data occurred to evaluate the bivariate correlations for
each hypothesis’s independent and dependent variable. A regression analysis of data
provided data evaluating studies with multiple research factors and the correlation among
their relationships (Cohen, Cohen, West, & Aiken, 2003). I examined ordinal regression
analysis if the Independent Variables (IV) of age and self-efficacy scores were predictive
of survey responses in the Dependent Variable (DV) technology integration behaviors.

58
A factor analysis validated results for each survey category. Self-efficacy beliefs,
technological practices used in instruction, technological social work practice options
taught, education on ethical integration of technology, and specific curriculum addressing
the impact of the digital divide on social work populations included variables being used
during ordinal regression statistical analysis.
I analyzed the collected data by using ordinal regression analysis. The age
categories of DISWF and CTIS self-efficacy scores served as independent variables for
exploration of the relationship to each DV. Specific assumptions needed to be tested for
use of ordinal regression in data analysis (Osborne, 2015). The independent and
dependent variables were measures at an ordinal level. I tested the IVs for multi-
collinearity and proportional odds. I completed the statistical tests for the appropriate use
of ordinal regression analysis with SPSS as the software database. Qualtrics and SPSS for
quantitative and MAXQDA 11 for qualitative analysis identified significant data
outcomes.
I identified multicollinearity, homogeneity of variance, normality, outliers, and
missing data during data screening. During data analysis, I identified each suspected
outlier as having a value of 1.0 or higher, when data cleaning through identifying missing
data. I sorted this missing data into three categories: (a) missing not at random (MNAR),
(b) missing at random (MAR), and (c) missing completely at random (MCAR)
determining the significance for inclusion or exclusion in the results (Osborne, 2015).
Data in the missing categories explicitly detailed inclusion or exclusion. I performed a

59
data cleaning analysis through binary logistic regression analysis to support the
screening.
Initially, data collected from this study I used for a descriptive analysis for trend
analysis (Creswell & Plano Clark, 2011). I used ordinal regression analysis to examine
the relationship between IV and DVs of each hypothesis. The two IVs tracked were age
category and self-efficacy scores.
I applied the correlation coefficient R to identify the relation of digital immigrant
status and self-efficacy. Separate DVs of technological practices used in instruction,
technological social work practice options taught, and specific curriculum were indicators
of the impact of the digital divide on social work populations producing the data results
(Cohen et al., 2003). B coefficients were the determinants of whether the relationship
between the IV and DV were positive or negative (Cohen et al., 2003).
I used factor analysis to determine whether common factors existed within
questionnaire variables (Osborne, 2015). Other relationships explored between IVs and
DVs included personal and educational institution demographics and pedagogical
behaviors. Specific testing types for quantitative hypotheses and qualitative research
questions are in Table 1.
Table 1
Data Analysis Matrix
Research questions Data sources Data analysis
Hypothesis 1 CTIS, Survey Ordinal Regression, Factor Analysis
Hypothesis 2 CTIS, Survey Ordinal Regression, Factor Analysis
Hypothesis 3 CTIS, Survey MLR, Factor Analysis Question 1 Demographics, Survey, Descriptive quantitative and
60
Interviews Qualitative analysis Question 2 Demographics, Survey,
Interviews Descriptive quantitative and Qualitative analysis
I identified confounding variable identities through hierarchical analysis of data
by ranking the variables (Bursac, Gauss, Williams, & Hosmer, 2008). A stepwise
selection identified which effects I should select for inclusion in the model (Bursac et al.,
2008). I interpreted the results from the remaining data thorough calculation of
confidence intervals at 95% for point estimates (Osborne, 2015).
Qualitative Plan
Coding data is one method to understand qualitative inquiry (Saldana, 2013). This
mixed methods study used a grounded theory, two phase approach to coding, with an
initial and then focused analysis (Charmaz, 2006). The data coding included material
from open-ended questions, interviews, and memo writing.
The first coding phase included a collection of words and phrases significant to
the variables. I sorted variables derived from each questionnaire by code variables of
individually numbered cases. I used MAXQDA 11 software for mixed methods data
analysis. MAXQDA 11 allowed code variables to connect attributes and text segments
(Kuckartz, 2014). Attribute coding provided description about study participants and
social work educational practices.
Additionally, the initial phase involved an analysis of magnitude codes.
Magnitude codes allowed survey behaviors to be quantified for frequency and
participation in technology integration activities. In order to develop a connection
between attribute and magnitude coding, I added pattern coding to the second phase of
61
data analysis. Pattern coding provided a framework to develop the major themes of the
data collected (Charmaz, 2006; Saldana, 2013).
Theming the data occurred throughout both phases to identify information or
directly addresed the phenomena in the study (Saldana, 2013). Crosstabs comparisons of
data displayed coded data in a quantitative format for analysis (Kuckartz, 2014).
MAXQDA 11 software processes integrated the coding in phases one and two with the
quantitative data obtained in the survey (Kuckartz, 2014). Significant examples given by
DISWE were useful in identifying relationships between meaning and integration of
technology quantitative results.
Discrepancy of data can occur through contaminated observations and from a rare
case data (Cohen et al., 2003). I minimized contaminated observations in this study by
using an expert researcher in assessment of research procedures and evaluation of
diagnostic statistics when data collection was complete. I checked my research notes and
interview coding for procedural irregularities, which may have contaminated the data.
Rare case data can occur due to valid, but unique individuals within the study
(Cohen et al., 2003). I analyzed rare cases for either elimination or identification of a
significant occurrence impacting an unexpected finding or problems with the regression
model. Then, I identified and evaluated the outlying data and their consequences within
the study.
Integration of Qualitative and Quantitative Data
I integrated data from the quantitative and qualitative analysis after separate
analysis of data sets in a convergent design (Creswell & Plano Clark, 2011). Closed and

62
open-ended questions with interviews provided different data sets complementing the
information about the DISWE beliefs and behaviors. I synthesized content data from each
data set in analysis to identify themes for a data-validation variant from the open-ended
questions and interviews. Similarities and differences in results were examined. This
convergent design triangulated method provided the ability to identify the significance of
statistical results with qualitative information provided in-depth understanding of the
topic for transferability.
Validity in mixed methods research is a controversial topic. Qualitative
researchers refuted the term validity due to the inability of results to be observed as truth
(Onwuegbuzie & Johnson, 2006). Qualitative researchers viewed many realities, not one
truth, for research results. Mixed methods researchers developed inferences or meanings,
ranging from purely quantitative to purely qualitative, about study findings to bridge this
gap in interpretation (Tashakkori & Teddlie, 2003, p. 71-73). The threat to inference
quality in mixed methods research can occur during research design, data collection, data
analysis and data interpretation (Onwuegbuzie & Johnson, 2006).
Increasing internal inference quality is accomplishable through within-design
consistency, conceptual consistency, interpretive consistency, and interpretive
distinctness (Tashakkori & Teddlie, 2003). Consistency was possible through the use of a
qualitative data collection program, MAXQDA, appropriate sample size, and calculation
of selected indices (Creswell & Plano Clark, 2011; MAXQDA, 2013).
I checked internal validity through triangulation of data, member checks, and
identification of research bias in this study; external validity was required for the ability
63
to replicate this research (Zohrabi, 2013). External validity was through consistency in
population choice, researcher self-awareness of position, explicit definitions of constructs
and premises, and a detailed account of research tools and procedures. Design quality and
interpretive rigor set the foundation of establishing construct validity and confirmability
(Tashakkori & Teddlie, 2010).
During the analysis and integration of data from open-ended questions and
interviews, rich descriptions added credibility and dependability to the quantitative
results (Patton, 2002). Approaches to identify confirmability added to the objectivity of
the data analysis (Hesse-Biber, 2010). A data audit at the end of the study enhanced
confirmability of the results (Hesse-Biber, 2010). Data audits can be reviews of
reflexivity to minimize my personal biases about the topic of the study (Creswell & Plano
Clark, 2011). Evaluation of qualitative data was by comparative multidisciplinary
research studies that contradicted or confirmed the data results on DISWE behaviors.
Ethical Procedures
The recruitment, data collection, and data analysis stages contained protections
for participants and their data. Recruitment materials included ethical and data collection
processes for participants. Informed consent specifically addressed content at the
beginning of each questionnaire and interview. I maintained the data with confidentiality
and anonymity. E-mail and phone calls allowed for participants to express any concerns
with the study. Data storage included a password on a hard drive and a cloud server.
This researcher was the only person with access to the personal data involved in
the study. Data will be destroyed within 5 years of publishing the dissertation. This study

64
received the approval by the IRB committee at Walden University to meet the
requirements of ethical behavior, confidentiality, and participant safety. Walden
University’s IRB approval number for this study was 03-21-16-0174700.
Summary
Data was from DISWE in this grounded theory research study to identify CTI
self-efficacy in relation to curriculum development and practice in social work education.
The mixed methods approach included triangulation of data to increase the generalization
of results (Hesse-Biber, 2010). The quantitative approach included demographics, a
modified version of the Wang et al. (2004) CTI survey and behavior specific Likert
questions. The qualitative portion of this survey included two open-ended questions in
the overall survey and four interviews with DISWE. The process of data collection and
analysis in Chapter 3 provided an avenue for evaluation of validity and replication. The
analysis of the data for this study’s quantitative and qualitative approaches and an
explanation of their significance are presented in Chapter 4.

65
Chapter 4: Results
Introduction
The results from the analysis of quantitative and qualitative data are in this
chapter. The purpose of this study was to explore the CTI by DISWE in three areas: (a)
curriculum, (b) pedagogy, and (c) inclusion of technological solutions with vulnerable
and marginalized populations.
The three quantitative research questions guiding the study were as follows:
RQ1: How did DISWE’s CTI self-efficacy impact integrating technology in
curriculum development, pedagogy, and practice strategies?
RQ2: What were the relationships between DISWEs CTI self-efficacy and the
number of digital options taught to students for integration into their social work
practice?
RQ3: What was the relationship between CTI self-efficacy of DISWE and their
ability to address digital divide issues in social work practice with students?
In the qualitative portion of the study, I explored how DISWE perceived
technological processes being integrated into their pedagogy, curriculum, and practice
outcomes. There were two qualitative questions explored:
RQ1: How did Digital Immigrant Social Work Educator’s Computer Technology
Integration self-efficacy of impact integrating technology in curriculum development,
pedagogy, and practice strategies?
66
RQ2: How did Digital Immigrant Social Work Educators Computer Technology
Integration self-efficacy impact instruction of technological resources for social work
systems experiencing digital inequities?
Organization of Chapter 4
The research results of this study in Chapter 4 are included in four sections. The
first is an overview of the data collection process. The second presents a breakdown of
the descriptive and factor analysis of data validating the model used. In the third ,
presentation of each quantitative and qualitative hypothesis with multinomial logistic
regression and thematically relevant interview data. The fourth is a summary of the
significant findings leading to the fifth chapter.
Demographics
I sent the CTIS survey to social work educators in the United States through
survey software, Qualtrics. Using the accredited programs list from CSWE’s website, I
obtained emails of faculty by visiting the university’s social work department website or
using a search engine to find faculty addresses, if not disclosed on the department’s
website. Age identification and full-time faculty status was through demographic survey
questions. Returned surveys totaled 439 of 5,668 DISWE potential participants, with n =
396 being the final participant number not having missing data. DISWE identified their
age group from four valid choices seen in Table 2.

67
Table 2
Completion of Survey by Age
Age group Frequency Percent
(2) 35 - 44 years old 117 26.7
(3) 45 - 54 years old 120 27.3
(4) 55 - 64 years old
133 30.3
(5) 65 and over 69 15.7
Total 439 100
Consistency of demographics for this study correlates with the CSWE (2014)
statistics on social work education. These results had correlations with age, gender, and
faculty status. The largest portion (41.4%) of full time faculty members identified their
ages as over 55 with the gender breakdown including 97 (22.1%) males and 342 (77.9%)
females. Distribution of full time faculty positions of participants consisted of 59 (13.6%)
non tenured, 8 (1.8%) visiting professors, 24 (5.5%) instructors, 24 (6.5%) lecturers, 96
(22.1%) tenure track, 177 (40.8%) tenured, and other 42 (9.7%).
I randomly selected 30 participants with SPSS for their comments in the
qualitative portion of the survey. The qualitative portion sample was through two
different methods, two open-ended questions (N = 30) on the CTI survey, and a
purposeful Skype interview with four DISWE. I chose these participants through a
snowball sampling of my social work contacts, who could identify other colleagues for
interviewing whom I did not know. DISWE, for the qualitative portion, met the criteria
and held a full-time status as a faculty member of an accredited BSW or MSW social
work program.
68
Data Collection
The survey distribution, using Qualtrics survey system, started in April of 2016
and remained open for 1 month. Each survey participant received an individual access
link to reduce error. I sent out an initial email and then a follow-up email 2 weeks after
the start of the data collection process to encourage the participation of DISWE. The
qualitative data in the survey maintained the same protocol as the quantitative portion.
The four interviews occurred in May and June of 2016, after the end of the
semester for college professors. The interviewees were from a snowball sampling of
other DISWE. An email and phone call from me initiated participation in the study. The
interviews occurred on Skype and were recorded on an MP3 player. Transfer of the
interviews onto a separate hard drive stored all research materials. The transcription took
place during June and July. After transcription, each interviewee verified his or her
interview content for approval of use in the study.
Variations in Data Collection
Four issues arose in the data collection process. The first issue involved obtaining
the contact information from the CSWE. Upon contacting CSWE for purchase of their
contact list, I learned that the contact list consisted of home addresses only. CSWE does
not collect email addresses for use in a purchase list. The CSWE website provided a list
of all accredited programs to collect email addresses by visiting each school of social
work faculty website where collection of full time faculty names and email addresses
occurred. This number totaled 5,668 social work educators.

69
The second issue involved timing of the qualitative interviews. Initially,
qualitative surveys through Skype were to be completed during the open survey time
frame. The time period at the end of the semester proved difficult for the face-to-face
interviews. I scheduled the interviews at the DISWE’s discretion after the end of the
school term.
The third issue occurred in the options for some of the survey questions. DISWEs
gave feedback about exclusion of specific categories. This feedback included a lack of
option for field faculty, not using the full range of gender identification, and a lack of
technology use in curriculum examples specific to course area taught. A few DISWEs
identified a lack of clarity in some survey questions. Each of these areas could impact the
results of the data analysis.
Lastly, during the creation of the survey in Qualtrics, the rating system may have
been confusing due to the ranking of answers in the CTI survey questions. Efficacy rating
scale was 1 to 5, where 1 = totally agree with the question (meaning “innovator in using
technology in this question area) and 5 = disagree with the question (meaning “one of the
last to use technology” in this question area). Lower ratings represented a higher CTI
self-efficacy while higher numbers represented a lower CTI self-efficacy. Higher
numbers commonly reflect more proficiency and lower numbers a higher proficiency.
The reverse order of these results could impact the understanding of the survey outcomes.

70
Data Analysis
Factor Analysis of Survey Responses
A factor analysis of principal components determined one factor capturing the
maximum amount of variance in the twenty-one efficacy questions. This single factor
accounted for 67% of the total variance in the efficacy questions. All questions loaded
positively on the factor, so as the ratings on the efficacy questions increased, the factor
score also increased, meaning a higher score reflected lower use of technology. The
efficacy rating scale was 1 to 5, where 1 equals totally agree with the question (meaning
“innovator in using technology in this question area) and 5 equals disagree with the
question (meaning “one of the last to use technology” in this question area).
Age and CTI Self-Efficacy
I first investigated the relationship between age group and efficacy question
ratings. Younger respondents had a lower average efficacy factor score, while older
respondents had a higher average efficacy score. This means that younger respondents
tended to have lower ratings on the efficacy questions (indicating higher use of
technology), while older respondents tended to have higher ratings on the efficacy
questions (indicating lower use of technology).
Table 3
Efficacy Factor Score Statistics
Age group N Mean Std. deviation
55 & Over 167 0.25 1.04
35 to 54 202 -0.21 0.92
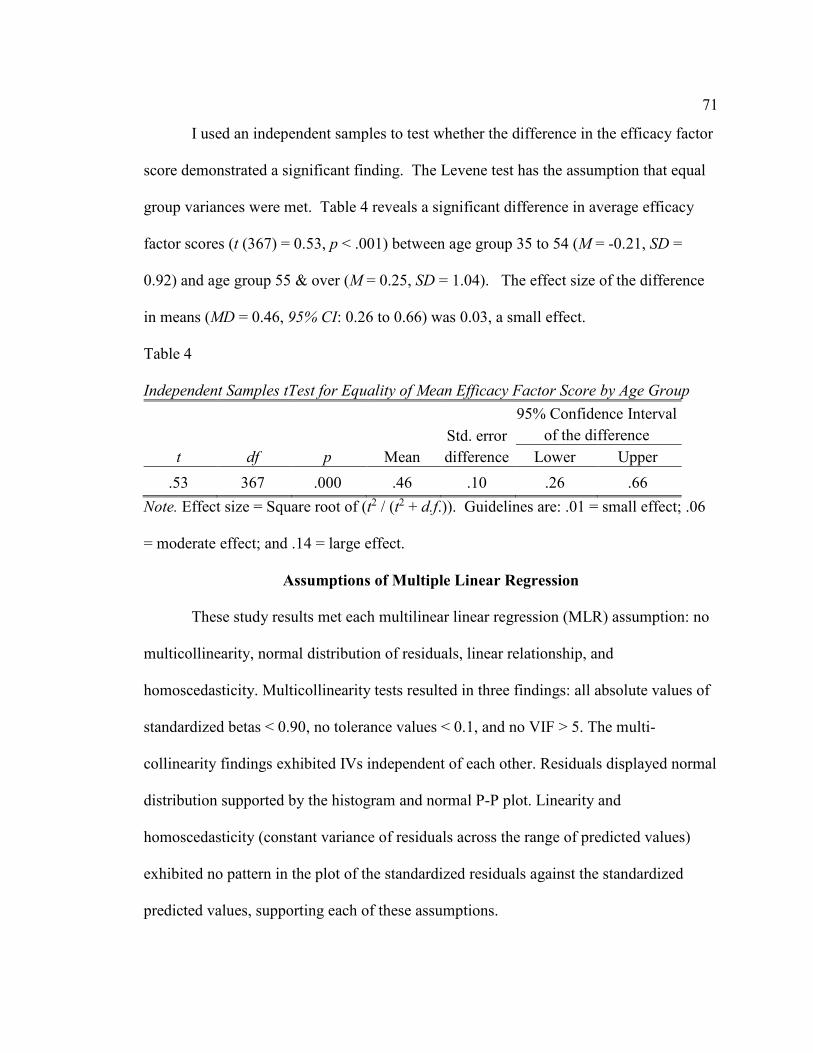
71
I used an independent samples to test whether the difference in the efficacy factor
score demonstrated a significant finding. The Levene test has the assumption that equal
group variances were met. Table 4 reveals a significant difference in average efficacy
factor scores (t (367) = 0.53, p < .001) between age group 35 to 54 (M = -0.21, SD =
0.92) and age group 55 & over (M = 0.25, SD = 1.04). The effect size of the difference
in means (MD = 0.46, 95% CI: 0.26 to 0.66) was 0.03, a small effect.
Table 4
Independent Samples tTest for Equality of Mean Efficacy Factor Score by Age Group
t df p Mean
Std. error
difference
95% Confidence Interval
of the difference
Lower Upper
.53 367 .000 .46 .10 .26 .66
Note. Effect size = Square root of (t2 / (t2 + d.f.)). Guidelines are: .01 = small effect; .06
= moderate effect; and .14 = large effect.
Assumptions of Multiple Linear Regression
These study results met each multilinear linear regression (MLR) assumption: no
multicollinearity, normal distribution of residuals, linear relationship, and
homoscedasticity. Multicollinearity tests resulted in three findings: all absolute values of
standardized betas < 0.90, no tolerance values < 0.1, and no VIF > 5. The multi-
collinearity findings exhibited IVs independent of each other. Residuals displayed normal
distribution supported by the histogram and normal P-P plot. Linearity and
homoscedasticity (constant variance of residuals across the range of predicted values)
exhibited no pattern in the plot of the standardized residuals against the standardized
predicted values, supporting each of these assumptions.

72
Research Questions
CTI Self-Efficacy and Technology Used in Instruction Methods
In this analysis, I explored age group and CTI self-efficacy scores and their
impact on the number of digital tools used in social work courses. The digital tools list
(Table 5) displayed the choices DISWE used in the survey. Using a hierarchical multiple
regression, the age group and CTI self-efficacy factor score (independent variables)
displayed a significant relationship with the number of digital tools used (dependent
variable). The regression occurred hierarchically, with age group entered as the first
block and CTI self-efficacy factor score as the second block.
Model 1 included age group as a set of dummy variables: Group 1 (age 35 to 44),
Group 2 (45 to 54), and Group 3 (55 to 64). Group 4 (65 & over) withheld as the
reference category. The regression model with age group as the only predictor was not
significant (F (3, 365) = 1.94, p = .123). In Model 2 (Block 2), age group and CTI
efficacy factor score were included as the independent variables. The regression model
displayed significant findings (F (4, 364) = 30.36, p < .001). The R2 for the model
indicated 0.25, meaning the model accounted for about 25% of the variance in the
dependent variable, the number of digital tools used. Table 5 shows the coefficients.
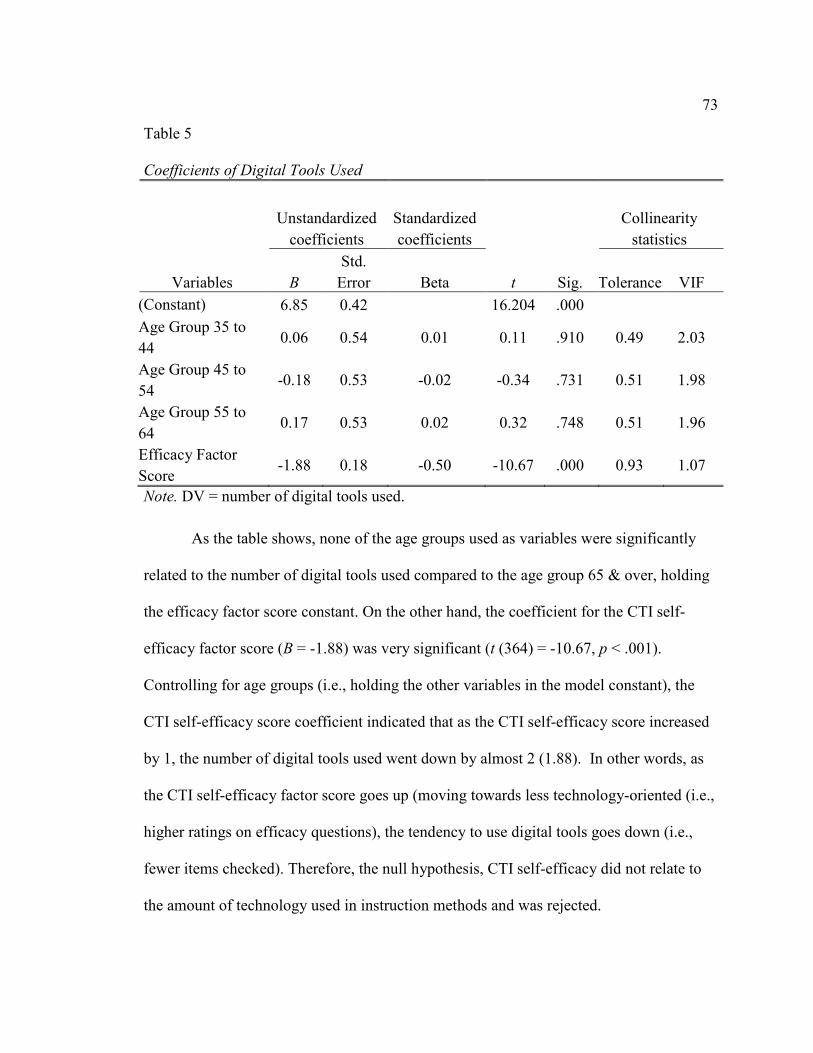
73
Table 5
Coefficients of Digital Tools Used
Variables
Unstandardized
coefficients
Standardized
coefficients
t Sig.
Collinearity
statistics
B
Std.
Error Beta Tolerance VIF
(Constant) 6.85 0.42 16.204 .000
Age Group 35 to
44 0.06 0.54 0.01 0.11 .910 0.49 2.03
Age Group 45 to
54 -0.18 0.53 -0.02 -0.34 .731 0.51 1.98
Age Group 55 to
64 0.17 0.53 0.02 0.32 .748 0.51 1.96
Efficacy Factor
Score -1.88 0.18 -0.50 -10.67 .000 0.93 1.07
Note. DV = number of digital tools used.
As the table shows, none of the age groups used as variables were significantly
related to the number of digital tools used compared to the age group 65 & over, holding
the efficacy factor score constant. On the other hand, the coefficient for the CTI self-
efficacy factor score (B = -1.88) was very significant (t (364) = -10.67, p < .001).
Controlling for age groups (i.e., holding the other variables in the model constant), the
CTI self-efficacy score coefficient indicated that as the CTI self-efficacy score increased
by 1, the number of digital tools used went down by almost 2 (1.88). In other words, as
the CTI self-efficacy factor score goes up (moving towards less technology-oriented (i.e.,
higher ratings on efficacy questions), the tendency to use digital tools goes down (i.e.,
fewer items checked). Therefore, the null hypothesis, CTI self-efficacy did not relate to
the amount of technology used in instruction methods and was rejected.

74
The “other specify please” category revealed a variety of technology tools used in
the classroom. A lack of clarity existed in the reasons DISWE used this category. Many
of the specific types of digital tools correlated with the categories for the question. An
example of this was Moodle and Blackboard as a specific other. I question whether
DISWE identified their specific Learning Management System or they did not understand
the meaning of the categories. One significant flaw in the question exhibited itself in the
“other” category. Social media, unknowingly omitted from the list, may present an issue
with reliability.
Relationship between CTI Self-Efficacy and Digital Options Instruction With
Students
In the second research question, I explored age group and the CTI self-efficacy
factor score with the types of technology-integrated curriculum and pedagogy used to
educate students in social work courses. Nine different areas identified DISWE behaviors
using digital curriculum and pedagogical options. The frequency of use rating was
broken into three groups: (a) never or rarely used, (b) sometimes used, and (c) often used
or used in every course. The use of MLR determined whether the age group and efficacy
factor score had an impact on the respondent’s age group. Thus, for each of the nine
MLRs, the DV frequency of use group (with “sometimes used” as the reference category)
and the independent variables age group and efficacy factor score categorized the results.
In each MLR, age group had no significant impact on a respondent’s frequency of
use group, but was kept in the model to control for age. Appendix F shows the MLR
results. Controlling for age group (i.e., holding the other variables in the model

75
constant), the Exp (B) value shows how the CTI self-efficacy factor score affected the
likelihood of being in the “never or rarely used” group compared to the “sometimes used”
group and the likelihood of being in the “often used or used in every course” group
compared to the “sometimes used” group. The following adds to the explanation of
impact in data results:
1. An Exp (B) > 1 represented an increased likelihood of being in the target
group as opposed to the reference group.
2. An Exp (B) < 1 represented a decreased likelihood of being in the target group
as opposed to the reference group.
3. An Exp (B) ≈ 1 indicated the independent variable had little or no impact on
the likelihood of being in the target group as opposed to the reference group.
All MLR results for the survey are in Appendix F. Using the preceding table, two
examples of the MLR results process follows for the second hypothesis.
1. DV, Q17 (1), identified how often DISWEs educate students about technology
in social work practice during their courses in “Role plays or vignettes
including technology examples.” Controlling for age group, if the CTI self-
efficacy factor score increased by 1, then the odds of being in the “never or
rarely used” group compared to the “sometimes used” group increased by a
factor of 1.62, or increased by 62% (Exp (B) = 1.62, p < .001.). The CTI self-
efficacy factor score did not have a significant impact on the odds of being in
the “often used or used in every course” group compared to the “sometimes
used” (p = .11).

76
2. DV, Q17 (2) had DISWEs identify whether they usde… “Specific examples
of systems using technology to solve social justice issues”. Controlling for age
group, if the CTI self-efficacy factor score increased by 1, then the odds of
being in the “never or rarely used” group compared to the “sometimes used”
group increased by a factor of 1.42, or increased by 42% (Exp (B) = 1.42, p =
.01.). If the CTI self- efficacy factor (controlling for age group) score
increased 1, then the odds of being in the “often used or used in every course”
group compared to the “sometimes used” group decreased by a factor of 0.41,
or decreased by 59% (Exp (B) = 0.41, p < .001.).
The methods of curriculum development and pedagogy analysis displayed mixed
results for hypothesis testing. My determination rejecting the null hypothesis occurred for
DVs 1,2,3,4,5,7, and 13 in the “never or rarely in each course” category and DVs
2,3,4,5,7, and 8, in the “often in every course” category. In the evaluation of DV’s 8 and
9 in the “never or rarely in each course” category coupled with DV’s 1 and 13 “often in
every course,” review of the data led to an acceptance of the null hypothesis (see
Appendix D).
CTI Self-Efficacy and Ability to Address Digital Divide With Students
The third research question involved age group and CTI self-efficacy factor score
with DISWE’s awareness in addressing digital divide issues with students. Two different
questions identified DISWE behaviors using digital curriculum and pedagogical options
addressing the digital divide. The frequency of use rating had 3 groups as in the second
DV: (a) never or rarely used; (b) sometimes used; and (c) often used or used in every
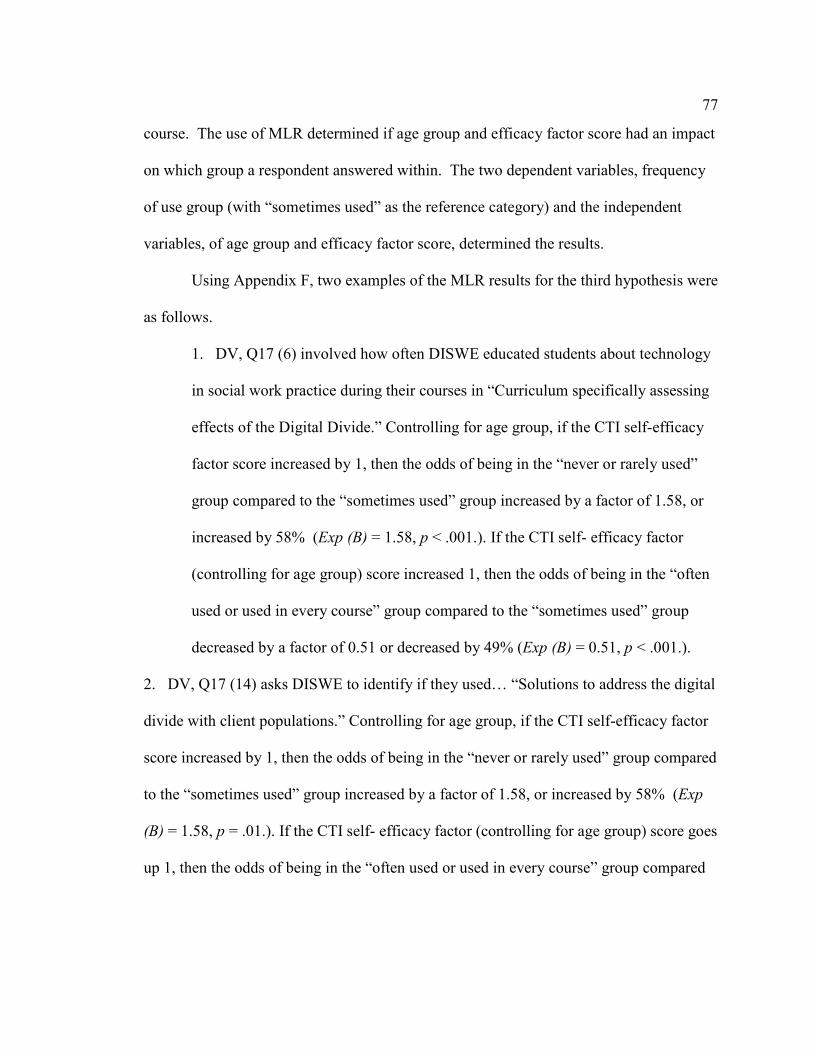
77
course. The use of MLR determined if age group and efficacy factor score had an impact
on which group a respondent answered within. The two dependent variables, frequency
of use group (with “sometimes used” as the reference category) and the independent
variables, of age group and efficacy factor score, determined the results.
Using Appendix F, two examples of the MLR results for the third hypothesis were
as follows.
1. DV, Q17 (6) involved how often DISWE educated students about technology
in social work practice during their courses in “Curriculum specifically assessing
effects of the Digital Divide.” Controlling for age group, if the CTI self-efficacy
factor score increased by 1, then the odds of being in the “never or rarely used”
group compared to the “sometimes used” group increased by a factor of 1.58, or
increased by 58% (Exp (B) = 1.58, p < .001.). If the CTI self- efficacy factor
(controlling for age group) score increased 1, then the odds of being in the “often
used or used in every course” group compared to the “sometimes used” group
decreased by a factor of 0.51 or decreased by 49% (Exp (B) = 0.51, p < .001.).
2. DV, Q17 (14) asks DISWE to identify if they used… “Solutions to address the digital
divide with client populations.” Controlling for age group, if the CTI self-efficacy factor
score increased by 1, then the odds of being in the “never or rarely used” group compared
to the “sometimes used” group increased by a factor of 1.58, or increased by 58% (Exp
(B) = 1.58, p = .01.). If the CTI self- efficacy factor (controlling for age group) score goes
up 1, then the odds of being in the “often used or used in every course” group compared

78
to the “sometimes used” group decreased by a factor of 0.36, or 64% (Exp (B) = 0.36, p
< .001.).
In each MLR, age group continued to exhibit no significant impact on a
respondent’s frequency of use group, but I kept in the model to control for age (See
Appendix D) Controlling for age group the Exp (B) value showed how the CTI self-
efficacy factor score influenced the likelihood of occurring in the “never or rarely used”
group compared to the “sometimes used” group and the likelihood of being in the “often
used or used in every course” group compared to the “sometimes used” group. An Exp
(B) > 1 represented an increased likelihood of being in the target group as opposed to the
reference group. The findings in Appendix D lead to my rejection of the null hypothesis.
Qualitative Results
The qualitative portion of this study was an exploration of the DISWE’s self-
concepts and identities in their CTI self-efficacy within three areas: (a) curriculum
development, (b) pedagogy, and (c) issues of the digital divide in social work education.
The central qualitative question was “How did digitally immigrant social work educators
perceive technological processes being integrated into their approaches to pedagogy,
curriculum and practice outcomes?”
RQ1: How did DISWE’s CTI self-efficacy impact integrating technology in
curriculum development, pedagogy, and practice strategies?
RQ2: How did DISWE’s CTI self-efficacy impact instruction of technological
resources for social work systems experiencing digital inequities?

79
Process of Data Coding
Using constructivist grounded theory coding, I examined data collected from
open-ended questions, interviews, and memo writing (Charmaz, 2006). The start of my
coding began with evaluating magnitude codes for perception of CTI self-efficacy of
DISWE in the open questions (Saldaña, 2013). My examination of open questions led to
four categories of magnitude coding; excellent, proficient, somewhat, and minimal.
Outlier Initial line by line analysis of data led way to identifying focused coding for
model significance. Theoretical categories evolved from my examining the focus coding
trends. Data from interview answers and memos offered me insight into positive and
negative CTI self-efficacy of DISWE described in the data obtained from the open survey
questions. The coding of in-person interviews provided rich content to give additional
insight into CTI with DISWE.
The initial sample within the proposal identified 30 random samples of DISWE
responses. Initially, the magnitude codes provided a varied sample from the 30 responses.
As I began the open coding process, the answers chosen did not reflect the entirety of rich
data available within the comments. While some comments minimally addressed the
questions (“very effective”), other answers provided a snapshot of the participant’s
knowledge on the subject. The lack of saturation in the open coding process for both
hypotheses led to my decision of including all open ended answers in the analysis of data.
The number of DISWE answering both questions (n=260) slightly differed from DISWE
answering only one question. Table 6 (Q40 comment frequency) and Table 7(Q41
comment frequency) have the identified discrepancies in the number of respondents for

80
each open question in the survey. Over half of the survey respondents (Q40=59%,
Q41=56%) answered at least one open question. I found no clear reason for a lack of
participation in DISWEs who did not fill out the survey questions. Table 8 displays
participants age ranges.
Table 6
Q40 Comment Frequency
Frequency Percent Valid percent Cumulative
percent
Valid
0 No Comment 182 41.5 41.5 41.5
1 Comment
provided
257 58.5 58.5 100.0
Total 439 100.0 100.0
Table 7
Q41 Comment Frequency
Frequency Percent Valid percent Cumulative
percent
Valid
.00 193 44.0 44.0 44.0
1.00 246 56.0 56.0 100.0
Total 439 100.0 100.0

81
Table 8
Q4 Current Age
Frequency Percent Valid percent Cumulative
percent
Valid
2 35 - 44 years old 56 21.5 21.5 21.5
3 45 - 54 years old 80 30.8 30.8 52.3
4 55 - 64 years old 73 28.1 28.1 80.4
5 65 over 51 19.6 19.6 100.0
Total 260 100.0 100.0
Self-Identification of CTI Efficacy in Curriculum Development and Pedagogy
Early adopters self-identified by using the term “early adopter” and evaluating
their efficacy in different terms as “I feel effective” or “fairly strong.” Early adopter
definitions ranged from a short statement of confidence to behaviors encompassing the
meaning of the term. Mentoring relationships with other faculty, writing journal articles
or books promoting technology integration in social work, and an embracing of the
challenge technology innovation brings to their profession stood out among the less
remarks. Comments included: “Very effective. I think technology enhances learning and
I am willing to learn and implement technological advances to support learning in the
classroom.” “I feel very effective. There are projects that I embed into the
classroom/activities that include technology as one of the processes which to complete
the assignment.”
Even with self-identified CTI efficacy the definition of the DISWE perceived
effectiveness included a narrow scope of technology uses. Technology course tools

82
exemplified CTI behavior responses. DISWE included specified use of pedagogy (how
they teach) as testament to their technology self-efficacy. The most frequent example of
pedagogical technology integration (n=30) consisted of using a Learning Management
System with students. Respondents defined use of LMS systems as proof of their self-
efficacy with technology integration.
DISWEs described their effectiveness with familiarity of a pedagogical tool
instead of technology’s use in the field. DISWE stated: “I regularly use Blackboard and
present learning materials, using online technology, such as having a recorded
PowerPoint lecture formatted into a movie, incorporating streaming videos into learning
materials and have students submit their own videos form my review.” “Very effective, I
was one of the first to teach online courses in my school,” and “I teach online and am
committed to providing distance education as a social justice effort.” Examples about
curriculum development rarely surfaced in self-definitions of CTI efficacy. Table 9 has
the top nine frequencies isolated in the second phase of the open coding process.
Significant themes arose from the open question data.
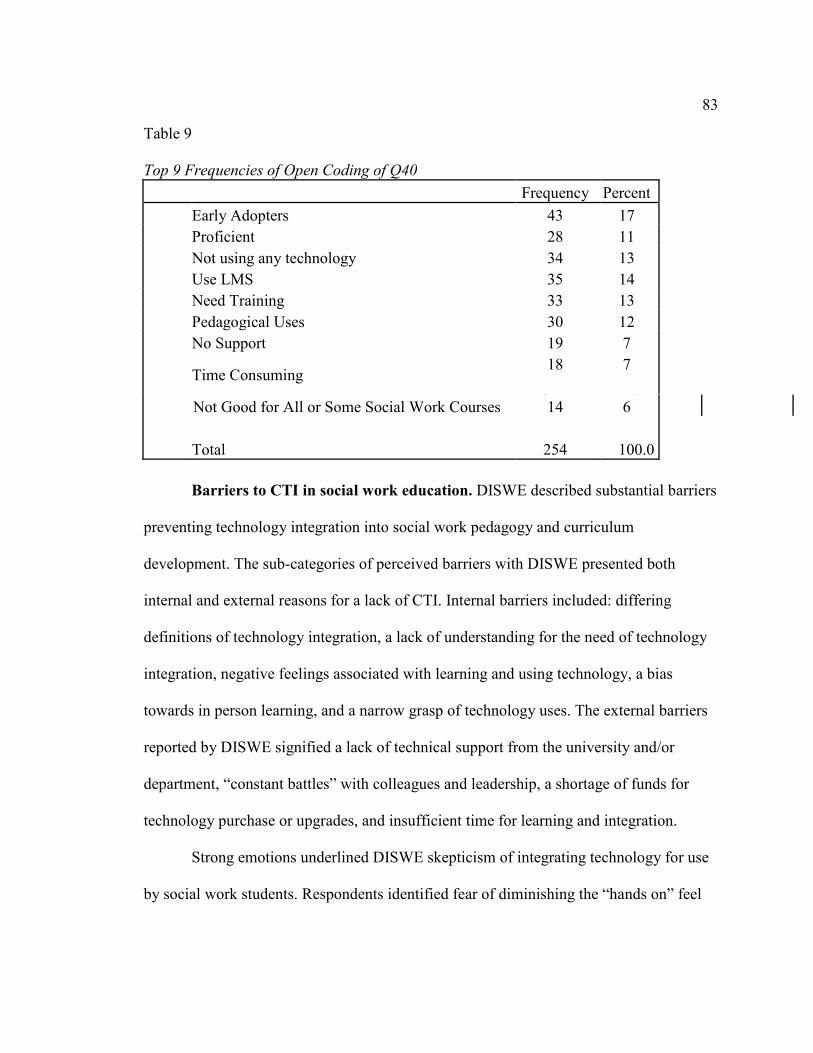
83
Table 9
Top 9 Frequencies of Open Coding of Q40
Frequency Percent
Early Adopters 43 17
Proficient 28 11
Not using any technology 34 13
Use LMS 35 14
Need Training 33 13
Pedagogical Uses 30 12
No Support 19 7
Time Consuming 18
7
Not Good for All or Some Social Work Courses 19
Total
14
254
6
100.0
Barriers to CTI in social work education. DISWE described substantial barriers
preventing technology integration into social work pedagogy and curriculum
development. The sub-categories of perceived barriers with DISWE presented both
internal and external reasons for a lack of CTI. Internal barriers included: differing
definitions of technology integration, a lack of understanding for the need of technology
integration, negative feelings associated with learning and using technology, a bias
towards in person learning, and a narrow grasp of technology uses. The external barriers
reported by DISWE signified a lack of technical support from the university and/or
department, “constant battles” with colleagues and leadership, a shortage of funds for
technology purchase or upgrades, and insufficient time for learning and integration.
Strong emotions underlined DISWE skepticism of integrating technology for use
by social work students. Respondents identified fear of diminishing the “hands on” feel

84
of social work. As one DISWE stated, “I believe that the wholesale adoption of
technology, because ‘we can’ is threatening the integrity of future generations of social
workers.” A dichotomy of technology self-efficacy in social work education was in the
following comment: “I feel as effective as anyone. I am skeptical about how useful
technology is except as an enhancement to communication and data management and
analysis. I feel like we lose a lot when we have to teach online as social work is about
relationships.” Another DISWE described their futility regarding CTI as “I am really
tired of having to learn new things ALL THE TIME. I also do not see any improvement
in communication…In fact, I think sometimes it is worse. I’m not sold on this…know it
is here…ready to retire before I am entirely lost…and part of me does not want to keep
up.”
One of the face-to-face interviewees with a high amount of CTI efficacy stated
this about the emotions of DISWE around tech instruction: “There are only a couple of us
that do this (CTI). I do this; my wife does it. Um, a couple others have tried it, but haven't
stuck with it; um, they're just not comfortable with the technology. Um, and so it's
something that we have a lot of conversation around with our peers, and we've actually
done some hand holding. And you know tried to lay it out for them and here's what it can
look like and here's the value of it and they'll try it, but I think that unless you've
embraced it, you fear it, and they run away from it.”
Time is a valuable commodity among educators. The rapid upgrading of
technology and surfacing of new processes is communicated through the data in concerns
of time constraints. As one DISWE expressed: “due to uncompensated time required (to)

85
develop and integrate technology in curriculum development, I am not motivated to put
for the effort.” The learning curve for technology presents a need for DISWE to choose
between traditional course content and the addition of technology as this quote illustrates:
“I am (an) advocate for this integration of technology in course(s). However, we are often
burdened by limited resources and heavy teaching loads. If we are provided a course
reduction, I am certainly willing to adapt more technology pieces into current curriculum.
A lack of support for resources and training add to the discomfort DISWE feel
toward technology integration “I am overwhelmed and anxious about this. I know that
it’s very important, but I don’t know where to get help to learn about all the tools first
listed in this survey.” At other times faculty or administration hinders CTI, “The majority
of my department remains skeptical of technology or refuse to use it,” and “There are
some technologies I would like to use but my university didn’t support.” DISWE relied
on university resources, department experts, and student knowledge to support their
learning track for using technology.
One of the DISWEs discussed their place as a technology integrator at their
university: “The students- I am the only one in my department that's using technology
largely out of a faculty of nine. We're all full-time. I told you we're spread across three
campuses, and I am the technology user. So I have coworkers that are asking me to show
me how to use, teach me how to use Google Community, so I want to make sure as I'm
teaching these things to the students, that they're understanding the importance of how to
do this.”
86
Constructive views on CTI in social work education. While the data collected
conveyed many barriers to CTI integration in social work education, educators expressed
an almost enthusiastic openness to learn about technology. Comments about appropriate
technology uses qualified as discrepant cases and included in the results for a greater
understanding of behaviors. One DISWE stated: “I feel with the proper training that I am
currently receiving, my ability to integrate technology in curriculum development and
pedagogy will be awesome. I will have the ability to reach the students in a way they will
learn and properly implement the knowledge, skills and values a true worker exhibits in
the field.”
Some DISWEs are motivated by their interest in learning how technology could
help social work populations, “I am curious about technology and its impact on
competent service to client systems. This curiosity is beneficial and prompts me to try
new things.” One 30 year veteran of social work education was “motivated to learn in
order to best equip social workers for this time and the future to practice well. That
includes becoming proficient myself in all nuances of technology.” DISWEs are willing
to learn about CTI if given the training and time to navigate the new technologies.
Early adoption of technology characterized each of the four face to face
interviews. These interviews focused on the DISWEs perceived CTI self-efficacy with
curriculum, pedagogy and addressing the digital divide. Each interviewee voiced their
mediocrity with technology as technical support, but as the interview continued CTI
behavior identified them in the early adopter position for social work. One DISWE
stated: “I would say that I'm on a scale 1-10 I’m probably about a 5. I think that I can
87
support them halfway. If it's a simple issue, if it's a software issue or connectivity issue, I
don't even know where to begin. I mean, thankfully (my university) has really good
support, so.”
Data from the in person interviews and survey questions underlined a
misunderstanding in the difference between CTI in social work education and the
functions of a help desk position. Even as early adopters, the content clearly focused on
pedagogy vs. curriculum development with both the answers given to the survey question
and the in person interviews. The focus of both quantitative and qualitative data results
supports the focus on pedagogy using technological tools and not CTI into curriculum.
Effectiveness of DISWE providing education about the digital divide. The
qualitative data collected about DISWEs CTI of education and techniques addressing
populations experiencing a digital divide exhibited a clear disconnect. When questioning
DISWEs not feeling effective in their delivery of information regarding the digital divide,
43% did not feel effective. As shown in Table 10, the frequency of not being effective in
teaching about the digital divide well surpassed any other category.

88
Table 10
Top 8 Frequencies of Open Coding for Q41
Frequency Percent
Effective 52 16 Somewhat Effective 20 6 Not Effective 138 43 Unclear on definition of Digital Divide/Inequities 33 10 Not Applicable to Course or Social Work 21 6 Should Address in the Future 21 6 Need Training to Address this Issue 21 6 Students Initiate Discussions of Digital Inequities 18 6 Total 324 99.0*
Note. *Not 100% due to rounding of numbers
Barriers to providing education on the digital divide. A struggle about defining
the term, digital divide, surfaced during the second phase of open coding. DISWEs
described their understanding of digital divide with terms used for other phenomena.
These phrases included: “I find it can be problematic if there is not sufficient IT support.”
“Some of my students experience internet outages and bandwidth issues.” Educators used
digital divide to describe students divide in understanding technology instead of the
impact on social work populations. These discrepant cases signified the many definitions
DISWE hold for the term digital divide.
DISWE relied on students to already understand or teach them about the digital
divide in courses. These two DISWEs explained further: “Students are much more tech
savvy than I am, and they are aware of these inequities.” The other stated: “While
students are aware of the economic and social barriers to accessing digital technology,

89
this (is) not an area I have been effective in developing as a regular part of my classroom
or online instruction.” Students driving content manifested in comments as “I think I
could be effective, but it has never come up.” One educator exclaimed: “I learn from
students on technology—they learn from me on how to be a clinical social worker—and
how to be a macro social worker. Personal!” Student participation in driving content
frequented the comments (n=18).
The discontent and ignorance of curating CTI content is a reason for exclusion of
the topic. Explanations from faculty covered inflexibility. “All of our faculty are over 45
years old and are not comfortable or ‘do not have the time’ to teach or use new
technology or assess the use of it.” Reasons for lack of knowledge, “I don’t think I am
responsible for knowing everything” Unawareness of the significance digital divides
bring to vulnerable and marginalized populations: “I don’t see technology as part of
cultural competence for social work students as the digital divide really excludes many of
the clients social workers serve” “I think, given the market place, digital inequities will
resolve themselves.” Again, DISWEs exhibited divergent definitions concerning
technology definitions associated with social work practice.
When speaking to one of the DISWE interviewees about specific teaching of
digital inequities, they responded with both a negative and affirmative stance: “Um,
frankly, I don't. I probably talk more about that in classroom settings or depending upon
the course. Um, so now, in this HBSE course, I definitely talk about, we just talked about
children and their access to technology or limitations in access to technology based on
issues associated with socioeconomic status or with rural or urban location or parental

90
knowledge of technology. So I think it probably depends on the course and the course
content. I can't say in my LGBT diversity class that technology or access or limitations to
technology comes up as much.” Many comments reflected the ambiguity of how to
integrate technological topics into social work education.
Inclusive behavior for CTI of digital divide populations. While much of the
data I analyzed revealed a lack of implementation surrounding the impact of the digital
divide, some DISWEs displayed evidence of awareness and follow through of the
concept. One educator teaching gerontology courses expressed: “There is a need to
address the digital divide and to teach about technological interventions for older adults
including problems of ADLs/IADLs and cognitive impairment; address issues of urban
and rural elders; address elder poverty. These topics do appear in text readings, other
assigned readings, and in discussion questions. Generally students appear to learn beyond
their own myths and stereotypes about older people and technology.” Other DISWEs
described the technological inequities in the courses they teach: “I discuss this in my
social welfare policy course when I am discussing access to services, applying for social
welfare benefits, etc.” These positive discrepant cases offer a view into the future of
social work education when CTI is woven throughout course content.
Evidence of Trustworthiness
The triangulation of data addressed credibility and dependability of the research
findings. Use of qualitative and quantitative methods in a constructivist paradigm offered
an understanding of how DISWEs give meaning to the connection between technology
and social work education (Charmaz, 2006). The use of an audit trail, memo records,

91
quantitative and qualitative results from the CTI survey and interviews offer validation
from five different data points.
The thick description of qualitative questions and interviews adds to the
transferability of results for future study (Charmaz, 2006). The participants included two
men and two women who all have varying backgrounds with BSW and MSW pedagogy
and curriculum development. As a reflection of the qualitative data, I chose each of the
participants by who had at least some experience using technology in social work
education. This offered strength in understanding the progression of technology use in the
profession.
Dependability and confirmability in the study occurred through participant checks
of the qualitative interviews. Each interviewee had an option to review and respond to
their conversation content. An audit trail and use of memos developed during of the
quantitative and qualitative collection of data supported the analysis. This audit trail
document consisted of a log of emails, conversations, impressions, perceived errors, and
decision making reasoning during the research process. The audit trail included analysis,
synthesis, and intentions of decisions made through both the quantitative and qualitative
phases. The gathering of memo writings occurred during each method in the collection of
quantitative and qualitative data. A colleague reviewed my work for researcher bias in
context and content.
Adjustment of Data Analysis
The process of analyzing qualitative data in this study changed the way I thought
about technology and processing. Initially, I downloaded MAXQDA 12 software in

92
preparation for exploring qualitative data sets. As I began the open coding process in
MAXQDA I became frustrated with software impediments not being fluid in the manner
of how my thought processes organize and evaluate data. I decided to proceed with data
analysis through hand coding. I started the coding process by printing each data set
multiple times. I placed each phase of the coding process next to the subsequent analysis.
The observation of these codes in one large flow chart enabled me to conceptualize
connections between the data. The irony of my choice not to use a computer program for
qualitative data analysis does not escape me as a researcher.
Summary
Chapter 4 was a review of the findings of quantitative and qualitative data
collected about the computer technology efficacy of social work educators in pedagogical
and curriculum development. Overall, I found a relationship in each of the hypotheses
within the quantitative and qualitative data, rejecting the null hypothesis for each research
question. The second quantitative research question about digital options taught to social
work students found two questions out of each set of nine accepting the null hypothesis;
otherwise the remaining questions rejected the null hypothesis. Chapter 5 presents an
interpretation of the findings in chapter 4 with limitations of the study and future
recommendations.
93
Chapter 5: Discussion, Conclusions, and Recommendations
Introduction
This study offered a baseline of social work educators’ behaviors in addressing
technology integration into the profession through education. Technology integration into
social work can be a sensitive topic among educators. Social work is known for being a
high touch profession with the in-person relationship being highly connected to providing
ethical practice. Compounding technology integration into social work education is the
differences in perceptions generations hold about classroom technology practices
(Langan, 2016).
In this study, I offered an exploration of how digitally immigrant social work
educator (DISWE) experienced technology integration in their teaching practices.
Comments from the qualitative research revealed the concern some DISWE encounter
with the delivery of effective social work education by using technological alternatives. I
did not address the efficacy of instruction with or without using technology, but an
exploration of the relationship between technology self-efficacy and practices of DISWEs
with students.
Interpretation of the Findings
The research questions in this study explored CTI self-efficacy among DISWEs
and how they experienced CTI in curriculum development, pedagogy, and technology
inclusion with populations experiencing the digital divide. At the seed of developing a
dissertation topic about technology and social work education six years ago, little
94
research existed. The body of investigations in 2010 centered on theoretical inquiry about
CTI efficacy in social work education with few articles devoted to CTI in practice.
Six years later, more research is being completed about CTI integration into
education, but the focus centers primarily on online learning (Fitch et al., 2016; Gioia,
2016). Other fields of study acknowledge the need for models of CTI integration through
qualitative research. Courduff, Szapkiw, and Wendt (2016) in special education and
Miller (2015) in the field of documentation developed research agendas addressing the
lack of connection between pedagogy and curriculum in their respective fields.
The first research question was on CTI self-efficacy and different types of
technology for use in instruction of social work content. DISWE measures of CTI self-
efficacy exhibited a significant relationship to how many digital tools were useful in the
classroom. The qualitative results displayed a related finding as DISWE self-identified
early adopters of technology discussed a wider variety of digital tools in their examples
than those identifying barriers to their technology use (Rogers, 2003). The qualitative
interviews of DISWE using more digital tools exhibited an openness to explore new
methods of instruction and an acceptance of failure rates for some pedagogical
experiments with technology.
I uncovered a revelation in the second research question about DISWE behaviors
with technology integration in education. A thread emerged with DISWE focusing on
CTI in pedagogy, but rarely used in curriculum examples. Pedagogy is how one teaches,
and curriculum is what one teaches (Hurney, Nash, Hartman, & Brantmeier, 2016). The
focus of research studies about CTI in social work education continues to center

95
primarily on the efficacy of pedagogical methods in instruction (Colvin & Bullock, 2014;
Deepak, Wisner, & Benton, 2016; O'Connor et al., 2014; 2014; Phelan, 2015). The
emphasis of qualitative responses in this study focused on online learning and digital
pedagogical approaches with few responses addressing curriculum integration, even by
early adopters (Rogers, 2003). One observation of feedback within my qualitative survey
results, interviews, and memos was imprecise definitions and misunderstandings when
using common technology nomenclature and a general lack of specific direction with
integration of CTI teaching the practice of social work.
Four of the independent variables in the second hypothesis (Q8, Q9, Q1, and Q13)
exploring DISWE use of CTI in pedagogy and curriculum did not exhibit a significant
result. Two questions in appendix F: “Ethical use of technology practices personally (p =
.069)” and “How to use social media for advocacy (p = .068)” surfaced as not significant
for DISWE rarely using CTI. The second set of independent variables displaying a lack
of significance in the second research question’s behaviors (Q1, Q13) of “role plays or
vignettes including technology examples (p =.114)” and “evaluation of technology use
within family systems (p = .81),” exhibited no significance level toward those DISWE
using CTI behaviors frequently. These questions need more research to determine the
meaning of their lack of significance in the DISWE list of CTI self-efficacy behaviors.
While some researchers discussed the need for technology integration in social
work education, few studies connected effectiveness of social work education with
technology content for use in practice with social work populations (Mishna et al., 2012;
Mukherjee & Clark, 2012; Steyaert & Gould, 2009). Watling (2012) opened the door for

96
social workers to address digital exclusion in social work education. Digital exclusion is
the lack of benefits (e.g., economic, political, or social) experienced by people in the
digital divide. The significant finding in this study about the lack of digital divide
curriculum integration validated the need for a collaborative effort to move forward
addressing technology inequities of the DISWEs. The results from the third research
question on the DISWE self-efficacy in teaching issues related to the digital divide
yielded a significant lack of knowledge for curriculum integration both in quantitative
and qualitative data (See Appendix F and Table 10). The common admission in
qualitative data revealed DISWE were ill equipped to address digital divide content
within their courses.
Quantitative data results confirmed the hesitancy of social work educators in
integrating technology into pedagogy and curriculum. In this study, I found that DISWE
feel less confident in CTI development across pedagogy and curriculum according to age;
the older the DISWE, the less confident in their use of technology. Cooper-Gaiter (2016)
confirmed issues of anxiety and self-efficacy with technology in older adults. Participants
offered insights as to the blocks in building a CTI curriculum for social work.
The insights of DISWE offered a systems perspective not developed in the often
used technology acceptance model currently being used for CTI adoption in Figure 5
(Davis et al., 1989; Venkatest et al., 2003). As I prioritized the data, it became clear that
the technology acceptance model (TAM), while forming a base for integration, did not
capture the intricacies of the DISWE processes in technology adoption (Charmaz, 2006;
Davis et al., 1989).

97
Figure 1.Technology acceptance model.
Note. Adapted from Davis, F.D. (1989) Perceived usefulness, perceived ease of use, and
user acceptance of information technology. MIS Quarterly, 13 (3) (1989), pp. 319–340
and Venkatesh, V.; Morris, M. G.; Davis, G. B.; Davis, F. D. (2003), User acceptance of
information technology: Toward a unified view. MIS Quarterly, 27 (3), 425–478.
Social work education is a professional course of study with nationwide
expectations of curriculum consistency across programs based on EPAS of the Council
on Social Work Accreditation (CSWE, 2015). The change process in social work
education incorporates the connection between many systems until the threshold for
universal acceptance becoms embraced and then implemented into curriculum. Due to the
nature of social work education, curriculum advancement only takes place through a
concerted effort of many diverse systems. Models, such as the technology acceptance
model, addressed neither the complexity of change within social work and higher
education nor the resistance by DISWE in technology implementation (Davis et al., 1989;
Watty, McKay, & Ngo, 2016).
98
The quantitative and qualitative results of this study described factors inhibiting
DISWE usage or integration of technology in curriculum. Through analysis of
juxtaposing data describing CTI resistance and systemic limitations, a model based on
systems theory opened up the possibility of a strength-based approach to technology
adaptations and innovation. The quantitative results, qualitative statements, coding,
themes, memos, and observations of participant feedback, offered both barriers and
motivation for a method of technology integration into social work curriculum. The
social work integration model for technology (SWIM-T) is in Figure 2, with the
corresponding definitions from data analysis in Tables 9 and 10.
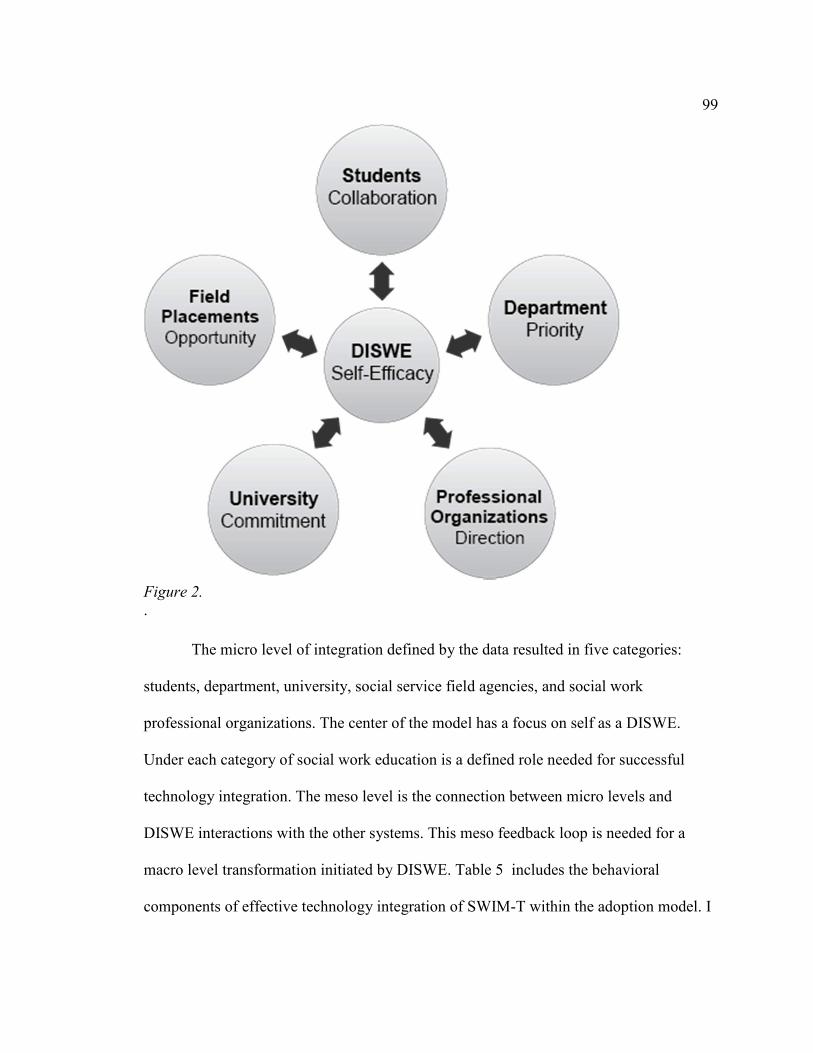
99
Figure 2. .
The micro level of integration defined by the data resulted in five categories:
students, department, university, social service field agencies, and social work
professional organizations. The center of the model has a focus on self as a DISWE.
Under each category of social work education is a defined role needed for successful
technology integration. The meso level is the connection between micro levels and
DISWE interactions with the other systems. This meso feedback loop is needed for a
macro level transformation initiated by DISWE. Table 5 includes the behavioral
components of effective technology integration of SWIM-T within the adoption model. I

100
focused on the opposite of behavioral components reported to offer a strengths-based
interpretation of quantitative and qualitative results.
Table 5
Identified Components of SWIM-T
Social work category
Identified components of effective technology integration
Technology integration role
Educators Change positive, willingness of trial and error for innovation, asking for help, silencing self-critic, educate on process not necessarily the technical aspect, teach digital citizenship over curriculum
Self-efficacy
Students Co-creators of technique and content, enlist as experts, connect technology to field assessment and evaluation, become digital citizens
Collaboration
Social service field placements
Efficacy research, Assessments of use in clinical, professional, advocacy, fundraising, and social media, ethical practices and policies, digital divide addressed
Opportunity
Department Committee development, Peer Support, Time Allocations, Mentoring (both inter and intra disciplinary), policies supporting quality improvement
Priority
University Support technology innovation strategies in higher education, Strategic plan inclusion of technology, Use of Experts/consultants in planning and execution, Acquisition and implementation of technology resources
Commitment
Professional organizations
Specific CSWE implicit and explicit EPA’s across competencies, Ethical standards for the profession, CEU training mandates nationwide, Collaboration with macro level resources to address digital divide inequities and increase technology funding for social work services and education
Direction
One finding needing further research is an addition of a CTI self-efficacy
component to TAM (Davis et al., 1989; Venkatest et al., 2003). This study provided
information needed on CTI self-efficacy for technology integration in higher education.
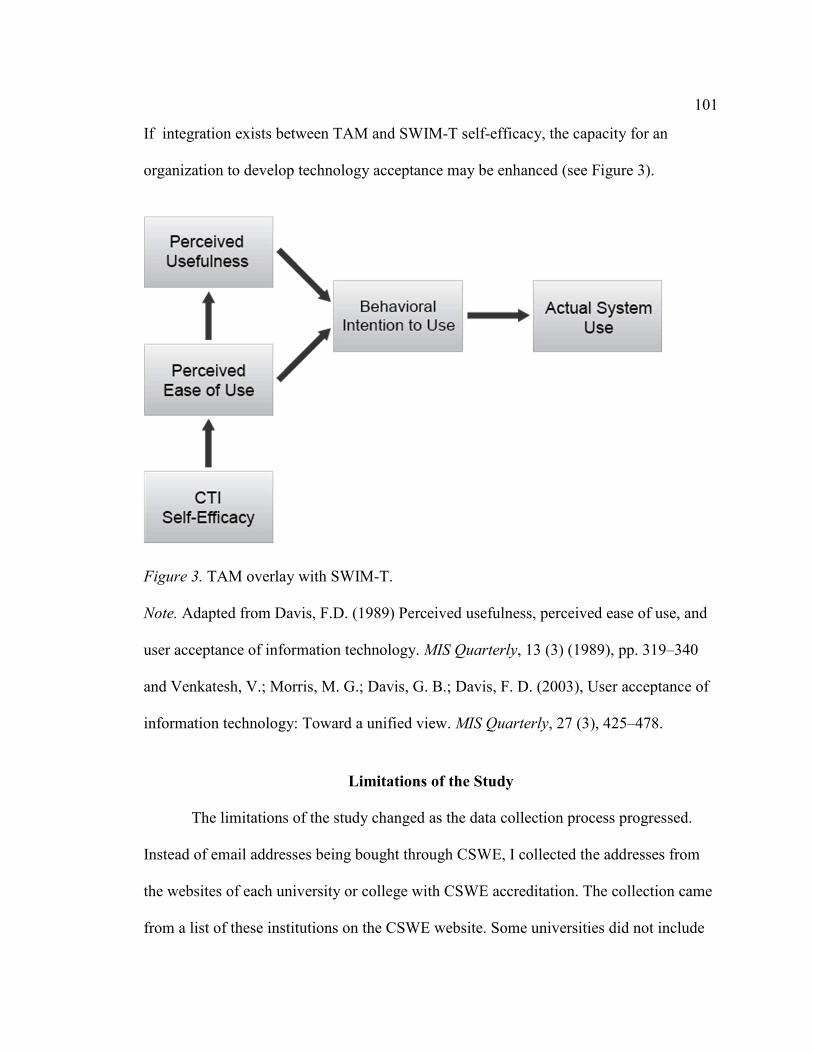
101
If integration exists between TAM and SWIM-T self-efficacy, the capacity for an
organization to develop technology acceptance may be enhanced (see Figure 3).
Figure 3. TAM overlay with SWIM-T.
Note. Adapted from Davis, F.D. (1989) Perceived usefulness, perceived ease of use, and
user acceptance of information technology. MIS Quarterly, 13 (3) (1989), pp. 319–340
and Venkatesh, V.; Morris, M. G.; Davis, G. B.; Davis, F. D. (2003), User acceptance of
information technology: Toward a unified view. MIS Quarterly, 27 (3), 425–478.
Limitations of the Study
The limitations of the study changed as the data collection process progressed.
Instead of email addresses being bought through CSWE, I collected the addresses from
the websites of each university or college with CSWE accreditation. The collection came
from a list of these institutions on the CSWE website. Some universities did not include
102
email addresses of their faculty members. I used Google searches of the faculty members’
names to research alternative ways to obtain undisclosed university addresses. This
method left out some DISWE from the sample due to invalid email addresses.
The ability to contact faculty for in person interviews became difficult due to the
survey being sent the last month of the academic year. This time frame is inconvenient
for some educators due to an increase of pressure to submit grades and other semester
end tasks. Some of the research sample may not have participated due to this timing. The
educators taking part in the in person interviews waited until the completion of the school
year to be interviewed. This time frame of interviews did not meet the goal of being
concurrent with the survey.
Field education is one area brought to my attention by field educators. The survey
questions I developed did not properly address how technology is useful in pedagogy and
curriculum in field placements. Understanding the implications of technology in the field
is a priority due to field being the signature pedagogy of social work education (CSWE,
2015).
Due to the deliberate inexplicit nature of the two open-ended questions, a minor
subset of DISWE defined “digital divide, pedagogy and/or curriculum development”
different than the intention of the question. The discrepant comments from DISWEs
whom misunderstood the definitions could not be added to the data set used for analysis.
I sought confirmation verifying the discrepant comments with feedback from another
social work educator.

103
Recommendations for Further Study
SWIM-T is a proposed model of technology integration for social work education
resulting from this mixed method, grounded theory study. This model addressed a gap in
literature connecting pedagogical and curriculum development by DISWE for delivery of
technology integrated social work education. During data analysis the revelation of
several threads for future research surfaced.
The first step in future research is to validate the SWIM-T for efficacy. The data
results outline the needs for successful development of a technology integration model in
social work education. As the number of SWIM-T studies increase, the opportunity for
innovation by DISWE opens. This model starts with the DISWE as the center of a
systems change. A shift in the DISWE self-efficacy with technology begins the role as an
agent of change in technology inclusion and ethical practice for the field.
The focus on current social work research and technology centers primarily on
online learning efficacy (Shorkey & Uebel, 2014). The future steps in research after
model acceptance is for social work education to address five main areas: (a) increasing
self-efficacy among DISWE, (b) identifying field placements use of technology, (c)
developing ethical standards, (d) creating a unified plan identifying technology goals in
education and the profession, and (e) researching evidence-based digital practices. The
shift in focus of social work education’s technological inclusion will need further
investigation to provide a convergence of optimal practices across the curriculum.
While some researchers discussed the need for technology integration in social
work education, few studies connected effectiveness of social work education with

104
technology content for use in practice with social work populations (Mishna et al,. 2012;
Mukherjee & Clark, 2012; Steyaert & Gould, 2009). Watling (2012) opened the door for
social workers to address digital exclusion in social work education through research.
The significant finding in this study, identifying the lack of digital divide curriculum
integration, validated the need for a collaborative effort to move forward addressing
technology inequities as DISWEs. The impact of the digital divide on social work
populations should not be an afterthought.
Implications
Integrating technology into social work pedagogy and curriculum provided an
intersection of opportunity between educational systems whose goal is to progress
students into professional positive social change agents. DISWEs can choose to confront
technology integration either as a crisis or a challenge. A systems approach to CTI offers
DISWE and the profession of social work support to work through existing social
problems with innovative methods.
Addressing the integration of technology into pedagogy and curriculum through a
SWIM-T approach can offer an increase in digital self-efficacy for each microsystem
involved in social work education. Digital citizenship, combined with technological
literacy in social work practice, may provide students with an edge in the job market and
an increase in efficacy with client populations. The university and department may
benefit from CTI self-efficacy though an edge in recruiting millennials or streamlining
educational processes.
105
Field placements serving marginalized and vulnerable populations can work with
students and DISWEs to (a) develop technological standards, (b) address digital divide
issues, (c) generate new funding streams, and (d) create evidence-based technology
practices. Social work professional organizations can become leaders of technology
guidance in ethics and practice. Lastly, DISWEs can decide to accept the inevitability of
technological progress by embracing change and moving forward toward a critical mass
where CTI brings social change to education and vulnerable populations.
Conclusion
Innovations in technology occur at an incredible pace often making it difficult to
remain current with each digital evolution. Innovation pacing should not be an excuse to
exclude these technological advancements in social work education. Social work
educators must evaluate if the need to adhere to “traditional” social work education is as
important as the need to remain current with the needs of the populations they serve and
the digital citizens entering social work education programs.
The SWIM-T model offers a process for technology integration into the field of
social work through a systems approach. Adoption of this model by DISWEs could
provide the critical mass needed to develop technology literacy in the field and an
evidence based response to an ever growing technologically literate society. Other
professions, such as k-12 educators, embrace technological advances and their integration
into educational innovation (Courduff et al., 2016; Pan & Franklin, 2011; Skoretz, 2011).
As millennials progress into higher education the need for innovative strategies bridging
the gap between technology used as a tool in education and technology as a part of a

106
professional practice. Here exists an opportunity for social work education to raise the bar
for its digital citizens or risk an increasing disparity between education and actual
practice.

107
References
Abrams, L. S., & Moio, J. A. (2009). Critical race theory and the cultural competence
dilemma in social work education. Journal of Social Work Education, 45(2), 245-
261. doi: 10.5175/jswe.2009.200700109
Aguirre, R. P., & Mitschke, D. B. (2011). Enhancing learning and learner satisfaction
through the use of WebCT in social work education. Social Work Education,
30(7), 847-860. doi:10.1080/02615479.2010.520119
Ahmedani, B., Harold, R., Fitton, V., & Shifflet Gibson E. (2011). What adolescents can
tell us: Technology and the future of social work education. Social Work
Education, 30(7), 830-846. doi:10.1080/02615479.2010.504767
Al-Awidi, H. M., & Alghazo, I. M., (2012). The effect of student teaching experience on
pre-service elementary teachers' self-efficacy beliefs for technology integration in
the UAE. Educational Technology, Research and Development, 60, 923-941. doi:
10.1007/s11423-012-9239-4
Allenby, B. R., & Sarewitz, D. (2011). The accelerating techno-human future.
Cambridge, MA: MIT Press.
Allen, J., Bracey, P., & Pasquini, L. (2012). Learning and performance innovation:
Chapter 2. In V. C. X. Wang (Ed.), Encyclopedia of E-leadership, counseling and
training (pp. 48-64). doi:10.4018/978-1-61350-068-2.ch005 .
Allen, I. E., & Seaman, J. (2013). Changing course: Ten years of tracking online
education in the United States. Wellesley MA: Babson College/Quahog Research
Group. Retrieved from http://www.tonvbates. ca/2013/01/13/measuring-the-

108
growth-of-online-learning-the-babson- college2012survey/#sthash.Fuxl
VuF6.dpuf
Allwardt, D. E. (2011). Writing with wikis: A cautionary tale of technology in the
classroom. Journal of Social Work Education, 47(3), 597-605.
doi:10.5175/jswe.2011.200900126
Association of Social Work Boards. (2003). Guide to Social work ethics course
development. Retrieved from http://www.aswb.org/
Aslan, S., & Reigeluth, C. (2013). Educational technologists: Leading change for a new
paradigm of education. Techtrends: Linking Research & Practice to Improve
Learning, 57(5), 18-24. doi:10.1007/s11528-013-0687-4
Aydin, S., & Boz, Y. (2010). Pre-service elementary science teachers’ science teaching
efficacy beliefs and their sources. Elementary Education Online, 9(2), 694–704.
[Online]:http://ilkogretimonline.org.tr
Bach, A., Shaffer, G., & Wolfson, T. (2013). Digital human capital: Developing a
framework for understanding the economic impact of digital exclusion in low-
income communities. Journal of Information Policy 3, 247-266.
doi:10.5325/jinfopoli.3.2013.0247
Bandura, A. (1977). Self-efficacy: Toward a unifying theory of behavioral change.
Psychological Review, 84(2), 191-215. doi:10.1037/0033-295X.84.2.191
Bandura, A. (1982). Self-efficacy mechanism in human agency. American Psychologist,
37(2), 122-147. doi:10.1037/0003-066x.37.2.122

109
Bandura, A. (1986). Social foundations of thought and action: A social cognitive theory.
Englewood Cliffs, NJ: Prentice-Hall.
Bandura, A. (1998). Personal and collective efficacy in human adaptation and change. In
J. G. Adair, D. Belanger, & K. L. Dion (Eds.), Advances in psychological science:
Vol. 1. Personal, social and cultural aspects (pp. 51-71). Hove, England:
Psychology Press. doi:10.1017/cbo9780511527692.003
Bennett, S., & Maton, K. (2010). Beyond the 'digital natives' debate: Towards a more
nuanced understanding of students' technology experiences. Journal of Computer
Assisted Learning, 26(5), 321-331. doi:10.1111/j.1365-2729.2010.00360.x
Berzin, S. C., & O'Connor, S. (2010). Educating today's school social workers: Are
school social work courses responding to the changing context? Children &
Schools, 32(4), 237-249. doi:10.1093/cs/32.4.237
Bogo, M., & Wayne, J. (2013). The implicit curriculum in social work education: The
culture of human interchange. Journal of Teaching in Social Work, 33(1), 2-14.
doi:10.1080/08841233.2012.746951
Bronfenbrenner, U. (1976). The Experimental Ecology of Education. Educational
Researcher, 5(9), 5. doi:10.2307/1174755
Bronfenbrenner, U. (1979). The ecology of human development: Experiments by nature
and design. Cambridge, MA: Harvard University Press.
Bronfenbrenner, U. (1994). Ecological models of human development. International
Encyclopedia of Education, 3(2), 1643 -1647. doi:10.1016/b0-
080430767/003594Bruno, G., Esposito, E., Genovese, A., & Gwebu, K. L.
110
(2011). A critical analysis of current indexes for digital divide measurement.
Information Society, 27(1), 16-28. doi:10.1080/01972243.2010.534364
Bursac, Z., Gauss, C. H., Williams, D. K., & Hosmer, D. W. (2008). Purposeful selection
of variables in logistic regression. Source code for biology and medicine, 3, 17.
doi:10.1186/1751-0473-3-17
Burton, J., & van den Broek, D. (2009). Accountable and countable: information
management systems and the bureaucratization of social work. British Journal of
Social work, 39(7), 1326-1342. doi:10.1093/bjsw/bcn027
Cao, Y., Ajjan, H., & Hong, P. (2013). Using social media applications for educational
outcomes in college teaching: A structural equation analysis. British Journal of
Educational Technology, 44(4), 581-593. doi:10.1111/bjet.12066
Chang, T., Lin, H., & Song, M. (2011). University faculty members’ perceptions of their
teaching efficacy. Innovations in Education and Teaching International, 48(1),
49-60. doi:10.1080/14703297.2010.543770
Charmaz, K. (2006). Constructing grounded theory: A practical guide through
qualitative analysis. London, England: Sage Publications.
Charmaz, K. (2008). Grounded theory as an emergent method. In S. N. Hesse-Biber & P.
Leavy (eds), Handbook of Emergent Methods (pp. 155 – 172). New York, NY:
The Guilford Press.
Chaumba, J. (2013). The use and value of mixed methods research in social work.
Advances in Social Work, 14(2), 307-333. Retrieved from
111
https://journals.iupui.edu/index.php/advancesinsocialwork/article/download/.../16
377
Cilesiz, S. (2011). A phenomenological approach to experiences with technology:
Current state, promise, and future directions for research. Educational Technology
Research & Development, 59(4), 487-510. doi:10.1007/s11423-010-9173-2
Clinical Social Work Association. (September, 2013). Report on online MSW programs.
Retrieved from
http://www.clinicalsocialworkassociation.org/sites/default/files/CSWA%20-
%20Final%20Online%20Report%20-%209-18-13.pdf
Cochran, G., & Landuyt, N. (2011). The second annual survey of continuing education
programs conducted by professional development. International Journal of
Continuing Social Work Education. 14(1), 1-34. Retrieved from
http://www.profdevjournal.org/index.html
Cohen, J., Cohen, P., West, S. G., & Aiken, L. S. (2003) Applied multiple
regression/correlation analysis for the behavioral sciences. Mahwah NJ:
Lawrence Erlbaum Associates, Inc., Publishers.
Colvin, A. D., & Bullock, A. N. (2014). Technology Acceptance in Social Work
Education: Implications for the Field Practicum. Journal Of Teaching In Social
Work, 34(5), 496-513. doi:10.1080/08841233.2014.952869
Council on Social work Education. (2012). 2012 Annual statistics on social work
education in the United States. Retrieved from
http://www.cswe.org/CentersInitiatives/DataStatistics/68984.aspx
112
Coe, J. R., & Elliott, D. (1999). An evaluation of teaching direct practice courses in a
distance education program for rural settings. Journal of Social Work Education,
35 (3), 353–365. Retrieved from http://www.cswe.org/Publications/JSWE.aspx
Collins, K. M. T. (2010). Advanced sampling designs in integrated research: Current
practices and emerging trends in the social and behavioral sciences. In A.
Tashakkori & C. Teddlie (Eds.), Sage handbook of mixed methods in social and
behavioral research (pp. 353–377). Thousand Oaks, CA: Sage.
Collins, K.M.T., & Onwuegbuzie, A. J. (2013). Establishing interpretive consistency
when mixing approaches: Role of sampling designs in evaluations. In D. M.
Mertens & S. Hesse-Biber (Eds.). Mixed methods and credibility of evidence in
evaluation. New Directions for Evaluation, 138, 85-95. doi:10.1002/ev.20060
Cooper-Gaiter, E. D. (2016). Computer anxiety and computer self-efficacy of older
adults. Retrieved from
http://search.proquest.com.ezp.waldenulibrary.org/pqdtglobal/docview/16674516
91/abstract/A826DB5E2A1A4789PQ/1?accountid=14872
Congress, E. P. (2012, Fall 2012). Continuing education: Lifelong learning for social
work practitioners and educators. Journal of Social Work Education. pp. 397-401.
doi:10.5175JSWE.2012.201200085.
Courduff, J. j., Szapkiw, A., & Wendt, J. L. (2016). Grounded in what works: Exemplary
practice in special education teachers' technology integration. Journal Of Special
Education Technology, 31(1), 26-38. doi:10.1177/0162643416633333

113
Cox, P., & Hardwick, L. (2002). Research and critical theory: Their contribution to social
work education and practice. Social Work Education, 21(1), 35-47.
doi:10.1080/02615470120107004
Creswell, J.W. (2009). Research design: Qualitative, quantitative, and mixed methods
approaches (3rd ed.). Los Angeles, CA: Sage.
Creswell, J.W. (2011). Designing and conducting mixed methods research. Thousand
Oaks, CA: Sage Publications.
Creswell, J.W. (2014). A concise introduction to mixed methods research. Los Angeles,
CA: Sage Publications.
Creswell, J., & Clark, V. (2013). Designing and conducting mixed methods research (2nd
ed.). Thousand Oaks, Calif.: SAGE Publications.
Crittenden, J. C. (2009). Factors influencing the attitudes and self-efficacy of Mississippi
allied health educators toward information and communication technology.
Career & Technical Education Research, 34(3), 155-174.
doi:10.5328/cter34.3.155
CSWE Commission on Educational Policy. (2015). Final 2015 Educational Policy (EP).
Retrieved from http://www.cswe.org/File.aspx?id=79793
CSWE. (2015). About CSWE. Retrieved from http://www.cswe.org/About.aspx
CSWE. (2014, March). Draft 2 of the 2015 educational policy and accreditation
standards. Retrieved from http://www.cswe.org/File.aspx?id=72120

114
CSWE. (September, 2013). Report on online MSW programs. Retrieved from
http://www.clinicalsocialworkassociation.org/sites/default/files/CSWA%20-
%20Final%20Online%20Report%20-%209-18-13.pdf
CSWE. (2008, October). Educational policy and accreditation standards. Retrieved
from http://www.cswe.org/File.aspx?id=14115
Cummings, S. M., Foels, L., & Chaffin, K. M. (2013). Comparative analysis of distance
education and classroom-based formats for a clinical social work practice course.
Social Work Education, 32(1), 68-80. doi:10.1080/02615479.2011.648179
Cwikel, J., Savaya, R., Munford, R., & Desai, M. (2010) Innovation in schools of Social
work: An international exploration. International Social Work, 53(2), 187-201.
doi:10.1177/0020872809355393
Davis, F. D. (1989), "Perceived usefulness, perceived ease of use, and user acceptance of
information technology", MIS Quarterly, 13 (3), 319–340, doi:10.2307/249008
Dearnley, C. A., Taylor, J. D., Laxton, J. C., Rinomhota, S., & Nkosana-Nyawata, I.
(2013). The student experience of piloting multi-modal performance feedback
tools in health and social care practice (work)-based settings. Assessment &
Evaluation in Higher Education, 38(4), 436-450.
doi:10.1080/02602938.2011.645014
Davis, F.D. (1989) Perceived usefulness, perceived ease of use, and user acceptance of
information technology. MIS Quarterly, 13 (3) (1989), pp. 319–340.
doi:10.2307/249008
115
de Boer, C., Campbell, S., & Hovey, A. (2011). When you come to a fork in the road,
take it: Teaching social work practice using blended learning. Canadian Journal
of Learning and Technology, 37(3). doi:10.21432/t26c79
Deepak, A. C., Wisner, B. L., & Benton, A. D. (2016). Intersections between technology,
engaged learning, and social capital in social work education. Social Work
Education, 35(3), 310-322. doi:10.1080/02615479.2016.1154661
DeLong Hamilton, T., Buchan, V. V., Hull, J. H., Christenson, B., Gerritsen-McKane, R.,
Rodenhiser, R. W., & Smith, M. L. (2011). Responding to the 2008 EPAS:
Baccalaureate education assessment direct and indirect measurement. Journal of
Baccalaureate Social Work, 16(1), 17-31. doi:10.1080/08841233.2011.539153
De Marco, S., Robles, J. M., & Antino, M. (2014). Digital skills as a conditioning factor
for digital political participation. Communications: The European Journal of
Communication Research, 39(1), 43-65. doi:10.1515/commun-2014-0004
Dickson, D., & Mullan, T. (1990). An empirical investigation of the effects of a micro-
counselling programme with social work students: The acquisition and transfer of
component skills. Counselling Psychology Quarterly, 3(3), 267-283.
doi:10.1080/09515079008254257
Dornisch, M. (2013). The digital divide in classrooms: Teacher technology comfort and
evaluations. Computers in the Schools, 30(3), 210-228.
doi:10.1080/07380569.2012.734432

116
Doughty, H. A. (2013). The idea of the digital university: Ancient traditions, disruptive
technologies and the battle for the soul of higher education. College Quarterly,
16(4), 13. doi:10.1353/rhe.2014.0027
Downing, J. J., & Dyment, J. E. (2013). Teacher educators' readiness, preparation, and
perceptions of preparing pre service teachers in a fully online environment: An
exploratory study. Teacher Educator, 48(2), 96-109.
doi:10.1080/08878730.2012.760023
Duncan-Daston, R., Hunter-Sloan, M., & Fullmer, E. (2013). Considering the ethical
implications of social media in social work education. Ethics Information
Technology, 15:35-43E doi: 10.1007/s10676-013-9312-7
East, J. F., LaMendola, W., & Alter, C. (2014). Distance education and organizational
environment. Journal of Social Work Education, 50(1), 19-33.
doi:10.1080/10437797.2014.856226
Edmunds, R., Thorpe, M., & Conole, G. (2012). Student attitudes towards and use of ICT
in course study, work and social activity: A technology acceptance model
approach. British Journal of Educational Technology, 43(1), 71-84.
doi:10.1111/j.1467-8535.2010.01142.x
Efe, H. A. (2015). The relation between science student teachers’ educational use of web
2.0 technologies and their computer self-efficacy. Journal of Baltic Science
Education, 14(1), 142-154. Retrieved from
http://journals.indexcopernicus.com/abstract.php?icid=1143044

117
Englander, M. (2012). The interview: Data collection in descriptive phenomenological
human scientific research. Journal of Phenomenological Psychology, 35 (3), 1-35.
doi:10.1163/156916212x632943
Eamon, M. K., Wu, C., Moroney, G., & Cundari, M. (2013). Teaching the importance
and use of web-based services to assist clients in obtaining public benefits.
Journal of Teaching in Social Work, 33(2), 143-158.
doi:10.1080/08841233.2013.777011
Epstein, D., Nisbet, T., & Gillespie. T. (2011) Who’s responsible for the digital divide?
Public perceptions and policy implications. The Information Society, 27: 92-104.
doi: 10.1080/01972243.548695
Farah, A. C. (2012). Factors influencing teachers' technology self-efficacy: A case study
(Order No. 3494891). Available from ProQuest Central. (Accession No.
922578690). Retrieved from
http://search.proquest.com/docview/922578690?accountid=14872
Federal Communications Commission. (2012). Eighth broadband progress report. (FCC
GN Docket No. 11-121) Retrieved October 4, 2014, from
http://www.fcc.gov/reports/eighth-broadband-progress-report
Felke, T. P. (2006). Geographic information systems potential uses in social work
education and practice. Journal of Evidence-Based Social Work, 3(3/4), 103.
doi:10.1300/J394v03n0308
118
Fink-Samnick, E., & Muller, L. S. (2015). Case management practice: Is technology
helping or hindering practice? Professional Case Management, 20(2), 98-102.
doi:10.1097/NCM.0000000000000084
Fitch, D., Canada, K., Cary, S., & Freese, R. (2016). Facilitating Social Work Role Plays
in Online Courses: The Use of Video Conferencing. Advances In Social Work,
17(1), 78-92. doi:10.18060/20874
Forte, J. A., & Root, V. (2011). To ITV or not to ITV: A comparison of hybrid and web-
enhanced approaches to teaching a macro-course in human behavior in the social
environment. Journal of Human Behavior in the Social Environment, 21(1), 82-
96. doi:10.1080/10911359.2011.535732
Freddolino, P. P., & Sutherland, C. A. (2000). Assessing the comparability of classroom
environments in graduate social work education deliver via interactive
instructional television. Journal of Social Work Education, 36(1), 115–129.
Retrieved from https://scholars.opb.msu.edu/en/publications/assessing-the-
comparability-of-classroom-environments-in-graduate-3
Friedline, T., Mann, A. R., & Lieberman, A. (2013). Teaching note--ask the audience:
Using student response systems in social work education. Journal of Social work
Education, 49(4), 782-792. Retrieved from
http://www.cswe.org/Publications/JSWE.aspx
Furlonger, B., & Gencic, E. (2014). Comparing satisfaction, life-stress, coping and
academic performance of counselling students in on-campus and distance
119
education learning environments. Australian Journal of Guidance and
Counselling, 24(1), 76-89. doi:10.1017/jgc.2014.2
Garrido, M., Sullivan, J., & Gordon, A. (2012). Understanding the links between ICT
skills training and employability: An analytical framework. Information
Technologies & International Development, 8(2), 17-32. Retrieved from
itidjournal.org/itid/article/viewFile/895/374
Geana, M. V., & Greiner, K. A. (2011). Health information and the digital divide.
Journal of Management & Marketing In Healthcare, 4(2), 108-112.
doi:10.1179/175330311X12943314049538
Gelman, C. R., & Tosone, C. (2010). Teaching social workers to harness technology and
inter-disciplinary collaboration for community service. British Journal of Social
Work, 40(1), 226-238. doi:10.1093/bjsw/bcn081
Glaser, Barney G & Strauss, Anselm L., 1967. The discovery of grounded theory:
Strategies for qualitative research. Chicago, IL: Aldine Publishing Company.
Gioia, S. W. (2016). Minds online: teaching effectively with technology. Social Work
Education, 35(6), 733. doi:10.1080/02615479.2015.1124494
Goldstein, E. G. (2007). Social work education and clinical learning: Yesterday, today
and tomorrow. Clinical Social Work Journal, 35, 15-23.
Grady, M. D., Powers, J., Despard, M., & Naylor, S. (2011). Measuring the implicit
curriculum: Initial development and results of an MSW survey. Journal of Social
Work Education, 47(3), 463-487. Retrieved from
itidjournal.org/itid/article/viewFile/895/374

120
Graham, C., Borup, J., & Smith, N. (2012). Using TPACK as a framework to understand
teacher candidates' technology integration decisions. Journal of Computer
Assisted Learning, 28(6), 530-546. doi:10.1111/j.1365-2729.2011.00472.x
Guo, R., Dobson, T., & Petrina, S. (2008). Digital natives, digital immigrants: An
analysis of age and ICT competency in teacher education. Journal of Educational
Computing Research, 38(3), 235-254. doi:10.2190/ec.38.3.a
Haight, K. W. (2011). The adoption and integration of technology within the classroom:
Teacher self-efficacy beliefs (Order No. 3445014). Retrieved from Dissertations
& Theses @ Walden University. (Accession No. 860309222).
Harris, B., & Birnbaum, R. (2014). Ethical and legal implications on the use of
technology in counseling. Clinical Social Work Journal. Springer Science
Business Media, New York. doi: 10/1007/s10615-014-0515-0
Hash, K. M., & Tower, L. E. (2010). The development and evaluation of online learning
modules to deliver lifespan content in human behavior in social environment
courses. Journal of Human Behavior In The Social Environment, 20(3), 379-392.
doi:10.1080/10911351003673260
Helding, L. (2011). Digital natives and digital immigrants: Teaching and learning in the
digital age. Journal of Singing, 68(2), 199-206. Retrieved from
http://scholar.dickinson.edu/faculty_publications/67/
Hesse-Biber, S. N. (2010). Mixing methods research: Merging theory with practice. New
York, NY: The Guilford Press.

121
Hick, S. (2006). Technology, social inclusion and poverty: An exploratory investigation
of a community technology center. Journal of Technology in Human Services,
24(1), 53-67. doi:10.1300/J017v24n01̱04
Hilbert, M. (2011) The end justifies the definition: The manifold outlooks on the digital
divide and their practical usefulness for policy-making. Telecommunications
Policy, 35(8), 715-736. doi:10.1016/j.telpol.2011.06.012
Hill, K., & Ferguson, S. M. (2014). Web 2.0 in social work macro practice: Ethical
considerations and questions. Journal of Social Work Values & Ethics, 11(1), 2-
11. Retrieved from http://jswve.org/download/2014-1/articles/2-JSWVE-11-
1Web%202.0%20in%20Social%20Work%20Macro%20Practice-pp%202-11.pdf
Holden, H., & Rada, R. (2011). Understanding the influence of perceived usability and
technology self-efficacy on teachers' technology acceptance. Journal of Research
On Technology In Education (International Society For Technology In
Education), 43(4), 343-367. Retrieved from
http://files.eric.ed.gov/fulltext/EJ930317.pdf
Horvath, V. E., & Mills, C. S. (2011). The challenges for faculty using interactive
television in distance education. Journal of Technology In Human Services, 29(1),
33-48. doi:10.1080/15228835.2011.568678
Hudson, C. G. (2000). At the edge of chaos: A new paradigm for social work?. Journal of
Social Work Education, 36(2), 215-231. Retrieved from
https://lms.ctl.cyut.edu.tw/sysdata/92/21092/doc/cf1781906edc4755/attach/10202
49.pdf
122
Ilharco, F. (2015). The backgroundness of new media: A phenomenological account of
information and communication technologies. Empedocles: European Journal
For The Philosophy Of Communication, 6(1), 39-55.
doi:10.1386/ejpc.6.1.39_1doi: 10.1386/ejpc.6.1.39_1
Intel Corporation. (Director) (2005). Excerpts from a conversation with Gordon Moore:
Moore's law [Theater]. Retrieved from
http://download.intel.com/museum/Moores_law/Video-
transcripts/excepts_a_Conversation_with_gordon_Moore.pdf
Hurney, C. A., Nash, C., Hartman, C. B., & Brantmeier, E. J. (2016). Incorporating
sustainability content and pedagogy through faculty development. International
Journal of Sustainability In Higher Education, 17(5), 582-600.
doi:10.1108/IJSHE-12-2014-0180
International Society for Technology in Education. 2008. National education standards.
Washington, DC: ISTE. Retrieved from: www.iste.org/standards/nets-for-
teachers.aspx.
Johnson, R. B. (2014). Mixed methods research design and analysis with validity: A
primer. Department of Professional Studies, University of South Alabama, USA.
Department of Professional Studies, University of South Alabama, USA.
Johnson, R. B. , Onwuegbuzie, A. J., & Turner, L. A. (2007) Towards a definition of
mixed methods research. Journal of Mixed Methods Research, 1(2), 112-133.
DOI: 10.1177/1558689806298224
123
Joiner, R., Gavin, J., Brosnan, M., Cromby, J., Gregory, H., Guiller, J., & ... Moon, A.
(2013). Comparing first and second generation digital natives' Internet use,
Internet anxiety, and Internet identification. Cyberpsychology, Behavior and
Social Networking, 16(7), 549-552. doi:10.1089/cyber.2012.0526
Judd, R. & Johnston, L. (2012). Ethical consequences of using social network sites for
students in professional social work programs. Journal of Social Work Values and
Ethics, 9 (1), 5-12. Retrieved from
http://www.jswvearchives.com/spring12/spr122.pdf
Kalemoglu Varol, Y. (2014). The relationship between attitudes of prospective physical
education teachers towards education technologies and computer self-efficacy
beliefs. Turkish Online Journal of Educational Technology - TOJET, 13(2), 157-
167. Retrieved from https://www.learntechlib.org/p/153681
Kays, L. (2011). Must I un-friend Facebook: Exploring the ethics of social media. The
New Social Worker Online. Retrieved 9/30/2012 from
http://www.socialworker.com/home/Feature_Articles/Ethics/Must_I_Un-
Friend_Facebook?_Exploring_the_Ethics_of_Social_Media/
.
Kelly, H. (2014). A path analysis of educator perceptions of open educational resources
using the technology acceptance model. International Review of Research In
Open & Distance Learning, 15(2), 26-42. Retrieved from
http://www.irrodl.org/index.php/irrodl/article/view/1715/2836
Kirkwood, A., & Price, L. (2013). Examining some assumptions and limitations of
research on the effects of emerging technologies for teaching and learning in
124
higher education. British Journal of Educational Technology, 44(4), 536-543.
doi:10.1111/bjet.12049
Kondrat, M. E. (2002). Actor-centered social work: Re-visioning 'person-in-Environment'
through a critical theory lens. Social Work, 47(4), 435-448. Retrieved from
doi:10.1093/sw/47.4.435
Krause, J. M. (2010). The impact of physical education student teaching experiences on
technology integration self-efficacy (Order No. 3436711). Available from
ProQuest Central. (822408583). Retrieved from
http://search.proquest.com/docview/822408583?accountid=14872
Kruger, L. G., & Gilroy, A. A. (2013). Broadband Internet access and the digital divide:
Federal assistance programs. Journal of Current Issues In Media &
Telecommunications, 5(4), 303-329. Retrieved from
http://eds.a.ebscohost.com/eds/pdfviewer/pdfviewer?vid=20&sid=fa027434-a6ca-
4413-b4ab-34cf96a35337%40sessionmgr4003&hid=420
Kuckartz, U. (2014). Qualitative text analysis: A guide to methods, practice and using
software. London, England: Sage.
Kuilema, J., (2012) Social workers and broadband advocacy: Social justice and
information communication technologies. Social Science Computer Review, 31
(3), 291-305. DOI: 10.1177/089443931245266
Kurzweil, R. (2010). Merging with the machines: Information technology, artificial
intelligence, and the law of exponential growth. World Future Review (World
Future Society), 2(2), 57-61. Retrieved from doi:10.1177/194675671000200107

125
Langan, D., Schott, N., Wykes, T., Szeto, J., Kolpin, S., Lopez, C., & Smith, N. (2016).
Students’ use of personal technologies in the university classroom: Analyzing the
perceptions of the digital generation. Technology, Pedagogy & Education, 25(1),
101-117. doi:10.1080/1475939X.2015.1120684
Lea, S., & Callaghan, L. (2011). Enhancing health and social care placement learning
through mobile technology. Educational Technology & Society, 14(1), 135-145.
Retrieved from
http://www.jstor.org/stable/jeductechsoci.14.1.135?seq=1#page_scan_tab_content
s
Lei, J. (2009). Digital natives as pre-service teachers: What technology preparation is
needed? Journal of Computing in Teacher Education, 25(3), 87-97. Retrieved
from https://www.learntechlib.org/p/105316
Lin, S., & Chen, S. (2013). Innovation attributes and pedagogical quality: a
concretization of joint theories on course management systems acceptance.
Quality & Quantity, 47(4), 2309-2317. doi:10.1007/s11135-011-9657-0
Littlejohn, A., Beetham, H., & Mcgill, L. (2012). Learning at the digital frontier: a review
of digital literacies in theory and practice. Journal of Computer Assisted
Learning, 28(6), 547-556. doi:10.1111/j.1365-2729.2011.00474.x
Longhofer, J., & Floersch, J., (2012) The coming crisis in social work: Some thoughts on
social work and science. Research on Social Work Practice, 22 (5), 499-519.
Retrieved from http://rsw.sagepub.com/content/22/5/499

126
MAXQDA (2013). Introducing maxqda 11. Retrieved from
http://www.maxqda.com/products/maxqda11
Manion, C. E., & Selfe, R. (2012). Sharing an assessment ecology: Digital media, wikis,
and the social work of knowledge. Technical Communication Quarterly, 21(1),
25-45. Retrieved from
http://search.proquest.com/docview/926978218?accountid=14872
Mattison, M. (2012). Social work practice in the digital age: Therapeutic e-mail as a
direct practice methodology. Social Work, 57(3), 249. doi:10.1093/sw/sws021
Means, B., Toyama, Y., Murphy, R., Bakia, M. & Jones, K. (2010). Evaluation of
evidence-based practices in online learning: a meta-analysis and review of online
learning studies. Washington, DC: U.S. Department of Education Office of
Planning, Evaluation, and Policy Development. Retrieved March 28, 2013, from
http://www2.ed.gov/rschstat/eval/tech/evidence-based-practices/finalreport.pdf
Miller, F. Q. (2015). Experiencing information use for early career academics’ learning: a
knowledge ecosystem model. Journal Of Documentation, 71(6), 1228-1249.
doi:10.1108/JD-04-2014-0058
Miller, K., Bunch-Harrison, S., Brumbaugh, B., Kutty, R., & FitzGerald, K. (2005). The
meaning of computers to a group of men who are homeless. American Journal of
Occupational Therapy, 59(2), 191-197. doi:10.5014/ajot.59.2.191
Miller, S. E., Rice, C. J., & Hall, D. H. (2011). Bridging the explicit and implicit
curricula: Critically thoughtful critical thinking. The Journal of Baccalaureate
Social Work, 16(1), 33-45. Retrieved from http://jbsw.org/

127
Mishna, F., Bogo, M., Root, J., Sawyer, J., & Khoury-Kassabri, M. (2012). 'It just crept
in': The digital age and implications for social work practice. Clinical Social Work
Journal, 40(3), 277-286. doi:10.1007/s10615-012-0383-4
Mishra, P., & Koehler, M. (2006). Technological pedagogical content knowledge: A
framework for teacher knowledge. Teachers College Record. 108(6), 1017-1054.
Retrieved from doi:10.1111/j.1467-9620.2006.00684.x
Moore, G. (1965). Cramming more components onto integrated circuits. Electronics,
38(9). doi:10.1109/n-ssc.2006.4785860
Moore, D. W. (1995). The emperor’s virtual clothes: The naked Truth about Internet
culture. New York: Algonquin Books.
Mossberger, K., Tolbert, C.J. & Hamilton, A. (2012). Measuring digital citizenship:
Mobile access and broadband. International Journal of Communication, 6, 2492-
2528. Retrieved from ijoc.org/index.php/ijoc/article/viewFile/1777/808
Mukherjee, D., & Clark, J. (2012). Students' participation in social networking sites:
Implications for social work education. Journal of Teaching in Social Work,
32(2), 161-173. doi:10.1080/08841233.2012.669329
Murray, M. C., & Pérez, J. (2014). Unraveling the digital literacy paradox: How higher
education fails at the fourth literacy. Issues in Informing Science & Information
Technology, 1185-100. Retrieved from iisit.org/Vol11/IISITv11p085-
100Murray0507.pdf
Nasah, A., CaCosta, B., Kinsell, C., & Seok, S. (2010). The digital literacy debate: An
investigation of digital propensity and information and communication
128
technology. Education Tech Research Development, 58, 531-555, DOI
10.1007/s11423-010-9151-8
NASW. (2011). NASW continuing education portal. Retrieved from
http://www.naswdc.org/CEPortal/CEPsearch.aspx. Retrieved on January, 19th,
2015.
NASW Delegate Assembly. (2008). Code of ethics of the national association of social
workers. Retrieved from http://www.socialworkers.org/pubs/code/code.asp
NASW, & Association of Social work Boards,. (2005). Technology and Social Work
practice. Retrieved from
http://www.socialworkers.org/practice/standards/naswtechnologystandards.pdf
Nicotera, N., & Hye-Kyung, K. (2009). Beyond diversity courses: Strategies for
integrating critical consciousness across social work curriculum. Journal of
Teaching in Social Work, 29(2), 188-203. doi:10.1080/08841230802240738
O'Connor, E., McDonald, F., & Ruggiero, M. (2014). Scaffolding complex learning:
Integrating 21st century thinking, emerging technologies, and dynamic design and
assessment to expand learning and communication opportunities. Journal of
Educational Technology Systems, 43(2), 199-226. doi:10.2190/ET.43.2.g
O'Hara, K. (2013). Welcome to (and from) the digital citizen. IEEE Internet Computing,
17(1), 92-95. doi:10.1109/MIC.2013.17
Office of Management and Budget, General Services Administration, Mobility Strategy
Task Force, & Web Reform Task Force. (n.d.). Digital government: Building a
21st century platform to better serve the American people. Retrieved January 19,

129
2015, from http://www.whitehouse.gov/sites/default/files/omb/egov/digital-
government/digital-government.html#appendix
Onwuegbuzie, A. & Johnson, R. B. (2006). The validity issue in mixed research.
Research in the Schools, 13(1), 48-63. Retrieved from
videolectures.net/site/normal_dl/tag=48066/MixedMethodsaandValidity.RITS.pdf
Onwuegbuzie, A. & Leech, N. (2006). Linking research questions to mixed methods data
analysis procedures. The Qualitative Report. 11(3) p. 474-498. Retrieved from
nsuworks.nova.edu/cgi/viewcontent.cgi?article=1663&context=tqr
Onwuegbuzie, A. & Collins, K. (2007). A typology of mixed methods sampling designs
in social science research. The Qualitative Report 12(2) p. 281-316. Retrieved
from nsuworks.nova.edu/cgi/viewcontent.cgi?article=1638&context=tqr
Palfrey, J. & Urs, G. (2010). Born digital: Understanding the first generation of digital
natives. New York: Purseus Book Group. Retrieved from
http://books.google.com/books?id=LlFNT1ER4scC&printsec=frontcover&source
=gbs_ge_summary_r&hl=en&output=reader&pg=GBS.PP1
Palinkas, L., Aarons, G., Horowitz, S., Chamberlain, P., Hurlburt, M., & Landsverk, J.
(2011). Mixed method designs in implementation research. Administration and
Policy in Mental Health. 38(1): 44-53. Doi: 10.1007/s10488-010-0314-z
Pan, S. C., & Franklin, T. (2011). In-service teachers' self-efficacy, professional
development, and web 2.0 tools for integration. New Horizons in Education,
59(3), 28-40. Retrieved from https://www.learntechlib.org/p/110668

130
Parton, N. (2008) Changes in the form of knowledge in Social work; From the “social”
to the “informational”?, British Journal of Social work, 38, 253-269.
https://doi.org/10.1093/bjsw/bcl337
Patton, M. Q. (2002). Qualitative research & evaluation methods (3rd ed.). Thousand
Oaks, CA: Sage Publications.
Peterson, N. A., Farmer, A. Y., & Zippay, A. (2014). The Implicit Curriculum in an
Urban University Setting: Pathways to Students’ Empowerment. Journal of Social
Work Education, 50(4), 630-647. doi:10.1080/10437797.2014.947163
Petracchi, H. E., & Morgenbesser, M. (1995). The use of video and one-way broad-cast
technology to deliver continuing social work education: A comparative
assessment of student learning. Journal of Continuing Social Work Education,
6(3), 18–22. Retrieved from http://www.socialwork.pitt.edu/person/helen-e-
petracchi
Petracchi, H. E., & Zastrow, C. (2010a). Suggestions for utilizing the 2008 EPAS in
CSWE-accredited baccalaureate and masters curriculums—Reflections from the
field, Part 1: The explicit curriculum. Journal of Teaching in Social Work, 30(2),
125-146. doi:10.1080/08841231003704761
Petracchi, H. E., & Zastrow, C. (2010b). Suggestions for Utilizing the 2008 EPAS in
CSWE-Accredited Baccalaureate and Masters Curriculums--Reflections from the
Field, Part 2: The Implicit Curriculum. Journal of Teaching in Social Work, 30(4),
357-366. doi:10.1080/08841233.2010.515928
131
Pew Research Center. (2015). Social media usage: 2005-2015. Washington, D.C.
Accessed on 9/19/2016. Retrieved from
http://www.pewinternet.org/2015/10/08/social-networking-usage-2005-2015/
Pew Research Center. (2015). Technology device ownership: 2015. Washington, D.C.
Accessed on 9/19/2016. Retrieved from
http://www.pewinternet.org/2015/10/29/technology-device-ownership-2015/
Phelan, J. E. (2015). The Use of E-Learning in Social Work Education. Social Work,
60(3), 257-264. doi:10.1093/sw/swv010
Potts, M. (2005). Measuring the distance: Evaluation of distance education in social
work. In P. Abels (Ed.), Distance education in social work: Planning, teaching,
and learning, (pp. 97–118). New York, NY: Springer Publishing Company.
Prensky, M. (2001a, September/October). Digital natives, digital immigrants. On the
Horizon, 9(5), 1–6. doi:10.1108/10748120110424816
Prensky, M. (2001b, November/December). Digital natives, digital immigrants, part 2:
Do they really think differently? On the Horizon, 9 (6), 1–6.
doi:10.1108/10748120110424843
Prochaska, J. O., & DiClemente, C. C. (1982). Transtheoretical therapy: Toward a more
integrative model of change. Psychotherapy: Theory, Research & Practice, 19(3),
276-288. doi:10.1037/h0088437
Quinn, A., & Barth, A. M. (2014). Operationalizing the implicit curriculum in MSW
distance education programs. Journal of Social Work Education, 50(1), 34-47.
doi:10.1080/10437797.2014.856229
132
Ransdell, S., Kent, B., Gaillard‐Kenney, S., & Long, J. (2011). Digital immigrants fare
better than digital natives due to social reliance. British Journal of Educational
Technology, 42(6), 931-938. doi:10.1111/j.1467-8535.2010.01137.x
Reber, M. F. (2010). Systems thinking for an economically literate society. Libertarian
Papers, 2(31-36), 1-14. Retrieved from
http://libertarianpapers.org/article_volume/volume-2-2010/
Reinsmith-Jones, K., Kibbe, S., Crayton, T., & Campbell, E. (2015). Use of second life in
social work education: Virtual world experiences and their effect on students.
Journal of Social Work Education, 51(1), 90-108.
doi:10.1080/10437797.2015.977167
Ribble, M. (2012). Digital Citizenship for Educational Change. Kappa Delta Pi Record,
48(4), 148-151. doi:10.1080/00228958.2012.734015
Ribble, M. S., & Bailey, G. D. (2004). Monitoring technology misuse & abuse: A five-
step plan for creating a digital citizenship program in your school. T.H.E. Journal,
32(1), 22. Retrieved from
http://www.digitalcitizenship.net/uploads/T.H.E.JournalArticle.pdf
Robbins, S. P., & Singer, J. B. (2014). From the editor—The medium Is the message:
Integrating social media and social work education. Journal of Social Work
Education, 50(3), 387-390. doi.org/101080/10437797.2014.916957
Rogers, M. (2003). Diffusion of innovation, 5th Edition. Free Press. New York

133
Quinn, G., & Straussner, S. A. (2010). Licensure and continuing education requirements
for substance abuse training in social work. Journal of Social Work Practice In
The Addictions, 10(4), 433-437. doi:10.1080/1533256X.2010.521084
Safar, A. H., & Alkhezzi, F. A. (2013). Beyond computer literacy: Technology
integration and curriculum transformation. College Student Journal, 47(4), 614-
626. Retrieved from eric.ed.gov/?id=EJ1029288
Sahay, M., & Kumar, K. (2014). Strategy formation for higher education institutions
using system dynamics modeling. International Journal of Intelligent
Technologies & Applied Statistics, 7(3), 207-227.
doi:10.6148/IJITAS.2014.0703.02
Salajan, F., Welch, A., Peterson, C., & Ray, C. (2011). Faculty perceptions of teaching
quality and peer influence in the utilization of learning technologies: An extension
of the technology acceptance model. Proceedings of the International Conference
on E-Learning, 335-343. Retrieved from
www.ascilite.org/conferences/sydney13/program/papers/Musarrat.pdf
Saldaña, J. (2013). The Coding Manual for Qualitative Researchers. London: Sage.
Sangeeta Namdev, D. (2012). ICT and web technology based innovations in education
sector. Turkish Online Journal of Distance Education, 13(4), 256-268. Retrieved
from https://www.learntechlib.org/p/113702
Schuler, D. (2002). Digital cities and digital citizens. Digital cities II: Computational and
sociological approaches lecture notes in computer science. 2362, 71-85. Retrieved
from link.springer.com/chapter/10.1007%2F3-540-45636-8_6

134
Servon, L., J. (2002). Bridging the digital divide: Technology, community and public
policy. New Jersey: Blackwell Publishing
Shdaimah, C. S., & McCoyd, J. M. (2012). Social work sense and sensibility: A
framework for teaching an integrated perspective. Social Work Education, 31(1),
22-35. doi:10.1080/02615479.2010.541237
Shorkey, C. T., & Uebel, M. (2014). History and development of instructional technology
and media in social work education. Journal of Social Work Education, 50(2),
247-261. doi:10.1080/10437797.2014.885248
Sipior, J. C., Ward, B. T., & Connolly, R. (2013). E-government awareness and visitation
among the digitally disadvantaged. Journal of Internet Commerce, 12(1), 26-47.
doi:10.1080/15332861.2013.763692
Skoretz, Y. M. (2011). A study of the impact of a school-based, job-embedded
professional development program on elementary and middle school teacher
efficacy for technology integration (Order No. 3444404). Available from
ProQuest Central. (858601892). Retrieved from
http://search.proquest.com/docview/858601892?accountid=14872
Social Work Policy Institution. (2013). Social work policy institute. Retrieved from
http://www.socialworkpolicy.org/research
Smith, C. W. (2010). “Digital divide” defined (hint: It’s not about access). Digital Divide
Institute. Retrieved From: http://www.digitaldivide.org/#!dd-defined/c1dh0
Steyaert, J., & Gould, N. (2009). Social work and the changing face of the digital divide.
British Journal of Social work, 39(4), 740-753. doi:10.1093/bjsw/bcp022

135
Stone, C., Trisi, D., Sherman, A., & Chen, W. (2014, April 17). A guide to statistics on
historical trends in income inequality. doi:10.1787/factbook-2014-graph56-en
Strom-Gottfried, K., Thomas, M., & Anderson, H. (2014). Social work and social media:
reconciling ethical standards and emerging technologies. Journal of Social Work
Values & Ethics, 11(1), 54-65. Retrieved from jswve.org/.../2014-1/.../7-JSWVE-
11-1-Social%20Work%20and%20Social%20Media...
Tsai, C., Chuang, S., Liang, J., & Tsai, M. (2011). Self-efficacy in Internet-based
learning environments: A literature review. Journal of Educational Technology &
Society, 14(4), 222-240. Retrieved from www.ifets.info/journals/14_4/19.pdf
Tüzemen, D., & Willis, J. (2013). The vanishing middle: Job polarization and workers'
Response to the decline in middle-skill jobs. Economic Review (01612387), (1),
5-32. Retrieved from https://ideas.repec.org/a/fip/fedker/y2013iqip5-
32nv.98no.1.html
Tashakkori, A. & Teddlie, C. (2010). Sage handbook of mixed methods in social &
behavioral research (2nd ed.). Los Angeles, Calif.: SAGE Publications.
U.S. Department of Labor Bureau of Labor Statistics. (2014, January 8). Job outlook:
Social workers. Retrieved January 24, 2015, from
http://www.bls.gov/ooh/community-and-social-service/social-workers.htm#tab-6
U.S. Department of Education. (2010, January 1). Evaluation of evidence-based practices
in online learning: A meta-analysis and review of online learning studies.
Retrieved January 19, 2015, from
https://www2.ed.gov/rschstat/eval/tech/evidence-based-practices/finalreport.pdf

136
USA.gov. (2014, November). Federal mobile apps directory. Retrieved from
http://www.usa.gov/mobileapps.shtml on January 19th, 2015.
Vayda, E., & Bogo, M. (1991). A teaching model to unite classroom and field. Journal of
Social Work Education, 27(3), 271-278. doi:10.3138/9781442621152
Van Vokom, M., Stapley, J. C., & Amaturo, V. (2014). Revisiting the digital divide:
Generational differences in technology use in everyday life. North American
Journal of Psychology, 16(3), 557-574. doi:10.3138/9781442621152
Vatter, H. G., & Will, R. E. (1967). Technology and the new philosophy of poverty.
Southern Economic Journal, 33(4), 559. doi:10.2307/1055650
Venkatesh, V.; Morris, M. G.; Davis, G. B.; Davis, F. D. (2003), User acceptance of
information technology: Toward a unified view. MIS Quarterly, 27 (3), 425–478.
doi:10.1111/j.1540-5915.2002.tb01646.x
Vernon, R., Vakalahi, H., Pierce, D., Pittman-Munke, P., & Adkins, L. (2009). Distance
education programs in social work: Current and emerging trends. Journal of
Social Work Education. 45, 263-276. doi:10.5175/jswe.2009.200700081
..
Videka, L., & Goldstein, E. (2012). 50 years and the future of agency-based clinical
social work practice: Introduction to the special issue. Clinical Social Work
Journal, 40(2), 119-126. doi:10.1007/s10615-012-0396-z
von Bertalanffy, L. (1968) General system theory: Foundations, development,
applications. New York, NY: Braziller.
von Bertalanffy, L. (1972). The history and status of general systems theory. Academy of
Management Journal, 15(4), 407-426. doi:10.2307/255139

137
Wang, L., Ertmer, P. A., & Newby, T. J. (2004). Increasing pre-service teachers' self-
efficacy beliefs for technology integration. Journal of Research on Technology In
Education (International Society For Technology In Education), 36(3), 231-250.
doi:10.1080/15391523.2004.10782414
Warner, R. (2013). Applied statistics: From bivariate through multivariate techniques.
Thousand Oaks, Calif.: SAGE Publications.
Watling, S. (2012). Digital exclusion: Potential implications for social work education.
Social Work Education, 31(1), 125-130. doi:10.1080/02615479.2010.539605
Watling, S., & Crawford, K. (2010). Digital exclusion: Implications for human services
Practitioners. Journal of Technology In Human Services, 28(4), 205-216.
doi:10.1080/15228835.2011.565242
Watson, W., & Watson, S. (2013). Exploding the ivory tower: Systemic change for
higher education. Techtrends: Linking Research & Practice to Improve Learning,
57(5), 42-46. doi:10.1007/s11528-013-0690-9
Watty, K., McKay, J., & Ngo, L. (2016). Innovators or inhibitors? Accounting faculty
resistance to new educational technologies in higher education. Journal of
Accounting Education, 361-15. doi:10.1016/j.jaccedu.2016.03.003
Wei, L., & Hindman, D. (2011). Does the digital divide matter more? Comparing the
effects of new media and old media use on the education-based knowledge gap.
Mass Communication & Society, 14(2), 216-235.
doi:10.1080/15205431003642707

138
Weisenfluh, S. M., & Csikai, E. L. (2013). Professional and educational needs of hospice
and palliative care social workers. Journal of Social Work In End-Of-Life &
Palliative Care, 9(1), 58-73. doi:10.1080/15524256.2012.758604
Williams, J., & Bolland, K. (2011). Mapping our way to success. Journal of
Baccalaureate Social Work, 16(2), 39-114. Retrieved by
https://journals.iupui.edu/index.php/advancesinsocialwork/article/viewFile/.../169
42
Wright, J. M. (2014). Planning to meet the expanding volume of online learners: An
examination of faculty motivation to teach online. Educational Planning, 21(4),
35-49. Retrieved from
digitalcommons.kennesaw.edu/cgi/viewcontent.cgi?article=1514&context=etd
Ye, H. (2014). Universal design for learning in an online teacher education course:
Enhancing learners' confidence to teach online. Journal of Online Learning &
Teaching, 10(2), 283-298. Retrieved from
https://www.jolt.merlot.org/vol10no2/he_0614.pdf
Youn, E. (2007). The relationship between technology content in a masters of social work
curriculum and technology use in social work practice: A qualitative research
study. Journal of Technology in Human Services, 25(1-2), 45-58.
doi:10.1300/J017v25n01_03
Zhang, W., & Gutierrez, O. (2007). Information technology acceptance in the social
services sector context: An exploration. Social Work, 52(3), 221-231. doi:
10.1093/sw/52.3.221
139
Zickuhr, K., & Smith, A. (2013, August 26). Home broadband 2013. Retrieved
November 30, 2014, from http://www.pewInternet.org/files/old-
media//Files/Reports/2013/PIP_Broadband 2013_082613.pdf
Zohrabi, M. (2013). Mixed method research: Instruments, validity, reliability and
reporting findings. Theory and Practice in Language Studies,3(2), 254-262.
doi:10.4304/tpls.3.2.254-262
140
Appendix A: Letter of Permission
Dear Ellen, You have my permission to modify the survey and use it for your dissertation study. The terms and conditions you specified are excellent. Thank you, Ling Ling Wang, Ph.D. Professor of Graduate School of Computer and Information Sciences Nova Southeastern University ________________________________________ From: Belluomini, Ellen [[email protected]] Sent: Friday, January 02, 2015 2:18 PM To: Ling Wang; [email protected] Subject: Permission to alter your CTI survey Dear Dr. Wang and Dr. Ertmer, I am a doctoral student from Walden University in the dissertation phase of earning my PhD. My dissertation is tentatively titled “Digitally Immigrant Social Work Faculty: Technology Self-Efficacy and Practice Outcomes” under the direction of Dr. Barbara Benoliel. I would like your permission to reproduce and alter some of your Computer Technology Integration survey as a self-efficacy measure in my research study. I have enclosed the differences. These differences address social work educators specifically and change the ratings to reflect a Diffusion of Innovation Theory model. I am validating the altered tool due to these modifications. I have enclosed the altered survey in this document. I promise to use this survey only for my research study and will not sell or use it with any compensated or curriculum development activities. I will include the copyright statement in the survey for each participant. The survey will be sent in an online format using Qualtrics as a data collection tool. I will send my research study and any proceeding articles, which include credit for your survey, to your attention. If these are acceptable terms and conditions, please indicate so by returning my email
141
stating I have your permission to use this modified survey in my research. Regards, Ellen Ellen Belluomini, LCSW Dominican University - Graduate School of Social Work Lecturer/Coordinator - Military Social Work Program

142
Appendix B: Computer Technology Integration Survey
Q1 Statement of Consent: I have read the above information. My understanding of this study is sufficient to agree to my involvement in this research. I have read the above information. I consent to participate in this study at this time. � I consent to my participation in this study.
� I do not wish to participate in this study.
Q2 Welcome!
Thank you for agreeing to participate in this survey about understanding the part technology plays in social work education. This survey is broken up into two parts, demographics with survey questions (13) and a self-efficacy survey (21 questions). This survey should take no longer than 15- 20 minutes. Below is a definition of technology and technology integration in relation to this survey. Technology - the methods, theory, devices, and practices used to solve problems using mechanical or industrial arts. Technology Integration - Using technology innovations in social work education to support curricular goals, address disparities, and maintain cultural relevance in practice. This first part of the survey consists of demographics and specifics of behavior in the integration of technology in your pedagogy. The second part is a modified version of the Computer Technology Integration Survey by Wand, Ertmer, and Newby (2004). Thank you for taking the time to participate in this study. Q4 What is your current age? � Under 35
� 35 - 44 years old
� 45 - 54 years old
� 55 - 64 years old
� 65 over
Q5 What is your gender preference? � Male
� Female
Q6 How many years have you practiced social work in the field? (not including teaching, consulting, or research) � 0-5 years
� 6-10 years
� 11-15 years
� Over 15 years
� I have never practiced in the field

143
Q7 How many students are enrolled at your university? (The entire school, not just the social work department) � 500 - 1,999
� 2,000 - 4,999
� 5,000 - 9,999
� 10,000 +
Q8 What is your faculty status? � Non - Tenured
� Visiting Professor
� Instructor
� Lecturer
� Tenure Track
� Tenured
� Other ____________________
Q9 Please check which level of social work education you primarily teach in: � BSW
� MSW
� PhD (if you only instruct at this level, thank you for your participation, but this
survey is only for BSW and MSW educators)
Q10 The type of courses I instruct in primarily are... � Fully Online
� Equally online and face to face
� Between 25-50% online
� Under 25% online
� I teach online minimally
� I do not teach online
Q11 Please record the amount of online or over blended format courses you have taught. � I have not instructed an online or blended course
� I have instructed in between 1 - 5 online/blended courses (blended means over 25%)
� I have instructed between 6 - 10 online/blended courses (blended means over 25%)
� I have instructed over 11 Online/blended courses (blended means over 25%)
Q12 What is the primary focus of your social work department? � A teaching institution
� A research institution

144
Q13 Please rank which courses you most often instruct in social work education. One being the most often, three being the least. ______ HBSE
______ Diversity
______ Policy
______ Practice
______ Research
______ Community
Q14 On scale of 1 - 10, how important to you personally is it to integrate technology into social work curriculum as a cultural competency for future social workers? � 0
� 1
� 2
� 3
� 4
� 5
� 6
� 7
� 8
� 9
� 10
Q15 On scale of 1 - 10, how important to your social work program is it to integrate technology into social work curriculum as a cultural competency for future social workers? � 0
� 1
� 2
� 3
� 4
� 5
� 6
� 7
� 8
� 9
� 10

145
Q16 Please check all the digital tools you currently use or have used within the last year in social work courses with your students.
Technology used in course delivery
Clickers in the Classroom �
Digital Cameras/video �
eAssessment �
ePortfolios �
Hash Tags �
Instructional Technology Devices (i.e. tablets, computers, etc.)
�
Learning Management Systems (i.e. Blackboard, D2L, Moodle)
�
Collaborative learning online tools (i.e., Google Docs, Dropbox)
�
Presentation software (i.e., PowerPoint, Keynote, Prezi)
�
Screen-casts (providing online instruction, lectures, etc.)
�
Smart Boards �
Smart Phones �
Apps �
Online Chats �
Survey Tools Online �
Provide tutorials or tutoring about technological processes or programs
�
Your own website �
Virtual Learning Environment (i.e. Adobe Connect, Blackboard Collaborate)
�
Video Conferencing (i.e. Adobe Connect, Blackboard Collaborate)
�
Podcasting �
Data collection through GPS or Geocaching:
�
Metadata collection tools �
Software Program from Publisher of Book (i.e., Pearson Course Connect)
�

146
MOOCs (Massive Open Online Courses) �
Other specify please: �
Other specify please: �
Other specify please: �
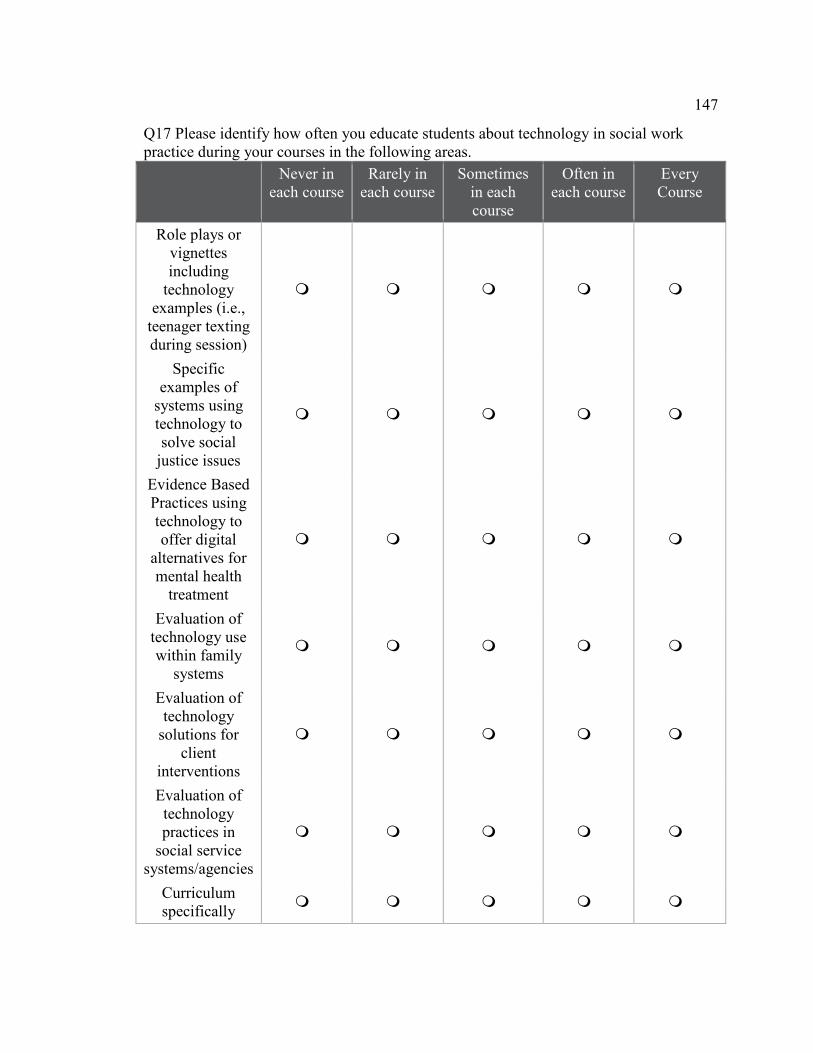
147
Q17 Please identify how often you educate students about technology in social work practice during your courses in the following areas.
Never in each course
Rarely in each course
Sometimes in each course
Often in each course
Every Course
Role plays or vignettes including
technology examples (i.e.,
teenager texting during session)
� � � � �
Specific examples of
systems using technology to solve social
justice issues
� � � � �
Evidence Based Practices using technology to offer digital
alternatives for mental health
treatment
� � � � �
Evaluation of technology use within family
systems
� � � � �
Evaluation of technology
solutions for client
interventions
� � � � �
Evaluation of technology practices in
social service systems/agencies
� � � � �
Curriculum specifically
� � � � �

148
assessing effects of the Digital
Divide on client populations
Solutions to address the
digital divide with client populations
� � � � �
Ethical use of technology practices
professionally
� � � � �
Ethical use of technology practices
personally
� � � � �
How to use social media for
advocacy � � � � �

149
Q18 Please choose the option which best describes the belief about your abilities using technology in response to each question. The self-efficacy scale options are defined as:
Totally Agree - I am an innovator in this area of using technology – I am confident in introducing and taking risks using technology. I am a leader in my use of technology.
Strongly Agree - I am an early adopter in this area of using technology – I am confident, but less vocal and more discerning about using technology, but I do use the latest tested advances.
Fairly Agree - I am in the early majority in this area of using technology – I am confident with technologies only after others show me how to use them. I am confident after I have tested the technology and the benefits are explained to me.
Agree a little - I am in the late majority in this area of using technology – I am confident in being skeptical about technology adoption and I only use technology after the majority of people have integrated the digital process or tool productively.
Disagree - I am one of the last in this area of using technology – I am confident in being conservative, traditional and skeptical of the change technology brings. I only use technology if it is required.
Q19 I feel confident that I understand computer capabilities well enough to maximize them in my classroom. � Totally Agree - I am an innovator in this area of using technology
� Strongly Agree - I am an early adopter in this area of using technology
� Fairly Agree - I am in the early majority in this area of using technology
� Agree a little - I am in the late majority in this area of using technology
� Disagree - I am one of the last in this area of using technology
Q20 I feel confident that I have the skills necessary to use the computer for instruction. � Totally Agree- I am an innovator in this area of using technology
� Strongly Agree - I am an early adopter in this area of using technology
� Fairly Agree - I am in the early majority in this area of using technology
� Agree a little - I am in the late majority in this area of using technology
� Disagree - I am one of the last in this area of using technology

150
Q21 I feel confident that I can successfully teach relevant subject content with appropriate use of technology. � Totally Agree - I am an innovator in this area of using technology
� Strongly Agree - I am an early adopter in this area of using technology
� Fairly Agree - I am in the early majority in this area of using technology
� Agree a little - I am in the late majority in this area of using technology
� Disagree -I am one of the last in this area of using technology
Q22 I feel confident in my ability to evaluate software tools and processes for teaching and learning. � Totally Agree - I am an innovator in this area of using technology
� Strongly Agree - I am an early adopter in this area of using technology
� Fairly Agree - I am in the early majority in this area of using technology
� Agree a little - I am in the late majority in this area of using technology
� Disagree -I am one of the last in this area of using technology
Q23 I feel confident that I can use correct computer terminology when directing students and their computer use. � Totally Agree - I am an innovator in this area of using technology
� Strongly Agree - I am an early adopter in this area of using technology
� Fairly Agree - I am in the early majority in this area of using technology
� Agree a little - I am in the late majority in this area of using technology
� Disagree -I am one of the last in this area of using technology
Q24 I feel confident I can help students when they have difficulty with the computer. � Totally Agree - I am an innovator in this area of using technology
� Strongly Agree - I am an early adopter in this area of using technology
� Fairly Agree - I am in the early majority in this area of using technology
� Agree a little - I am in the late majority in this area of using technology
� Disagree -I am one of the last in this area of using technology
Q25 I feel confident I can effectively monitor students' computer use for project development in my classroom. � Totally Agree - I am an innovator in this area of using technology
� Strongly Agree - I am an early adopter in this area of using technology
� Fairly Agree - I am in the early majority in this area of using technology
� Agree a little - I am in the late majority in this area of using technology
� Disagree -I am one of the last in this area of using technology
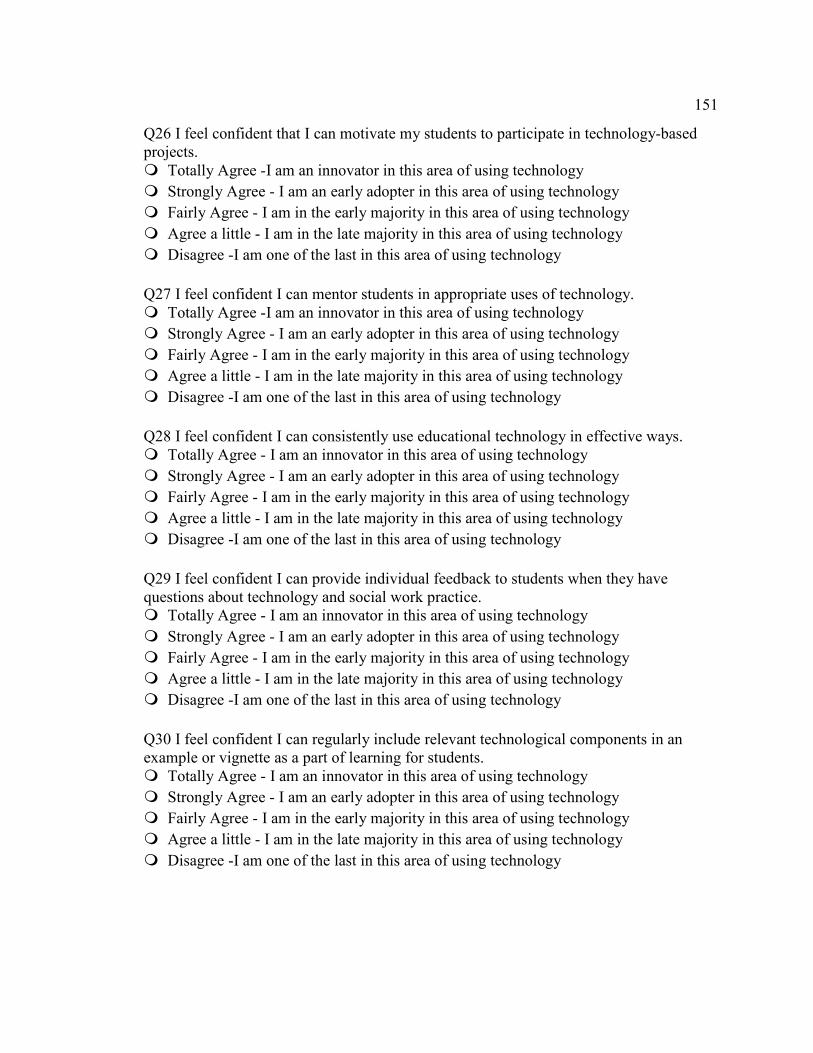
151
Q26 I feel confident that I can motivate my students to participate in technology-based projects. � Totally Agree -I am an innovator in this area of using technology
� Strongly Agree - I am an early adopter in this area of using technology
� Fairly Agree - I am in the early majority in this area of using technology
� Agree a little - I am in the late majority in this area of using technology
� Disagree -I am one of the last in this area of using technology
Q27 I feel confident I can mentor students in appropriate uses of technology. � Totally Agree -I am an innovator in this area of using technology
� Strongly Agree - I am an early adopter in this area of using technology
� Fairly Agree - I am in the early majority in this area of using technology
� Agree a little - I am in the late majority in this area of using technology
� Disagree -I am one of the last in this area of using technology
Q28 I feel confident I can consistently use educational technology in effective ways. � Totally Agree - I am an innovator in this area of using technology
� Strongly Agree - I am an early adopter in this area of using technology
� Fairly Agree - I am in the early majority in this area of using technology
� Agree a little - I am in the late majority in this area of using technology
� Disagree -I am one of the last in this area of using technology
Q29 I feel confident I can provide individual feedback to students when they have questions about technology and social work practice. � Totally Agree - I am an innovator in this area of using technology
� Strongly Agree - I am an early adopter in this area of using technology
� Fairly Agree - I am in the early majority in this area of using technology
� Agree a little - I am in the late majority in this area of using technology
� Disagree -I am one of the last in this area of using technology
Q30 I feel confident I can regularly include relevant technological components in an example or vignette as a part of learning for students. � Totally Agree - I am an innovator in this area of using technology
� Strongly Agree - I am an early adopter in this area of using technology
� Fairly Agree - I am in the early majority in this area of using technology
� Agree a little - I am in the late majority in this area of using technology
� Disagree -I am one of the last in this area of using technology
152
Q31 I feel confident about selecting appropriate technological interventions for instruction of social work students for their client populations. � Totally Agree -I am an innovator in this area of using technology
� Strongly Agree - I am an early adopter in this area of using technology
� Fairly Agree - I am in the early majority in this area of using technology
� Agree a little - I am in the late majority in this area of using technology
� Disagree -I am one of the last in this area of using technology
Q32 I feel confident about assigning and grading technology-based projects. � Totally Agree -I am an innovator in this area of using technology
� Strongly Agree - I am an early adopter in this area of using technology
� Fairly Agree - I am in the early majority in this area of using technology
� Agree a little - I am in the late majority in this area of using technology
� Disagree -I am one of the last in this area of using technology
Q33 I feel confident about keeping curricular goals and technology uses in mind when selecting an ideal way to assess student learning. � Totally Agree - I am an innovator in this area of using technology
� Strongly Agree - I am an early adopter in this area of using technology
� Fairly Agree - I am in the early majority in this area of using technology
� Agree a little - I am in the late majority in this area of using technology
� Disagree -I am one of the last in this area of using technology
Q34 I feel confident about using technology resources (such as spreadsheets, electronic portfolios, Learning Management statistics, etc.) to collect and analyze data from student tests and products to improve instructional practices. � Totally Agree - I am an innovator in this area of using technology
� Strongly Agree - I am an early adopter in this area of using technology
� Fairly Agree - I am in the early majority in this area of using technology
� Agree a little - I am in the late majority in this area of using technology
� Disagree -I am one of the last in this area of using technology
Q35 I feel confident that I can address the impact of the digital divide/exclusion on social work populations with students. � Totally Agree - I am an innovator in this area of using technology
� Strongly Agree - I am an early adopter in this area of using technology
� Fairly Agree - I am in the early majority in this area of using technology
� Agree a little - I am in the late majority in this area of using technology
� Disagree -I am one of the last in this area of using technology

153
Q36 I feel confident I can be responsive to students' needs during technology usage. � Totally Agree - I am an innovator in this area of using technology
� Strongly Agree - I am an early adopter in this area of using technology
� Fairly Agree - I am in the early majority in this area of using technology
� Agree a little - I am in the late majority in this area of using technology
� Disagree -I am one of the last in this area of using technology
Q37 I feel confident that, as time goes by, my ability to address my students' and social work populations technology needs will continue to improve. � Totally Agree -I am an innovator in this area of using technology
� Strongly Agree - I am an early adopter in this area of using technology
� Fairly Agree - I am in the early majority in this area of using technology
� Agree a little - I am in the late majority in this area of using technology
� I Disagree - am one of the last in this area of using technology
Q38 I feel confident that I can develop creative ways to cope with system innovations (such as Learning Management System changes or upgrades) and continue to teach effectively with technology. � Totally Agree - I am an innovator in this area of using technology
� Strongly Agree - I am an early adopter in this area of using technology
� Fairly Agree - I am in the early majority in this area of using technology
� Agree a little - I am in the late majority in this area of using technology
� Disagree -I am one of the last in this area of using technology
Q39 I feel confident that I can carry out technology- based projects even when I am opposed by skeptical colleagues. � Totally Agree - I am an innovator in this area of using technology
� Strongly Agree - I am an early adopter in this area of using technology
� Fairly Agree - I am in the early majority in this area of using technology
� Agree a little - I am in the late majority in this area of using technology
� Disagree -I am one of the last in this area of using technology
Q40 If you have any questions or would like an electronic copy of this dissertation please leave your information (name, email address) below or send your question to Ellen Belluomini at [email protected]. I appreciate your participation in this research.

154
Appendix C: Letter to Directors of Social Work Programs
To All Directors and Chairpersons of Social Work Programs
My name is Ellen Belluomini, a faculty member at Dominican University. As part
of my doctoral research in social work education I have designed a study to identify
Computer Technology Integration self-efficacy and the pedagogy/curriculum
development of digital practices in social work education for faculty over the age of 35.
As a social work educator myself, I understand the difficulty technology integration
poses in the education of students. This study explores the relationship between social
work educators and technology.
I would appreciate it if you would support this study in two ways:
1. Please forward this link to your full time faculty for their participation in this
study.
2. Please use a small portion of a staff meeting to identify that an email was sent
out to participate in this study and encourage their participation.
Should you have any questions, I can be reached via email at [email protected]
or by phone at XXX. You may also contact my research chair, Dr. Barbara Benoliel, at
Your support of this research is greatly appreciated.
Ellen Belluomini
Doctoral Candidate
Walden University

155
Appendix D: Multinomial Logistic Regression Coefficients
Variables B S.E. Wald Sig Odds 95%
Ratio Lower Upper
RQ2 DV’s
Never or Rarely in each course
Role plays or vignettes including technology examples (1) 0.48 0.14 12.52 .000 1.62 1.24 2.12 Specific examples of systems using technology to solve social justice issues (2) 0.35 0.14 6.27 .012 1.42 1.08 1.88 EBP using technology to offer digital alternatives for MH Treatment (3) 0.37 0.14 7.19 .007 1.45 1.11 1.90 Evaluation of technology use within family systems (13) 0.74 0.18 17.20 .000 2.10 1.48 2.98 Evaluation of technology solutions for client interventions (4) 0.56 0.15 13.37 .000 1.76 1.30 2.38 Evaluation of technology practices in social service systems/agencies (5) 0.52 0.14 13.01 .000 1.67 1.27 2.21 Ethical use of technology practices professionally (7) 0.32 0.14 5.00 .025 1.37 1.04 1.81 Ethical use of technology practices personally (8) 0.27 0.15 3.30 .069 1.31 0.98 1.75 How to use social media for advocacy (9) 0.25 0.14 3.32 .068 1.28 0.98 1.68
Often or in every course
Role plays or vignettes including technology examples (1) -0.31 0.19 2.50 .114 0.74 0.50 1.08 Specific examples of systems using technology to solve social justice issues (2) -0.90 0.21 17.64 .000 0.41 0.27 0.62 EBP using technology to offer digital alternatives for MH Treatment (3) -0.87 0.23 14.82 .000 0.42 0.27 0.65 Evaluation of technology use within family systems (13) -0.52 0.30 3.05 .081 0.59 0.33 1.07 Evaluation of technology solutions for client interventions (4) -1.09 0.28 15.46 .000 0.34 0.19 0.58 Evaluation of technology practices in social service systems/agencies (5) -0.72 0.20 12.51 .000 0.49 0.33 0.73 Ethical use of technology practices professionally (7) -0.37 0.14 6.73 .009 0.69 0.52 0.91 Ethical use of technology practices personally (8) -0.36 0.16 5.52 .019 0.70 0.51 0.94 How to use social media for advocacy (9) -0.64 0.16 15.03 .000 0.53 0.39 0.73

156
RQ3 DV’s
Never or Rarely in each course
Curriculum specifically assessing effects of the Digital Divide 0.46 0.17 7.65 .006 1.58 1.14 2.18 on client populations (6) Solutions to address the digital divide with client populations (14) 0.46 0.17 7.70 .006 1.58 1.14 2.19
Often or in every course Curriculum specifically assessing effects of the Digital Divide -0.68 0.26 6.75 .009 0.51 0.31 0.85 on client populations (6) Solutions to address the digital divide with client populations (14) -1.01 0.32 9.97 .002 0.36 0.19 0.68

157
Appendix E: MLR Output Q17
Variables B S.E. Wald Sig Odds 95%
Ratio Lower Upper
RQ2 DV’s
Never or Rarely in each course
Role plays or vignettes including technology examples (1) 0.48 0.14 12.52 .000 1.62 1.24 2.12 Specific examples of systems using technology to solve social justice issues (2) 0.35 0.14 6.27 .012 1.42 1.08 1.88 EBP using technology to offer digital alternatives for MH Treatment (3) 0.37 0.14 7.19 .007 1.45 1.11 1.90 Evaluation of technology use within family systems (13) 0.74 0.18 17.20 .000 2.10 1.48 2.98 Evaluation of technology solutions for client interventions (4) 0.56 0.15 13.37 .000 1.76 1.30 2.38 Evaluation of technology practices in social service systems/agencies (5) 0.52 0.14 13.01 .000 1.67 1.27 2.21 Ethical use of technology practices professionally (7) 0.32 0.14 5.00 .025 1.37 1.04 1.81 Ethical use of technology practices personally (8) 0.27 0.15 3.30 .069 1.31 0.98 1.75 How to use social media for advocacy (9) 0.25 0.14 3.32 .068 1.28 0.98 1.68
Often or in every course
Role plays or vignettes including technology examples (1) -0.31 0.19 2.50 .114 0.74 0.50 1.08 Specific examples of systems using technology to solve social justice issues (2) -0.90 0.21 17.64 .000 0.41 0.27 0.62 EBP using technology to offer digital alternatives for MH Treatment (3) -0.87 0.23 14.82 .000 0.42 0.27 0.65 Evaluation of technology use within family systems (13) -0.52 0.30 3.05 .081 0.59 0.33 1.07 Evaluation of technology solutions for client interventions (4) -1.09 0.28 15.46 .000 0.34 0.19 0.58 Evaluation of technology practices in social service systems/agencies (5) -0.72 0.20 12.51 .000 0.49 0.33 0.73 Ethical use of technology practices professionally (7) -0.37 0.14 6.73 .009 0.69 0.52 0.91 Ethical use of technology practices personally (8) -0.36 0.16 5.52 .019 0.70 0.51 0.94 How to use social media for advocacy (9) -0.64 0.16 15.03 .000 0.53 0.39 0.73
RQ3 DV’s
Never or Rarely in each course
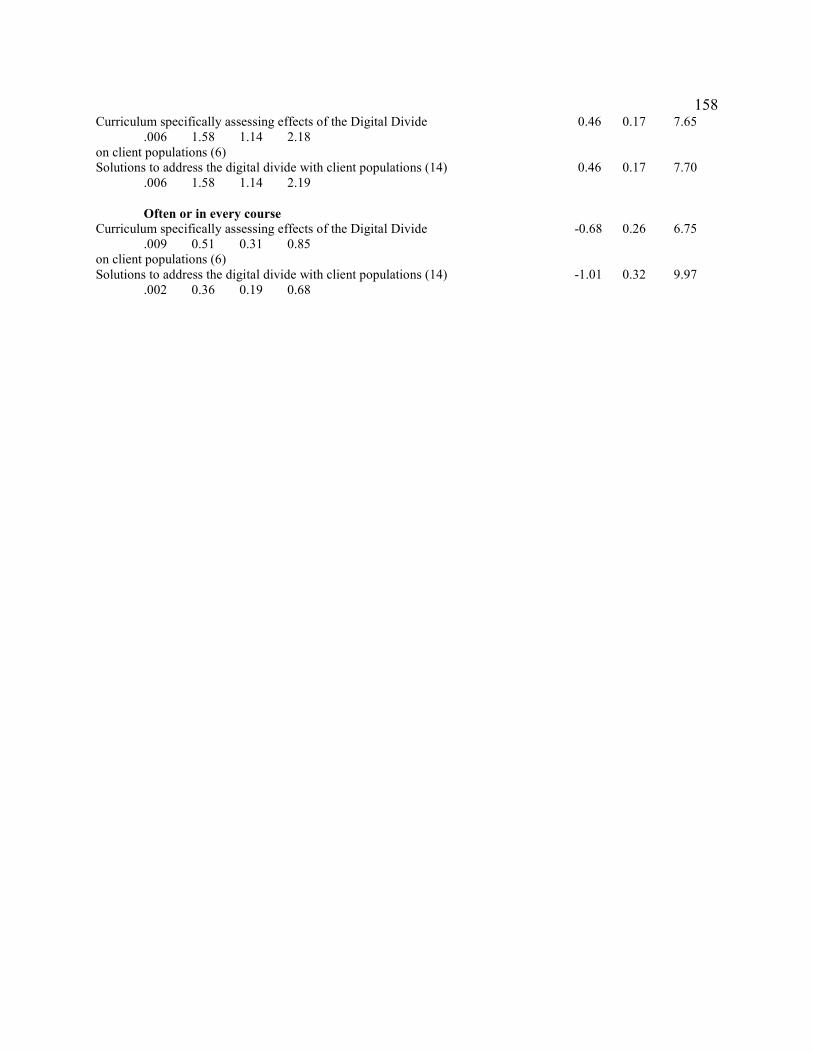
158
Curriculum specifically assessing effects of the Digital Divide 0.46 0.17 7.65 .006 1.58 1.14 2.18 on client populations (6) Solutions to address the digital divide with client populations (14) 0.46 0.17 7.70 .006 1.58 1.14 2.19
Often or in every course Curriculum specifically assessing effects of the Digital Divide -0.68 0.26 6.75 .009 0.51 0.31 0.85 on client populations (6) Solutions to address the digital divide with client populations (14) -1.01 0.32 9.97 .002 0.36 0.19 0.68

159
Appendix F: MLR Output Q17
Parameter Estimates
Q17_1_Recoded Role plays or
vignettes including technology
examples (i.e., teenager texting
during session)a B
Std.
Error Wald df Sig.
Exp(
B)
95% Confidence
Interval for Exp(B)
Lower
Bound
Upper
Bound
0 Never or
Rarely in each
course
Intercept .680 .301 5.104 1 .024
[Q4=2] .172 .389 .196 1 .658 1.188 .554 2.548
[Q4=3] .311 .388 .643 1 .423 1.365 .638 2.917
[Q4=4] .293 .391 .561 1 .454 1.340 .623 2.884
[Q4=5] 0b . . 0 . . . .
FAC1_2 .483 .136
12.51
9 1 .000 1.620 1.240 2.117
2 Often or in
every course
Intercept -
1.292 .515 6.284 1 .012
[Q4=2] .548 .604 .824 1 .364 1.730 .530 5.646
[Q4=3] .506 .617 .674 1 .412 1.659 .495 5.555
[Q4=4] 1.160 .599 3.752 1 .053 3.191 .986 10.322
[Q4=5] 0b . . 0 . . . .
FAC1_2 -.307 .194 2.496 1 .114 .736 .503 1.077
a. The reference category is: 1 Sometimes in each course.
b. This parameter is set to zero because it is redundant.
Age (Q4) did not have a significant impact on Q17_1, but I had it in the model, so the
coefficients of other predictors reflected controlling for age. Here, Factor 1 (captured 67% of the
total variance in the efficacy variables) had a sig. relationship with the likelihood of being in
Q17_1 Group 0. If the value for Factor 1 went up 1 unit, then the odds of being in Group 0
increased by a factor of 1.62 (or 62%). So as Factor 1 went up (meaning the ratings for the
efficacy questions move towards the end of the scale reflected "one of the last in this area using

160
technology"), the odds of being in Group 0 went up (Grp 0 is "rarely or never educate students
about technology..."). Factor 1 was not a sig. predictor of Group 2.
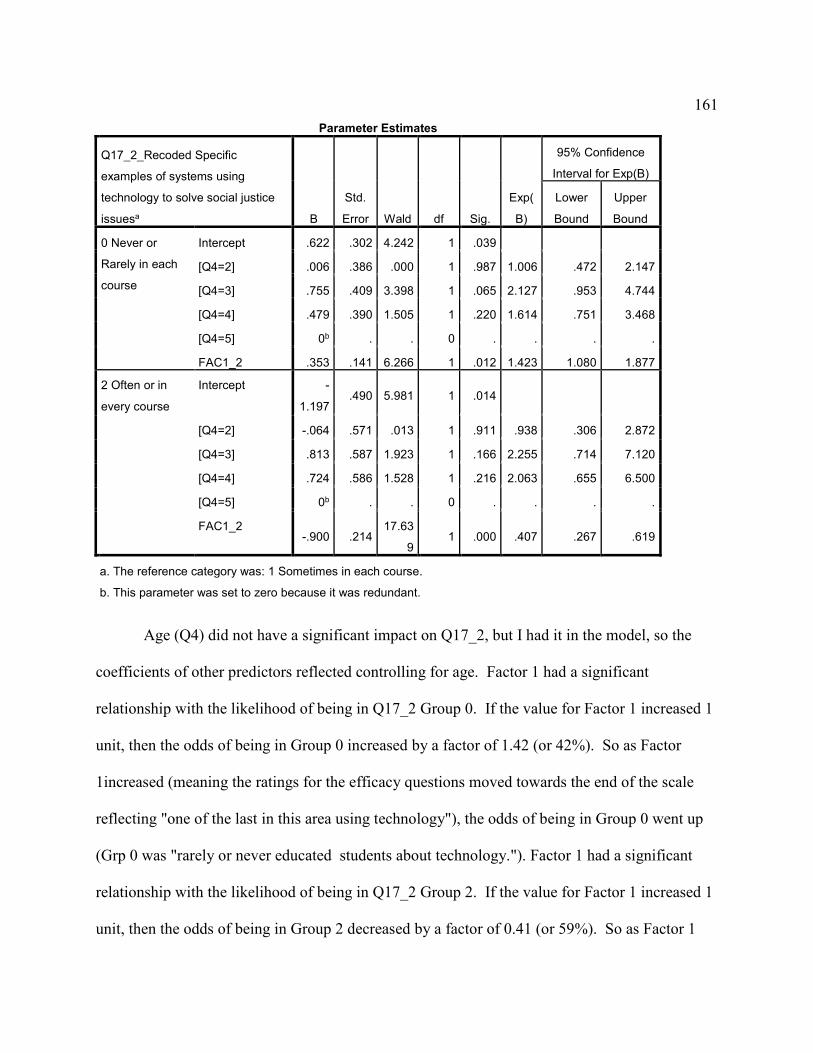
161
Parameter Estimates
Q17_2_Recoded Specific
examples of systems using
technology to solve social justice
issuesa B
Std.
Error Wald df Sig.
Exp(
B)
95% Confidence
Interval for Exp(B)
Lower
Bound
Upper
Bound
0 Never or
Rarely in each
course
Intercept .622 .302 4.242 1 .039
[Q4=2] .006 .386 .000 1 .987 1.006 .472 2.147
[Q4=3] .755 .409 3.398 1 .065 2.127 .953 4.744
[Q4=4] .479 .390 1.505 1 .220 1.614 .751 3.468
[Q4=5] 0b . . 0 . . . .
FAC1_2 .353 .141 6.266 1 .012 1.423 1.080 1.877
2 Often or in
every course
Intercept -
1.197 .490 5.981 1 .014
[Q4=2] -.064 .571 .013 1 .911 .938 .306 2.872
[Q4=3] .813 .587 1.923 1 .166 2.255 .714 7.120
[Q4=4] .724 .586 1.528 1 .216 2.063 .655 6.500
[Q4=5] 0b . . 0 . . . .
FAC1_2 -.900 .214
17.63
9 1 .000 .407 .267 .619
a. The reference category was: 1 Sometimes in each course.
b. This parameter was set to zero because it was redundant.
Age (Q4) did not have a significant impact on Q17_2, but I had it in the model, so the
coefficients of other predictors reflected controlling for age. Factor 1 had a significant
relationship with the likelihood of being in Q17_2 Group 0. If the value for Factor 1 increased 1
unit, then the odds of being in Group 0 increased by a factor of 1.42 (or 42%). So as Factor
1increased (meaning the ratings for the efficacy questions moved towards the end of the scale
reflecting "one of the last in this area using technology"), the odds of being in Group 0 went up
(Grp 0 was "rarely or never educated students about technology."). Factor 1 had a significant
relationship with the likelihood of being in Q17_2 Group 2. If the value for Factor 1 increased 1
unit, then the odds of being in Group 2 decreased by a factor of 0.41 (or 59%). So as Factor 1
162
increased (meaning the ratings for the efficacy questions moved towards the end of the scale
reflecting "one of the last in this area using technology"), the odds of being in Group 2 decreased
(Group 2 was "often or in every course educate students about technology").

163
Parameter Estimates
Q17_3_Recoded Evidence Based
Practices using technology to offer
digital alternatives for mental healtha B
Std.
Error Wald df Sig.
Exp(B
)
95% Confidence
Interval for Exp(B)
Lower
Bound
Upper
Bound
0 Never or
Rarely in each
course
Intercept .898 .318 7.956 1 .005
[Q4=2] .265 .413 .411 1 .521 1.303 .580 2.925
[Q4=3] .229 .403 .323 1 .570 1.258 .571 2.772
[Q4=4] -.215 .389 .305 1 .581 .807 .377 1.728
[Q4=5] 0b . . 0 . . . .
FAC1_2 .371 .138 7.192 1 .007 1.449 1.105 1.901
2 Often or in
every course
Intercept -
1.012 .504 4.029 1 .045
[Q4=2] .024 .596 .002 1 .967 1.025 .319 3.293
[Q4=3] -.306 .621 .243 1 .622 .736 .218 2.486
[Q4=4] .087 .592 .021 1 .883 1.091 .342 3.478
[Q4=5] 0b . . 0 . . . .
FAC1_2 -.871 .226
14.81
5 1 .000 .419 .269 .652
a. The reference category was: 1 Sometimes in each course.
b. This parameter was set to zero because it was redundant.
Age (Q4) did not have a significant impact on Q17_3, but I had it in the model, so the
coefficients of other predictors reflected controlling for age. Factor 1 had a significant
relationship with the likelihood of being in Q17_3 Group 0. If the value for Factor 1 increased 1
unit, then the odds of being in Group 0 increased by a factor of 1.45 (or 45%). So as Factor
1increased (meaning the ratings for the efficacy questions moved towards the end of the scale
reflecting "on one of the last in this area using technology"), the odds of being in Group 0
increased (Grp 0 was "rarely one ever educates students about technology"). Factor 1 had a
significant relationship with the likelihood of being in Q17_3 Group 2. If the value for Factor 1
increased 1 unit, then the odds of being in Group 2 decreased by a factor of 0.42 (or 58%). So as

164
Factor 1 increased (meaning the ratings for the efficacy questions moved towards the end of the
scale reflecting "one of the last in this area using technology"), the odds of being in Group 2
decreased (Grp 2 was "often or in every course educates students about technology").

165
Parameter Estimates
Q17_13_Recoded Evaluation of
technology use within family
systemsa B
Std.
Error Wald df Sig.
Exp(B
)
95% Confidence
Interval for Exp(B)
Lower
Bound
Upper
Bound
0 Never or
Rarely in each
course
Intercept 2.343 .486
23.23
1 1 .000
[Q4=2] -.449 .560 .641 1 .423 .639 .213 1.914
[Q4=3] -.557 .558 .995 1 .318 .573 .192 1.711
[Q4=4] -.775 .560 1.915 1 .166 .461 .154 1.380
[Q4=5] 0b . . 0 . . . .
FAC1_2 .742 .179
17.19
5 1 .000 2.100 1.479 2.981
2 Often or in
every course
Intercept -.890 .778 1.310 1 .252
[Q4=2] -.240 .855 .079 1 .779 .786 .147 4.205
[Q4=3] -.460 .879 .273 1 .601 .631 .113 3.540
[Q4=4] .100 .854 .014 1 .906 1.105 .207 5.890
[Q4=5] 0b . . 0 . . . .
FAC1_2 -.522 .299 3.052 1 .081 .593 .330 1.066
a. The reference category was: 1 Sometimes in each course.
b. This parameter was set to zero because it was redundant.
Age (Q4) did not have a significant impact on Q17_13, but I had it in the model, so the
coefficients of other predictors reflected controlling for age. Factor 1 had a significant
relationship with the likelihood of being in Q17_13 Group 0. If the value for Factor 1 increased
1 unit, then the odds of being in Group 0 increased by a factor of 2.10 (or 110%). So as Factor
1increased (meaning the ratings for the efficacy questions moved towards the end of the scale
reflecting "one of the last in this area using technology"), the odds of being in Group 0 increased
(Group 0 was "rarely or never educate students about technology, etc."). Factor 1 did not have a
significant relationship with the likelihood of being in Q17_13 Group 2 (p > .05).

166
Parameter Estimates
Q17_4_Recoded Evaluation of
technology solutions for client
interventionsa B
Std.
Error Wald df Sig.
Exp(B
)
95% Confidence
Interval for Exp(B)
Lower
Bound
Upper
Bound
0 Never or
Rarely in each
course
Intercept 1.373 .359
14.59
9 1 .000
[Q4=2] .044 .449 .010 1 .922 1.045 .433 2.521
[Q4=3] .077 .447 .030 1 .863 1.080 .450 2.596
[Q4=4] -.421 .433 .948 1 .330 .656 .281 1.533
[Q4=5] 0b . . 0 . . . .
FAC1_2 .564 .154
13.36
9 1 .000 1.757 1.299 2.378
2 Often or in
every course
Intercept -
1.420 .631 5.069 1 .024
[Q4=2] .002 .689 .000 1 .998 1.002 .260 3.865
[Q4=3] -.242 .722 .112 1 .737 .785 .191 3.229
[Q4=4] .303 .692 .192 1 .662 1.354 .349 5.255
[Q4=5] 0b . . 0 . . . .
FAC1_2 -
1.094 .278
15.46
3 1 .000 .335 .194 .578
a. The reference category was: 1 Sometimes in each course.
b. This parameter was set to zero because it was redundant.
Age (Q4) did not have a significant impact on Q17_4, but I had it in the model, so the
coefficients of other predictors reflected controlling for age. Factor 1 had a significant
relationship with the likelihood of being in Q17_4 Group 0. If the value for Factor 1 increased 1
unit, then the odds of being in Group 0 increased by a factor of 1.76 (or 76%). So as Factor
1increased (meaning the ratings for the efficacy questions moved towards the end of the scale
reflected "one of the last in this area using technology"), the odds of being in Group 0 increased
(Group 0 was "rarely or never educate students about technology, etc."). Factor 1 had a

167
significant relationship with the likelihood of being in Q17_4 Group 2. If the value for Factor 1
increased 1 unit, then the odds of being in Group 2 decreased by a factor of 0.34 (or 66%). So as
Factor 1 increased (meaning the ratings for the efficacy questions moved towards the end of the
scale reflecting "one of the last in this area using technology"), the odds of being in Group 2
decreased (Grp 2was "often or in every course educates students about technology, etc.").
Parameter Estimates
Q17_5_Recoded Evaluation of
technology practices in social
service systems/agenciesa B
Std.
Error Wald df Sig.
Exp(B
)
95% Confidence
Interval for Exp(B)
Lower
Bound
Upper
Bound
0 Never or
Rarely in each
course
Intercept .484 .302 2.561 1 .110
[Q4=2] .469 .397 1.392 1 .238 1.598 .733 3.482
[Q4=3] .530 .396 1.791 1 .181 1.700 .782 3.697
[Q4=4] .453 .388 1.364 1 .243 1.573 .736 3.363
[Q4=5] 0b . . 0 . . . .
FAC1_2 .515 .143
13.01
2 1 .000 1.673 1.265 2.213
2 Often or in
every course
Intercept -
1.202 .474 6.430 1 .011
[Q4=2] .444 .557 .636 1 .425 1.559 .523 4.645
[Q4=3] .759 .558 1.847 1 .174 2.136 .715 6.382
[Q4=4] .732 .567 1.668 1 .197 2.079 .685 6.313
[Q4=5] 0b . . 0 . . . .
FAC1_2 -.715 .202
12.50
8 1 .000 .489 .329 .727
a. The reference category was: 1 sometimes in each course.
b. This parameter was set to zero because it was redundant.
Age (Q4) did not have a significant impact on Q17_5, but I had it in the model, so the
coefficients of other predictors reflected controlling for age. Factor 1 had a significant
relationship with the likelihood of being in Q17_5 Group 0. If the value for Factor 1 increased 1
unit, then the odds of being in Group 0 increased by a factor of 1.67 (or 67%). So as Factor 1

168
increased (meaning the ratings for the efficacy questions move towards the end of the scale
reflecting "one of the last in this area using technology"), the odds of being in Group 0 increased
(Group 0 was "rarely or never educate students about technology, etc."). Factor 1 had a
significant relationship with the likelihood of being in Q17_5 Group 2. If the value for Factor 1
increased 1 unit, then the odds of being in Group 2 decreased by a factor of 0.49 (or 51%). So as
Factor 1 increased (meaning the ratings for the efficacy questions moved towards the end of the
scale reflected "one of the last in this area using technology"), the odds of being in Group 2
decreased (Grp 2 was "often or in every course educates students about technology, etc.").

169
Parameter Estimates
Q17_7_Recoded Ethical use of
technology practices professionallya B
Std.
Error Wald df Sig.
Exp(B
)
95% Confidence
Interval for Exp(B)
Lower
Bound
Upper
Bound
0 Never or
Rarely in each
course
Intercept .599 .334 3.226 1 .072
[Q4=2] -.472 .430 1.205 1 .272 .623 .268 1.449
[Q4=3] -.498 .419 1.412 1 .235 .608 .267 1.382
[Q4=4] -.562 .404 1.935 1 .164 .570 .258 1.258
[Q4=5] 0b . . 0 . . . .
FAC1_2 .317 .142 5.000 1 .025 1.372 1.040 1.811
2 Often or in
every course
Intercept .212 .367 .334 1 .563
[Q4=2] .032 .446 .005 1 .943 1.032 .430 2.477
[Q4=3] .033 .443 .005 1 .941 1.033 .434 2.460
[Q4=4] -.227 .441 .265 1 .607 .797 .336 1.893
[Q4=5] 0b . . 0 . . . .
FAC1_2 -.373 .144 6.727 1 .009 .688 .519 .913
a. The reference category was: 1 Sometimes in each course.
b. This parameter was set to zero because it was redundant.
Age (Q4) did not have a significant impact on Q17_7, but I had it in the model, so the
coefficients of other predictors reflected controlling for age. Factor 1 had a significant
relationship with the likelihood of being in Q17_7 Group 0. If the value for Factor 1 increased
by 1 unit, then the odds of being in Group 0 increased by a factor of 1.37 (or 37%). So as Factor
1increased (meaning the ratings for the efficacy questions moved towards the end of the scale
reflected "one of the last in this area using technology"), the odds of being in Group 0 increased
(Group 0 was "rarely or never educate students about technology, etc."). Factor 1 had a
significant relationship with the likelihood of being in Q17_7 Group 2. If the value for Factor 1
increased 1 unit, then the odds of being in Group 2 decreased by a factor of 0.69 (or 31%). So as
Factor 1 increased (meaning the ratings for the efficacy questions moved towards the end of the
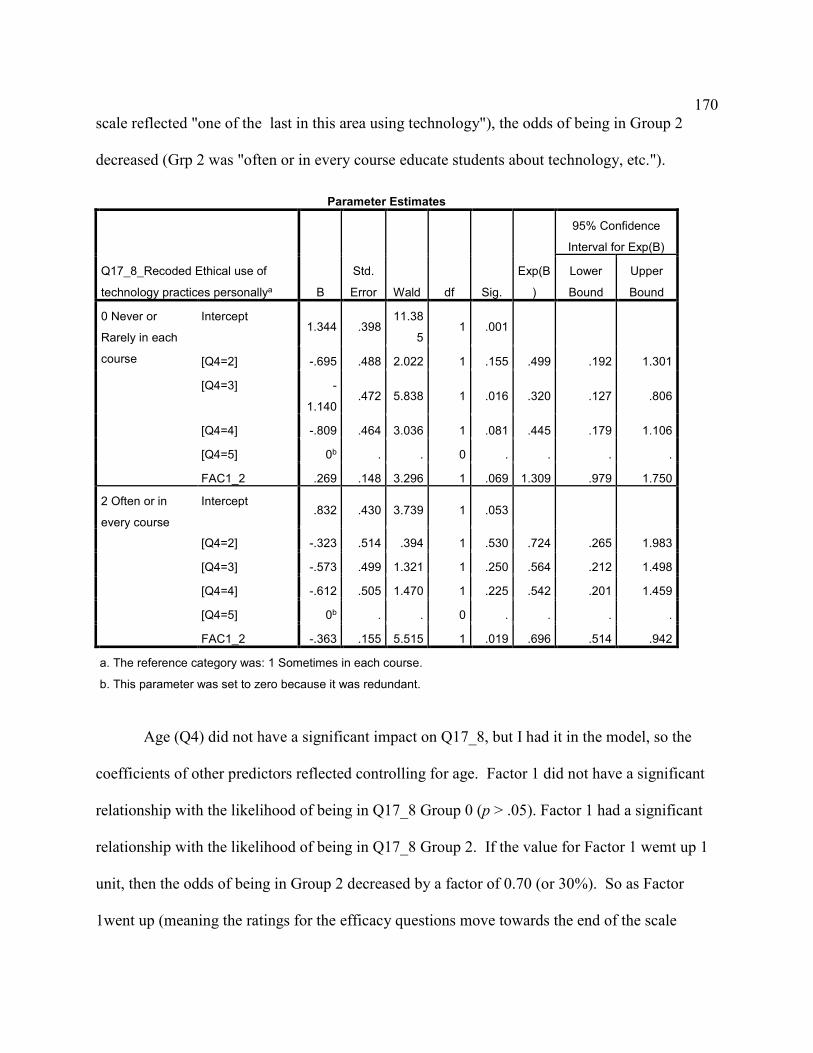
170
scale reflected "one of the last in this area using technology"), the odds of being in Group 2
decreased (Grp 2 was "often or in every course educate students about technology, etc.").
Parameter Estimates
Q17_8_Recoded Ethical use of
technology practices personallya B
Std.
Error Wald df Sig.
Exp(B
)
95% Confidence
Interval for Exp(B)
Lower
Bound
Upper
Bound
0 Never or
Rarely in each
course
Intercept 1.344 .398
11.38
5 1 .001
[Q4=2] -.695 .488 2.022 1 .155 .499 .192 1.301
[Q4=3] -
1.140 .472 5.838 1 .016 .320 .127 .806
[Q4=4] -.809 .464 3.036 1 .081 .445 .179 1.106
[Q4=5] 0b . . 0 . . . .
FAC1_2 .269 .148 3.296 1 .069 1.309 .979 1.750
2 Often or in
every course
Intercept .832 .430 3.739 1 .053
[Q4=2] -.323 .514 .394 1 .530 .724 .265 1.983
[Q4=3] -.573 .499 1.321 1 .250 .564 .212 1.498
[Q4=4] -.612 .505 1.470 1 .225 .542 .201 1.459
[Q4=5] 0b . . 0 . . . .
FAC1_2 -.363 .155 5.515 1 .019 .696 .514 .942
a. The reference category was: 1 Sometimes in each course.
b. This parameter was set to zero because it was redundant.
Age (Q4) did not have a significant impact on Q17_8, but I had it in the model, so the
coefficients of other predictors reflected controlling for age. Factor 1 did not have a significant
relationship with the likelihood of being in Q17_8 Group 0 (p > .05). Factor 1 had a significant
relationship with the likelihood of being in Q17_8 Group 2. If the value for Factor 1 wemt up 1
unit, then the odds of being in Group 2 decreased by a factor of 0.70 (or 30%). So as Factor
1went up (meaning the ratings for the efficacy questions move towards the end of the scale
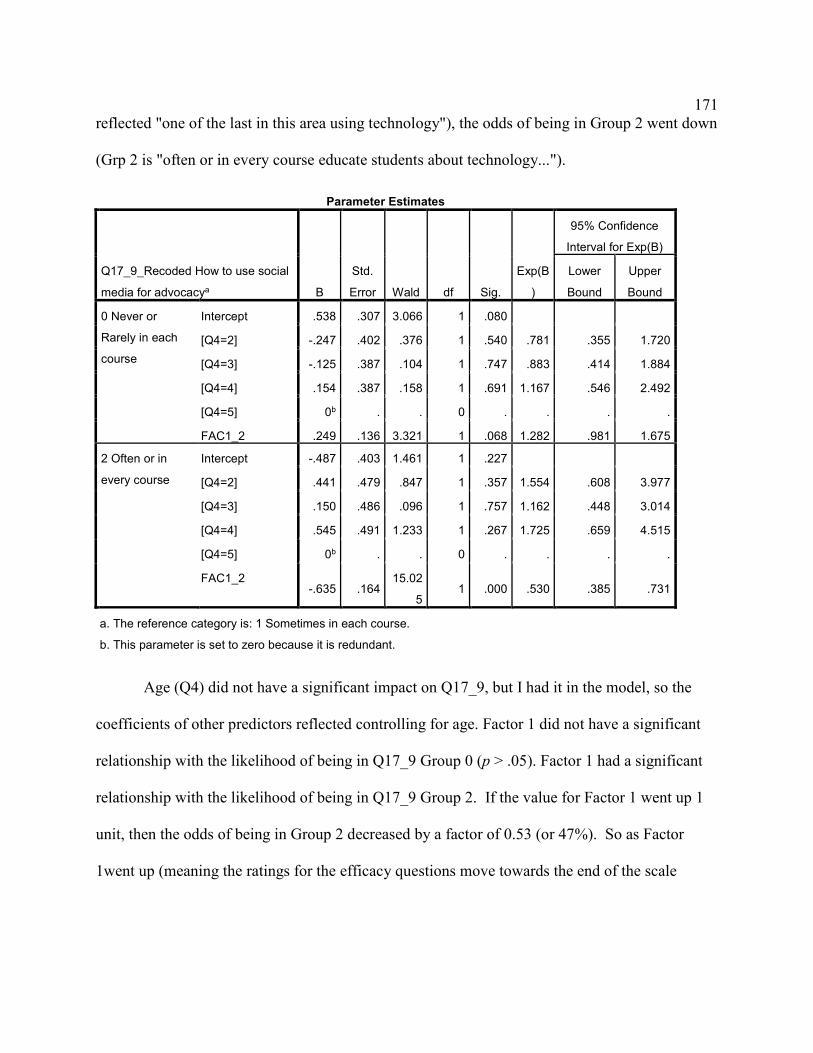
171
reflected "one of the last in this area using technology"), the odds of being in Group 2 went down
(Grp 2 is "often or in every course educate students about technology...").
Parameter Estimates
Q17_9_Recoded How to use social
media for advocacya B
Std.
Error Wald df Sig.
Exp(B
)
95% Confidence
Interval for Exp(B)
Lower
Bound
Upper
Bound
0 Never or
Rarely in each
course
Intercept .538 .307 3.066 1 .080
[Q4=2] -.247 .402 .376 1 .540 .781 .355 1.720
[Q4=3] -.125 .387 .104 1 .747 .883 .414 1.884
[Q4=4] .154 .387 .158 1 .691 1.167 .546 2.492
[Q4=5] 0b . . 0 . . . .
FAC1_2 .249 .136 3.321 1 .068 1.282 .981 1.675
2 Often or in
every course
Intercept -.487 .403 1.461 1 .227
[Q4=2] .441 .479 .847 1 .357 1.554 .608 3.977
[Q4=3] .150 .486 .096 1 .757 1.162 .448 3.014
[Q4=4] .545 .491 1.233 1 .267 1.725 .659 4.515
[Q4=5] 0b . . 0 . . . .
FAC1_2 -.635 .164
15.02
5 1 .000 .530 .385 .731
a. The reference category is: 1 Sometimes in each course.
b. This parameter is set to zero because it is redundant.
Age (Q4) did not have a significant impact on Q17_9, but I had it in the model, so the
coefficients of other predictors reflected controlling for age. Factor 1 did not have a significant
relationship with the likelihood of being in Q17_9 Group 0 (p > .05). Factor 1 had a significant
relationship with the likelihood of being in Q17_9 Group 2. If the value for Factor 1 went up 1
unit, then the odds of being in Group 2 decreased by a factor of 0.53 (or 47%). So as Factor
1went up (meaning the ratings for the efficacy questions move towards the end of the scale
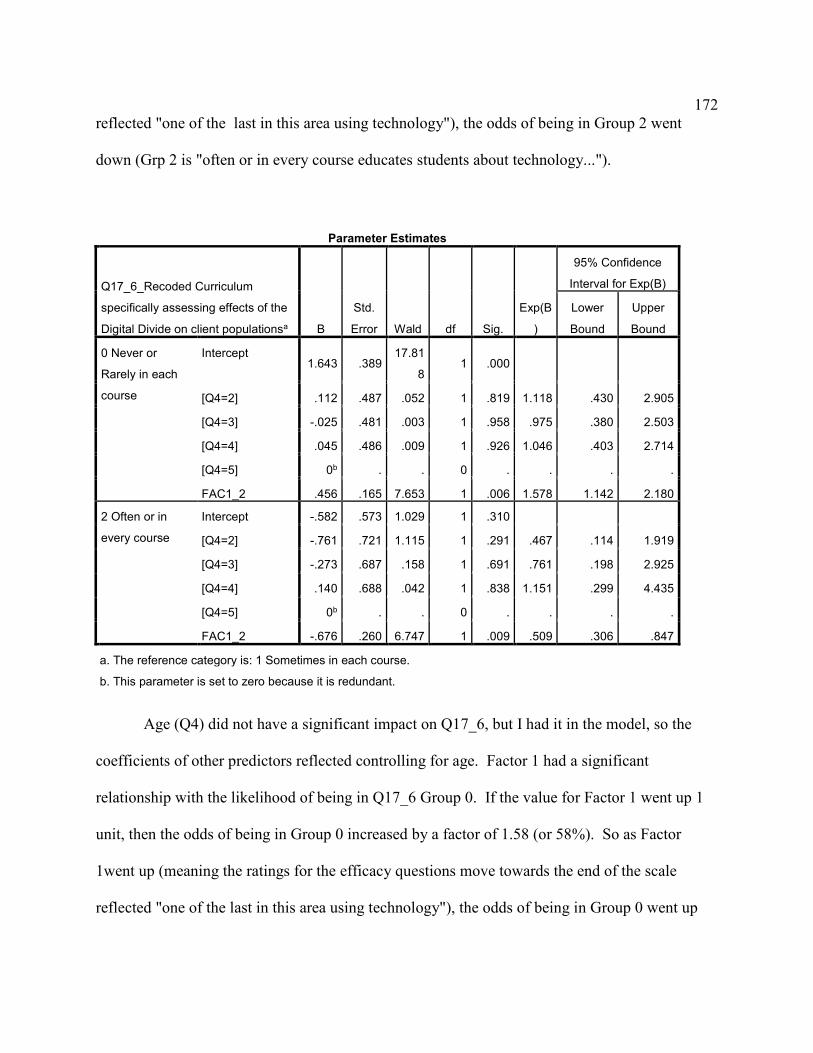
172
reflected "one of the last in this area using technology"), the odds of being in Group 2 went
down (Grp 2 is "often or in every course educates students about technology...").
Parameter Estimates
Q17_6_Recoded Curriculum
specifically assessing effects of the
Digital Divide on client populationsa B
Std.
Error Wald df Sig.
Exp(B
)
95% Confidence
Interval for Exp(B)
Lower
Bound
Upper
Bound
0 Never or
Rarely in each
course
Intercept 1.643 .389
17.81
8 1 .000
[Q4=2] .112 .487 .052 1 .819 1.118 .430 2.905
[Q4=3] -.025 .481 .003 1 .958 .975 .380 2.503
[Q4=4] .045 .486 .009 1 .926 1.046 .403 2.714
[Q4=5] 0b . . 0 . . . .
FAC1_2 .456 .165 7.653 1 .006 1.578 1.142 2.180
2 Often or in
every course
Intercept -.582 .573 1.029 1 .310
[Q4=2] -.761 .721 1.115 1 .291 .467 .114 1.919
[Q4=3] -.273 .687 .158 1 .691 .761 .198 2.925
[Q4=4] .140 .688 .042 1 .838 1.151 .299 4.435
[Q4=5] 0b . . 0 . . . .
FAC1_2 -.676 .260 6.747 1 .009 .509 .306 .847
a. The reference category is: 1 Sometimes in each course.
b. This parameter is set to zero because it is redundant.
Age (Q4) did not have a significant impact on Q17_6, but I had it in the model, so the
coefficients of other predictors reflected controlling for age. Factor 1 had a significant
relationship with the likelihood of being in Q17_6 Group 0. If the value for Factor 1 went up 1
unit, then the odds of being in Group 0 increased by a factor of 1.58 (or 58%). So as Factor
1went up (meaning the ratings for the efficacy questions move towards the end of the scale
reflected "one of the last in this area using technology"), the odds of being in Group 0 went up

173
(Grp 0 is "rarely or never educate students about technology..."). Factor 1 had a significant
relationship with the likelihood of being in Q17_6 Group 2. If the value for Factor 1 went up 1
unit, then the odds of being in Group 2 decreased by a factor of 0.51 (or 49%). So as Factor 1
went up (meaning the ratings for the efficacy questions move towards the end of the scale
reflected "one of the last in this area using technology"), the odds of being in Group 2 went
down (Group 2 is "often or in every course educates students about technology...").

174
Parameter Estimates
Q17_14_Recoded Solutions to
address the digital divide with
client populationsa B
Std.
Error Wald df Sig.
Exp(
B)
95% Confidence
Interval for Exp(B)
Lower
Bound
Upper
Bound
0 Never or
Rarely in each
course
Intercept 2.275 .473
23.10
1 1 .000
[Q4=2] -.566 .550 1.059 1 .303 .568 .193 1.668
[Q4=3] -.631 .550 1.318 1 .251 .532 .181 1.562
[Q4=4] -.923 .540 2.924 1 .087 .397 .138 1.144
[Q4=5] 0b . . 0 . . . .
FAC1_2 .459 .165 7.701 1 .006 1.583 1.144 2.188
2 Often or in
every course
Intercept -
1.209 .812 2.215 1 .137
[Q4=2] -.881 .912 .934 1 .334 .414 .069 2.473
[Q4=3] -.169 .872 .038 1 .846 .844 .153 4.665
[Q4=4] -.066 .874 .006 1 .940 .936 .169 5.187
[Q4=5] 0b . . 0 . . . .
FAC1_2 -
1.014 .321 9.966 1 .002 .363 .193 .681
a. The reference category is: 1 Sometimes in each course.
b. This parameter is set to zero because it is redundant.
Age (Q4) did not have a significant impact on Q17_14, but I had it in the model, so the
coefficients of other predictors reflected controlling for age. Factor 1 had a significant
relationship with the likelihood of being in Q17_14 Group 0. If the value for Factor 1 went up 1
unit, then the odds of being in Group 0 increased by a factor of 1.58 (or 58%). So as Factor 1
went up (meaning the ratings for the efficacy questions move towards the end of the scale
reflected "one of the last in this area using technology"), the odds of being in Group 0 went up

175
(Group 0 is "rarely or never educate students about technology..."). Factor 1 had a significant
relationship with the likelihood of being in Q17_14 Group 2. If the value for Factor 1 went up 1
unit, then the odds of being in Group 2 decreased by a factor of 0.36 (or 64%). So as Factor 1
went up (meaning the ratings for the efficacy questions move towards the end of the scale
reflected "one of the last in this area using technology"), the odds of being in Group 2 went
down (Group 2 is "often or in every course educate students about technology”
Related Documents