Digital transformation in the food industry – Opportunities, challenges and solution approaches from the perspective of ongoing research projects Dr.-Ing. Tobias Voigt. Technische Universität München Lehrstuhl für Lebensmittelverpackungstechnik

Welcome message from author
This document is posted to help you gain knowledge. Please leave a comment to let me know what you think about it! Share it to your friends and learn new things together.
Transcript

Digital transformation in the food industry –
Opportunities, challenges and solution approaches
from the perspective of ongoing research projects
Dr.-Ing. Tobias Voigt.
Technische Universität München
Lehrstuhl für Lebensmittelverpackungstechnik

Digital Transformation
• Digital Products
• Digital business models
Digitalization
• business processes
• manufacturing management
• automation
Digitization
• exchange of data
• interconnectedness
• Analog-to-digital conversion
Digital Industry – Levels and Terms
[medium.com/api-product-management, 2019]
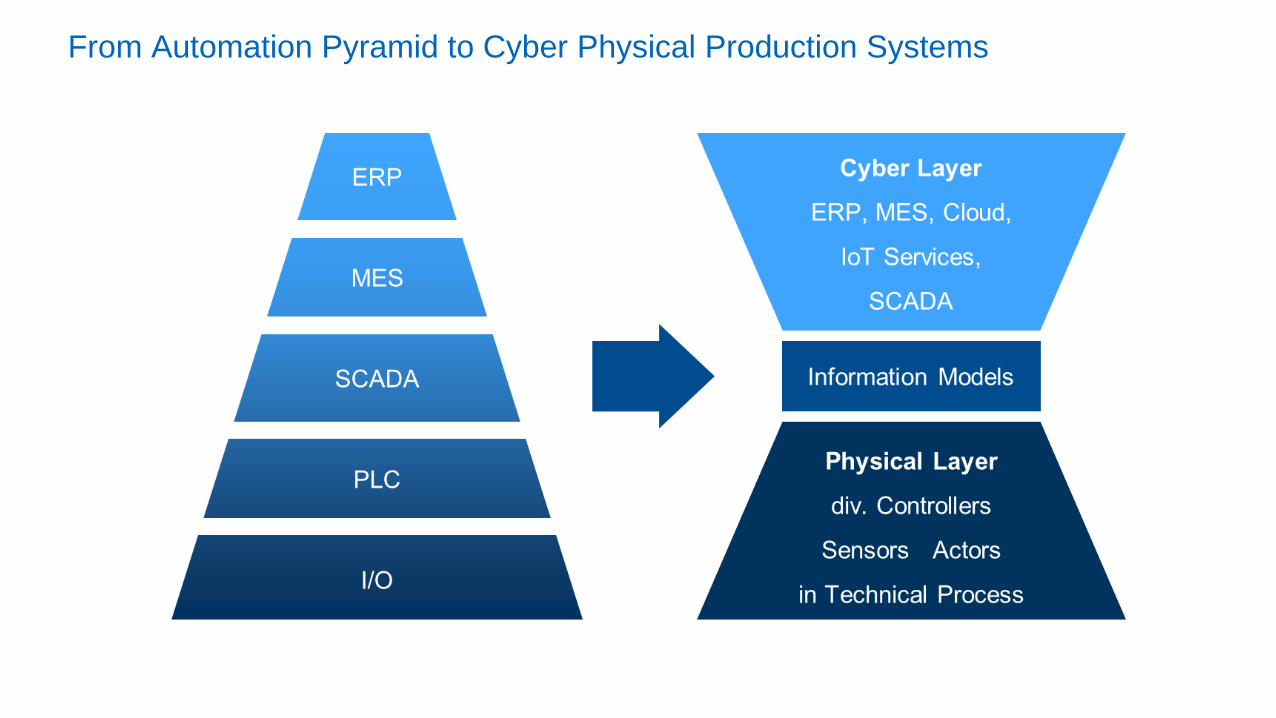
From Automation Pyramid to Cyber Physical Production Systems

Objectives of the food industry
[Food economy 4.0 –
VTT’s vision of an era of smart consumer-centric food production, 2018]
each digital representation challenge requires adequate modelling approaches
• cost reduction
increase in productivity
saving of resources
Improved production processes
• Stronger networking of the supply chain
Transparency and security
traceability
• Better product quality
Avoidance of food losses
Process stability with fluctuating raw materials
• Greater flexibility
Increasing the reaction speed
More customized products

5
Information Models for the Food Industry - Weihenstephan Standards (WS)
Standard interface
Ethernet Socket
Proprietary commands
Test Tool
Data contents
Tagnames/numbers
Data types
XML Device description
Data Evaluation
Efficiency Analysis
Batch Tracing
Quality Assurance
Beverage/food production, bottling and packaging
MES
machine controller

6
Example of a Standard WS Data Point
Additional data points may be defined with a different prefix according to specified
rules, e. g. data point from company XYZ AG (Bottle capper)
Name: closure force
Tag-Number: 31101 (from free area for parameters)
Tag-Name: XYZ_Closure_Force
Data Type: Unsigned32
Read/ Write: RW
Description: Data Point provides the closure force for a closing stamp in N.
Name: Total Bottles
Tag-Number: 50005
Tag-Name: WS_Tot_Bottles
Data Type: Unsigned32
Read/ Write: R
Description: This data point provides the number
of bottles processed in the machine

Alternative to current WS communication protocol (based on TCP/IP)
Pros:
• Bidirectional communication, fast data exchange
• Available on all relevant PLCs
• No license costs
• System independent
• Availability of all data
• Direct access to the PLC
WS goes OPC UA

WS
CS
WSDeviceType
FunctionalGroupType
Data_for_batch_and_article_tracing
Counters
Data_for_machine state
Data_for_operating_mode
Data_for_the_program
Failure_notices
Measured_values
Parameters
Pointers
WS_Version
IsSubTypeOf
WSBaseDataType
WS_Version_Vendor WS_Version_Project
WSDeviceType
WS Template<GroupIdentifier>ComputedValues WS Brew-Template

Data profile libraries for different machine types
?

MES Modelling
MES Project
1.
Basic
Evaluation
2.
Pre-Planning
Stage
3.
Basic
Planning
4.
Detailed
Design
5.
Implementation
Stage
6.
Operation
Stage
7.
Project
Completion
State of the art:
• Customization
• Specialization
• Parametrization
Consequence:
• Personnel
expenditure
• 90 % Software
• 10 % Hardware
Motivation:
• Concepts &
Methods
• Saving Potential
• Reduction of Cost
Model-driven Engineering of
Manufacturing Execution Systems

Model-driven approach for MES Generation
Modeling Specifying Generating

Beverage filling line – plant model

Beverage filling line – process model

Beverage filling line – MES function model

Beverage filling line – report model

Beverage filling line – prototype of generator

Model-based fault localization in bottling plants
Conveyors connecting machines of a
bottling plant for returnable bottles
[Photo: Deutscher Brauer-Bund e.V.].
Generic structure of a bottling plant for returnable bottles

Physical Component Models
1.1
1
0.9
0.8
0.7
0.6
0.5
0.4
0.3
0.2
900
800
700
600
500
400
300
200
100
0 1000 2000 3000 4000 Zeit in s
1000 2000 3000 4000 Zeit in s
v [m/s]
B [objects]
Time in
s
Schematic model of the Material Transporter
Buffer response (lower graph) to variation of vin and vout
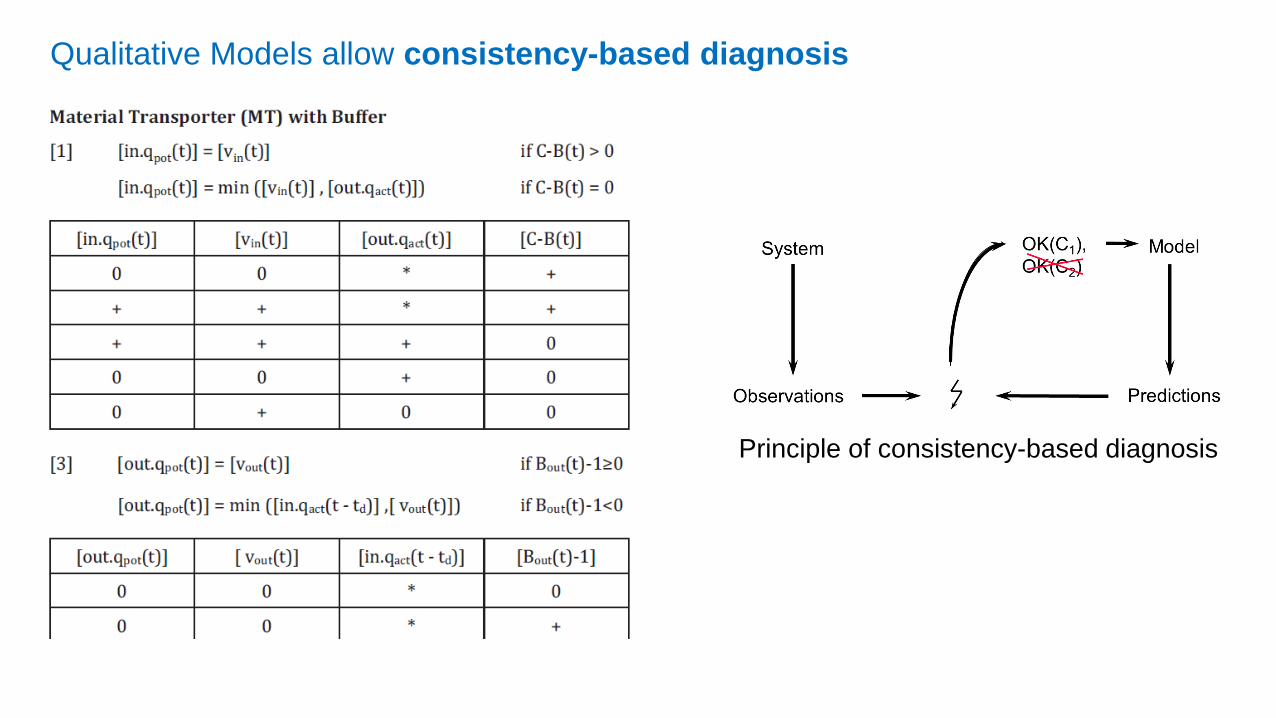
Qualitative Models allow consistency-based diagnosis
Principle of consistency-based diagnosis

Evaluation of results for the diagnosis solution
Implementation (screenshot) into an industrial diagnosis tool

Energy simulation in food production systems
• Rising energy cost
(especially electric)
• Energy consumption
of packaging machinery
strongly related to
production state
• Prognosis necessary
for optimisation
• State related forecast
solutions are missing
Goal:
operational state related modelling and simulation
to forecast the electric energy consumption
Index of the development of industrial electricity prices *
in Germany in from 1998 to 2014 (1998 = Index 100)[BDEW; Federation of energy consumers, 2015]
10095
65 6974
9096
104
123 122
142
122129
150 150162 165
0
20
40
60
80
100
120
140
160
180
Ind
ex (
199
8=
10
0)

Data Acquisition and Modelling Approach
Power consumption and production states
of the bottle cleaning machine
Measurements at an industrial bottling
and packaging plant consisting of 10
machines
• Production state (operating, failure,
held, emergency stop, lack, tailback,
idle, prepared)
• Electrical power
Basic modelling idea:
Energy consumption of a machine is
correlated with its energetic states at
three constant levels:
• Producing
• Suspended
• Inactive
Pe
l[k
W]

Stepwise change of the consumption level of the bottle cleaning machine(maximum variation, average value and confidence interval (a=0.05) of 20 measurements)
Modelling state changes along intermediate consumption levels IL

Model implementation
SQL Data
Base
SQL Data
Base
energy
forecast
energetic
parametersstate data
machine
control
measured
energy
data
MES
(historical
state data)
Material
flow
simulationMATLAB energy model

Model Validation for single machines
example of a validation plot for the bottle cleaning machine
energy parameters for the bottle cleaning machine
P [kW] t [s] P [kW] t [s] P [kW] t [s]
IL1 7,2 0 49,78 4,9 38,9 4,5
IL2 7,2 0 44,5 34,8 48,5 10,2
IL3 7,2 0 42,1 53,2 49,3 21,4
Steady state 7,2 -- 37,8 -- 50 --
Incative Suspended Production
Pel[k
W]
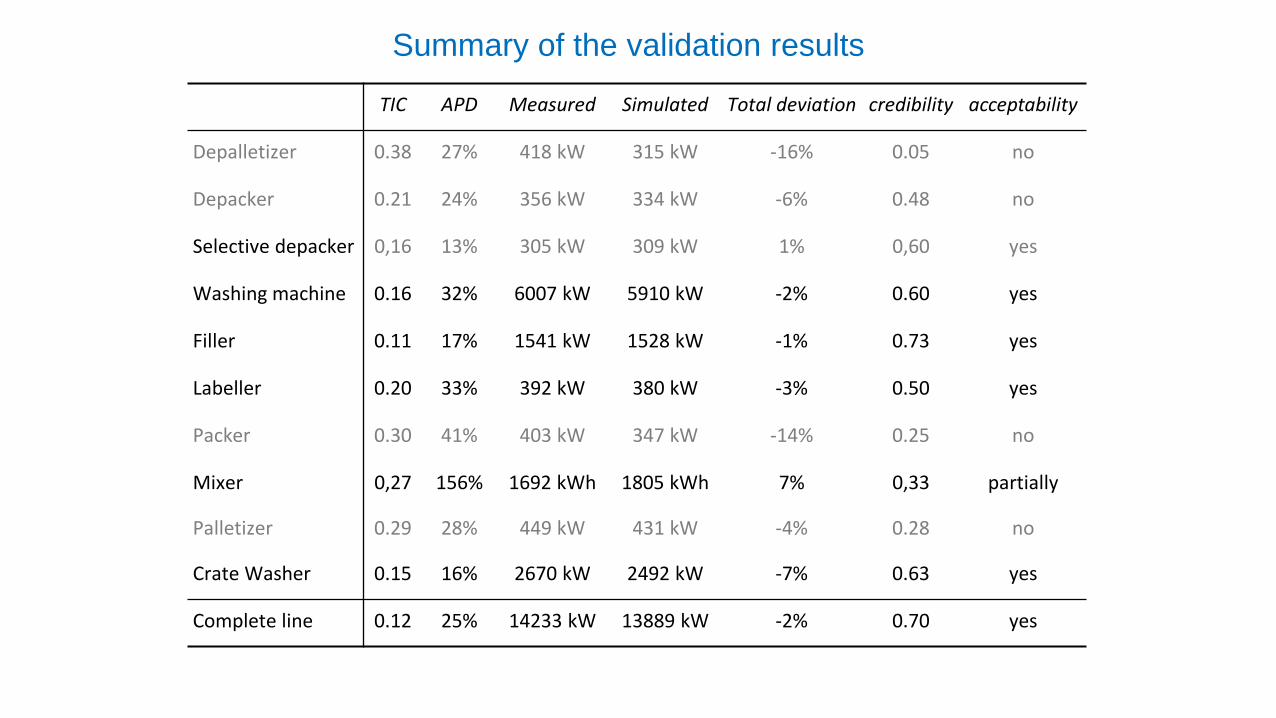
TIC APD Measured Simulated Total deviation credibility acceptability
Depalletizer 0.38 27% 418 kW 315 kW -16% 0.05 no
Depacker 0.21 24% 356 kW 334 kW -6% 0.48 no
Selective depacker 0,16 13% 305 kW 309 kW 1% 0,60 yes
Washing machine 0.16 32% 6007 kW 5910 kW -2% 0.60 yes
Filler 0.11 17% 1541 kW 1528 kW -1% 0.73 yes
Labeller 0.20 33% 392 kW 380 kW -3% 0.50 yes
Packer 0.30 41% 403 kW 347 kW -14% 0.25 no
Mixer 0,27 156% 1692 kWh 1805 kWh 7% 0,33 partially
Palletizer 0.29 28% 449 kW 431 kW -4% 0.28 no
Crate Washer 0.15 16% 2670 kW 2492 kW -7% 0.63 yes
Complete line 0.12 25% 14233 kW 13889 kW -2% 0.70 yes
Summary of the validation results

Validation plot of the complete bottling and packaging line (14
days)
time [s]
tota
l en
erg
y co
nsu
mp
tio
n [
kW]
50
100
75
tota
l en
erg
yco
nsu
mp
tio
n[k
W]
6.46 6.58x10⁵
6.52time [s]
Validation time: 336 h (14 days)

RoboFill - Agent-based bottling in lot size 1

IT-Architecture of the cyber-physical production system
Anlage
Aufträge
Kommunikation
V F1 F2 R1 R2 D
A
AufgabeAbgabe

Agent System Architecture

Individualization in the RoboFill Webshop

32Benedikt Marschall, M.Sc. | 25. Flaschenkellerseminar | Freising, 04.12.2018
Design der Demonstrationsanlage

Digital transformation in the food industry
Chances
• cost reduction
increase in productivity
saving of resources
Improved production processes
• Stronger networking of the supply chain
Transparency and security
traceability
• Better product quality
Avoidance of food losses
Process stability with fluctuating raw materials
• Greater flexibility
Increasing the reaction speed
More customized products
Challenges
• Consistent internal and external digital
networking
(Standardized) communication interfaces
Big data sharing
• Reusable product and process models
(Digital Twins) for
Product development and plant planning
Virtual commissioning
production control
• Reference applications in the food industry
Decentralized production control (agents)
Machine Learning (Analytics)
Digital business models
Related Documents