The Journal of Computing Sciences in Colleges Papers of the 33rd Annual CCSC Southeastern Conference October 25th-26th, 2019 Auburn University Auburn, AL Baochuan Lu, Editor John Hunt, Regional Editor Southwest Baptist University Covenant College Volume 35, Number 4 October 2019

Welcome message from author
This document is posted to help you gain knowledge. Please leave a comment to let me know what you think about it! Share it to your friends and learn new things together.
Transcript
The Journal of ComputingSciences in Colleges
Papers of the 33rd Annual CCSCSoutheastern Conference
October 25th-26th, 2019Auburn University
Auburn, AL
Baochuan Lu, Editor John Hunt, Regional EditorSouthwest Baptist University Covenant College
Volume 35, Number 4 October 2019

The Journal of Computing Sciences in Colleges (ISSN 1937-4771 print, 1937-4763 digital) is published at least six times per year and constitutes the refereedpapers of regional conferences sponsored by the Consortium for Computing Sci-ences in Colleges. Printed in the USA. POSTMASTER: Send address changesto Susan Dean, CCSC Membership Secretary, 89 Stockton Ave, Walton, NY13856.
Copyright ©2019 by the Consortium for Computing Sciences in Colleges. Per-mission to copy without fee all or part of this material is granted provided thatthe copies are not made or distributed for direct commercial advantage, theCCSC copyright notice and the title of the publication and its date appear, andnotice is given that copying is by permission of the Consortium for ComputingSciences in Colleges. To copy otherwise, or to republish, requires a fee and/orspecific permission.
2
Table of Contents
The Consortium for Computing Sciences in Colleges Board ofDirectors 5
CCSC National Partners & Foreword 7
Welcome to the 2019 CCSC Southeastern Conference 9
Regional Committees — 2019 CCSC Southeastern Region 10
Reviewers — 2019 CCSC Southeastern Conference 11
Introduction to Jetstream:A Research and Education Cloud — Conference Tutorial 12
Sanjana Sudarshan, Jeremy Fischer, Indiana University
Using Eclipse and IntelliJ with Dynamic Viewers for ProgramUnderstanding and Debugging in Java — Conference Tutorial 15
James H. Cross II, T. Dean Hendrix, Auburn University
Building and Expanding a Successful Undergraduate ResearchProgram — Panel Discussion 18
Sarah Heckman, NC State University, Brandon Fain, Duke University,Manuel Pérez-Quiñones, University of North Carolina at Charlotte
A Comparison of Two Popular Machine Learning Frameworks 20Chance Simmons, Mark A. Holliday, Western Carolina University
Alexa Skill Voice Interface for the Moodle Learning ManagementSystem 26
Michelle Melton, James Fenwick Jr., Appalachian State University
Auto-Checking Digital Logic Design Labs Through PhysicalComputing 36
Gongbing Hong, Gita Phelps, Yi Liu, Kenneth Trussell, Georgia Collegeand State University
Similarity Matching in News Articles 46Nathaniel Ballard, Deepti Joshi, The Citadel
Categorizing User Stories in the Software Engineering Classroom 52Brian T. Bennett, Tristan Onek, East Tennessee State University
3
Rethinking the Role of Simulation in Computer NetworksEducation 60
Qian Liu, Rhode Island College
Detecting Areas of Social Unrest Through Natural LanguageProcessing on Social Media 68
Timothy Clark, Deepti Joshi, The Citadel
Take Note: An Investigation of Technology on the Line NoteTaking Process in the Theatre 74
René Borr, Valerie Summet, Rollins College
Exploring Collaborative Talk Among African-American Middle-School Girls in the Context of Game Design for Social Change 80
Jakita O. Thomas, Auburn University, Yolanda Rankin, Florida StateUniversity, Quimeka Saunders, Spelman College
Assessing Ethics in a Computer Science Curriculum: InstrumentDescription and Preliminary Results 90
Kevin R. Sanft, University of North Carolina Asheville
Reflective Writing Through Primary Sources 97Valerie Summet, Rollins College
Mapping and Securing User Requirements on an IoT Network 103J. Delpizzo, R. Honeycutt, E. Spoehel, S. Banik, The Citadel
Ranking Privacy of the Users in the Cyberspace 109Adrian Beaput, Shankar Banik, Deepti Joshi, The Citadel
One Department, Four Undergraduate Computing Programs 115Tony Pittarese, Brian Bennett, Mathew Desjardins, East TennesseeState University
Examining Strategies to Improve Student Success in CS1 124Janet T. Jenkins, Mark G. Terwilliger, University of North Alabama
+, - or Neutral: Sentiment Analysis of Tweets on Twitter— Nifty Assignment 133
Robert Lutz, Evelyn Brannock, Georgia Gwinnett College
4

The Consortium for Computing Sciences in CollegesBoard of Directors
Following is a listing of the contactinformation for the members of theBoard of Directors and the Officers ofthe Consortium for ComputingSciences in Colleges (along with theyears of expiration of their terms), aswell as members serving CCSC:Jeff Lehman, President (2020),(260)359-4209,[email protected],Mathematics and Computer ScienceDepartment, Huntington University,2303 College Avenue, Huntington, IN46750.Karina Assiter, Vice President(2020), (802)387-7112,[email protected] Lu, Publications Chair(2021), (417)328-1676,[email protected], Southwest BaptistUniversity - Department of Computerand Information Sciences, 1600University Ave., Bolivar, MO 65613.Brian Hare, Treasurer (2020),(816)235-2362, [email protected],University of Missouri-Kansas City,School of Computing & Engineering,450E Flarsheim Hall, 5110 RockhillRd., Kansas City MO 64110.Judy Mullins, Central PlainsRepresentative (2020), AssociateTreasurer, (816)390-4386,[email protected], School ofComputing and Engineering, 5110Rockhill Road, 546 Flarsheim Hall,University of Missouri - Kansas City,Kansas City, MO 64110.
John Wright, EasternRepresentative (2020), (814)641-3592,[email protected], Juniata College,1700 Moore Street, BrumbaughAcademic Center, Huntingdon, PA16652.David R. Naugler, MidsouthRepresentative(2022), (317) 456-2125,[email protected], 5293 Green HillsDrive, Brownsburg IN 46112.Lawrence D’Antonio,Northeastern Representative (2022),(201)684-7714, [email protected],Computer Science Department,Ramapo College of New Jersey,Mahwah, NJ 07430.Cathy Bareiss, MidwestRepresentative (2020),[email protected], Olivet NazareneUniversity, Bourbonnais, IL 60914.Brent Wilson, NorthwesternRepresentative (2021), (503)554-2722,[email protected], George FoxUniversity, 414 N. Meridian St,Newberg, OR 97132.Mohamed Lotfy, Rocky MountainRepresentative (2022), InformationTechnology Department, College ofComputer & Information Sciences,Regis University, Denver, CO 80221.Tina Johnson, South CentralRepresentative (2021), (940)397-6201,[email protected], Dept. ofComputer Science, Midwestern StateUniversity, 3410 Taft Boulevard,Wichita Falls, TX 76308-2099.
5

Kevin Treu, SoutheasternRepresentative (2021), (864)294-3220,[email protected], FurmanUniversity, Dept of ComputerScience, Greenville, SC 29613.Bryan Dixon, SouthwesternRepresentative (2020), (530)898-4864,[email protected], ComputerScience Department, California StateUniversity, Chico, Chico, CA95929-0410.
Serving the CCSC: Thesemembers are serving in positions asindicated:Brian Snider, MembershipSecretary, (503)554-2778,[email protected], George FoxUniversity, 414 N. Meridian St,Newberg, OR 97132.Will Mitchell, Associate Treasurer,(317)392-3038, [email protected],1455 S. Greenview Ct, Shelbyville, IN46176-9248.John Meinke, Associate Editor,
[email protected], UMUC EuropeRet, German Post: Werderstr 8,D-68723 Oftersheim, Germany, ph011-49-6202-5777916.Shereen Khoja, Comptroller,(503)352-2008, [email protected],MSC 2615, Pacific University, ForestGrove, OR 97116.Elizabeth Adams, NationalPartners Chair, [email protected],James Madison University, 11520Lockhart Place, Silver Spring, MD20902.Megan Thomas, MembershipSystem Administrator,(209)667-3584,[email protected], Dept. ofComputer Science, CSU Stanislaus,One University Circle, Turlock, CA95382.Deborah Hwang, Webmaster,(812)488-2193, [email protected],Electrical Engr. & Computer Science,University of Evansville, 1800 LincolnAve., Evansville, IN 47722.
6

CCSC National Partners
The Consortium is very happy to have the following as National Partners.If you have the opportunity please thank them for their support of computingin teaching institutions. As National Partners they are invited to participatein our regional conferences. Visit with their representatives there.
Platinum PartnerTuringscraft
Google for EducationGitHub
NSF – National Science Foundation
Silver PartnerszyBooks
Bronze PartnersNational Center for Women and Information Technology
TeradataMercury Learning and Information
Mercy College
7

Foreword
The following five CCSC conferences will take place this fall.
Midwestern Conference October 4-5, 2019Benedictine University in Lisle, IL
Northwestern Conference October 4–5, 2019Pacific University, Forest Grove, OR
Rocky Mountain Conference October 11-12, 2019University of Sioux Falls in Sioux Falls, SD
Eastern Conference October 25-26, 2019Robert Morris University in Moon Township, PA
Southeastern Conference October 25-26, 2019Auburn University in Auburn, AL
The papers and talks cover a wide variety of topics that are current, excit-ing, and relevant to us as computer science educators. We publish papers andabstracts from the conferences in our JCSC journal. You will get the links tothe digital journals in your CCSC membership email. You can also find thejournal issues in the ACM digital library and in print on Amazon.
Since this spring we have switched to Latex for final manuscript submission.The transition has been smooth. Authors and regional editors have workedhard to adapt to the change, which made my life a lot easier.
The CCSC board of directors have decided to deposit DOIs for all peer-reviewed papers we publish. With the DOIs others will be able to cite yourwork in the most accurate and reliable way.
Baochuan LuSouthwest Baptist University
CCSC Publications Chair
8

Welcome to the 2019 CCSC Southeastern Conference
Welcome to the 33rd Southeastern Regional Conference of the Consortiumfor Computing Sciences in Colleges. The CCSC:SE Regional Board welcomesyou to Auburn, AL, the home of Auburn University. The conference is designedto promote a productive exchange of information among college personnel con-cerned with computer science education in the academic environment. It isintended for faculty as well as administrators of academic computing facilities,and it is also intended to be welcoming to student participants in a varietyof special activities. We hope that you will find something to challenge andengage you at the conference!
The conference program is highlighted with a variety of sessions, such asengaging guest speakers, workshops, panels, student posters, faculty posters, anifty assignment session and several sessions for high quality refereed papers.We received 25 papers this year of which 15 were accepted to be presented atthe conference and included in the proceedings – an acceptance rate of 60%.
Two exciting activities are designed specifically for students – a researchcontest and an undergraduate programming competition, with prizes for thetop finishers in each.
We especially would like to thank the faculty, staff, and students of AuburnUniversity for their help in organizing this conference. Many thanks also to theCCSC Board, the CCSC:SE Regional Board, and to a wonderful ConferenceCommittee, led by Conference Chair Dr. Richard Chapman. Thank you all somuch for your time and energy.
We also need to send our deepest appreciation to our partners, sponsors,and vendors. Please take the time to go up to them and thank them for theircontributions and support for computing sciences education – CCSC:SE Na-tional Partners: Turing’s Craft, Google for Education, GitHub, National Sci-ence Foundation, Codio, zyBooks, National Center for Women and InformationTechnology, Teradata University Network, Mercury Learning and Information,Mercy College. Sponsoring Organizations: CCSC, ACM-SIGCSE, Upsilon PiEpsilon.
We could not have done this without many excellent submissions from au-thors, many insightful comments from reviewers, and the support from oureditors Baochuan Lu and Susan Dean. Thanks to all of you for helping tocreate such a great program.
We hope you enjoy the conference and your visit to Auburn University.
Kevin Treu, CCSC:SE Regional Board Chair, Furman UniversityJohn Hunt, Program Chair, Covenant College
9

2019 CCSC Southeastern Conference Steering Committee
Kevin Treu, Conference Chair . . . . . . . . . . . . . . . . . . . . . . . . . . . .Furman UniversityRichard Chapman, Site chair . . . . . . . . . . . . . . . . . . . . . . . . . . . . .Auburn UniversityJohn Hunt, Program Chair . . . . . . . . . . . . . . . . . . . . . . . . . . . . . . . . Covenant CollegeJean French, Local Registrar . . . . . . . . . . . . . . . . . . . . Coastal Carolina UniversityChris Healy, Student Research Contest Director . . . . . . . . . . Furman UniversityNadeem Hamid, Nifty Assignments Co-Chair . . . . . . . . . . . . . . . . . .Berry CollegeSteven Benzel, Nifty Assignments Co-Chair . . . . . . Georgia Highlands CollegeAndy Digh, Programming Competion Co-Director . . . . . . . . Mercer UniversityChris Healy, Programming Competion Co-Director . . . . . . . Furman University
Regional Board — 2019 CCSC Southeastern Region
Kevin Treu, Board Chair . . . . . . . . . . . . . . . . . . . . . . . . . . . . . . . . Furman UniversityKevin Treu, Board Representative . . . . . . . . . . . . . . . . . . . . . . . Furman UniversityJean French, Registrar . . . . . . . . . . . . . . . . . . . . . . . . . . Coastal Carolina UniversityJohn Hunt, Treasuer . . . . . . . . . . . . . . . . . . . . . . . . . . . . . . . . . . . . . . Covenant CollegeLaurie Patterson, Secretary . . . . . . . .University of North Carolina WilmingtonSusan Dean, publicity chair . . . . . . . . . . . . . . . . . . . . . . . . . . . . . . . . . . . . . . . . . . retiredJohn Hunt, Regional Editor . . . . . . . . . . . . . . . . . . . . . . . . . . . . . . . Covenant College
10

Reviewers — 2019 CCSC Southeastern Conference
Ali, Farha . . . . . . . . . . . . . . . . . . . . . . . . . . . . . . . .Lander University, Greenwood, SCAllen, Robert . . . . . . . . . . . . . . . . . . . . . . . . . . . . . . . . Mercer University, Macon, GAAlvin, Chris . . . . . . . . . . . . . . . . . . . . . . . . . . . . . Furman University, Greenville , SCAngel, N. Faye . . . . . . . . . . . . . . . . . . . . . . . . . . . . . . . . . Ferrum College, Ferrum, VABesmer, Andrew . . . . . . . . . . . . . . . . . . . . . . . . Winthrop University, Rock Hill, SCBogert, Kenneth . . . . . . University of North Carolina Asheville, Asheville, NCBonyadi, Cyrus . . .University of Maryland, Baltimore College, Longwood, FLBowe, Lonnie . . . . . . . . . . . . . . . . . . . . . . . . . . . Concord University, Princeton, WVCarl, Stephen . . . . . . Sewanee: The University of the South, Chattanooga, TNDannelly, Stephen . . . . . . . . . . . . . . . . . . . . . . .Winthrop University, Rock Hill, SCDekhane, Sonal . . . . . . . . . . . . . . . Georgia Gwinnett College, Lawrenceville, GADigh, Andy . . . . . . . . . . . . . . . . . . . . . . . . . . . . . . . . . . Mercer University, Macon, GADrawert, Brian . . . . . . . .University of North Carolina Asheville, Asheville, NCDumas, Joe . . . . . . University of Tennessee at Chattanooga, Chattanooga, TNElliott, Robert A. . . . .Southern University at New Orleans, New Orleans, LAGarrido, Jose . . . . . . . . . . . . . . . . . . . . . Kennesaw State University, Marietta, GAGaspar, Alessio . . . . . . . . . . . . . . . . . . .University of South Florida, Lakeland, FLGlass, Michael . . . . . . . . . . . . . . . . . . . . . . . . . Valparaiso University, Valparaiso, INGoddard, Wayne . . . . . . . . . . . . . . . . . . . . . . . . . . Clemson University, Clemson, SCHeinz, Adrian . . . . . . . . . . . . . . . . .Georgia Gwinnett College, Lawrenceville, GAHolliday, Mark . . . . . . . . . . . . . . . . .Western Carolina University, Cullowhee„ NCHong, Gongbing . . . . Georgia College and State University, Milledgeville, GAHutchings, Dugald . . . . . . . . . . . . . . . . . . . . . . . . . . . . . . . .Elon University, Elon, NCLartigue, Jonathan . . . . . . . . . . . . . . . . . . . . .Collins Aerospace, Cedar Rapids, IALee, Gilliean . . . . . . . . . . . . . . . . . . . . . . . . . . . . . Lander University, Greenwood, SCLee, Ingyu . . . . . . . . . . . . . . . . . . . . . . . . . . . . . . . . . . . . . . . . Troy University, Troy, ALLewis, Adam . . . . . . . . . . . . . . . . . . . . . . . . . . .Athens State University, Athens, ALLi, Rao . . . . . . . . . . . . . . . . . . . . . . University of South Carolina Aiken, Aiken, SCLindoo, Ed . . . . . . . .Nova Southeastern University, Fort Lauderdale-Davie, FLLiu, Yi . . . . . . . . . . . . . . . . . . . Georgia College State Universi, Milledgeville, GALutz, Robert . . . . . . . . . . . . . . . . . .Georgia Gwinnett College. Lawrenceville, GALux, Thomas . . . . . . . . . . . . . . . . . . . . . . . . . . . . . . . . Roanoke College, Ashland, VAMcGuire, Timothy . . . . . . . . . . . . . Texas A&M University, College Station, TXMurray, Meg . . . . . . . . . . . . . . . . . . . . .Kennesaw State University, Kennesaw, GAPatterson, Brian . . . . . . . . . . . . . . . . . . . . . . . . Oglethorpe University, Atlanta, GAPittarese, Tony . . . . . . . . . . East Tennessee State University, Johnson City, TNPlank, James . . . . . . . . . . . . . . . . . . . . . . . . University of Tennessee, Knoxville, TNPounds, Andrew . . . . . . . . . . . . . . . . . . . . . . . . . . . . . Mercer University, Macon, GASpurlock, Scott . . . . . . . . . . . . . . . . . . . . . . . . . . . . . . . . . . . Elon University, Elon, NCWalker, Aaron . . . . . . . . . . . . . . . . . . . . . . . . . . . . . University of North Georgia, GA
11
Introduction to Jetstream:A Research and Education Cloud∗
Conference Tutorial
Sanjana Sudarshan and Jeremy FischerResearch TechnologiesIndiana University
Bloomington, IN 47401{ssudarsh, jeremy}@iu.edu
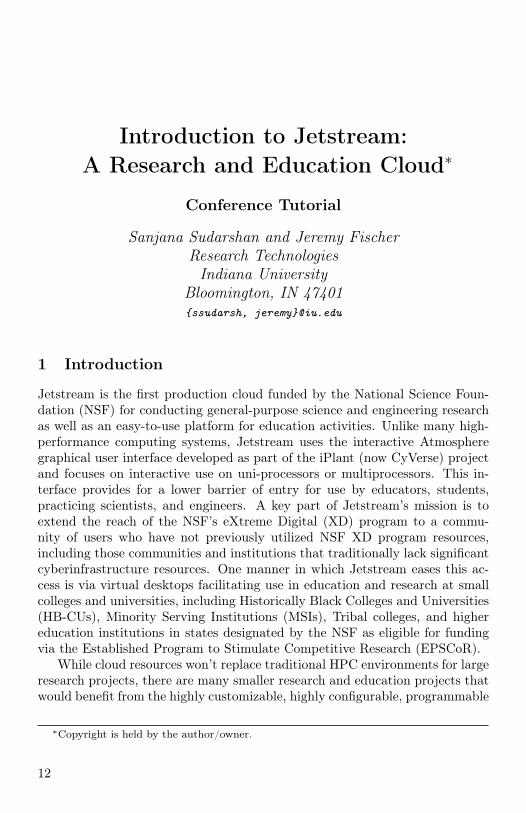
1 Introduction
Jetstream is the first production cloud funded by the National Science Foun-dation (NSF) for conducting general-purpose science and engineering researchas well as an easy-to-use platform for education activities. Unlike many high-performance computing systems, Jetstream uses the interactive Atmospheregraphical user interface developed as part of the iPlant (now CyVerse) projectand focuses on interactive use on uni-processors or multiprocessors. This in-terface provides for a lower barrier of entry for use by educators, students,practicing scientists, and engineers. A key part of Jetstream’s mission is toextend the reach of the NSF’s eXtreme Digital (XD) program to a commu-nity of users who have not previously utilized NSF XD program resources,including those communities and institutions that traditionally lack significantcyberinfrastructure resources. One manner in which Jetstream eases this ac-cess is via virtual desktops facilitating use in education and research at smallcolleges and universities, including Historically Black Colleges and Universities(HB-CUs), Minority Serving Institutions (MSIs), Tribal colleges, and highereducation institutions in states designated by the NSF as eligible for fundingvia the Established Program to Stimulate Competitive Research (EPSCoR).
While cloud resources won’t replace traditional HPC environments for largeresearch projects, there are many smaller research and education projects thatwould benefit from the highly customizable, highly configurable, programmable
∗Copyright is held by the author/owner.
12
cyberinfrastructure afforded by cloud computing environments such as Jet-stream. Jetstream is a Infrastructure-as-a-Service platform comprised of twogeographically isolated clusters, each supporting hundreds of virtual machinesand data volumes. The two cloud systems are integrated via a user-friendlyweb application that provides a user interface for common cloud computingoperations, authentication to XSEDE via Globus, and an expressive set of webservice APIs.
Jetstream enables on-demand access to interactive, user-configurable com-puting and analysis capability. It also seeks to democratize access to cloudcapabilities and promote shareable, reproducible research. This event will de-scribe Jetstream in greater detail, as well as how its unique combination ofhardware, software, and user engagement support the "long tail of science."This tutorial will describe Jetstream in greater detail, as well as how its uniquecombination of hardware, software, and user engagement support the "long tailof science." Attendees will get a greater understanding of how Jetstream mayenhance their education or research efforts via a hands-on approach to usingJetstream via the Atmosphere interface.
2 Tutorial Description
This tutorial requires two to three hours.
• Prerequisites: Basic Linux command line knowledge a plus (but not re-quired)
• Required: Laptop, modern web browser (Chrome, Firefox, Safari)
• Targeting: Educators, Researchers, Campus Champions/ACI-Ref Facili-tators, Campus research computing support staff
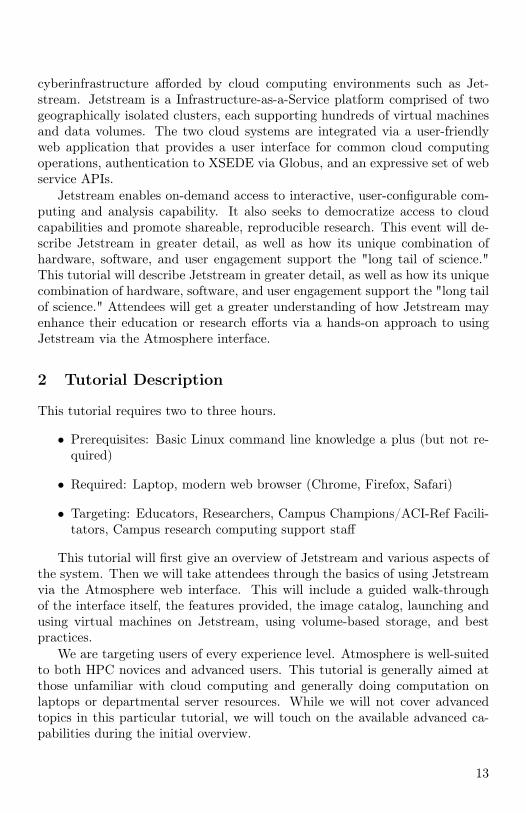
This tutorial will first give an overview of Jetstream and various aspects ofthe system. Then we will take attendees through the basics of using Jetstreamvia the Atmosphere web interface. This will include a guided walk-throughof the interface itself, the features provided, the image catalog, launching andusing virtual machines on Jetstream, using volume-based storage, and bestpractices.
We are targeting users of every experience level. Atmosphere is well-suitedto both HPC novices and advanced users. This tutorial is generally aimed atthose unfamiliar with cloud computing and generally doing computation onlaptops or departmental server resources. While we will not cover advancedtopics in this particular tutorial, we will touch on the available advanced ca-pabilities during the initial overview.
13

3 Tutorial Program
This is a sample tutorial program. Time required for this tutorial is approxi-mately 3 hours.
• What is Jetstream?
• Q & A and what brief hands-on overview
• Getting started with Jetstream, including VM launching
• Break
• Accessing your VM, creating and using volumes
• Customizing and saving images, DOIs
• Cleaning up
• Final Q & A
14

Using Eclipse and IntelliJ with DynamicViewers for Program Understanding and
Debugging in Java∗
Conference Tutorial
James H. Cross II and T. Dean HendrixComputer Science and Software Engineering
Auburn UniversityAuburn, AL 36849
{crossjh,hendrtd}@auburn.edu
New jGRASP plugins for Eclipse and IntelliJ bring the jGRASP viewersand viewer canvas to the Eclipse and IntelliJ Java debuggers. The plugins pro-vide automatic generation of visualizations that directly support the teachingof major concepts, including classes, interfaces, objects, inheritance, polymor-phism, composition, and data structures. The integrated visualizations areintended to overcome the mismatch between what we want to teach and whatmost IDEs provide in the way of support for learning. This tutorial will fo-cus on the canvas of dynamic viewers which allows students and instructors tocreate “custom” program visualizations by dragging viewers for any primitiveor object onto the canvas and then saving it. Participants are encouraged tobring their own computers with programs from their courses. jGRASP and theplugins are freely available.
All educators who teach Java will benefit from this tutorial. However, itwill be especially suitable for instructors who teach Java-based programming,data structures, or algorithms courses. The overall objective of the tutorialis to introduce faculty to the advanced pedagogical features provided by theviewers and canvas for teaching and learning Java. The participants will beguided through numerous scenarios to see how creating visualizations of theirprograms and making them available to students can make learning to pro-gram a more enjoyable experience. In addition to finding the visualizationsuseful for understanding example programs, students can easily create visual-izations of their own programs which will be especially useful while debugging.
∗Copyright is held by the author/owner.
15

Since the canvas can be populated with any primitives or objects created bytheir programs, including traditional data structures (e.g., stacks, queues, lists,and binary trees), the visualizations created by faculty and students are onlylimited by their creativity. As they “play” or step through their programs indebug mode, all viewers on the canvas are updated dynamically to provide theopportunity for a much clearer understanding of the program.
Consider the following examples which contain multiple viewers on eachcanvas. Figure 1 shows a canvas in Eclipse for a simple binary search program,which includes five viewers: key, low, mid, high, and intArray. These werecreated by simply dragging the variables from the debug window or detailspane in Eclipse onto the canvas. For the array viewer on intArray, the userhas added the variables for the indices which will move along the array as theirvalues change.
Figure 1: Canvas in Eclipse for a simple binary search program.
Figure 2 shows a canvas in IntelliJ for an implementation of selection sort,which includes six viewers: two on the array ia (one as a bar graph and theother as typical “textbook” presentation), index, min, scan, and temp. The bargraph viewer and the presentation array viewer update automatically as theprogram runs in the debugger. The bar graph makes it easy to see which valuewill be the next min for a given iteration through the array.
In each of these examples, the user can simply click the play button on thecanvas to auto step through the program, which brings the canvas to life with
16
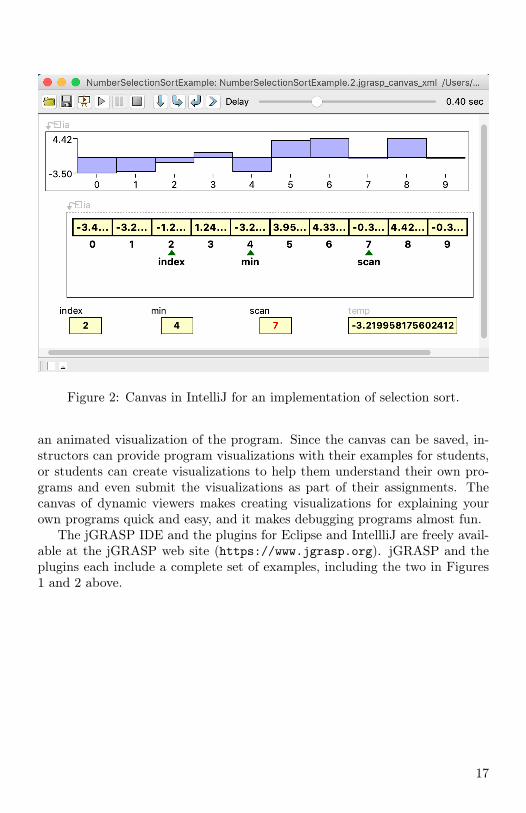
Figure 2: Canvas in IntelliJ for an implementation of selection sort.
an animated visualization of the program. Since the canvas can be saved, in-structors can provide program visualizations with their examples for students,or students can create visualizations to help them understand their own pro-grams and even submit the visualizations as part of their assignments. Thecanvas of dynamic viewers makes creating visualizations for explaining yourown programs quick and easy, and it makes debugging programs almost fun.
The jGRASP IDE and the plugins for Eclipse and IntellliJ are freely avail-able at the jGRASP web site (https://www.jgrasp.org). jGRASP and theplugins each include a complete set of examples, including the two in Figures1 and 2 above.
17

Building and Expanding a SuccessfulUndergraduate Research Program∗
Panel Discussion
Sarah Heckman1, Brandon Fain2, Manuel Pérez-Quiñones31NC State University
[email protected] [email protected]
3University of North Carolina at [email protected]
Undergraduate research is an important means of engaging computer sci-ence students outside of the classroom in substantive and original inquiry intothe discipline, and to prepare them for independent work in industry or grad-uate school. We discuss the approaches and challenges of starting, managing,and expanding undergraduate research programs in computer science depart-ments. The presentation should be of interest to faculty developing an under-graduate research program in their department.
During the panel, we will discuss program contexts and how that informsdecisions about what type of undergraduate research program that may be cre-ated and the support structures available for undergraduate students. Programstructure informs how students connect with faculty, the scope of an under-graduate research project, and what students receive for their work. Additionalconsiderations on recruitment and admission into undergraduate research pro-grams should be considered by departments as they think about how to supportand grow a program; students may not know undergraduate research is an op-tion. Many students may not know that undergraduate research is an option.Once students are part of a program, expectations for success and comple-tion are critical to ensure a good experience. Students may be expected towrite a proposal about their work before the project starts, present their workat a poster sessions locally or at the state (e.g., the State of North CarolinaUndergraduate Research and Creativity Symposium), national (e.g., NationalConference on Undergraduate Research), and international levels, supporting
∗Copyright is held by the author/owner.
18

retention in computing [3]. Finally, there are extensive resources for supportingundergraduate research. For example, Affinity Research Groups [1] provide amodel for creating research teams.
Sarah Heckman is an Associate Teaching Professor and Director of Un-dergraduate Programs for the Department of Computer Science at NC StateUniversity. She oversees the CSC Honors Program which requires an under-graduate research component.
Brandon Fain is an Assistant Research Professor at Duke University. Hebuilt an undergraduate summer research program at Duke piloted during 2019based on a collaboration with similar undergraduate summer programs in datascience and software engineering at Duke University.
Manuel Pérez-Quiñones is a Professor at University of North Carolina –Charlotte. In the late 90s, Dr. Pérez-Quiñones was director of the IndustrialAffiliates Program1 at the University of Puerto Rico Mayaguez. The IAP pro-gram [2] just celebrated 30 years. In 2002, together with Dr. Scott McCrickard,they started the Virginia Tech Undergraduate Research in Computer Scienceprogram2. This year’s poster session was the 18th iteration of the program.From 2006 until 2010, Dr. Pérez-Quiñones was co-chair of the CREU program3
as part of the CRA-W/CDC Broadening Participation in Computing Alliance.
References
[1] Ann Gates, Steve Roach, Elsa Villa, Kerrie Kephart, Connie Della-Piana,and Gabriel Della-Piana. The Affinity Research Group Model: CreatingAnd Maintaining Effective Research Teams. IEEE Computer Society Press,2008.
[2] M. Velez-Reyes, M. Perez-Quinones, and J. Cruz-Rivera. The industrialaffiliates program at the university of puerto rico - mayaguez. In ProceedingsOf the 1999 Frontiers In Education Conference, FIE 1999, pages 13C5/13–13C5/18. IEEE, 1999.
[3] Heather M. Wright and N. Burçin Tamer. Can sending first and second yearcomputing students to technical conferences help retention? In Proceedingsof the 50th ACM Technical Symposium on Computer Science Education,SIGCSE ’19, pages 56–62, New York, NY, USA, 2019. ACM.
1https://ece.uprm.edu/iap/2https://www.vturcs.cs.vt.edu/3https://cra.org/cra-w/creu/
19
A Comparison of Two Popular MachineLearning Frameworks∗
Chance Simmons and Mark A. HollidayDepartment of Mathematics and Computer Science
Western Carolina UniversityCullowhee, NC 28723
[email protected] [email protected]
Abstract
Using artificial neural networks is an important approach for draw-ing inferences and making predictions when analyzing large and com-plex data sets. TensorFlow and PyTorch are two widely-used machinelearning frameworks that support artificial neural network models. Weevaluated the relative effectiveness of these two frameworks to model abinary classification problem. The binary classification was done usingsentiment analysis on a publicly-available data set of product reviews.We first implemented the same model in the same testing environmentto see if we were able to achieve similar accuracy with both frameworks.We then compared the training time, memory usage, and ease of use ofthe two frameworks.
1 Introduction
Artificial neural networks (ANNs) [4] have been demonstrated to be effectivefor many cases of supervised learning [6], but programming an ANN manuallycan be a challenging task. Frameworks such as TensorFlow and PyTorch havebeen created to simplify the creation and use of ANNs.
One of the major uses of artificial neural networks is natural languageprocessing[5] one aspect of which is sentiment analysis. To compare the twomachine learning frameworks, the first step was to develop, train, and evaluate
∗Copyright ©2019 by the Consortium for Computing Sciences in Colleges. Permission tocopy without fee all or part of this material is granted provided that the copies are not madeor distributed for direct commercial advantage, the CCSC copyright notice and the title ofthe publication and its date appear, and notice is given that copying is by permission of theConsortium for Computing Sciences in Colleges. To copy otherwise, or to republish, requiresa fee and/or specific permission.
20

the same neural network model in both frameworks. In theory we should beable to obtain the same accuracy in both frameworks. since the same underly-ing model was being implemented. The second step was to compare the modelimplementations in the two frameworks based on execution time, memory us-age, and ease of development.
2 Data Set
The data set that was chosen to test the frameworks was a publicly-availableset of Amazon reviews for video games[1]. The ratings that the individual gavewere also included in the data set. Due to the nuances and bias involved in whateach individual feels a certain rating should be, the data set was then brokendown into only positive and negative reviews. The positive reviews consistedof the reviews with ratings of 4 or 5, whereas the negative reviews consisted ofthe reviews with ratings 1, 2, or 3. By having only two categories, the problemthen becomes a sentiment analysis problem that uses binary classification.
Neural networks use mathematical calculations, so the textual reviews neededto be converted into numerical information. In this case, the text was analyzedto find the most common 10,000 words. Each occurrence of each word in thetextual reviews was then replaced by the numerical index of that word in thecommon word list if that word occurred in the common word list. Any wordthat were not common enough to be found in the common word list was giventhe value of 0. Below is an example sentence from the Amazon reviews andthe corresponding tokenization.
[’Dirt 3 on DVDi collect racing games so had to add this to my collectionSonwated one also’]
[ 98 19 908 496 34 30 80 3 408 11 3 39 31 0 0 0 0 0 0 0 . . . (0x230)]
Each sentence is reduced to a total size of 250 indices. This number waschosen by taking the average length of all the sentences in the data set. Anysentence over 250 words used just the first 250 words found in the vocabulary.If a sentence is shorter than 250 words, then the rest of list is padded with 0’s.In the above example, there were only 13 words that were found to be in thevocabulary. This meant that 13 words in the original sentence were convertedto their numerical representation and the rest of the list was filled with 0’s.
This sentence highlights some of the issues that were found with the dataset. Some of the user’s reviews included grammatical errors. These errors madeit so that those words were not common enough to be included in the finalsentence, removing some of the important information. In this case, words like‘DVD’, ‘collection’, ‘Son’ and ‘wanted’ are left out from the tokenized sentencebecause of errors present in the review.
21
3 Model
In a recurrent neural network (RNN) [3] the output of the RNN cell is fedback into the recurrent network cell as input, allowing for sequences of infor-mation to be learned. Since the words that occur before a certain word in asentence add importance to the current word being analyzed, RNNs are oftenused in natural language processing. So we used a RNN instead of a simplefeed-forward fully-connected neural network.
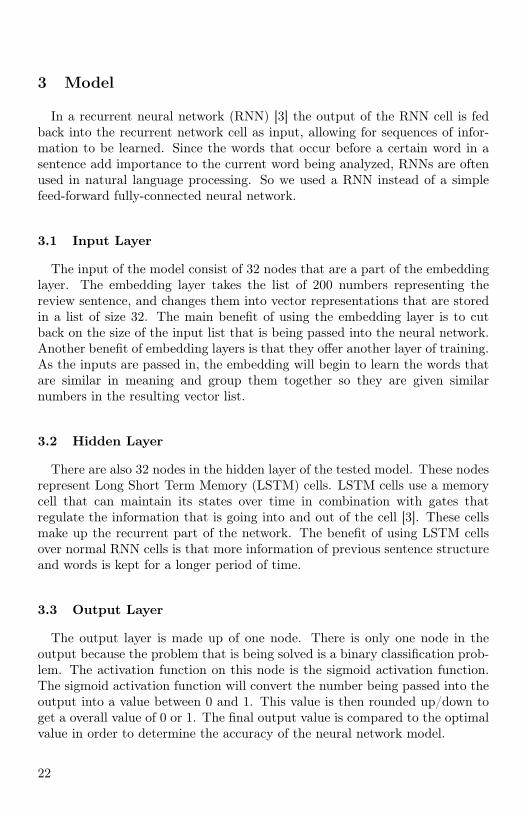
3.1 Input Layer
The input of the model consist of 32 nodes that are a part of the embeddinglayer. The embedding layer takes the list of 200 numbers representing thereview sentence, and changes them into vector representations that are storedin a list of size 32. The main benefit of using the embedding layer is to cutback on the size of the input list that is being passed into the neural network.Another benefit of embedding layers is that they offer another layer of training.As the inputs are passed in, the embedding will begin to learn the words thatare similar in meaning and group them together so they are given similarnumbers in the resulting vector list.
3.2 Hidden Layer
There are also 32 nodes in the hidden layer of the tested model. These nodesrepresent Long Short Term Memory (LSTM) cells. LSTM cells use a memorycell that can maintain its states over time in combination with gates thatregulate the information that is going into and out of the cell [3]. These cellsmake up the recurrent part of the network. The benefit of using LSTM cellsover normal RNN cells is that more information of previous sentence structureand words is kept for a longer period of time.
3.3 Output Layer
The output layer is made up of one node. There is only one node in theoutput because the problem that is being solved is a binary classification prob-lem. The activation function on this node is the sigmoid activation function.The sigmoid activation function will convert the number being passed into theoutput into a value between 0 and 1. This value is then rounded up/down toget a overall value of 0 or 1. The final output value is compared to the optimalvalue in order to determine the accuracy of the neural network model.
22

4 Training
We used Google Colaboratory as the testing environment since supports bothframeworks and Python as the language. To maximize the performance of bothimplementations, we enabled use of the Graphics Processing Units (GPUs).
We used the Adam optimizer in both implementations. The Adam opti-mizer is a basic optimizer that uses gradient descent and a momentum factorto perform back propagation. Back propagation is the process of adjusting theweights of the links between the nodes in order for the network to become moreaccurate when similar input is passed into it. The momentum factor is usedto change the links weights at a higher rate whenever the same links are beingchanged constantly.
Over-fitting is a serious issue when training a neural network. Over-fittingoccurs whenever the network’s training becomes so specific to the training datathat its predictions for other data become less accurate. After extensive testingwe were able to obtain the best accuracy on new data for both frameworks byusing 20 epochs, a dropout of fifty percent, a learning rate of 0.01, a batchsize of 1000, and a hidden layer size of 32 nodes. Dropout means that inthe training of the neural network during each epoch a random and usuallydifferent 50 percent of the nodes in a layer would not be considered.
5 Results
5.1 Accuracy
The TensorFlow Accuracy graph (Figure 1) and the PyTorch Accuracy graph(Figure 2) indicate how close the accuracies of the two frameworks are. Thetraining accuracy in both models are constantly increasing; this is due to thefact that the models are starting to memorize the information that they arebeing trained on. The validation accuracy indicates how well the model isactually learning through the training process. In both cases, the validationaccuracy of the models in both frameworks averaged about 78% after 20 epochs.Clearly both frameworks were able to implement the neural network accuratelyand are capable of producing the same results given the same model and dataset to train on.
5.2 Training Time and Memory Usage
The TensorFlow Training Time graph (Figure 1) and the PyTorch Train-ing Time graph (Figure 2) indicate that the training time for TensorFlow issubstantially higher (average of 11.1954 seconds while PyTorch’s average was
23

5 10 15 20Epochs
50
60
70
80
90
100
Accu
racy
Accuracy ValuesTraining AccuracyValidation Accuracy
5 10 15 20Epochs
11.0
11.2
11.4
11.6
11.8
12.0
Tim
e
TensorFlow Training Time
Figure 1: TensorFlow Accuracy and Training Time
5 10 15 20Epochs
50
60
70
80
90
100
Accu
racy
Accuracy ValuesTraining AccuracyValidation Accuracy
5 10 15 20Epochs
7.65
7.70
7.75
7.80
7.85
7.90
Tim
e
PyTorch Training Time
Figure 2: PyTorch Accuracy and Training Time
7.6798 seconds). The durations of the model training times can vary substan-tially from day to day on Google Colaboratory. However, the relative durationsbetween TensorFlow and PyTorch remain consistent.
TensorFlow had a lower memory usage during training (1.7 GB of RAMwhile PyTorch’s memory usage was 3.5 GB); both had little variance in memoryusage during training. Both had higher memory usage (4.8 GB for TensorFlowand 5 GB for PyTorch) during the initial loading of the data.
5.3 Ease of Use
PyTorch’s more object-oriented style made implementing the model lesstime-consuming and the specification of data handling more straightforward.TensorFlow, on the other hand, had a slightly steeper learning curve due tothe low level implementations of the neural network structure. The Tensor-Flow low level approach allows for a more customized approach to forming theneural network which allows implementing more specialized features. The very
24

high level Keras library runs on top of TensorFlow. So as a teaching tool, thevery high level Keras library[2] can be used to teach basic concepts, and thenTensorflow can be used to further the understanding of the concepts by havingto lay out more of the structure.
6 Conclusions
TensorFlow and PyTorch showed equal accuracy in our experiments. Ten-sorFlow’s training time was substantially higher, but its memory usage waslower. PyTorch allows quicker prototyping than TensorFlow, but TensorFlowmay be a better option if custom features are needed in the neural network.Our model implementations and data set are available athttps://github.com/Ltcas/NLPFrameworkComparison.
Comparing PyTorch to the recently released TensorFlow 2.0 as well as tousing the Keras library is possible future work.
References
[1] Amazon reviews data sets. https://snap.stanford.edu/data/web-Amazon.html. Accessed: 2018-12-14.
[2] Francois Chollet. Deep Learning with Python. Manning, 2017.
[3] Aurelien Geron. Hands-on machine learning with Scikit-Learn and Tensor-Flow : concepts, tools, and techniques to build intelligent systems. O’ReillyMedia, Sebastopol, CA, 2017.
[4] Warren Mcculloch and Walter Pitts. A logical calculus of ideas immanentin nervous activity. Bulletin of Mathematical Biophysics, 5:127–147, 1943.
[5] Delip Rao and Brian McMahah. Natural Language Processing with Py-Torch. O’Reilly Media, Sebastopol, CA, 2019.
[6] Stuart J. Russell and Peter Norvig. Artificial Intelligence - A ModernApproach Third Edition. Pearson Education, 2010.
25

Alexa Skill Voice Interface for theMoodle Learning Management System∗
Michelle Melton and James Fenwick Jr.Department of Computer Science
Appalachian State UniversityBoone, NC 28608
{meltonml,fenwickjb}@appstate.edu
AbstractMost educational and training organizations today use some type of
learning management system (LMS) to make course material availableonline to participants. An LMS can be used for face-to-face, fully online,or hybrid courses incorporating versions of both. Learning managementsystem users want easy and fast access to learning materials. LMS accessis typically provided through an online interface or a mobile application,both of which require the use of touch and sight on a computer or device.With the rapid growth of technology advancements and user knowledge,LMS users will expect faster and more convenient access.
The last decade has brought considerable progress in voice technology.Significant improvement in the accuracy of speech to text translationhas made the use of voice-enabled devices more common. Since bothtechnology and usage are continuing to grow, voice interfaces will becomeeven more important for modern applications.
Two of the top three LMS frameworks on the market today have voiceinterfaces. Both Blackboard Learn and Canvas by Instructure have Ama-zon Alexa skill integrations that provide basic course information suchas announcements, assignments, and grades. Presently, there is no dis-tributed voice integration for Moodle, the second-ranked LMS provider.
This paper details the development of a voice user interface for alearning management system: specifically, an Amazon Alexa skill forMoodle. The research thoroughly outlines the process of developing anAlexa skill for Moodle, including:
∗Copyright ©2019 by the Consortium for Computing Sciences in Colleges. Permission tocopy without fee all or part of this material is granted provided that the copies are not madeor distributed for direct commercial advantage, the CCSC copyright notice and the title ofthe publication and its date appear, and notice is given that copying is by permission of theConsortium for Computing Sciences in Colleges. To copy otherwise, or to republish, requiresa fee and/or specific permission.
26

• user-centered interface design;• developing effective prototypes for early feedback on the design;• usage of the Alexa Skills Kit for the front-end development of the
skill;• implementing the Moodle API for the development of the back-end
web service for the skill; and• planning and conducting effective usability testing sessions and
evaluating results.
An Alexa skill integration with Moodle will allow users to morequickly and conveniently access information from the LMS. Immediatebenefits of the project include providing site announcements to all users,course announcements to students and teachers, and overall course gradesand upcoming due dates to students. In the future, the application maybe expanded to implement instructor capabilities like getting a list ofassignments that need grading and the ability to create voice activitiesfor students. Future development may also include providing additionalcourse content for students, such as attendance, missing assignments,and instructor contact information.
1 Introduction
Today, most educational and training organizations make at least some of theircourse content available on a learning management system (LMS). Whether thecourses are online, face-to-face, or hybrid, an LMS makes assignments, grades,and other course material available online.
Students rank easy access and fast access to learning materials as secondand third in importance for an LMS [3]. Most learning management systemsattempt to meet these needs with an online interface as well as some type ofmobile access. With both innovations in technology and user savviness growingrapidly, LMS users will want even faster and more convenient access to coursematerial than the online and mobile interfaces can provide.
Historically, the biggest challenge for voice interfaces (spoken interactionswith a computer) was the accurate translation of speech to text [5]. Mod-ern voice technology has improved significantly in the past decade; the speechrecognition error rate is now only about 8% [9]. With such a dramatic im-provement in the usability of voice-enabled devices, they are becoming morecommonplace. In fact, 20% of Google searches are now performed by voice [8].
Many popular applications have already started integrating voice interfaces,including some LMS frameworks. In 2017, Blackboard Learn and Canvas byInstructure, two of the top three learning management systems, implementedAmazon Alexa skills that provide standard course content like announcements,assignments, and grades. There is currently no distributed voice integration
27

for Moodle, the second-ranked LMS provider.This paper describes the development of an Amazon Alexa skill that en-
hances the speed and convenience of accessing information in the Moodle LMS.Current features include providing all users access to public site announcementsand enabling student access to course announcements, grades, and upcomingdue dates. Future development may expand functionality to include instructoractions, such as accessing assignments that need grading and possibly even cre-ating voice interactive assignments, as well as expanding the content availableto students.
2 Alexa Skill
Similar to Google Home and Apple’s Siri voice assistant, Alexa is Amazon’scloud-based voice service available on Alexa devices. Alexa skills are appsthat enable voice-activated capabilities for connected smart devices and onlineservices. Users interact with Alexa by saying a wake word to wake the de-vice and then speaking an invocation phrase that consists of an utterance andthe invocation name of the skill. For example, “Alexa, ask Daily Horoscopesfor the horoscope for Gemini” consists of the “Alexa,” wake word, the “DailyHoroscopes” invocation name, and “the horoscope for Gemini” utterance.
3 Voice Interface Design
General interface design principles can and should be applied to creating voiceapplications, but a few characteristics of voice user interfaces (VUIs) requirespecial consideration in their design. Auditory interactions differ from visualones in that they present information one word at a time, the information isconstantly changing, and there is no permanent record of what was said [5].These unique characteristics can place cognitive demands on users by requiringthem to use short-term memory and to move at a predetermined pace [4]. It isimportant to take these cognitive issues into account during the design of thevoice interface.
Due to the differences between visual and voice interfaces, standard proto-typing for user feedback early in the design process has to be modified for voiceinteractions. The interaction layer (the dialog and responses of the system) andthe presentation layer (the voice, word choice, and speaking rate of the sys-tem) are more connected in a voice application, so both should be included inprototypes. Prompts should be fully scripted for the interaction layer, so theuser’s ability to complete a task is not impaired. The production voice shouldbe used because pitch and pace (the personality of the system) can affect auser’s evaluation of the interface [5].
28

The design process ensured careful consideration of the purpose and capa-bilities of the skill, what users would say when interacting with the skill, andplanning for how Alexa would respond to build a voice interface that providesvalue and is easy to use.
The process began by identifying user stories for the skill. To determine thecapabilities users would find most beneficial, reports from Google Analytics forAsULearn (the Appalachian State University instance of Moodle) were exam-ined to verify the most viewed pages. This data helped inform the decisions ofthe initial intents for the skill: GetSiteAnnouncementsIntent, GetCourseAn-nouncementsIntent, GetDueDatesIntent, and GetGradesIntent.
With the user story intents established, the way users will speak their in-tentions needed to be considered, which involved outlining the utterances foreach intent. To ensure that the invocation phrases considered actually matchthe words students might use, students completed a basic survey about theirpreferences for the phrasing of the application name, courses, announcements,grades, and due dates. These results helped guide the design of the Alexa skillin terms of the invocation name, the way courses were spoken to the user andto the skill, and the implementation of additional utterances for each intent.
The last step in the design process was planning how Alexa would respondto user requests. Formatting the responses so they sound natural took priorityover using proper grammar to make sure Alexa sounds like a person when auser is interacting with the skill [1]. Responses that need an answer from theuser were designed to end with a prompting question to serve as a cue forthe user to begin speaking. Multiple variations of responses were designed foreach intent, and acknowledgments such as “thanks,” “okay,” and “great” wereplanned for inclusion to make the interaction more conversational [1].
Another element of the design focused on adding a layer of access protectionto the skill. To address privacy concerns, the design incorporated the abilityto set an optional PIN during account linking that can be used to verify theuser before personal information is returned.
4 Alexa Skill Architecture
4.1 Front-end
The front-end of the voice user interface for a custom Alexa skill is created inthe Alexa Skills Kit (ASK) developer console. Building the interaction modelinvolves configuring the invocation name, intents, sample utterances, and slottypes, which define information that can vary within an utterance and are usedto facilitate dialog with the user.
The skill invocation name was set to “as you learn” since this is how usersspeak the branded name of the Appalachian State University Moodle site.
29
To enable the primary capabilities of the skill, four ASK intents werecreated: GetSiteAnnouncementsIntent, GetCourseAnnouncementsIntent, Get-GradesIntent, and GetDueDatesIntent. Between 50 and 250 utterances foreach intent were added to the interaction model, as Amazon recommends atleast 30 utterances per intent to enhance skill performance [1]. Several Alexabuilt-in intents were also implemented to provide for the processing of standardcommands, such as handling the typical ways users end a skill session as wellas ask for help.
The Dialog interface in the ASK enables dialog between a user and Alexa.A Dialog directive returned with a skill response lets Alexa know that a userresponse is needed to complete the processing of a request. Responses are thenstored in slots in subsequent requests to Alexa. A custom COURSE slot typewas created and populated so users can say the name of a course for which theywould like to hear announcements. To handle PIN responses from the user,the AMAZON.FOUR_DIGIT_NUMBER slot type was implemented. Thisslot type provides built-in recognition of the variety of ways four-digit numbersare spoken, such as “nineteen twenty-one” or “one nine two one”, and sends thedigits to the web service for processing [2].
To establish the connection between the Alexa skill front-end and the webservice back-end that receives and processes the skill requests, the address ofthe Moodle web service was input as the endpoint. Account linking was enabledto use OAuth 2.0 implicit grant authorization, and the address of the customlogin for the Alexa skill for Moodle plugin was set as the authorization URI.
4.2 Back-end
4.2.1 Web Service Plugin
The custom Alexa Skill plugin for Moodle was developed and coded to serve asthe back-end web service endpoint for the skill. Moodle already provides a webservice API enabling third-party customization. However, several deviationsfrom the standard API were necessary to adhere to the ASK requirements. TheMoodle core web service that custom plugins extend only allows the passing ofarguments via URL query strings. In order to receive the JSON documents sentby Alexa, a third-party plugin providing the REST protocol with JSON pay-load support [7] was forked and customized to meet the requirements. Moodle’sweb service API requires that the parameters for the web service be pre-definedin the plugin, which would involve declaring all the JSON request properties inthe plugin code. This specification posed a problem because the Alexa SkillsKit states that new properties may be added to the request and response for-mats, and web service endpoints must not break when receiving requests withadditional properties [2]. In order to meet this specification, the RESTALEXA
30
plugin was designed to send the JSON request to the Alexa plugin as a textstring.
4.2.2 Skill Linking to Moodle Account
To enable account linking, the Alexa Skills Kit requires that the web servicelogin accept a username, password, state, client ID, response type, and redirectURI. The web service needs to generate and return a token for the specifieduser, along with the state from the request, to Alexa at the provided redirectURI [2]. The Moodle core token request is similar to the core web servicerequest in that arguments are passed via URL query strings. It also onlyprovides the token in the response. This response structure was not sufficientto meet the ASK requirements, so a custom login and account linking processwas created.
A PIN verification option was implemented for users who want an addedlayer of security for accessing personal information in Moodle from Alexa. Thesecurity PIN is useful for Alexa devices in shared living spaces like studentapartments. After users login to Moodle via their specified authenticationmethod, they are able to create an optional 4-digit PIN that is stored in Moodleas user data. If the web service receives a request from a user with a linkedaccount and a PIN set, Alexa will prompt for PIN verification before providinguser-specific information.
4.2.3 Web Service Processing of Requests
When the web service receives an Alexa skill request, it parses the JSON andcalls an internal function for the request type specified. When the web servicereceives a LaunchRequest, sent when a user opens the skill, it sends a responsethat includes a welcome message and available options, ending with a promptfor the user’s choice. If the Moodle account is linked, the response will bepersonalized with the user’s first name.
For the GetSiteAnnouncementsIntent, the web service will respond with thesite announcements from the front page. The number of site announcementsretrieved is determined by the front page settings, limited to five for usability.
For the GetCourseAnnouncementsIntent, the web service performs accountlinking and PIN verification, and the list of courses for which the user hasenrollments is retrieved. If there are no courses or if a single course withno announcements is found, these respective messages are returned. If thereare announcements for a single course, they are provided. The number ofannouncements retrieved is determined by the course settings, again limited tofive. If more than one course is found for a user, the web service responds withthe list of course names and a prompt for the user to select a course. The user’s
31

course name response is parsed from the COURSE slot value in the requestfrom Alexa and checked against the list of course enrollments for the user. Ifa match is found, the announcements for that course are returned.
The GetGradesIntent performs account linking and PIN verification, anda response is returned with the overall course grades for each of the student’scourses.
The web service also performs account linking and PIN verification for theGetDueDatesIntent and the course enrollments and group memberships for theuser are determined and events retrieved. The number of events returned inthe response is determined by the site setting, limited to five for usability. Thesite setting for number of days in the future to look ahead is also used in theevaluation of returned events.
Responses are randomly chosen from several variations so the user experi-ence is more personal and conversational. Responses also include a reprompt,which Alexa speaks if no response is heard from the user within 8 seconds, orif the response is not understood.
4.2.4 Moodle Plugin Installation
Documentation and installation instructions were created for the web serviceplugin. A JSON file of the interaction model was also included with the plugincode for quickly building the base skill in the Alexa developer console withthe JSON Editor import feature. There are several GUI settings that areautomatically configured for the Moodle site administrator on installation, andthe plugin includes several configurable settings to facilitate installation anduse on any instance of Moodle.
5 Results
The overall objective was to build a voice user interface that enhances the speedand convenience of accessing information in a learning management system.This goal was achieved by implementing an Amazon Alexa skill for the MoodleLMS that provides voice access to site announcements, course announcements,grades, and due dates.
Upon development of the four primary intents for the Alexa skill, usabilitytesting was performed to evaluate the voice application. Students from a vari-ety of different colleges, grade levels, and familiarity with Amazon Alexa skillsand AsULearn were recruited to participate.
After using the skill, participants were asked to complete an online survey torate their experience. The feedback survey was designed and built based on theSUISQ-MR [6]. The four usability factors were distributed across the survey asuser goal orientation (questions 1-2), customer service behavior (questions 3-4),
32

Figure 1: Usability testing survey results.
speech characteristics (question 5), and verbosity (questions 6-8). A 5-pointLikert scale was used, with 1 being “Strongly disagree” and 5 being “Stronglyagree.” Figure 1 shows the results of the survey completed by participants afterusing the skill.
A follow-up interview was also conducted to get additional feedback. Theinterview consisted of several open-ended questions to allow participants todiscuss their opinion of the skill in greater detail. Participants were askedwhat they found easy about using the skill, what they found difficult aboutusing the skill, if they encountered anything unexpected during the use of theskill, and if there were other features or capabilities they would find useful tohave in the skill. They were also asked about the PIN section of the accountlinking process; specifically, if it was obvious that it was optional, as well as itspurpose.
Interviews revealed that most participants realized the optionality of thePIN after they had already created it during the account linking process, andthey assumed its purpose was for an additional layer of access protection. How-ever, they expressed that additional clarity on the account linking form wouldbe helpful. All users reacted positively to the PIN feature.
Comments regarding what was easy as well as difficult about using the skilltended to vary based on the user’s familiarity with Alexa. Users who were morefamiliar with Alexa communicated that the skill was very similar to and even
33

easier to use than other Alexa skills. Those with less Alexa experience discusseddifficulty figuring out what they needed to say to use the skill; however, theyalso indicated that any difficulty with the utterances would be easily overcomewith a little practice using the system.
Many of the suggestions for additional features or capabilities for the skillwere ideas discovered in previous research, such as the student survey con-ducted to aid in the design of the skill. Most of these features are alreadyplanned for future development work.
All users expressed surprise and delight that Alexa knew and used theirname in the response to the LaunchRequest. Personalization of the skill inter-action appears to be appreciated and highly valuable for the usability of theinterface.
At the end of each testing session, all participants expressed their enjoymentin using the skill and the capabilities it provided, as well as their hope that itwill be implemented on AsULearn in production.
6 Conclusion and Future Work
The next step in the project will be to release the skill in production and let abroader audience of students interact with it. The increased usage will enablefurther usability research, as well as more comprehensive analytics from theAlexa developer console. The additional data will ensure that any proposedchanges align with the needs of most of the skill’s user base.
The plugin code for the Alexa skill is available on GitHub at https://goo.gl/jCJGLG, and the plugin code for the RESTALEXA protocol plugin isavailable at https://goo.gl/eMdmBT.
With the implementation of a few final modifications and enhancementsbased on usability test feedback, the skill will be submitted to the AppalachianState University Center for Academic Excellence Learning Technology Servicesteam for review before submitting for certification and launch in the AlexaSkills Store.
The initial development of a voice application for accessing information inthe Moodle learning management system was the core of this research; however,there are additional, further reaching implications to investigate in the future.Future work may include adding instructor-specific tasks such as the ability tohear a list of assignments that need grading, as well as the ability to createvoice activities in Moodle. Allowing students to complete quizzes verballyis a feature that would offer added value for instructors and students alike.Expanding the existing intents would also improve the current capabilities ofthe skill.
In addition to expanding the functionality of the skill, research on the us-
34
ability impact would be interesting to explore. The spoken/auditory access toMoodle may enhance the accessibility of the application for users with disabil-ities. Providing students access to their current performance may also havea positive impact on student success. Research to find out if the increasedaccess to academic status and learning materials afforded by the voice inter-face positively affects overall student success is another area of interest. Withthe development of the initial application and usability testing complete, theseextended areas of development and research can be explored in the future.
References
[1] Amazon Alexa. Alexa Voice Design Guide. World Wide Web electronicpublication, https://developer.amazon.com/designing-for-voice.
[2] Amazon Alexa. Understand Custom Skills. World Wide Webelectronic publication, https://developer.amazon.com/docs/custom-skills/understanding-custom-skills.html.
[3] Lee Yen Chaw and Chun Meng Tang. The voice of the students: Needs andexpectations from learning management systems. In Proceedings. EuropeanConference on Games Based Learning, 2017.
[4] Michael H. Cohen, Jennifer Balogh, and James P. Giangola. Voice UserInterface Design. Addison-Wesley, 2004.
[5] Susan L. Hura. Usability testing of spoken conversational sys-tems. Journal of Usability Studies 12: 155 - 163, August 2017.http://www.uxpajournal.org/usability-spoken-systems.
[6] James R. Lewis. Standardized questionnaires for voice interaction design.The Journal of the Association for Voice Interaction Design 1: 1 - 16, April2016.
[7] Moodle. REST protocol (with JSON/XML payload support),February 2016. World Wide Web electronic publication,https://moodle.org/plugins/webservice_restjson.
[8] Cathy Pearl. Designing Voice User Interfaces: Principles of ConversationalExperiences. O’Reilly Media, 2016.
[9] John Rome. Alexa goes to college: Asu’s innovative use of voice technology.In Annual Conference, 2017.
35

Auto-Checking Digital Logic Design LabsThrough Physical Computing∗
Gongbing Hong, Gita Phelps, Yi Liu, Kenneth TrussellInformation Systems and Computer Science
Georgia College and State UniversityMilledgeville, GA 31061
{gongbing.hong,gita.phelps,yi.liu,kenneth.trussell}@gcsu.edu
Abstract
In this paper we introduce a simple and inexpensive solution thatauto-checks digital logic design (DLD) labs using Raspberry Pi – a smallsingle board computer with physical computing capability. Given thelarge number of test cases associated with any typical DLD lab, thiswork has the benefit of dramatically cutting the amount of manual laborrequired of an instructor to check DLD lab work. When used by stu-dents for self-check, it helps improve learning outcome and experienceby providing quick feedback to students.
1 Introduction
This work is motivated by the enormous amount of manual work an instructorhas to perform in grading digital logic design (DLD) labs for students. DLDlabs often have a significant number of inputs and outputs. The number of testcases grows exponentially with the number of digital inputs. For example, fora simple 4-bit adder, the number of inputs is 8 for two 4-bit operands and thenumber of outputs is 5 for a 4-bit sum and a 1-bit carry-out. The total numberof input combinations is thus 28 = 256. For each input combination, one has tocheck all 5 outputs against the expected result. So the total number of checksis 256 × 5 = 1280. Given the size of any typical class, that is undoubtedlylabor intensive if the check is done manually. So in reality, instructors often
∗Copyright ©2019 by the Consortium for Computing Sciences in Colleges. Permission tocopy without fee all or part of this material is granted provided that the copies are not madeor distributed for direct commercial advantage, the CCSC copyright notice and the title ofthe publication and its date appear, and notice is given that copying is by permission of theConsortium for Computing Sciences in Colleges. To copy otherwise, or to republish, requiresa fee and/or specific permission.
36
“cut corners” in various ways to reduce the amount of work which in the endcan sacrifice the quality of teaching. One solution to this problem is thusauto-checking / grading.
While auto-grading assignments in the teaching of programming relatedcourses is a well established practice, to the best of our knowledge, there hasbeen few simple and inexpensive solutions for the auto-checking / gradingof DLD labs. This is likely due to the relative “messiness” in dealing withphysical world objects by software tools. But thanks to the recently cheap andcommercially available small single-board computers such as Raspberry Pi [5]that readily support physical computing, this issue can now be easily addressedat a very low cost.
In this paper, we attempt to fill a void by presenting a simple and inexpen-sive solution that extends auto-grading to the field of DLD labs. The remainderof the paper is organized as follows. In Section 2, we review some backgroundinformation and related work. In Section 3, we introduce our methodology.After that, we present our solution with some discussion in Section 4. In Sec-tion 5, we conclude the paper with some future work.
2 Background and Related Work
2.1 Autograding in CS education
Auto-grading involves utilizing automated software tools called autograders tocheck and grade student work automatically. It has been successfully usedin checking / grading programming assignments. When a student submitsa program to an autograder, the autograder automatically picks a test case,supplies the input from the test case, and runs the program. When the programterminates, its output is automatically compared against the expected resultfor correctness. The autograder then iteratively tries the next test case untilall test cases are exhausted.
Auto-grading is beneficial to students by providing instant feedback abouttheir submissions, which can be used to help correct any mistakes in a timelymanner. At a minimum, students will be able to learn almost immediatelywhether or not their solutions are acceptable. If a submission turns out to beincorrect, a student can try again depending on the settings. Autograders areoften set to allow multiple submissions before the deadline of an assignment.This is definitely something extremely useful but hard to do for a human grader.As a result, auto-checking helps enhance the student learning experience – morestudent work, more effective teaching, and better results. Due to its efficiency,autograding is particularly essential for massive open online courses (MOOCs).It has been reported that autograding helps improve the completion rates inthe offerings of MOOCs [6].
37
There are a variety of autograders available today, both open source andcommerical products such as Autolab [9], Submitty [4], and CodeLab [2]. Thesetools, however, are for the auto-grading of software code only. Our proposedsystem, on the other hand, will be an auto-checker / grader for hardware-oriented digital logic design labs.
2.2 Current practices in teaching digital logic design
When it comes to teaching DLD, projects may be either simulated or hand-builtwith tangible IC chips on actual breadboards or both. Commercial softwareproducts are available for DLD simulations but are expensive. At our insti-tution, we prefer to use a freely available, light-weight DLD simulation toolcalled Logisim [1]. Students are instructed to create their design using Logisimand simulate it to eliminate any design issues before they actually implementtheir design on a breadboard.
While simulation may be considered adequate to some, we have found ben-efit in having students build and wire the circuits by hand on actual bread-boards thereby linking the practical and the theoretical. Tangible learningengages students and the haptic experience concretizes the concepts discussedin class. Constructing circuits can be frustrating because errors can arise fromdifferent sources making it difficult to locate and correct hardware bugs. Re-search has been done in this area to help students by visualizing the states ofcircuits. Toastboard [3] and CurrentViz [10] are two examples of educationaltools used with designing on actual breadboards. Toastboard provides mea-surement and visualization of voltage and CurrentViz provides measurementand visualization of current on a breadboard. They both rely on custom builtbreadboards not yet available for widespread use. These tools are more com-plex than our auto-checker/grader. The DLD auto-checker we propose can beeasily reproduced by others using only a Raspberry Pi.
3 Methodology
In this section, we demonstrate how to check the correctness of a simple DLDlab using Raspberry Pi. This example lab asks students to design and imple-ment a half adder that adds two single binary digits A and B to produce twooutputs S (sum) and C (carry). Its functionality is given by the block diagramand the truth table in Figure 1.
To auto-check the correctness of the lab work, the binary inputs must besupplied and the outputs must be read and checked against the expected out-puts given in the truth table. This can be done through GPIO signal pins ofa Raspberry Pi processor. The inputs and the outputs of the half adder canbe wired to any four chosen GPIO signal pins. Newer Pi models provide a
38

Figure 1: Half Adder Lab.
40-pin GPIO header with a layout as shown in Figure 2. For example, in thefigure, GPIO signal pin 22, which we will simply call GPIO pin 22, is found atphysical pin location #15 on the 40-pin GPIO header. As shown, we will usethe GPIO pins 27 and 22 for inputs A and B. We will use the GPIO pins 23and 24 for outputs S and C.
Figure 2: Raspberry Pi GPIO Pin header.
Some of the pins on the GPIO header are labeled 5V/3.3V and Ground.For most digital circuit labs that do not require much electrical power, thesepins can be a huge convenience to the user – they can be used to directly powerthe circuits without issue.
The I/O pins on the GPIO header can be programmed to be either inputor output pins. A pin programmed as an output can be programmaticallydriven to either high (1) or low (0). So an output GPIO pin can be used as abinary input to a digital circuit. A pin programmed as an input can be wired
39

to an output of a digital circuit and read to get the value of the digital output.Such reading can then be used to check against the expected result of a circuitoutput for correctness. For the pin allocation shown in Figure 2, GPIO pins 27and 22 should be programmed as output pins to provide digital inputs A andB. GPIO pins 23 and 24 should be programmed as input pins to check digitaloutputs S and C.
A script is then written to enable the auto-checking of the lab. We canwrite such script using a variety of scripting/programming languages such asPython and C/C++. Various GPIO driver libraries are available. GPIO Zero[8], a Python package, is one of the easiest. Using this package, each GPIOsignal pin can be abstracted into a Python object:
# Inputs to the circuit (outputs from Pi)gateInA = DigitalOutputDevice (27) # use GPIO pin 27 for AgateInB = DigitalOutputDevice (22) # use GPIO pin 22 for B
# Output from the circuit (inputs from Pi)gateOutC = DigitalInputDevice (24) # use GPIO pin 24 for CgateOutS = DigitalInputDevice (23) # use GPIO pin 23 for S
With these Python objects, the following code snippet tests the input com-bination (A = 1 and B = 0) and checks the actual output against its expectedoutput (C = 0 and S = 1):
# Set digital input (Pi output)gateInA.on() # A = 1gateInB.off() # B = 0
# Check digital output (Pi input)if gateOutS.isActive and gateOutC.value == 0:
print(`Pass ')else:
print(`Fail ')
The complete Python script for auto-checking the half adder DLD lab basedon this methodology is available here1.
4 Solution and Discussion
In the previous section we demonstrated how to use Raspberry Pi to auto-checka DLD lab in an ad-hoc fashion. Based on that approach without additionalwork, one would have to write a new script for each new lab. That is clearlynot ideal. Below we consider the problem of writing a generic script that canbe used for any DLD lab.
We will first present a generic script that works for any combinationalcircuit DLD lab. Due to the complexity of sequential circuits, a generic script
1https://drive.google.com/open?id=1gDH_CZjsIClylR-JeSceihJ0h6IZ2nNB
40
is not available at this time. Instead we will choose an example sequentialcircuit DLD lab and provide an ad-hoc solution to it to illustrate some of thecharacteristics specific to sequential circuits.
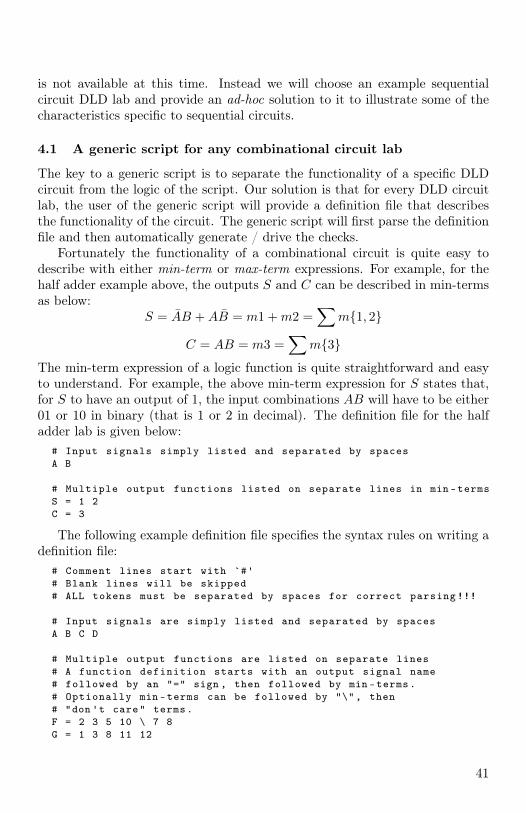
4.1 A generic script for any combinational circuit lab
The key to a generic script is to separate the functionality of a specific DLDcircuit from the logic of the script. Our solution is that for every DLD circuitlab, the user of the generic script will provide a definition file that describesthe functionality of the circuit. The generic script will first parse the definitionfile and then automatically generate / drive the checks.
Fortunately the functionality of a combinational circuit is quite easy todescribe with either min-term or max-term expressions. For example, for thehalf adder example above, the outputs S and C can be described in min-termsas below:
S = AB +AB = m1 +m2 =∑
m{1, 2}
C = AB = m3 =∑
m{3}
The min-term expression of a logic function is quite straightforward and easyto understand. For example, the above min-term expression for S states that,for S to have an output of 1, the input combinations AB will have to be either01 or 10 in binary (that is 1 or 2 in decimal). The definition file for the halfadder lab is given below:
# Input signals simply listed and separated by spacesA B
# Multiple output functions listed on separate lines in min -termsS = 1 2C = 3
The following example definition file specifies the syntax rules on writing adefinition file:
# Comment lines start with `#'# Blank lines will be skipped# ALL tokens must be separated by spaces for correct parsing !!!
# Input signals are simply listed and separated by spacesA B C D
# Multiple output functions are listed on separate lines# A function definition starts with an output signal name# followed by an "=" sign , then followed by min -terms.# Optionally min -terms can be followed by "\", then# "don 't care" terms.F = 2 3 5 10 \ 7 8G = 1 3 8 11 12
41

Our generic auto-grading script for any combinational circuit lab can befound here2. Roughly it does the following:
1. Parse the input definition file line by line (skip comment / blank lines)
(a) Parse the first line for input signals into a list of inputs
(b) Parse the rest of the lines each as an output function into a list of outputs
2. Generate and drive the checks
(a) Initialize a GPIO pin list for all GPIO pins available on a Raspberry Pi
(b) Check if there are enough GPIO pins for the inputs and the outputs
(c) For each input or output signal, allocate a GPIO pin from the GPIO pin list
(d) Print out instructions for the user to wire their circuit to Raspberry Pi
(e) For each binary combination of the inputs:
i. Drive the inputs to the circuitii. For each logic function:
A. Read the actual output and compare it with the expectedB. Print the test result (PASS or FAIL)
Digital circuit labs may have more signal lines than the number of GPIOpins available on a Raspberry Pi. Solutions are available to expand the numberof GPIO pins using off-the-shelf port expander IC chips such as MCP23017 andMCP23S17 [7].
4.2 An ad-hoc solution for an example sequential circuit lab
Unlike combinational circuits, the functionality of sequential circuits is notthat easy to describe depending on the types of the circuits. Some types ofsequential circuits can be relatively easy but others will likely be difficult. Forthis reason, we have not attempted a generic script for any sequential circuitlabs at this time.
In the following, however, to illustrate some of the characteristics specific tosequential circuits, we demonstrate the use of an ad hoc script that can auto-check a sequential circuit lab we gave to our students. The lab in question isa RAM lab, in which students are asked to build a circuit for a random accessmemory system as illustrated in Figure 3 using an Intel 2114 static RAM chip.
The operation of any sequential circuit such as the one for this RAM labrequires the control signals to be given in proper order. For example, theaddress must be provided before the chip is selected. Certain signals must bemaintained for a certain period of time to ensure proper operation. Togetherthese constraints require the steps to be properly sequenced and delays to beinserted at critical junctions in the script.
A code snippet that tests writing/reading to/from the RAM is given below:
2https://drive.google.com/open?id=1HZ0FEM45MOkO3MpQ2hUgkyUrqnQiEH4u
42

Figure 3: RAM Lab.
# Write value `val ' to address `addr 'setPins(addr , addrIn) # set address pins with `addr 'time.sleep (0.001) # address setup timesetPins(val , dil) # set data input lines with `val 'weIn.off() # write mode enabledcsIn.off() # chip selectedtime.sleep (0.001) # hold sufficient time for writecsIn.on() # chip deselected (after data written)weIn.on()time.sleep (0.001) # input data hold time
# Read from address `addr ' (data goes into `dat ')setPins(addr , addrIn) # set address pins with `addr 'time.sleep (0.001) # address setup timeweIn.on() # read mode enabledcsIn.off() # chip selectedtime.sleep (0.001) # hold sufficient time for readdat = readPins(dol) # read data from the data output linescsIn.on() # chip deselected (after data read)time.sleep (0.001) # output data off delay
In the above, we have inserted more delays than is required. Actual requireddelays can be shorter depending on the types of chips used. The complete scriptis given here3.
4.3 Discussion
We have successfully deployed this solution in two of our hardware-orientedcourses at our institution. For each DLD lab, we asked students to do a self-check with a Raspberry Pi. Student feedback has been all positive as it is easyto do. Students are reportedly more engaged. For any failed check, students
3https://drive.google.com/open?id=1C4Mt7QNvEt7uL73MQU5rxSkhShYiMlz5
43

were motivated to address their design and / or implementation issues. Failedchecks were often due to wrong wiring and misreading of the datasheets – thatis the whole point of the automated checks. We have not seen any studentsabandoning their labs in the last two years. Before this solution was deployed,we had no idea how many students failed or partially failed a lab without tellingus.
As currently implemented, this automated check is black box in nature –no details of the circuits are required for the script to run. Debugging help isnot supported but users can use the results of the auto-check as their guide totroubleshoot issues. It is debatable as to whether it helps to pinpoint exacterrors in their circuits with specialized tools such as Toastboard [3] when it isthe time for the students to develop their own debugging skills. In addition, tobe able to pinpoint the exact errors in a circuit, systems such as Toastboardhave to be provided with the exact schematics of the circuit along with theinformation on where each component is wired on the breadboard. This canbe quite complicated and hard to use.
5 Conclusions and Future Work
In this paper we presented a solution that can auto-check/grade digital logicdesign labs similar to autograders for programming assignments. Our solutionto auto-check a DLD lab is very simple to use. By taking advantage of the$35 Raspberry Pi with physical computing capability, the solution is also aninexpensive one.
This solution has been successfully used at our institution. It has helpedinstructors to greatly reduce the amount of manual work needed in the gradingof DLD labs. Students enjoy the solution because it is capable of providingquick feedback to them about their lab work. Such feedback encourages themto keep trying. The solution keeps students engaged at a higher level.
Moving forward a more generic solution for sequential circuit labs is anapparent direction worth pursuing. A simple outright solution may not beimmediately available but generic scripts for certain subtypes of sequentialcircuits are very likely.
44

References
[1] Carl Burch. Logisim. http://www.cburch.com/logisim/index.html,Accessed May 2, 2019.
[2] Turing’s Craft. CodeLab: A powerful tool for programming instruction.https://www.turingscraft.com, Accessed May 2, 2019.
[3] Daniel Drew, Julie L Newcomb, William McGrath, Filip Maksimovic,David Mellis, and Björn Hartmann. The Toastboard: Ubiquitous in-strumentation and automated checking of breadboarded circuits. In Pro-ceedings of the 29th Annual Symposium on User Interface Software andTechnology, pages 677–686. ACM, 2016.
[4] Rensselaer Center for Open Source. Submitty. https://submitty.org,Accessed May 2, 2019.
[5] Raspberry Pi Foundation. Raspberry Pi – Teach, Learn, and Make withRaspberry Pi. http://www.raspberrypi.org, Accessed May 2, 2019.
[6] Katy Jordan. Massive open online course completion rates revisited: As-sessment, length and attrition. The International Review of Research inOpen and Distributed Learning, 16(3), 2015.
[7] Derek Molloy. Exploring Raspberry Pi. Wiley Online Library, 2016.
[8] Ben Nuttall. GPIO Zero: A friendly Python API for physical com-puting. https://www.raspberrypi.org/blog/gpio-zero-a-friendly-python-api-for-physical-computing/, Accessed May 2, 2019.
[9] Carnegie Mellon University. Autolab Project. http://www.autolabproject.com/, Accessed May 2, 2019.
[10] Te-Yen Wu, Hao-Ping Shen, Yu-Chian Wu, Yu-An Chen, Pin-Sung Ku,Ming-Wei Hsu, Jun-You Liu, Yu-Chih Lin, and Mike Y Chen. Currentviz:Sensing and visualizing electric current flows of breadboarded circuits.In Proceedings of the 30th Annual ACM Symposium on User InterfaceSoftware and Technology, pages 343–349. ACM, 2017.
45
Similarity Matching in News Articles∗
Nathaniel Ballard and Deepti JoshiDepartment of Cyber and Computer Sciences
The CitadelCharleston, SC 29409
{nballard,djoshi}@citadel.edu
Abstract
With the need for intelligence growing every day, big data analyticshas become the forefront of intelligence work. Having the ability to accessnews archives and other news article databases have given a data analysta plethora of information to analyze, but which article is the same event,is there any redundant data within these collection sets of data? Thispaper expands on these questions. By implementing cosine similarityand vector space modeling, we can start to get a better understanding ofthe dataset. The results suggest that an article can be related to anotherarticle by topic or word semantics allowing now the creation of a web ofarticles that are similar or in some cases even the same.
1 Introduction
With most modern newspapers being available online, and now containingeasily accessible archives, access to big data has become more available to thepublic. However, this abundance of news articles leads to the question – isthere some way to automate the discovery of article relation without manuallyreading every single article? As of 2017, there were 30,948,149 total estimatedcirculations of U.S. weekday newspapers [6]. It is safe to say that many ifnot all of these articles contain different writing styles. So even though twoarticles may be about the same event or topic, different writing styles can makethem significantly distinct from each other. This makes the problem even moresignificant, where comparing large amounts of data with different writing styles
∗Copyright ©2019 by the Consortium for Computing Sciences in Colleges. Permission tocopy without fee all or part of this material is granted provided that the copies are not madeor distributed for direct commercial advantage, the CCSC copyright notice and the title ofthe publication and its date appear, and notice is given that copying is by permission of theConsortium for Computing Sciences in Colleges. To copy otherwise, or to republish, requiresa fee and/or specific permission.
46

can be daunting, but not impossible. There already exists natural languageprocessing (NLP) algorithms, latent semantic analysis (LSI) [3,1], and topicdetection algorithms [4,5] that can analyze plain-text documents for semanticstructure [2]. However, these existing algorithms do not account for differentwriting styles and semantics. In this paper, we outline one possible solutionthat solves the problems stated above in a clear and concise manner.
Currently, our work centers around the use of the algorithm developedby Radim Řehůřek named Gensim [2]. By compiling Gensim’s analysis forplain text documents, we have created a structure that can analyze newspaperarticles’ pairwise similarities based on different parameters such as the topicof the article, the primary actions in the article, the actors involved, or even afull redundancy of the article.
The paper is outlined as follows: Section 2 discusses the background ofGensim, why it was chosen, its features and how it will be implemented. Section3 presents the methodology of our ongoing work – the ideas behind the structureimplemented and how it is used in real time. Section 4 shows our preliminaryresults. We also analyze and expand the results to discuss the importance ofthis research. Finally, Section 5 presents the conclusion and future work.
2 Background
Figure 1: Vector Space Modelas a graph [4].
Gensim (gensim = “generate similarly”) is atopic detection modeling for humans algo-rithm developed by Radim Řehůřek for hisPh.D. thesis. This project uses Gensim’s al-gorithms to develop a structure to be usedto tackle our big data set and produce ef-fective results. Specifically, the solution usestwo sets of algorithms in Gensim’s “analyzeplain-text documents for semantic structure”[2] approach, namely, cosine similarity andvector space modeling. Vector space model-ing is known as the representation of docu-ments as vectors in common vector space [3].
Looking at Figure 1, sentence 1, sentence2, and sentence n can be treated as docu-ments on a vector space. Then when the documents are placed in the vectorspace model, Gensim uses cosine similarities to find the distance between eachof the articles.
~a ∗~b = ||~a||||~b||cosθ , where cosθ = ~a∗~b||~a||||~b||
47
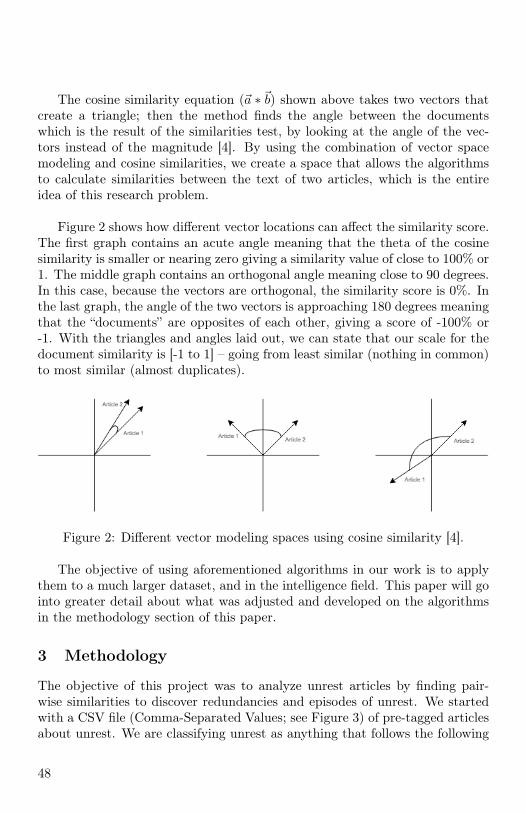
The cosine similarity equation (~a ∗~b) shown above takes two vectors thatcreate a triangle; then the method finds the angle between the documentswhich is the result of the similarities test, by looking at the angle of the vec-tors instead of the magnitude [4]. By using the combination of vector spacemodeling and cosine similarities, we create a space that allows the algorithmsto calculate similarities between the text of two articles, which is the entireidea of this research problem.
Figure 2 shows how different vector locations can affect the similarity score.The first graph contains an acute angle meaning that the theta of the cosinesimilarity is smaller or nearing zero giving a similarity value of close to 100% or1. The middle graph contains an orthogonal angle meaning close to 90 degrees.In this case, because the vectors are orthogonal, the similarity score is 0%. Inthe last graph, the angle of the two vectors is approaching 180 degrees meaningthat the “documents” are opposites of each other, giving a score of -100% or-1. With the triangles and angles laid out, we can state that our scale for thedocument similarity is [-1 to 1] – going from least similar (nothing in common)to most similar (almost duplicates).
Figure 2: Different vector modeling spaces using cosine similarity [4].
The objective of using aforementioned algorithms in our work is to applythem to a much larger dataset, and in the intelligence field. This paper will gointo greater detail about what was adjusted and developed on the algorithmsin the methodology section of this paper.
3 Methodology
The objective of this project was to analyze unrest articles by finding pair-wise similarities to discover redundancies and episodes of unrest. We startedwith a CSV file (Comma-Separated Values; see Figure 3) of pre-tagged articlesabout unrest. We are classifying unrest as anything that follows the following
48
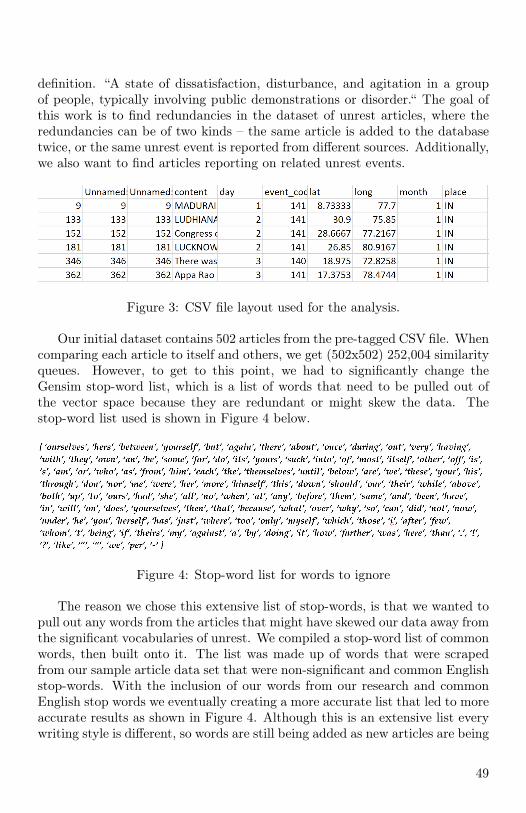
definition. “A state of dissatisfaction, disturbance, and agitation in a groupof people, typically involving public demonstrations or disorder.“ The goal ofthis work is to find redundancies in the dataset of unrest articles, where theredundancies can be of two kinds – the same article is added to the databasetwice, or the same unrest event is reported from different sources. Additionally,we also want to find articles reporting on related unrest events.
Figure 3: CSV file layout used for the analysis.
Our initial dataset contains 502 articles from the pre-tagged CSV file. Whencomparing each article to itself and others, we get (502x502) 252,004 similarityqueues. However, to get to this point, we had to significantly change theGensim stop-word list, which is a list of words that need to be pulled out ofthe vector space because they are redundant or might skew the data. Thestop-word list used is shown in Figure 4 below.
Figure 4: Stop-word list for words to ignore
The reason we chose this extensive list of stop-words, is that we wanted topull out any words from the articles that might have skewed our data away fromthe significant vocabularies of unrest. We compiled a stop-word list of commonwords, then built onto it. The list was made up of words that were scrapedfrom our sample article data set that were non-significant and common Englishstop-words. With the inclusion of our words from our research and commonEnglish stop words we eventually creating a more accurate list that led to moreaccurate results as shown in Figure 4. Although this is an extensive list everywriting style is different, so words are still being added as new articles are being
49
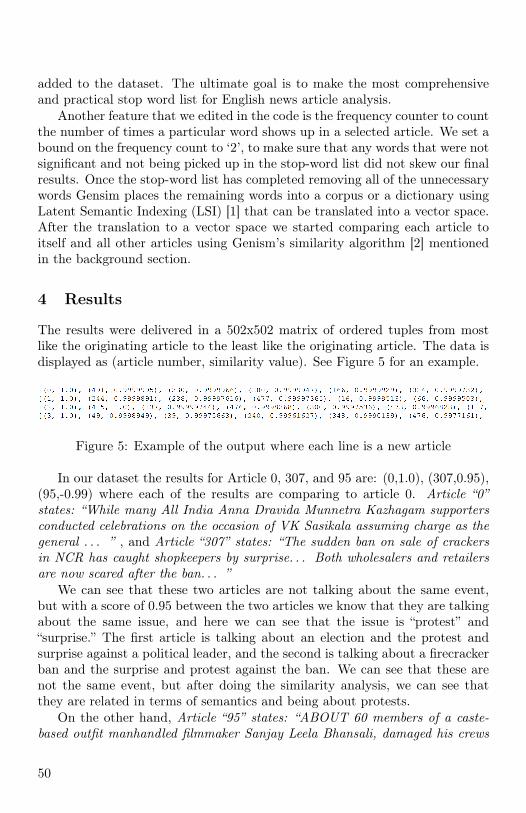
added to the dataset. The ultimate goal is to make the most comprehensiveand practical stop word list for English news article analysis.
Another feature that we edited in the code is the frequency counter to countthe number of times a particular word shows up in a selected article. We set abound on the frequency count to ‘2’, to make sure that any words that were notsignificant and not being picked up in the stop-word list did not skew our finalresults. Once the stop-word list has completed removing all of the unnecessarywords Gensim places the remaining words into a corpus or a dictionary usingLatent Semantic Indexing (LSI) [1] that can be translated into a vector space.After the translation to a vector space we started comparing each article toitself and all other articles using Genism’s similarity algorithm [2] mentionedin the background section.
4 Results
The results were delivered in a 502x502 matrix of ordered tuples from mostlike the originating article to the least like the originating article. The data isdisplayed as (article number, similarity value). See Figure 5 for an example.
Figure 5: Example of the output where each line is a new article
In our dataset the results for Article 0, 307, and 95 are: (0,1.0), (307,0.95),(95,-0.99) where each of the results are comparing to article 0. Article “0”states: “While many All India Anna Dravida Munnetra Kazhagam supportersconducted celebrations on the occasion of VK Sasikala assuming charge as thegeneral . . . ” , and Article “307” states: “The sudden ban on sale of crackersin NCR has caught shopkeepers by surprise. . . Both wholesalers and retailersare now scared after the ban. . . ”
We can see that these two articles are not talking about the same event,but with a score of 0.95 between the two articles we know that they are talkingabout the same issue, and here we can see that the issue is “protest” and“surprise.” The first article is talking about an election and the protest andsurprise against a political leader, and the second is talking about a firecrackerban and the surprise and protest against the ban. We can see that these arenot the same event, but after doing the similarity analysis, we can see thatthey are related in terms of semantics and being about protests.
On the other hand, Article “95” states: “ABOUT 60 members of a caste-based outfit manhandled filmmaker Sanjay Leela Bhansali, damaged his crews
50
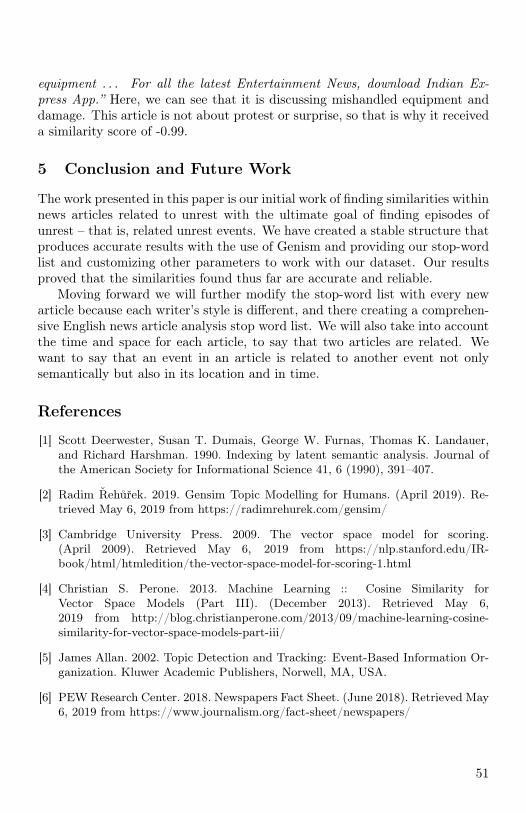
equipment . . . For all the latest Entertainment News, download Indian Ex-press App.” Here, we can see that it is discussing mishandled equipment anddamage. This article is not about protest or surprise, so that is why it receiveda similarity score of -0.99.
5 Conclusion and Future Work
The work presented in this paper is our initial work of finding similarities withinnews articles related to unrest with the ultimate goal of finding episodes ofunrest – that is, related unrest events. We have created a stable structure thatproduces accurate results with the use of Genism and providing our stop-wordlist and customizing other parameters to work with our dataset. Our resultsproved that the similarities found thus far are accurate and reliable.
Moving forward we will further modify the stop-word list with every newarticle because each writer’s style is different, and there creating a comprehen-sive English news article analysis stop word list. We will also take into accountthe time and space for each article, to say that two articles are related. Wewant to say that an event in an article is related to another event not onlysemantically but also in its location and in time.
References
[1] Scott Deerwester, Susan T. Dumais, George W. Furnas, Thomas K. Landauer,and Richard Harshman. 1990. Indexing by latent semantic analysis. Journal ofthe American Society for Informational Science 41, 6 (1990), 391–407.
[2] Radim Řehůřek. 2019. Gensim Topic Modelling for Humans. (April 2019). Re-trieved May 6, 2019 from https://radimrehurek.com/gensim/
[3] Cambridge University Press. 2009. The vector space model for scoring.(April 2009). Retrieved May 6, 2019 from https://nlp.stanford.edu/IR-book/html/htmledition/the-vector-space-model-for-scoring-1.html
[4] Christian S. Perone. 2013. Machine Learning :: Cosine Similarity forVector Space Models (Part III). (December 2013). Retrieved May 6,2019 from http://blog.christianperone.com/2013/09/machine-learning-cosine-similarity-for-vector-space-models-part-iii/
[5] James Allan. 2002. Topic Detection and Tracking: Event-Based Information Or-ganization. Kluwer Academic Publishers, Norwell, MA, USA.
[6] PEW Research Center. 2018. Newspapers Fact Sheet. (June 2018). Retrieved May6, 2019 from https://www.journalism.org/fact-sheet/newspapers/
51

Categorizing User Stories in the SoftwareEngineering Classroom∗
Brian T. Bennett and Tristan OnekDepartment of Computing
East Tennessee State UniversityJohnson City, TN 37614{bennetbt,onektr}@etsu.edu
Abstract
User story documentation is a significant aspect of Agile develop-ment in which developers document possible actions that users may takewithin a software system. It is essential to educate students in a softwareengineering curriculum on how to create this documentation so they canbe competent developers in their future careers. This study uses theINVEST user story rating system to assess user stories that studentswrote for a term project in a two-part software engineering course series.We demonstrate potential issues that students experience in user storycreation based on the INVEST analysis and propose potential solutionsto this problem.
1 Introduction
The use of agile development methodologies has increased in the software en-gineering industry since the signing of the Agile Manifesto [2] in 2001. Thismanifesto grew from the application of lean production principles to softwareengineering [4], and recognized that software development life cycles shouldfocus on customer interaction and user needs rather than copious amounts ofdocumentation. Therefore, the documentation focus of agile methods is writ-ing down system features in terms of user interactions. Many modern softwaresystems, such as web and mobile applications, involve heavy user interaction
∗Copyright ©2019 by the Consortium for Computing Sciences in Colleges. Permission tocopy without fee all or part of this material is granted provided that the copies are not madeor distributed for direct commercial advantage, the CCSC copyright notice and the title ofthe publication and its date appear, and notice is given that copying is by permission of theConsortium for Computing Sciences in Colleges. To copy otherwise, or to republish, requiresa fee and/or specific permission.
52

with the system, making documentation of such interactions imperative forcompleting the project successfully.
The most common form of agile requirements documentation is the userstory. User stories provide a lightweight method for documenting a user’sinteraction with a piece of software. The most common form of a user story is“As a <user role>, I want to <perform a task>, so I can <accomplish a goal>.”These short statements describe in a few words what a user would like to dowithin the system and why they would like to do it, but the story format isnot intended to describe how a developer should implement the feature. Userstories accomplish two things: (1) they allow customers to focus on each actionwithin the system, and (2) they provide developers with small, manageablechunks of work and with implementation freedom.
Teaching students the proper format for user stories and the motivationbehind this format is vital for creating well-prepared employees. In a soft-ware engineering curriculum, students should learn about and experience agilesoftware development through participation in a group project using agile con-cepts to create a modern software system effectively. Participation in an agileproject requires students to create and maintain a backlog of user stories as anintegral part of their education, addressing the Agile Manifesto’s [2] concernsfor customer and user interaction. However, many students are unable to write‘good’ user stories when they must first use the concept. This study aims tocategorize the problems found in student-produced user stories. We analyzeuser stories produced by software engineering students during group projectassignments and categorize them using the INVEST method developed by BillWake [5]. Locating the students’ weaknesses in user story design based uponthe INVEST principles can lead to appropriate revisions to the curriculum toprevent students from causing documentation debt in future class assignmentsand upon entering the industry. Based on the analysis and judgments made,we conclude how to better educate students about user story development anduse, while keeping the limitations of the study in mind.
2 Motivation
Despite how useful user stories are for documentation, researchers show thatlimitations exist when using them. Issues with poorly designed user stories canlead to issues with code based on those user stories. Mendes et al. [3] identifycommon issues with user stories and solutions to those issues, while Wake [5]gives a precise method for analyzing user stories that has become a standardfor determining story quality.
Mendes et al. [3] describe documentation debt as the impact of missing, in-adequate, or incomplete documents in a software engineering project. Mendes
53
et al.’s [3] goal is to analyze documentation debt instances in a software en-gineering case study through agile requirements. Artifacts like user storiesconstitute part of a project’s agile requirements [3]. These user stories cannotbe effective if certain causes lead to the aforementioned issues of incomplete-ness and insufficiency. Mendes et al. [3] define several common causes leadingto these issues, including a lack of information, requirement volatility, and lackof non-functional requirements (NFRs). For example, consider the followinguser story.
“Get the back end set up.”
The story is not user-centered and attempts to describe an NFR. It is alsonon-specific because it lacks information that is pertinent to the feature. Ithas no meaning to anyone other than the project team who created it; eventhe creators of this story could forget the meaning after time passes.
Students who create user stories should consider them carefully. One methodof performing careful consideration is through the INVEST mnemonic createdby Bill Wake [5] to assist with user story development and evaluation. Wake [5]observed that good user stories should be independent (I) from other stories toallow for easier scheduling. In addition, good stories should be negotiable (N)to give flexibility in implementation. Furthermore, good stories are valuable(V) to the customer and will show a return on the investment of developmenteffort. User stories should also be estimable (E) to allow for easier schedulingand prioritization. Another quality of good user stories is that they are small(S) in scope, effort, and description. Finally, Wake [5] notes that a good storyshould be testable (T) so developers can effectively write test cases for it. Fornovice software engineers, especially students, producing user stories that meetthese principles can be difficult.
The above studies provide considerations regarding the problem presentedin this research–improving the quality of student user stories. Good user storydesign should ultimately lead to a minimization of documentation debt toprevent other development issues from arising. If students understand howto write user stories that accurately reflect actions users will take, and canalso write stories to adhere to standards such as INVEST, they will be moreprepared to work effectively in their future careers.
3 Approach
This research uses the INVEST mnemonic [5] to assess students’ user stories.The INVEST system’s factors are significant because they consider the differentways that user stories may add business value to a project. In the softwareengineering curriculum, students learn about the importance of adding business
54

value throughout the development life-cycle. This system can be applied tostudent user stories to determine if they understand how to write stories thatwill result in increased business value. Students from several sections of twocourses were assessed–Software Engineering 1 and Software Engineering 2–from Spring 2018 to Spring 2019. In both courses, students were divided intogroups each semester to create a software system for a client and were requiredto write user stories for their projects. Students used the tracking software Jira[1] throughout each semester to track user stories, and this allowed for ease ofdata collection.
In total, seventeen projects were selected for analysis based on the avail-ability of user stories in these projects. Because of the availability of userstories, only seven projects were used from Software Engineering 1, while tenwere from Software Engineering 2. Ten user stories were chosen randomlyfrom each project, resulting in 170 user stories. Next, both authors assessedeach user story based on the INVEST criteria, quantifying each user story’sINVEST values using a binary system in which ‘0’ does not satisfy the cate-gory and ‘1’ satisfies the category. The authors’ scores were then averaged todetermine final ratings. The sums of the averaged values represent the userstory’s overall strength from 0 to 6, where 0 represents the worst score, and 6represents the best score. This assessment allows computation of how manyof the overall user stories are considered ‘good’ according to INVEST, and thenumber that adheres to each INVEST principle. These data points provideinsight into student performance and provide direction for updated instructionwith user stories in the software engineering classroom.
4 Results
Results are based on the 170 user stories analyzed using the INVEST method–70 stories from Software Engineering 1 and 100 stories from Software Engineer-ing 2. Figure 1 shows a histogram of INVEST scores. Only five user storiesreceived a perfect score (2.9%). The majority of user stories–101 (59.4%)–fellin the 4-5 range, with 5 being the most frequent value (32.35%). User sto-ries with INVEST scores in the range 0-3 accounted for 37.64% of the storiesanalyzed, with 22 (12.9%) stories having an INVEST score of 0.
Figure 2 shows the average overall scores for each INVEST characteristic(where 170 is the maximum) and the percentages of each. The highest scoringcharacteristic is value, with an average score of 122.5. Results indicate thatapproximately 72.1% of the user stories analyzed were estimated to be valuableto the customer. The next-highest characteristic is testability with an averagescore of 114 of 170 (67.1%). These numbers indicate that two out of everythree user stories contained enough information to write test cases for verifica-
55

Figure 1: Histogram of INVEST Scores in the analyzed data
tion. Similarly, 112.5 user stories were negotiable (66.2%), containing pertinentdetails without attempting to enforce a specific design. A total of 97 stories(57.1%) were considered small enough for agile development purposes. A to-tal of 93.5 (55.0%) user stories were considered estimable, providing enoughinformation to estimate the time required for the feature. The lowest scoring
Figure 2: Overall INVEST Scores and Percentages
56

Figure 3: Normalized INVEST Scores of user stories created in Software En-gineering 1 and Software Engineering 2
characteristic is independence, where only 83 (48.8%) of the user stories couldbe developed without dependency with others.
Figure 3 shows normalized details by course. This figure shows percentagesfor both Software Engineering 1 and Software Engineering 2 in each category.Because the two Software Engineering courses are intended to be taken as asequence, one would hypothesize Software Engineering 2 students would showimprovements over those in Software Engineering 1. However, results showthis is not the case. In each INVEST category, Software Engineering 1 stu-dents outperform Software Engineering 2 students. The largest difference is inthe independent category, where 58.6% of Software Engineering 1 user storiesare considered independent but only 42% of Software Engineering 2 stories areconsidered independent, a difference of 16.6%. Others with fairly large gapsinclude the negotiable (a gap of 13.8%) and small (a gap of 13.5%) character-istics. The smallest gap (2.9%) is in the testability characteristic.
5 Discussion and Future Work
The assessments on student user stories indicate that students are more capa-ble of fulfilling some INVEST characteristics than others. This leads to theconclusion that students must learn not only how to write a user story butalso what components should be present and why those components are nec-essary. Students demonstrate a stronger capacity to make user stories testable
57

and valuable, but these alone do not make a user story complete under theINVEST criteria. Independence, estimation, and breaking stories into smallerfeatures should be enforced when teaching user story development. Becausescores dropped in the second course of the sequence, INVEST principles mustcontinue to be reinforced when requiring students to write user stories through-out the course sequence.
To reinforce INVEST principles, which also support proper developmentpractices, students must receive consistent reinforcement on how to create gooduser stories. Assessing student documentation abilities should be not done oncebut multiple times through both courses. Thoroughly reviewing students’ userstories at each stage of the group project and placing more focus on the qualityof this documentation can help students develop better habits with user storycreation and can also serve as a way to demonstrate how important user storiesare. This focus on reviewing documentation ideally leads to less documentationdebt both in the group projects assigned and in future industry jobs.
Some limitations exist within this study that could affect the stated con-clusions. First, this study is dependent on the INVEST system rather thanother rating systems that may have a more comprehensive picture of user storyquality. Evaluating other review systems may prevent this conclusion from be-ing entirely dependent on one system. Second, the study required the manualrating of each user story, which is subjective. Although having two peoplescoring each story attempted to mitigate this limitation, having more peoplescoring stories would be ideal. Third, the study involved a small sample sizeof only 170 user stories. Randomly choosing 10 stories from 17 projects couldaffect results by missing problems that exist but were not selected for analysis.However, the data set will continue to expand in future semesters.
This study provides a brief analysis of common issues with user stories insoftware engineering education with a proposed solution to mitigate some ofthese issues. The conclusions and reviewed literature in this study may serve asa basis for future experiments that assess software engineering students acrossdifferent performance metrics. Future analysis may take the form of the casestudy that Mendes et al. [3] performed, except that students would be analyzedinstead of professional software engineers. This would provide similar insightsthat Mendes et al. [3] collected, but would be through an academic rather thanan industry context. By focusing on the academic context and understandingits significance, however, students can receive appropriate training on essentialmatters such as documentation before transitioning into their career paths.
58

References
[1] Jira. https://www.atlassian.com/software/jira.
[2] Manifesto for agile software development. https://agilemanifesto.org/.
[3] Thiago Souto Mendes, Mário André De F. Farias, Manoel Mendonça, Hen-rique Frota Soares, Marcos Kalinowski, and Rodrigo Oliveira Spínola. Im-pacts of agile requirements documentation debt on software projects. Pro-ceedings of the 31st Annual ACM Symposium on Applied Computing - SAC16, 2016.
[4] I. Nonaka and H. Takeuchi. The new new product development game.Harvard Business Review, 64(1), 1986.
[5] Bill Wake. Invest in good stories, and smart tasks, 2013. https://xp123.com/articles/invest-in-good-stories-and-smart-tasks/.
59

Rethinking the Role of Simulation inComputer Networks Education∗
Qian LiuMathematics and Computer Science Department
Rhode Island CollegeProvidence, RI 02908
Abstract
Fundamentals in Computer Networks are essential to one’s deep un-derstanding of network internals. In general, simulators are used in intro-ductory networking courses to illustrate abstract concepts and to helpstudents observe network behavior without requiring dedicated hard-ware. However, due to their limitations, they don’t provide ways forstudents to investigate some essential topics. In this paper, we intro-duce several activities for students to practice, investigate, and learnthose underlying essentials in detail. Our activities create a personalizedlearning environment in which students can learn things at their ownpace and explore topics based on their interests. Our study indicatesthat students have achieved a better understanding of network internalsand have gained practical skills after these activities.
1 Introduction
Simulation is typically used in Computer Networks courses to illustrate networkfundamentals and to emulate various scenarios without requiring dedicatedhardware. In general, a typical undergraduate networking course focuses onthe topics listed in Table 1 although there are often differences in the teachingorder or covered depth. Various simulations are introduced and used in dif-ferent ways to illustrate those topics. Some are using simulation applets [9, 7]
∗Copyright ©2019 by the Consortium for Computing Sciences in Colleges. Permission tocopy without fee all or part of this material is granted provided that the copies are not madeor distributed for direct commercial advantage, the CCSC copyright notice and the title ofthe publication and its date appear, and notice is given that copying is by permission of theConsortium for Computing Sciences in Colleges. To copy otherwise, or to republish, requiresa fee and/or specific permission.
60
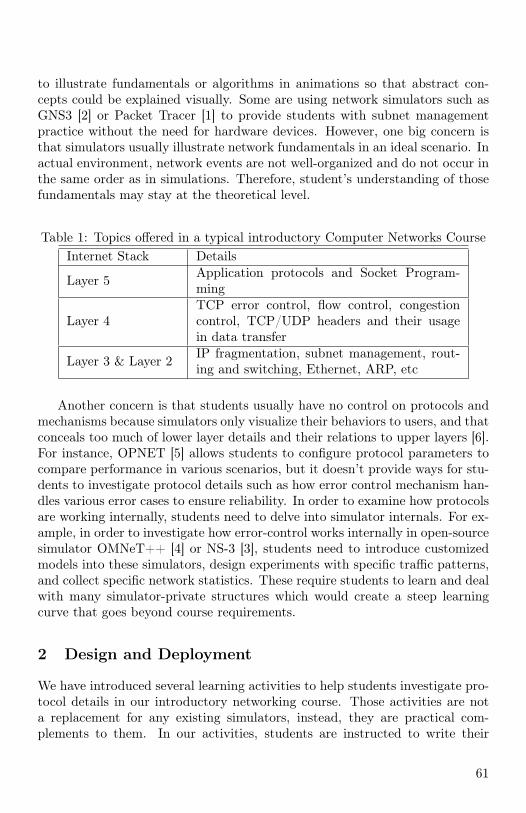
to illustrate fundamentals or algorithms in animations so that abstract con-cepts could be explained visually. Some are using network simulators such asGNS3 [2] or Packet Tracer [1] to provide students with subnet managementpractice without the need for hardware devices. However, one big concern isthat simulators usually illustrate network fundamentals in an ideal scenario. Inactual environment, network events are not well-organized and do not occur inthe same order as in simulations. Therefore, student’s understanding of thosefundamentals may stay at the theoretical level.
Table 1: Topics offered in a typical introductory Computer Networks CourseInternet Stack Details
Layer 5 Application protocols and Socket Program-ming
Layer 4TCP error control, flow control, congestioncontrol, TCP/UDP headers and their usagein data transfer
Layer 3 & Layer 2 IP fragmentation, subnet management, rout-ing and switching, Ethernet, ARP, etc
Another concern is that students usually have no control on protocols andmechanisms because simulators only visualize their behaviors to users, and thatconceals too much of lower layer details and their relations to upper layers [6].For instance, OPNET [5] allows students to configure protocol parameters tocompare performance in various scenarios, but it doesn’t provide ways for stu-dents to investigate protocol details such as how error control mechanism han-dles various error cases to ensure reliability. In order to examine how protocolsare working internally, students need to delve into simulator internals. For ex-ample, in order to investigate how error-control works internally in open-sourcesimulator OMNeT++ [4] or NS-3 [3], students need to introduce customizedmodels into these simulators, design experiments with specific traffic patterns,and collect specific network statistics. These require students to learn and dealwith many simulator-private structures which would create a steep learningcurve that goes beyond course requirements.
2 Design and Deployment
We have introduced several learning activities to help students investigate pro-tocol details in our introductory networking course. Those activities are nota replacement for any existing simulators, instead, they are practical com-plements to them. In our activities, students are instructed to write their
61

own “simulators” to delve into topics listed in Table 1 that are not fully cov-ered or cannot be examined by existing simulators. Students are working ingroups, using socket library to build simulators. Unlike existing learning mod-els [11, 12, 10] that arrange students to work in specific framework, students inour activities are not limited in any context, and they can introduce customizedmodels or extensions to explore topics based on their interests and learn thingsat their own pace.
2.1 Activity 1: Error Control Model
Figure 1: Basic Algorithms in Activity 1
In this activity, students are using socket model to simulate techniquesin error-control mechanism: acknowledgement and retransmission, which notonly are important to understand transport layer, but also have significanteffect on the design of other networks, for instance, InfiniBand [8] uses similartechniques to ensure reliability in its transport layer. Students are instructed tobuild their simulators on top of TCP. A random packet discarder is introducedto discard packets (simulate packet loss), depending on a configurable “lossrate” parameter. That is, after receiving a packet, receiver runs the discarderto decide whether the current packet should be discarded “manually” as if itwas not received previously. Figure 1 lists the basic algorithms used in thissimulator. The reasons we use TCP and a random packet discarder, instead ofimplementing those features on UDP, are:
• students have control on the loss rate and can simply adjust it to comparedifferent scenarios.
• It can create a personalized learning environment in which students couldlearn essential error-control techniques at their own pace. For instance,
62
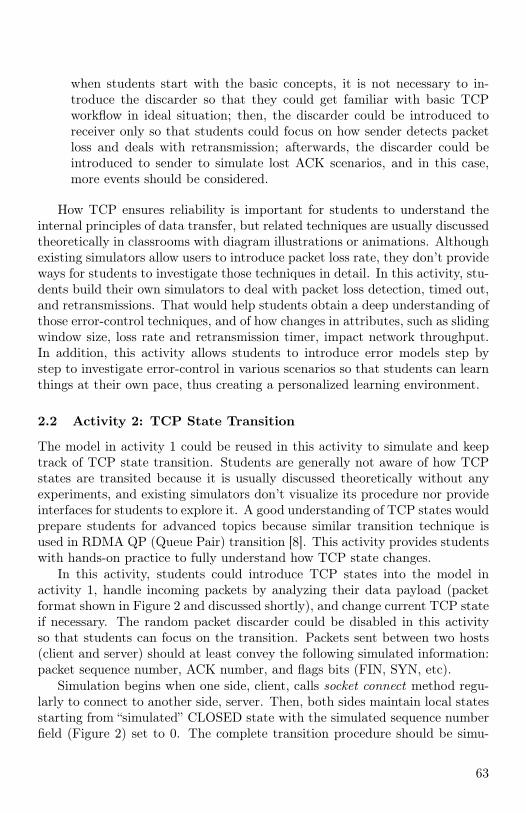
when students start with the basic concepts, it is not necessary to in-troduce the discarder so that they could get familiar with basic TCPworkflow in ideal situation; then, the discarder could be introduced toreceiver only so that students could focus on how sender detects packetloss and deals with retransmission; afterwards, the discarder could beintroduced to sender to simulate lost ACK scenarios, and in this case,more events should be considered.
How TCP ensures reliability is important for students to understand theinternal principles of data transfer, but related techniques are usually discussedtheoretically in classrooms with diagram illustrations or animations. Althoughexisting simulators allow users to introduce packet loss rate, they don’t provideways for students to investigate those techniques in detail. In this activity, stu-dents build their own simulators to deal with packet loss detection, timed out,and retransmissions. That would help students obtain a deep understanding ofthose error-control techniques, and of how changes in attributes, such as slidingwindow size, loss rate and retransmission timer, impact network throughput.In addition, this activity allows students to introduce error models step bystep to investigate error-control in various scenarios so that students can learnthings at their own pace, thus creating a personalized learning environment.
2.2 Activity 2: TCP State Transition
The model in activity 1 could be reused in this activity to simulate and keeptrack of TCP state transition. Students are generally not aware of how TCPstates are transited because it is usually discussed theoretically without anyexperiments, and existing simulators don’t visualize its procedure nor provideinterfaces for students to explore it. A good understanding of TCP states wouldprepare students for advanced topics because similar transition technique isused in RDMA QP (Queue Pair) transition [8]. This activity provides studentswith hands-on practice to fully understand how TCP state changes.
In this activity, students could introduce TCP states into the model inactivity 1, handle incoming packets by analyzing their data payload (packetformat shown in Figure 2 and discussed shortly), and change current TCP stateif necessary. The random packet discarder could be disabled in this activityso that students can focus on the transition. Packets sent between two hosts(client and server) should at least convey the following simulated information:packet sequence number, ACK number, and flags bits (FIN, SYN, etc).
Simulation begins when one side, client, calls socket connect method regu-larly to connect to another side, server. Then, both sides maintain local statesstarting from “simulated” CLOSED state with the simulated sequence numberfield (Figure 2) set to 0. The complete transition procedure should be simu-
63

Figure 2: Packet Format in our Activities
lated, that is, from one side sends a SYN packet (a packet with the SYN bitset) to initiate a (simulated) connection request, to one side sends a FIN packetto terminate the “simulated” connection. Both sides should move local statesappropriately in response to different flag bits. The sequence number and ACKnumber fields must also be considered, for instance, if one sends a packet withSYN and ACK bits set (connection reply) and receives a packet with ACK bitset only, then the sequence number in the ACK packet must match the ACKnumber in the connection reply packet sent previously, otherwise, the TCPstate cannot transit to the “simulated” ESTABLISHED state.
2.3 Activity 3: Segmentation and Fragmentation
In this activity, students implement the basic arithmetic operations of TCPsegmentation and IP fragmentation in their simulations with several inputparameters: a (pseudo) destination IPv4 address, a port number, message size,and a sequence of MTUs in which each value represents the MTU supportedby a (pseudo) router, therefore, the list of MTUs simulates the path of routersbetween the local host and destination. The MSS value is set to the max MTUvalue of the list minus 40 (TCP and IP headers). Students should divide the(pseudo) message into segments and encapsulate them with appropriate TCPand IP headers in their simulations, that means, students should build a packetstructure in their programs to simulate TCP header and IPv4 header exactly,and fill out necessary fields in these headers, especially the sequence numberand port number in TCP header, and the length, DF, MF, fragment offsetfields in IP header. When a packet traverses a “pseudo” router with MTU lessthan the packet length, the packet should be broken it into multiple fragmentsbased on fragmentation policy. When a packet leaves the last “router”, it shouldbe buffered, if necessary, and re-constructed into a complete TCP segment.
This simulation provides students with hands-on practice in protocol head-ers, segmentation, and fragmentation; generally, the latter two are discussedwithout programming exercises in a typical networking course. Running pingcommand on a physical host would allow one to observe the fragmented packetsbut not the internal principles. This model helps students comprehend whenand how external networks handle segmentation and fragmentation.
64

2.4 Activity 4: MAC Table and ARP
Students are instructed to implement switch self-learning capability and ARPprocedure in a simple star topology consisting of a switch and eight host ob-jects. Initially, each host object has a (pre-assigned) IPv4 address and anempty ARP cache table, and the switch object has an empty MAC table. Inorder to clearly reflect the link layer internals, we introduce a mechanism calledsoftMAC that automatically converts an IPv4 address to a MAC address. ThesoftMAC conversion is simple: it attaches 16 bits of 0s at the front of a givenIP address to generate a MAC address.That means, a host with IP a.b.c.d hasMAC address 0-0-a-b-c-d. The simulation begins when a host sends a datapacket to a random selected host. The sending host should follow the ARPlook up procedure and send ARP request if necessary. The switch then checksits MAC table to decide where to forward the packet and whether it has learntthe MAC address. When a host receives a packet, it first determines the typeof the packet (ARP or data packet) and then sends a new data packet to anew random selected host to continue the simulation if necessary. All hostsperform random communication until the switch records all MACs in its table,then the simulation stops.
Students could introduce more extensions in this model to gain better com-prehension of link layer mechanisms. For instance, if MAC table aging timeis introduced, what would happen if the switch object receives a packet butdoesn’t know where to forward it (difference between broadcasting and flood-ing). In addition, they would learn how to simulate sending/receiving by usingcertain events instead of generating actual traffic, for instance, they could reg-ister an event with pre-defined structure into a list in which each event will beexecuted in the future based on its timer. This is the general way modern sim-ulators use, and we hope this activity would help students conduct advancedresearch in the future.
3 Results
We use these activities in our introductory networking course at undergraduatelevel with the objective of engaging students in effective learning and helpingthem comprehend core techniques in transport layer, network layer, and linklayer. For each activity, we give two tests in a stepwise learning process. Wefirst take a test after lecture and practice in network simulators, dependingon topics we discussed, then, students work in our activities, and after that,we give another test on the same topics but with more advanced questions.Finally, we grade these tests and review student progress. Figure 3 (aggregated)shows grades comparison and the percentage of students making common errorsbefore and after taking those activities. They indicate that students have
65
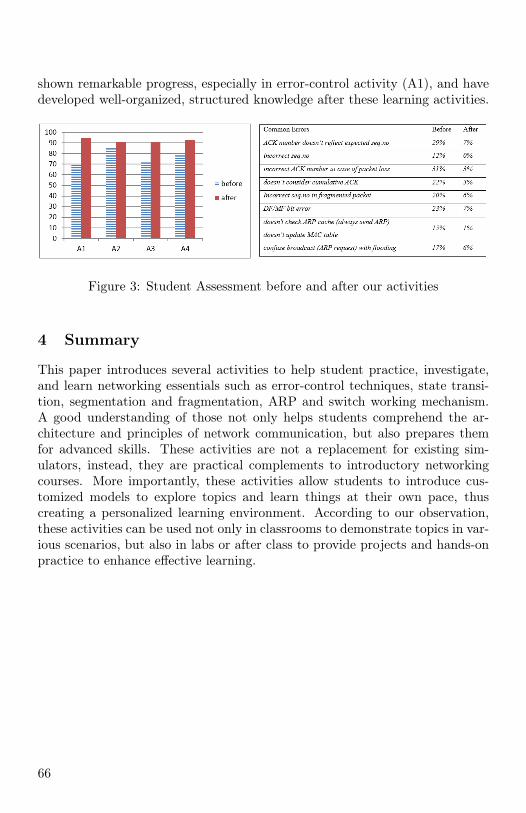
shown remarkable progress, especially in error-control activity (A1), and havedeveloped well-organized, structured knowledge after these learning activities.
Figure 3: Student Assessment before and after our activities
4 Summary
This paper introduces several activities to help student practice, investigate,and learn networking essentials such as error-control techniques, state transi-tion, segmentation and fragmentation, ARP and switch working mechanism.A good understanding of those not only helps students comprehend the ar-chitecture and principles of network communication, but also prepares themfor advanced skills. These activities are not a replacement for existing sim-ulators, instead, they are practical complements to introductory networkingcourses. More importantly, these activities allow students to introduce cus-tomized models to explore topics and learn things at their own pace, thuscreating a personalized learning environment. According to our observation,these activities can be used not only in classrooms to demonstrate topics in var-ious scenarios, but also in labs or after class to provide projects and hands-onpractice to enhance effective learning.
66

References
[1] Cisco Packet Tracer.https://www.netacad.com/courses/packet-tracer.
[2] GNS3 Simulator. https://www.gns3.com/.
[3] NS-3. https://www.nsnam.org/.
[4] OMNeT++ Discrete Event Simulator. https://omnetpp.org/.
[5] OPNET Simulator.https://www.riverbed.com/products/steelcentral/opnet.html.
[6] D. Feinberg. Teaching Simplified Network Protocols. In Proceedings ofthe 41st ACM technical symposium on Computer science education, Mar.2010.
[7] M. Holiday. Animation of computer networking concepts. In Journal onEducational Resources in Computing, 3(2), Jun. 2003.
[8] InfiniBand Trade Association. Infiniband Architecture SpecificationVolume 1, Release 1.3, March 2015.
[9] J. Kurose and K. Ross. Computer Networking: A Top-Down Approach(7th edition). Pearson, 2016.
[10] K. Lee, J. Kim, and S. Moon. An educational networking framework forfull layer implementation and testing. In Proceedings of the 46th ACMTechnical Symposium on Computer Science Education, Mar. 2015.
[11] J. M. Pullen. Teaching network protocol concepts in an open-sourcesimulation environment. In Proceedings of the 23rd Annual ACMConference on Innovation and Technology in Computer ScienceEducation, Jul. 2018.
[12] W. Zhu. Hands-on network programming projects in the cloud. InProceedings of the 46th ACM Technical Symposium on Computer ScienceEducation, Mar. 2015.
67
Detecting Areas of Social UnrestThrough Natural LanguageProcessing on Social Media∗
Timothy Clark and Deepti JoshiDepartment of Cyber and Computer Sciences
The CitadelCharleston, SC 29409
{tclark6,djoshi}@citadel.edu
Abstract
With the growing use of internet and social media as a source fornews, information is becoming faster and easier to access than ever be-fore. The rise of internet and social media has also brought a voice toa much broader demographic. With this, each user has the ability totake the role of an active reporter, creating a massive amount of dataon ongoing events. The goal of this research is to collect and review thisdata, from Twitter in particular, to detect, analyze, and display eventsof Social Unrest in India, Pakistan, and Bangladesh.
1 Introduction
From humble beginnings as amateur community platforms, social media hasrapidly blossomed into a complex web of global information and online inter-action [4]. Due to this, many have turned to social media as an outlet to voicetheir views and opinions on the communities, cities, and countries in whichthey live. Not only does this create a broader spectrum of view points aboutvarious events, but the response time in relation to those events far exceedsthat of conventional news. As pointed out by TwitterStand: News in Tweets,there have been several events that show mass amounts of tweets pertaining
∗Copyright ©2019 by the Consortium for Computing Sciences in Colleges. Permission tocopy without fee all or part of this material is granted provided that the copies are not madeor distributed for direct commercial advantage, the CCSC copyright notice and the title ofthe publication and its date appear, and notice is given that copying is by permission of theConsortium for Computing Sciences in Colleges. To copy otherwise, or to republish, requiresa fee and/or specific permission.
68
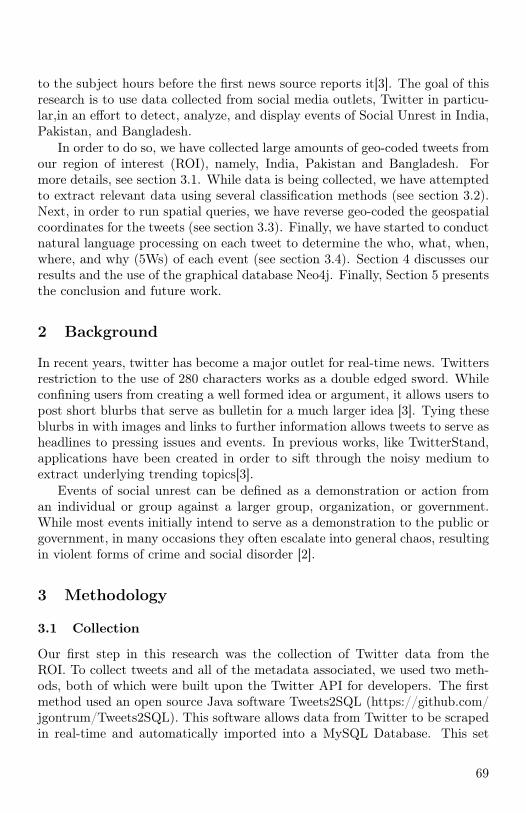
to the subject hours before the first news source reports it[3]. The goal of thisresearch is to use data collected from social media outlets, Twitter in particu-lar,in an effort to detect, analyze, and display events of Social Unrest in India,Pakistan, and Bangladesh.
In order to do so, we have collected large amounts of geo-coded tweets fromour region of interest (ROI), namely, India, Pakistan and Bangladesh. Formore details, see section 3.1. While data is being collected, we have attemptedto extract relevant data using several classification methods (see section 3.2).Next, in order to run spatial queries, we have reverse geo-coded the geospatialcoordinates for the tweets (see section 3.3). Finally, we have started to conductnatural language processing on each tweet to determine the who, what, when,where, and why (5Ws) of each event (see section 3.4). Section 4 discusses ourresults and the use of the graphical database Neo4j. Finally, Section 5 presentsthe conclusion and future work.
2 Background
In recent years, twitter has become a major outlet for real-time news. Twittersrestriction to the use of 280 characters works as a double edged sword. Whileconfining users from creating a well formed idea or argument, it allows users topost short blurbs that serve as bulletin for a much larger idea [3]. Tying theseblurbs in with images and links to further information allows tweets to serve asheadlines to pressing issues and events. In previous works, like TwitterStand,applications have been created in order to sift through the noisy medium toextract underlying trending topics[3].
Events of social unrest can be defined as a demonstration or action froman individual or group against a larger group, organization, or government.While most events initially intend to serve as a demonstration to the public orgovernment, in many occasions they often escalate into general chaos, resultingin violent forms of crime and social disorder [2].
3 Methodology
3.1 Collection
Our first step in this research was the collection of Twitter data from theROI. To collect tweets and all of the metadata associated, we used two meth-ods, both of which were built upon the Twitter API for developers. The firstmethod used an open source Java software Tweets2SQL (https://github.com/jgontrum/Tweets2SQL). This software allows data from Twitter to be scrapedin real-time and automatically imported into a MySQL Database. This set
69
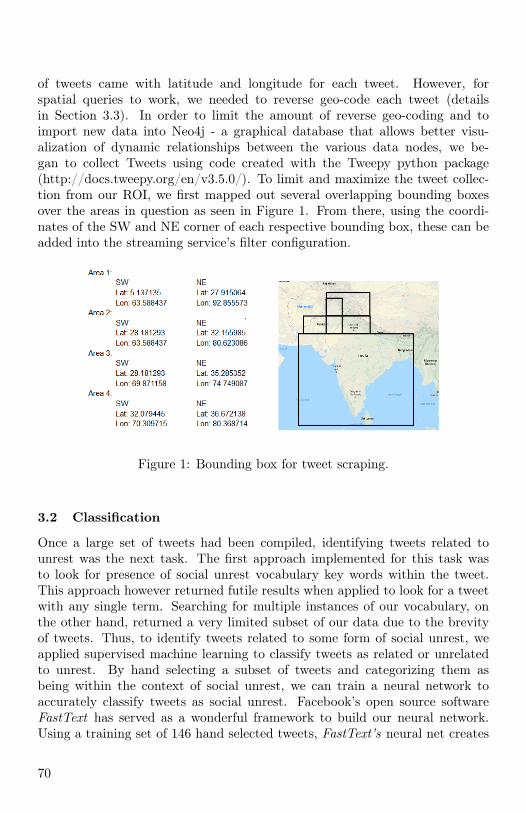
of tweets came with latitude and longitude for each tweet. However, forspatial queries to work, we needed to reverse geo-code each tweet (detailsin Section 3.3). In order to limit the amount of reverse geo-coding and toimport new data into Neo4j - a graphical database that allows better visu-alization of dynamic relationships between the various data nodes, we be-gan to collect Tweets using code created with the Tweepy python package(http://docs.tweepy.org/en/v3.5.0/). To limit and maximize the tweet collec-tion from our ROI, we first mapped out several overlapping bounding boxesover the areas in question as seen in Figure 1. From there, using the coordi-nates of the SW and NE corner of each respective bounding box, these can beadded into the streaming service’s filter configuration.
Figure 1: Bounding box for tweet scraping.
3.2 Classification
Once a large set of tweets had been compiled, identifying tweets related tounrest was the next task. The first approach implemented for this task wasto look for presence of social unrest vocabulary key words within the tweet.This approach however returned futile results when applied to look for a tweetwith any single term. Searching for multiple instances of our vocabulary, onthe other hand, returned a very limited subset of our data due to the brevityof tweets. Thus, to identify tweets related to some form of social unrest, weapplied supervised machine learning to classify tweets as related or unrelatedto unrest. By hand selecting a subset of tweets and categorizing them asbeing within the context of social unrest, we can train a neural network toaccurately classify tweets as social unrest. Facebook’s open source softwareFastText has served as a wonderful framework to build our neural network.Using a training set of 146 hand selected tweets, FastText’s neural net creates
70
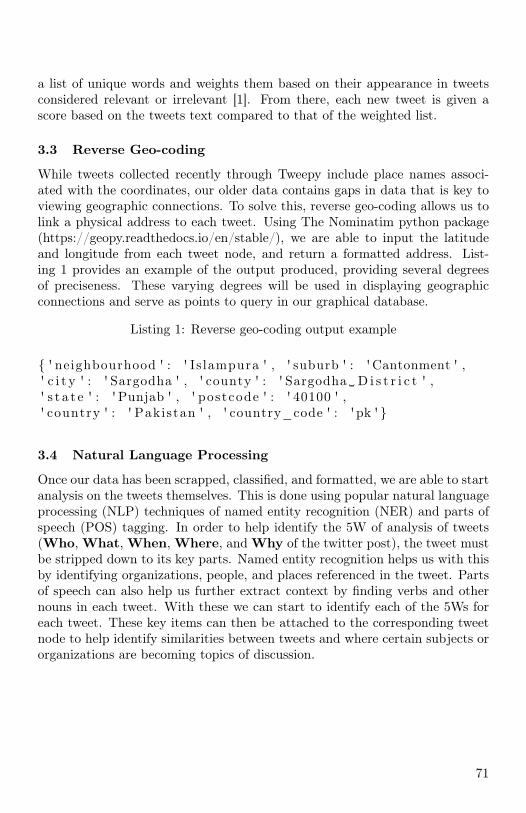
a list of unique words and weights them based on their appearance in tweetsconsidered relevant or irrelevant [1]. From there, each new tweet is given ascore based on the tweets text compared to that of the weighted list.
3.3 Reverse Geo-coding
While tweets collected recently through Tweepy include place names associ-ated with the coordinates, our older data contains gaps in data that is key toviewing geographic connections. To solve this, reverse geo-coding allows us tolink a physical address to each tweet. Using The Nominatim python package(https://geopy.readthedocs.io/en/stable/), we are able to input the latitudeand longitude from each tweet node, and return a formatted address. List-ing 1 provides an example of the output produced, providing several degreesof preciseness. These varying degrees will be used in displaying geographicconnections and serve as points to query in our graphical database.
Listing 1: Reverse geo-coding output example
{ ' neighbourhood ' : ' Is lampura ' , ' suburb ' : 'Cantonment ' ,' c i t y ' : ' Sargodha ' , ' county ' : ' Sargodha␣ D i s t r i c t ' ,' s t a t e ' : 'Punjab ' , ' postcode ' : ' 40100 ' ,' country ' : ' Pakistan ' , ' country_code ' : 'pk ' }
3.4 Natural Language Processing
Once our data has been scrapped, classified, and formatted, we are able to startanalysis on the tweets themselves. This is done using popular natural languageprocessing (NLP) techniques of named entity recognition (NER) and parts ofspeech (POS) tagging. In order to help identify the 5W of analysis of tweets(Who, What, When, Where, and Why of the twitter post), the tweet mustbe stripped down to its key parts. Named entity recognition helps us with thisby identifying organizations, people, and places referenced in the tweet. Partsof speech can also help us further extract context by finding verbs and othernouns in each tweet. With these we can start to identify each of the 5Ws foreach tweet. These key items can then be attached to the corresponding tweetnode to help identify similarities between tweets and where certain subjects ororganizations are becoming topics of discussion.
71

4 Results
From our research, we now have a strong data set that can be used to identifykey events of social unrest in our ROI. With our classification techniques weare able to identify tweets with accuracy of 77% based on a testing our neuralnet with a training set of 110 and and a testing set of 36. From our reversegeo-coding, we can now filter events based on key geographical points, as wellas map coordinate points to view concentrations of social unrest tweets (seeFigure 2). Lastly, our NLP strategies will allow us to set a foundation for topicdetection by identifying the 5Ws for each tweet. Associating each tweet with aWho, What, When, Where, and Why, also provides further points to be usedto filter data to analyze.
Figure 2: Heatmap of identified social unrest tweets
To compliment our research we have began the development on a web appli-cation to serve as an easy way to access, query and display every aspect of ourdata. Tying in our named entity recognition software, the text visualizationtool is able to view text of tweets with each entity annotated and highlighted.Also, as stated before, with the use of the graphical database system Neo4j, wehave the ability to create visual representations of each data point and the re-lations that connect each point. Figure 3 gives an example of how our databasedisplays the geographic connections of tweets. In this example, each countrynode is linked with several nodes representing the cities residing in that coun-try. Each city node is then connected with all tweets posted from that specificcity or region. Note that the example graph is only partially expanded.
72

Figure 3: Neo4j graphical representation of Twitter data
5 Conclusion and Future Work
From this research, tweets can now successfully be processed to complete 5Wanalysis. Moving forward we hope to incorporate more elements of twitter, i.e.the use of hashtags and emojis, as another way to fill in components of the5W analysis as well as start to analyze sentiment. Other aspects of of futurework include refining our training set and classification methods to increasedetection accuracy. As we further our research, we will also begin to expandour ROI into more countries. With this the importance of translating tweetswhile maintaining sentiment value will become pertinent in our research.
References
[1] Armand Joulin, Edouard Grave, Piotr Bojanowski, and TomasMikolov. Bag of tricks for efficient text classification. arXiv preprintarXiv:1607.01759, 2016.
[2] Fengcai Qiao, Pei Li, Xin Zhang, Zhaoyun Ding, Jiajun Cheng, and HuiWang. Predicting social unrest events with hidden markov models usinggdelt. Discrete Dynamics in Nature Society, pages 1 – 13, 2017.
[3] Jagan Sankaranarayanan, Hanan Samet, Benjamin E. Teitler, Michael D.Lieberman, and Jon Sperling. Twitterstand: News in tweets. In Proceedingsof the 17th ACM SIGSPATIAL International Conference on Advances inGeographic Information Systems, GIS ’09, pages 42–51, New York, NY,USA, 2009. ACM.
[4] J. van Dijck. The Culture of Connectivity: A Critical History of SocialMedia. Oxford Scholarship online. OUP USA, 2013.
73

Take Note: An Investigation ofTechnology on the Line Note Taking
Process in the Theatre∗
René Borr and Valerie SummetMathematics and Computer Science
Rollins CollegeWinter Park, FL 32789{rborr,vsummet}@rollins.edu
Abstract
The very nature of theatre is that every performance is unique, whichestablishes one of the main challenges when creating technology to beused in the theatrical setting. Often, technology used in the theatre isadapted from another field such as art, music, lighting or construction.This paper discusses the design, creation, and evaluation of a softwareprogram to help stage managers take line notes during rehearsal for the-atrical productions.
1 Problem and Background
Before a play or musical can be seen by an audience, it must be fully rehearsedand have a series of full runs. A full run of a production occurs during arehearsal when the show is performed in its entirety without any of the technicalelements such as lighting, sound, or costumes. The stage manager is in chargeof ensuring that the production as a whole goes smoothly by working alongsidethe actors, designers, and technicians. During a full run, the stage manageralso takes line notes. Line notes serve as feedback to the actors and indicatewhat they said on stage versus what they should have said according to thescript. Unfortunately, all current methods – including handwritten notes on a
∗Copyright ©2019 by the Consortium for Computing Sciences in Colleges. Permission tocopy without fee all or part of this material is granted provided that the copies are not madeor distributed for direct commercial advantage, the CCSC copyright notice and the title ofthe publication and its date appear, and notice is given that copying is by permission of theConsortium for Computing Sciences in Colleges. To copy otherwise, or to republish, requiresa fee and/or specific permission.
74
photocopy of the script or digital notes on a digital copy of the script – usedare not fast or efficient enough to make the process of taking line notes simplefor the stage manager.
2 Literature Review
There is little computing technology developed for theatre in comparison toother fields. However, there are current commercial software products availablefor theatre management. We begin by examining these areas.
One of the most challenging aspects of a theatre production is the collab-oration between the different artists involved, such as costume designers, setdesigners, directors and actors. Theatre design software is developed to fostercollaboration among the different parties. For example, A virtual reality sys-tem was developed to help theatrical designers collaborate over long distances[2]. This system helped designers visualize aspects of a production such aslighting design and abstract set designs by utilizing a tabletop projection sys-tem. Another system is a digital script user interface that allows both actorsand directors to visualize a script in a more cohesive fashion [5].
There are multiple commercial software systems that assist with organiza-tion during a rehearsal process. Virtual Callboard [7], Propared[3] and StageWrite [6] are software systems used by both designers and actors to managea production including document management or tracking an actor’s locationand movements during rehearsal. There are also systems such as Cuelist [1] andQLab[4], which were designed to help with the process of creating a promptbook, a book which specifies all cues for all parts of a production.
Products like the ones outlined in this section can prove to be invaluablewhen organizing large-scale theatrical productions. However, none of thesesystems assisted stage managers in taking lines notes.
3 System Design
Before implementing the system, a series of preliminary interviews were con-ducted. A total of six stage managers with experience working on at least onefull production were interviewed about their experience taking line notes.
While methods varied slightly, most stage managers highlighted the linesin a digital version of the script that were said incorrectly. The color of thehighlight would correspond to the type of error made. Stage managers wouldre-organize lines said incorrectly and distribute them to actors after rehearsalended. Based off of these interviews a series of user requirements were compiled:
75

• parse and format a text-based script for display.• allow script traversal which facilitates monitoring the play in real time.• allow the user to quickly mark specific words if a line was said incorrectly,preferably with color coordination.
• export all notes in a readable format which can be understood by anactor performing in the production.
• allow the user to categorize how lines are exported (by character or scene).
Following object-oriented principles and a loose SCRUM methodology, wedeveloped a Java-based software system for taking line notes which met theabove user requirements. The system consisted of a Parser which assisted thestage manager in importing a digital script and segmenting it by Acts, Scenes,Lines, Words, and Characters. This “master script” could then be saved andused again to avoid repeating the parsing process. The Notetaker Interface(Figure 1) is the GUI component that allows the user to notate errors said bythe actor and includes the ability to navigate between Scenes (top buttons)and change categories of errors with a button click (lower buttons). The stagemanager could then export these line notes with color coordination as feedbackto the actors.
Figure 1: The Notetaker Interface
76
4 Evaluation
To understand the effectiveness of the software, we designed a study to as-sess the system’s usability in a simulated theatrical environment. We recordedfour scenes using different volunteer actors from the Rollins College TheatreDepartment. Each scene was one to two minutes long and included approxi-mately ten errors of varying types. These error types fell into three differentcategories that could be easily simulated: missed (Red), added (Yellow), andchanged (Green). Each of the four scenes was played in succession, and fivedifferent veteran stage managers used our system to notate the errors in com-parison to the scripts they were given. After they completed the line notes, weinterviewed each participant to obtain qualitative data.
To analyze the data, the line notes from each participant were comparedto a correct version and the total number of errors found was calculated. If aparticipant located an error but marked additional words, or if the error wasfound but categorized incorrectly, we counted the line note as correct. In a realtheatrical setting, the actor would be able to use this feedback to understandthat a line was said incorrectly.
While this study format does not allow us to simulate the fatigue experi-enced by the user during a two hour rehearsal, nor all the possible categories,it does allow us to efficiently test the system for learnability and ease-of-use.
5 Analysis and Discussion
Overall, the results from the study were positive. However, the testing poolwas small, and we cannot assume that these findings will generalize withoutfurther study.
As a group, the participants were able to locate 70% of the 41 errors in theexperiment. There was improvement in performance from the first scene (48%of errors found) to the final (84% of errors found). This increase in correctnesscan be attributed to two factors: participants becoming more familiar with thesystem and the speed at which the scenes were performed. The first scene wascomedic scene which tends to be performed faster while the second was a dra-matic scene which has a slower pace. Table 1 shows breakdown of performanceby participant.
5.1 Usability and Strengths
During the interviews, the users identified several strengths of the softwaresystem. The users liked the ability to click to navigate from scene to sceneinstead of scrolling. Participant 2 talked about the ability to change scenes by
77

Table 1: Errors Found by Each ParticipantScene 1 Scene 2 Scene 3 Scene 4 Total
Participant 10 Errors 10 Errors 10 Errors 11 Errors 41 errorsP1 5 8 8 10 31P2 4 8 7 10 29P3 5 7 8 8 28P4 6 8 7 9 30P5 4 6 7 9 26
AVERAGE 48% 74% 74% 84% 70%
saying, “I like how you can flip back and forth between the scenes. I think it isa lot easier to be able to see all the scenes instead of having to scroll."
Second, the users liked the ability to use the buttons to change error cate-gories. Due to the fact that the buttons were marked with the category nameand color, the system helped reduce the cognitive load. Participant 3 said, “[Changing the color of text in Word or Adobe] takes longer than this programdid because this ... will automatically make it the color you want if you clickon the right thing [button].”
Third, stage managers liked the ability to mark individual words with adouble click which made it easier to mark small details while keeping up withthe actors. Participant 2 remarked, “I think [error marking] is especially easierwhen it’s just one word. When you can just double click on it, it is a lot easier.”
While not explicitly tested in the study, the participants appreciated thesoftware’s ability to export categorized line notes. This functionality is uniqueto this software, and it saves the stage manager time post-rehearsal. Partici-pant 3 said “[Compiling notes] is what takes the longest for me, so it’s reallyhelpful that I don’t have to do that manually.”
5.2 Critiques and Future Work
The biggest criticism of the software were some UI details. For example, theplacement of a drop down menu which appears when the user highlights wordsblocks their vision of some of the remaining sentences. Additionally, severalparticipants complained that yellow was hard to see on the button panel. Bothof these complaints are easily solved in future versions.
Some participants were concerned that the software does not have a backupif the user’s computer is rendered unusable for a period of time. Several stagemanagers currently use Google Docs to ensure their notes are accessible at anytime. This concern informs future work to include cloud backups.
Additionally, future work includes a study of the system during a full length
78

production. This would provide a stage manager with the time to become anexpert with the system and would allow us to study the system in a fast-paced,in situ use case.
6 Conclusion
In this paper we have discussed the design, implementation, and study of asoftware system to aid stage managers in taking line notes during theatricalproductions. We have designed a system that not only allows for accurate linenote taking, but provides a better user experience. Additionally, our systemsaves the user time by compiling notes for distribution. After completing auser study, we found that on average, the users were able to find errors with70% accuracy using our system and all the stage managers who evaluated thesoftware were enthusiastic about trying it during a full length production.
References
[1] Cuelist. reinventing collaboration for theater and live events, 2019 (accessedMay 2, 2019). https://www.thecuelist.com.
[2] Y. Horiuchi, T. Inoue, and K. Okada. Virtual stage linked with a physicalminiature stage to support multiple users in planning theatrical produc-tions. In Proc of the 2012 ACM Intl Conf on Intelligent User Interfaces,IUI ’12, pages 109–118. ACM, 2012.
[3] Propared. Production Planning Software Revolutionizing How Organiza-tions Manage Show Logistics and Streamline Communications, 2019 (ac-cessed May 2, 2019). https://www.propared.com.
[4] QLab. QLab, 2019 (accessed May 2, 2019). https://figure53.com/qlab/.
[5] S. Sinclair, S. Ruecker, S. Gabriele, and A. Sapp. Digital scripts on a virtualstage: the design of new online tools for drama students. In Proc of the5th IASTED Intl Conf on Web-Based Education, WBE ’06, pages 155–159.ACTA Press, 2012.
[6] Stage Write. Capture Creativity with Stage Write, 2019 (accessed May 2,2019). https://www.stagewritesoftware.com.
[7] VirtualCallboard. Online Stage Management and Production Management,2019 (accessed May 2, 2019). https://www.virtualcallboard.com.
79
Exploring Collaborative Talk AmongAfrican-American Middle-School Girls inthe Context of Game Design for Social
Change∗
Jakita O. Thomas1, Yolanda Rankin2, Quimeka Saunders 3
1Auburn University, Auburn, AL [email protected]
2Florida State University, Tallahassee, FL [email protected]
3Spelman College, 350 Spelman LaneAtlanta, GA 30314
Abstract
Computer Science education research establishes collaboration amongstudents as a key component in learning, particularly its role in pair pro-gramming. Furthermore, research shows that girls, an underrepresentedpopulation in computing, benefit from collaborative learning environ-ments, contributing to their persistence in CS. However, too few studiesexamine the role and benefits of collaborative learning, especially col-laborative talk, among African-American girls in the context of complextasks like designing video games for social change. In this exploratorystudy, we engage 4 dyads of African-American middle school girls in thetask of designing a video game for social change, recording the dyads’conversations with their respective partners over an eight-week summergame design experience during the second year of what has now becomea six-year study. Qualitative analysis of dyadic collaborative discus-sion reveals how collaborative talk evolves over time in African-Americanmiddle-school girls.
∗Copyright ©2019 by the Consortium for Computing Sciences in Colleges. Permission tocopy without fee all or part of this material is granted provided that the copies are not madeor distributed for direct commercial advantage, the CCSC copyright notice and the title ofthe publication and its date appear, and notice is given that copying is by permission of theConsortium for Computing Sciences in Colleges. To copy otherwise, or to republish, requiresa fee and/or specific permission.
80

1 Introduction
Collaborative Learning has been presented as one of the many ways of address-ing some of the known failures of traditional methods of instruction. Some ofthese known failures include low rates of retention, failure to transfer learningand inability of learners to apply knowledge flexibly. Collaboration, for thepurposes of this research, has been defined as the joint effort of two individualsto complete a given/task or project. The act of collaboration allows groups toreveal conflict, negotiate meanings and uncover common ground that can serveto model the thinking necessary to carry out certain actions/task.
Computer Science (CS) education research espouses collaborative learningas beneficial for students learning how to program whether in an entry levelor advanced CS course [10][7]. However, additional studies are needed to bet-ter understand how diverse populations of students master collaboration whiledeveloping key computational thinking skills. In this paper, we explore collab-orative talk between dyads of African-American middle school girls engagedin game design for social change. This research poses the following question:What conversational patterns do the African-American middle school girls gen-erate as they engage in collaborative talk in the context of designing games forsocial change? We address this research question by analyzing recorded videoobservations of dyads working together during the second year (or Season) ofSCAT’s two-week intensive summer game design experience.
2 Background
Collaborative learning has been presented as one of the many ways of address-ing some of the known failures of learning by traditional methods of instruction[4][1]. Although, collaborative learning has been shown to improve some of thechallenges of individual learning, putting two children together for group workwill not necessarily ensure that they will profit from the interaction in a learn-ing environment. Children benefit from the interaction to the extent in whichthey participate [6]. Teasley [8] found, when comparing dyads that talked withand dyads that did not (i.e., no-talk dyads), that dyads that talked generatedbetter hypotheses than no talk dyads. In her study, dyads collaboratively pro-grammed a sprite to move a certain way. She also characterized and categorizedthe collaborative talk, called utterances, that those dyads engaged in using ver-bal coding scheme. The coding scheme accounted for utterances, which weredefined as individual message units that consisted of single sounds, sentencefragments and interruptions or complete sentences and nonverbal activity suchas nods, shrugs, pointing, writing and control of the computer mouse [8]. Thecoding scheme included the following categories: procedural, command selec-
81
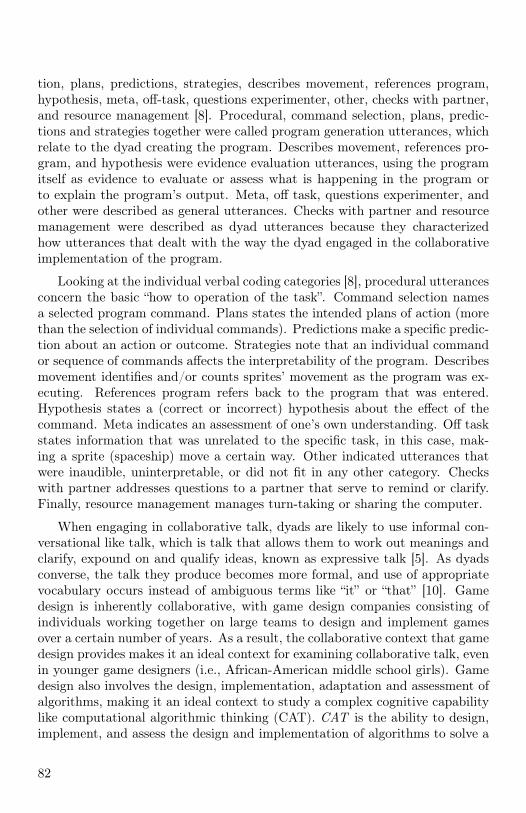
tion, plans, predictions, strategies, describes movement, references program,hypothesis, meta, off-task, questions experimenter, other, checks with partner,and resource management [8]. Procedural, command selection, plans, predic-tions and strategies together were called program generation utterances, whichrelate to the dyad creating the program. Describes movement, references pro-gram, and hypothesis were evidence evaluation utterances, using the programitself as evidence to evaluate or assess what is happening in the program orto explain the program’s output. Meta, off task, questions experimenter, andother were described as general utterances. Checks with partner and resourcemanagement were described as dyad utterances because they characterizedhow utterances that dealt with the way the dyad engaged in the collaborativeimplementation of the program.
Looking at the individual verbal coding categories [8], procedural utterancesconcern the basic “how to operation of the task”. Command selection namesa selected program command. Plans states the intended plans of action (morethan the selection of individual commands). Predictions make a specific predic-tion about an action or outcome. Strategies note that an individual commandor sequence of commands affects the interpretability of the program. Describesmovement identifies and/or counts sprites’ movement as the program was ex-ecuting. References program refers back to the program that was entered.Hypothesis states a (correct or incorrect) hypothesis about the effect of thecommand. Meta indicates an assessment of one’s own understanding. Off taskstates information that was unrelated to the specific task, in this case, mak-ing a sprite (spaceship) move a certain way. Other indicated utterances thatwere inaudible, uninterpretable, or did not fit in any other category. Checkswith partner addresses questions to a partner that serve to remind or clarify.Finally, resource management manages turn-taking or sharing the computer.
When engaging in collaborative talk, dyads are likely to use informal con-versational like talk, which is talk that allows them to work out meanings andclarify, expound on and qualify ideas, known as expressive talk [5]. As dyadsconverse, the talk they produce becomes more formal, and use of appropriatevocabulary occurs instead of ambiguous terms like “it” or “that” [10]. Gamedesign is inherently collaborative, with game design companies consisting ofindividuals working together on large teams to design and implement gamesover a certain number of years. As a result, the collaborative context that gamedesign provides makes it an ideal context for examining collaborative talk, evenin younger game designers (i.e., African-American middle school girls). Gamedesign also involves the design, implementation, adaptation and assessment ofalgorithms, making it an ideal context to study a complex cognitive capabilitylike computational algorithmic thinking (CAT). CAT is the ability to design,implement, and assess the design and implementation of algorithms to solve a
82

Figure 1: Game Design Cycle
broad range of problems [9].
The game design cycle consists of seven phases, which include brainstorm-ing, storyboarding, physical prototype, design document, software prototype,implementation and quality assurance/maintenance, are iterative themselves(See Figure 1). Between each iterative phase beginning with storyboarding,playtesting occurs. Playtesting involves target players playing the game in dif-ferent forms and providing feedback that informs the iterative design of thegame [3]. During the brainstorming phase, dyads are to come up with as manygame ideas as they possibly can and may present these ideas to an audience forfeedback. After an idea is generated, dyads are required to explain their ideavisually using paper-and-pencil in order to give a thorough explanation of theirgame. The images or series of “screenshots” are called storyboarding, whichsimulate the players’ movement throughout the entire game while using fewwords to describe non-visual elements of the game (e.g., sound). During thephysical prototyping phase, dyads create a playable prototype using craft ma-terials, and their physical prototypes are playtested. After iteratively workingthrough each prototype, the design document is drafted, which describes everyaspect of the game. Next, each dyad creates software prototypes, which modelthe core gameplay and are playtested to help dyads make remaining designdecisions. During the implementation phase, dyads implement their games,which are playtested after each iteration. Lastly, quality assurance is done andconsists of making sure that the target audience has access to the softwaregame and there are no lingering issues within the software prototype[3][9].
83
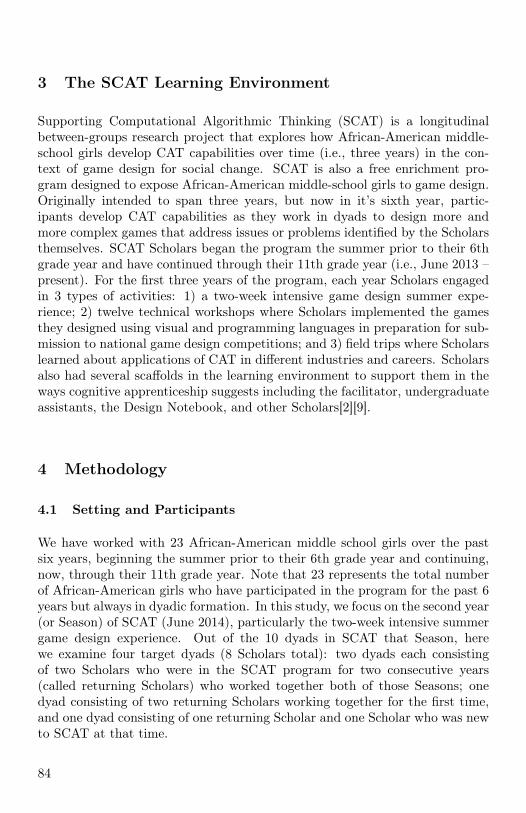
3 The SCAT Learning Environment
Supporting Computational Algorithmic Thinking (SCAT) is a longitudinalbetween-groups research project that explores how African-American middle-school girls develop CAT capabilities over time (i.e., three years) in the con-text of game design for social change. SCAT is also a free enrichment pro-gram designed to expose African-American middle-school girls to game design.Originally intended to span three years, but now in it’s sixth year, partic-ipants develop CAT capabilities as they work in dyads to design more andmore complex games that address issues or problems identified by the Scholarsthemselves. SCAT Scholars began the program the summer prior to their 6thgrade year and have continued through their 11th grade year (i.e., June 2013 –present). For the first three years of the program, each year Scholars engagedin 3 types of activities: 1) a two-week intensive game design summer expe-rience; 2) twelve technical workshops where Scholars implemented the gamesthey designed using visual and programming languages in preparation for sub-mission to national game design competitions; and 3) field trips where Scholarslearned about applications of CAT in different industries and careers. Scholarsalso had several scaffolds in the learning environment to support them in theways cognitive apprenticeship suggests including the facilitator, undergraduateassistants, the Design Notebook, and other Scholars[2][9].
4 Methodology
4.1 Setting and Participants
We have worked with 23 African-American middle school girls over the pastsix years, beginning the summer prior to their 6th grade year and continuing,now, through their 11th grade year. Note that 23 represents the total numberof African-American girls who have participated in the program for the past 6years but always in dyadic formation. In this study, we focus on the second year(or Season) of SCAT (June 2014), particularly the two-week intensive summergame design experience. Out of the 10 dyads in SCAT that Season, herewe examine four target dyads (8 Scholars total): two dyads each consistingof two Scholars who were in the SCAT program for two consecutive years(called returning Scholars) who worked together both of those Seasons; onedyad consisting of two returning Scholars working together for the first time,and one dyad consisting of one returning Scholar and one Scholar who was newto SCAT at that time.
84
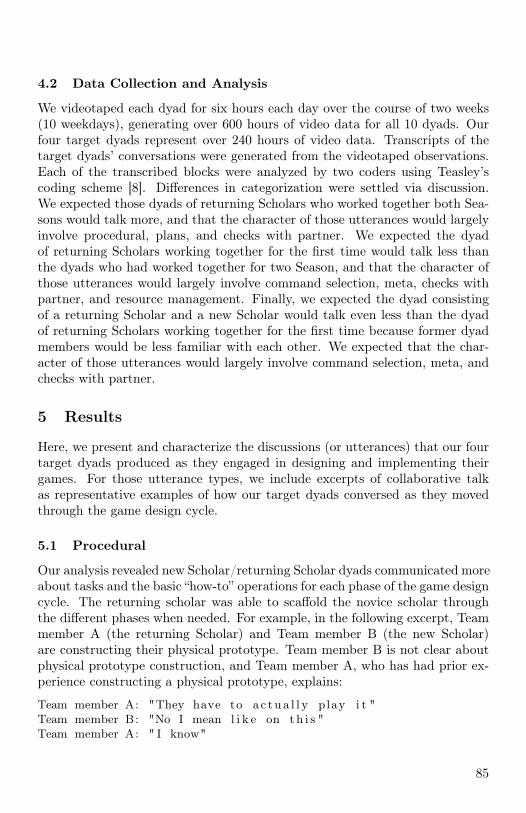
4.2 Data Collection and Analysis
We videotaped each dyad for six hours each day over the course of two weeks(10 weekdays), generating over 600 hours of video data for all 10 dyads. Ourfour target dyads represent over 240 hours of video data. Transcripts of thetarget dyads’ conversations were generated from the videotaped observations.Each of the transcribed blocks were analyzed by two coders using Teasley’scoding scheme [8]. Differences in categorization were settled via discussion.We expected those dyads of returning Scholars who worked together both Sea-sons would talk more, and that the character of those utterances would largelyinvolve procedural, plans, and checks with partner. We expected the dyadof returning Scholars working together for the first time would talk less thanthe dyads who had worked together for two Season, and that the character ofthose utterances would largely involve command selection, meta, checks withpartner, and resource management. Finally, we expected the dyad consistingof a returning Scholar and a new Scholar would talk even less than the dyadof returning Scholars working together for the first time because former dyadmembers would be less familiar with each other. We expected that the char-acter of those utterances would largely involve command selection, meta, andchecks with partner.
5 Results
Here, we present and characterize the discussions (or utterances) that our fourtarget dyads produced as they engaged in designing and implementing theirgames. For those utterance types, we include excerpts of collaborative talkas representative examples of how our target dyads conversed as they movedthrough the game design cycle.
5.1 Procedural
Our analysis revealed new Scholar/returning Scholar dyads communicated moreabout tasks and the basic “how-to” operations for each phase of the game designcycle. The returning scholar was able to scaffold the novice scholar throughthe different phases when needed. For example, in the following excerpt, Teammember A (the returning Scholar) and Team member B (the new Scholar)are constructing their physical prototype. Team member B is not clear aboutphysical prototype construction, and Team member A, who has had prior ex-perience constructing a physical prototype, explains:
Team member A: "They have to a c t ua l l y play i t "Team member B: "No I mean l i k e on t h i s "Team member A: " I know"
85
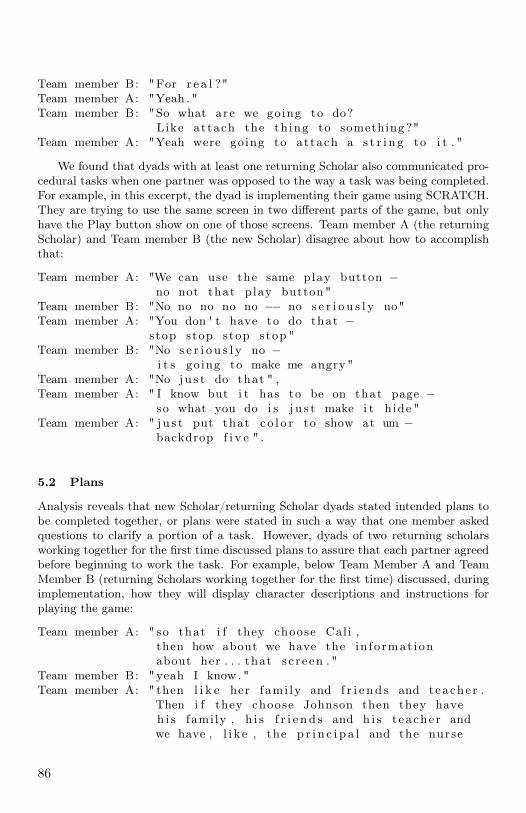
Team member B: "For r e a l ?"Team member A: "Yeah . "Team member B: "So what are we going to do?
Like attach the th ing to something ?"Team member A: "Yeah were going to attach a s t r i n g to i t . "
We found that dyads with at least one returning Scholar also communicated pro-cedural tasks when one partner was opposed to the way a task was being completed.For example, in this excerpt, the dyad is implementing their game using SCRATCH.They are trying to use the same screen in two different parts of the game, but onlyhave the Play button show on one of those screens. Team member A (the returningScholar) and Team member B (the new Scholar) disagree about how to accomplishthat:
Team member A: "We can use the same play button −no not that play button"
Team member B: "No no no no no −− no s e r i o u s l y no"Team member A: "You don ' t have to do that −
stop stop stop stop "Team member B: "No s e r i o u s l y no −
i t s going to make me angry"Team member A: "No j u s t do that " ,Team member A: " I know but i t has to be on that page −
so what you do i s j u s t make i t h ide "Team member A: " j u s t put that c o l o r to show at um −
backdrop f i v e " .
5.2 Plans
Analysis reveals that new Scholar/returning Scholar dyads stated intended plans tobe completed together, or plans were stated in such a way that one member askedquestions to clarify a portion of a task. However, dyads of two returning scholarsworking together for the first time discussed plans to assure that each partner agreedbefore beginning to work the task. For example, below Team Member A and TeamMember B (returning Scholars working together for the first time) discussed, duringimplementation, how they will display character descriptions and instructions forplaying the game:
Team member A: " so that i f they choose Cal i ,then how about we have the in fo rmat ionabout her . . . that s c r e en . "
Team member B: "yeah I know ."Team member A: " then l i k e her fami ly and f r i e n d s and teacher .
Then i f they choose Johnson then they haveh i s fami ly , h i s f r i e n d s and h i s t eacher andwe have , l i k e , the p r i n c i p a l and the nurse
86

− people . "Team member B: "and then t e l l them how to play " .
Dyads with two returning Scholars did not state or discuss intended plans of action.Instead, using the Design Notebook, they worked simultaneously on different portionsof one task, or one partner took the lead with no prior discussion of which partnerwould take the lead or which part of the task each partner would work on. Instead,those roles were negotiated in a seamless way without dialogue.
5.3 Checks with Partner/Meta
Both new Scholar/returning Scholar dyads as well as dyads with two returning Schol-ars working for the first time consistently checked with their partner for clarificationto assure tasks were being completed accurately and in a way their partner liked.Below, Team member A and Team member B are designing levels of their game,discussing how players will be able to access the bonus level:
Team member A: "game . . . bonus l e v e l . . . games . . . bonus l e v e l . . .but that ' s only i f they pass the game . "
Team member B: "yeah , they pass the game then they ' l lget the bonus l e v e l . . . how about i f theyonly get a c e r t a i n amount o f po in t sthey get the bonus l e v e l . . . l i k e i f themost amount o f po in t s you can get to passthe l e v e l i s l i k e 50 the l e a s t you can geti s l i k e 30 to pass the l e v e l . . . but i fthey get they 40 po in t s then they getthe bonus l e v e l but they don ' t get togo to the next round " .
In dyads with returning Scholars working together for a second Season, partners rarelychecked with each other, but focused instead on getting agreement from their partneron the process they were engaged in. For example, while creating their storyboards,Team member A checks in with her partner around the process for creating thestoryboards.
Team member A: "Like we drew . . . we drew l i k e the f r on t page ,but i f you c l i c k on each one . . . l i k e wherewould we go to . . . So are we supposed to l i k edraw the game l i k e somebody ' s p lay ing i t ?"
Team member B: "mhm"Team member A: " I know , but I s t i l l get confused that was
l i k e , a whi l e ago " .
87

6 Conclusion
We anticipated that dyads with two returning Scholar who had also worked togetherfor two Season would engage in the most discussion, while dyads with one returningScholar and one new Scholar would engage in the least discussion. The analysis ofdata of our four target dyads suggests otherwise. Instead, we found the opposite. Thenew Scholar/returning Scholar dyad engaged in collaborative talk most frequentlywith the returning Scholar (the more expert team member in terms of designinggames for social change) helping scaffold the novice team member throughout thegame design cycle. Further, while the returning Scholars working together for thefirst time, engaged in collaborative talk less than the new Scholar/returning Scholardyad, they did engage in more collaborative talk than the returning Scholars workingtogether for the second time. Perhaps most surprising was the finding that the dyadscontaining two returning scholars working together for the second time (or secondSeason) engaged in the least collaborative talk out of all of the target dyads withsporadic discussions throughout each phase of the game design cycle and with thesedyads working mostly independently on each task and checking in with each otherafter completing a portion of a task. This suggests that the amount or duration ofcollaborative talk may not be the best indicator of collaboration for every task orprocess, especially when dyads work together for extended periods of time (in thiscase, into the second SCAT season, or more than one year). It would appear that thesegroups had developed practices over the course of the first Season that later supportedthem in engaging in game design for social change without a lot of collaborativetalk during the second Season. Further, our analysis revealed that the utterancecategories that showed up most in the data were Procedural, Plans, and ChecksWith Partner/Meta. Additionally, our analysis revealed that the utterance categoriesthat showed up most in the data were uttered or enacted differently depending uponthe type of dyad (i.e., two returning Scholars working together for a second Season,two returning Scholars working together for the first time, or one returning Scholarworking with one new Scholar). For example, for dyads with one returning Scholarand one new Scholar, plans utterances focused on stating the intended plans togetheror asking questions about the plan for clarity. For dyads with two returning Scholarsworking together for the first time, plans utterances focused on ensuring that bothmembers of the dyad agreed before proceeding with a plan of action. However, for tworeturning Scholars working together for a second Season, plans utterances were notstated or spoken at all. Instead, these dyads relied almost completely on the DesignNotebook, and were able to divide the workload up in such a way that they couldwork independently, trusting that each partner would execute their plans in the waysthey both intended. Future work includes conducting the same examination for thesame groups using dyad video observations from the first Season of SCAT during thetwo-week intensive summer game design experience, where all Scholars participatedin the SCAT program for the first time and where all dyads worked together for thefirst time.
Acknowledgements: We would also like to gratefully acknowledge the support ofNSF (DR K -12 #1150098).
88

References
[1] Margarita Azmitia. Peer interaction and problem solving: When are two headsbetter than one? Child Development, 59(1):87–96, 1988.
[2] Allan Collins, John S. Brown, and Susan E. Newman. Cognitive apprenticeship,chapter 14, pages 453–494. Erlbaum, Hillsdale, NJ, 1989.
[3] Tracy Fullerton, Christopher Swain, and Steven Hoffamn. Game Design Work-shop: designing, prototyping and playtesting games.
[4] T. D. Koschmann. Towards a theory of computer support for collaborativelearning. The Journal of the Learning Sciences, 3:219–225, 1993.
[5] B. Latour. Science in action: How to follow scientists and engineers throughsociety. Harvard University Press, 1987.
[6] Barbara Rogoff. Apprenticeship in thinking: Cognitive development in socialcontext. Oxford University Press, 1990.
[7] O. Ruvalcaba, L. Werner, and J J. Denner. Observations of pair programming:Variations in collaboration across demographic groups. Proceedings of the 47thACM Technical Symposium on Computing Science Education, March 02-05:90 –95.
[8] S. D. Teasley. The role of talk in children’s peer collaborations. DevelopmentalPsychology, 31(2):207 – 220.
[9] J. O. Thomas. The computational algorithmic thinking (cat) capability flow: Amethodological approach to articulating complex cognitive skills and capabilitiesover time. Proceedings of the 49th ACM Technical Symposium on ComputerScience Education (SIGCSE), 2018.
[10] L. Werner, J. Denner, and S. Campbell. Children programming games: A strat-egy for measuring computational learning. ACM Transactions on ComputingEducation, 4(4):22.
89

Assessing Ethics in a Computer ScienceCurriculum: Instrument Description and
Preliminary Results∗
Kevin R. SanftDepartment of Computer Science
University of North Carolina Asheville1 University HeightsAsheville, NC 28804
AbstractEthics and professional conduct are components of many undergrad-
uate computer science curricula. Assessment of students’ knowledge andconduct is important for evaluating ethics-related student learning out-comes and teaching effectiveness. We present a survey designed to assessa student learning outcome evaluated on five dimensions related to ethicsand professional conduct. A rubric application is provided to categorizethe responses into rubric levels. Preliminary assessments from an in-troductory programming course, a professional development course anda computer science capstone course are presented and compared. As-sessing ethics is challenging due to time demands and the variety andnuance that realistic ethical dilemmas entail. Shortcomings such as thepossibility of dishonest responses are discussed. Overall, the instrumentprovides a mechanism requiring minimal time commitment for assessingethics-related student learning outcomes.
1 Introduction
Ethics and professional values have been a part of many computer science cur-ricula for decades [2, 8]. However, these topics have received renewed attention
∗Copyright ©2019 by the Consortium for Computing Sciences in Colleges. Permission tocopy without fee all or part of this material is granted provided that the copies are not madeor distributed for direct commercial advantage, the CCSC copyright notice and the title ofthe publication and its date appear, and notice is given that copying is by permission of theConsortium for Computing Sciences in Colleges. To copy otherwise, or to republish, requiresa fee and/or specific permission.
90

in recent years due to the increasing role of technology in society and scandalsat tech companies. From the use of social media to spread misinformation, poordata privacy policies, security breaches, concerns about automation and artifi-cial intelligence, and many other challenges, ethical issues related to technologycontinue to make headlines, underscoring the importance of emphasizing thesetopics in the computer science curriculum.
In this work we will use the term ethics broadly to encompass ethics, pro-fessional values and professional conduct. Previous work on assessing ethics-related student learning outcomes has often focused on scenario-based ap-proaches (e.g. [7, 11, 5, 9]). These typically involve a description of a chal-lenging hypothetical scenario and the application of a rubric to categorize theresponse. Other work has emphasized the importance of aligning assessmentinstruments to the student learning outcomes and the difficulties in assessinghypothetical scenarios [6, 4]. Scenario-based assessments tend to be time-consuming and most approaches are susceptible to bias due to disingenuousresponses.
In this work we present an assessment survey to evaluate an ethics-relatedstudent learning outcome across five predefined dimensions. The questionsfeature some answer choices that are designed to detect dishonest responses.Student responses are classified into rubric levels automatically. The assess-ment results are designed to provide useful metrics in a continuous improvementplan.
2 Student Learning Outcomes
The student learning outcome assessed in this work is based on an outcome inthe ABET Criteria for Accrediting Computing Programs, 2018-2019, namely,“Students will make informed judgments in computing practice based on legaland ethical principles" [1]. The outcome is assessed on five dimensions thatare adapted from the 2018 ACM Code of Ethics and Professional Conduct [3]:1) Knowledge of Legal Issues, 2) Plagiarism, 3) Privacy and Confidentiality,4) Societal Impact, and 5) Quality of Work. These dimensions, along with amatrix of rubric levels are available in Reference [10].
3 Instrument
The survey consists of fifteen multiple choice questions, including scenario-based, factual, and opinion questions. The questions and response options arelisted below. The Likert scale choices are 1=Strongly Disagree, 2=Disagree,3=Neutral, 4=Agree, and 5=Strongly Agree. The first question is “check allthat apply", the rest are single option response.
91

1. Legally, which of the following factors are relevant in determining if astudent can use a portion of copyrighted text or images in a homeworkassignment (check all that apply): a) You can never use someone else’scopyrighted material; b) If the copyright holder is given attribution; c)That the use is for academic/educational purposes; d) The amount ofmaterial copied; e) The effect of the use on the copyright holder’s income.
2. Suppose you sign a contract with a company to develop a portion of alarge software product. The contract states that you are the author andnot the owner of the software you write. This means: a) As the author, Iam allowed to use my code only for my own personal future projects.; b)As the author, I am allowed to help other software companies using thesame code.; c) Since I’m not the owner, I can’t use the code anywhereelse.; d) I’m not sure.
3. Copyright law applies to computer programs. (True, False, Don’t know)
4. Copyright applies only when the copyright is registered. (True, False,Don’t know)
5. Have you plagiarized (code or other writing) on a homework assignment(in any course) at the college level within the past 12 months? (Yes, No)
6. Have you ever plagiarized (code or other writing) on a homework assign-ment (in any course) at the college level? (Yes, No)
7. If you did not have time to finish a computer program for a homeworkassignment, would you copy programming code from another student?(Yes, No)
8. Imagine you work for a social media company. When do you think itis acceptable to use or share private and confidential user data (choosethe best response): a) When it is convenient for software developmentpurposes.; b) When the financial benefits of using the data are worthmore than the expected cost of the risks.; c) When necessary for busi-ness purposes and it adheres to the company’s privacy policy.; d) Whennecessary for business purposes but only with explicit user consent.; e)It is never acceptable to use or share confidential data.; f) None of thesechoices reflect my views.
9. It is important that computer scientists consider societal impacts whenimplementing systems. (Likert scale)
10. In the future, I will consider social needs and accessibility in design andimplementation of computing systems. (Likert scale)
92
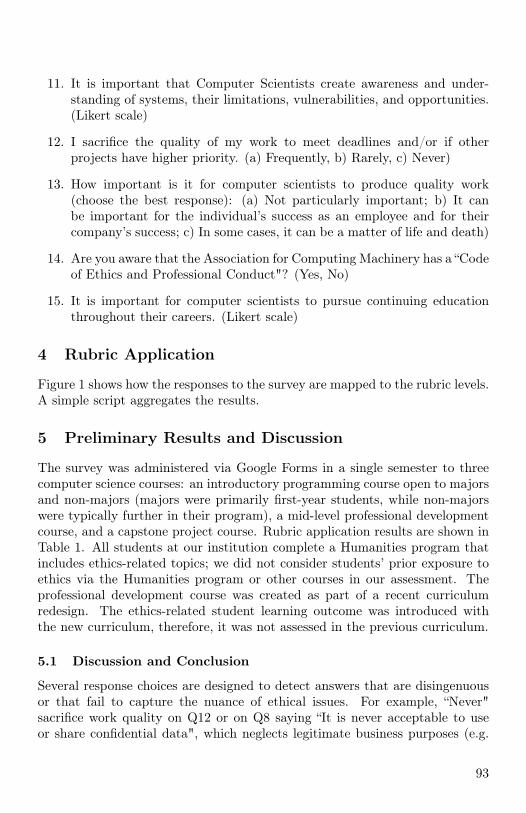
11. It is important that Computer Scientists create awareness and under-standing of systems, their limitations, vulnerabilities, and opportunities.(Likert scale)
12. I sacrifice the quality of my work to meet deadlines and/or if otherprojects have higher priority. (a) Frequently, b) Rarely, c) Never)
13. How important is it for computer scientists to produce quality work(choose the best response): (a) Not particularly important; b) It canbe important for the individual’s success as an employee and for theircompany’s success; c) In some cases, it can be a matter of life and death)
14. Are you aware that the Association for Computing Machinery has a “Codeof Ethics and Professional Conduct"? (Yes, No)
15. It is important for computer scientists to pursue continuing educationthroughout their careers. (Likert scale)
4 Rubric Application
Figure 1 shows how the responses to the survey are mapped to the rubric levels.A simple script aggregates the results.
5 Preliminary Results and Discussion
The survey was administered via Google Forms in a single semester to threecomputer science courses: an introductory programming course open to majorsand non-majors (majors were primarily first-year students, while non-majorswere typically further in their program), a mid-level professional developmentcourse, and a capstone project course. Rubric application results are shown inTable 1. All students at our institution complete a Humanities program thatincludes ethics-related topics; we did not consider students’ prior exposure toethics via the Humanities program or other courses in our assessment. Theprofessional development course was created as part of a recent curriculumredesign. The ethics-related student learning outcome was introduced withthe new curriculum, therefore, it was not assessed in the previous curriculum.
5.1 Discussion and Conclusion
Several response choices are designed to detect answers that are disingenuousor that fail to capture the nuance of ethical issues. For example, “Never"sacrifice work quality on Q12 or on Q8 saying “It is never acceptable to useor share confidential data", which neglects legitimate business purposes (e.g.
93
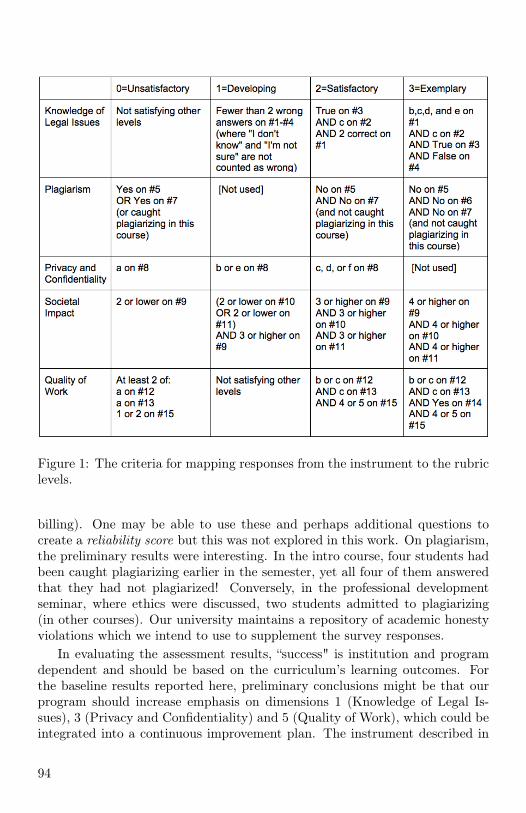
Figure 1: The criteria for mapping responses from the instrument to the rubriclevels.
billing). One may be able to use these and perhaps additional questions tocreate a reliability score but this was not explored in this work. On plagiarism,the preliminary results were interesting. In the intro course, four students hadbeen caught plagiarizing earlier in the semester, yet all four of them answeredthat they had not plagiarized! Conversely, in the professional developmentseminar, where ethics were discussed, two students admitted to plagiarizing(in other courses). Our university maintains a repository of academic honestyviolations which we intend to use to supplement the survey responses.
In evaluating the assessment results, “success" is institution and programdependent and should be based on the curriculum’s learning outcomes. Forthe baseline results reported here, preliminary conclusions might be that ourprogram should increase emphasis on dimensions 1 (Knowledge of Legal Is-sues), 3 (Privacy and Confidentiality) and 5 (Quality of Work), which could beintegrated into a continuous improvement plan. The instrument described in
94

DimensionRubricLevel
Overall(N=54)
Intro(N=30)
Seminar(N=17)
Capstone(N=7)
Knowledge ofLegal Issues
0 15% 10% 18% 29%1 50% 40% 65% 57%2 30% 40% 18% 14%3 6% 10% 0% 0%
Plagiarism
0 13% 20% 6% 0%2 2% 0% 6% 0%3 85% 80% 88% 100%
Privacy andConfidentiality
0 2% 0% 6% 0%1 50% 53% 41% 57%2 48% 47% 53% 43%
SocietalImpact
0 4% 3% 6% 0%1 4% 3% 6% 0%2 26% 30% 24% 14%3 67% 63% 63% 86%
Quality ofWork
0 0% 0% 0% 0%1 70% 80% 59% 57%2 11% 17% 0% 14%3 19% 3% 41% 29%
Table 1: Baseline assessment results for three computer science courses: anintro programming course open to majors and non-majors, a professional de-velopment course, and a capstone course. Percentages may not add to 100%due to rounding. Dimensions are described in Reference [10]. Rubric levels are0=Unsatisfactory to 3=Exemplary as applied in Figure 1.
this work provides a convenient mechanism for assessing ethics-related studentlearning outcomes. Future work will explore longitudinal results and the effectsof specific continuous improvement plan actions.
Acknowledgements
The author thanks Charley Sheaffer of the UNC Asheville Department of Com-puter Science for his contributions to the learning outcome, dimensions andrubrics.
95
References
[1] ABET. Criteria for accrediting computing programs, 2018-2019.https://www.abet.org/accreditation/accreditation-criteria/criteria-for-accrediting-computing-programs-2018-2019/.
[2] Richard H. Austing, Bruce H. Barnes, Della T. Bonnette, Gerald L. Engel,and Gordon Stokes. Curriculum ’78: Recommendations for the undergraduateprogram in computer science— a report of the acm curriculum committeeon computer science. Commun. ACM, 22(3):147–166, March 1979.
[3] Association for Computing Machinery. Acm code of ethics and professionalconduct. https://www.acm.org/code-of-ethics.
[4] Ursula Fuller and Bob Keim. Assessing students’ practice of professional values.SIGCSE Bull., 40(3):88–92, June 2008.
[5] Mary J. Granger, Elizabeth S. Adams, Christina Björkman, Don Gotterbarn,Diana D. Juettner, C. Dianne Martin, and Frank H. Young. Using informationtechnology to integrate social and ethical issues into the computer science andinformation systems curriculum: Report of the iticse ’97 working group on so-cial and ethical issues in computing curricula. SIGCUE Outlook, 25(4):38–47,October 1997. Chairman-Little, Joyce Currie.
[6] Matthew W. Keefer, Sara E. Wilson, Harry Dankowicz, and Michael C. Loui.The importance of formative assessment in science and engineering ethics edu-cation: Some evidence and practical advice. Sci Eng Ethics, 20:249, 2014.
[7] Keith Miller. Integrating computer ethics into the computer science curriculum.Computer Science Education, 1(1):37–52, 1988.
[8] The Joint Task Force on Computing Curricula Association for Comput-ing Machinery (ACM) IEEE Computer Society. Computer science curricula2013. https://www.acm.org/binaries/content/assets/education/cs2013_web_final.pdf.
[9] D.B. Parker. Ethical Conflicts in Computer Science and Technology. AFIPSPress, 1981.
[10] Charley Sheaffer and UNC Asheville Department of Computer Science,2018-2019. https://drive.google.com/file/d/1wTsOP4M-50RLUWR9fx1g--6bb_Fvkzw8/view?usp=sharing.
[11] L.J. Staehr and G.J. Byrne. Using the defining issues test for evaluating com-puter ethics teaching. IEEE Transactions on Education, 46(2):226–234, 2003.
96

Reflective Writing Through PrimarySources∗
Valerie SummetMathematics and Computer Science
Rollins CollegeWinter Park, FL 34761
AbstractIn this paper, we present a series of reflective writing assignments.
In contrast to previous use of reflective writing in computer science, thiswork aims to provide a discussion of ways of incorporating reflectivewriting and primary sources into higher level courses and providing aplatform for reflection on a large scope of events including the computerscience major, the undergraduate learning experience, and plans for botheducation and careers. We give examples of the primary sources, theoverall structure of the assignments, and some student reactions to them.
1 Background
Reflective writing is an important skill in an undergraduate education. Reflec-tive writing encourages critical thinking, assists in developing student inquiry,and may help students understand content material or larger patterns in theirlearning. In CS, reflective writing has most often been used to reflect on asmall, practical activity such as a specific exercise. The purpose of this paperhowever, is to examine how students reflect on their undergraduate educationand, in particular, their major in Computer Science. In this paper, we present aseries of writing assignments designed to expose CS student to primary sources,facilitate a close reading of those sources, and encourage students to reflect onthe connections between the reading and their experiences as a computer sci-ence major at Rollins College.
∗Copyright ©2019 by the Consortium for Computing Sciences in Colleges. Permission tocopy without fee all or part of this material is granted provided that the copies are not madeor distributed for direct commercial advantage, the CCSC copyright notice and the title ofthe publication and its date appear, and notice is given that copying is by permission of theConsortium for Computing Sciences in Colleges. To copy otherwise, or to republish, requiresa fee and/or specific permission.
97

2 Related Work
In CS, reflective writing has been highly targeted. For example, Stone andMadigan [7] integrated reflective writing into two specific assignments: a tear-down of a PC in an architecture class and in case studies during a networksecurity class. They noted, “The early papers were more like research paperswhere the students repeated the concepts but did little in tying the mate-rial to their own experiences. As the term progressed the reflections becameless research and fact-oriented and more reflective and personal.” George [3]used reflective journal in a Data Structures and Algorithms course. Thesejournal entries were specifically tied to course content and programming as-signments and asked students to reflect on their understanding and learning ofthose topics. Fekete, et al. [2] used reflective diaries in CS1 to encourage stu-dents to develop regular study habits and learning patterns. The diary entriesasked concrete questions such as what new things the students had learned thisweek, what readings they had completed, how they did on last week’s plan,and what their plan for the coming week was. VanDeGrift [9] studied writingin the context of pair programming. Specifically, she designed project reportswhich were completed after three different pair projects based around reflectivewriting. “Reflective and personal” writing was an explicit goal of the currentproject, but the desire was to decouple and expand the reflection away fromcourse-specific programming or content.
Reflective writing has also been used as a feedback mechanism to the courseinstructor in Computer Science (e.g. [6]) but instructor feedback was not thegoal of this project.
3 Assignment Structure and Methodology
For each reflective writing assignment, a reading was chosen which served tohighlight a different topic in computer science and require the students to makeconnections to that theme in their education. On the day an assignment wasdue, the class also had a discussion about the reading and student responses.
3.1 Structure
Each assignment was scaffolded to take the students through three levels ofquestions leading to deeper reflection. The assignment began with questionsencouraging close reading, for example, asking the students to find quotes thatthey found funny, insightful, or confusing. Then the students had a seriesof questions which tied the reading to a theme or topic. These two types ofquestions provided a low-stakes way of beginning class discussion and served as
98
a starting point for students to share their opinions on value-neutral questions.The assignment then transitioned to the reflective questions.
The reflective questions at the end of the assignment specifically ask thestudent to reflect on their education thus far and the choices they have made.Students are also asked to think critically about the entirety of their educationand how they will actively manage their careers and lives in the future.
3.2 Primary Sources
While there are many possible choices for primary sources, the readings belowwere chosen to expose the students to a wide spectrum of writing: women au-thors, historical sources as well as modern writing, and peer-reviewed scholarlyarticles as well as accessible pieces written for a lay audience.
1. Ada Lovelace’s Note A [5]. This writing is a historical primary sourcewhich few students had interacted with. Most students found it challeng-ing due to the language (typical of the 19th century), its mathematicalfoundations, and the wildly different vocabulary concerning the “compu-tational” aspect of her writing.
2. Vannevar Bush’s article As We May Think [1]. Again, this is a historicalprimary source which has had vast implications in information manage-ment and the development of the World Wide Web as we know it today.
3. Nancy Leveson’s article Medical Devices: The Therac-25 [4]. This articleprovides an in-depth dive into a medical disaster brought about by poorsoftware engineering and software bugs. In spite of its length (35 pages),this is one of the most popular readings and discussion sessions.
4. D.A. Winsor’s Communication Failures Contributing to the ChallengerAccident: An Example for Technical Communicators [10]. This articlehighlights the importance of communication with both your peers andmanagers who may not have the same technical background to facilitatea common understanding.
5. Ellen Ullman’s book chapter New, Old, and Middle Age [8]. In this piece,Ullman reflects on the mental effort required to stay educated in the fieldof computer science. As she approaches middle-age, she questions if shehas the drive to learn the skills younger people graduate with. Unsur-prisingly, the students relate to the mental exhaustion of always learningnew things. Again, this has proved to be a very popular discussion piece.
3.3 Topics
Each primary source serves as the basis for one assignment on a specific topic.Some sources correspond to the topic better than others, but the desire wasfor the student to begin to reflect on this topic in relation to the reading.
99

There are several questions in which the students must tie the topic into thereading. Some of the topics included creativity, lifelong learning, career plan-ning and management, ethics and ethical work, prioritization and perspective,communication, and teamwork.
Some assignments focused on only one topic while others incorporate mul-tiple topics. Many class discussions tied into multiple topics. For example,communication between technical experts and lay people was a theme thatwas discussed in Bush’s, Leveson’s, and Winsor’s writing.
4 Data, Observations, and Reactions
During the Spring 2018 semester, student writings were collected and analyzedwith IRB approval. Specifically, a total of 101 unique writings were collectedfrom 24 students over five assignments given during the Senior Capstone coursewhich students traditionally take in their final semester.
In general, the students liked the readings and class discussions. Fromanonymous course evaluations, we received the following comments:
• I also looked forward to the class discussions about the readings. Thereare not enough discussion based classes in the computer science program.
• I really enjoyed having the reading assignments within this class becauseit helps broaden the work of computer science majors.
• ...the discussions we had during class were actually interesting.• I really liked the inclusion of a writing component this semester, becauseI think that is hugely beneficial in the job setting...
• Reading about the programming cases made me interested in some of thepolicy. Not enough to go into law, but definitely interested enough to keepup with regulations.
The majority of negative comments were focused on the mechanics of the as-signments and included things such as grading and due dates.
Moreover, we saw evidence that the students were using the primary sourcereadings and the writing assignments as venues for personal reflections. Thefollowing quotes showcase some reflections:
On teamwork: “I believe a pretty universal aspect of teamwork for com-puter scientist is documentation of code. API’s and libraries of code need docu-mentation so people outside of those who created the documents can understandand implement them. Reflecting on this question made me realize how collabo-rative the computer science field is. ... One of the most interesting parts aboutteamwork and CS is how it looks differently than teamwork for other fields.”
On begin prepared for the responsibilities outlined in the ACMEthics Code: “I worry about responsibility 2.5, ‘Give comprehensive and thor-ough evaluations of computer systems and their impacts, including analysis of
100

possible risks.’ I don’t feel comfortable exhaustively testing my code for all er-rors. I can detect some errors along the development of an application butexhaustively testing a program from all possible errors worries me.”
On communication: “I’d love to offer some great examples of times whenI was able to communicate some complex Computer Science idea to a lay per-son, but I find myself struggling to communicate on basic levels sometimes.This is something I am working on.”
On keeping skills up-to-date: “I have to be honest here. I have beenlanguishing in learning fatigue for a few semesters now. The only thing keepingme going is my friends, my pride, and caffeine.”
On how learning changed over time: “When I first started at Rollins Iwanted to learn every little detail of everything that we touched on in any class.However, I quickly found out that there is too much technology and its beingupdated too quickly to have any possibility of ‘keeping up.’ So I tried to focusa lot more on learning skills that I can apply regardless of what language ortechnology I’m currently using. Things like problem solving techniques, algo-rithm analysis, or good coding practices will most likely remain useful no matterwhat new language I use. Then when it comes to learning a new language ortechnology I focus on learning what I need to accomplish a specific goal.”
On not understanding new things: “This [reading] made me feel likeI was not alone. Often, I feel like I am scrambling to know what is going onaround me and want to make others realize I know what is going on.”
These quotes demonstrate the student candor and depth of thought whichwent into their writings. Students were surprisingly willing to share thesethoughts with us through their writings and sometimes shared them duringclass discussions as well. Moreover, in class the students sometimes sharedmoments of cohort bonding. For example, Ullman’s writings in particularhelped students of all genders discuss imposter syndrome and how even the“best” students experienced it to some degree.
5 Future Work and ConclusionOne of the unexplored themes to arise from the analysis of the students’ writ-ings has been program deficiencies. We have been able to identify several areasof our curriculum that need enhancement or redesign based on the students’reflections. These type of insights provide an opportunity for instructor anddepartment reflection on missing components and opportunities to restructurecertain courses to meet these needs, and further analysis in this area is planned.
These reflective writing assignments have shown promise in encouragingstudents’ critical thinking, inquiry, and self-reflection. They have also providedstudents with valuable context provided by primary sources and historical doc-uments and allowed the students to reflect on the entirety of their education.
101

References
[1] Vannevar Bush. As we may think. Atlantic Monthly, (176):101–108, 71945.
[2] Alan Fekete, Judy Kay, Jeff Kingston, and Kapila Wimalaratne. Sup-porting reflection in introductory computer science. In Proc of the 31stSIGCSE Technical Symp on Computer Science Education, SIGCSE ’00,pages 144–148. ACM, 2000.
[3] Susan E. George. Learning and the reflective journal in computer science.In Proc. of the Twenty-fifth Australasian Conf. on Comp. Sci., ACSC ’02,pages 77–86. Australian Computer Society, Inc., 2002.
[4] Nancy Leveson. Safeware: System Safety and Computers, chapter Ap-pendix A - Medical Devices: The Therac-25 story. Addison-Wesley, 1995.
[5] Ada Lovelace. Sketch of the analytical engine invented by charles babbage:Note A. http://www.fourmilab.ch/babbage/sketch.html. Accessed:2019-04-24.
[6] Jeffrey A. Stone. Using reflective blogs for pedagogical feedback in CS1. InProc of the 43rd ACM Technical Symp on Computer Science Education,SIGCSE ’12, pages 259–264. ACM, 2012.
[7] Jeffrey A. Stone and Elinor M. Madigan. Integrating reflective writing inCS/IS. SIGCSE Bull., 39(2):42–45, June 2007.
[8] Ellen Ullman. Close to the Machine: Technophilia and Its Discontents.City Lights Publishers, 2001.
[9] Tammy VanDeGrift. Coupling pair programming and writing: Learningabout students’ perceptions and processes. In Proc of the 35th SIGCSETechnical Symp on Comp Sci Ed, SIGCSE ’04, pages 2–6. ACM, 2004.
[10] D.A. Winsor. Communication failures contributing to the Challenger ac-cident: an example for technical communicators. IEEE Transactions onProfessional Communication, 31(3):101–107, 9 1998.
102
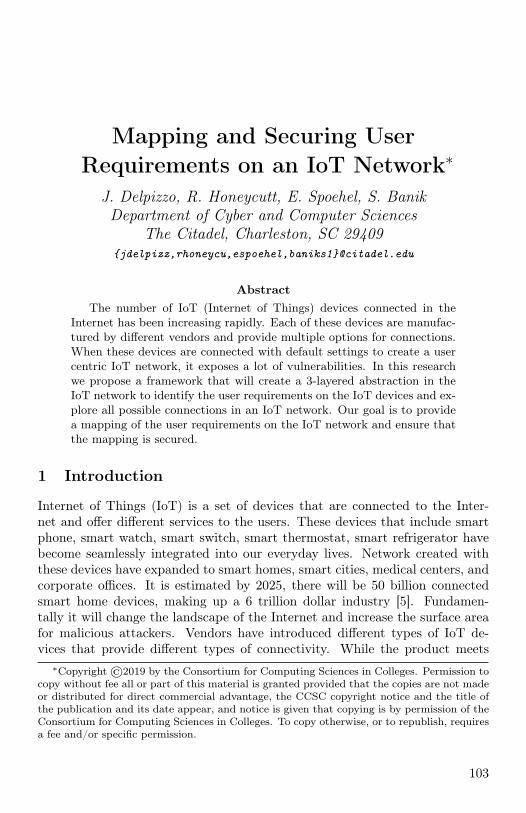
Mapping and Securing UserRequirements on an IoT Network∗
J. Delpizzo, R. Honeycutt, E. Spoehel, S. BanikDepartment of Cyber and Computer Sciences
The Citadel, Charleston, SC 29409{jdelpizz,rhoneycu,espoehel,baniks1}@citadel.edu
AbstractThe number of IoT (Internet of Things) devices connected in the
Internet has been increasing rapidly. Each of these devices are manufac-tured by different vendors and provide multiple options for connections.When these devices are connected with default settings to create a usercentric IoT network, it exposes a lot of vulnerabilities. In this researchwe propose a framework that will create a 3-layered abstraction in theIoT network to identify the user requirements on the IoT devices and ex-plore all possible connections in an IoT network. Our goal is to providea mapping of the user requirements on the IoT network and ensure thatthe mapping is secured.
1 Introduction
Internet of Things (IoT) is a set of devices that are connected to the Inter-net and offer different services to the users. These devices that include smartphone, smart watch, smart switch, smart thermostat, smart refrigerator havebecome seamlessly integrated into our everyday lives. Network created withthese devices have expanded to smart homes, smart cities, medical centers, andcorporate offices. It is estimated by 2025, there will be 50 billion connectedsmart home devices, making up a 6 trillion dollar industry [5]. Fundamen-tally it will change the landscape of the Internet and increase the surface areafor malicious attackers. Vendors have introduced different types of IoT de-vices that provide different types of connectivity. While the product meets
∗Copyright ©2019 by the Consortium for Computing Sciences in Colleges. Permission tocopy without fee all or part of this material is granted provided that the copies are not madeor distributed for direct commercial advantage, the CCSC copyright notice and the title ofthe publication and its date appear, and notice is given that copying is by permission of theConsortium for Computing Sciences in Colleges. To copy otherwise, or to republish, requiresa fee and/or specific permission.
103
the functionality requirements, it may not always meet security requirements.A unsuspecting user may purchase IoT devices to add convenience to theirlives. However, when these devices are connected to the home IoT network,they open major gaps in the existing network that can be exploited to exposeprivate information or create a botnet, like the mirai botnet, to infect othersystems.
We propose a framework of three layers in an IoT network. For a set ofIoT devices, the physical layer identifies all possible connections among thesedevices, the requirement layer identifies all the connections required by the userfor using these devices, and the logical layer maps the user requirements on thephysical network. First the user needs to identify the devices that they wouldlike to have connected in their home IoT Network. We propose an algorithmthat will identify all the physical connections between the user selected devices.Next we get the requirement of user for connecting these devices. For example,the user wants to use the smart phone to control the temperature. We proposean algorithm that maps the requirement of the user on the physical networkof IoT devices. We identify the physical connections that are used to map theuser requirements. Our goal is to design the secured logical layer that will mapthe user requirements on the physical network and restrict the connections thatare not used in the mapping.
The remainder of this paper is organized as follows. In Section 2, we presentthe recent research in IoT security from the literature. Section 3 describes ourSystem Model. Section 4 outlines the proposed algorithms. In Section 5, wediscuss our experimental testbed and results. Section 6 provides ideas for futurework and concludes the paper.
2 Literature Review
Lee et. al. [1] has described different types of IoT devices and their networkingtechnologies and outlined different types of attacks on these devices. The au-thors have proposed some recommendations for securing the smart home thatinclude robust user authentication, device authentication, network monitoring,secure key management, and physical protection. Kolias et. al. in [2] havecreated IoT security labs that include a light switched system, remote plantwatering system, and system to automatically control devices. Security flawsencountered by the authors are insecure web applications, wireless protocolvulnerabilities, architectural vulnerabilities, and limits on resource availableon the IoT devices for security. In [3], the authors explains the holistic aspectsof smart home security. This requires security in depth, integrated hardware,software, network, and application layers. Some core issues addressed by theauthors are on the computational and energy constraints of hardware, access
104

control, routine software updates, protocol diversity, and loopholes in machinelearning at the application layer. Jjung et. al. [4] have proposed to divide anIoT network into the Task, Interface, and Interaction layers. Semantic depen-dency links are generated to create the Interface layer that connects entitiesacross the task layer. Once the interface layer is created, the authors proposedalgorithm that searches for semantically matching interfaces.
3 Proposed System Model
Our proposed system model creates a three layered abstraction (Figure 1) inan IoT network. The bottom layer which is the Physical Layer is composedof all the physical connections present in the IoT network for a given set ofIoT devices. The top layer that keeps track of all of the connections that theuser wants is called the Requirements Layer. The middle layer that is calledthe Logical Layer is in essence the Requirements layer superimposed onto thePhysical Layer.
Figure 1: Diagram of LayerModel
Figure 2: Graph example ofLayer Model
Each layer is represented with a graph (Figure 2) where vertices are devicesand edges are the connections between those devices. In the Physical LayerGraph (PLG), the graph describes the connectivity between the devices. Avariety of common protocols that characterize the edges at this level includeWi-Fi (IEEE 802.11), Bluetooth, Zigbee, and Ethernet. In the RequirementLayer Graph (RLG), we connect two vertices with an edge if that connectiv-ity is required by the user. The Logical Layer Graph (LLG) includes all thevertices from RLG but it includes only the edges that are required to map theRLG into PLG. For any edge that exists in the RLG we find all of the pathsfrom those two vertices in the PLG, those paths are then added to LLG. Thepoint of constructing the LLG is to remove or block unnecessary connectionsthat exists in PLG which might be exploited by attackers. After creating theLLG, we prune the LLG to create a Secured Logical Layer Graph (SLLG). Forconstructing the SLLG, we analyze the security of each path in the LLG, andkeep the path that is secured for each mapping of RLG onto PLG.
105

4 Proposed Algorithms
In this section we present two algorithms. Algorithm 1 constructs PLG for agiven a set of IoT devices. Algorithm 2 maps each edge in RLG into PLG andconstructs LLG.
Algorithm 1 starts with scanning all devices connected to the host machineand records information for connected devices in a database. Then for eachdevice in the database it requests, scans, and records the connection informa-tion in the database. The algorithm stops when all the devices in the databaseare scanned. The approach is very similar to a breath first search.
Algorithm 2 for mapping RLG to PLG traverses the adjacency matrix ofRLG to discover all paths in RLG. Then it passes two nodes and the list to the
106

procedure CreatePaths. CreatePaths checks if there is the same connectionin the PLG. If the path is found in PLG then it is added to the LLG. Thecomplexity of Algorithm 2 is M ∗N2 where M is number of nodes in RLG andN is the number of nodes in PLG.
5 Experiment
To test Algorithm 1 for constructing PLG, we created a home IoT networkwith a computer, a Samsung Galaxy phone, an Echo Dot, a Google Home, aNest Thermostat, a router, a Smart Hub and a bulb. Using a python scriptutilizing bluetool for bluetooth scanning and the bash command iwlist for Wi-fi scanning, the program actively listened for the command to scan on eachvirtual machine, the virtual machine controller (VMC) gave the command andall the devices used Secure File Copy (SCP) to transfer their portion of thedatabase to the VMC which then combined the database parts to form thePLG [6]. The PLG is shown in Figure 3. A snapshot of the database is shownin Figure 5.
To demonstrate the effectiveness of Algorithm 2 for mapping RLG to PLG,we use PLG constructed by Algorithm 1. For the RLG we used different typesof connectivity requirements in IoT network that users may need. An exampleof RLG is shown in Figure 4. A snapshot of the output of Algorithm 2 is shownin Figure 6.
Figure 3: PLG Example Figure 4: RLG Example
6 Conclusion
The number of IoT devices are growing rapidly. Many of these devices leave aplethora of security and privacy concerns for users when they are connected totheir home network. In our research we propose a three layered abstraction ofIoT Network - Physical Layer, Logical Layer and Requirement Layer. We pro-pose algorithms for constructing Physical Layer Graph (PLG) and mapping ofRequirement Layer Graph (RLG) onto Physical Layer Graph for IoT Network.Our ultimate goal is to create a Secured Logical Layer Graph (SLLG) of IoT
107
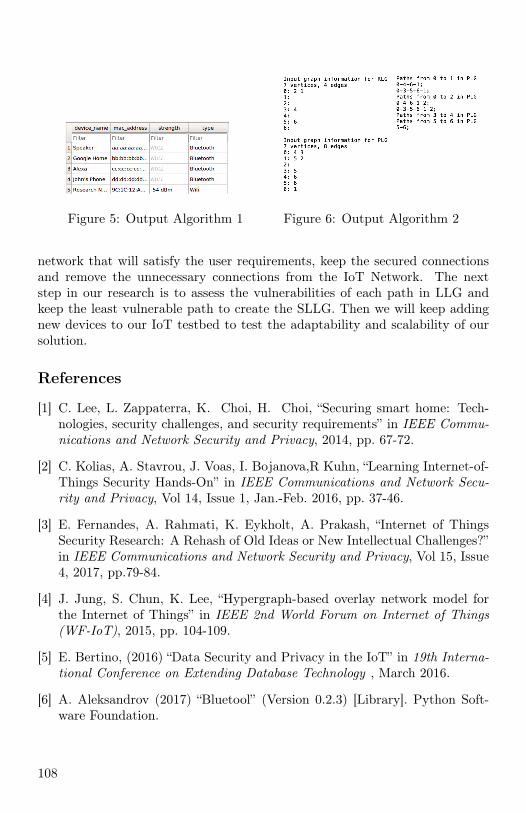
Figure 5: Output Algorithm 1 Figure 6: Output Algorithm 2
network that will satisfy the user requirements, keep the secured connectionsand remove the unnecessary connections from the IoT Network. The nextstep in our research is to assess the vulnerabilities of each path in LLG andkeep the least vulnerable path to create the SLLG. Then we will keep addingnew devices to our IoT testbed to test the adaptability and scalability of oursolution.
References
[1] C. Lee, L. Zappaterra, K. Choi, H. Choi, “Securing smart home: Tech-nologies, security challenges, and security requirements” in IEEE Commu-nications and Network Security and Privacy, 2014, pp. 67-72.
[2] C. Kolias, A. Stavrou, J. Voas, I. Bojanova,R Kuhn, “Learning Internet-of-Things Security Hands-On” in IEEE Communications and Network Secu-rity and Privacy, Vol 14, Issue 1, Jan.-Feb. 2016, pp. 37-46.
[3] E. Fernandes, A. Rahmati, K. Eykholt, A. Prakash, “Internet of ThingsSecurity Research: A Rehash of Old Ideas or New Intellectual Challenges?”in IEEE Communications and Network Security and Privacy, Vol 15, Issue4, 2017, pp.79-84.
[4] J. Jung, S. Chun, K. Lee, “Hypergraph-based overlay network model forthe Internet of Things” in IEEE 2nd World Forum on Internet of Things(WF-IoT), 2015, pp. 104-109.
[5] E. Bertino, (2016) “Data Security and Privacy in the IoT” in 19th Interna-tional Conference on Extending Database Technology , March 2016.
[6] A. Aleksandrov (2017) “Bluetool” (Version 0.2.3) [Library]. Python Soft-ware Foundation.
108
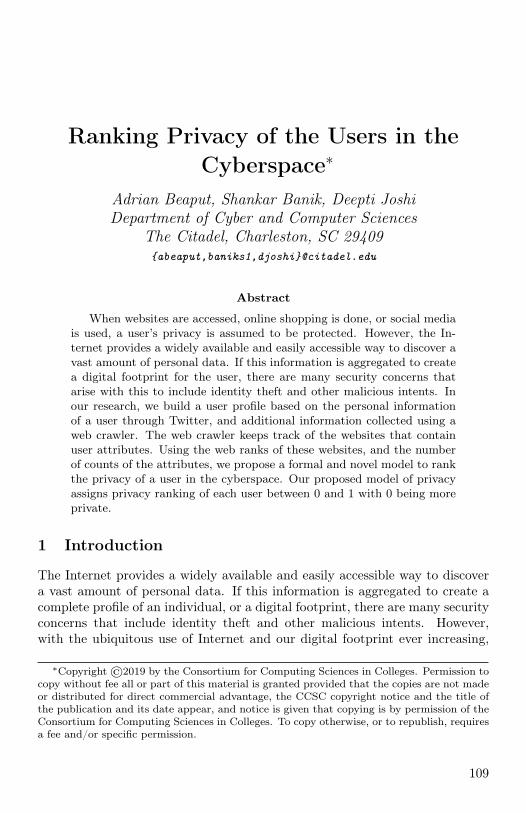
Ranking Privacy of the Users in theCyberspace∗
Adrian Beaput, Shankar Banik, Deepti JoshiDepartment of Cyber and Computer Sciences
The Citadel, Charleston, SC 29409{abeaput,baniks1,djoshi}@citadel.edu
Abstract
When websites are accessed, online shopping is done, or social mediais used, a user’s privacy is assumed to be protected. However, the In-ternet provides a widely available and easily accessible way to discover avast amount of personal data. If this information is aggregated to createa digital footprint for the user, there are many security concerns thatarise with this to include identity theft and other malicious intents. Inour research, we build a user profile based on the personal informationof a user through Twitter, and additional information collected using aweb crawler. The web crawler keeps track of the websites that containuser attributes. Using the web ranks of these websites, and the numberof counts of the attributes, we propose a formal and novel model to rankthe privacy of a user in the cyberspace. Our proposed model of privacyassigns privacy ranking of each user between 0 and 1 with 0 being moreprivate.
1 Introduction
The Internet provides a widely available and easily accessible way to discovera vast amount of personal data. If this information is aggregated to create acomplete profile of an individual, or a digital footprint, there are many securityconcerns that include identity theft and other malicious intents. However,with the ubiquitous use of Internet and our digital footprint ever increasing,
∗Copyright ©2019 by the Consortium for Computing Sciences in Colleges. Permission tocopy without fee all or part of this material is granted provided that the copies are not madeor distributed for direct commercial advantage, the CCSC copyright notice and the title ofthe publication and its date appear, and notice is given that copying is by permission of theConsortium for Computing Sciences in Colleges. To copy otherwise, or to republish, requiresa fee and/or specific permission.
109
understanding how exposed we are online is a critical problem to solve. Wheninformation is posted online on different websites open to the public, onlineshopping is done, or social media is used, a user assumes that their privacy isprotected.
Privacy is defined as the state of being free from the public eye; however,when information is posted on the Internet it loses its state of privacy. Privacyon social media then translates to being the concealment of information thatreveals personally identifiable information (PII) which include Social SecurityNumber, Passport Number, Driving License Number, etc. Some of these PIIare directly made available by the users or can be derived from information.
In this research, our goal is to build a digital footprint of a user and thenanalyze and rank the user’s privacy using our own proposed novel privacy met-ric (see Section 3) on the scale of 0 to 1, with 0 being most private, and 1 beingleast private. To achieve this, we build a user profile based the personal infor-mation that an individual makes available on the web. The initial data pointscollected using a user’s social media profile, are ran through a web crawler.The web crawler provides new information about the user, which also providesa feedback loop into the crawler to collect additional information. Based onthe information collected and aggregated using the web crawler, we propose aformal model to rank the privacy of a user in the cyberspace. Industry andgovernment agencies that deal with sensitive information can use our model tocalculate the privacy of the users. This information will be useful when usersare given access to sensitive information. If a user is less private, then theprobability of leaking sensitive information through that user will be higher.
Our paper is organized as follows. Section 2 provides literature review. Insection 3, we describe our proposed privacy ranking metric. Section 4 providesour system model. In section 5, we describe our experimentation setup andpresent the obtained results. Finally, section 6 outlines the conclusion andfuture work.
2 Literature Review
Cheung et al in [1] have evaluated the privacy risk of user shared images.They have explored the possibility of whether or not widely accessible userimages invade the privacy of a user. This is done by de-anonymizing socialgraphs and online profiles. Zafarani et al in [4] have presented a behavioral-modeling approach for connecting users across social media sites. They haveproposed a methodology called MOBIUS that identifies user’s unique behav-ioral patterns, constructs features that exploit information redundancies, andemploys machine learning for effective user identification. Narayanan et al in[3] have looked at de-anonymizing users across heterogeneous social comput-
110
ing platforms. They have showed that correlations in users’ activity patternsacross different sites provide enough evidence that the two profiles belong tothe same user. Kamiyama et al in [2] have presented a unified metric for mea-suring anonymity and privacy with applications to online social network. Theyhave developed a privacy metric that first measures the current anonymity fora specific question using the user’s present blog posts, and estimates the user’sfuture privacy by predicting future blog posts.
3 Privacy Metric
Our proposed Privacy Metric first identifies the attributes of a user that arepresent in the cyberspace. Next we check the web rank value for each of thewebsite that contains these attributes. If the website is frequently visited, itsweb rank value will be higher which will make the attribute that appears at thiswebsite less private. We calculate the number of times the attribute appearsin different websites. Based on the web rank values of all the websites thatcontain the attribute, we use a maximizing expression that finds the highestweb rank value for the attribute. Next, we derive an expression for privacyranking of the user using the maximum rank of value of each of the attributeand its count. We normalize the expression so that privacy ranking of each userwill be between 0 and 1 with 0 being more private and 1 being less private.The derivation of the privacy ranking of the user is explained below.
Let us assume that user u uses Social Media SM from where we obtain theattributes A = a1, a2, a3, . . . , . . . , an. We create a subset S = a1, a2, a3, . . . , amwhere S ∈ A. For S, we find the derived set of attributes DA(S). DA is theset of attributes that can be found about user u using the known attributes.Given S and u as input to the web crawler, we find DA(S). The Web Crawlerfinds the webpages WP1, WP2, WP3, . . ., . . ., WPk. Let us assume that WP1
reveals attributes b1, b2, b3; WP2 reveals attributes b2, b3, b4; WP3 reveals b3,b4, b5; . . . ;. . .; WPk reveals b1, b2, b3, b4, b5, b6, . . ., bt. We obtain the WebRank values for each of WP1, WP2, WP3, . . ., WPk. Let us assume that WebRank of WPi is WR(WPi) where 1 ≤ i ≤ k. We define Matrix B where B[i][j]= 1 if bj appears in WPi. 1 ≤ i ≤ k and 1 ≤ j ≤ t. We define vector R whereR[i][1] = WR(WPi), 1 ≤ i ≤ k.
B =
1 1 1 0 0 . . . 00 1 1 1 0 . . . 00 0 1 1 1 . . . 0...0 0 0 0 1 . . . 1
, R =
WR[WP1]WR[WP2]WR[WP3]...WR[WPk]
111
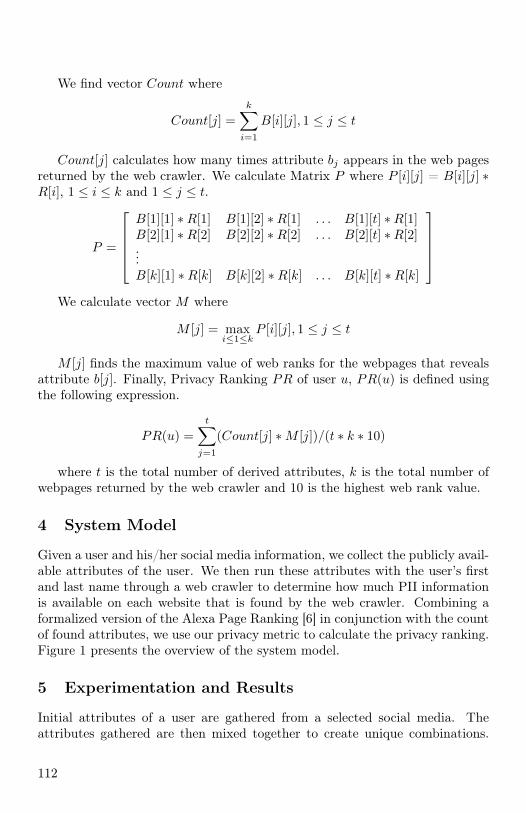
We find vector Count where
Count[j] =
k∑i=1
B[i][j], 1 ≤ j ≤ t
Count[j] calculates how many times attribute bj appears in the web pagesreturned by the web crawler. We calculate Matrix P where P [i][j] = B[i][j] ∗R[i], 1 ≤ i ≤ k and 1 ≤ j ≤ t.
P =
B[1][1] ∗R[1] B[1][2] ∗R[1] . . . B[1][t] ∗R[1]B[2][1] ∗R[2] B[2][2] ∗R[2] . . . B[2][t] ∗R[2]...B[k][1] ∗R[k] B[k][2] ∗R[k] . . . B[k][t] ∗R[k]
We calculate vector M where
M [j] = maxi≤1≤k
P [i][j], 1 ≤ j ≤ t
M [j] finds the maximum value of web ranks for the webpages that revealsattribute b[j]. Finally, Privacy Ranking PR of user u, PR(u) is defined usingthe following expression.
PR(u) =
t∑j=1
(Count[j] ∗M [j])/(t ∗ k ∗ 10)
where t is the total number of derived attributes, k is the total number ofwebpages returned by the web crawler and 10 is the highest web rank value.
4 System Model
Given a user and his/her social media information, we collect the publicly avail-able attributes of the user. We then run these attributes with the user’s firstand last name through a web crawler to determine how much PII informationis available on each website that is found by the web crawler. Combining aformalized version of the Alexa Page Ranking [6] in conjunction with the countof found attributes, we use our privacy metric to calculate the privacy ranking.Figure 1 presents the overview of the system model.
5 Experimentation and Results
Initial attributes of a user are gathered from a selected social media. Theattributes gathered are then mixed together to create unique combinations.
112

Figure 1: System model for ranking a user’s privacy on the webThese combinations are then added to a search queue that is ran through ourweb crawler. Our web crawler starts off by entering the search entry from thequeue into a Google search. We then collect all of the URLs from the Googlesearch. Each URL collected will be scraped for URLs in the web page andadded to a separate queue. The separate queue gives our breadth first searcha distance of one to limit the number of websites not pertaining to the usersearched. We then combine the two queues and crawl through all the websitesagain. The next time we crawl through the websites we search for PII usingthe formulated regular expressions (see Figure 2).
In concurrence with the search for PII in each website, we also calculate ourformalized version of the Alexa Page Ranking [6]. The Alexa Page Ranking iscalculated based on the number of visits to a website. This number can rangefrom 0 to infinity. In order to formalize the Alexa Page Ranking, we groupedwebpage rankings based on similarity to their Google Page Rank. This allowsus to limit the website rankings from 1 to 10, where 1 is the least visited.For each website searched we create a row in our table and indicate if a PIIattribute is found, and its cardinality (number of times the attribute is foundin the different pages visited) based on our formulated privacy metric. Afterall the websites are crawled for PII, we take the cardinality of the PII attributeand highest ranking of the websites that contain this attribute, apply thesevalues towards calculating the user’s privacy ranking based on our proposedprivacy metric.
For our data collections, we were able to successfully collect data aboutsearched users using our regular expressions and web crawler. The level of ac-curacy varies based on user attributes and websites crawled since our crawlerrelies on the Google search algorithm for accuracy. Then privacy metric wassuccessfully implemented in combination with the web crawler to produce re-sults for the user searched. Figure 3 shows the example of calculating theprivacy values of two users where the first user has privacy value of 0.25 andsecond user has a privacy value of 0.39.
6 Conclusion and Future Work
Users share information about themselves in social media. This informationcan be used to derive more attributes about the user using web crawlers. We
113

Figure 2: Regular expressionsto discover and match user at-tributes
Figure 3: Privacy ranking ob-tained for two sample users –anonymity maintained
analyze the websites that contains these derived attributes. If other users fre-quently visit the website, then the derived attribute contained at that websitebecomes less private. Based on the number of times these attributes appearat the websites, and the web ranking of the websites themselves, we propose anovel privacy ranking method to calculate the privacy of users. The range ofthe privacy rank for each user is between 0 and 1, where 1 means less privateand 0 means more private. Industry and government agencies that deal withsensitive information can use our model to calculate the privacy of their em-ployees. If an employee is less private, then the probability of leaking sensitiveinformation through that employee will be higher. As part of future work, wewill categorize attributes based on their weights toward privacy.
References
[1] M. Cheung, J. She, “Evaluating the Privacy Risk of User-Shared Images” inACM Transactions on Multimedia Computing, Communications, and Applica-tions (TOMM), Volume 12 Issue 4s, Article 58, November 2016.
[2] K. Kamiyama, T. Ngoc, I. Echizen, H. Yoshiura, “Unified Metric for MeasuringAnonymity and Privacy with Application to Online Social Network” in 6th In-ternational Conference on Intelligent Information Hiding and Multimedia SignalProcessing, 2010, pp. 506-509.
[3] A. Narayanan, V. Shmatikov, “De-anonymizing Social Networks” in 30th IEEESymposium on Security and Privacy, 2009, pp. 173-187.
[4] R. Zafarani, H. Liu, “Connecting users across social media sites: a behavioral-modeling approach” in 19th ACM SIGKDD international conference on Knowl-edge discovery and data mining, 2013, pp. 41-49.
[5] E. Bertino, (2016) “Data Security and Privacy in the IoT” in 19th InternationalConference on Extending Database Technology , March 2016.
[6] https://www.alexa.com/siteinfo.
114

One Department, Four UndergraduateComputing Programs∗
Tony Pittarese, Brian Bennett, Mathew DesjardinsDepartment of Computing
East Tennessee State UniversityJohnson City, TN 37614
{pittares,bennetbt,desjardins}@etsu.edu
Abstract
While most departments accredited by the ABET Computing Ac-creditation Commission offer only one undergraduate program, the De-partment of Computing at East Tennessee State University houses threesuch programs: Computer Science, Information Systems, and Informa-tion Technology. In fall 2019 a fourth undergraduate program in Cy-bersecurity and Modern Networks will be added. Combining multipleprograms in a single department allows for increased student opportu-nity, improved faculty utilization, efficient course scheduling, streamlinedaccreditation and assessment management, improved student retention,and enhanced financial stability to support growth.
1 Introduction
The East Tennessee State University Computer Science Department was foundedin 1975 as one of the first computing-focused departments in the Tennesseehigher education system and the region overall[8]. In subsequent years theDepartment has added multiple undergraduate programs making it, as of thiswriting, the only ABET-accredited institution to house three or more ABET-accredited computing programs in a single academic department served by asingle team of faculty that reports to one department chair [2]. Reflective of
∗Copyright ©2019 by the Consortium for Computing Sciences in Colleges. Permission tocopy without fee all or part of this material is granted provided that the copies are not madeor distributed for direct commercial advantage, the CCSC copyright notice and the title ofthe publication and its date appear, and notice is given that copying is by permission of theConsortium for Computing Sciences in Colleges. To copy otherwise, or to republish, requiresa fee and/or specific permission.
115

its unique structure, in 2010 the department changed its name to the Depart-ment of Computing. The department employs 16 tenured/tenure-track faculty,5 full-time non-tenured faculty, 19 graduate students, and 5 full-time supportstaff. The Department currently enrolls 500 students, graduates 80-85 studentsper year, and generates over 17,500 credit hours each academic year. (Roughly45% of those hours come from service courses offered to the university as awhole). Rather than operate as four distinct academic departments, or evenas four distinct entities merged into one unit such as a college or school, thedepartment has structured itself as a single, unified department with four in-tegrated programs. This structure provides many positive opportunities forstudents, faculty, staff, and college/university administration. The efficiencysuch a structure affords has proven useful to ensure consistent funding to sup-port growth in a time when overall university attendance has been stagnant orin decline.
2 Curriculum and the “Computing Core”
The Computer Science (CS) program has a traditional theoretical approach,relying heavily on advanced math and disciplines such as computer architec-ture and operating systems. The Information Systems (IS) program focuseson business applications of computing and requires students to complete a 15-hour application emphasis area in management or accounting. The Informa-tion Technology (IT) program serves students interested in applied computingfields such as web development and system administration. The Cybersecurityand Modern Networks (CSMN) program focuses on advanced topics in com-puter security and contemporary networking applications such as Internet ofThings and cloud computing. The structure of the Department’s curriculumhas evolved over its 44-year history to facilitate its current integrated format.Initially, CS and IS programs shared an introductory programming sequencebased on C++ and data structures, while IT students learned Visual Basicand took courses in web design and advanced database [4]. As all programsrequired at least 3 computing electives, the intent was for students to be ableto take courses required in other departmental programs to meet this need.In reality, course prerequisites often made this difficult. The first major steptowards unifying the department around an integrated set of core courses wasmade in 2007 when all undergraduate programs moved to require Java as theintroductory language. While this change was heavily debated at the time [6],it reduced any potential setbacks for students who wished to switch programstheir freshman year and also established a programming lingua franca amongall programs to serve as a foundation for later coursework[8]. This went along way toward resolving prerequisite issues, providing students with a robust
116
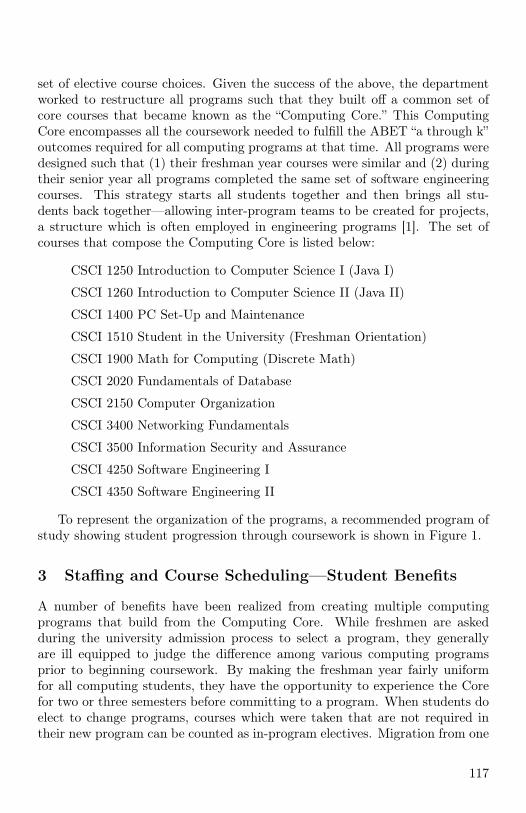
set of elective course choices. Given the success of the above, the departmentworked to restructure all programs such that they built off a common set ofcore courses that became known as the “Computing Core.” This ComputingCore encompasses all the coursework needed to fulfill the ABET “a through k”outcomes required for all computing programs at that time. All programs weredesigned such that (1) their freshman year courses were similar and (2) duringtheir senior year all programs completed the same set of software engineeringcourses. This strategy starts all students together and then brings all stu-dents back together—allowing inter-program teams to be created for projects,a structure which is often employed in engineering programs [1]. The set ofcourses that compose the Computing Core is listed below:
CSCI 1250 Introduction to Computer Science I (Java I)
CSCI 1260 Introduction to Computer Science II (Java II)
CSCI 1400 PC Set-Up and Maintenance
CSCI 1510 Student in the University (Freshman Orientation)
CSCI 1900 Math for Computing (Discrete Math)
CSCI 2020 Fundamentals of Database
CSCI 2150 Computer Organization
CSCI 3400 Networking Fundamentals
CSCI 3500 Information Security and Assurance
CSCI 4250 Software Engineering I
CSCI 4350 Software Engineering II
To represent the organization of the programs, a recommended program ofstudy showing student progression through coursework is shown in Figure 1.
3 Staffing and Course Scheduling—Student Benefits
A number of benefits have been realized from creating multiple computingprograms that build from the Computing Core. While freshmen are askedduring the university admission process to select a program, they generallyare ill equipped to judge the difference among various computing programsprior to beginning coursework. By making the freshman year fairly uniformfor all computing students, they have the opportunity to experience the Corefor two or three semesters before committing to a program. When students doelect to change programs, courses which were taken that are not required intheir new program can be counted as in-program electives. Migration from one
117
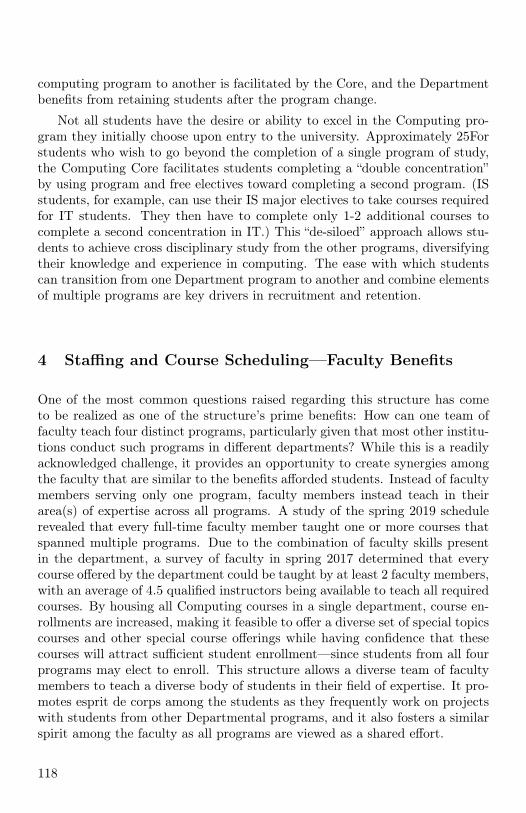
computing program to another is facilitated by the Core, and the Departmentbenefits from retaining students after the program change.
Not all students have the desire or ability to excel in the Computing pro-gram they initially choose upon entry to the university. Approximately 25Forstudents who wish to go beyond the completion of a single program of study,the Computing Core facilitates students completing a “double concentration”by using program and free electives toward completing a second program. (ISstudents, for example, can use their IS major electives to take courses requiredfor IT students. They then have to complete only 1-2 additional courses tocomplete a second concentration in IT.) This “de-siloed” approach allows stu-dents to achieve cross disciplinary study from the other programs, diversifyingtheir knowledge and experience in computing. The ease with which studentscan transition from one Department program to another and combine elementsof multiple programs are key drivers in recruitment and retention.
4 Staffing and Course Scheduling—Faculty Benefits
One of the most common questions raised regarding this structure has cometo be realized as one of the structure’s prime benefits: How can one team offaculty teach four distinct programs, particularly given that most other institu-tions conduct such programs in different departments? While this is a readilyacknowledged challenge, it provides an opportunity to create synergies amongthe faculty that are similar to the benefits afforded students. Instead of facultymembers serving only one program, faculty members instead teach in theirarea(s) of expertise across all programs. A study of the spring 2019 schedulerevealed that every full-time faculty member taught one or more courses thatspanned multiple programs. Due to the combination of faculty skills presentin the department, a survey of faculty in spring 2017 determined that everycourse offered by the department could be taught by at least 2 faculty members,with an average of 4.5 qualified instructors being available to teach all requiredcourses. By housing all Computing courses in a single department, course en-rollments are increased, making it feasible to offer a diverse set of special topicscourses and other special course offerings while having confidence that thesecourses will attract sufficient student enrollment—since students from all fourprograms may elect to enroll. This structure allows a diverse team of facultymembers to teach a diverse body of students in their field of expertise. It pro-motes esprit de corps among the students as they frequently work on projectswith students from other Departmental programs, and it also fosters a similarspirit among the faculty as all programs are viewed as a shared effort.
118

5 Staffing and Course Scheduling—Administrative Ben-efits
Housing all four programs in one department allows one department chair toadminister all programs, one system manager and one assistant system managerto administer computing systems for all programs (7 labs, over 225 machines,1 unified lab image), and two full time student advisors to work with freshmenin all four programs. This has resulted in reduced administrative overhead andexpenses, providing more funds for professional development of faculty andstaff, travel, equipment purchases, and other Departmental priorities. Whilesuch a structure promotes efficient topic coverage within the Department, itintroduces challenges. As faculty members tend to not think of themselvesin terms of individual programs, it has proven helpful to recognize programchampions to be advocates for each program and fulfill program-specific re-sponsibilities in tasks such as accreditation visits. During accreditation visits,time must be taken to explain the unique Department structure and align fac-ulty interviews and other activities so as to provide evaluators the opportunityto become comfortable with the staffing structure employed.
6 Program Outcomes and Assessment
Building off the structure provided by the Computing Core, a set of five “Gen-eral Outcomes” has been defined. These General Outcomes apply to all gradu-ates, regardless of their program. Program-specific outcomes extend the Gen-eral Outcomes similar to how program-specific courses extend the ComputingCore. These outcomes are shown in Figure 2. A key strength of this structuringof outcomes is how it facilitates program assessment [7]. General Outcomes aremeasured either (1) via course-embedded activities and rubrics in ComputingCore courses—most particularly Software Engineering I and II, which serve asthe Computing Core capstone courses—or (2) by a senior exit exam taken byall graduates. Regardless of which of these two methods are employed, GeneralOutcome data is collected for all programs at one time. Although all scores,rubrics, results, etc. are anonymous, each of these are tagged with the student’sprogram of study to facilitate data reporting and analysis. Program-specificoutcomes are collected in courses unique to individual program. To ease as-sessment workload, program-specific data is collected only for students in theparticular program. (No program-specific data is captured for students takingelective courses outside of their program.)
119

Figure 2: General and program-specific outcomes.
It is common for assessment-driven improvements implemented for one pro-gram to also result in improvements for the other programs. In situations whereassessment data reported for one program is lower than that of the other pro-grams, it is possible to compare the course outcomes across all programs tomore precisely pinpoint ways to implement improvement. For example, in2015 it was noted in IT assessment reporting that students were doing poorlyin oral communication. As this was investigated further, it was discovered thatperformance of students varied greatly based on what general education speechcourse they selected. A change was made in all programs to require studentsto take Argumentation and Debate—thereby having an improvement neededin the IT program to drive improvement in all programs. In 2014, tools such asSlack were introduced to improve teamwork skills of CS students in SoftwareEngineering work, which also resulted in improvements across all programs.These examples show how changes introduced to improve performance for oneprogram can also benefit students in all programs. While conducting activitiessuch as Self-Studies for accreditation purposes, the multi-program character ofthe department facilitates reporting. Only one ABET Self-Study document isrequired to maintain accreditation (although outcome reporting and other doc-
120
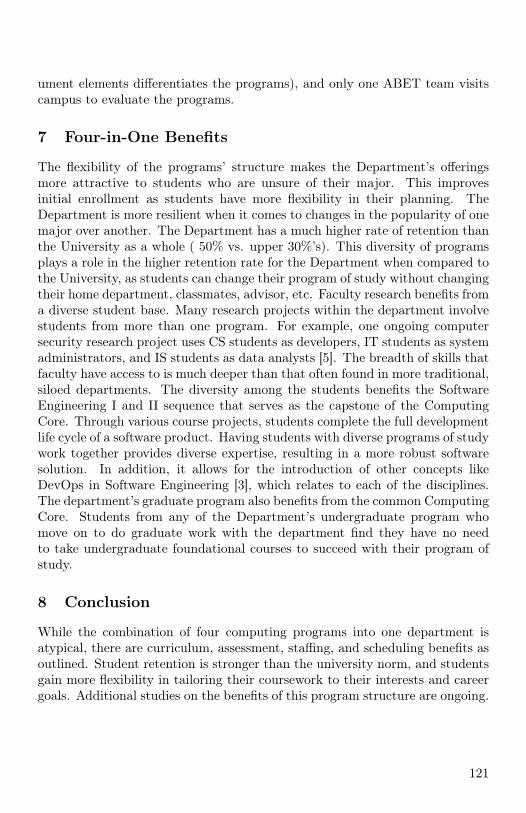
ument elements differentiates the programs), and only one ABET team visitscampus to evaluate the programs.
7 Four-in-One Benefits
The flexibility of the programs’ structure makes the Department’s offeringsmore attractive to students who are unsure of their major. This improvesinitial enrollment as students have more flexibility in their planning. TheDepartment is more resilient when it comes to changes in the popularity of onemajor over another. The Department has a much higher rate of retention thanthe University as a whole ( 50% vs. upper 30%’s). This diversity of programsplays a role in the higher retention rate for the Department when compared tothe University, as students can change their program of study without changingtheir home department, classmates, advisor, etc. Faculty research benefits froma diverse student base. Many research projects within the department involvestudents from more than one program. For example, one ongoing computersecurity research project uses CS students as developers, IT students as systemadministrators, and IS students as data analysts [5]. The breadth of skills thatfaculty have access to is much deeper than that often found in more traditional,siloed departments. The diversity among the students benefits the SoftwareEngineering I and II sequence that serves as the capstone of the ComputingCore. Through various course projects, students complete the full developmentlife cycle of a software product. Having students with diverse programs of studywork together provides diverse expertise, resulting in a more robust softwaresolution. In addition, it allows for the introduction of other concepts likeDevOps in Software Engineering [3], which relates to each of the disciplines.The department’s graduate program also benefits from the common ComputingCore. Students from any of the Department’s undergraduate program whomove on to do graduate work with the department find they have no needto take undergraduate foundational courses to succeed with their program ofstudy.
8 Conclusion
While the combination of four computing programs into one department isatypical, there are curriculum, assessment, staffing, and scheduling benefits asoutlined. Student retention is stronger than the university norm, and studentsgain more flexibility in tailoring their coursework to their interests and careergoals. Additional studies on the benefits of this program structure are ongoing.
121

Figure
1:Recom
mended
progressionthrough
thefour
programsof
study
122

References
[1] ABET. Criteria for accrediting engineering programs, 2018–2019.https://www.abet.org/accreditation/accreditation-criteria/criteria-for-accrediting-engineering-programs-2018-2019.
[2] ABET. ABET accredited programs, 2019. http://main.abet.org/aps/Accreditedprogramsearch.aspx.
[3] B. T. Bennett and M. L. Barrett. Incorporating DevOps into undergraduatesoftware engineering courses: A suggested framework. Journal of Comput-ing Sciences in Colleges, 34(2):180–187, 2018.
[4] T. Countermine and P. Pfeiffer. Implementing an IT concentration in a CSdepartment: content, rationale, and initial impact. In Proceedings of thethirty-first SIGCSE technical symposium on Computer Science education,pages 275–279. ACM, 2000.
[5] B. Franklin J. Dangler M. Lehrfeld, A. Ogle. Dimensioning spam–an indepth examination of why users click on deceptive emails. Journal of Com-puting Sciences in Colleges, 30(2):213–219, 2014.
[6] ETSU Department of Computing. Proposal for using Java as our teachinglanguage. unpublished internal document, 2006.
[7] D. Sanderson. Assessment in the department of computer and informationsciences at East Tennessee State University: An overview. InternationalJournal of Engineering Education, 25(5):920–927, 2009.
[8] D. Tarnoff. Interview with Don Bailes, founding chair of the department ofcomputer science: History of the computing department at East TennesseeState University.
123
Examining Strategies to Improve StudentSuccess in CS1∗
Janet T. Jenkins and Mark G. TerwilligerComputer Science and Information Systems
University of North AlabamaFlorence, AL 35632
{jltruitt,mterwilliger}@una.edu
Abstract
With the pervasiveness of the necessity of computational thinkingacross fields, more universities are requiring courses that build students’ability to think computationally. Computer Science 1 (CS1) is one suchcourse where computational thinking is required. This paper summarizesthe work of two CS faculty who co-taught separate sections of CS1 forfive semesters. Course modifications were made to augment CS1 withsupport inside and outside of the classroom for students to be successful.The use of in class tutors and requiring design documents were two ofthe primary modifications made to the course. A variety of data wascollected in areas such as student planning, program design, frustration,and resources used to determine what relationships impact student suc-cess. One of the main benefits observed was an increase in the studentpass rate.
1 Introduction
There have been many efforts to seek out better ways to teach Computer Sci-ence 1 (CS1), from lecture, to lab, to pair programming, to flipped classrooms.However, Watson and Li claim that a “pass rate of CS1 courses of 67.7%, andcomparable results were found based on course size, and institutional gradelevel” [10]. Additionally, they assert “contributions of this study have been to
∗Copyright ©2019 by the Consortium for Computing Sciences in Colleges. Permission tocopy without fee all or part of this material is granted provided that the copies are not madeor distributed for direct commercial advantage, the CCSC copyright notice and the title ofthe publication and its date appear, and notice is given that copying is by permission of theConsortium for Computing Sciences in Colleges. To copy otherwise, or to republish, requiresa fee and/or specific permission.
124

show that CS1 pass rates vary by different countries, have not improved overtime, and they are largely unaffected by the programming language taught inthe course.” [10]. There is no shortage of research in efforts on improving CS1,and yet pass rates have not made a turn for the better.
There is a global need for an increasing number of skilled programmers.The United States Bureau of Labor Statistics show that software developerjobs are predicted to grow at a rate of 24% as far out as 2026. This growth rateis much faster than the average for all occupations reported [6]. Additionally,the National Center for Education Statistics and Code.org cited that in 2015,there were just under 530,000 open computing jobs and only 60,000 studentsgraduating with computer science degrees [4]. The gap between needed skilleddevelopers and actual skilled developers could lead to somewhat of a crisiswithout attention to mass preparation for current students. Already, we seean uptick in the number of states in the US requiring at least some level ofcomputer science education in K-12 [1].
This gap provides motivation for CS1 educators to provide a course withembedded support to help students master the rigorous material in CS1. Al-though K-12 state CS requirements are on the rise, there are still schools thatdo not offer CS curriculum [1], meaning some students will still lack the neces-sary background in computational problem solving. Shein posits that learningto think like a programmer is important for students in a variety of fields, evenif they do not need the coding skills in their work. In effect, computationalthinking helps students to break larger problems down into smaller problemsin order to solve them [8].
2 Overview and Methodology
2.1 Background
In our CS1 course, the same programming language has been used for over 15years, taught by a variety of professors, with a variety of teaching styles. Wedefine pass as a student earning a grade of A, B, or C. Our institution shows arange of CS1 pass rates from lows under 45% to highs that rarely exceed 70%.In fact, before we began our study, a pass rate of 60% or higher was achievedin only 35% of the semesters. Additionally, assessment of our program showedthat our upper level students were not prepared to build an appropriate designfor their larger projects. Specifically, too many of the students did not developalgorithmic thought prior to writing code. Often, when advising our studentswho are struggling or are considering changing their major from CS, frustrationis dominant in their demeanor.
We want students to be able to transition from critical thinking to computa-tional thinking so computational thinking can become a tool for their problem
125
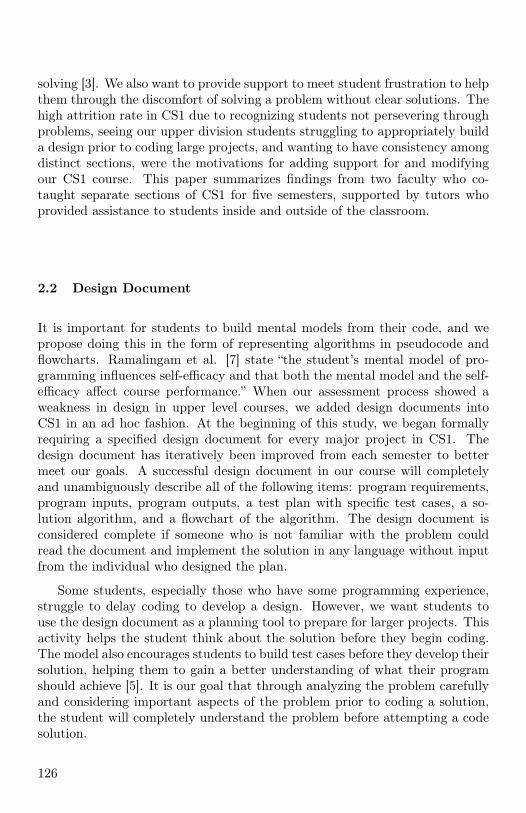
solving [3]. We also want to provide support to meet student frustration to helpthem through the discomfort of solving a problem without clear solutions. Thehigh attrition rate in CS1 due to recognizing students not persevering throughproblems, seeing our upper division students struggling to appropriately builda design prior to coding large projects, and wanting to have consistency amongdistinct sections, were the motivations for adding support for and modifyingour CS1 course. This paper summarizes findings from two faculty who co-taught separate sections of CS1 for five semesters, supported by tutors whoprovided assistance to students inside and outside of the classroom.
2.2 Design Document
It is important for students to build mental models from their code, and wepropose doing this in the form of representing algorithms in pseudocode andflowcharts. Ramalingam et al. [7] state “the student’s mental model of pro-gramming influences self-efficacy and that both the mental model and the self-efficacy affect course performance.” When our assessment process showed aweakness in design in upper level courses, we added design documents intoCS1 in an ad hoc fashion. At the beginning of this study, we began formallyrequiring a specified design document for every major project in CS1. Thedesign document has iteratively been improved from each semester to bettermeet our goals. A successful design document in our course will completelyand unambiguously describe all of the following items: program requirements,program inputs, program outputs, a test plan with specific test cases, a so-lution algorithm, and a flowchart of the algorithm. The design document isconsidered complete if someone who is not familiar with the problem couldread the document and implement the solution in any language without inputfrom the individual who designed the plan.
Some students, especially those who have some programming experience,struggle to delay coding to develop a design. However, we want students touse the design document as a planning tool to prepare for larger projects. Thisactivity helps the student think about the solution before they begin coding.The model also encourages students to build test cases before they develop theirsolution, helping them to gain a better understanding of what their programshould achieve [5]. It is our goal that through analyzing the problem carefullyand considering important aspects of the problem prior to coding a solution,the student will completely understand the problem before attempting a codesolution.
126
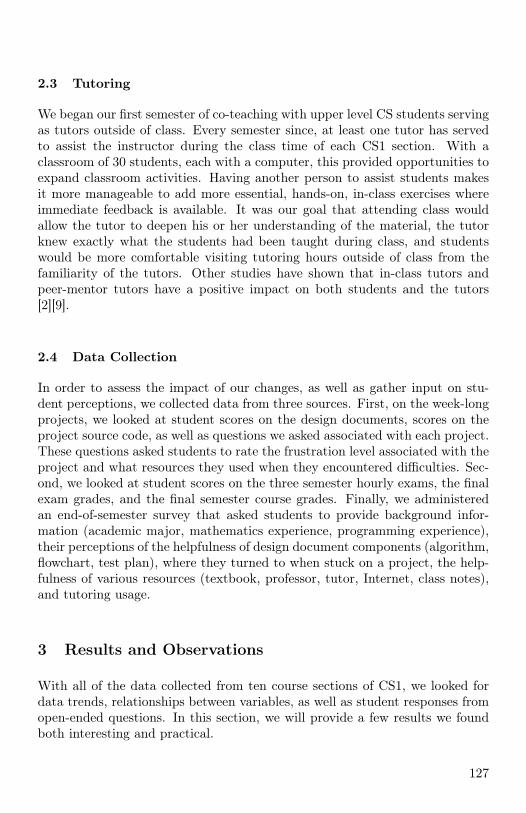
2.3 Tutoring
We began our first semester of co-teaching with upper level CS students servingas tutors outside of class. Every semester since, at least one tutor has servedto assist the instructor during the class time of each CS1 section. With aclassroom of 30 students, each with a computer, this provided opportunities toexpand classroom activities. Having another person to assist students makesit more manageable to add more essential, hands-on, in-class exercises whereimmediate feedback is available. It was our goal that attending class wouldallow the tutor to deepen his or her understanding of the material, the tutorknew exactly what the students had been taught during class, and studentswould be more comfortable visiting tutoring hours outside of class from thefamiliarity of the tutors. Other studies have shown that in-class tutors andpeer-mentor tutors have a positive impact on both students and the tutors[2][9].
2.4 Data Collection
In order to assess the impact of our changes, as well as gather input on stu-dent perceptions, we collected data from three sources. First, on the week-longprojects, we looked at student scores on the design documents, scores on theproject source code, as well as questions we asked associated with each project.These questions asked students to rate the frustration level associated with theproject and what resources they used when they encountered difficulties. Sec-ond, we looked at student scores on the three semester hourly exams, the finalexam grades, and the final semester course grades. Finally, we administeredan end-of-semester survey that asked students to provide background infor-mation (academic major, mathematics experience, programming experience),their perceptions of the helpfulness of design document components (algorithm,flowchart, test plan), where they turned to when stuck on a project, the help-fulness of various resources (textbook, professor, tutor, Internet, class notes),and tutoring usage.
3 Results and Observations
With all of the data collected from ten course sections of CS1, we looked fordata trends, relationships between variables, as well as student responses fromopen-ended questions. In this section, we will provide a few results we foundboth interesting and practical.
127
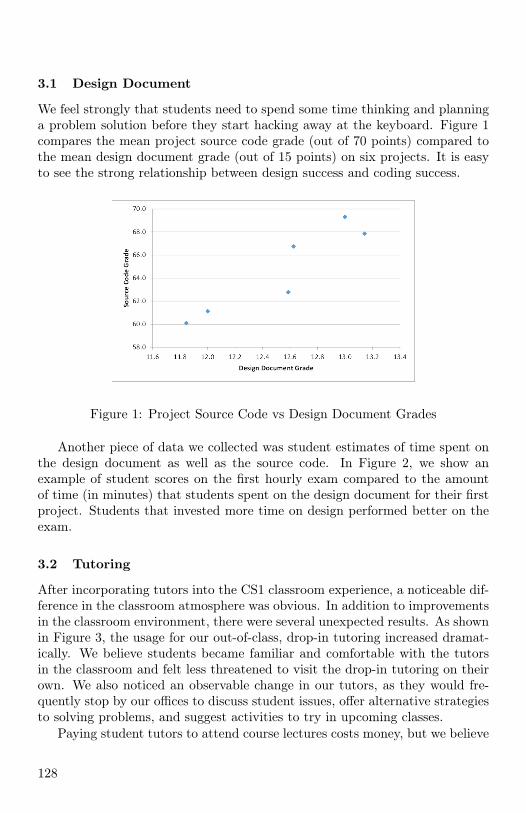
3.1 Design Document
We feel strongly that students need to spend some time thinking and planninga problem solution before they start hacking away at the keyboard. Figure 1compares the mean project source code grade (out of 70 points) compared tothe mean design document grade (out of 15 points) on six projects. It is easyto see the strong relationship between design success and coding success.
Figure 1: Project Source Code vs Design Document Grades
Another piece of data we collected was student estimates of time spent onthe design document as well as the source code. In Figure 2, we show anexample of student scores on the first hourly exam compared to the amountof time (in minutes) that students spent on the design document for their firstproject. Students that invested more time on design performed better on theexam.
3.2 Tutoring
After incorporating tutors into the CS1 classroom experience, a noticeable dif-ference in the classroom atmosphere was obvious. In addition to improvementsin the classroom environment, there were several unexpected results. As shownin Figure 3, the usage for our out-of-class, drop-in tutoring increased dramat-ically. We believe students became familiar and comfortable with the tutorsin the classroom and felt less threatened to visit the drop-in tutoring on theirown. We also noticed an observable change in our tutors, as they would fre-quently stop by our offices to discuss student issues, offer alternative strategiesto solving problems, and suggest activities to try in upcoming classes.
Paying student tutors to attend course lectures costs money, but we believe
128
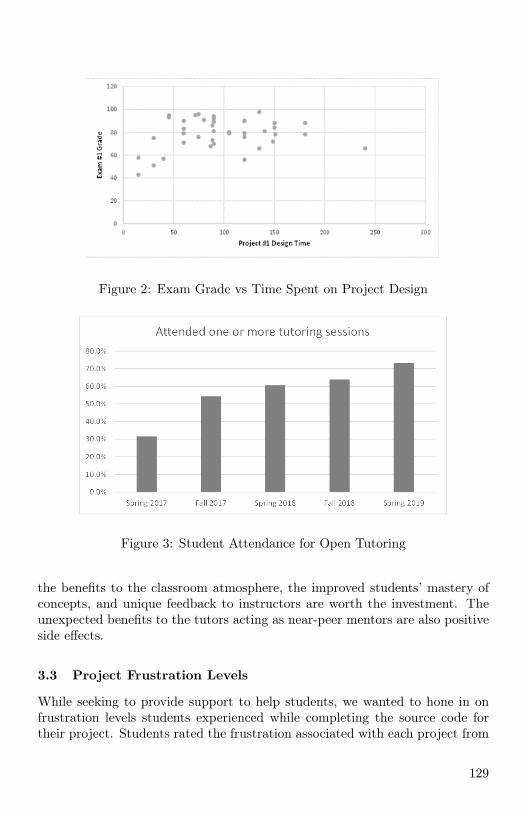
Figure 2: Exam Grade vs Time Spent on Project Design
Figure 3: Student Attendance for Open Tutoring
the benefits to the classroom atmosphere, the improved students’ mastery ofconcepts, and unique feedback to instructors are worth the investment. Theunexpected benefits to the tutors acting as near-peer mentors are also positiveside effects.
3.3 Project Frustration Levels
While seeking to provide support to help students, we wanted to hone in onfrustration levels students experienced while completing the source code fortheir project. Students rated the frustration associated with each project from
129

1 to 10, higher values meaning more frustration. In Figure 4, we looked at thescores on the first hourly exam compared to the students average frustrationlevel on the first three projects. In this example, you could actually predicta student’s exam score with some degree of accuracy just by looking at theircoding frustration level
Figure 4: Exam Grade vs Frustration Level on Projects
We were also interested in where they went for help first when they werefrustrated or hit a road block when they were coding. In each of the fivesemesters, the resource students used when encountering difficulties was tosearch the Internet. This was followed by looking at class notes, visiting thetutor, going to the professor’s office hours, referring to the textbook, and askinga classmate for help. As shown in Figure 5, the student practice of searchingthe Internet for the answer first is trending downwards. Over recent semesters,we have seen a spike in frequency of visits to tutor sessions and professor officehours.
3.4 Course Success Rates
One of the most important data points we are following is the success rates ofour students, not only in CS1 but also in the subsequent course CS2. In the 12years before our study, a 60% pass rate in CS1 was achieved during 35% of thesemesters. In the five semesters of this study, a 60% pass rate was achieved inall five semesters.
130

Figure 5: Students Seeking Internet Help When Stuck on Projects
4 Conclusions and Future Work
Between the three data sources mentioned, we have collected an enormousamount of both quantitative and qualitative data over five semesters and tenrecent sections of CS1. We feel the changes we have made over the past threeyears have contributed to the increased success rates in CS1. We are also veryinterested in digging more into what happens when students get stuck andbecome frustrated while working on a project. This inevitably happens withall students at some point and we want to provide students with the necessarytools to persevere when they do encounter obstacles. More work is needed tocontinue exploring our data and collecting new data to help determine wherestudents are still struggling and which of our course changes have made themost impact. This will help to inform how future CS1 courses may be developedor augmented, and what teaching methods, learning strategies, and courseresources will make the most significant impact for the success of our students.
References
[1] Code.org. 2018 state of computer science education, policy and implemen-tation. https://code.org/files/2018_state_of_cs.pdf.
[2] P.E. Dickson. Using undergraduate teaching assistants in a small collegeenvironment. In Proceedings of the 42nd ACM Technical Symposium onComputer Science Education, SIGCSE ’11, pages 75–80, New York, NY,USA, 2011. ACM.
131

[3] H. Fleenor. Establishing computational thinking as just another tool inthe problem solving tool box. In Proceedings of the 50th ACM TechnicalSymposium on Computer Science Education, SIGCSE ’19, pages 1253–1253, New York, NY, USA, 2019. ACM.
[4] S. Kessler. You probably should have majored in computer sci-ence. https://qz.com/929275/you-probably-should-have-majored-in-computer-science.
[5] W. Marrero and A. Settle. Testing first: Emphasizing testing in earlyprogramming courses. In 10th Annual SIGCSE Conference on Innovationand Technology in Computer Science Education, ITiCSE ’05, pages 4–8,New York, NY, USA, 2005. ACM.
[6] US Bureau of Labor Statistics. Us bureau of labor statistics. computer andinformation research scientist. https://www.bls.gov/ooh/computer-and-information-technology/software-developers.htm.
[7] V. Ramalingam, D. LaBelle, and S. Wiedenbeck. Self-efficacy and mentalmodels in learning to program. In 9th Annual SIGCSE Conference onInnovation and Technology in Computer Science Education, ITiCSE ’04,pages 171–175, New York, NY, USA, 2004. ACM.
[8] E. Shein. Should everybody learn to code? Communications of the ACM,57(2):16–18, 2014.
[9] G. Trujillo, P.G. Aguinaldo, C. Anderson, J. Bustamante, D.R. Gelsinger,M.J. Pastor, J. Wright, L. Márquez-Magaña, and B. Riggs. Near-peerstem mentoring offers unexpected benefits for mentors from traditionallyunderrepresented backgrounds. Perspectives on Undergraduate Researchand Mentoring, 4(1):1–13, 2015.
[10] Christopher Watson and Frederick Li. Failure rates in introductory pro-gramming revisited. In Proceedings of the 2014 Conference on Innovationand Technology in Computer Science Education, ITiCSE ’14, pages 33–34,New York, NY, USA, 2014. ACM.
132
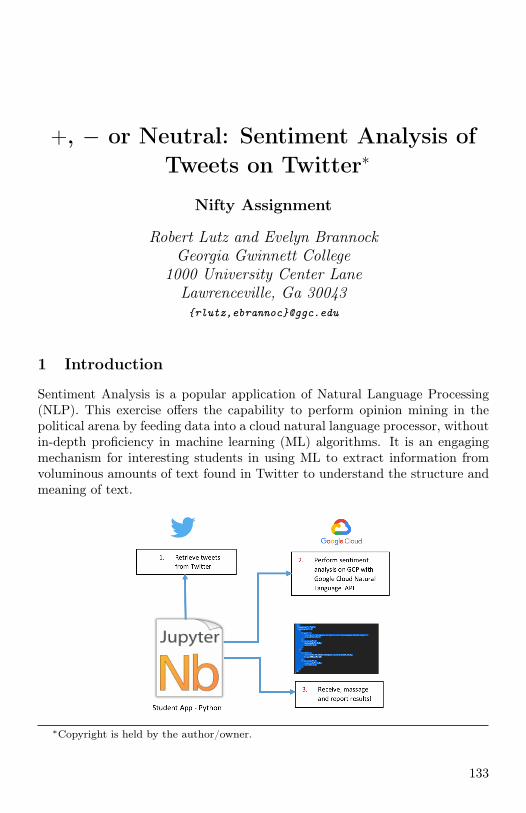
+, − or Neutral: Sentiment Analysis ofTweets on Twitter∗
Nifty Assignment
Robert Lutz and Evelyn BrannockGeorgia Gwinnett College
1000 University Center LaneLawrenceville, Ga 30043{rlutz,ebrannoc}@ggc.edu
1 Introduction
Sentiment Analysis is a popular application of Natural Language Processing(NLP). This exercise offers the capability to perform opinion mining in thepolitical arena by feeding data into a cloud natural language processor, withoutin-depth proficiency in machine learning (ML) algorithms. It is an engagingmechanism for interesting students in using ML to extract information fromvoluminous amounts of text found in Twitter to understand the structure andmeaning of text.
∗Copyright is held by the author/owner.
133
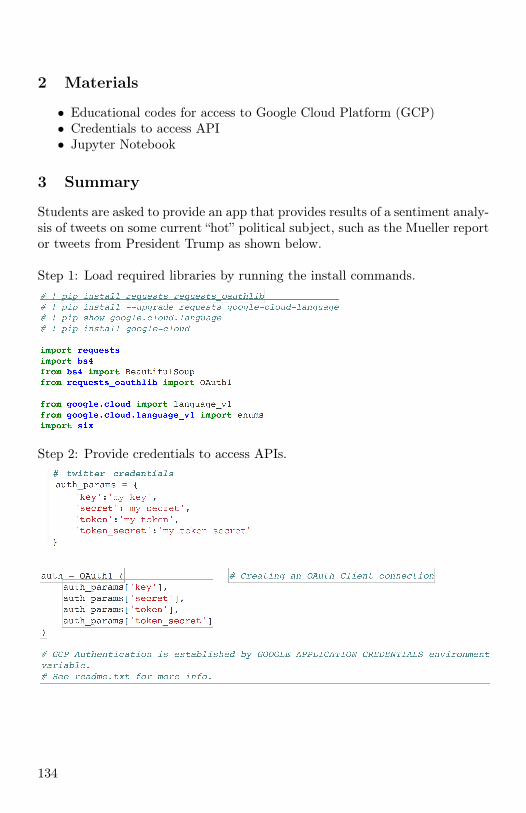
2 Materials
• Educational codes for access to Google Cloud Platform (GCP)• Credentials to access API• Jupyter Notebook
3 Summary
Students are asked to provide an app that provides results of a sentiment analy-sis of tweets on some current “hot” political subject, such as the Mueller reportor tweets from President Trump as shown below.
Step 1: Load required libraries by running the install commands.
Step 2: Provide credentials to access APIs.
134

Step 3: Establish calling endpoint, call parameters and make the request.
Step 4: Coerce the response into a list of messages.
Step 5: Create a (reusable) function for sentiment analysis using Google’sNatural Language Processing.
135
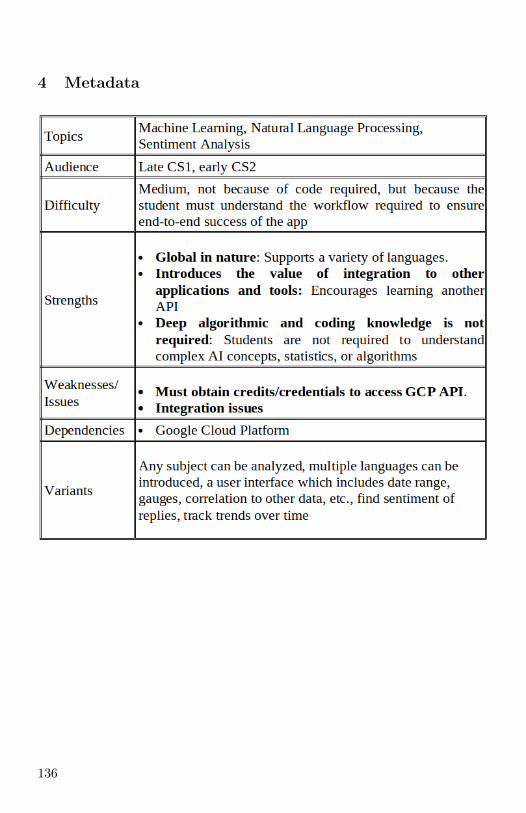
4 Metadata
136
Related Documents