UNITED STATES SECURITIES AND EXCHANGE COMMISSION Washington, D.C. 20549 FORM 8-K CURRENT REPORT Pursuant to Section 13 OR 15(d) of The Securities Exchange Act of 1934 Date of Report (Date of earliest event reported): July 29, 2021 DIGITAL REALTY TRUST, INC. (Exact name of registrant as specified in its charter) Maryland 001-32336 26-0081711 (State or other jurisdiction of incorporation) (Commission File Number) (IRS Employer Identification No.) 5707 Southwest Parkway, Building 1, Suite 275 Austin, Texas 78735 (Address of principal executive offices) (Zip Code) (737) 281-0101 (Registrant’s telephone number, including area code) N/A (Former name or former address, if changed since last report) Check the appropriate box below if the Form 8-K filing is intended to simultaneously satisfy the filing obligation of the registrant under any of the following provisions: ☐ Written communications pursuant to Rule 425 under the Securities Act (17 CFR 230.425) ☐ Soliciting material pursuant to Rule 14a-12 under the Exchange Act (17 CFR 240.14a-12) ☐ Pre-commencement communications pursuant to Rule 14d-2(b) under the Exchange Act (17 CFR 240.14d-2(b)) ☐ Pre-commencement communications pursuant to Rule 13e-4(c) under the Exchange Act (17 CFR 240.13e-4(c)) Securities registered pursuant to Section 12(b) of the Act: Title of each class Trading symbol(s) Name of each exchange on which registered Common Stock DLR New York Stock Exchange Series J Cumulative Redeemable Preferred Stock DLR Pr J New York Stock Exchange Series K Cumulative Redeemable Preferred Stock DLR Pr K New York Stock Exchange Series L Cumulative Redeemable Preferred Stock DLR Pr L New York Stock Exchange Indicate by check mark whether the registrant is an emerging growth company as defined in Rule 405 of the Securities Act of 1933 (§230.405 of this chapter) or Rule 12b-2 of the Securities Exchange Act of 1934 (§240.12b-2 of this chapter). Emerging growth company ☐ If an emerging growth company, indicate by check mark if the registrant has elected not to use the extended transition period for complying with any new or revised financial accounting standards provided pursuant to Section 13(a) of the Exchange Act. ◻

Welcome message from author
This document is posted to help you gain knowledge. Please leave a comment to let me know what you think about it! Share it to your friends and learn new things together.
Transcript

UNITED STATESSECURITIES AND EXCHANGE COMMISSION
Washington, D.C. 20549
FORM 8-KCURRENT REPORT
Pursuant to Section 13 OR 15(d) of The Securities Exchange Act of 1934
Date of Report (Date of earliest event reported): July 29, 2021
DIGITAL REALTY TRUST, INC.(Exact name of registrant as specified in its charter)
Maryland 001-32336 26-0081711(State or other jurisdiction
of incorporation)(Commission File Number)
(IRS Employer Identification No.)
5707 Southwest Parkway, Building 1, Suite 275 Austin, Texas 78735
(Address of principal executive offices) (Zip Code)
(737) 281-0101(Registrant’s telephone number, including area code)
N/A(Former name or former address, if changed since last report)
Check the appropriate box below if the Form 8-K filing is intended to simultaneously satisfy the filing obligation of the registrant under any of the following provisions:
☐ Written communications pursuant to Rule 425 under the Securities Act (17 CFR 230.425)
☐ Soliciting material pursuant to Rule 14a-12 under the Exchange Act (17 CFR 240.14a-12)
☐ Pre-commencement communications pursuant to Rule 14d-2(b) under the Exchange Act (17 CFR 240.14d-2(b))
☐ Pre-commencement communications pursuant to Rule 13e-4(c) under the Exchange Act (17 CFR 240.13e-4(c))
Securities registered pursuant to Section 12(b) of the Act:
Title of each classTrading symbol(s)
Name of each exchange on which registered
Common Stock DLR New York Stock ExchangeSeries J Cumulative Redeemable Preferred Stock DLR Pr J New York Stock ExchangeSeries K Cumulative Redeemable Preferred Stock DLR Pr K New York Stock ExchangeSeries L Cumulative Redeemable Preferred Stock DLR Pr L New York Stock Exchange
Indicate by check mark whether the registrant is an emerging growth company as defined in Rule 405 of the Securities Act of 1933 (§230.405 of this chapter) or Rule 12b-2 of the Securities Exchange Act of 1934(§240.12b-2 of this chapter).
Emerging growth company ☐
If an emerging growth company, indicate by check mark if the registrant has elected not to use the extended transition period for complying with any new or revised financial accounting standards providedpursuant to Section 13(a) of the Exchange Act. ◻

Item 2.02 Results of Operations and Financial Condition.
The information in this Item 2.02 of this Current Report on Form 8-K is also being furnished under Item 7.01 “Regulation FD Disclosure” of Form 8-K. Such information, includingthe exhibits attached hereto, is furnished pursuant to Item 2.02 and shall not be deemed “filed” for any purpose, including for the purposes of Section 18 of the Securities Exchange Actof 1934, as amended, or the Exchange Act, or otherwise subject to the liabilities of that Section. The information in this Current Report on Form 8-K shall not be deemed incorporated byreference into any filing under the Securities Act of 1933, as amended, or the Securities Act, or the Exchange Act regardless of any general incorporation language in such filing.
On July 29, 2021, we issued a press release announcing our financial results for the quarter ended June 30, 2021. The press release referred to certain supplemental information thatis available on the Company’s website at www.digitalrealty.com. A copy of the press release and supplemental information is attached hereto as Exhibit 99.1 and incorporated byreference herein.
On July 29, 2021, we also posted presentation materials to our website at www.digitalrealty.com. The presentation materials are attached hereto as Exhibit 99.2 and incorporated byreference herein.
Item 7.01 Regulation FD Disclosure.
The information in this Item 7.01 of this Current Report on Form 8-K is also being furnished under Item 2.02 “Results of Operations and Financial Condition” of Form 8-K. Suchinformation, including the exhibits attached hereto, is furnished pursuant to Item 7.01 and shall not be deemed “filed” for any purpose, including for the purposes of Section 18 of theExchange Act, or otherwise subject to the liabilities of that Section. The information in this Current Report on Form 8-K shall not be deemed incorporated by reference into any filingunder the Securities Act or the Exchange Act regardless of any general incorporation language in such filing.
On July 29, 2021, we issued a press release announcing our financial results for the quarter ended June 30, 2021. The press release referred to certain supplemental information thatis available on the Company’s website at www.digitalrealty.com. A copy of the press release and supplemental information is attached hereto as Exhibit 99.1 and incorporated byreference herein.
On July 29, 2021, we also posted presentation materials to our website at www.digitalrealty.com. The presentation materials are attached hereto as Exhibit 99.2 and incorporated byreference herein.
Item 9.01 Financial Statements and Exhibits.
(d) Exhibits.
Exhibit No. Description
99.1 Earnings Press Release and Supplemental Information for the Quarter Ended June 30, 2021.99.2 Presentation Materials posted July 29, 2021.104 Cover Page Interactive Data File (embedded within the Inline XBRL document)

SIGNATURES
Pursuant to the requirements of the Securities Exchange Act of 1934, the registrant has duly caused this report to be signed on its behalf by the undersigned hereunto duly authorized.
Digital Realty Trust, Inc.By: /s/ JOSHUA A. MILLS
Joshua A. MillsExecutive Vice President, General Counsel
and Secretary
Date: July 29, 2021

Table of Contents
Table of Contents
Financial SupplementTable of Contents Second Quarter 2021
Overview PAGE
Corporate Information 3
Ownership Structure 5
Key Quarterly Financial Data 6
Consolidated Statements of Operations
Earnings Release 8
2021 Outlook 11
Consolidated Quarterly Statements of Operations 13
Funds From Operations and Core Funds From Operations 14
Adjusted Funds From Operations 15
Balance Sheet Information
Consolidated Balance Sheets 16
Components of Net Asset Value 17
Debt Maturities 18
Debt Analysisand Covenant Compliance 19
Internal Growth
Same-Capital Operating Trend Summary 20
Summary of Leasing Activity- Signed 21
Summary of Leasing Activity- Renewed 22
Lease Expirations- By Size 23
Top 20 Customers by Annualized Rent 24
Occupancy Analysis 25
External Growth
Development Lifecycle- Committed Active Development 26
Construction Projects in Progress 27
Historical Capital Expenditures and Investments in Real Estate 28
Development Lifecycle - Held for Development 29
Acquisitions / Dispositions / Joint Ventures 30
Unconsolidated Joint Ventures 31
Additional Information
Reconciliation of Earnings Before Interest, Taxes, Depreciation& Amortization and Financial Ratios 32
Management Statements on Non-GAAP Measures 33
Forward-Looking Statements 35
Table of Contents
Financial SupplementCorporate Information Second Quarter 2021
3
Corporate ProfileDigital Realty owns, acquires, develops and operates data centers. The company is focused on providing data center, colocation and interconnection solutions for domestic and international customers across a variety of industry verticals ranging from cloud and information technology services, communications and social networking to financial services, manufacturing, energy, healthcare, and consumer products. As of June 30, 2021, the company’s 291 data centers, including 44 data centers held as investments in unconsolidated joint ventures, contain applications and operations critical to the day-to-day operations of technology industry and corporate enterprise data center customers. Digital Realty’s portfolio is comprised of approximately 35.8 million square feet, excluding approximately 7.6 million square feet of space under active development and 2.0 million square feet of space held for future development, located throughout North America, Europe, South America, Asia, Australia and Africa. For additional information, please visit the company’s website at https://www.digitalrealty.com/.
Corporate Headquarters5707 Southwest Parkway, Building 1, Suite 275Austin, TX 78735 Telephone: (737) 281-0101
Website: https://www.digitalrealty.com/
Senior ManagementChief Executive Officer: A. William Stein
Chief Financial Officer: Andrew P. Power
Chief Investment Officer: Gregory S. Wright
Chief Technology Officer: Christopher L. Sharp
Chief Revenue Officer: Corey J. Dyer
Executive Vice President, Operations: Erich J. Sanchack
Investor RelationsTo request more information or to be added to our e-mail distribution list, please visit the Investor Relations section of our website at https://investor.digitalrealty.com/
Analyst Coverage
Bank of America BMO Capital Cowen &Argus Research Merrill Lynch Barclays Berenberg Markets Citigroup CompanyAngus Kelleher Michael Funk Tim Long Nate Crossett Ari Klein Michael Rollins Colby Synesael(212) 425-7500 (646) 855-5664 (212) 526-4043 (646) 949-9030 (212) 885-4103 (212) 816-1116 (646) 562-1355
Credit Suisse Deutsche Bank Edward Jones Green Street Advisors J.P. Morgan Jefferies KeyBanc CapitalSami Badri Matthew Niknam Kyle Sanders David Guarino Richard Choe Jonathan Petersen Jordan Sadler(212) 538-1727 (212) 250-4711 (314) 515-0198 (949) 640-8780 (212) 662-6708 (212) 284-1705 (917) 368-2280
MoffettNathanson Morgan Stanley Morningstar New Street Research Raymond James RBC Capital Markets Robert W. BairdNick Del Deo Simon Flannery Matthew Dolgin Jonathan Chaplin Frank Louthan Jonathan Atkin David Rodgers(212) 519-0025 (212) 761-6432 (312) 696-6783 (212) 921-9876 (404) 442-5867 (415) 633-8589 (216) 737-7341
Stifel TD Securities Truist Securities UBS Wells Fargo William Blair Wolfe ResearchErik Rasmussen Jonathan Kelcher Gregory Miller John Hodulik Eric Luebchow James Breen Jeff Kvaal(212) 271-3461 (416) 307-9931 (212) 303-4169 (212) 713-4226 (312) 630-2386 (617) 235-7513 (646) 582-9350
This Earnings Press Release and Supplemental Information package supplements the information provided in our quarterly and annual reports filed with the U.S. Securities and Exchange Commission. Additional information about Digital Realty and our business is also available on our website at https://www.digitalrealty.com/.
BMO
Table of Contents
Financial SupplementCorporate Information (Continued) Second Quarter 2021
4
Stock Listing Information
The stock of Digital Realty Trust, Inc. is traded primarily on the New York Stock Exchange under the following symbols:
Common Stock: DLRSeriesJ Preferred Stock: DLRPRJSeriesK Preferred Stock: DLRPRKSeriesL Preferred Stock: DLRPRL
Symbols may vary by stock quote provider.
Credit Ratings
Standard & Poor’s Corporate Credit Rating: BBB (Stable Outlook)Preferred Stock: BB+
Moody’sIssuer Rating: Baa2 (Stable Outlook)Preferred Stock: Baa3
FitchIssuer Default Rating: BBB (Stable Outlook)Preferred Stock: BB+
These credit ratings may not reflect the potential impact of risks relating to the structure or trading of the company’s securities and are provided solely for informational purposes. Credit ratings are not recommendations to buy,hold or sell any security, and may be revised or withdrawn at any time by the issuing rating agency at its sole discretion. The company does not undertake any obligation to maintain the ratings or to advise of any change inratings. Each agency’s rating should be evaluated independently of any other agency’s rating. An explanation of the significance of the ratings may be obtained from each of the rating agencies.
Common Stock Price Performance
The following summarizes recent activity of Digital Realty’s common stock (DLR):
Three Months Ended
30-Jun-21 31-Mar-21 31-Dec-20 30-Sep-20 30-Jun-20
High price $164.04 $150.43 $159.58 $165.49 $158.36
Low price $140.29 $124.65 $126.79 $138.71 $127.12
Closing price, end of quarter $150.46 $140.84 $139.51 $146.76 $142.11
Average daily trading volume 1,293,054 1,809,056 1,666,992 1,427,781 2,483,290
Indicated dividend per common share (1) $4.64 $4.64 $4.48 $4.48 $4.48
Closing annual dividend yield, end of quarter 3.1% 3.3% 3.2% 3.1% 3.2%
Shares and units outstanding, end of quarter (2) 289,658,561 289,113,581 288,335,993 288,087,282 276,686,892
Closing market value of shares and units outstanding (3) $43,582,029 $40,718,757 $40,225,753 $42,279,688 $39,319,974
(1) On an annualized basis. (2) As of June 30, 2021, the total number of shares and units includes 282,603,152 shares of common stock, 5,352,766 common units held by third parties and 1,702,643 common units and vested and unvested long-term incentive units held by
directors, officers and others and excludes all shares of common stock potentially issuable upon conversion of our series J, series K and series L cumulative redeemable preferred stock upon certain change of control transactions. (3) Dollars in thousands as of the end of the quarter. This Earnings Press Release and Supplemental Information package supplements the information provided in our quarterly and annual reports filed with the U.S. Securities and Exchange Commission. Additional information about us and our datacenters is also available on our website at www.digitalrealty.com.
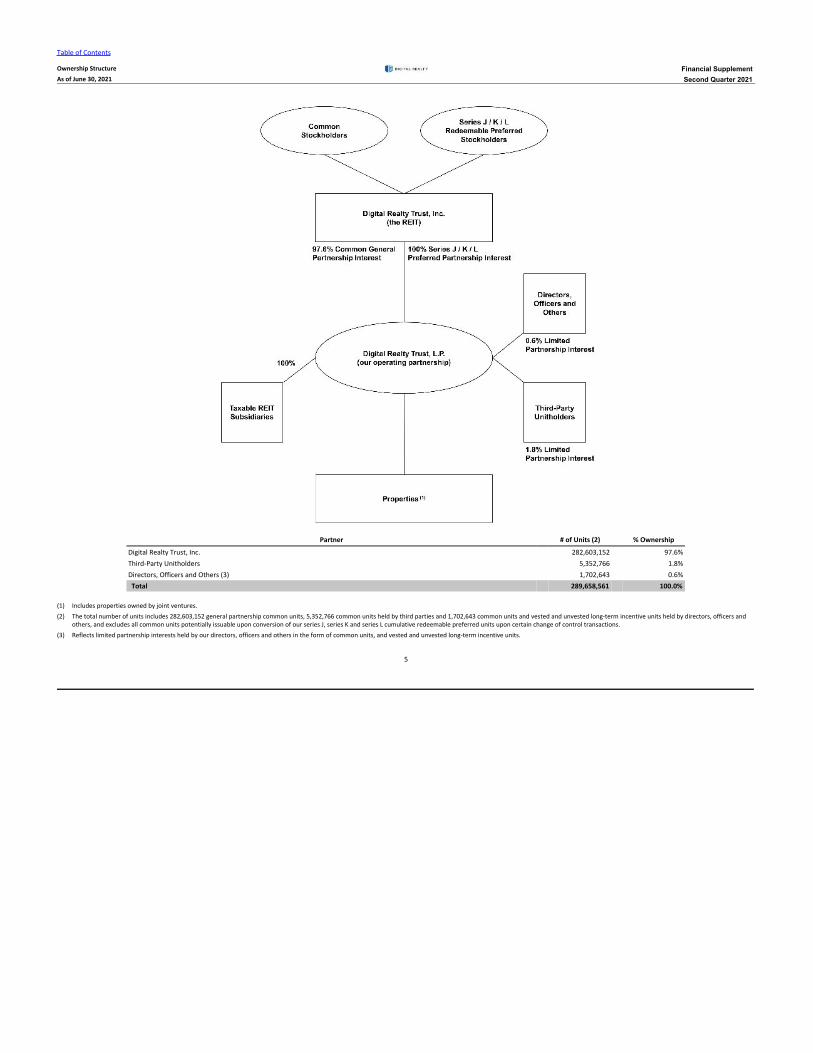
Table of Contents
Ownership Structure Financial SupplementAs of June 30, 2021 Second Quarter 2021
5
Partner # of Units (2) % Ownership
Digital Realty Trust, Inc. 282,603,152 97.6% Third-Party Unitholders 5,352,766 1.8% Directors, Officers and Others (3) 1,702,643 0.6%
Total 289,658,561 100.0%
(1) Includes properties owned by joint ventures. (2) The total number of units includes 282,603,152 general partnership common units, 5,352,766 common units held by third parties and 1,702,643 common units and vested and unvested long-term incentive units held by directors, officers and
others, and excludes all common units potentially issuable upon conversion of our series J, series K and series L cumulative redeemable preferred units upon certain change of control transactions.(3) Reflects limited partnership interests held by our directors, officers and others in the form of common units, and vested and unvested long-term incentive units.
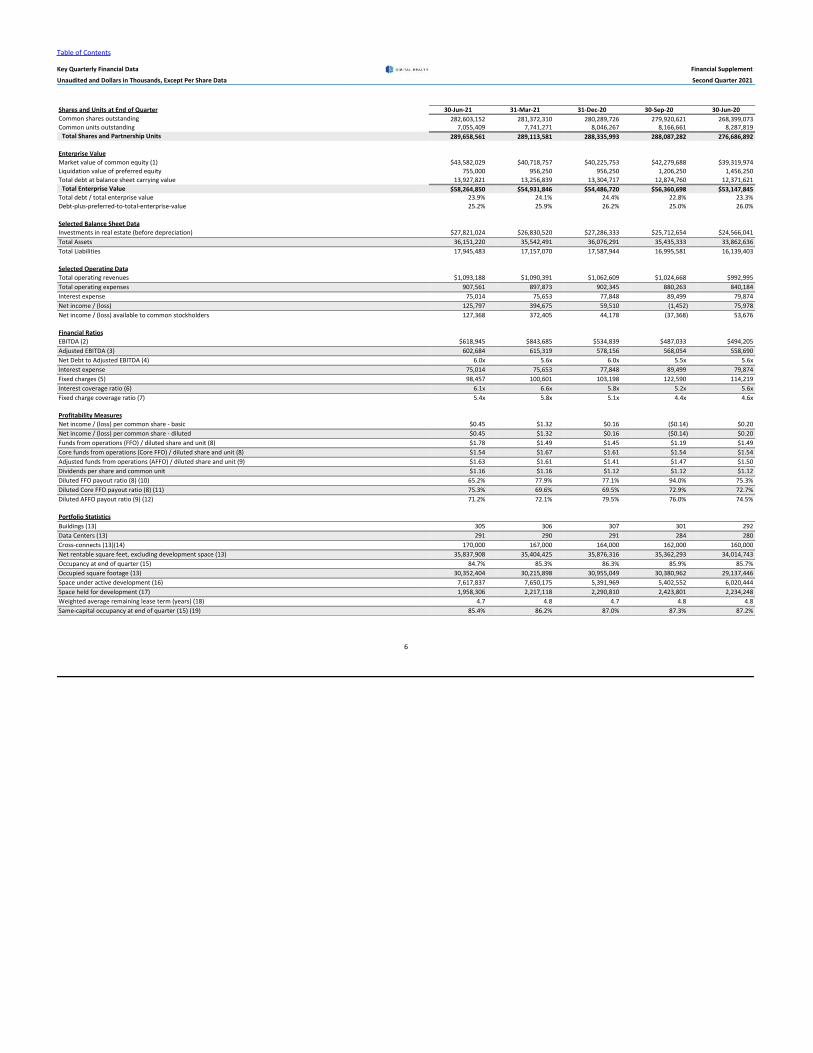
Table of Contents
Key Quarterly Financial Data Financial Supplement
Unaudited and Dollars in Thousands, Except Per Share Data Second Quarter 2021
6
Shares and Units at End of Quarter 30-Jun-21 31-Mar-21 31-Dec-20 30-Sep-20 30-Jun-20 Common shares outstanding 282,603,152 281,372,310 280,289,726 279,920,621 268,399,073 Common units outstanding 7,055,409 7,741,271 8,046,267 8,166,661 8,287,819
Total Shares and Partnership Units 289,658,561 289,113,581 288,335,993 288,087,282 276,686,892
Enterprise Value Market value of common equity (1) $43,582,029 $40,718,757 $40,225,753 $42,279,688 $39,319,974 Liquidation value of preferred equity 755,000 956,250 956,250 1,206,250 1,456,250 Total debt at balance sheet carrying value 13,927,821 13,256,839 13,304,717 12,874,760 12,371,621
Total Enterprise Value $58,264,850 $54,931,846 $54,486,720 $56,360,698 $53,147,845 Total debt / total enterprise value 23.9% 24.1% 24.4% 22.8% 23.3% Debt-plus-preferred-to-total-enterprise-value 25.2% 25.9% 26.2% 25.0% 26.0%
Selected Balance Sheet Data Investments in real estate (before depreciation) $27,821,024 $26,830,520 $27,286,333 $25,712,654 $24,566,041 Total Assets 36,151,220 35,542,491 36,076,291 35,435,333 33,862,636 Total Liabilities 17,945,483 17,157,070 17,587,944 16,995,581 16,139,403
Selected Operating Data Total operating revenues $1,093,188 $1,090,391 $1,062,609 $1,024,668 $992,995 Total operating expenses 907,561 897,873 902,345 880,263 840,184 Interest expense 75,014 75,653 77,848 89,499 79,874 Net income / (loss) 125,797 394,675 59,510 (1,452) 75,978 Net income / (loss) available to common stockholders 127,368 372,405 44,178 (37,368) 53,676
Financial Ratios EBITDA (2) $618,945 $843,685 $534,839 $487,033 $494,205 Adjusted EBITDA (3) 602,684 615,319 578,156 568,054 558,690 Net Debt to Adjusted EBITDA (4) 6.0x 5.6x 6.0x 5.5x 5.6x Interest expense 75,014 75,653 77,848 89,499 79,874 Fixed charges (5) 98,457 100,601 103,198 122,590 114,219 Interest coverage ratio (6) 6.1x 6.6x 5.8x 5.2x 5.6x Fixed charge coverage ratio (7) 5.4x 5.8x 5.1x 4.4x 4.6x
Profitability Measures Net income / (loss) per common share - basic $0.45 $1.32 $0.16 ($0.14) $0.20 Net income / (loss) per common share - diluted $0.45 $1.32 $0.16 ($0.14) $0.20 Funds from operations (FFO) / diluted share and unit (8) $1.78 $1.49 $1.45 $1.19 $1.49 Core funds from operations (Core FFO) / diluted share and unit (8) $1.54 $1.67 $1.61 $1.54 $1.54 Adjusted funds from operations (AFFO) / diluted share and unit (9) $1.63 $1.61 $1.41 $1.47 $1.50 Dividends per share and common unit $1.16 $1.16 $1.12 $1.12 $1.12 Diluted FFO payout ratio (8) (10) 65.2% 77.9% 77.1% 94.0% 75.3% Diluted Core FFO payout ratio (8) (11) 75.3% 69.6% 69.5% 72.9% 72.7% Diluted AFFO payout ratio (9) (12) 71.2% 72.1% 79.5% 76.0% 74.5%
Portfolio Statistics Buildings (13) 305 306 307 301 292 Data Centers (13) 291 290 291 284 280 Cross-connects (13)(14) 170,000 167,000 164,000 162,000 160,000 Net rentable square feet, excluding development space (13) 35,837,908 35,404,425 35,876,316 35,362,293 34,014,743 Occupancy at end of quarter (15) 84.7% 85.3% 86.3% 85.9% 85.7% Occupied square footage (13) 30,352,404 30,215,898 30,955,049 30,380,962 29,137,446 Space under active development (16) 7,617,837 7,650,175 5,391,969 5,402,552 6,020,444 Space held for development (17) 1,958,306 2,217,118 2,290,810 2,423,801 2,234,248 Weighted average remaining lease term (years) (18) 4.7 4.8 4.7 4.8 4.8 Same-capital occupancy at end of quarter (15) (19) 85.4% 86.2% 87.0% 87.3% 87.2%
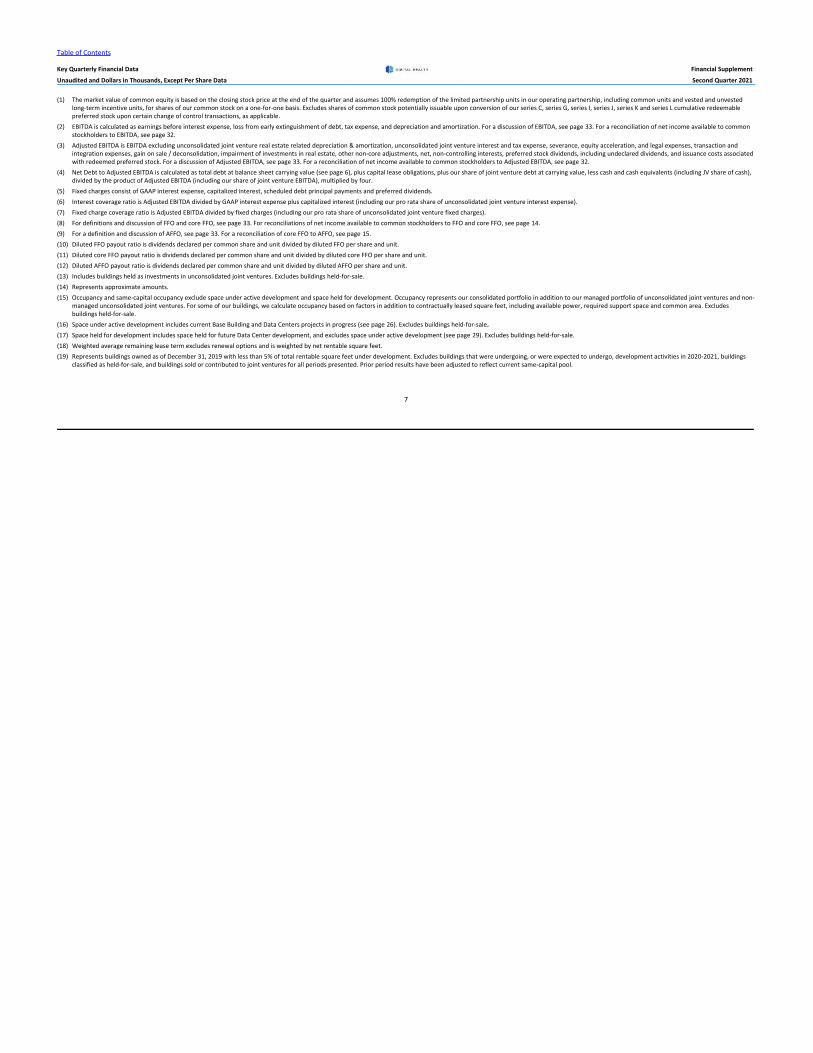
Table of Contents
Key Quarterly Financial Data Financial Supplement
Unaudited and Dollars in Thousands, Except Per Share Data Second Quarter 2021
7
(1) The market value of common equity is based on the closing stock price at the end of the quarter and assumes 100% redemption of the limited partnership units in our operating partnership, including common units and vested and unvested long-term incentive units, for shares of our common stock on a one-for-one basis. Excludes shares of common stock potentially issuable upon conversion of our series C, series G, series I, series J, series K and series L cumulative redeemable preferred stock upon certain change of control transactions, as applicable.
(2) EBITDA is calculated as earnings before interest expense, loss from early extinguishment of debt, tax expense, and depreciation and amortization. For a discussion of EBITDA, see page33. For a reconciliation of net income available to commonstockholders to EBITDA, see page 32.
(3) Adjusted EBITDA is EBITDA excluding unconsolidated joint venture real estate related depreciation & amortization, unconsolidated joint venture interest and tax expense, severance, equity acceleration, and legal expenses, transaction andintegration expenses, gain on sale / deconsolidation, impairment of investments in real estate, other non-core adjustments, net, non-controlling interests, preferred stock dividends, including undeclared dividends, and issuance costs associatedwith redeemed preferred stock. For a discussion of Adjusted EBITDA, see page33. For a reconciliation of net income available to common stockholders to Adjusted EBITDA, see page32.
(4) Net Debt to Adjusted EBITDA is calculated as total debt at balance sheet carrying value (see page6), plus capital lease obligations, plus our share of joint venture debt at carrying value, less cash and cash equivalents (including JV share of cash), divided by the product of Adjusted EBITDA (including our share of joint venture EBITDA), multiplied by four.
(5) Fixed charges consist of GAAP interest expense, capitalized interest, scheduled debt principal payments and preferred dividends. (6) Interest coverage ratio is Adjusted EBITDA divided by GAAP interest expense plus capitalized interest (including our pro rata share of unconsolidated joint venture interest expense).(7) Fixed charge coverage ratio is Adjusted EBITDA divided by fixed charges (including our pro rata share of unconsolidated joint venture fixed charges).(8) For definitions and discussion of FFO and core FFO, see page33. For reconciliations of net income available to common stockholders to FFO and core FFO, see page14. (9) For a definition and discussion of AFFO, see page33. For a reconciliation of core FFO to AFFO, see page15. (10) Diluted FFO payout ratio is dividends declared per common share and unit divided by diluted FFO per share and unit. (11) Diluted core FFO payout ratio is dividends declared per common share and unit divided by diluted core FFO per share and unit. (12) Diluted AFFO payout ratio is dividends declared per common share and unit divided by diluted AFFO per share and unit. (13) Includes buildings held as investments in unconsolidated joint ventures. Excludes buildings held-for-sale. (14) Represents approximate amounts. (15) Occupancy and same-capital occupancy exclude space under active development and space held for development. Occupancy represents our consolidated portfolio in addition to our managed portfolio of unconsolidated joint ventures and non-
managed unconsolidated joint ventures. For some of our buildings, we calculate occupancy based on factors in addition to contractually leased square feet, including available power, required support space and common area. Excludesbuildings held-for-sale.
(16) Space under active development includes current Base Building and Data Centers projects in progress (see page26). Excludes buildings held-for-sale. (17) Space held for development includes space held for future Data Center development, and excludes space under active development (see page29). Excludes buildings held-for-sale. (18) Weighted average remaining lease term excludes renewal options and is weighted by net rentable square feet.(19) Represents buildings owned as of December 31, 2019 with less than 5% of total rentable square feet under development. Excludes buildings that were undergoing, or were expected to undergo, development activities in 2020-2021, buildings
classified as held-for-sale, and buildings sold or contributed to joint ventures for all periods presented. Prior period results have been adjusted to reflect current same-capital pool.
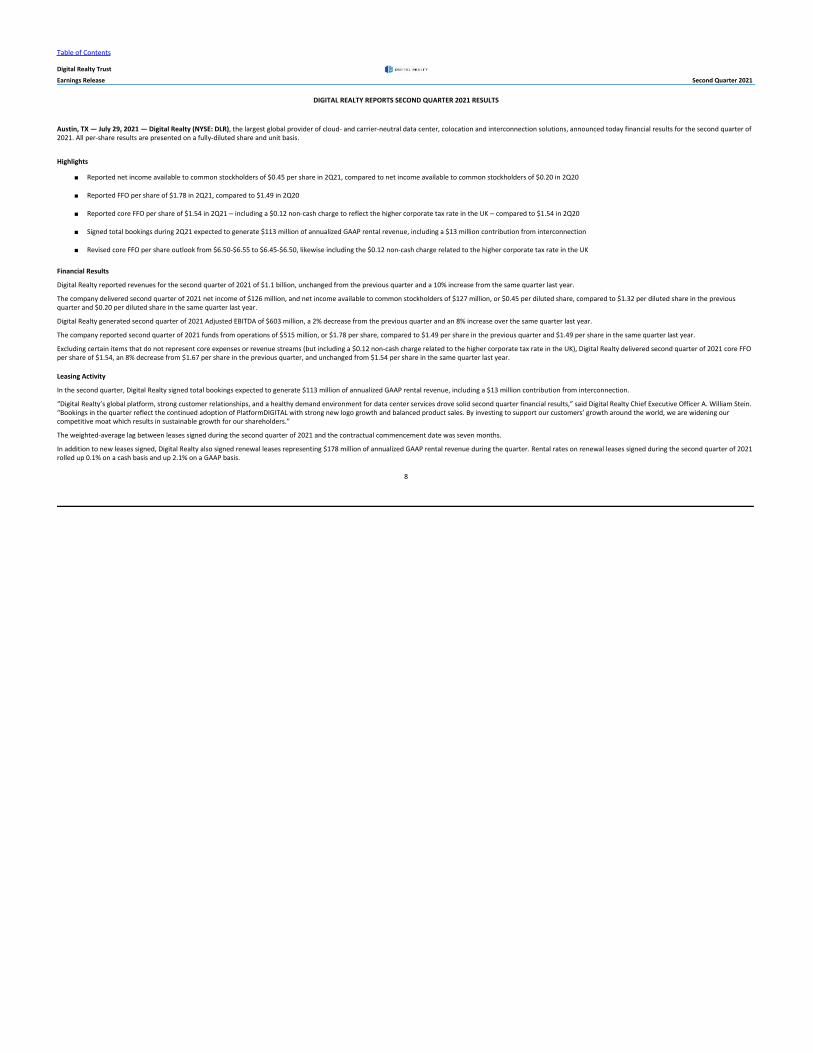
Table of Contents
Digital Realty Trust
Earnings Release Second Quarter 2021
8
DIGITAL REALTY REPORTS SECOND QUARTER 2021 RESULTS
Austin, TX — July 29, 2021 — Digital Realty (NYSE: DLR), the largest global provider of cloud- and carrier-neutral data center, colocation and interconnection solutions, announced today financial results for the second quarter of 2021. All per-share results are presented on a fully-diluted share and unit basis.
Highlights
◾ Reported net income available to common stockholders of $0.45 per share in 2Q21, compared to net income available to common stockholders of $0.20 in 2Q20
◾ Reported FFO per share of $1.78 in 2Q21, compared to $1.49 in 2Q20
◾ Reported core FFO per share of $1.54 in 2Q21 – including a $0.12 non-cash charge to reflect the higher corporate tax rate in the UK – compared to $1.54 in 2Q20
◾ Signed total bookings during 2Q21 expected to generate $113 million of annualized GAAP rental revenue, including a $13 million contribution from interconnection
◾ Revised core FFO per share outlook from $6.50-$6.55 to $6.45-$6.50, likewise including the $0.12 non-cash charge related to the higher corporate tax rate in the UK
Financial Results
Digital Realty reported revenues for the second quarter of 2021 of $1.1 billion, unchanged from the previous quarter and a 10% increase from the same quarter last year.
The company delivered second quarter of 2021 net income of $126 million, and net income available to common stockholders of $127 million, or $0.45 per diluted share, compared to $1.32 per diluted share in the previous quarter and $0.20 per diluted share in the same quarter last year.
Digital Realty generated second quarter of 2021 Adjusted EBITDA of $603 million, a 2% decrease from the previous quarter and an 8% increase over the same quarter last year.
The company reported second quarter of 2021 funds from operations of $515 million, or $1.78 per share, compared to $1.49 per share in the previous quarter and $1.49 per share in the same quarter last year.
Excluding certain items that do not represent core expenses or revenue streams (but including a $0.12 non-cash charge related to the higher corporate tax rate in the UK), Digital Realty delivered second quarter of 2021 core FFO per share of $1.54, an 8% decrease from $1.67 per share in the previous quarter, and unchanged from $1.54 per share in the same quarter last year.
Leasing Activity
In the second quarter, Digital Realty signed total bookings expected to generate $113 million of annualized GAAP rental revenue, including a $13 million contribution from interconnection.
“Digital Realty’s global platform, strong customer relationships, and a healthy demand environment for data center services drove solid second quarter financial results,” said Digital Realty Chief Executive Officer A. William Stein. “Bookings in the quarter reflect the continued adoption of PlatformDIGITAL with strong new logo growth and balanced product sales. By investing to support our customers’ growth around the world, we are widening our competitive moat which results in sustainable growth for our shareholders.”
The weighted-average lag between leases signed during the second quarter of 2021 and the contractual commencement date was seven months.
In addition to new leases signed, Digital Realty also signed renewal leases representing $178 million of annualized GAAP rental revenue during the quarter. Rental rates on renewal leases signed during the second quarter of 2021 rolled up 0.1% on a cash basis and up 2.1% on a GAAP basis.

Table of Contents
Digital Realty Trust
Earnings Release Second Quarter 2021
9
New leases signed during the second quarter of 2021 are summarized by region as follows:
Annualized GAAP Base Rent GAAP Base Rent GAAP Base Rent
The Americas (in thousands) Square Feet per Square Foot Megawatts per Kilowatt
0-1 MW $10,377 39,453 $263 2.9 $296 > 1 MW 45,254 333,508 136 38.9 97
Other (1) 211 8,941 24 — —Total $55,843 381,902 $146 41.8 $111
EMEA (2)
0-1 MW $19,315 69,995 $276 6.8 $238
> 1 MW 4,639 42,153 110 3.3 117
Other (1) 15 339 44 — —Total $23,969 112,487 $213 10.1 $198
Asia Pacific (2)
0-1 MW $11,489 11,734 $979 2.1 $465
> 1 MW 9,095 46,848 194 4.7 161
Other (1) 365 5,028 73 — —Total $20,949 63,610 $329 6.8 $254
All Regions (2)
0-1 MW $41,181 121,182 $340 11.8 $292
> 1 MW 58,988 422,509 140 46.9 105
Other (1) 591 14,308 41 — —Total $100,761 558,000 $181 58.7 $142
Interconnection $12,648 N/A N/A N/A N/A
Grand Total $113,409 558,000 $181 58.7 $142
Note: Totals may not foot due to rounding differences.
(1) Other includes Powered Base Building shell capacity as well as storage and office space within fully improved data center facilities.
(2) Based on quarterly average exchange rates during the three months ended June 30, 2021.
Investment Activity
During the second quarter of 2021, Digital Realty closed on the acquisition of a five-acre land parcel in Seoul, South Korea for approximately $66 million, or $13.5 million per acre, and an 18.5-acre land parcel in Sydney, Australia for $65 million, or approximately $3.5 million per acre. The two sites are expected to support the development of approximately 64 megawatts and 97 megawatts of IT load, respectively. Commencement of development on these land parcels will be subject to market demand, and delivery will be phased to meet future growth requirements.
Separately, Digital Realty also closed on the sale of a vacant, 240,000-square foot office and industrial property in Phoenix, AZ during the second quarter of 2021 for $19 million, or approximately $79 per square foot.
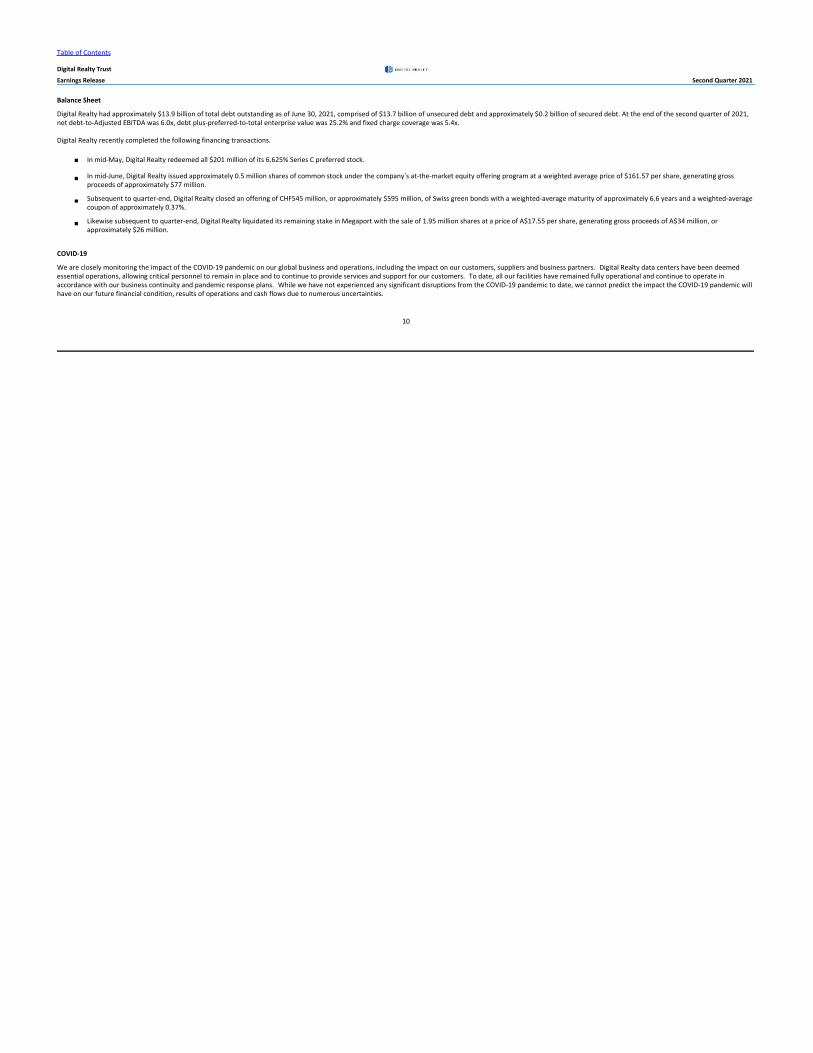
Table of Contents
Digital Realty Trust
Earnings Release Second Quarter 2021
10
Balance Sheet
Digital Realty had approximately $13.9 billion of total debt outstanding as of June 30, 2021, comprised of $13.7 billion of unsecured debt and approximately $0.2 billion of secured debt. At the end of the second quarter of 2021, net debt-to-Adjusted EBITDA was 6.0x, debt plus-preferred-to-total enterprise value was 25.2% and fixed charge coverage was 5.4x.
Digital Realty recently completed the following financing transactions.
◾ In mid-May, Digital Realty redeemed all $201 million of its 6.625% Series C preferred stock.
◾ In mid-June, Digital Realty issued approximately 0.5 million shares of common stock under the company’s at-the-market equity offering program at a weighted average price of $161.57 per share, generating gross proceeds of approximately $77 million.
◾ Subsequent to quarter-end, Digital Realty closed an offering of CHF545 million, or approximately $595 million, of Swiss green bonds with a weighted-average maturity of approximately 6.6 years and a weighted-average coupon of approximately 0.37%.
◾ Likewise subsequent to quarter-end, Digital Realty liquidated its remaining stake in Megaport with the sale of 1.95 million shares at a price of A$17.55 per share, generating gross proceeds of A$34 million, or approximately $26 million.
COVID-19
We are closely monitoring the impact of the COVID-19 pandemic on our global business and operations, including the impact on our customers, suppliers and business partners. Digital Realty data centers have been deemedessential operations, allowing critical personnel to remain in place and to continue to provide services and support for our customers. To date, all our facilities have remained fully operational and continue to operate inaccordance with our business continuity and pandemic response plans. While we have not experienced any significant disruptions from the COVID-19 pandemic to date, we cannot predict the impact the COVID-19 pandemic willhave on our future financial condition, results of operations and cash flows due to numerous uncertainties.

Table of Contents
Digital Realty Trust
Earnings Release Second Quarter 2021
11
2021 Outlook
Digital Realty revised its 2021 core FFO per share outlook from $6.50-$6.55 to $6.45-$6.50, including a $0.12 non-cash charge related to the higher corporate tax rate in the UK. The assumptions underlying the outlook are summarized in the following table.
As of As of As of Top-Line and Cost Structure February 11, 2021 April 29, 2021 July 29, 2021
Total revenue $4.250 - $4.350 billion $4.300 - $4.400 billion $4.325 - $4.425 billionNet non-cash rent adjustments (1) ($10) - ($15) million ($20) - ($25) million ($20) - ($25) millionAdjusted EBITDA $2.300 - $2.350 billion $2.330 - $2.380 billion $2.350 - $2.400 billionG&A $365 - $375 million $380 - $390 million $380 - $390 million
Internal GrowthRental rates on renewal leases
Cash basis Slightly negative Slightly negative Slightly negativeGAAP basis Slightly positive Slightly positive Slightly positive
Year-end portfolio occupancy 84.0% - 85.0% 84.0% - 85.0% 84.0% - 85.0%"Same-capital" cash NOI growth (2) (2.5%) - (3.5%) (2.5%) - (3.5%) (2.5%) - (3.5%)
Foreign Exchange RatesU.S. Dollar / Pound Sterling $1.25 - $1.30 $1.30 - $1.38 $1.30 - $1.38U.S. Dollar / Euro $1.15 - $1.20 $1.15 - $1.20 $1.15 - $1.20
External GrowthDispositions
Dollar volume $0.6 - $1.0 billion $0.7 - $1.0 billion $0.7 - $1.0 billionCap rate 0.0% - 12.0% 0.0% - 12.0% 0.0% - 12.0%
DevelopmentCapEx (3) $2.0 - $2.3 billion $2.0 - $2.3 billion $2.0 - $2.3 billionAverage stabilized yields 9.0% - 15.0% 9.0% - 15.0% 9.0% - 15.0%
Enhancements and other non-recurring CapEx (4) $5 - $10 million $5 - $10 million $5 - $10 millionRecurring CapEx + capitalized leasing costs (5) $220 - $230 million $220 - $230 million $210 - $220 million
Balance SheetLong-term debt issuance
Dollar amount $1.0 - $1.5 billion $1.0 - $1.5 billion $1.8 - $2.0 billionPricing 1.00% 1.00% 1.00%Timing Early-to-mid 2021 Early-to-mid 2021 Early-to-mid 2021
Net income per diluted share $1.40 - $1.45 $2.00 - $2.05 $2.20 - $2.25Real estate depreciation and (gain) / loss on sale $4.90 - $4.90 $4.25 - $4.25 $4.15 - $4.15
Funds From Operations / share (NAREIT-Defined) $6.30 - $6.35 $6.25 - $6.30 $6.35 - $6.40Non-core expenses and revenue streams $0.10 - $0.15 $0.25 - $0.25 $0.10 - $0.10
Core Funds From Operations / share $6.40 - $6.50 $6.50 - $6.55 $6.45 - $6.50
(1) Net non-cash rent adjustments represent the sum of straight-line rental revenue and straight-line rent expense, as well as the amortization of above- and below-market leases (i.e., ASC 805 adjustments). (2) The “same-capital” pool includes properties owned as of December 31, 2019 with less than 5% of total rentable square feet under development. It also excludes properties that were undergoing, or were expected to undergo, development
activities in 2020-2021, properties classified as held for sale, and properties sold or contributed to joint ventures for all periods presented. (3) Includes land acquisitions. (4) Other non-recurring CapEx represents costs incurred to enhance the capacity or marketability of operating properties, such as network fiber initiatives and software development costs. (5) Recurring CapEx represents non-incremental improvements required to maintain current revenues, including second-generation tenant improvements and leasing commissions.

Table of Contents
Digital Realty Trust
Earnings Release Second Quarter 2021
12
Non-GAAP Financial Measures
This press release contains non-GAAP financial measures, including FFO, core FFO and Adjusted EBITDA. A reconciliation from U.S. GAAP net income available to common stockholders to FFO, a reconciliation from FFO to core FFO, and definitions of FFO and core FFO are included as an attachment to this document. A reconciliation from U.S. GAAP net income available to common stockholders to Adjusted EBITDA, a definition of Adjusted EBITDA and definitions of net debt-to-Adjusted EBITDA, debt-plus-preferred-to-total enterprise value, cash NOI, and fixed charge coverage ratio are included as an attachment to this document.
Investor Conference Call
Prior to Digital Realty’s investor conference call at 5:30 p.m. EDT / 2:30 p.m. PDT on July 29, 2021, a presentation will be posted to the Investors section of the company’s website at https://investor.digitalrealty.com/. The presentation is designed to accompany the discussion of the company’s Second Quarter 2021 financial results and operating performance. The conference call will feature Chief Executive Officer A. William Stein and Chief Financial Officer Andrew P. Power.
To participate in the live call, investors are invited to dial (888) 317-6003 (for domestic callers) or (412) 317-6061 (for international callers) and reference the conference ID# 0833892 at least five minutes prior to start time. A live webcast of the call will be available via the Investors section of Digital Realty’s website at https://investor.digitalrealty.com/.
Telephone and webcast replays will be available after the call until August 29, 2021. The telephone replay can be accessed by dialing (877) 344-7529 (for domestic callers) or (412) 317-0088 (for international callers) and providing the conference ID# 10157227. The webcast replay can be accessed on Digital Realty’s website.
About Digital Realty
Digital Realty supports the world’s leading enterprises and service providers by delivering the full spectrum of data center, colocation and interconnection solutions. PlatformDIGITAL®, the company’s global data center platform, provides customers a trusted foundation and proven Pervasive Datacenter Architecture (PDx™) solution methodology for scaling digital business and efficiently managing data gravity challenges. Digital Realty’s global data center footprint gives customers access to the connected communities that matter to them with 291 facilities in 47 metros across 24 countries on six continents. To learn more about Digital Realty, please visit digitalrealty.com or followus on LinkedIn and Twitter.
Contact Information
Andrew P. PowerChief Financial OfficerDigital Realty(415) 738-6500
John J. Stewart / Jim HusebyInvestor RelationsDigital Realty(415) 738-6500

Table of Contents
Consolidated Quarterly Statements of Operations Financial Supplement
Unaudited and Dollars in Thousands, Except Per Share Data Second Quarter 2021
13
Three Months Ended Six Months Ended30-Jun-21 31-Mar-21 31-Dec-20 30-Sep-20 30-Jun-20 30-Jun-21 30-Jun-20
Rental revenues $768,826 $754,544 $754,422 $726,441 $698,041 $1,523,370 $1,277,815
Tenant reimbursements - Utilities 169,743 184,973 154,937 155,111 141,576 354,716 255,096
Tenant reimbursements - Other 60,261 59,328 62,084 53,654 62,630 119,589 119,573
Interconnection & other 90,565 89,061 86,424 85,725 85,428 179,626 155,263
Fee income 3,628 2,426 4,722 3,687 4,353 6,054 6,805
Other 165 59 20 50 967 224 1,780
Total Operating Revenues $1,093,188 $1,090,391 $1,062,609 $1,024,668 $992,995 $2,183,579 $1,816,332
Utilities $185,010 $176,046 $169,282 $177,925 $160,173 $361,057 $289,698
Rental property operating 198,207 185,733 205,177 180,755 172,474 383,940 308,656
Property taxes 42,795 49,005 42,442 39,732 45,071 91,800 87,194
Insurance 5,703 3,498 3,410 2,926 3,370 9,201 6,917
Depreciation & amortization 368,981 369,733 359,915 365,842 349,165 738,714 640,622
General & administration 94,956 97,568 101,582 90,431 90,649 192,524 152,915
Severance, equity acceleration, and legal expenses 2,536 2,427 606 920 3,642 4,963 4,914
Transaction and integration expenses 7,075 14,120 19,290 14,953 15,618 21,195 72,419
Impairment of investments in real estate — — — 6,482 — — —
Other expenses 2,298 (257) 641 297 22 2,041 136
Total Operating Expenses $907,561 $897,873 $902,345 $880,263 $840,184 $1,805,435 $1,563,471
Operating Income $185,627 $192,518 $160,264 $144,405 $152,811 $378,144 $252,861
Equity in (loss) earnings of unconsolidated joint ventures 52,143 (23,031) 31,055 (2,056) (7,632) 29,112 (86,628)
Gain on sale / deconsolidation 499 333,921 1,684 10,410 — 334,420 304,801
Interest and other (expense) income, net 10,124 (7,186) (2,747) 4,348 22,163 2,938 18,621
Interest (expense) (75,014) (75,653) (77,848) (89,499) (79,874) (150,667) (165,674)
Income tax (expense) (47,582) (7,547) (3,322) (16,053) (11,490) (55,129) (18,672)
Loss from early extinguishment of debt — (18,347) (49,576) (53,007) — (18,347) (632)
Net Income / (Loss) $125,797 $394,675 $59,510 ($1,452) $75,978 $520,471 $304,677
Net (income) loss attributable to noncontrolling interests (4,544) (8,756) (1,818) 1,316 (1,147) (13,300) (5,831)
Net Income / (Loss) Attributable to Digital Realty Trust, Inc. $121,253 $385,919 $57,692 ($136) $74,831 $507,171 $298,846
Preferred stock dividends, including undeclared dividends (11,885) (13,514) (13,514) (20,712) (21,155) (25,399) (42,310)
Gain on / (Issuance costs associated with) redeemed preferred stock 18,000 — — (16,520) — 18,000 —
Net Income / (Loss) Available to Common Stockholders $127,368 $372,405 $44,178 ($37,368) $53,676 $499,772 $256,536
Weighted-average shares outstanding - basic 281,791,855 281,094,798 280,117,213 270,214,413 267,569,823 281,445,252 244,866,574
Weighted-average shares outstanding - diluted 282,433,857 281,928,182 281,122,368 270,214,413 270,744,408 282,075,611 247,576,014
Weighted-average fully diluted shares and units 289,484,805 289,210,666 288,903,143 281,523,515 278,719,109 289,218,609 255,704,473
Net income / (loss) per share - basic $0.45 $1.32 $0.16 ($0.14) $0.20 $1.78 $1.05Net income / (loss) per share - diluted $0.45 $1.32 $0.16 ($0.14) $0.20 $1.77 $1.04
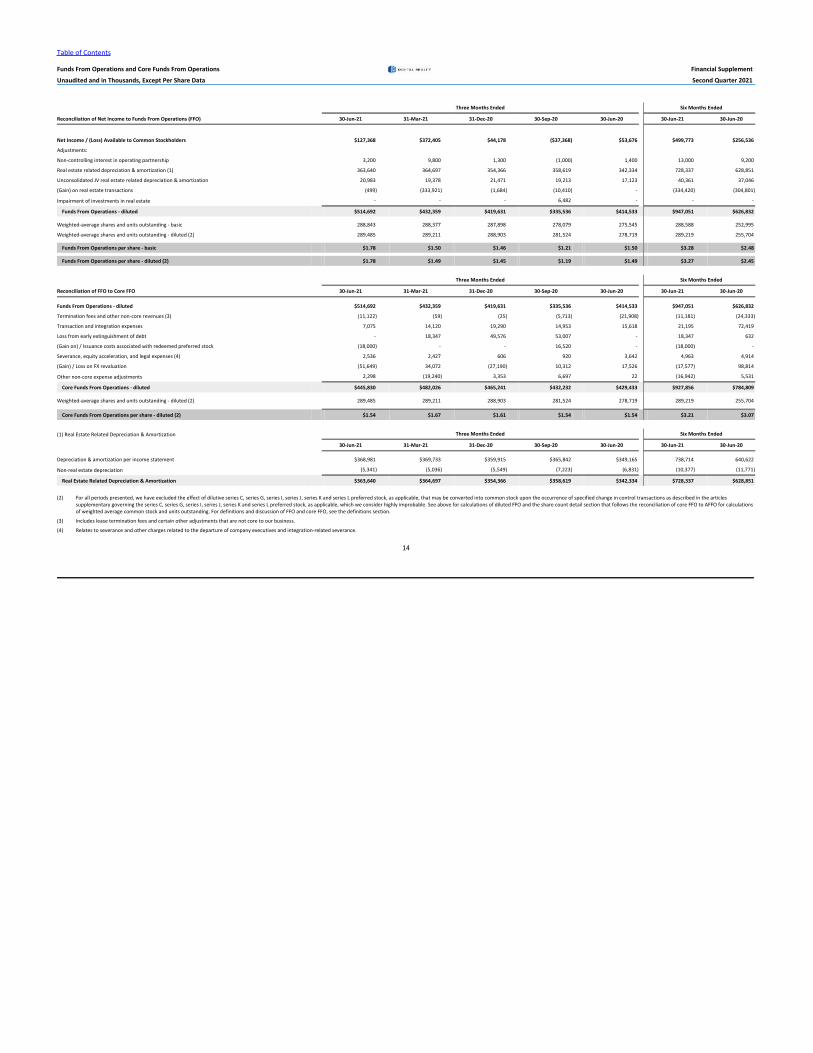
Table of Contents
Funds From Operations and Core Funds From Operations Financial Supplement
Unaudited and in Thousands, Except Per Share Data Second Quarter 2021
14
Three Months Ended Six Months Ended
Reconciliation of Net Income to Funds From Operations (FFO) 30-Jun-21 31-Mar-21 31-Dec-20 30-Sep-20 30-Jun-20 30-Jun-21 30-Jun-20
Net Income / (Loss) Available to Common Stockholders $127,368 $372,405 $44,178 ($37,368) $53,676 $499,773 $256,536
Adjustments:
Non-controlling interest in operating partnership 3,200 9,800 1,300 (1,000) 1,400 13,000 9,200
Real estate related depreciation & amortization (1) 363,640 364,697 354,366 358,619 342,334 728,337 628,851
Unconsolidated JV real estate related depreciation & amortization 20,983 19,378 21,471 19,213 17,123 40,361 37,046
(Gain) on real estate transactions (499) (333,921) (1,684) (10,410) - (334,420) (304,801)
Impairment of investments in real estate - - - 6,482 - - -
Funds From Operations - diluted $514,692 $432,359 $419,631 $335,536 $414,533 $947,051 $626,832
Weighted-average shares and units outstanding - basic 288,843 288,377 287,898 278,079 275,545 288,588 252,995
Weighted-average shares and units outstanding - diluted (2) 289,485 289,211 288,903 281,524 278,719 289,219 255,704
Funds From Operations per share - basic $1.78 $1.50 $1.46 $1.21 $1.50 $3.28 $2.48
Funds From Operations per share - diluted (2) $1.78 $1.49 $1.45 $1.19 $1.49 $3.27 $2.45
Three Months Ended Six Months Ended
Reconciliation of FFO to Core FFO 30-Jun-21 31-Mar-21 31-Dec-20 30-Sep-20 30-Jun-20 30-Jun-21 30-Jun-20
Funds From Operations - diluted $514,692 $432,359 $419,631 $335,536 $414,533 $947,051 $626,832
Termination fees and other non-core revenues (3) (11,122) (59) (25) (5,713) (21,908) (11,181) (24,333)
Transaction and integration expenses 7,075 14,120 19,290 14,953 15,618 21,195 72,419
Loss from early extinguishment of debt - 18,347 49,576 53,007 - 18,347 632
(Gain on) / Issuance costs associated with redeemed preferred stock (18,000) - - 16,520 - (18,000) -
Severance, equity acceleration, and legal expenses (4) 2,536 2,427 606 920 3,642 4,963 4,914
(Gain) / Loss on FX revaluation (51,649) 34,072 (27,190) 10,312 17,526 (17,577) 98,814
Other non-core expense adjustments 2,298 (19,240) 3,353 6,697 22 (16,942) 5,531
Core Funds From Operations - diluted $445,830 $482,026 $465,241 $432,232 $429,433 $927,856 $784,809
Weighted-average shares and units outstanding - diluted (2) 289,485 289,211 288,903 281,524 278,719 289,219 255,704
Core Funds From Operations per share - diluted (2) $1.54 $1.67 $1.61 $1.54 $1.54 $3.21 $3.07
(1) Real Estate Related Depreciation & Amortization Three Months Ended Six Months Ended
30-Jun-21 31-Mar-21 31-Dec-20 30-Sep-20 30-Jun-20 30-Jun-21 30-Jun-20
Depreciation & amortization per income statement $368,981 $369,733 $359,915 $365,842 $349,165 738,714 640,622
Non-real estate depreciation (5,341) (5,036) (5,549) (7,223) (6,831) (10,377) (11,771)
Real Estate Related Depreciation & Amortization $363,640 $364,697 $354,366 $358,619 $342,334 $728,337 $628,851
(2) For all periods presented, we have excluded the effect of dilutive series C, series G, series I, series J, series K and series L preferred stock, as applicable, that may be converted into common stock upon the occurrence of specified change in control transactions as described in the articles supplementary governing the series C, series G, series I, series J, series K and series L preferred stock, as applicable, which we consider highly improbable. See above for calculations of diluted FFO and the share count detail section that follows the reconciliation of core FFO to AFFO for calculations of weighted average common stock and units outstanding. For definitions and discussion of FFO and core FFO, see the definitions section.
(3) Includes lease termination fees and certain other adjustments that are not core to our business.
(4) Relates to severance and other charges related to the departure of company executives and integration-related severance.
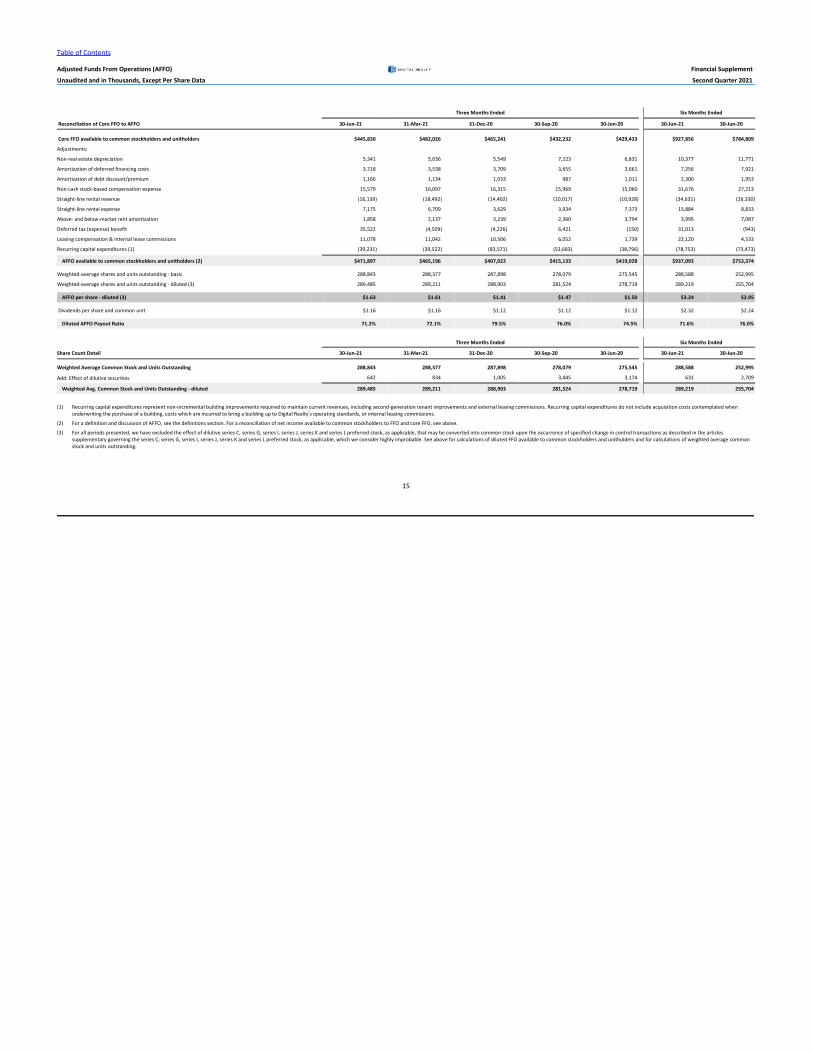
Table of Contents
Adjusted Funds From Operations (AFFO) Financial Supplement
Unaudited and in Thousands, Except Per Share Data Second Quarter 2021
15
Three Months Ended Six Months Ended
Reconciliation of Core FFO to AFFO 30-Jun-21 31-Mar-21 31-Dec-20 30-Sep-20 30-Jun-20 30-Jun-21 30-Jun-20
Core FFO available to common stockholders and unitholders $445,830 $482,026 $465,241 $432,232 $429,433 $927,856 $784,809
Adjustments:
Non-real estate depreciation 5,341 5,036 5,549 7,223 6,831 10,377 11,771
Amortization of deferred financing costs 3,718 3,538 3,709 3,655 3,661 7,256 7,921
Amortization of debt discount/premium 1,166 1,134 1,033 987 1,011 2,300 1,953
Non-cash stock-based compensation expense 15,579 16,097 16,315 15,969 15,060 31,676 27,213
Straight-line rental revenue (16,139) (18,492) (14,402) (10,017) (10,928) (34,631) (26,330)
Straight-line rental expense 7,175 6,709 3,629 3,934 7,373 13,884 8,833
Above- and below-market rent amortization 1,858 2,137 3,239 2,360 3,794 3,995 7,087
Deferred tax (expense) benefit 35,522 (4,509) (4,226) 6,421 (150) 31,013 (943)
Leasing compensation & internal lease commissions 11,078 11,042 10,506 6,052 1,739 22,120 4,533
Recurring capital expenditures (1) (39,231) (39,522) (83,571) (53,683) (38,796) (78,753) (73,473)
AFFO available to common stockholders and unitholders (2) $471,897 $465,196 $407,022 $415,133 $419,028 $937,093 $753,374
Weighted-average shares and units outstanding - basic 288,843 288,377 287,898 278,079 275,545 288,588 252,995
Weighted-average shares and units outstanding - diluted (3) 289,485 289,211 288,903 281,524 278,719 289,219 255,704
AFFO per share - diluted (3) $1.63 $1.61 $1.41 $1.47 $1.50 $3.24 $2.95
Dividends per share and common unit $1.16 $1.16 $1.12 $1.12 $1.12 $2.32 $2.24
Diluted AFFO Payout Ratio 71.2% 72.1% 79.5% 76.0% 74.5% 71.6% 76.0%
Three Months Ended Six Months Ended
Share Count Detail 30-Jun-21 31-Mar-21 31-Dec-20 30-Sep-20 30-Jun-20 30-Jun-21 30-Jun-20
Weighted Average Common Stock and Units Outstanding 288,843 288,377 287,898 278,079 275,545 288,588 252,995
Add: Effect of dilutive securities 642 834 1,005 3,445 3,174 631 2,709
Weighted Avg. Common Stock and Units Outstanding - diluted 289,485 289,211 288,903 281,524 278,719 289,219 255,704
(1) Recurring capital expenditures represent non-incremental building improvements required to maintain current revenues, including second-generation tenant improvements and external leasing commissions. Recurring capital expenditures do not include acquisition costs contemplated whenunderwriting the purchase of a building, costs which are incurred to bring a building up to Digital Realty’s operating standards, or internal leasing commissions.
(2) For a definition and discussion of AFFO, see the definitions section. For a reconciliation of net income available to common stockholders to FFO and core FFO, see above.
(3) For all periods presented, we have excluded the effect of dilutive series C, series G, series I, series J, series K and series L preferred stock, as applicable, that may be converted into common stock upon the occurrence of specified change in control transactions as described in the articlessupplementary governing the series C, series G, series I, series J, series K and series L preferred stock, as applicable, which we consider highly improbable. See above for calculations of diluted FFO available to common stockholders and unitholders and for calculations of weighted average commonstock and units outstanding.

Table of Contents
Consolidated Balance Sheets Financial Supplement
Unaudited and in Thousands, Except Share and Per Share Data Second Quarter 2021
16
30-Jun-21 31-Mar-21 31-Dec-20 30-Sep-20 30-Jun-20AssetsInvestments in real estate:Real estate $23,287,853 $22,762,279 $23,142,988 $22,125,486 $20,843,273Construction in progress 3,270,570 2,904,642 2,768,326 2,328,654 2,514,324Land held for future development 143,575 192,896 226,862 198,536 175,209
Investments in real estate $26,701,998 $25,859,817 $26,138,175 $24,652,676 $23,532,806Accumulated depreciation and amortization (5,919,650) (5,649,019) (5,555,221) (5,250,140) (4,945,534)
Net Investments in Properties $20,782,348 $20,210,798 $20,582,954 $19,402,536 $18,587,272Investment in unconsolidated joint ventures 1,119,026 970,703 1,148,158 1,059,978 1,033,235
Net Investments in Real Estate $21,901,374 $21,181,501 $21,731,112 $20,462,514 $19,620,507
Cash and cash equivalents $120,482 $221,140 $108,501 $971,305 $505,174Accounts and other receivables (1) 630,086 657,096 603,111 585,506 542,750Deferred rent 539,379 524,200 528,180 510,627 496,684Customer relationship value, deferred leasing costs & other intangibles, net 2,956,027 3,057,245 3,122,904 3,106,414 3,128,140Goodwill 8,185,931 8,125,706 8,330,996 8,012,256 7,791,522Assets associated with real estate held for sale — — — — 10,981Operating lease right-of-use assets (2) 1,452,633 1,495,869 1,386,959 1,363,285 1,375,427Other assets 365,308 279,734 264,528 423,426 391,451
Total Assets $36,151,220 $35,542,491 $36,076,291 $35,435,333 $33,862,636
Liabilities and EquityGlobal unsecured revolving credit facilities $1,026,368 $451,007 $531,905 $124,082 $64,492Unsecured term loans — — 536,580 512,642 799,550Unsecured senior notes, net of discount 12,659,043 12,566,198 11,997,010 11,999,170 11,268,753Secured debt and other, net of premiums 242,410 239,634 239,222 238,866 238,826Operating lease liabilities (2) 1,545,689 1,581,759 1,468,712 1,444,060 1,451,152Accounts payable and other accrued liabilities 1,367,240 1,305,921 1,420,162 1,610,814 1,303,337Deferred tax liabilities, net 742,127 650,543 698,308 711,474 664,802Accrued dividends and distributions — — 324,386 571 —Security deposits and prepaid rent 362,606 362,008 371,659 353,902 348,253Liabilities associated with assets held for sale — — — — 238
Total Liabilities $17,945,483 $17,157,070 $17,587,944 $16,995,581 $16,139,403
Redeemable non-controlling interests - operating partnership 41,490 40,097 42,011 41,265 40,584
EquityPreferred Stock: $0.01 par value per share, 110,000,000 shares authorized:Series C Cumulative Redeemable Perpetual Preferred Stock (3) — $219,250 $219,250 $219,250 $219,250Series G Cumulative Redeemable Preferred Stock (4) — — — — 241,468Series I Cumulative Redeemable Preferred Stock (5) — — — — 242,012Series J Cumulative Redeemable Preferred Stock (6) $193,540 193,540 193,540 193,540 193,540Series K Cumulative Redeemable Preferred Stock (7) 203,264 203,264 203,264 203,264 203,264Series L Cumulative Redeemable Preferred Stock (8) 334,886 334,886 334,886 334,886 334,886Common Stock: $0.01 par value per share, 392,000,000 shares authorized (9) 2,806 2,795 2,788 2,784 2,670Additional paid-in capital 20,844,834 20,700,282 20,626,897 20,566,645 19,292,311Dividends in excess of earnings (4,153,407) (3,952,497) (3,997,938) (3,726,901) (3,386,525)Accumulated other comprehensive income (loss), net 31,733 (77,783) 135,010 (123,623) (358,349)
Total Stockholders' Equity $17,457,656 $17,623,737 $17,717,697 $17,669,845 $16,984,527
Noncontrolling InterestsNoncontrolling interest in operating partnership $513,897 $571,292 $608,980 $620,676 $633,831Noncontrolling interest in consolidated joint ventures 192,694 150,295 119,659 107,966 64,291
Total Noncontrolling Interests $706,591 $721,587 $728,639 $728,642 $698,122
Total Equity $18,164,247 $18,345,324 $18,446,336 $18,398,487 $17,682,649
Total Liabilities and Equity $36,151,220 $35,542,491 $36,076,291 $35,435,333 $33,862,636
(1) Net of allowance for doubtful accounts of $20,356 and $18,825 as of June 30, 2021 and December 31, 2020, respectively.(2) Adoption of the new lease accounting standard required that we adjust the consolidated balance sheet to include the recognition of additional right-of-use assets and lease liabilities for operating leases. See our quarterly report on Form10-Q filed on May10, 2019 for additional information.(3) SeriesC Cumulative Redeemable Perpetual Preferred Stock, 6.625%, $0 and $201,250 liquidation preference, respectively ($25.00 per share), 0 and 8,050,000 shares issued and outstanding as of June 30, 2021 and December 31, 2020, respectively. (4) SeriesG Cumulative Redeemable Preferred Stock, 5.875%, $0 liquidation preference (redeemed October 15, 2020, reclassified to accounts payable as of September 30, 2020 for accounting purposes) ($25.00 per share) and 0 shares issued and outstanding as of June 30, 2021 and December 31,
2020.(5) SeriesI Cumulative Redeemable Preferred Stock, 6.350%, $0 liquidation preference ($25.00 per share) and 0 shares issued and outstanding as of June 30, 2021 and December 31, 2020.(6) SeriesJ Cumulative Redeemable Preferred Stock, 5.250%, $200,000 and $200,000 liquidation preference, respectively ($25.00 per share), 8,000,000 and 8,000,000 shares issued and outstanding as of June 30, 2021 and December 31, 2020, respectively.(7) SeriesK Cumulative Redeemable Preferred Stock, 5.850%, $210,000 and $210,000 liquidation preference, respectively ($25.00 per share), 8,400,000 and 8,400,000 shares issued and outstanding as of June 30, 2021 and December 31, 2020, respectively.(8) SeriesL Cumulative Redeemable Preferred Stock, 5.200%, $345,000 and $345,000 liquidation preference, respectively ($25.00 per share), 13,800,000 and 13,800,000 shares issued and outstanding as of June 30, 2021 and December 31, 2020, respectively.(9) Common Stock: 282,603,152 and 208,900,758 shares issued and outstanding as of June 30, 2021 and December 31, 2020, respectively.
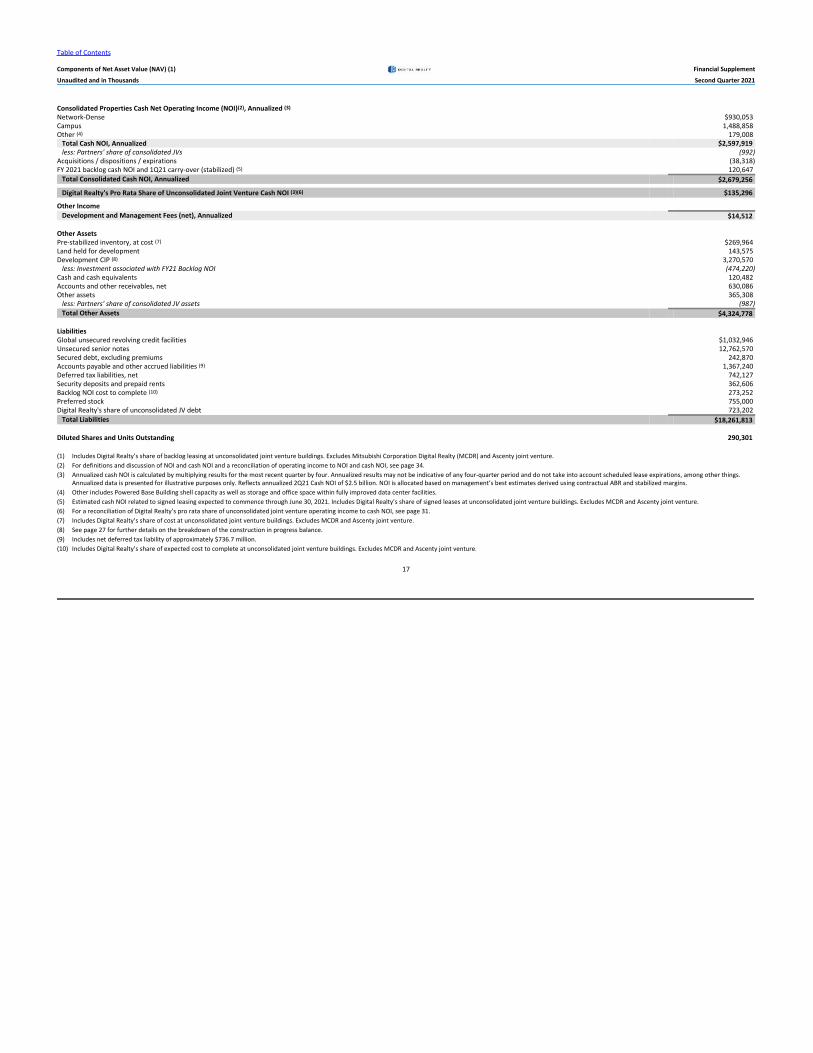
Table of Contents
Components of Net Asset Value (NAV) (1) Financial Supplement
Unaudited and in Thousands Second Quarter 2021
17
Consolidated Properties Cash Net Operating Income (NOI)(2), Annualized (3)
Network-Dense $930,053Campus 1,488,858Other (4) 179,008
Total Cash NOI, Annualized $2,597,919less: Partners' share of consolidated JVs (992)
Acquisitions / dispositions / expirations (38,318)FY 2021 backlog cash NOI and 1Q21 carry-over (stabilized) (5) 120,647
Total Consolidated Cash NOI, Annualized $2,679,256
Digital Realty's Pro Rata Share of Unconsolidated Joint Venture Cash NOI (3)(6) $135,296
Other IncomeDevelopment and Management Fees (net), Annualized $14,512
Other AssetsPre-stabilized inventory, at cost (7) $269,964Land held for development 143,575Development CIP (8) 3,270,570
less: Investment associated with FY21 Backlog NOI (474,220)Cash and cash equivalents 120,482Accounts and other receivables, net 630,086Other assets 365,308
less: Partners' share of consolidated JV assets (987)Total Other Assets $4,324,778
LiabilitiesGlobal unsecured revolving credit facilities $1,032,946Unsecured senior notes 12,762,570Secured debt, excluding premiums 242,870Accounts payable and other accrued liabilities (9) 1,367,240Deferred tax liabilities, net 742,127Security deposits and prepaid rents 362,606Backlog NOI cost to complete (10) 273,252Preferred stock 755,000Digital Realty's share of unconsolidated JV debt 723,202
Total Liabilities $18,261,813
Diluted Shares and Units Outstanding 290,301
(1) Includes Digital Realty’s share of backlog leasing at unconsolidated joint venture buildings. Excludes Mitsubishi Corporation Digital Realty (MCDR) and Ascenty joint venture.(2) For definitions and discussion of NOI and cash NOI and a reconciliation of operating income to NOI and cash NOI, see page 34.(3) Annualized cash NOI is calculated by multiplying results for the most recent quarter by four. Annualized results may not be indicative of any four-quarter period and do not take into account scheduled lease expirations, among other things.
Annualized data is presented for illustrative purposes only. Reflects annualized 2Q21 Cash NOI of $2.5 billion. NOI is allocated based on management’s best estimates derived using contractual ABR and stabilized margins. (4) Other includes Powered Base Building shell capacity as well as storage and office space within fully improved data center facilities.(5) Estimated cash NOI related to signed leasing expected to commence through June 30, 2021. Includes Digital Realty’s share of signed leases at unconsolidated joint venture buildings. Excludes MCDR and Ascenty joint venture.(6) For a reconciliation of Digital Realty’s pro rata share of unconsolidated joint venture operating income to cash NOI, see page 31.(7) Includes Digital Realty’s share of cost at unconsolidated joint venture buildings. Excludes MCDR and Ascenty joint venture.(8) See page 27 for further details on the breakdown of the construction in progress balance.(9) Includes net deferred tax liability of approximately $736.7 million.(10) Includes Digital Realty’s share of expected cost to complete at unconsolidated joint venture buildings. Excludes MCDR and Ascenty joint venture.
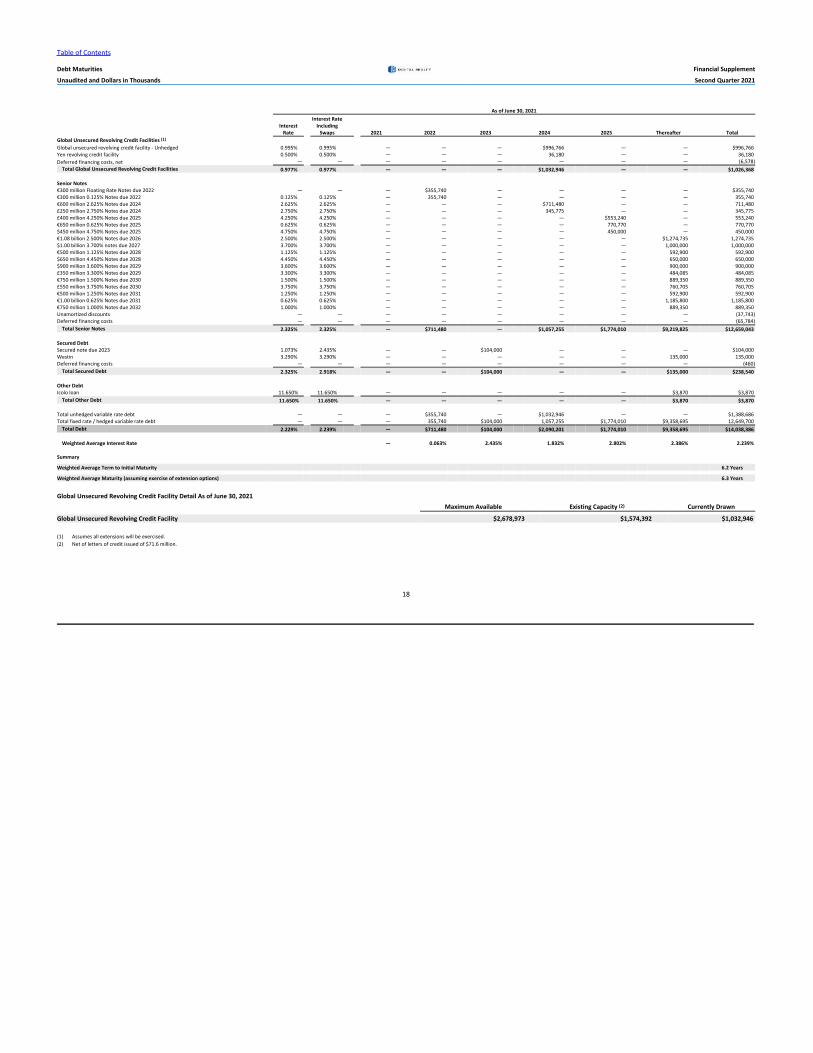
Table of Contents
Debt Maturities Financial Supplement
Unaudited and Dollars in Thousands Second Quarter 2021
18
As of June 30, 2021Interest Rate
Interest IncludingRate Swaps 2021 2022 2023 2024 2025 Thereafter Total
Global Unsecured Revolving Credit Facilities (1)
Global unsecured revolving credit facility - Unhedged 0.995% 0.995% — — — $996,766 — — $996,766Yen revolving credit facility 0.500% 0.500% — — — 36,180 — — 36,180Deferred financing costs, net — — — — — — — — (6,578)
Total Global Unsecured Revolving Credit Facilities 0.977% 0.977% — — — $1,032,946 — — $1,026,368
Senior Notes€300 million Floating Rate Notes due 2022 — — — $355,740 — — — — $355,740€300 million 0.125% Notes due 2022 0.125% 0.125% — 355,740 — — — — 355,740€600 million 2.625% Notes due 2024 2.625% 2.625% — — — $711,480 — — 711,480£250 million 2.750% Notes due 2024 2.750% 2.750% — — — 345,775 — — 345,775£400 million 4.250% Notes due 2025 4.250% 4.250% — — — — $553,240 — 553,240€650 million 0.625% Notes due 2025 0.625% 0.625% — — — — 770,770 — 770,770$450 million 4.750% Notes due 2025 4.750% 4.750% — — — — 450,000 — 450,000€1.08 billion 2.500% Notes due 2026 2.500% 2.500% — — — — — $1,274,735 1,274,735$1.00 billion 3.700% notes due 2027 3.700% 3.700% — — — — — 1,000,000 1,000,000€500 million 1.125% Notes due 2028 1.125% 1.125% — — — — — 592,900 592,900$650 million 4.450% Notes due 2028 4.450% 4.450% — — — — — 650,000 650,000$900 million 3.600% Notes due 2029 3.600% 3.600% — — — — — 900,000 900,000£350 million 3.300% Notes due 2029 3.300% 3.300% — — — — — 484,085 484,085€750 million 1.500% Notes due 2030 1.500% 1.500% — — — — — 889,350 889,350£550 million 3.750% Notes due 2030 3.750% 3.750% — — — — — 760,705 760,705€500 million 1.250% Notes due 2031 1.250% 1.250% — — — — — 592,900 592,900€1.00 billion 0.625% Notes due 2031 0.625% 0.625% — — — — — 1,185,800 1,185,800€750 million 1.000% Notes due 2032 1.000% 1.000% — — — — — 889,350 889,350Unamortized discounts — — — — — — — — (37,743)Deferred financing costs — — — — — — — — (65,784)
Total Senior Notes 2.325% 2.325% — $711,480 — $1,057,255 $1,774,010 $9,219,825 $12,659,043
Secured DebtSecured note due 2023 1.073% 2.435% — — $104,000 — — — $104,000Westin 3.290% 3.290% — — — — — 135,000 135,000Deferred financing costs — — — — — — — — (460)
Total Secured Debt 2.325% 2.918% — — $104,000 — — $135,000 $238,540
Other DebtIcolo loan 11.650% 11.650% — — — — — $3,870 $3,870
Total Other Debt 11.650% 11.650% — — — — — $3,870 $3,870
Total unhedged variable rate debt — — — $355,740 — $1,032,946 — — $1,388,686Total fixed rate / hedged variable rate debt — — — 355,740 $104,000 1,057,255 $1,774,010 $9,358,695 12,649,700
Total Debt 2.229% 2.239% — $711,480 $104,000 $2,090,201 $1,774,010 $9,358,695 $14,038,386
Weighted Average Interest Rate — 0.063% 2.435% 1.832% 2.802% 2.386% 2.239%
Summary
Weighted Average Term to Initial Maturity 6.2 Years
Weighted Average Maturity (assuming exercise of extension options) 6.3 Years
Global Unsecured Revolving Credit Facility Detail As of June 30, 2021
Maximum Available Existing Capacity (2) Currently Drawn
Global Unsecured Revolving Credit Facility $2,678,973 $1,574,392 $1,032,946
(1) Assumes all extensions will be exercised.(2) Net of letters of credit issued of $71.6 million.
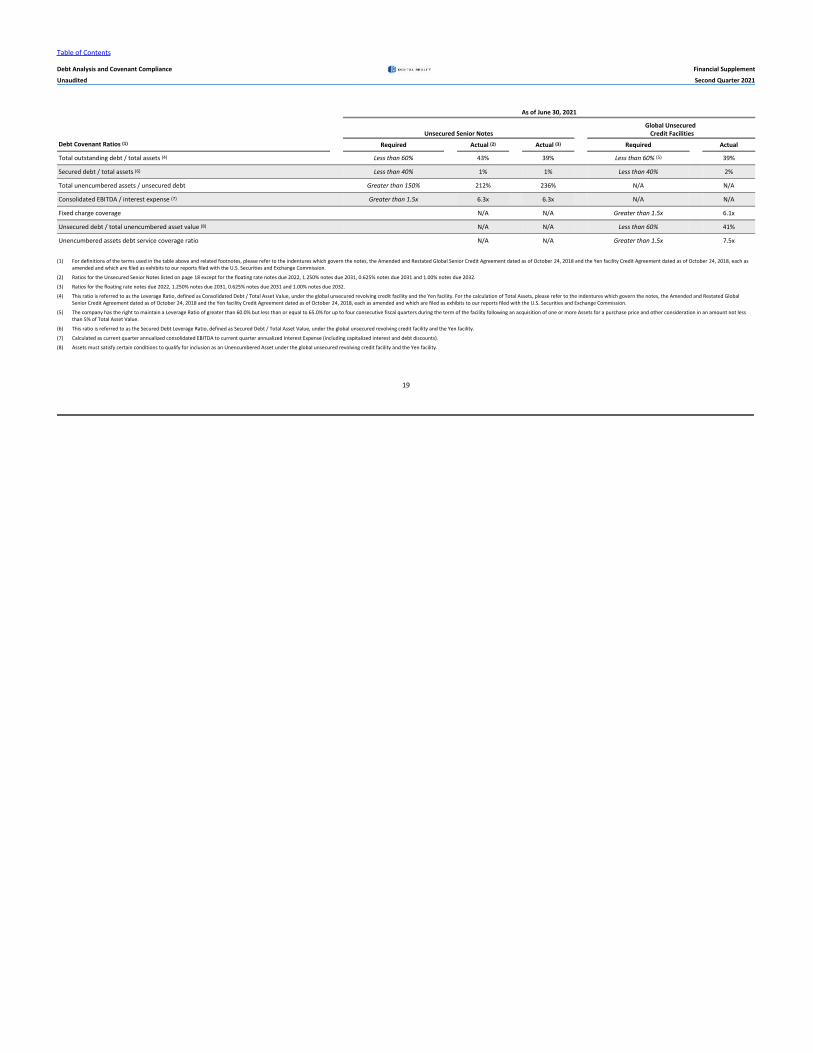
Table of Contents
Debt Analysis and Covenant Compliance Financial Supplement
Unaudited Second Quarter 2021
19
As of June 30, 2021
Global Unsecured Unsecured Senior Notes Credit Facilities
Debt Covenant Ratios (1) Required Actual (2) Actual (3) Required Actual
Total outstanding debt / total assets (4) Less than 60% 43% 39% Less than 60% (5) 39%
Secured debt / total assets (6) Less than 40% 1% 1% Less than 40% 2%
Total unencumbered assets / unsecured debt Greater than 150% 212% 236% N/A N/A
Consolidated EBITDA / interest expense (7) Greater than 1.5x 6.3x 6.3x N/A N/A
Fixed charge coverage N/A N/A Greater than 1.5x 6.1x
Unsecured debt / total unencumbered asset value (8) N/A N/A Less than 60% 41%
Unencumbered assets debt service coverage ratio N/A N/A Greater than 1.5x 7.5x
(1) For definitions of the terms used in the table above and related footnotes, please refer to the indentures which govern the notes, the Amended and Restated Global Senior Credit Agreement dated as of October24, 2018 and the Yen facility Credit Agreement dated as of October24, 2018, each asamended and which are filed as exhibits to our reports filed with the U.S. Securities and Exchange Commission.
(2) Ratios for the Unsecured Senior Notes listed on page18 except for the floating rate notes due 2022, 1.250% notes due 2031, 0.625% notes due 2031 and 1.00% notes due 2032.
(3) Ratios for the floating rate notes due 2022, 1.250% notes due 2031, 0.625% notes due 2031 and 1.00% notes due 2032.
(4) This ratio is referred to as the Leverage Ratio, defined as Consolidated Debt / Total Asset Value, under the global unsecured revolving credit facility and the Yen facility. For the calculation of Total Assets, please refer to the indentures which govern the notes, the Amended and Restated GlobalSenior Credit Agreement dated as of October24, 2018 and the Yen facility Credit Agreement dated as of October24, 2018, each as amended and which are filed as exhibits to our reports filed with the U.S. Securities and Exchange Commission.
(5) The company has the right to maintain a Leverage Ratio of greater than 60.0% but less than or equal to 65.0% for up to four consecutive fiscal quarters during the term of the facility following an acquisition of one or more Assets for a purchase price and other consideration in an amount not lessthan 5% of Total Asset Value.
(6) This ratio is referred to as the Secured Debt Leverage Ratio, defined as Secured Debt / Total Asset Value, under the global unsecured revolving credit facility and the Yen facility.
(7) Calculated as current quarter annualized consolidated EBITDA to current quarter annualized Interest Expense (including capitalized interest and debt discounts).
(8) Assets must satisfy certain conditions to qualify for inclusion as an Unencumbered Asset under the global unsecured revolving credit facility and the Yen facility.
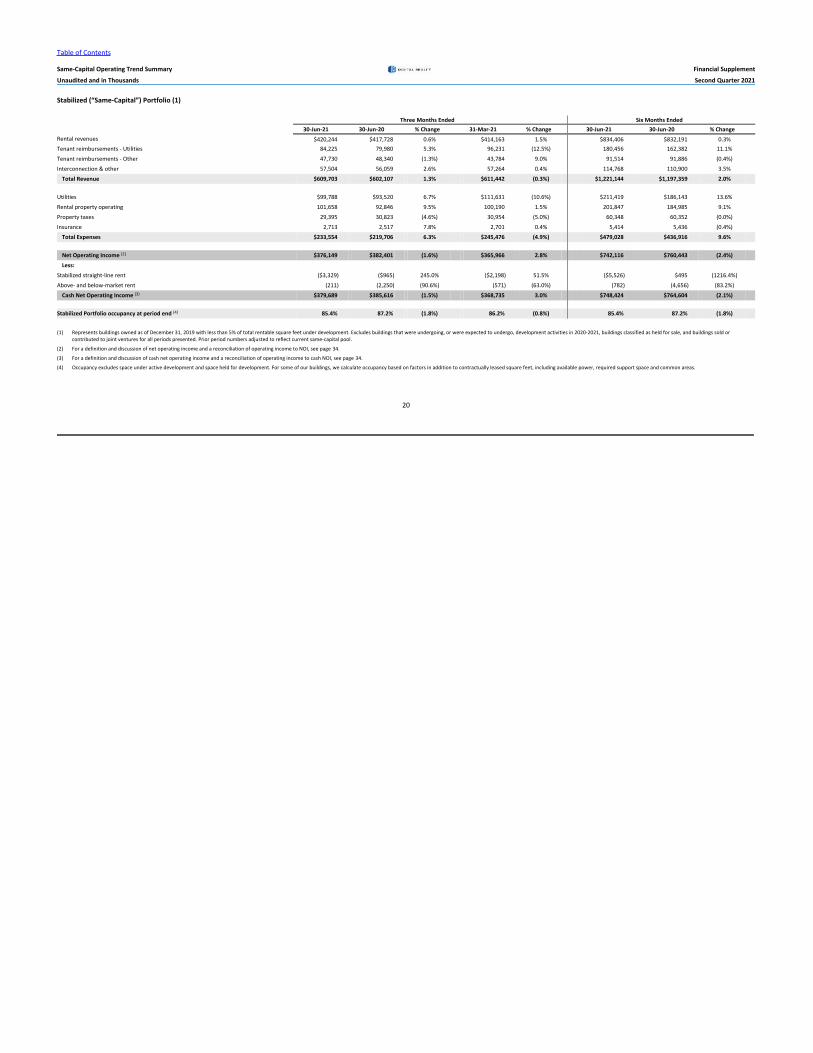
Table of Contents
Same-Capital Operating Trend Summary Financial Supplement
Unaudited and in Thousands Second Quarter 2021
20
Stabilized (“Same-Capital”) Portfolio (1)
Three Months Ended Six Months Ended30-Jun-21 30-Jun-20 % Change 31-Mar-21 % Change 30-Jun-21 30-Jun-20 % Change
Rental revenues $420,244 $417,728 0.6% $414,163 1.5% $834,406 $832,191 0.3%Tenant reimbursements - Utilities 84,225 79,980 5.3% 96,231 (12.5%) 180,456 162,382 11.1%
Tenant reimbursements - Other 47,730 48,340 (1.3%) 43,784 9.0% 91,514 91,886 (0.4%)
Interconnection & other 57,504 56,059 2.6% 57,264 0.4% 114,768 110,900 3.5%
Total Revenue $609,703 $602,107 1.3% $611,442 (0.3%) $1,221,144 $1,197,359 2.0%
Utilities $99,788 $93,520 6.7% $111,631 (10.6%) $211,419 $186,143 13.6%
Rental property operating 101,658 92,846 9.5% 100,190 1.5% 201,847 184,985 9.1%
Property taxes 29,395 30,823 (4.6%) 30,954 (5.0%) 60,348 60,352 (0.0%)
Insurance 2,713 2,517 7.8% 2,701 0.4% 5,414 5,436 (0.4%)
Total Expenses $233,554 $219,706 6.3% $245,476 (4.9%) $479,028 $436,916 9.6%
Net Operating Income (2) $376,149 $382,401 (1.6%) $365,966 2.8% $742,116 $760,443 (2.4%)
Less:
Stabilized straight-line rent ($3,329) ($965) 245.0% ($2,198) 51.5% ($5,526) $495 (1216.4%)
Above- and below-market rent (211) (2,250) (90.6%) (571) (63.0%) (782) (4,656) (83.2%)
Cash Net Operating Income (3) $379,689 $385,616 (1.5%) $368,735 3.0% $748,424 $764,604 (2.1%)
Stabilized Portfolio occupancy at period end (4) 85.4% 87.2% (1.8%) 86.2% (0.8%) 85.4% 87.2% (1.8%)
(1) Represents buildings owned as of December 31, 2019 with less than 5% of total rentable square feet under development. Excludes buildings that were undergoing, or were expected to undergo, development activities in 2020-2021, buildings classified as held for sale, and buildings sold orcontributed to joint ventures for all periods presented. Prior period numbers adjusted to reflect current same-capital pool.
(2) For a definition and discussion of net operating income and a reconciliation of operating income to NOI, see page34.
(3) For a definition and discussion of cash net operating income and a reconciliation of operating income to cash NOI, see page34.
(4) Occupancy excludes space under active development and space held for development. For some of our buildings, we calculate occupancy based on factors in addition to contractually leased square feet, including available power, required support space and common areas.
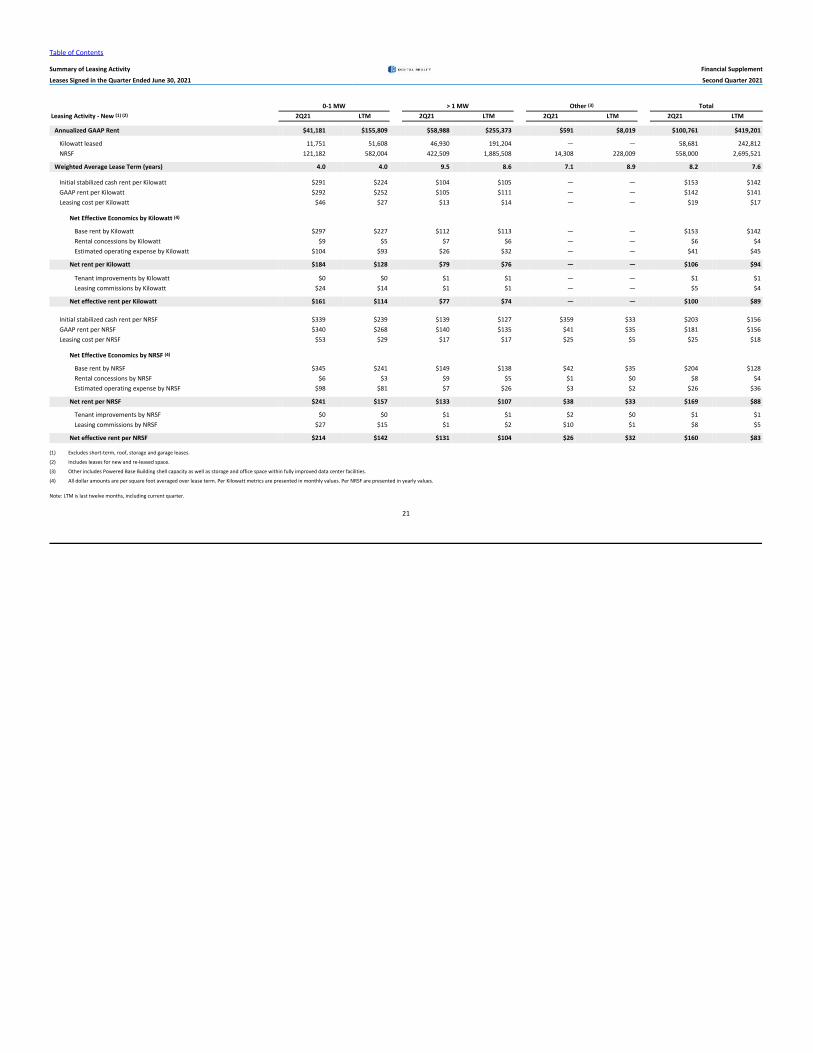
Table of Contents
Summary of Leasing Activity Financial Supplement
Leases Signed in the Quarter Ended June 30, 2021 Second Quarter 2021
21
0-1 MW > 1 MW Other (3) Total Leasing Activity - New (1) (2) 2Q21 LTM 2Q21 LTM 2Q21 LTM 2Q21 LTM
Annualized GAAP Rent $41,181 $155,809 $58,988 $255,373 $591 $8,019 $100,761 $419,201
Kilowatt leased 11,751 51,608 46,930 191,204 — — 58,681 242,812NRSF 121,182 582,004 422,509 1,885,508 14,308 228,009 558,000 2,695,521
Weighted Average Lease Term (years) 4.0 4.0 9.5 8.6 7.1 8.9 8.2 7.6
Initial stabilized cash rent per Kilowatt $291 $224 $104 $105 — — $153 $142GAAP rent per Kilowatt $292 $252 $105 $111 — — $142 $141Leasing cost per Kilowatt $46 $27 $13 $14 — — $19 $17
Net Effective Economics by Kilowatt (4)
Base rent by Kilowatt $297 $227 $112 $113 — — $153 $142Rental concessions by Kilowatt $9 $5 $7 $6 — — $6 $4Estimated operating expense by Kilowatt $104 $93 $26 $32 — — $41 $45
Net rent per Kilowatt $184 $128 $79 $76 — — $106 $94
Tenant improvements by Kilowatt $0 $0 $1 $1 — — $1 $1Leasing commissions by Kilowatt $24 $14 $1 $1 — — $5 $4
Net effective rent per Kilowatt $161 $114 $77 $74 — — $100 $89
Initial stabilized cash rent per NRSF $339 $239 $139 $127 $359 $33 $203 $156GAAP rent per NRSF $340 $268 $140 $135 $41 $35 $181 $156Leasing cost per NRSF $53 $29 $17 $17 $25 $5 $25 $18
Net Effective Economics by NRSF (4)
Base rent by NRSF $345 $241 $149 $138 $42 $35 $204 $128Rental concessions by NRSF $6 $3 $9 $5 $1 $0 $8 $4Estimated operating expense by NRSF $98 $81 $7 $26 $3 $2 $26 $36
Net rent per NRSF $241 $157 $133 $107 $38 $33 $169 $88
Tenant improvements by NRSF $0 $0 $1 $1 $2 $0 $1 $1Leasing commissions by NRSF $27 $15 $1 $2 $10 $1 $8 $5
Net effective rent per NRSF $214 $142 $131 $104 $26 $32 $160 $83
(1) Excludes short-term, roof, storage and garage leases.
(2) Includes leases for new and re-leased space.
(3) Other includes Powered Base Building shell capacity as well as storage and office space within fully improved data center facilities.
(4) All dollar amounts are per square foot averaged over lease term. Per Kilowatt metrics are presented in monthly values. Per NRSF are presented in yearly values.
Note: LTM is last twelve months, including current quarter.

Table of Contents
Summary of Leasing Activity Financial Supplement
Leases Renewed in the Quarter Ended June 30, 2021 Second Quarter 2021
22
0-1 MW > 1 MW Other (4) Total Leasing Activity - Renewals (1) (2) (3) 2Q21 LTM 2Q21 LTM 2Q21 LTM 2Q21 LTM
Leases renewed (Kilowatt) 34,895 126,386 23,440 93,941 — — 58,335 220,326Leases renewed (NRSF) 515,796 1,783,260 260,818 1,042,007 313,620 885,724 1,090,234 3,710,991Leasing cost per Kilowatt $2 $1 $0 $1 — — $1 $1Leasing cost per NRSF $1 $1 $0 $1 $1 $1 $1 $1
Weighted Term (years) 2.0 1.7 2.1 3.5 5.0 3.8 2.9 2.7
Cash Rent
Expiring cash rent per Kilowatt $310 $319 $143 $147 — — $243 $246Renewed cash rent per Kilowatt $312 $321 $141 $141 — — $244 $245
% Change Cash Rent Per Kilowatt 0.8% 0.8% (0.9%) (3.7%) — — 0.4% (0.4%)
Expiring cash rent per NRSF $252 $271 $154 $159 $25 $22 $163 $180Renewed cash rent per NRSF $254 $273 $152 $153 $24 $22 $163 $180
% Change Cash Rent Per NRSF 0.8% 0.8% (0.9%) (3.7%) (5.7%) (0.4%) 0.1% (0.4%)
GAAP Rent
Expiring GAAP rent per Kilowatt $307 $317 $138 $141 — — $239 $242Renewed GAAP rent per Kilowatt $313 $322 $141 $145 — — $244 $246
% Change GAAP Rent Per Kilowatt 1.9% 1.6% 2.1% 2.8% — — 1.9% 1.6%
Expiring GAAP rent per NRSF $249 $269 $149 $152 $23 $20 $160 $177Renewed GAAP rent per NRSF $254 $274 $152 $156 $24 $23 $164 $181
% Change GAAP Rent Per NRSF 1.9% 1.6% 2.1% 2.8% 6.2% 12.5% 2.1% 2.2%
Retention ratio (5) 87.4% 83.8% 68.4% 68.0% 71.5% 74.9% 77.3% 76.6%
Churn (6) 1.9% 10.7% 0.9% 5.0% 1.1% 3.7% 1.4% 7.2%
(1) Excludes short-term, roof, storage and garage leases.
(2) Rental rates represent annual estimated cash rent per kilowatt, adjusted for straight-line rents in accordance with GAAP.
(3) Per Kilowatt metrics are presented in monthly values. Per NRSF metrics are presented in yearly values.
(4) Other includes Powered Base Building shell capacity as well as storage and office space within fully improved data center facilities.
(5) Based on square feet.
(6) Churn is defined as recurring revenue lost during the period due to leases terminated or not renewed during the period, divided by recurring revenue at the beginning of the period.
Note: LTM is last twelve months, including current quarter.

Table of Contents
Lease Expirations - By Size Financial Supplement
Dollars in Thousands, Except Per Square Foot Second Quarter 2021
23
% of Annualized Rent Per Annualized Rent Per Rent Per kW Square Footage of Annualized Annualized Occupied Occupied Square Annualized Rent kW of Expiring Rent per kW Per Month at
Year Expiring Leases (1) Rent (2) Rent Square Foot Foot at Expiration at Expiration Leases Per Month Expiration 0 - 1 MW Available 1,723,777 — — — — — — — — Month to Month (3) 143,414 $35,286 1.2% $246 $248 $35,515 8,855 $332 $334 2021 845,144 254,879 8.3% 302 301 254,786 62,870 338 338 2022 1,428,035 403,142 13.2% 282 283 403,479 108,414 310 310 2023 612,593 136,767 4.5% 223 226 138,733 42,745 267 270 2024 569,080 98,239 3.2% 173 177 100,975 37,612 218 224 2025 349,837 61,039 2.0% 174 181 63,272 21,532 236 245 2026 152,913 22,351 0.7% 146 157 24,061 10,095 185 199 2027 171,315 20,478 0.7% 120 132 22,635 9,503 180 198 2028 64,936 5,328 0.2% 82 96 6,263 2,148 207 243 2029 40,691 4,815 0.2% 118 133 5,428 2,635 152 172 2030 42,793 4,927 0.2% 115 118 5,065 3,182 129 133 Thereafter 224,721 11,589 0.4% 52 55 12,368 3,968 243 260
Total / Wtd. Avg. 6,369,248 $1,058,839 34.6% $228 $231 $1,072,578 313,560 $281 $285
> 1 MW Expiring Leases (1) Annualized Annualized Annualized Rent Per Annualized Rent Per Annualized Rent Per kW of Expiring Annualized Rent Per kW Available 1,888,368 — — — — — — — — Month to Month (3) 134,899 $16,236 0.5% $120 $120 $16,236 9,899 $137 $137 2021 670,976 108,919 3.6% 162 167 111,796 63,377 143 147 2022 1,681,053 282,549 9.2% 168 170 285,190 158,784 148 150 2023 1,635,116 237,715 7.8% 145 146 238,846 138,018 144 144 2024 1,286,425 190,919 6.2% 148 157 202,215 120,201 132 140 2025 1,739,747 225,602 7.4% 130 139 242,372 156,446 120 129 2026 1,299,204 167,260 5.5% 129 143 185,897 118,390 118 131 2027 628,654 90,245 2.9% 144 162 102,093 64,513 117 132 2028 455,508 49,825 1.6% 109 127 57,910 44,413 93 109 2029 684,816 75,011 2.5% 110 128 87,417 63,915 98 114 2030 492,128 58,050 1.9% 118 135 66,216 47,071 103 117 Thereafter 1,847,024 211,017 6.9% 114 136 251,225 180,377 97 116
Total / Wtd. Avg. 14,443,916 $1,713,348 56.0% $136 $147 $1,847,413 1,165,404 $123 $132
Other (4) Expiring Leases (1) Annualized Annualized Annualized Rent Per Annualized Rent Per Annualized Rent Per kW of Expiring Annualized Rent Per kW Available 1,434,163 — — — — — — — — Month to Month (3) 37,956 $1,606 0.1% $42 $42 $1,606 — — — 2021 548,030 19,423 0.6% 35 35 19,417 — — — 2022 1,018,538 25,583 0.8% 25 25 25,135 — — — 2023 1,096,441 28,192 0.9% 26 27 29,145 — — — 2024 645,990 22,109 0.7% 34 35 22,673 — — — 2025 1,018,958 42,723 1.4% 42 44 44,614 — — — 2026 579,121 15,735 0.5% 27 31 17,700 — — — 2027 379,086 14,794 0.5% 39 45 17,119 — — — 2028 227,938 11,483 0.4% 50 58 13,261 — — — 2029 431,914 19,044 0.6% 44 52 22,619 — — — 2030 730,692 30,424 1.0% 42 52 38,101 — — — Thereafter 2,791,057 57,291 1.9% 21 27 75,432 — — —
Total / Wtd. Avg. 10,939,886 $288,407 9.4% $30 $34 $326,822 — — —
Total Expiring Leases (1) Annualized Annualized Annualized Rent Per Annualized Rent Per Annualized Rent Per kW of Expiring Annualized Rent Per kW Available 5,046,308 — — — — — — — — Month to Month (3) 316,269 $53,128 1.7% $168 $169 $53,357 — — — 2021 2,064,150 383,221 12.5% 186 187 386,000 — — — 2022 4,127,626 711,274 23.2% 172 173 713,803 — — — 2023 3,344,150 402,674 13.2% 120 122 406,724 — — — 2024 2,501,495 311,268 10.2% 124 130 325,862 — — — 2025 3,108,542 329,364 10.8% 106 113 350,257 — — — 2026 2,031,238 205,346 6.7% 101 112 227,658 — — — 2027 1,179,055 125,516 4.1% 106 120 141,848 — — — 2028 748,381 66,635 2.2% 89 103 77,433 — — — 2029 1,157,421 98,870 3.2% 85 100 115,464 — — — 2030 1,265,614 93,401 3.1% 74 86 109,382 — — — Thereafter 4,862,802 279,896 9.1% 58 70 339,024 — — —
Total / Wtd. Avg. 31,753,051 $3,060,594 100.0% $115 $122 $3,246,812 — — —
(1) For some buildings, we calculate square footage based on factors in addition to contractually leased square feet, including available power, required support space and common areas. We estimate the total net rentable square feet available for lease based on a number of factors in addition tocontractually leased square feet, including available power, required support space and common areas.
(2) Annualized rent represents the monthly contractual base rent (defined as cash base rent before abatements) under existing leases as of June 30, 2021, multiplied by 12.
(3) Includes leases, licenses and similar agreements that upon expiration have been automatically renewed on amonth-to-month basis.
(4) Other includes unimproved building shell capacity as well as storage and office space within fully improved data center facilities.
Note: Represents consolidated portfolio in addition to our managed portfolio of unconsolidated joint ventures based on our ownership percentage.
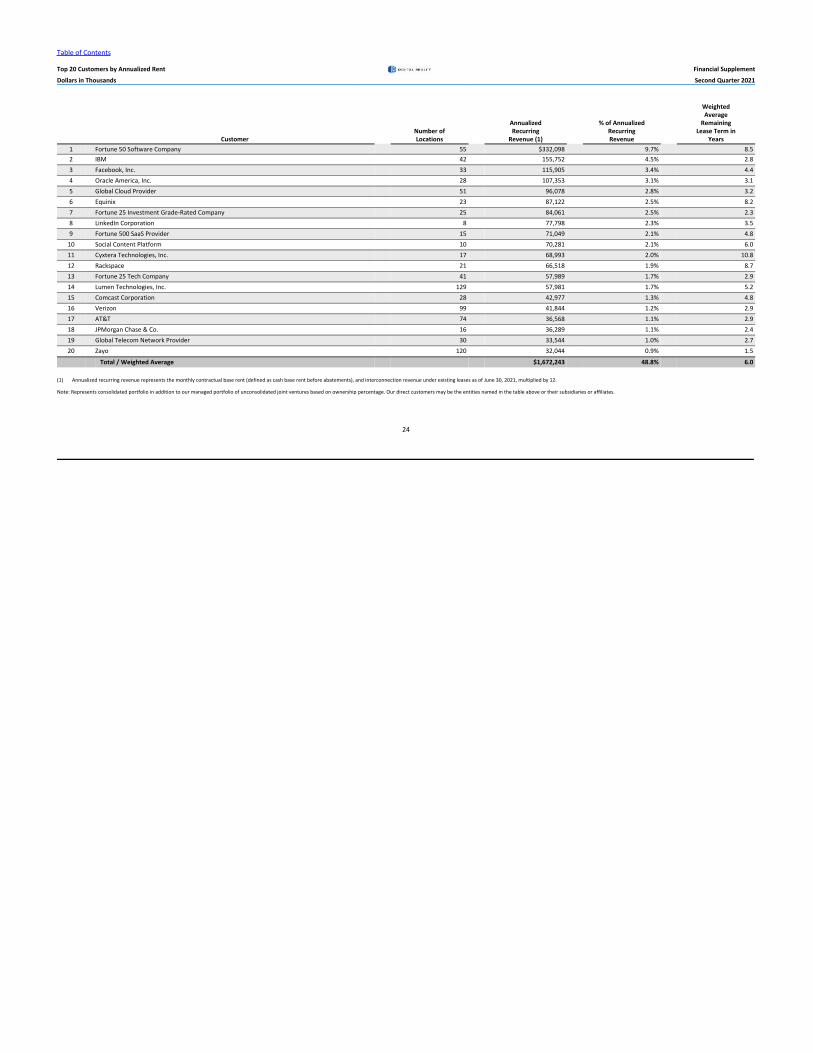
Table of Contents
Top 20 Customers by Annualized Rent Financial Supplement
Dollars in Thousands Second Quarter 2021
24
WeightedAverage
Annualized % of Annualized RemainingNumber of Recurring Recurring Lease Term in
Customer Locations Revenue (1) Revenue Years1 Fortune 50 Software Company 55 $332,098 9.7% 8.52 IBM 42 155,752 4.5% 2.83 Facebook, Inc. 33 115,905 3.4% 4.44 Oracle America, Inc. 28 107,353 3.1% 3.15 Global Cloud Provider 51 96,078 2.8% 3.26 Equinix 23 87,122 2.5% 8.27 Fortune 25 Investment Grade-Rated Company 25 84,061 2.5% 2.38 LinkedIn Corporation 8 77,798 2.3% 3.59 Fortune 500 SaaS Provider 15 71,049 2.1% 4.8
10 Social Content Platform 10 70,281 2.1% 6.011 Cyxtera Technologies, Inc. 17 68,993 2.0% 10.812 Rackspace 21 66,518 1.9% 8.713 Fortune 25 Tech Company 41 57,989 1.7% 2.914 Lumen Technologies, Inc. 129 57,981 1.7% 5.215 Comcast Corporation 28 42,977 1.3% 4.816 Verizon 99 41,844 1.2% 2.917 AT&T 74 36,568 1.1% 2.918 JPMorgan Chase & Co. 16 36,289 1.1% 2.419 Global Telecom Network Provider 30 33,544 1.0% 2.720 Zayo 120 32,044 0.9% 1.5
Total / Weighted Average $1,672,243 48.8% 6.0
(1) Annualized recurring revenue represents the monthly contractual base rent (defined as cash base rent before abatements), and interconnection revenue under existing leases as of June 30, 2021, multiplied by 12.
Note: Represents consolidated portfolio in addition to our managed portfolio of unconsolidated joint ventures based on ownership percentage. Our direct customers may be the entities named in the table above or their subsidiaries or affiliates.

Table of Contents
Occupancy Analysis Financial Supplement
Dollars in Thousands Second Quarter 2021
25
Net Rentable Space Under Active Space Held for Annualized Occupancy (5) White Space Data CenterMetropolitan Area Square Feet (1) Development (2) Development (3) Rent (4) 30-Jun-21 31-Mar-21 IT Load (6) Count
North America Northern Virginia 5,893,718 433,715 76,944 $577,666 92.2% 92.6% 470.4 24 Chicago 3,426,580 — 148,101 302,489 87.6% 87.5% 162.7 10 New York 2,083,013 201,160 99,947 215,923 84.7% 84.3% 51.0 13 Silicon Valley 2,251,021 65,594 — 214,289 96.8% 96.8% 105.5 20 Dallas 3,530,749 143,051 28,094 193,330 80.2% 81.1% 101.2 21 Phoenix 795,687 — — 67,636 72.5% 71.6% 42.5 2 San Francisco 824,972 23,321 — 62,762 64.7% 71.3% 29.1 4 Atlanta 525,414 41,661 313,581 52,222 94.7% 94.7% 7.1 4 Los Angeles 798,571 19,908 — 43,813 85.1% 84.8% 13.8 4 Seattle 400,369 — — 40,352 85.9% 85.7% 19.5 1 Portland 331,242 823,056 — 32,411 97.5% 97.5% 28.5 2 Toronto, Canada 364,798 466,866 — 31,423 77.9% 83.6% 29.8 3 Boston 437,119 — 50,649 22,256 50.7% 47.3% 19.0 3 Houston 392,816 — 13,969 18,130 70.6% 70.6% 13.0 6 Miami 226,314 — — 8,615 89.3% 90.6% 1.3 2 Austin 85,688 — — 7,154 63.5% 63.5% 4.3 1 Minneapolis/St. Paul 328,765 — — 6,945 100.0% 100.0% — 1 Charlotte 95,499 — — 5,058 89.5% 89.4% 1.5 3
North America Total/Weighted Average 22,792,334 2,218,332 731,285 $1,902,474 86.1% 86.4% 1,100.1 124 EMEA London, England 1,431,735 — 160,850 $253,320 74.7% 75.8% 101.8 16 Frankfurt, Germany 1,771,678 1,452,149 — 200,052 86.2% 88.0% 98.8 27 Amsterdam, Netherlands 1,172,124 94,730 95,262 139,409 64.6% 62.4% 110.4 13 Paris, France 472,691 440,722 — 65,907 86.2% 86.3% 33.1 10 Vienna, Austria 353,575 — — 47,771 80.3% 83.7% 25.6 2 Marseille, France 293,908 226,253 — 46,189 82.7% 80.6% 20.8 4 Dublin, Ireland 381,052 94,005 — 45,631 75.5% 75.8% 24.3 8 Madrid, Spain 218,282 225,140 — 36,039 77.8% 78.6% 9.0 4 Zurich, Switzerland 284,671 258,240 — 35,496 69.9% 58.4% 17.0 3 Brussels, Belgium 136,685 27,420 — 24,084 77.0% 77.4% 7.5 3 Stockholm, Sweden 205,304 48,492 — 23,480 62.3% 61.3% 12.8 6 Copenhagen, Denmark 163,755 162,123 — 18,152 78.1% 76.5% 7.1 3 Dusseldorf, Germany 105,523 95,926 — 15,981 59.9% 59.9% 4.3 3 Athens, Greece 55,170 66,736 — 7,144 61.4% 60.4% 1.7 3 Zagreb, Croatia 19,116 12,801 — 2,524 55.3% 48.5% 0.9 1 Nairobi, Kenya 15,710 — — 1,078 52.2% 54.7% 0.5 1 Mombasa, Kenya 10,082 37,025 — 610 41.2% 44.3% 0.3 2
EMEA Total/Weighted Average 7,091,062 3,241,762 256,112 $962,866 76.5% 76.2% 475.7 109 Asia Pacific Singapore 751,810 131,037 — $120,871 87.4% 95.8% 54.0 3 Sydney, Australia 226,697 222,838 — 27,298 86.4% 85.7% 14.9 4 Melbourne, Australia 146,570 — — 16,156 62.8% 71.0% 9.6 2 Tokyo, Japan — 406,664 — — — — — 1 Osaka, Japan — 429,067 — — — — — 2 Seoul, South Korea — 162,260 — — — — — 1 Hong Kong — 284,751 — — — — — 1
Asia Pacific Total/Weighted Average 1,125,077 1,636,617 — $164,326 84.0% 89.3% 78.5 14 Non-Data Center Properties 263,668 — — $1,263 100.0% 100.0% — —
Consolidated Portfolio Total/Weighted Average 31,272,142 7,096,711 987,397 $3,030,928 84.0% 84.3% 1,654.3 247 Managed Unconsolidated Joint Ventures
Northern Virginia 1,250,419 — — $77,414 92.7% 92.7% 75.2 7 Hong Kong 186,300 — — 20,178 87.3% 87.3% 11.0 1 Silicon Valley 326,305 — — 13,915 100.0% 100.0% — 4 Dallas 319,876 — — 5,693 82.4% 82.4% — 3 New York 108,336 — — 3,460 100.0% 100.0% 3.4 1
Managed Unconsolidated Portfolio Total/Weighted Average 2,191,236 — — $120,661 92.2% 92.2% 89.6 16Managed Portfolio Total/Weighted Average 33,463,378 7,096,711 987,397 $3,151,589 84.5% 84.9% 1,743.9 263
Digital Realty Share Total/Weighted Average (7) 31,753,051 7,096,711 987,397 $3,060,594 84.1% 84.5% 1,674.6 Non-Managed Unconsolidated Joint Ventures Sao Paulo, Brazil 919,846 285,903 413,872 131,388 98.4% 97.9% 77.4 16 Osaka, Japan 277,031 55,055 — 50,176 87.5% 87.3% 21.6 2 Tokyo, Japan 892,667 — — 47,359 74.3% 87.8% 21.0 2 Rio De Janeiro, Brazil 72,442 26,781 — 11,126 100.0% 100.0% 6.0 2 Fortaleza, Brazil 94,205 — — 10,078 100.0% 100.0% 6.2 1 Seattle 51,000 — — 7,770 100.0% 100.0% 9.0 1 Santiago, Chile 67,340 45,209 180,835 6,605 68.7% 68.7% 6.3 2 Queretaro, Mexico — 108,178 376,202 — - - — 2
Non-Managed Portfolio Total/Weighted Average 2,374,531 521,126 970,909 $264,502 87.4% 92.2% 147.4 28Portfolio Total/Weighted Average 35,837,908 7,617,837 1,958,306 $3,416,091 84.7% 85.3% 1,891.3 291
(1) We estimate the total net rentable square feet available for lease based on a number of factors in addition to contractually leased square feet, including available power, required support space and common areas.
(2) Space under active development includes current Base Building and Data Center projects in progress (see page26).
(3) Space held for development includes space held for future Data Center development, and excludes space under active development (see page29).
(4) Annualized base rent represents themonthly contractual base rent (defined as cash base rent before abatements) under existing leases as of June 30, 2021, multiplied by 12.
(5) Occupancy excludes space under active development and space held for development. For some of our buildings, we calculate occupancy based on factors in addition to contractually leased square feet, including available power, required support space and common areas.
(6) White Space IT Load represents UPS-backed utility power dedicated to Digital Realty’s operated data center space.
(7) Represents consolidated portfolio plus our managed portfolio of unconsolidated joint ventures based on our ownershippercentage.
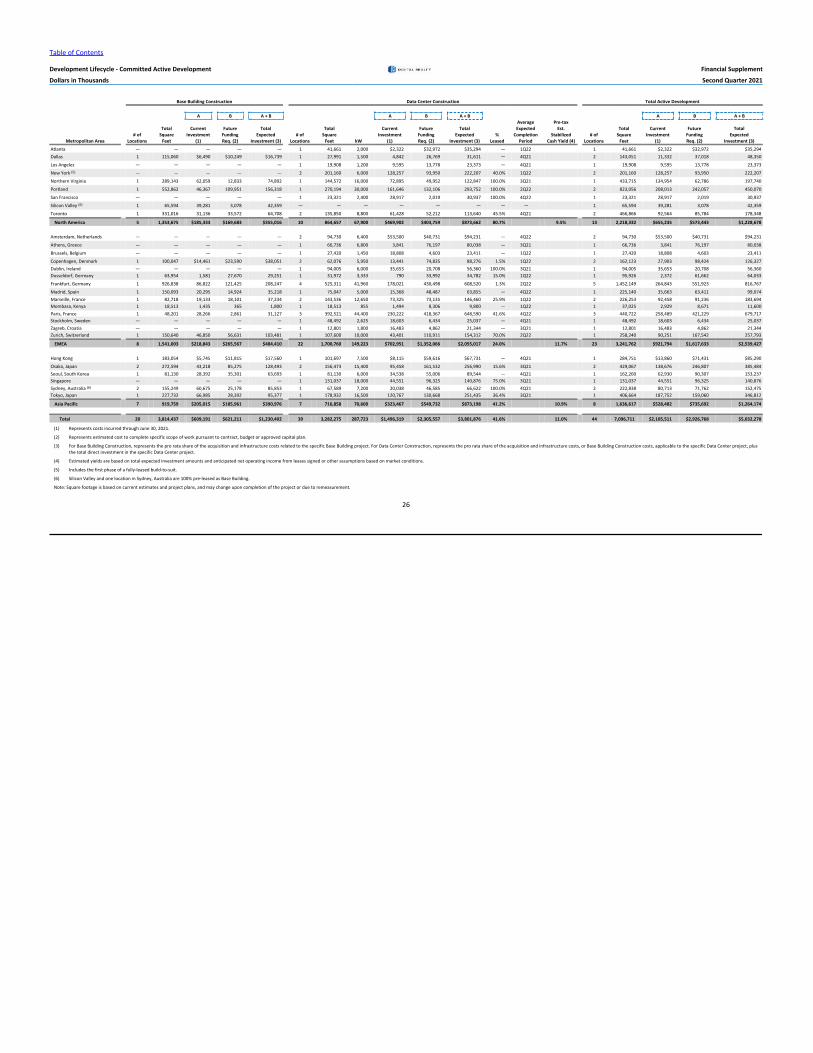
Table of Contents
Development Lifecycle - Committed Active Development Financial Supplement
Dollars in Thousands Second Quarter 2021
26
Base Building Construction Data Center Construction Total Active Development
A B A + B A B A + B A B A + BAverage Pre-tax
Total Current Future Total Total Current Future Total Expected Est. Total Current Future Total# of Square Investment Funding Expected # of Square Investment Funding Expected % Completion Stabilized # of Square Investment Funding Expected
Metropolitan Area Locations Feet (1) Req. (2) Investment (3) Locations Feet kW (1) Req. (2) Investment (3) Leased Period Cash Yield (4) Locations Feet (1) Req. (2) Investment (3)
Atlanta — — — — — 1 41,661 2,000 $2,322 $32,972 $35,294 — 1Q22 1 41,661 $2,322 $32,972 $35,294 Dallas 1 115,060 $6,490 $10,249 $16,739 1 27,991 1,500 4,842 26,769 31,611 — 4Q21 2 143,051 11,332 37,018 48,350
Los Angeles — — — — — 1 19,908 1,200 9,595 13,778 23,373 — 4Q21 1 19,908 9,595 13,778 23,373
New York (5) — — — — — 2 201,160 6,000 128,257 93,950 222,207 40.0% 1Q22 2 201,160 128,257 93,950 222,207
Northern Virginia 1 289,143 62,059 12,833 74,892 1 144,572 16,000 72,895 49,952 122,847 100.0% 3Q21 1 433,715 134,954 62,786 197,740
Portland 1 552,862 46,367 109,951 156,318 1 270,194 30,000 161,646 132,106 293,752 100.0% 2Q22 2 823,056 208,013 242,057 450,070
San Francisco — — — — — 1 23,321 2,400 28,917 2,019 30,937 100.0% 4Q22 1 23,321 28,917 2,019 30,937
Silicon Valley (6) 1 65,594 39,281 3,078 42,359 — — — — — — — — 1 65,594 39,281 3,078 42,359
Toronto 1 331,016 31,136 33,572 64,708 2 135,850 8,800 61,428 52,212 113,640 45.5% 4Q21 2 466,866 92,564 85,784 178,348
North America 5 1,353,675 $185,333 $169,683 $355,016 10 864,657 67,900 $469,902 $403,759 $873,662 80.7% 9.5% 13 2,218,332 $655,235 $573,443 $1,228,678
Amsterdam, Netherlands — — — — — 2 94,730 6,400 $53,500 $40,731 $94,231 — 4Q22 2 94,730 $53,500 $40,731 $94,231
Athens, Greece — — — — — 1 66,736 6,800 3,841 76,197 80,038 — 3Q21 1 66,736 3,841 76,197 80,038
Brussels, Belgium — — — — — 1 27,420 1,450 18,808 4,603 23,411 — 1Q22 1 27,420 18,808 4,603 23,411
Copenhagen, Denmark 1 100,047 $14,461 $23,590 $38,051 2 62,076 5,950 13,441 74,835 88,276 1.5% 1Q22 2 162,123 27,903 98,424 126,327 Dublin, Ireland — — — — — 1 94,005 6,000 35,653 20,708 56,360 100.0% 3Q21 1 94,005 35,653 20,708 56,360 Dusseldorf, Germany 1 63,954 1,581 27,670 29,251 1 31,972 3,333 790 33,992 34,782 15.0% 1Q22 1 95,926 2,372 61,662 64,033
Frankfurt, Germany 1 926,838 86,822 121,425 208,247 4 525,311 41,960 178,021 430,498 608,520 1.3% 2Q22 5 1,452,149 264,843 551,923 816,767
Madrid, Spain 1 150,093 20,295 14,924 35,218 1 75,047 5,000 15,368 48,487 63,855 — 4Q22 1 225,140 35,663 63,411 99,074 Marseille, France 1 82,718 19,133 18,101 37,234 2 143,536 12,650 73,325 73,135 146,460 25.9% 1Q22 2 226,253 92,458 91,236 183,694 Mombasa, Kenya 1 18,513 1,435 365 1,800 1 18,513 855 1,494 8,306 9,800 — 1Q22 1 37,025 2,929 8,671 11,600 Paris, France 1 48,201 28,266 2,861 31,127 3 392,521 44,400 230,222 418,367 648,590 41.6% 4Q22 3 440,722 258,489 421,229 679,717 Stockholm, Sweden — — — — — 1 48,492 2,625 18,603 6,434 25,037 — 4Q21 1 48,492 18,603 6,434 25,037 Zagreb, Croatia — — — — — 1 12,801 1,800 16,483 4,862 21,344 — 3Q21 1 12,801 16,483 4,862 21,344 Zurich, Switzerland 1 150,640 46,850 56,631 103,481 1 107,600 10,000 43,401 110,911 154,312 70.0% 2Q22 1 258,240 90,251 167,542 257,793
EMEA 8 1,541,003 $218,843 $265,567 $484,410 22 1,700,760 149,223 $702,951 $1,352,066 $2,055,017 24.0% 11.7% 23 3,241,762 $921,794 $1,617,633 $2,539,427
Hong Kong 1 183,054 $5,745 $11,815 $17,560 1 101,697 7,500 $8,115 $59,616 $67,731 — 4Q21 1 284,751 $13,860 $71,431 $85,290
Osaka, Japan 2 272,594 43,218 85,275 128,493 2 156,473 15,400 95,458 161,532 256,990 15.6% 3Q21 2 429,067 138,676 246,807 385,484 Seoul, South Korea 1 81,130 28,392 35,301 63,693 1 81,130 6,000 34,538 55,006 89,544 — 4Q21 1 162,260 62,930 90,307 153,237 Singapore — — — — — 1 131,037 18,000 44,551 96,325 140,876 75.0% 3Q21 1 131,037 44,551 96,325 140,876 Sydney, Australia (6) 2 155,249 60,675 25,178 85,853 1 67,589 7,200 20,038 46,585 66,622 100.0% 4Q21 2 222,838 80,713 71,762 152,475 Tokyo, Japan 1 227,732 66,985 28,392 95,377 1 178,932 16,500 120,767 130,668 251,435 36.4% 3Q21 1 406,664 187,752 159,060 346,812
Asia Pacific 7 919,759 $205,015 $185,961 $390,976 7 716,858 70,600 $323,467 $549,732 $873,198 41.2% 10.9% 8 1,636,617 $528,482 $735,692 $1,264,174
Total 20 3,814,437 $609,191 $621,211 $1,230,402 39 3,282,275 287,723 $1,496,319 $2,305,557 $3,801,876 41.6% 11.0% 44 7,096,711 $2,105,511 $2,926,768 $5,032,278
(1) Represents costs incurred through June 30, 2021.
(2) Represents estimated cost to complete specific scope of work pursuant to contract, budget or approved capital plan.
(3) For Base Building Construction, represents the pro rata share of the acquisition and infrastructure costs related to the specific Base Building project. For Data Center Construction, represents the pro rata share of the acquisition and infrastructure costs, or Base Building Construction costs, applicable to the specific Data Center project, plusthe total direct investment in the specific Data Center project.
(4) Estimated yields are based on total expected investment amounts and anticipated net operating income from leases signed or other assumptions based on market conditions.
(5) Includes the first phase of a fully-leased build-to-suit.
(6) Silicon Valley and one location in Sydney, Australia are 100% pre-leased as Base Building.
Note: Square footage is based on current estimates and project plans, and may change upon completion of the project or due to remeasurement.
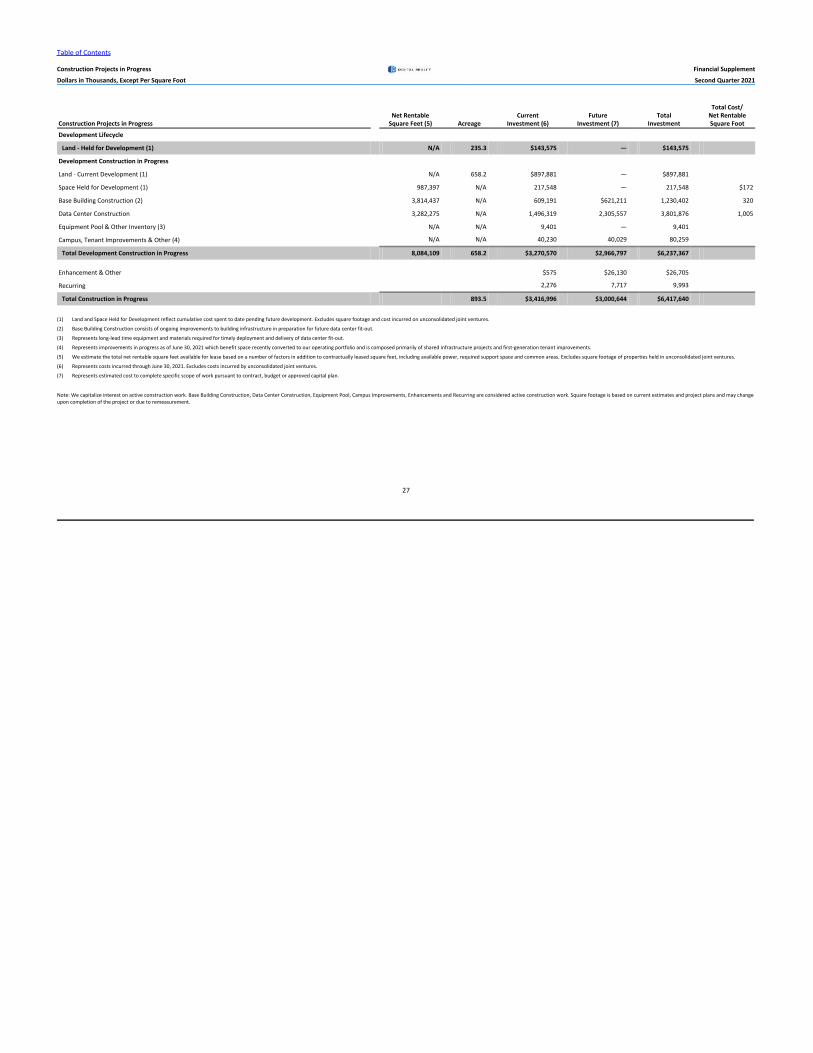
Table of Contents
Construction Projects in Progress Financial Supplement
Dollars in Thousands, Except Per Square Foot Second Quarter 2021
27
Total Cost/Net Rentable Current Future Total Net Rentable
Construction Projects in Progress Square Feet (5) Acreage Investment (6) Investment (7) Investment Square Foot
Development Lifecycle
Land - Held for Development (1) N/A 235.3 $143,575 — $143,575
Development Construction in Progress
Land - Current Development (1) N/A 658.2 $897,881 — $897,881
Space Held for Development (1) 987,397 N/A 217,548 — 217,548 $172
Base Building Construction (2) 3,814,437 N/A 609,191 $621,211 1,230,402 320
Data Center Construction 3,282,275 N/A 1,496,319 2,305,557 3,801,876 1,005
Equipment Pool & Other Inventory (3) N/A N/A 9,401 — 9,401
Campus, Tenant Improvements & Other (4) N/A N/A 40,230 40,029 80,259
Total Development Construction in Progress 8,084,109 658.2 $3,270,570 $2,966,797 $6,237,367
Enhancement & Other $575 $26,130 $26,705
Recurring 2,276 7,717 9,993
Total Construction in Progress 893.5 $3,416,996 $3,000,644 $6,417,640
(1) Land and Space Held for Development reflect cumulative cost spent to date pending future development. Excludes square footage and cost incurred on unconsolidated joint ventures.
(2) Base Building Construction consists of ongoing improvements to building infrastructure in preparation for future data center fit-out.
(3) Represents long-lead time equipment and materials required for timely deployment and delivery of data center fit-out.
(4) Represents improvements in progress as of June 30, 2021 which benefit space recently converted to our operating portfolio and is composed primarily of shared infrastructure projects and first-generation tenant improvements.
(5) We estimate the total net rentable square feet available for lease based on a number of factors in addition to contractually leased square feet, including available power, required support space and common areas. Excludes square footage of properties held in unconsolidated joint ventures.
(6) Represents costs incurred through June 30, 2021. Excludes costs incurred by unconsolidated joint ventures.
(7) Represents estimated cost to complete specific scope of work pursuant to contract, budget or approved capital plan.
Note: We capitalize interest on active construction work. Base Building Construction, Data Center Construction, Equipment Pool, Campus Improvements, Enhancements and Recurring are considered active construction work. Square footage is based on current estimates and project plans and may changeupon completion of the project or due to remeasurement.

Table of Contents
Historical Capital Expenditures and Investments in Real Estate Financial Supplement
Dollars in Thousands Second Quarter 2021
28
Three Months Ended Six Months Ended 30-Jun-21 31-Mar-21 31-Dec-20 30-Sep-20 30-Jun-20 30-Jun-21 30-Jun-20
Non-Recurring Capital Expenditures (1)
Development $505,942 $439,793 $576,008 $441,958 $413,443 $945,735 $733,536
Enhancements and Other Non-Recurring 102 58 853 49 94 160 122
Total Non-Recurring Capital Expenditures $506,044 $439,851 $576,861 $442,007 $413,537 $945,895 $733,658
Recurring Capital Expenditures (2) $39,231 $39,522 $83,571 $53,683 $38,796 $78,753 $73,473
Total Direct Capital Expenditures $545,275 $479,373 $660,432 $495,690 $452,333 $1,024,648 $807,131
Indirect Capital Expenditures
Capitalized Interest $11,558 $11,434 $11,836 $12,379 $13,133 $22,992 $23,075
Capitalized Overhead 16,090 17,716 15,003 14,024 12,124 33,806 24,679
Total Indirect Capital Expenditures $27,648 $29,150 $26,839 $26,403 $25,257 $56,798 $47,754
Total Improvements to and Advances for Investment in Real Estate $572,923 $508,523 $687,271 $522,093 $477,590 $1,081,446 $854,885
Consolidated Portfolio Net Rentable Square Feet (3) 31,753,051 31,356,257 31,855,032 31,410,022 30,225,412 31,753,051 30,225,412
(1) Non-recurring capital expenditures are primarily for development of space and land, excluding acquisition costs.(2) Recurring capital expenditures represent non-incremental building improvements required to maintain current revenues, including second-generation tenant improvements and external leasing commissions. Recurring capital expenditures do
not include acquisition costs contemplated when underwriting the purchase of a building, costs which are incurred to bring a building up to Digital Realty’s operating standards, or internal leasing commissions.(3) For some of our buildings, we calculate square footage based on factors in addition to contractually leased square feet, including available power, required support space and common areas.

Table of Contents
Development Lifecycle – Held for Development Financial Supplement
Dollars in Thousands Second Quarter 2021
29
Land Inventory (1) Space Held for Development
Land - Land - Total # of Held for Current # of Square Current
Metropolitan Area Locations Acres Development Development Locations Feet Investment (2)
Atlanta — — — — 1 313,581 $25,621 Boston — — — — 1 50,649 23,623 Chicago 1 1.4 $25,537 — 6 148,101 52,194 Dallas 3 116.3 33,072 — 2 28,094 3,133 Houston — — — — 1 13,969 2,726 New York 1 21.5 — $35,411 6 99,947 18,114 Northern Virginia 7 601.3 16,350 438,026 4 76,944 2,128 Phoenix 2 56.5 16,464 — — — — Silicon Valley 1 13.0 — 67,870 — — —
North America 15 809.9 $91,423 $541,307 21 731,285 $127,538
Amsterdam, Netherlands 1 4.4 — $22,259 2 95,262 $37,548 Brussels, Belgium 1 2.5 — 1,421 — — — Copenhagen, Denmark 2 7.6 $7,437 — — — — Dublin, Ireland 3 7.0 7,206 — — — — Frankfurt, Germany 1 12.0 — 116,190 — — — London, England 1 6.7 17,766 — 4 160,850 52,461 Madrid, Spain 1 1.8 19,744 — — — — Paris, France 2 8.4 — 52,472 — — — Vienna, Austria 1 5.6 — 19,566 — — —
EMEA 13 56.0 $52,152 $211,908 6 256,112 $90,009
Melbourne, Australia 1 4.1 — $4,275 — — — Seoul, South Korea 1 4.9 — 69,498 — — — Sydney, Australia 1 18.5 — 70,894 — — —
Asia Pacific 3 27.5 — $144,666 — — —
Consolidated Portfolio 31 893.5 $143,575 $897,881 27 987,397 $217,548
(1) Represents locations acquired to support ground-up development.(2) Represents costs incurred through June 30, 2021. Includes the cost of acquisition as well as cost of improvements since acquisition to prepare for future building construction.
Note: Square footage is based on current estimates and project plans and may change upon completion of the project or due to remeasurement.
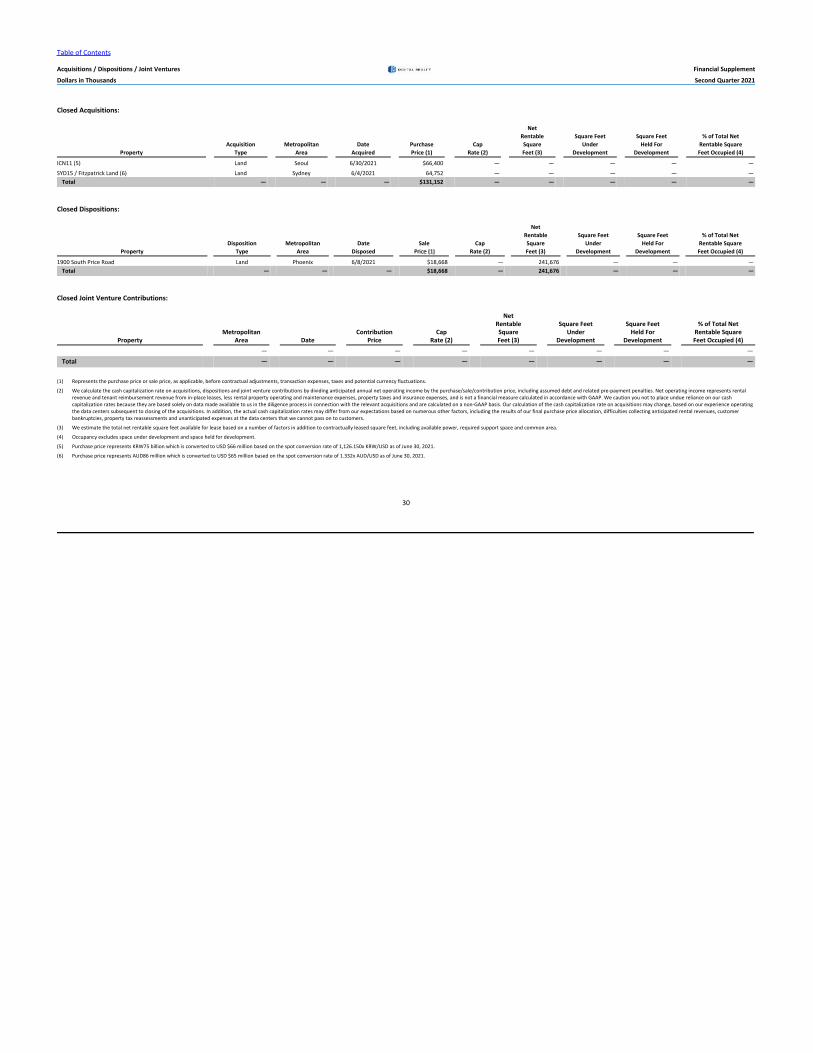
Table of Contents
Acquisitions / Dispositions / Joint Ventures Financial Supplement
Dollars in Thousands Second Quarter 2021
30
Closed Acquisitions:
Net Rentable Square Feet Square Feet % of Total Net
Acquisition Metropolitan Date Purchase Cap Square Under Held For Rentable SquareProperty Type Area Acquired Price (1) Rate (2) Feet (3) Development Development Feet Occupied (4)
ICN11 (5) Land Seoul 6/30/2021 $66,400 — — — — —
SYD15 / Fitzpatrick Land (6) Land Sydney 6/4/2021 64,752 — — — — —Total — — — $131,152 — — — — —
Closed Dispositions:
Net Rentable Square Feet Square Feet % of Total Net
Disposition Metropolitan Date Sale Cap Square Under Held For Rentable SquareProperty Type Area Disposed Price (1) Price (1) Rate (2) Feet (3) Development Development Feet Occupied (4)
1900 South Price Road Land Phoenix 6/8/2021 $18,668 — 241,676 — — —Total — — — $18,668 — 241,676 — — —
Closed Joint Venture Contributions:
Net Rentable Square Feet Square Feet % of Total Net
Metropolitan Contribution Cap Square Under Held For Rentable SquareProperty Area Date Price Rate (2) Feet (3) Development Development Feet Occupied (4)
— — — — — — — —Total — — — — — — — —
(1) Represents the purchase price or sale price, as applicable, before contractual adjustments, transaction expenses, taxes and potential currency fluctuations.
(2) We calculate the cash capitalization rate on acquisitions, dispositions and joint venture contributions by dividing anticipated annual net operating income by the purchase/sale/contribution price, including assumed debt and related pre-payment penalties. Net operating income represents rentalrevenue and tenant reimbursement revenue from in-place leases, less rental property operating and maintenance expenses, property taxes and insurance expenses, and is not a financial measure calculated in accordance with GAAP. We caution you not to place undue reliance on our cashcapitalization rates because they are based solely on data made available to us in the diligence process in connection with the relevant acquisitions and are calculated on a non-GAAP basis. Our calculation of the cash capitalization rate on acquisitions may change, based on our experience operatingthe data centers subsequent to closing of the acquisitions. In addition, the actual cash capitalization rates may differ from our expectations based on numerous other factors, including the results of our final purchase price allocation, difficulties collecting anticipated rental revenues, customerbankruptcies, property tax reassessments and unanticipated expenses at the data centers that we cannot pass on to customers.
(3) We estimate the total net rentable square feet available for lease based on a number of factors in addition to contractually leased square feet, including available power, required support space and common area.
(4) Occupancy excludes space under development and space held for development.
(5) Purchase price represents KRW75 billion which is converted to USD $66 million based on the spot conversion rate of 1,126.150x KRW/USD as of June 30, 2021.
(6) Purchase price represents AUD86 million which is converted to USD $65 million based on the spot conversion rate of 1.332x AUD/USD as of June 30, 2021.

Table of Contents
Unconsolidated Joint Ventures (“JVs”) Financial Supplement
Dollars in Thousands Second Quarter 2021
31
Summary Balance Sheet - As of June 30, 2021at the JV's 100% Share Ascenty Clise (1) Lumen (2) Mitsubishi Mapletree Prudential Colovore Other (3) Total
Undepreciated book value of operating real estate $823,647 $48,513 $185,326 $746,840 $774,422 $430,196 $28,418 $104,999 $3,142,361Accumulated depreciation & amortization (136,422) (5,590) (47,306) (60,952) (68,536) (75,577) (9,727) (1,961) (406,071)
Net Book Value of Operating Real Estate $687,226 $42,923 $138,020 $685,888 $705,886 $354,619 $18,691 $103,038 $2,736,291Cash 195,928 209 17,793 125,909 31,339 3,814 4,125 105 379,222Other assets 1,264,926 8,661 10,561 89,482 216,336 45,343 1,110 20 1,636,439
Total Assets $2,148,080 $51,793 $166,374 $901,279 $953,561 $403,776 $23,926 $103,163 $4,751,952
Debt 906,998 47,764 — 387,900 — 211,349 3,125 — 1,557,136Other liabilities 120,364 395 8,526 103,258 23,419 65,286 278 12,915 334,441Equity / (deficit) 1,120,718 3,634 157,848 410,121 930,142 127,141 20,523 90,248 2,860,375
Total Liabilities and Equity $2,148,080 $51,793 $166,374 $901,279 $953,561 $403,776 $23,926 $103,163 $4,751,952
Digital Realty's ownership percentage 49% (4) 50% 50% 50% 20% 20% 17% Various
Digital Realty's Pro Rata Share of Unconsolidated JV Debt $462,569 $23,882 — $193,950 — $42,270 $531 — $723,202
Summary Statement of Operations - Three Months Ended June 30, 2021
at the JV's 100% Share Ascenty Clise (1) Lumen (2) Mitsubishi Mapletree Prudential Colovore Other (3) Total
Total revenues $50,297 $2,595 $6,432 $39,528 $26,914 $10,824 $3,289 — $139,879Operating expenses (18,678) (814) (2,399) (19,393) (10,380) (2,293) (2,003) ($13) (55,973)
Net Operating Income (NOI) $31,619 $1,781 $4,033 $20,135 $16,534 $8,531 $1,286 ($13) $83,906
Straight-line rent — — 48 (460) (818) (34) — — (1,264)Above and below market rent — — — — 178 (822) — — (644)
Cash Net Operating Income (NOI) $31,619 $1,781 $4,081 $19,675 $15,894 $7,675 $1,286 ($13) $81,998
Interest expense ($21,670) ($523) — ($1,197) ($4) ($2,541) ($361) — ($26,296)Depreciation & amortization (21,858) (189) ($2,289) (8,673) (17,536) (3,279) (569) — (54,393)Other income / (expense) (2,416) — (250) (1,575) (1,299) (194) (95) ($1) (5,830)FX remeasurement on USD debt 104,993 — — — — — — — 104,993
Total Non-Operating Expenses $59,049 ($712) ($2,539) ($11,445) ($18,839) ($6,014) ($1,025) ($1) $18,474
Net Income / (Loss) $90,668 $1,069 $1,494 $8,690 ($2,305) $2,517 $261 ($14) $102,380
Digital Realty's ownership percentage 49% (4) 50% 50% 50% 20% 20% 17% Various
Digital Realty's Pro Rata Share of Unconsolidated JV NOI $16,126 $891 $2,017 $10,068 $3,307 $1,706 $219 ($5) $34,329
Digital Realty's Pro Rata Share of Unconsolidated JV Cash NOI $16,126 $891 $2,041 $9,838 $3,179 $1,535 $219 ($5) $33,824
Digital Realty's Earnings (loss) income from unconsolidated joint ventures $46,074 $535 747 $4,345 ($461) $864 $44 ($5) $52,143
Digital Realty's Pro Rata Share of core FFO (5) $3,675 $630 $1,892 $8,682 $3,046 $1,520 $141 ($5) $19,581
Digital Realty's Fee Income from Joint Ventures — — $225 $100 $1,012 $819 — — $2,156
(1) Formerly known as 2020 Fifth Avenue.(2) Formerly known as 33 Chun Choi Street.(3) Includes two joint ventures.(4) Equity in income pick-up comprised of 49% owned by Digital Realty and 2% owned by management, with a corresponding offset for the 2% in minority interest.(5) For a definition of Core FFO, see page33.
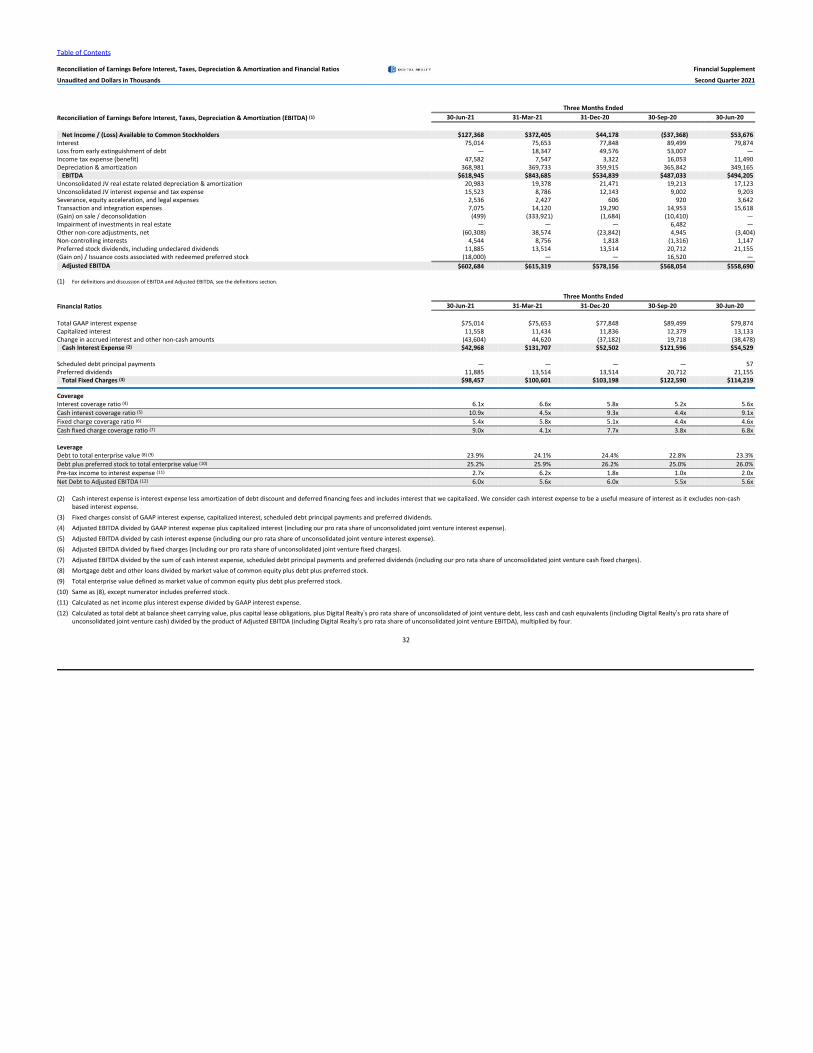
Table of Contents
Reconciliation of Earnings Before Interest, Taxes, Depreciation & Amortization and Financial Ratios Financial Supplement
Unaudited and Dollars in Thousands Second Quarter 2021
32
Three Months EndedReconciliation of Earnings Before Interest, Taxes, Depreciation & Amortization (EBITDA) (1) 30-Jun-21 31-Mar-21 31-Dec-20 30-Sep-20 30-Jun-20
Net Income / (Loss) Available to Common Stockholders $127,368 $372,405 $44,178 ($37,368) $53,676Interest 75,014 75,653 77,848 89,499 79,874Loss from early extinguishment of debt — 18,347 49,576 53,007 —Income tax expense (benefit) 47,582 7,547 3,322 16,053 11,490Depreciation & amortization 368,981 369,733 359,915 365,842 349,165
EBITDA $618,945 $843,685 $534,839 $487,033 $494,205Unconsolidated JV real estate related depreciation & amortization 20,983 19,378 21,471 19,213 17,123Unconsolidated JV interest expense and tax expense 15,523 8,786 12,143 9,002 9,203Severance, equity acceleration, and legal expenses 2,536 2,427 606 920 3,642Transaction and integration expenses 7,075 14,120 19,290 14,953 15,618(Gain) on sale / deconsolidation (499) (333,921) (1,684) (10,410) —Impairment of investments in real estate — — — 6,482 —Other non-core adjustments, net (60,308) 38,574 (23,842) 4,945 (3,404)Non-controlling interests 4,544 8,756 1,818 (1,316) 1,147Preferred stock dividends, including undeclared dividends 11,885 13,514 13,514 20,712 21,155(Gain on) / Issuance costs associated with redeemed preferred stock (18,000) — — 16,520 —
Adjusted EBITDA $602,684 $615,319 $578,156 $568,054 $558,690
(1) For definitions and discussion of EBITDA and Adjusted EBITDA, see the definitions section.
Three Months EndedFinancial Ratios 30-Jun-21 31-Mar-21 31-Dec-20 30-Sep-20 30-Jun-20
Total GAAP interest expense $75,014 $75,653 $77,848 $89,499 $79,874Capitalized interest 11,558 11,434 11,836 12,379 13,133Change in accrued interest and other non-cash amounts (43,604) 44,620 (37,182) 19,718 (38,478)
Cash Interest Expense (2) $42,968 $131,707 $52,502 $121,596 $54,529
Scheduled debt principal payments — — — — 57Preferred dividends 11,885 13,514 13,514 20,712 21,155
Total Fixed Charges (3) $98,457 $100,601 $103,198 $122,590 $114,219
CoverageInterest coverage ratio (4) 6.1x 6.6x 5.8x 5.2x 5.6xCash interest coverage ratio (5) 10.9x 4.5x 9.3x 4.4x 9.1xFixed charge coverage ratio (6) 5.4x 5.8x 5.1x 4.4x 4.6xCash fixed charge coverage ratio (7) 9.0x 4.1x 7.7x 3.8x 6.8x
LeverageDebt to total enterprise value (8) (9) 23.9% 24.1% 24.4% 22.8% 23.3%Debt plus preferred stock to total enterprise value (10) 25.2% 25.9% 26.2% 25.0% 26.0%Pre-tax income to interest expense (11) 2.7x 6.2x 1.8x 1.0x 2.0xNet Debt to Adjusted EBITDA (12) 6.0x 5.6x 6.0x 5.5x 5.6x
(2) Cash interest expense is interest expense less amortization of debt discount and deferred financing fees and includes interest that we capitalized. We consider cash interest expense to be a useful measure of interest as it excludes non-cashbased interest expense.
(3) Fixed charges consist of GAAP interest expense, capitalized interest, scheduled debt principal payments and preferred dividends.(4) Adjusted EBITDA divided by GAAP interest expense plus capitalized interest (including our pro rata share of unconsolidated joint venture interest expense).(5) Adjusted EBITDA divided by cash interest expense (including our pro rata share of unconsolidated joint venture interest expense). (6) Adjusted EBITDA divided by fixed charges (including our pro rata share of unconsolidated joint venture fixed charges).(7) Adjusted EBITDA divided by the sum of cash interest expense, scheduled debt principal payments and preferred dividends (including our pro rata share of unconsolidated joint venture cash fixed charges).(8) Mortgage debt and other loans divided by market value of common equity plus debt plus preferred stock.(9) Total enterprise value defined as market value of common equity plus debt plus preferred stock.(10) Same as (8), except numerator includes preferred stock.(11) Calculated as net income plus interest expense divided by GAAP interest expense.(12) Calculated as total debt at balance sheet carrying value, plus capital lease obligations, plus Digital Realty’s pro rata share of unconsolidated of joint venture debt, less cash and cash equivalents (including Digital Realty’s pro rata share of
unconsolidated joint venture cash) divided by the product of Adjusted EBITDA (including Digital Realty’s pro rata share of unconsolidated joint venture EBITDA), multiplied by four.
Table of Contents
Management Statements on Non-GAAP Measures Financial Supplement
Unaudited Second Quarter 2021
33
Definitions
Funds From Operations (FFO):We calculate funds from operations, or FFO, in accordance with the standards established by the National Association of Real Estate Investment Trusts, or Nareit, in the Nareit Funds From Operations White Paper - 2018Restatement. FFO represents net income (loss) (computed in accordance with GAAP), excluding gains (or losses) from real estate transactions, impairment of investment in real estate, real estate related depreciation andamortization (excluding amortization of deferred financing costs), unconsolidated JV real estate related depreciation & amortization, non-controlling interests in operating partnership and after adjustments for unconsolidatedpartnerships and joint ventures. Management uses FFO as a supplemental performance measure because, in excluding real estate related depreciation and amortization and gains and losses from property dispositions and afteradjustments for unconsolidated partnerships and joint ventures, it provides a performance measure that, when compared year over year, captures trends in occupancy rates, rental rates and operating costs. We also believe that,as a widely recognized measure of the performance of REITs, FFO will be used by investors as a basis to compare our operating performance with that of other REITs. However, because FFO excludes depreciation andamortization and captures neither the changes in the value of our data centers that result from use or market conditions, nor the level of capital expenditures and capitalized leasing commissions necessary to maintain theoperating performance of our data centers, all of which have real economic effect and could materially impact our financial condition and results from operations, the utility of FFO as a measure of our performance is limited.Other REITs may not calculate FFO in accordance with the NAREIT definition and, accordingly, our FFO may not be comparable to other REITs’ FFO. FFO should be considered only as a supplement to net income computed inaccordance with GAAP as a measure of our performance.
Core Funds from Operations (Core FFO):We present core funds from operations, or core FFO, as a supplemental operating measure because, in excluding certain items that do not reflect core revenue or expense streams, it provides a performance measure that, whencompared year over year, captures trends in our core business operating performance. We calculate core FFO by adding to or subtracting from FFO (i) termination fees and other non-core revenues, (ii) transaction and integrationexpenses, (iii) loss from early extinguishment of debt, (iv) gain on / issuance costs associated with redeemed preferred stock, (v) severance, equity acceleration, and legal expenses, (vi) gain/loss on FX revaluation, and (vii) othernon-core expense adjustments. Because certain of these adjustments have a real economic impact on our financial condition and results from operations, the utility of core FFO as a measure of our performance is limited. OtherREITs may calculate core FFO differently than we do and accordingly, our core FFO may not be comparable to other REITs’ core FFO. Core FFO should be considered only as a supplement to net income computed in accordancewith GAAP as a measure of our performance.
Adjusted Funds from Operations (AFFO):We present adjusted funds from operations, or AFFO, as a supplemental operating measure because, when compared year over year, it assesses our ability to fund dividend and distribution requirements from our operatingactivities. We also believe that, as a widely recognized measure of the operations of REITs, AFFO will be used by investors as a basis to assess our ability to fund dividend payments in comparison to other REITs, including on a pershare and unit basis. We calculate AFFO by adding to or subtracting from core FFO (i) non-real estate depreciation, (ii) amortization of deferred financing costs, (iii) amortization of debt discount/premium, (iv) non-cash stock-based compensation expense, (v) straight-line rental revenue, (vi) straight-line rental expense, (vii) above- and below-market rent amortization, (viii) deferred tax (expense) benefit, (ix) leasing compensation and internal leasecommissions, and (x) recurring capital expenditures. Other REITs may calculate AFFO differently than we do and, accordingly, our AFFO may not be comparable to other REITs’ AFFO. AFFO should be considered only as asupplement to net income computed in accordance with GAAP as a measure of our performance.
EBITDA and Adjusted EBITDA:We believe that earnings before interest, loss from early extinguishment of debt, income taxes, and depreciation and amortization, or EBITDA, and Adjusted EBITDA (as defined below), are useful supplemental performancemeasures because they allow investors to view our performance without the impact of non-cash depreciation and amortization or the cost of debt and, with respect to Adjusted EBITDA, unconsolidated joint venture real estaterelated depreciation & amortization, unconsolidated joint venture interest expense and tax, severance, equity acceleration, and legal expenses, transaction and integration expenses, gain on sale / deconsolidation, impairment ofinvestments in real estate, other non-core adjustments, net, non-controlling interests, preferred stock dividends, including undeclared dividends, and issuance costs associated with redeemed preferred stock. Adjusted EBITDA isEBITDA excluding unconsolidated joint venture real estate related depreciation & amortization, unconsolidated joint venture interest expense and tax, severance, equity acceleration, and legal expenses, transaction andintegration expenses, gain on sale / deconsolidation, impairment of investments in real estate, other non-core adjustments, net, non-controlling interests, preferred stock dividends, including undeclared dividends, and gain on /issuance costs associated with redeemed preferred stock. In addition, we believe EBITDA and Adjusted EBITDA are frequently used by securities analysts, investors and other interested parties in the evaluation of REITs. BecauseEBITDA and Adjusted EBITDA are calculated before recurring cash charges including interest expense and income taxes, exclude capitalized costs, such as leasing commissions, and are not adjusted for capital expenditures orother recurring cash requirements of our business, their utility as a measure of our performance is limited. Other REITs may calculate EBITDA and Adjusted EBITDA differently than we do and, accordingly, our EBITDA and AdjustedEBITDA may not be comparable to other REITs’ EBITDA and Adjusted EBITDA. Accordingly, EBITDA and Adjusted EBITDA should be considered only as supplements to net income computed in accordance with GAAP as a measureof our financial performance.

Table of Contents
Management Statements on Non-GAAP Measures Financial Supplement
Unaudited Second Quarter 2021
34
Net Operating Income (NOI) and Cash NOI:Net operating income, or NOI, represents rental revenue, tenant reimbursement revenue and interconnection revenue less utilities expense, rental property operating expenses, property taxes and insurance expenses (asreflected in the statement of operations). NOI is commonly used by stockholders, company management and industry analysts as a measurement of operating performance of the company’s rental portfolio. Cash NOI is NOI lessstraight-line rents and above- and below-market rent amortization. Cash NOI is commonly used by stockholders, company management and industry analysts as a measure of property operating performance on a cash basis.However, because NOI and cash NOI exclude depreciation and amortization and capture neither the changes in the value of our data centers that result from use or market conditions, nor the level of capital expenditures andcapitalized leasing commissions necessary to maintain the operating performance of our data centers, all of which have real economic effect and could materially impact our results from operations, the utility of NOI and cash NOIas measures of our performance is limited. Other REITs may calculate NOI and cash NOI differently than we do and, accordingly, our NOI and cash NOI may not be comparable to other REITs’ NOI and cash NOI. NOI and cash NOIshould be considered only as supplements to net income computed in accordance with GAAP as measures of our performance.
Additional Definitions
Net debt-to-Adjusted EBITDA ratio is calculated using total debt at balance sheet carrying value, plus capital lease obligations, plus our share of JV debt, less unrestricted cash and cash equivalents (including JV share of cash)divided by the product of Adjusted EBITDA (inclusive of our share of JV EBITDA) multiplied by four.
Debt-plus-preferred-to-total enterprise value is mortgage debt and other loans plus preferred stock divided by mortgage debt and other loans plus the liquidation value of preferred stock and the market value of outstandingDigital Realty Trust, Inc. common stock and Digital Realty Trust, L.P. units, assuming the redemption of Digital Realty Trust, L.P. units for shares of Digital Realty Trust, Inc. common stock.
Fixed charge coverage ratio is Adjusted EBITDA divided by the sum of GAAP interest expense, capitalized interest, scheduled debt principal payments and preferred dividends. For the quarter ended June 30, 2021, GAAP interestexpense was $75 million, capitalized interest was $12 million and scheduled debt principal payments and preferred dividends was $12 million.
Reconciliation of Net Operating Income (NOI) Three Months Ended Six Months Ended(in thousands) 30-Jun-21 31-Mar-21 30-Jun-20 30-Jun-21 30-Jun-20
Operating income $185,627 $192,518 $152,811 $378,144 $252,861
Fee income (3,628) (2,426) (4,353) (6,054) (6,805)
Other income (165) (59) (967) (224) (1,780)
Depreciation and amortization 368,981 369,733 349,165 738,714 640,622
General and administrative 94,956 97,568 90,649 192,524 152,915
Severance, equity acceleration, and legal expenses 2,536 2,427 3,642 4,963 4,914
Transaction expenses 7,075 14,120 15,618 21,195 72,419
Other expenses 2,298 (257) 22 2,041 136
Net Operating Income $657,680 $673,624 $606,587 $1,331,303 $1,115,282
Cash Net Operating Income (Cash NOI)
Net Operating Income $657,680 $673,624 $606,587 $1,331,303 $1,115,282
Straight-line rental revenue (17,127) (18,607) (10,713) (35,734) (24,105)
Straight-line rental expense 7,069 6,750 7,296 13,819 8,791
Above- and below-market rent amortization 1,858 2,137 3,794 3,994 7,087
Cash Net Operating Income $649,480 $663,904 $606,964 $1,313,382 $1,107,055
Table of Contents
Forward-Looking Statements Financial Supplement
Second Quarter 2021
35
This document contains forward-looking statements within the meaning of the federal securities laws, which are based on current expectations, forecasts and assumptions that involve risks and uncertainties that could cause actual outcomes and results to differ materially.Such forward-looking statements include statements relating to: our economic outlook, our expected investment and expansion activity, our redemptions, the COVID-19 pandemic, our liquidity, our joint ventures, supply and demand for data center and colocation space, ouracquisition and disposition activity, pricing and net effective leasing economics, market dynamics and data center fundamentals, our strategic priorities, our product offerings, available inventory rent from leases that have been signed but have not yet commenced and othercontracted rent to be received in future periods, rental rates on future leases, lag between signing and commencement, cap rates and yields, investment activity, the company’s FFO, core FFO and net income, 2021 outlook and underlying assumptions, information related totrends, our strategy and plans, leasing expectations, weighted average lease terms, the exercise of lease extensions, lease expirations, debt maturities, annualized rent at expiration of leases, the effect new leases and increases in rental rates will have on our rental revenue,our credit ratings, construction and development activity and plans, projected construction costs, estimated yields on investment, expected occupancy, expected square footage and IT load capacity upon completion of development projects, 2021 backlog NOI, NAVcomponents, and other forward-looking financial data. Such statements are based on management’s beliefs and assumptions made based on information currently available to management. Such statements are subject to risks, uncertainties and assumptions and are notguarantees of future performance and may be affected by known and unknown risks, trends, uncertainties and factors that are beyond our control. Should one or more of these risks or uncertainties materialize, or should underlying assumptions prove incorrect, actualresults may vary materially from those anticipated, estimated or projected. Some of the risks and uncertainties that may cause our actual results, performance or achievements to differ materially from those expressed or implied by forward-looking statements include,among others, the following:
● reduced demand for data centers or decreases in information technology spending;
● increased competition or available supply of data center space;
● decreased rental rates, increased operating costs or increased vacancy rates;
● the suitability of our data centers and data center infrastructure, delays or disruptions in connectivity or availability of power, or failures or breaches of our physical and information security infrastructure or services;
● our dependence upon significant customers, bankruptcy or insolvency of a major customer or a significant number of smaller customers, or defaults on or non-renewal of leases by customers;
● our ability to attract and retain customers;
● breaches of our obligations or restrictions under our contracts with our customers;
● our inability to successfully develop and lease new properties and development space, and delays or unexpected costs in development of properties;
● the impact of current global and local economic, credit and market conditions;
● our inability to retain data center space that we lease or sublease from third parties;
● global supply chain or procurement disruptions, or increased supply chain costs;
● information security and data privacy breaches;
● difficulty managing an international business and acquiring or operating properties in foreign jurisdictions and unfamiliar metropolitan areas;
● our failure to realize the intended benefits from, or disruptions to our plans and operations or unknown or contingent liabilities related to, our recent acquisitions;
● our failure to successfully integrate and operate acquired or developed properties or businesses;
● difficulties in identifying properties to acquire and completing acquisitions;
● risks related to joint venture investments, including as a result of our lack of control of such investments;
● risks associated with using debt to fund our business activities, including re-financing and interest rate risks, our failure to repay debt when due, adverse changes in our credit ratings or our breach of covenants or other terms contained in our loan facilities andagreements;
● our failure to obtain necessary debt and equity financing, and our dependence on external sources of capital;
● financial market fluctuations and changes in foreign currency exchange rates;
● adverse economic or real estate developments in our industry or the industry sectors that we sell to, including risks relating to decreasing real estate valuations and impairment charges and goodwill and other intangible asset impairment charges;
● our inability to manage our growth effectively;
● losses in excess of our insurance coverage;
● our inability to attract and retain talent;
● impact on our operations and on the operations of our customers, suppliers and business partners during a pandemic, such as COVID-19;
● environmental liabilities, risks related to natural disasters and our inability to achieve our sustainability goals;
● our inability to comply with rulesand regulations applicable to our company;
● Digital Realty Trust,Inc.’s failure to maintain its status as a REIT for federal income tax purposes;
● Digital Realty Trust,L.P.’s failure to qualify as a partnership for federal income tax purposes;
● restrictions on our ability to engage in certain business activities;
● changes in local, state, federal and international laws and regulations, including related to taxation, real estate and zoning laws, and increases in real property tax rates; and
● the impact of any financial, accounting, legal or regulatory issues or litigation that may affect us.
The risks included here are not exhaustive, and additional factors could adversely affect our business and financial performance. Several additional material risks are discussed in our annual report on Form 10-K for the year ended December 31, 2020 and other filings with the U.S. Securities and Exchange Commission. Those risks continue to be relevant to our performance and financial condition. Moreover, we operate in a very competitive and rapidly changing environment. New risk factors emerge from time to time and it is not possible for management to predict all such risk factors, nor can it assess the impact of all such risk factors on the business or the extent to which any factor, or combination of factors, may cause actual results to differ materially from those contained in any forward-looking statements. We expressly disclaim any responsibility to update forward-looking statements, whether as a result of new information, future events or otherwise. Digital Realty, Digital Realty Trust, the Digital Realty logo, Turn-Key Flex, Powered Base Building, and PlatformDIGITAL, Data Gravity Index and Data Gravity Index DGx are registered trademarks and service marks of Digital Realty Trust, Inc. in the United States and/or other countries. All other names, trademarks and service marks are the property of their respective owners.

Exhibit 99.2
DigitalRealtythetrustedfoundation|poweringyourdigitalambitionsGlobal.Connected.Sustainable.2Q21FINANCIALRESULTSJULY2021

|2NavigatingtheFutureSustainableGrowthforCustomers,ShareholdersandEmployeesGLOBALCONNECTEDSUSTAINABLESellingGLOBALLY…SupportingLOCALLYEMEAAPACAMERICASADigitalRealtyandBrookfieldInfrastructureJVDIGITALREALTY|2Q21FINANCIALRESULTS|JULY29,2021

|3ServingaSocialPurposeDeliveringSustainableGrowthforAllStakeholdersAwarded2021GreenLeaseLeaderforthirdconsecutiveyearENVIRONMENTALLeddisasterrecoveryassistanceandcommunityreinvestmentprograms:committedtoenhancingthewell‐beingofshareholders,customers,employees,vendorsandcommunitiesDemonstratedseniorleadershipandemployeecommitmenttoDiversity,Equity&Inclusion;signedCEOActionPledgefordiversity;co‐chairNareit’sdiversityinitiativeAdoptedtheRooneyRuleandamendedcorporategovernanceguidelinestoclarifythatdirectorcandidatepoolsmustincludecandidateswithdiversityofrace,ethnicityandgenderSOCIALInstitutedminimumstockownershiprequirementsfordirectorsandmanagementEstablishedproxyaccessforshareholdersandprovidedshareholderstheabilitytoproposeamendmentstothebylawsEnhancedBoarddiversitywiththeadditionofthreenewDirectors201520192018GOVERNANCE2021FormalizedESGoversightundertheNominating&CorporateGovernanceCommitteePublishedthirdannualESGreportinJune2021PublishedEEO‐1report,providingtransparencyontheracialandgendercompositionoftheU.S.workforceCommittedtoreducingdirectemissionsby68%andindirectemissionsby24%by2030Named2021EPAENERGYSTAR®PartneroftheYearforsecondconsecutiveyear2020DIGITALREALTY|2Q21FINANCIALRESULTS|JULY29,2021

|4Note:AsofJune30,2021.GlobalPlatformExpandingGlobalPlatformSupportingCustomerGrowth4,000+Customers170,000+Cross‐Connects47MetroAreasDIGITALREALTY|2Q21FINANCIALRESULTS|JULY29,2021SingaporeSeoulMarseilleMumbaiToronto
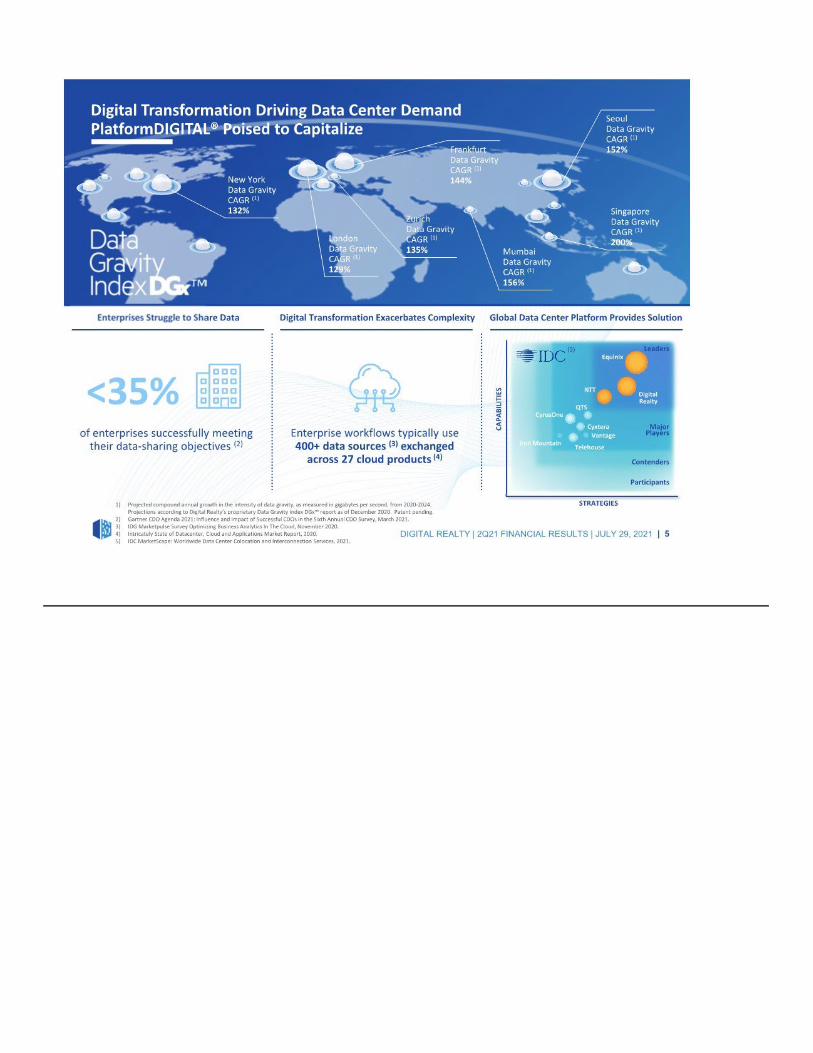
Enterpriseworkflowstypicallyuse400+datasources(3)exchangedacross27cloudproducts(4)|5EnterprisesStruggletoShareDataDigitalTransformationExacerbatesComplexityGlobalDataCenterPlatformProvidesSolutionDIGITALREALTY|2Q21FINANCIALRESULTS|JULY29,2021LeadersMajorPlayersContendersParticipantsEquinixDigitalRealtyNTTCyxteraTelehouseIronMountainQTSVantageCyrusOneSTRATEGIESCAPABILITIES(5)<35%ofenterprisessuccessfullymeetingtheirdata‐sharingobjectives(2)1)Projectedcompoundannualgrowthintheintensityofdatagravity,asmeasuredingigabytespersecond,from2020‐2024.ProjectionsaccordingtoDigitalRealty’sproprietaryDataGravityIndexDGx™reportasofDecember2020.Patentpending.2)GartnerCDOAgenda2021:InfluenceandImpactofSuccessfulCDOsintheSixthAnnualCDOSurvey,March2021.3)IDGMarketpulseSurveyOptimizingBusinessAnalyticsInTheCloud,November2020.4)IntricatelyStateofDatacenter,CloudandApplicationsMarketReport,2020.5)IDCMarketScape:WorldwideDataCenterColocationandInterconnectionServices,2021.DigitalTransformationDrivingDataCenterDemandPlatformDIGITAL®PoisedtoCapitalizeNewYorkDataGravityCAGR(1)132%LondonDataGravityCAGR(1)129%ZurichDataGravityCAGR(1)135%™FrankfurtDataGravityCAGR(1)144%SeoulDataGravityCAGR(1)152%MumbaiDataGravityCAGR(1)156%SingaporeDataGravityCAGR(1)200%

FinancialResults|6DIGITALREALTY|2Q21FINANCIALRESULTS|JULY29,2021

DigitalTransformationDrivingSteadyDemandGlobalFull‐ProductSpectrumProvidesBroadestSolutionsNote:Darkershadingrepresentsinterconnectionbookings.Second‐quarterbookingsarehighlightedinlighterblue.Totalsmaynotaddupduetorounding.1)OtherincludesPoweredBaseBuilding®shellcapacityaswellasstorageandofficespacewithinfullyimproveddatacenterfacilities.2Q21BOOKINGS0‐1MW$41.2mm>1MW$59.0mmOTHER(1)$0.6mmINTERCONNECTION$12.6mmTOTALBOOKINGS$113.4mmHISTORICALBOOKINGSANNUALIZEDGAAPBASERENT$inmillions20112012201320142015201620172018201920202021|7DIGITALREALTY|2Q21FINANCIALRESULTS|JULY29,2021$0$50$100$150

47%oftotalbookingsfrom0‐1MW+interconnection44%oftotalbookingsoutsidetheAmericasConnectedDataCommunitiesAttractingNewLogos|8109newlogosComputerTechnologyCloud&MediaProviderCustomerDataPlatformDigitalHealthcare&BiotechFinancialServicesEuropeanBroadcasterNote:ForquarterendedJune30,2021.DIGITALREALTY|2Q21FINANCIALRESULTS|JULY29,2021

$197M$82M$283M$14M$6M$8M$24M2021202220231Q21BacklogTop‐LineStepFunctionHealthyBacklogSetsaSolidFoundation|9Note:Totalsmaynotaddupduetorounding.1)AmountsshownrepresentGAAPannualizedbaserentfromleasessigned.2)AmountsshownrepresentGAAPannualizedbaserentfromleasessigned,butnotyetcommenced,basedonestimatedfuturecommencementdateattimeofsigning.Actualcommencementdatesmayvary.DigitalRealtyBacklogUnconsolidatedJointVentureBacklogDigitalRealtyBacklogUnconsolidatedJointVentureBacklogBACKLOGROLL‐FORWARD(1)$inmillionsCOMMENCEMENTTIMING(2)$inmillions$147M$114M$269M$14M$18M$8M$34M202120222023+2Q21Backlog$2MDIGITALREALTY|2Q21FINANCIALRESULTS|JULY29,2021$283M$89M$102M$269M$24M$11M$2M$34M1Q21BacklogSignedCommenced2Q21Backlog
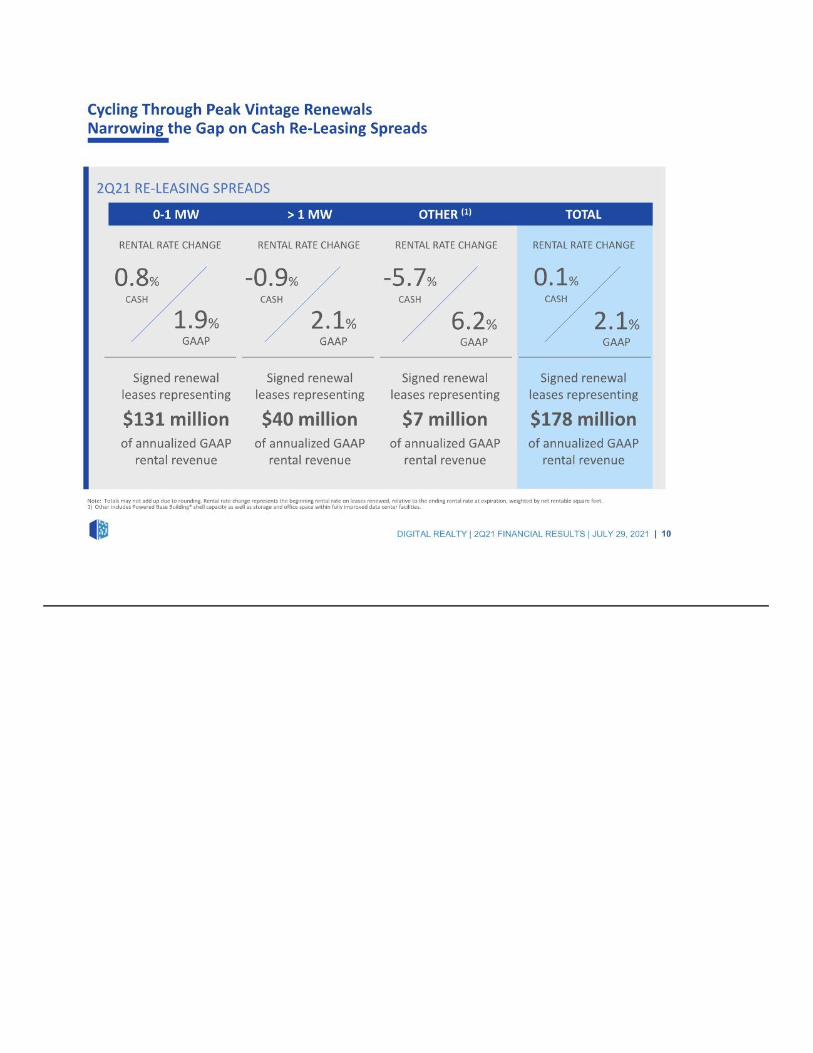
CyclingThroughPeakVintageRenewalsNarrowingtheGaponCashRe‐LeasingSpreads|100‐1MW>1MWOTHER(1)TOTALSignedrenewalleasesrepresenting$131millionofannualizedGAAPrentalrevenueSignedrenewalleasesrepresenting$40millionofannualizedGAAPrentalrevenueSignedrenewalleasesrepresenting$7millionofannualizedGAAPrentalrevenueSignedrenewalleasesrepresenting$178millionofannualizedGAAPrentalrevenueRENTALRATECHANGE0.8%CASH1.9%GAAPRENTALRATECHANGE‐0.9%CASH2.1%GAAPRENTALRATECHANGE‐5.7%CASH6.2%GAAPRENTALRATECHANGE0.1%CASH2.1%GAAP2Q21RE‐LEASINGSPREADSNote:Totalsmaynotaddupduetorounding.Rentalratechangerepresentsthebeginningrentalrateonleasesrenewed,relativetotheendingrentalrateatexpiration,weightedbynetrentablesquarefeet.1)OtherincludesPoweredBaseBuilding®shellcapacityaswellasstorageandofficespacewithinfullyimproveddatacenterfacilities.DIGITALREALTY|2Q21FINANCIALRESULTS|JULY29,2021
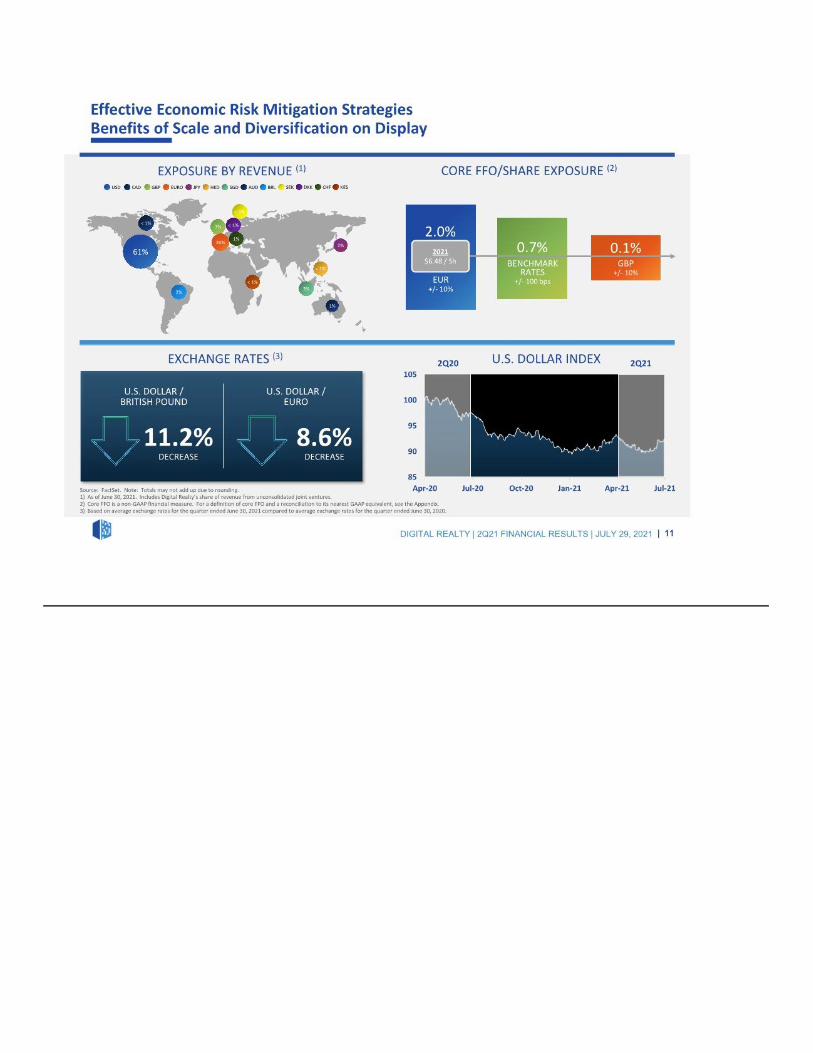
EffectiveEconomicRiskMitigationStrategiesBenefitsofScaleandDiversificationonDisplaySource:FactSet.Note:Totalsmaynotaddupduetorounding.1)AsofJune30,2021.IncludesDigitalRealty’sshareofrevenuefromunconsolidatedjointventures.2)CoreFFOisanon‐GAAPfinancialmeasure.ForadefinitionofcoreFFOandareconciliationtoitsnearestGAAPequivalent,seetheAppendix.3)BasedonaverageexchangeratesforthequarterendedJune30,2021comparedtoaverageexchangeratesforthequarterendedJune30,2020.11.2%DECREASE8.6%DECREASEU.S.DOLLARINDEX2Q202Q21EXPOSUREBYREVENUE(1)USDCADGBPEUROJPYHKDSGDAUDCOREFFO/SHAREEXPOSURE(2)EXCHANGERATES(3)U.S.DOLLAR/BRITISHPOUNDU.S.DOLLAR/EURO|11BRLSEKDKKCHFKES2021$6.48/Sh0.7%BENCHMARKRATES+/‐100bps0.1%GBP+/‐10%61%<1%7%20%<1%3%2%1%2%<1%<1%1%<1%DIGITALREALTY|2Q21FINANCIALRESULTS|JULY29,2021859095100105Apr‐20Jul‐20Oct‐20Jan‐21Apr‐21Jul‐212.0%EUR+/‐10%

Four‐QuarterTwo‐StepBuildingMomentumNote:Basedonmanagementestimates;actualperformancemaydiffermaterially.CoreFFOandNOIarenon‐GAAPfinancialmeasures.FordescriptionsandreconciliationstotheclosestGAAPequivalents,seetheAppendix.2021ECOREFFOPERSHARE|121Q212Q21DeferredTaxNOIGrowthNormalized3Q214Q21OpExDIGITALREALTY|2Q21FINANCIALRESULTS|JULY29,2021Impact
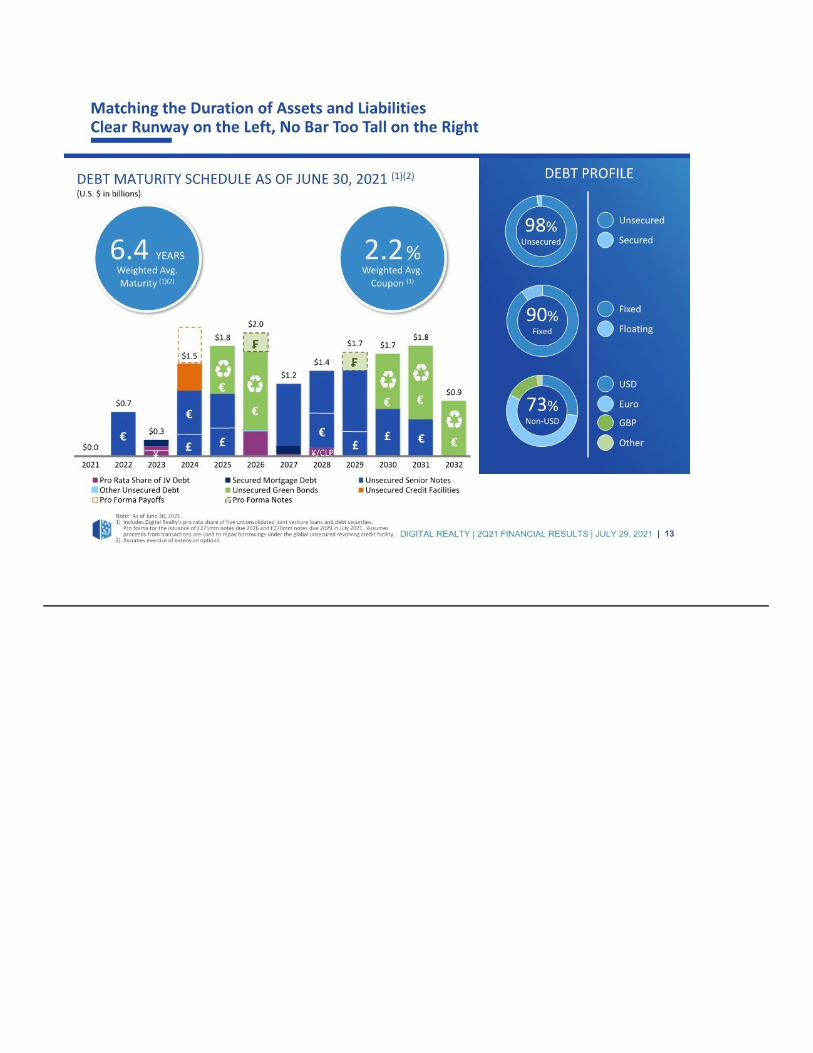
DEBTMATURITYSCHEDULEASOFJUNE30,2021(1)(2)(U.S.$inbillions)MatchingtheDurationofAssetsandLiabilitiesClearRunwayontheLeft,NoBarTooTallontheRight98%UnsecuredUnsecuredSecuredFixedFloatingUSDEuroGBPOther90%Fixed73%Non‐USD6.4YEARSWeightedAvg.Maturity(1)(2)2.2%WeightedAvg.Coupon(1)DEBTPROFILE|13Note:AsofJune30,2021.1)IncludesDigitalRealty’sproratashareoffiveunconsolidatedjointventureloansanddebtsecurities.Proformafortheissuanceof₣275mmnotesdue2026and₣270mmnotesdue2029inJuly2021.Assumesproceedsfromtransactionsareusedtorepayborrowingsundertheglobalunsecuredrevolvingcreditfacility.2)Assumesexerciseofextensionoptions.DIGITALREALTY|2Q21FINANCIALRESULTS|JULY29,2021$0.0$0.7$0.3$1.5$1.8$2.0$1.2$1.4$1.7$1.7$1.8$0.9202120222023202420252026202720282029203020312032ProRataShareofJVDebtSecuredMortgageDebtUnsecuredSeniorNotesOtherUnsecuredDebtUnsecuredGreenBondsUnsecuredCreditFacilitiesProFormaPayoffsProFormaNotes£££€€£₣₣€€€¥€€€€¥/CLP
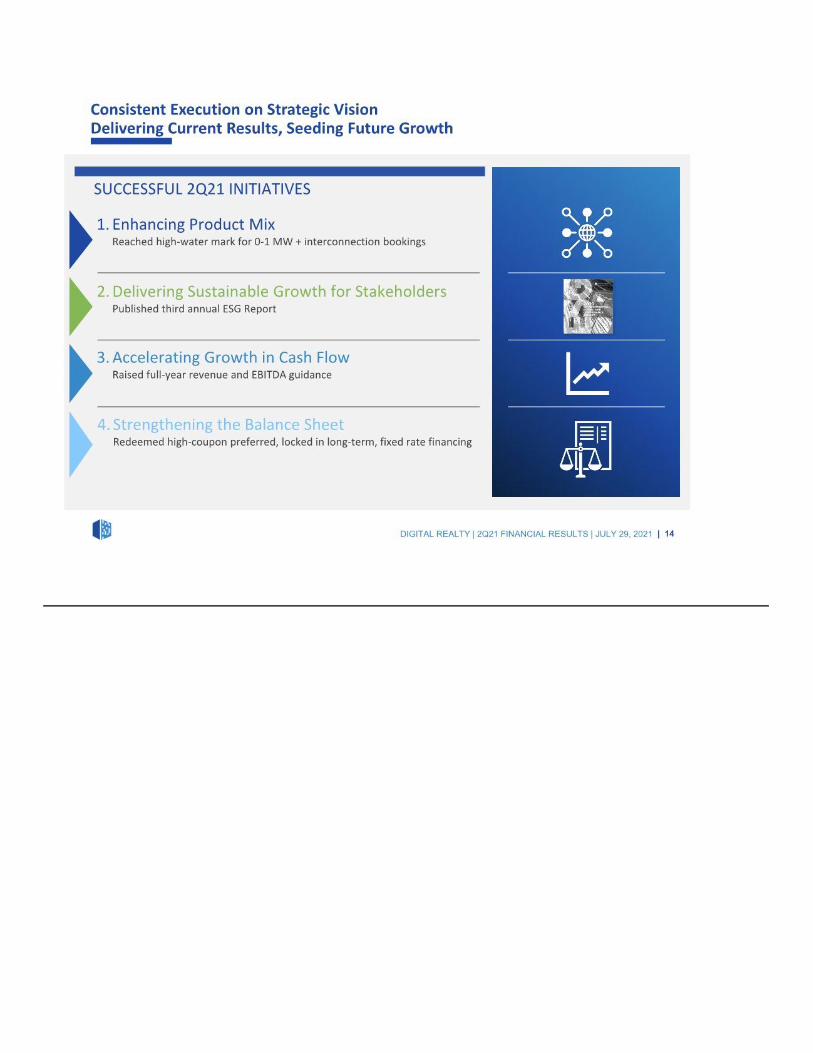
ConsistentExecutiononStrategicVisionDeliveringCurrentResults,SeedingFutureGrowth|14SUCCESSFUL2Q21INITIATIVES1.EnhancingProductMixReachedhigh‐watermarkfor0‐1MW+interconnectionbookings2.DeliveringSustainableGrowthforStakeholdersPublishedthirdannualESGReport3.AcceleratingGrowthinCashFlowRaisedfull‐yearrevenueandEBITDAguidance4.StrengtheningtheBalanceSheetRedeemedhigh‐couponpreferred,lockedinlong‐term,fixedratefinancingDIGITALREALTY|2Q21FINANCIALRESULTS|JULY29,2021

Appendix|15DIGITALREALTY|2Q21FINANCIALRESULTS|JULY29,2021
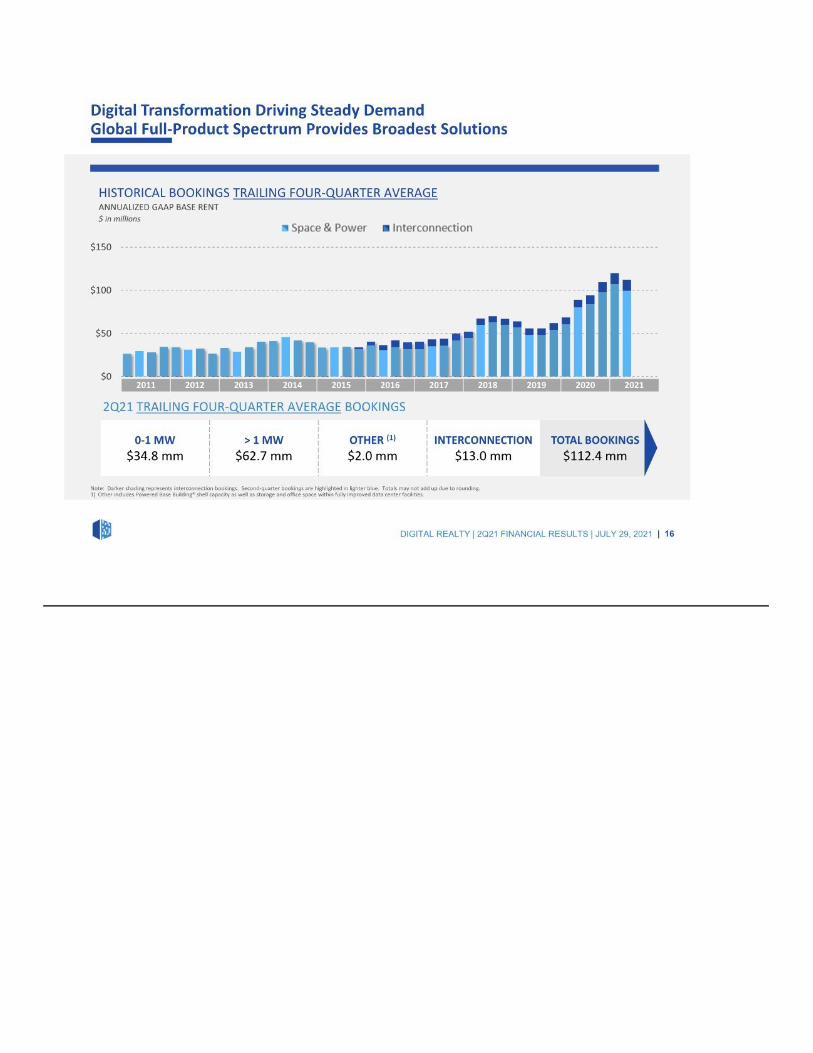
DigitalTransformationDrivingSteadyDemandGlobalFull‐ProductSpectrumProvidesBroadestSolutionsHISTORICALBOOKINGSTRAILINGFOUR‐QUARTERAVERAGEANNUALIZEDGAAPBASERENT$inmillions2Q21TRAILINGFOUR‐QUARTERAVERAGEBOOKINGS0‐1MW$34.8mm>1MW$62.7mmOTHER(1)$2.0mmINTERCONNECTION$13.0mmTOTALBOOKINGS$112.4mm20112012201320142015201620172018201920202021|16Note:Darkershadingrepresentsinterconnectionbookings.Second‐quarterbookingsarehighlightedinlighterblue.Totalsmaynotaddupduetorounding.1)OtherincludesPoweredBaseBuilding®shellcapacityaswellasstorageandofficespacewithinfullyimproveddatacenterfacilities.DIGITALREALTY|2Q21FINANCIALRESULTS|JULY29,2021$0$50$100$150
AppendixManagementStatementsonNon‐GAAPMeasures|17Theinformationincludedinthispresentationcontainscertainnon‐GAAPfinancialmeasuresthatmanagementbelievesarehelpfulinunderstandingourbusiness,asfurtherdescribedbelow.Ourdefinitionandcalculationofnon‐GAAPfinancialmeasuresmaydifferfromthoseofotherREITs,and,therefore,maynotbecomparable.Thenon‐GAAPfinancialmeasuresshouldnotbeconsideredalternativestonetincomeoranyotherGAAPmeasurementofperformanceandshouldnotbeconsideredanalternativetocashflowsfromoperating,investingorfinancingactivitiesasameasureofliquidity.FundsFromOperations(FFO):Wecalculatefundsfromoperations,orFFO,inaccordancewiththestandardsestablishedbytheNationalAssociationofRealEstateInvestmentTrusts,orNAREIT,intheNAREITFundsFromOperationsWhitePaper‐2018Restatement.FFOrepresentsnetincome(loss)(computedinaccordancewithGAAP),excludinggains(orlosses)fromrealestatetransactions,impairmentofinvestmentinrealestate,realestaterelateddepreciationandamortization(excludingamortizationofdeferredfinancingcosts),unconsolidatedJVrealestaterelateddepreciation&amortization,non‐controllinginterestsinoperatingpartnershipandafteradjustmentsforunconsolidatedpartnershipsandjointventures.ManagementusesFFOasasupplementalperformancemeasurebecause,inexcludingrealestaterelateddepreciationandamortizationandgainsandlossesfrompropertydispositionsandafteradjustmentsforunconsolidatedpartnershipsandjointventures,itprovidesaperformancemeasurethat,whencomparedyearoveryear,capturestrendsinoccupancyrates,rentalratesandoperatingcosts.Wealsobelievethat,asawidelyrecognizedmeasureoftheperformanceofREITs,FFOwillbeusedbyinvestorsasabasistocompareouroperatingperformancewiththatofotherREITs.However,becauseFFOexcludesdepreciationandamortizationandcapturesneitherthechangesinthevalueofourdatacentersthatresultfromuseormarketconditions,northelevelofcapitalexpendituresandcapitalizedleasingcommissionsnecessarytomaintaintheoperatingperformanceofourdatacenters,allofwhichhaverealeconomiceffectandcouldmateriallyimpactourfinancialconditionandresultsfromoperations,theutilityofFFOasameasureofourperformanceislimited.OtherREITsmaynotcalculateFFOinaccordancewiththeNAREITdefinitionand,accordingly,ourFFOmaynotbecomparabletootherREITs’FFO.FFOshouldbeconsideredonlyasasupplementtonetincomecomputedinaccordancewithGAAPasameasureofourperformance.CoreFundsfromOperations(CoreFFO):Wepresentcorefundsfromoperations,orcoreFFO,asasupplementaloperatingmeasurebecause,inexcludingcertainitemsthatdonotreflectcorerevenueorexpensestreams,itprovidesaperformancemeasurethat,whencomparedyearoveryear,capturestrendsinourcorebusinessoperatingperformance.WecalculatecoreFFObyaddingtoorsubtractingfromFFO(i)terminationfeesandothernon‐corerevenues,(ii)transactionandintegrationexpenses,(iii)lossfromearlyextinguishmentofdebt,(iv)gainon/issuancecostsassociatedwithredeemedpreferredstock,(v)severance,equityacceleration,andlegalexpenses,(vi)gain/lossonFXrevaluation,and(vii)othernon‐coreexpenseadjustments.Becausecertainoftheseadjustmentshavearealeconomicimpactonourfinancialconditionandresultsfromoperations,theutilityofcoreFFOasameasureofourperformanceislimited.OtherREITsmaycalculatecoreFFOdifferentlythanwedoandaccordingly,ourcoreFFOmaynotbecomparabletootherREITs’coreFFO.CoreFFOshouldbeconsideredonlyasasupplementtonetincomecomputedinaccordancewithGAAPasameasureofourperformance.EBITDAandAdjustedEBITDA:Webelievethatearningsbeforeinterest,lossfromearlyextinguishmentofdebt,incometaxes,anddepreciationandamortization,orEBITDA,andAdjustedEBITDA(asdefinedbelow),areusefulsupplementalperformancemeasuresbecausetheyallowinvestorstoviewourperformancewithouttheimpactofnon‐cashdepreciationandamortizationorthecostofdebtand,withrespecttoAdjustedEBITDA,unconsolidatedjointventurerealestaterelateddepreciation&amortization,unconsolidatedjointventureinterestexpenseandtax,severance,equityacceleration,andlegalexpenses,transactionandintegrationexpenses,gainonsale/deconsolidation,impairmentofinvestmentsinrealestate,othernon‐coreadjustments,net,non‐controllinginterests,preferredstockdividends,includingundeclareddividends,andissuancecostsassociatedwithredeemedpreferredstock.AdjustedEBITDAisEBITDAexcludingunconsolidatedjointventurerealestaterelateddepreciation&amortization,unconsolidatedjointventureinterestexpenseandtax,severance,equityacceleration,andlegalexpenses,transactionandintegrationexpenses,gainonsale/deconsolidation,impairmentofinvestmentsinrealestate,othernon‐coreadjustments,net,non‐controllinginterests,preferredstockdividends,includingundeclareddividends,andgainon/issuancecostsassociatedwithredeemedpreferredstock.Inaddition,webelieveEBITDAandAdjustedEBITDAarefrequentlyusedbysecuritiesanalysts,investorsandotherinterestedpartiesintheevaluationofREITs.BecauseEBITDAandAdjustedEBITDAarecalculatedbeforerecurringcashchargesincludinginterestexpenseandincometaxes,excludecapitalizedcosts,suchasleasingcommissions,andarenotadjustedforcapitalexpendituresorotherrecurringcashrequirementsofourbusiness,theirutilityasameasureofourperformanceislimited.OtherREITsmaycalculateEBITDAandAdjustedEBITDAdifferentlythanwedoand,accordingly,ourEBITDAandAdjustedEBITDAmaynotbecomparabletootherREITs’EBITDAandAdjustedEBITDA.Accordingly,EBITDAandAdjustedEBITDAshouldbeconsideredonlyassupplementstonetincomecomputedinaccordancewithGAAPasameasureofourfinancialperformance.NetOperatingIncome(NOI)andCashNOI:Netoperatingincome,orNOI,representsrentalrevenue,tenantreimbursementrevenueandinterconnectionrevenuelessutilitiesexpense,rentalpropertyoperatingexpenses,propertytaxesandinsuranceexpenses(asreflectedinthestatementofoperations).NOIiscommonlyusedbystockholders,companymanagementandindustryanalystsasameasurementofoperatingperformanceofthecompany’srentalportfolio.CashNOIisNOIlessstraight‐linerentsandabove‐andbelow‐marketrentamortization.CashNOIiscommonlyusedbystockholders,companymanagementandindustryanalystsasameasureofpropertyoperatingperformanceonacashbasis.However,becauseNOIandcashNOIexcludedepreciationandamortizationandcaptureneitherthechangesinthevalueofourdatacentersthatresultfromuseormarketconditions,northelevelofcapitalexpendituresandcapitalizedleasingcommissionsnecessarytomaintaintheoperatingperformanceofourdatacenters,allofwhichhaverealeconomiceffectandcouldmateriallyimpactourresultsfromoperations,theutilityofNOIandcashNOIasmeasuresofourperformanceislimited.OtherREITsmaycalculateNOIandcashNOIdifferentlythanwedoand,accordingly,ourNOIandcashNOImaynotbecomparabletootherREITs’NOIandcashNOI.NOIandcashNOIshouldbeconsideredonlyassupplementstonetincomecomputedinaccordancewithGAAPasmeasuresofourperformance.DIGITALREALTY|2Q21FINANCIALRESULTS|JULY29,2021
AppendixForward‐LookingStatements|18Thisinformationinthispresentationcontainsforward‐lookingstatementswithinthemeaningofthefederalsecuritieslaws,whicharebasedoncurrentexpectations,forecastsandassumptionsthatinvolverisksanduncertaintiesthatcouldcauseactualoutcomesandresultstodiffermaterially.Suchforward‐lookingstatementsincludestatementsrelatingto:oureconomicoutlook;theexpectedbenefitsofInterxionandothertransactions;ourexpectedinvestmentandexpansionactivity;ourjointventures;theexpectedbenefitsandtimingofPlatformDIGITAL®;theDataGravityIndex™;DataGravityIndexDGx™;publiccloudservicesspending;ourcorporategovernance;oursustainabilityinitiatives;theexpectedeffectofforeigncurrencytranslationadjustmentsonourfinancials;theCOVID‐19pandemic;demanddriversandeconomicgrowthoutlook;businessdrivers;sourcesanduses;ourexpecteddevelopmentplansandcompletions,includingtiming,totalsquarefootage,ITcapacityandraisedfloorspaceuponcompletion;expectedavailabilityforleasingeffortsandcolocationinitiatives;organizationalinitiatives;ourproductofferings;ourcommunitiesofinterest;ourexpectedGotoMarketstrategy;jointventureopportunities;occupancyandtotalinvestment;ourexpectedinvestmentinourproperties;ourestimatedtimetostabilizationandtargetedreturnsatstabilizationofourproperties;ourexpectedfutureacquisitions;acquisitionsstrategy;availableinventoryanddevelopmentstrategy;thesigningandcommencementofleases,andrelatedrentalrevenue;lagbetweensigningandcommencementofleases;our2021backlog;futurerents;ourexpectedsamestoreportfoliogrowth;ourexpectedgrowthandstabilizationofdevelopmentcompletionsandacquisitions;ourexpectedmarktomarketratesonleaseexpirations,leaserolloversandexpectedrentalratechanges;ourre‐leasingspreads;ourleasingexpirations;ourexpectedyieldsoninvestments;ourexpectationswithrespecttocapitalinvestmentsatleaseexpirationonexistingdatacenterorcolocationspace;barrierstoentry;competition;debtmaturities;leasematurities;ourexpectedreturnsoninvestedcapital;estimatedabsorptionrates;ourotherexpectedfuturefinancialandotherresults,andtheassumptionsunderlyingsuchresults;ourtopinvestmentgeographiesandmarketopportunities;ourexpectedcolocationexpansions;ourabilitytoaccessthecapitalmarkets;expectedtimeandcostsavingstoourcustomers;ourcustomers’capitalinvestments;ourplansandintentions;futuredatacenterutilization,utilizationrates,growthrates,trends,supplyanddemand;datacenteroutsourcingtrends;datacenterexpansionplans;estimatedkW/MWrequirements;growthintheoverallInternetinfrastructuresectorandsegmentsthereof;thereplacementcostofourassets;thedevelopmentcostsofourbuildings,andleadtimes;estimatedcostsforcustomerstodeployormigratetoanewdatacenter;capitalexpenditures;theeffectnewleasesandincreasesinrentalrateswillhaveonourrentalrevenuesandresultsofoperations;leaseexpirationrates;ourabilitytoborrowfundsunderourcreditfacilities;estimatesofthevalueofourdevelopmentportfolio;ourabilitytomeetourliquidityneeds,includingtheabilitytoraiseadditionalcapital;creditratings;capitalizationrates,orcaprates;marketforecasts;potentialnewlocations;theexpectedimpactofourglobalexpansion;dividendpaymentsandourdividendpolicy;projectedfinancialinformationandcovenantmetrics;coreFFOrunrateandNOIgrowth;otherforwardlookingfinancialdata;leasingexpectations;ourexposuretotenantsincertainindustries;ourexpectationsandunderlyingassumptionsregardingoursensitivitytofluctuationsinforeignexchangeratesandenergyprices;andthesufficiencyofourcapitaltofundfuturerequirements.Youcanidentifyforward‐lookingstatementsbytheuseofforward‐lookingterminologysuchas“believes,”“expects,”“may,”“will,”“should,”“seeks,”“approximately,”“intends,”“plans,”“proforma,”“estimates”or“anticipates”orthenegativeofthesewordsandphrasesorsimilarwordsorphraseswhicharepredictionsoforindicatefutureeventsortrendsanddiscussionswhichdonotrelatesolelytohistoricalmatters.Suchstatementsarebasedonmanagement’sbeliefsandassumptionsmadebasedoninformationcurrentlyavailabletomanagement.Suchstatementsaresubjecttorisks,uncertaintiesandassumptionsandarenotguaranteesoffutureperformanceandmaybeaffectedbyknownandunknownrisks,trends,uncertaintiesandfactorsthatarebeyondourcontrol.Shouldoneormoreoftheserisksoruncertaintiesmaterialize,orshouldunderlyingassumptionsproveincorrect,actualresultsmayvarymateriallyfromthoseanticipated,estimatedorprojected.Someoftherisksanduncertaintiesthatmaycauseouractualresults,performanceorachievementstodiffermateriallyfromthoseexpressedorimpliedbyforward‐lookingstatementsinclude,amongothers,thefollowing:reduceddemandfordatacentersordecreasesininformationtechnologyspending;thecompetitiveenvironmentinwhichweoperate;decreasedrentalrates,increasedoperatingcostsorincreasedvacancyrates;theimpactoftheCOVID‐19pandemiconourorourcustomers’,suppliers’orbusinesspartners’operations;increasedcompetitionoravailablesupplyofdatacenterspace;thesuitabilityofourdatacentersanddatacenterinfrastructure,delaysordisruptionsinconnectivityoravailabilityofpower,orfailuresorbreachesofourphysicalandinformationsecurityinfrastructureorservices;ourdependenceuponsignificantcustomers,bankruptcyorinsolvencyofamajorcustomerorasignificantnumberofsmallercustomers,ordefaultsonornon‐renewalofleasesbycustomers;breachesofourobligationsorrestrictionsunderourcontractswithourcustomers;ourinabilitytosuccessfullydevelopandleasenewpropertiesanddevelopmentspace,anddelaysorunexpectedcostsindevelopmentofproperties;theimpactofcurrentglobalandlocaleconomic,creditandmarketconditions;ourinabilitytoretaindatacenterspacethatweleaseorsubleasefromthirdparties;difficultymanaginganinternationalbusinessandacquiringoroperatingpropertiesinforeignjurisdictionsandunfamiliarmetropolitanareas;ourinabilitytoachieveexpectedrevenuesynergiesorcostsavingsasaresultofourcombinationwithInterxion;ourfailuretorealizetheintendedbenefitsfrom,ordisruptionstoourplansandoperationsorunknownorcontingentliabilitiesrelatedto,ourrecentacquisitions;ourfailuretosuccessfullyintegrateandoperateacquiredordevelopedpropertiesorbusinesses;difficultiesinidentifyingpropertiestoacquireandcompletingacquisitions;risksrelatedtojointventureinvestments,includingasaresultofourlackofcontrolofsuchinvestments;risksassociatedwithusingdebttofundourbusinessactivities,includingre‐financingandinterestraterisks,ourfailuretorepaydebtwhendue,adversechangesinourcreditratingsorourbreachofcovenantsorothertermscontainedinourloanfacilitiesandagreements;ourfailuretoobtainnecessarydebtandequityfinancing,andourdependenceonexternalsourcesofcapital;financialmarketfluctuationsandchangesinforeigncurrencyexchangerates;adverseeconomicorrealestatedevelopmentsinourindustryortheindustrysectorsthatwesellto,includingrisksrelatingtodecreasingrealestatevaluationsandimpairmentchargesandgoodwillandotherintangibleassetimpairmentcharges;ourinabilitytomanageourgrowtheffectively;lossesinexcessofourinsurancecoverage;environmentalliabilitiesandrisksrelatedtonaturaldisasters;ourinabilitytocomplywithrulesandregulationsapplicabletoourcompany;DigitalRealtyTrust,Inc.’sfailuretomaintainitsstatusasaREITforfederalincometaxpurposes;DigitalRealtyTrust,L.P.’sfailuretoqualifyasapartnershipforfederalincometaxpurposes;restrictionsonourabilitytoengageincertainbusinessactivities;andchangesinlocal,state,federalandinternationallawsandregulations,includingrelatedtotaxation,realestateandzoninglaws,andincreasesinrealpropertytaxrates;ourabilitytoattractandretainqualifiedpersonnelandtoattractandretaincustomers;andtheimpactofanyfinancial,accounting,legalorregulatoryissuesorlitigationthatmayaffectus.Therisksincludedherearenotexhaustive,andadditionalfactorscouldadverselyaffectourbusinessandfinancialperformance.WediscussedanumberofadditionalmaterialrisksinourannualreportonForm10‐KfortheyearendedDecember31,2020,andotherfilingswiththeSecuritiesandExchangeCommission.Thoseriskscontinuetoberelevanttoourperformanceandfinancialcondition.Moreover,weoperateinaverycompetitiveandrapidlychangingenvironment.Newriskfactorsemergefromtimetotimeanditisnotpossibleformanagementtopredictallsuchriskfactors,norcanitassesstheimpactofallsuchriskfactorsonthebusinessortheextenttowhichanyfactor,orcombinationoffactors,maycauseactualresultstodiffermateriallyfromthosecontainedinanyforward‐lookingstatements.Weexpresslydisclaimanyresponsibilitytoupdateforward‐lookingstatements,whetherasaresultofnewinformation,futureeventsorotherwise.DigitalRealty,DigitalRealtyTrust,theDigitalRealtylogo,Interxion,Turn‐KeyFlex,PoweredBaseBuilding,PlatformDIGITAL,DataGravityIndex,DataGravityIndexDGxandConnectedDataCommunitiesareregisteredtrademarksandservicemarksofDigitalRealtyTrust,Inc.intheUnitedStatesand/orothercountries.Allothernames,trademarksandservicemarksarethepropertyoftheirrespectiveowners.DIGITALREALTY|2Q21FINANCIALRESULTS|JULY29,2021

ReconciliationofNon‐GAAPItemsToTheirClosestGAAPEquivalent|19DIGITALREALTY|2Q21FINANCIALRESULTS|JULY29,2021June30,2021June30,2020June30,2021June30,2020Netincomeavailabletocommonstockholders127,368$53,676$499,778$256,535$Adjustments:Noncontrollinginterestsinoperatingpartnership3,2001,40013,0009,200Realestaterelateddepreciationandamortization(1)363,640342,334728,337628,851Realestaterelateddepreciationandamortizationrelatedtoinvestmentinunconsolidatedjointventures20,98317,12340,36137,046(Gain)onrealestatetransactions(499)‐(334,420)(304,801)FFOavailabletocommonstockholdersandunitholders514,692$414,533$947,056$626,831$BasicFFOpershareandunit1.78$1.50$3.28$2.48$DilutedFFOpershareandunit1.78$1.49$3.27$2.45$WeightedaveragecommonstockandunitsoutstandingBasic288,843275,545288,588252,995Diluted289,485278,719289,219255,704(1)Realestaterelateddepreciationandamortizationwascomputedasfollows:Depreciationandamortizationperincomestatement368,981349,165738,714640,622Non‐realestatedepreciation(5,341)(6,831)(10,377)(11,771)363,640$342,334$728,337$628,851$June30,2021June30,2020June30,2021June30,2020FFOavailabletocommonstockholdersandunitholders‐‐basicanddiluted514,692$414,533$947,056$626,831$Weightedaveragecommonstockandunitsoutstanding288,843275,545288,588252,995Add:Effectofdilutivesecurities6423,1746312,709Weightedaveragecommonstockandunitsoutstanding‐‐diluted289,485278,719289,219255,704ThreeMonthsEndedSixMonthsEndedSixMonthsEndedDigitalRealtyTrust,Inc.andSubsidiariesReconciliationofNetIncomeAvailabletoCommonStockholderstoFundsFromOperations(FFO)(inthousands,exceptpershareandunitdata)(unaudited)ThreeMonthsEnded
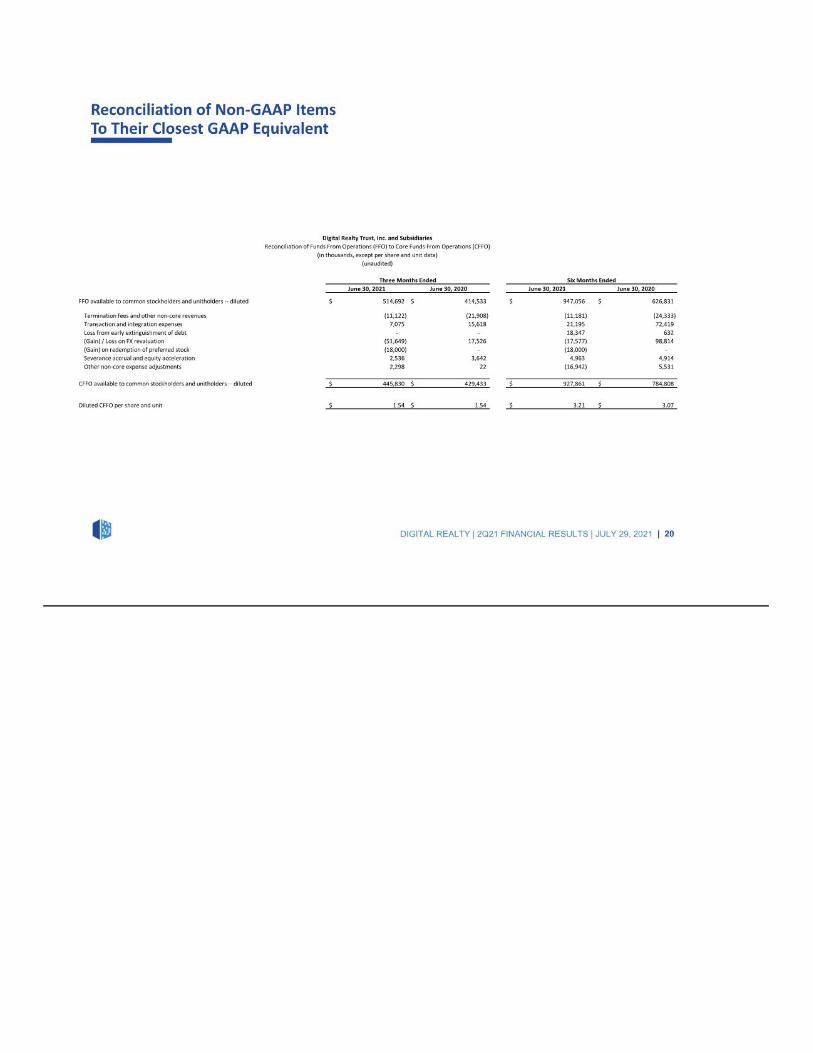
ReconciliationofNon‐GAAPItemsToTheirClosestGAAPEquivalent|20DIGITALREALTY|2Q21FINANCIALRESULTS|JULY29,2021June30,2021June30,2020June30,2021June30,2020FFOavailabletocommonstockholdersandunitholders‐‐diluted514,692$414,533$947,056$626,831$Terminationfeesandothernon‐corerevenues(11,122)(21,908)(11,181)(24,333)Transactionandintegrationexpenses7,07515,61821,19572,419Lossfromearlyextinguishmentofdebt‐‐18,347632(Gain)/LossonFXrevaluation(51,649)17,526(17,577)98,814(Gain)onredemptionofpreferredstock(18,000)‐(18,000)‐Severanceaccrualandequityacceleration2,5363,6424,9634,914Othernon‐coreexpenseadjustments2,29822(16,942)5,531CFFOavailabletocommonstockholdersandunitholders‐‐diluted445,830$429,433$927,861$784,808$DilutedCFFOpershareandunit1.54$1.54$3.21$3.07$DigitalRealtyTrust,Inc.andSubsidiariesReconciliationofFundsFromOperations(FFO)toCoreFundsFromOperations(CFFO)(inthousands,exceptpershareandunitdata)(unaudited)ThreeMonthsEndedSixMonthsEnded

ReconciliationofNon‐GAAPItemsToTheirClosestGAAPEquivalent|21DIGITALREALTY|2Q21FINANCIALRESULTS|JULY29,2021June30,2021June30,2020June30,2021June30,2020Netincomeavailabletocommonstockholders127,368$53,676$499,778$256,535$Interest75,01479,874150,667165,674Lossfromearlyextinguishmentofdebt‐‐18,347632Incometaxexpense(benefit)47,58211,49055,12918,672Depreciationandamortization368,981349,165738,714640,622EBITDA618,945494,2051,462,6351,082,135UnconsolidatedJVrealestaterelateddepreciation&amortization20,98317,12340,36137,046UnconsolidatedJVinterestexpenseandtaxexpense15,5239,20345,45432,487Severanceaccrualandequityacceleration2,5363,6424,9634,914Transactionandintegrationexpenses7,07515,61821,19572,419(Gain)onsale/deconsolidation(499)‐(346,514)(67,497)Othernon‐coreadjustments,net(60,308)(3,404)(40,631)(24,250)Noncontrollinginterests4,5441,14713,3005,831Preferredstockdividends,includingundeclareddividends11,88521,15525,39942,310(Gain)onredemptionofpreferredstock(18,000)‐(1,480)11,760.AdjustedEBITDA602,684$558,689$1,231,164$1,202,506$DigitalRealtyTrust,Inc.andSubsidiariesReconciliationofNetIncomeAvailabletoCommonStockholderstoEarningsBeforeInterest,Taxes,DepreciationandAmortization(EBITDA)andAdjustedEBITDA(inthousands)(unaudited)SixMonthsEndedThreeMonthsEnded
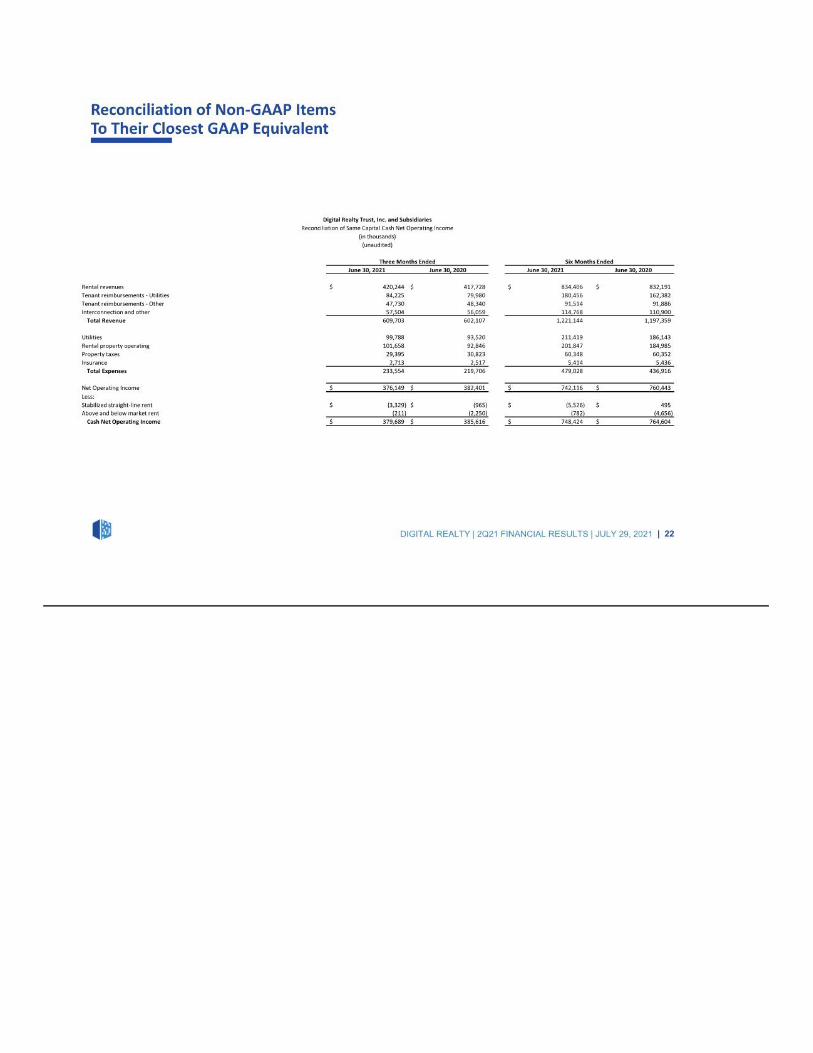
ReconciliationofNon‐GAAPItemsToTheirClosestGAAPEquivalent|22DIGITALREALTY|2Q21FINANCIALRESULTS|JULY29,2021June30,2021June30,2020June30,2021June30,2020Rentalrevenues420,244$417,728$834,406$832,191$Tenantreimbursements‐Utilities84,22579,980180,456162,382Tenantreimbursements‐Other47,73048,34091,51491,886Interconnectionandother57,50456,059114,768110,900TotalRevenue609,703602,1071,221,1441,197,359Utilities99,78893,520211,419186,143Rentalpropertyoperating101,65892,846201,847184,985Propertytaxes29,39530,82360,34860,352Insurance2,7132,5175,4145,436TotalExpenses233,554219,706479,028436,916NetOperatingIncome376,149$382,401$742,116$760,443$Less:Stabilizedstraight‐linerent(3,329)$(965)$(5,526)$495$Aboveandbelowmarketrent(211)(2,250)(782)(4,656)CashNetOperatingIncome379,689$385,616$748,424$764,604$ThreeMonthsEndedSixMonthsEndedDigitalRealtyTrust,Inc.andSubsidiariesReconciliationofSameCapitalCashNetOperatingIncome(inthousands)(unaudited)
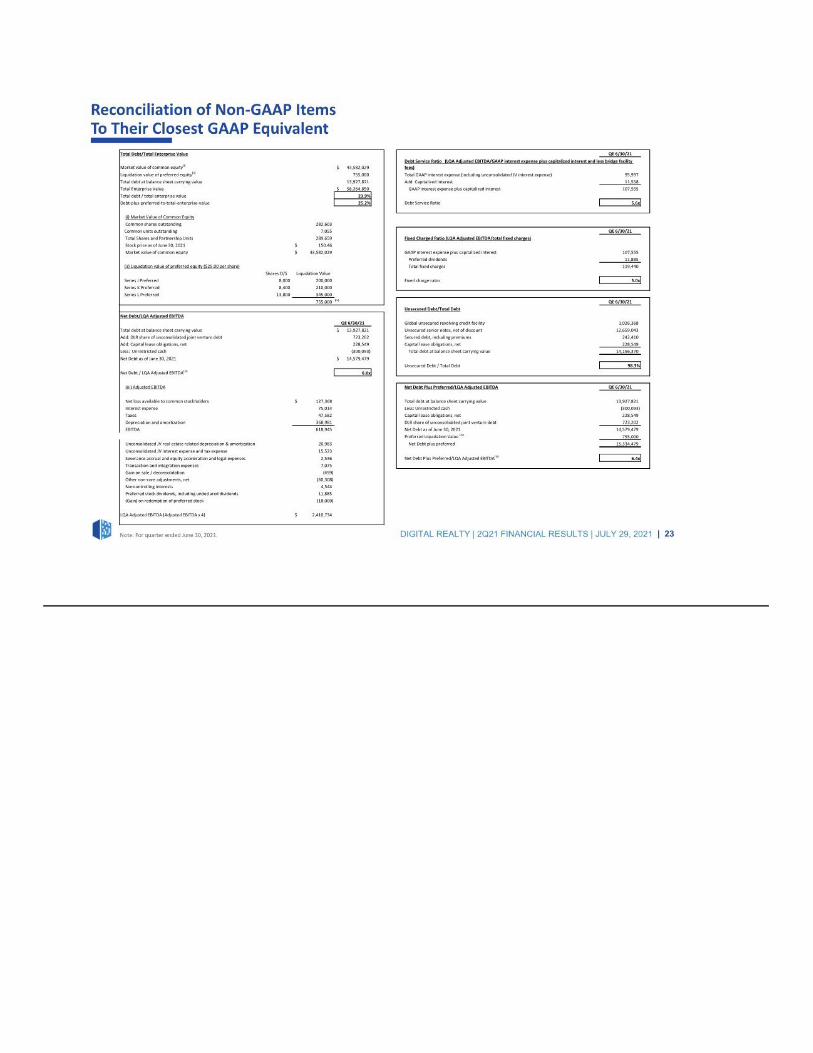
ReconciliationofNon‐GAAPItemsToTheirClosestGAAPEquivalent|23Note:ForquarterendedJune30,2021.DIGITALREALTY|2Q21FINANCIALRESULTS|JULY29,2021TotalDebt/TotalEnterpriseValueQE6/30/21Marketvalueofcommonequity(i)43,582,029$Liquidationvalueofpreferredequity(ii)755,000TotalGAAPinterestexpense(includingunconsolidatedJVinterestexpense)95,997Totaldebtatbalancesheetcarryingvalue13,927,821Add:Capitalizedinterest11,558TotalEnterpriseValue58,264,850$GAAPinterestexpensepluscapitalizedinterest107,555Totaldebt/totalenterprisevalue23.9%Debt‐plus‐preferred‐to‐total‐enterprise‐value25.2%DebtServiceRatio5.6x(i)MarketValueofCommonEquityCommonsharesoutstanding282,603Commonunitsoutstanding7,055QE6/30/21TotalSharesandPartnershipUnits289,659FixedChargedRatio(LQAAdjustedEBITDA/totalfixedcharges)StockpriceasofJune30,2021150.46$Marketvalueofcommonequity43,582,029$GAAPinterestexpensepluscapitalizedinterest107,555Preferreddividends11,885(ii)Liquidationvalueofpreferredequity($25.00pershare)Totalfixedcharges119,440SharesO/SLiquidationValueSeriesJPreferred8,000200,000Fixedchargeratio5.0xSeriesKPreferred8,400210,000SeriesLPreferred13,800345,000755,000(iv)QE6/30/21UnsecuredDebt/TotalDebtNetDebt/LQAAdjustedEBITDAQE6/30/21Globalunsecuredrevolvingcreditfacility1,026,368Totaldebtatbalancesheetcarryingvalue13,927,821$Unsecuredseniornotes,netofdiscount12,659,043Add:DLRshareofunconsolidatedjointventuredebt723,202Secureddebt,includingpremiums242,410Add:Capitalleaseobligations,net228,549Capitalleaseobligations,net228,549Less:Unrestrictedcash(300,093)Totaldebtatbalancesheetcarryingvalue14,156,370NetDebtasofJune30,202114,579,479$UnsecuredDebt/TotalDebt98.3%NetDebt/LQAAdjustedEBITDA(iii)6.0x(iii)AdjustedEBITDANetDebtPlusPreferred/LQAAdjustedEBITDAQE6/30/21Netlossavailabletocommonstockholders127,368$Totaldebtatbalancesheetcarryingvalue13,927,821Interestexpense75,014Less:Unrestrictedcash(300,093)Taxes47,582Capitalleaseobligations,net228,549Depreciationandamortization368,981DLRshareofunconsolidatedjointventuredebt723,202EBITDA618,945NetDebtasofJune30,202114,579,479PreferredLiquidationValue(iv)755,000UnconsolidatedJVrealestaterelateddepreciation&amortization20,983NetDebtpluspreferred15,334,479UnconsolidatedJVinterestexpenseandtaxexpense15,523Severanceaccrualandequityaccelerationandlegalexpenses2,536NetDebtPlusPreferred/LQAAdjustedEBITDA(iii)6.4xTransactionandintegrationexpenses7,075Gainonsale/deconsolidation(499)Othernon‐coreadjustments,net(60,308)Noncontrollinginterests4,544Preferredstockdividends,includingundeclareddividends11,885(Gain)onredemptionofpreferredstock(18,000)LQAAdjustedEBITDA(AdjustedEBITDAx4)2,410,734$DebtServiceRatio(LQAAdjustedEBITDA/GAAPinterestexpensepluscapitalizedinterestandlessbridgefacilityfees)
Related Documents

![[XLS]seekingalpha.com · Web view2016/08/08 · HD SUPPLY HOLDINGS INC HDS HOME BANCORP INC HBCP HEADWATERS INC HW HOME BANCSHARES INC HOMB HEALTHCARE REALTY TRUST HR HOME DEPOT INC](https://static.cupdf.com/doc/110x72/5b1e7c767f8b9af1328b87e9/xls-web-view20160808-hd-supply-holdings-inc-hds-home-bancorp-inc-hbcp.jpg)


