DIGITAL MARKETING PERFORMANCE MEASUREMENT: HOW GOOD MARKETING PERFORMANCE MEASUREMENT PRACTICES CAN INCREASE FIRM’S PERFORMANCE THE CASE OF FORALL PHONES Rodrigo Vieira Castilho Project submitted as partial requirement for the conferral of Master in Marketing Supervisor: Prof. Hélia Maria Gonçalves Pereira, Prof. Auxiliar, ISCTE Business School, Departamento de Marketing, Operações e Gestão Geral Co-Supervisor: Prof. Nuno Alexandre Guerreiro Pedro, Prof. Convidado, ISCTE Business School, Departamento de Marketing, Operações e Gestão Geral June 2019

Welcome message from author
This document is posted to help you gain knowledge. Please leave a comment to let me know what you think about it! Share it to your friends and learn new things together.
Transcript
DIGITAL MARKETING PERFORMANCE
MEASUREMENT: HOW GOOD MARKETING
PERFORMANCE MEASUREMENT PRACTICES CAN
INCREASE FIRM’S PERFORMANCE
THE CASE OF FORALL PHONES
Rodrigo Vieira Castilho
Project submitted as partial requirement for the conferral of
Master in Marketing
Supervisor:
Prof. Hélia Maria Gonçalves Pereira, Prof. Auxiliar, ISCTE Business School, Departamento de
Marketing, Operações e Gestão Geral
Co-Supervisor:
Prof. Nuno Alexandre Guerreiro Pedro, Prof. Convidado, ISCTE Business School,
Departamento de Marketing, Operações e Gestão Geral
June 2019

“What cannot be measured cannot be managed” – Peter Drucker
“Measure what is measurable, and make measurable what is not so” – Galileu Galilei

ACKNOWLEDGMENTS
The realization of this project has become a constant and demanding challenge, as all the
points were being developed. All this work would not be possible alone. From the support
and help from the supervisors, the information and receptiveness of Forall Phones, as well
as the emotional support from those we love most: family, girlfriend, and friends, who
have made this process much easier to overcome. Having said this, I would like to thank
all who, directly or indirectly, contributed positively to this thesis.
To prof. Hélia Pereira and to prof. Nuno Pedro, I would like to thank them for all the tips
and help shown from the beginning to the end of this project. Their help was essential not
only for the development of the thesis and its contents, but also for the encouragement
and suggestions for continuous improvement.
To my family, especially to my parents and my brother, to my girlfriend and to my friends,
I want to thank them for the unconditional support they gave me during all these months.
Writing this thesis was a difficult long process, with good and bad moments, and the
motivational words, as well as the encouragement to overcome this process, are due,
above all, to them.
To Miguel Santos, my instructor in the Analytics Expert course, from Goobec Portugal,
for all the given support and sharing of know-how and, especially, for being so helpful in
every subject of interest, always in the attempt to raise the content of my thesis to a higher
level.
Lastly, I would like to express my deepest appreciations to Forall Phones, mainly to my
friend Bernardo Carreiro, Financial Controller and to José Alves, Head of Performance,
for all the work and time invested in this project. I want to thank them all for the internal
information provided, as well as all efforts in the attempt to increase the credibility of my
thesis, making it richer and insightful. To them, I am grateful for all the knowledge
sharing, much valuable for the topic development.

ABSTRACT
The main purpose of this case study is to analyse the impact of good marketing
performance practices on firm’s results, by using financial metrics.
With digital improvement, it has become easier to measure marketing efforts. Hence, this
project is focused on Forall Phones’ digital marketing performance measurement process,
on how performance indicators are chosen, communicated and used to lead to strategic
decisions, and if this department is creating value for the company.
The measurement process used is one of the firm’s competitive advantages, with a
constant monitoring of the trade-off between costs and benefits, in order to provide a clear
vision of what is most profitable for the department. There is a clear focus on what is
highly quantifiable and measurable and the establishment of objectives and target
audiences, and their constant monitoring, allowing a more effective way of channelling
efforts in this direction.
Despite the high investment in marketing and, since the professionalization of the
department, the considerable increase of the results at the level of sales and revenue, there
is not enough data to clearly highlight it from the rest. One possible justification is that
the department does not make a forecast of ROI with its respective monitoring, which
would allow knowing all the profitability of the marketing, as well as perceive gaps and
its causes, which would provide a more effective budget management, through a better
resources’ allocation.
Keywords: digital marketing, marketing metrics, marketing performance measurement,
ROI marketing
JEL Classification System: L25 Firm Performance: Size, Diversification, and Scope
M13 Start-ups
M31 Marketing
RESUMO
O presente caso de estudo tem como principal propósito analisar o impacto de boas
práticas de medição da performance do marketing nos resultados da empresa, usando
métricas financeiras.
Com o avanço do digital, tornou-se mais fácil medir os esforços de marketing. Assim,
este projeto está focado no processo de medição de performance de marketing digital da
Forall Phones, na maneira como os indicadores de performance são escolhidos,
comunicados e usados para tomar decisões estratégicas, e se o departamento de marketing
está ou não a criar valor para a empresa.
O processo de medição usado tem sido uma das vantagens competitivas da empresa,
havendo uma constante monitorização de custos relativamente aos benefícios, de modo a
proporcionar uma leitura clara do que é mais rentável para o departamento. Existe um
foco claro nas métricas altamente quantificáveis e mensuráveis e o estabelecimento de
objetivos e de públicos-alvo, e sua monitorização, permite um foco mais claro daquilo
que se pretende, canalizando os esforços nesse sentido.
Apesar do elevado investimento em marketing e de, desde a profissionalização do
departamento, os resultados ao nível de vendas e receita terem aumentado
consideravelmente, não existem dados suficientes para o destacar, claramente, dos
restantes. Uma possível justificação é o facto de o departamento não fazer uma previsão
de ROI com uma monitorização do mesmo, o que permitiria saber toda a rentabilidade do
marketing, bem como perceber desvios e causas dos mesmos, proporcionando uma gestão
do budget mais eficaz, através de uma melhor alocação de recursos.
Palavras-Chave: marketing digital, métricas de marketing, medição de performance,
marketing ROI
JEL Classification System: L25 Firm Performance: Size, Diversification, and Scope
M13 Start-ups
M31 Marketing

I
INDEX
1. CASE STUDY CONTEXT ..................................................................................................... 1
1.1. THE PROBLEM .............................................................................................................. 1
1.2. MACROECONOMIC OVERVIEW .............................................................................. 2
1.3. MARKET ANALYSIS - EXTERNAL ANALYSIS ...................................................... 3
1.3.1. SMARTPHONES MARKET IN PORTUGAL .......................................................... 3
1.3.2. EXTERNAL ANALYSIS - SMARTPHONES INDUSTRY – THE GROWING
SEGMENT OF REFURBISHED .......................................................................................... 4
1.3.3. THE COMPETITIVE SITUATION ........................................................................... 7
1.4. FORALL PHONES – INTERNAL ANALYSIS .......................................................... 10
1.4.1. BUSINESS IDEA AND HISTORY.......................................................................... 10
1.4.2. OPERATING MODEL AND PRODUCTS .............................................................. 11
1.4.3. TARGET MARKET ................................................................................................. 12
1.5. MARKETING AT FORALL PHONES ....................................................................... 13
1.5.1. E-COMMERCE VS PHYSICAL STORES .............................................................. 13
............................................................................................................................................. 17
1.5.2. FORALL FAMILY ................................................................................................... 17
1.5.3. IMPORTANCE OF THE MARKETING DEPARTMENT AT FORALL ............... 18
1.6. DIGITAL MARKETING PERFORMANCE MEASUREMENT ............................. 21
1.6.1. BEST PRACTICES IN DIGITAL MARKETING PERFORMANCE
MEASUREMENT ............................................................................................................. 21
1.6.1.1. THE IMPORTANCE OF MEASUREMENT .................................................... 21
1.6.1.2. THE “RIGHT” METRICS ................................................................................. 22
1.6.1.3. ROI MARKETING ............................................................................................ 26
1.6.2. FORALL PHONES DIGITAL MARKETING PERFORMANCE .................... 28
1.6.2.1. FORALL PHONES’ DIGITAL MARKETING PERFORMANCE
MEASUREMENT .......................................................................................................... 29
1.6.2.1.1. GOALS ESTABLISHMENT ...................................................................... 30
1.6.2.1.2. DATA GATHERING – PLATFORMS OPERATIONALIZATION AND
REPORTING .............................................................................................................. 31
1.6.2.1.3. DATA ANALYSIS ..................................................................................... 32
1.6.2.1.4. THE FEEDBACK FOR STRATEGIC DECISIONS .................................. 34
1.6.2.1.5. REPORTING AND COMMUNICATING ................................................. 35
1.6.2.2. THE BLACK FRIDAY CAMPAIGN – ILLUSTRATIVE EXAMPLE OF
PERFORMANCE MEASUREMENT ............................................................................ 36
1.6.2.3. ROI MARKETING AT FORALL PHONES ..................................................... 38

II
2. QUESTIONS ......................................................................................................................... 40
3. APPENDICES ....................................................................................................................... 41
APPENDIX 1. MAP OF THE PERCENTAGE OF PEOPLE LIVING WITH THE
MINIMUM WAGE IN EUROPE ........................................................................................... 41
APPENDIX 2. LEVEL OF MINIMUM WAGE IN THE 28 EU MEMBER STATES ........ 41
APPENDIX 3. MEDIUM AVERAGE SALARY (€) IN THE 28 EU MEMBERS .............. 42
APPENDIX 4. TAX BURDEN CONTRIBUTION TO GDP (IN %) IN PORTUGAL FROM
1995-2017 ............................................................................................................................... 42
APPENDIX 5. TAX BURDEN CONTRIBUTION TO GDP IN THE 28 MEMBER
STATES (2017) ...................................................................................................................... 43
APPENDIX 6. EVOLUTION OF THE UNEMPLOYMENT RATE (%) IN PORTUGAL
(1983-2017) ............................................................................................................................. 43
APPENDIX 7. UNEMPLOYMENT RATE IN THE EUROPE COUNTRIES (2018) ......... 44
APPENDIX 8. MOBILE PHONE PENETRATION RATE (%) IN PORTUGAL (2004-
2018) ....................................................................................................................................... 44
APPENDIX 9. NUMBER OF SMARTPHONES SOLD TO END USERS WORLDWIDE
2007 TO 2017 (IN MILLION UNITS) ................................................................................... 44
APPENDIX 10. GLOBAL SMARTPHONE SHIPMENTS RANKING (MILLION UNITS)
AND YOY% GROWTH (2016-2017) .................................................................................... 45
APPENDIX 11. REFURBISHED SMARTPHONES VS NEW SMARTPHONE
SHIPMENTS YOY GROWTH (%) IN EMERGING REFURBISHED MARKETS ............ 45
APPENDIX 12. REGIONAL ANNUAL GROWTH COMPARISON IN THE GLOBAL
SMARTPHONE MARKET .................................................................................................... 45
APPENDIX 13. BIGGEST SMARTPHONE PLAYERS SHIPMENT VOLUMES
(MILLION UNITS) AND MARKET SHARE VARIATION (%) (2017-2018) .................... 46
APPENDIX 14. PRICING BENCHMARKING ANALYSIS IPHONE 8 64G & IPHONE X
64 G ......................................................................................................................................... 46
APPENDIX 15. FORALL PHONES PRODUCT OVERVIEW ........................................... 46
APPENDIX 16. PAYMENT, RETURNS & WARRANTY .................................................. 47
APPENDIX 17. FORALL PHONES STORES LOCATION ................................................ 47
APPENDIX 18. PERCENTAGE OF PEOPLE BETWEEN 16-74 YEARS OLD WHO
USED ELECTRONIC COMMERCE IN PORTUGAL (2010-2017) .................................... 47
APPENDIX 19. EVOLUTION OF INTERNET PENETRATION IN PORTUGAL (1997-
2017) ....................................................................................................................................... 48
APPENDIX 20. FORALL PHONES’ SALES BY CHANNEL (%) AND TOTAL
SMARTPHONE SALES UNITS (SEP-DEC 2018) ............................................................... 48
APPENDIX 21. FORALL PHONES ONLINE MARKETING TOOLS & PLATFORMS .. 49
APPENDIX 22. METRICS SYSTEM SUMMARY TABLE (DIGITAL SOFT METRICS) 50
APPENDIX 23. METRICS SYSTEM SUMMARY TABLE (DIGITAL HARD METRICS)
................................................................................................................................................. 51

III
APPENDIX 24. BLACK FRIDAY CAMPAIGN COMMUNICATION POSTED ON
FACEBOOK ........................................................................................................................... 52
4. TEACHING NOTES ............................................................................................................ 53
4.1. CASE STUDY TARGET ............................................................................................... 53
4.2. PEDAGOGICAL OBJECTIVES ................................................................................. 53
4.3. LITERATURE REVIEW .............................................................................................. 54
4.3.1. MARKETING PERFORMANCE MEASUREMENT ............................................. 54
4.3.2. DIGITAL MARKETING AND DATA GATHERING ............................................ 59
4.3.3. DIGITAL MARKETING PERFORMANCE MEASUREMENT ............................ 62
4.3.3.1. ALIGNMENT AND ACCOUNTABILITY – INTEGRATING FINANCIAL
INDICATORS ................................................................................................................. 66
4.3.3.1.1. THE ROI MARKETING METHODOLOGY ............................................ 69
4.3.3.2. MONITORING AND COMMUNICATING THROUGH ACTIONABLE
DASHBOARDS .............................................................................................................. 71
4.4. ANALYTICAL FRAMEWORK PRESENTATION .................................................. 73
4.5. ACTION PLAN ............................................................................................................. 75
4.6. ANIMATION QUESTIONS ......................................................................................... 76
4.7. CASE STUDY RESOLUTION PROPOSAL .............................................................. 76
4.8. CASE STUDY RESOLUTION SLIDES ..................................................................... 92
5. MANAGEMENT LESSONS AND MAIN CONCLUSIONS ............................................ 98
6. BIBLIOGRAPHY .............................................................................................................. 102
INDEX OF TABLES
TABLE 1. PRICING POSITIONING ANALYSIS ..................................................................... 8
TABLE 2. FORALL PHONE’S MARKETING INVESTMENT BY CHANNEL AND COST
PER ACQUISITION BY SALE (€) (SEP-DEC 2018) ............................................................... 20
TABLE 3. THE RIGHT METRICS SUMMARY ..................................................................... 24
TABLE 4. BASIC ROI CALCULATION ................................................................................. 27
TABLE 5. FORALL PHONES’ METRICS SYSTEM ............................................................. 34
IV
INDEX OF FIGURES
FIGURE 1. SMARTPHONE PENETRATION IN PORTUGAL (%) (2012-JUL2018) ............. 4
FIGURE 2. MARKET SHARE OF USED SMARTPHONES (%) WORLDWIDE FROM 2015
TO 2020 ........................................................................................................................................ 6
FIGURE 3. PERCENTAGE OF PEOPLE BETWEEN 16-74 YEARS OLD WHO USED
ELECTRONIC COMMERCE IN PORTUGAL (2010-2017) .................................................... 14
FIGURE 4. ONLINE AND STORE SMARTPHONE SALES UNITS (SEP-DEC 2018) ....... 17
FIGURE 5. FORALL PHONE’S MARKETING DEPARTMENT CHART ............................ 18
FIGURE 6. FORALL PHONE’S DIGITAL MARKETING ECOSYSTEM ............................ 19
FIGURE 7. VEM MARKETING’S FRAMEWORK OF METRICS ........................................ 23
FIGURE 8. DIGITAL MARKETING METRICS DIVIDED INTO CATEGORIES
(ACQUISITION, BEHAVIOUR, CONVERSION AND INVOLVEMENT) ............................ 25
FIGURE 9. FORALL PHONES’ PERFORMANCE ANALYSIS FILE .................................. 33
FIGURE 10. FORALL PHONES’ PERFORMANCE ANALYSIS DASHBOARD ................ 36
INDEX OF TABLES TEACHING NOTES (TN)
TN TABLE 1. STEEL’S WEB ANALYTICS METRICS FOR THE DIFFERENT STAGS OF
CUSTOMERS’ PATH TO PURCHASE .................................................................................... 65
TN TABLE 2. TYPE OF ADVERTISING CONTRACTING MODEL ................................... 65
TN TABLE 3. ACTION PLAN ................................................................................................. 75
TN TABLE 4. DIGITAL MEASUREMENT PLAN OF FORALL PHONES - RESOLUTION
PROPOSAL ................................................................................................................................ 91
INDEX OF FIGURES TEACHING NOTES (TN)
TN FIGURE 1. THE CHAIN OF MARKETING PRODUCTIVITY ....................................... 56
TN FIGURE 2. THE MARKETING-PERFORMANCE OUTCOME CHAIN AND
EXAMPLE MEASURES ............................................................................................................ 56
TN FIGURE 3. TYPES OF RETURN ON MARKETING ACTIVITIES ................................ 68
TN FIGURE 4. THE ROI MARKETING PROCESS MODEL ................................................ 71
TN FIGURE 5. STEEL’S DIGITAL MARKETING PERFORMANCE MEASUREMENT
PROCESS AND TOOLS IN USE .............................................................................................. 72
TN FIGURE 6. INDICATORS THAT MAY HAVE LED TO THE CREATION OF FORALL
PHONES ..................................................................................................................................... 78
TN FIGURE 7. DIGITAL MARKETING PERFORMANCE MEASUREMENT PROCESS
ADOPTED BY FORALL PHONES ........................................................................................... 79
TN FIGURE 8. ROI MARKETING GAPS EXPLANATION .................................................. 90

1
1. CASE STUDY CONTEXT
1.1. THE PROBLEM
With the economic crisis that rose in Europe, several countries, including Portugal, have
implemented severe austerity measures, such as wages cuts or an increase in direct and
indirect taxes, leading to a fall in family incomes, also due to the increase in the
unemployment rate. Because of this, many consumption patterns have had to be altered,
changing some household behaviours regarding their hierarchy of priorities. In addition
to the families, many companies also entered a cost containment phase, leading to
collective redundancies, lower wages and an increase in the number of working hours.
The need to justify investment has been increased over the last years and, then, today the
need for results is mandatory.
These days, organizations are optimizing costs, so it is required for all departments to be
financially accountable. Due to this, the need for measurement is indispensable because
without measurement it is impossible to be accountable. The growing pressure within the
companies to attain results and outcomes has been leading to the measurement of the
return on marketing, treating marketing expenditures as an investment and not as cost
(Schultz & Gronstedt, 1997 as cited in Seggie, Cavusgil & Phelan, 2007), being possible
to compare them to other assets or departments, enhancing the marketing function as a
crucial role in the business strategy. Marketing Science Institute (MSI) in a Journal of
Marketing article (2004), emphasizes that marketing only would have “a seat at the table”
if linked to financial performance. The same institution suggests that marketing will
continue losing points to other departments, if they continue focusing only on soft
measures, as brand awareness.
In fact, there is evidence that senior management is much more demanding, requiring
information of the return on investment (ROI) from the campaigns the marketers are
carrying out, owing to the substantial amount of financial resources they manage (Seggie
et al., 2017). In the 2017 VisionEdge Marketing (VEM) report, research from KPMG was
tinted, suggesting that 9 in 10 organizations “expect their CEO to lead the organization
on a strategic growth trajectory”. Research by CMO Council and Deloitte was also
emphasized in which “almost 70% of CEOs now expect CMOs to lead revenue growth”
(VEM, 2017).
2
In this sense, this case study was focused on three main goals: first, to analyse Forall
Phones, focusing on their marketing department and how they measure the digital
marketing performance, as well as to explore the involved market, analysing its potential
and characteristics. Second, to study the importance of measuring the performance of
digital marketing, by adding financial indicators linked to the business outcomes and,
finally, to define solutions to improve the level of performance measurement in Forall
Phones.
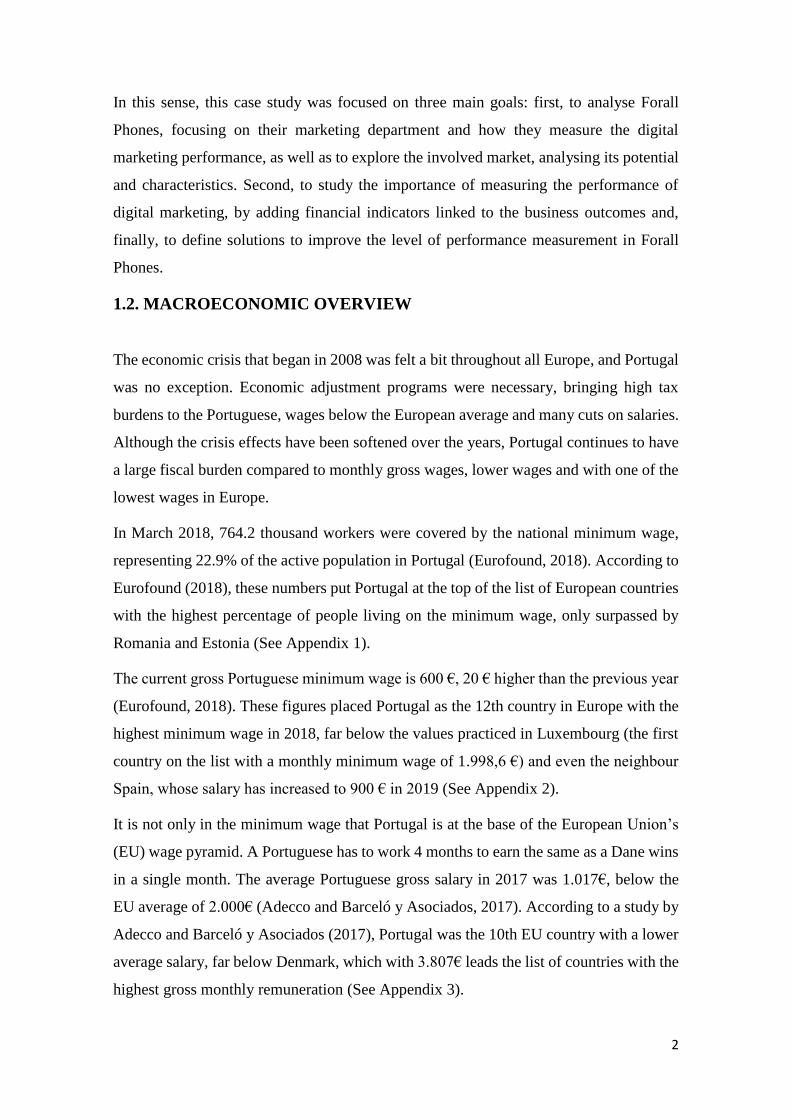
1.2. MACROECONOMIC OVERVIEW
The economic crisis that began in 2008 was felt a bit throughout all Europe, and Portugal
was no exception. Economic adjustment programs were necessary, bringing high tax
burdens to the Portuguese, wages below the European average and many cuts on salaries.
Although the crisis effects have been softened over the years, Portugal continues to have
a large fiscal burden compared to monthly gross wages, lower wages and with one of the
lowest wages in Europe.
In March 2018, 764.2 thousand workers were covered by the national minimum wage,
representing 22.9% of the active population in Portugal (Eurofound, 2018). According to
Eurofound (2018), these numbers put Portugal at the top of the list of European countries
with the highest percentage of people living on the minimum wage, only surpassed by
Romania and Estonia (See Appendix 1).
The current gross Portuguese minimum wage is 600 €, 20 € higher than the previous year
(Eurofound, 2018). These figures placed Portugal as the 12th country in Europe with the
highest minimum wage in 2018, far below the values practiced in Luxembourg (the first
country on the list with a monthly minimum wage of 1.998,6 €) and even the neighbour
Spain, whose salary has increased to 900 € in 2019 (See Appendix 2).
It is not only in the minimum wage that Portugal is at the base of the European Union’s
(EU) wage pyramid. A Portuguese has to work 4 months to earn the same as a Dane wins
in a single month. The average Portuguese gross salary in 2017 was 1.017€, below the
EU average of 2.000€ (Adecco and Barceló y Asociados, 2017). According to a study by
Adecco and Barceló y Asociados (2017), Portugal was the 10th EU country with a lower
average salary, far below Denmark, which with 3.807€ leads the list of countries with the
highest gross monthly remuneration (See Appendix 3).

3
Since the beginning of the crisis, the Portuguese people have suffered severe salaries’
cuts. Since 2008, the direct income taxes, have led the Portuguese to deliver much of their
income to the state, through direct and indirect taxes. The Portuguese tax burden
contribution reached its highest records in 2018, contributing with 35.4% to GDP,
according to INE (2018), surpassing the previous year, with a contribution of 34.4% (INE,
2017) (See Appendix 4). Despite this high tax burden, the weight of taxes and social
contributions in Portugal is still lower than the average in the EU. Compared with the rest
of the Member States, Portugal is below average (INE, 2017) (See Appendix 5).
The years after the crisis were black years regarding the unemployment rate in Portugal.
In 2013, unemployment reached a 16.2% rate, a new record (Pordata, 2017). Since then,
there has been a steady decline since reaching the lowest level in recent years, with 6.7%
(See Appendix 6) in October 2018, according to Eurostat (2018). Today, according to
Pordata (2018), the Portuguese unemployment rate is in line with the European Union
average, with the same value (See Appendix 7).
1.3. MARKET ANALYSIS - EXTERNAL ANALYSIS
1.3.1. SMARTPHONES MARKET IN PORTUGAL
According to the International Data Corporation (IDC) European Mobile Phone Tracker,
in 2009, one year after the crisis, in the technological sector, 622 thousand smartphones
were sold in Portugal, representing a decrease of 28% when compared to the previous
year. For the European Research from IDC’s Mobile Phones Area, Francisco Jerónimo
(2010) “The Portuguese mobile phone market witnessed a drop never seen before in 2009.
The economic crisis has had a strong impact on demand in a market where penetration
rates above 100% show a clear saturation”.
Despite the crisis, as of 2010, the number of Portuguese with smartphones began to grow,
exponentially. In 2018, more than nine million Portuguese, living in Continental Portugal,
aged 10 or older, had a mobile, and most of them, a smartphone (Marktest, 2018). In fact,
according to Marktest Barómetro de Telecomunicações, in July 2018, close to 6.9 million
individuals had a smartphone, representing close to three-quarters of the total number of
mobile phone owners (See Appendix 8). The same entity states that this has been a
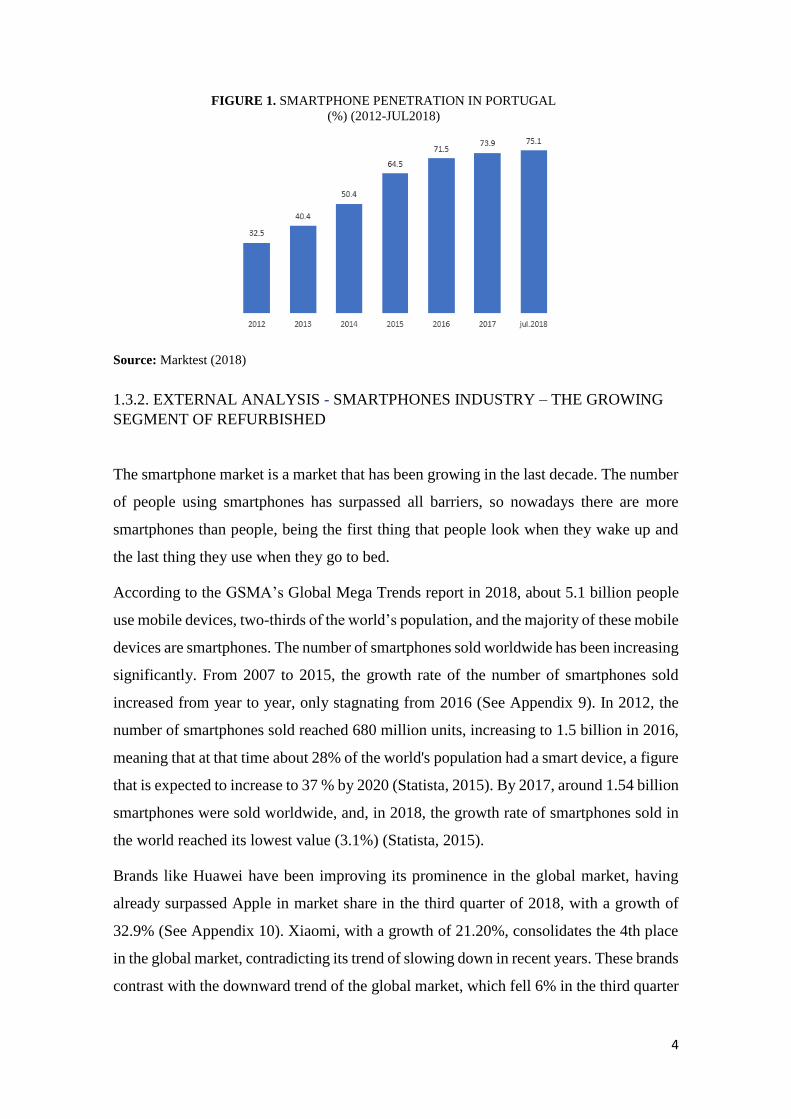
growing trend in Portugal over recent years, from 32.5% in 2012 to 75.1% in 2018, more
than doubled the number, registered five years earlier (See Figure 1).
4
1.3.2. EXTERNAL ANALYSIS - SMARTPHONES INDUSTRY – THE GROWING
SEGMENT OF REFURBISHED
The smartphone market is a market that has been growing in the last decade. The number
of people using smartphones has surpassed all barriers, so nowadays there are more
smartphones than people, being the first thing that people look when they wake up and
the last thing they use when they go to bed.
According to the GSMA’s Global Mega Trends report in 2018, about 5.1 billion people
use mobile devices, two-thirds of the world’s population, and the majority of these mobile
devices are smartphones. The number of smartphones sold worldwide has been increasing
significantly. From 2007 to 2015, the growth rate of the number of smartphones sold
increased from year to year, only stagnating from 2016 (See Appendix 9). In 2012, the
number of smartphones sold reached 680 million units, increasing to 1.5 billion in 2016,
meaning that at that time about 28% of the world's population had a smart device, a figure
that is expected to increase to 37 % by 2020 (Statista, 2015). By 2017, around 1.54 billion
smartphones were sold worldwide, and, in 2018, the growth rate of smartphones sold in
the world reached its lowest value (3.1%) (Statista, 2015).
Brands like Huawei have been improving its prominence in the global market, having
already surpassed Apple in market share in the third quarter of 2018, with a growth of
32.9% (See Appendix 10). Xiaomi, with a growth of 21.20%, consolidates the 4th place
in the global market, contradicting its trend of slowing down in recent years. These brands
contrast with the downward trend of the global market, which fell 6% in the third quarter
Source: Marktest (2018)
FIGURE 1. SMARTPHONE PENETRATION IN PORTUGAL
(%) (2012-JUL2018)

5
of 2017, the main reason being their substantially lower price in comparison to Apple and
Samsung (Counterpoint, 2017).
The decline in the global market in recent years is largely due to the growth of the market
for used and refurbished smartphones, which are sold at much lower prices than the new
ones. Due to the exorbitant prices of high-end smartphones, adding to the numerous
economic difficulties that families have been facing, the second-hand or refurbished
smartphone market has begun to rise another weight in the global market.
In 2016, Deloitte quantified the refurbished market in 17 billion USD$, with 120 million
units sold, at an average price of 140 USD$, representing a 50% appreciation over 2015.
In that year were sold 80 million smartphones, quantifying the market at 11 billion USD$.
According to the same entity, with its TMT Predictions 2016 Report, it was also predicted
that the growth rate of the used mobile phones market would be 4-5 times higher than the
general smartphone market.
By the end of 2017, the refurbished market was already worth 19 billion USD$ and,
according to the IDC (2018) forecast, this figure would rise year after year at a rate of
10%. For this weight, much contributed the US. In fact, by 2015, the US refurbished
market accounted for 18.7% of the entire second-hand smartphone market, with an
expected increase to 24.8% in 2020, according to Statista (2015) (Figure 2). That is, it is
predicted that in 2020, about 55 million used smartphones will be sold, only in this
country.
IDC (2018) also expects this industry will reach a 52.7 billion USD$ value in 2022,
representing an average selling price of 180 USD$, believing that this market may present
opportunities for revenue growth and market share, as second-tier devices become more
prepared to capture a larger share of the market, over the next few years.
While this segment has been growing, since 2016 the global smartphone market has been
stagnating, having grown only 3% in 2017, a number very far from the growth rates
obtained until then. After growing 28% in 2014, the number of smartphones shipments
grew only 10.5% in 2015 and 3.1% in 2016. For this, IDC (2018) has pointed out some
causes, such as the longer refresh cycles, the offer with regard to the repair by the
consumer which allows to increase the life of the smartphone (The Right-to-Repair
movement), and especially the “increased smartphone prices at the high end of the
spectrum that has led to many consumers holding on to their phones longer than

6
expected”, highlighted by Anthony Scarsella (2018), a research manager for IDC's
Mobile Phone program, making the option for reconditioned mobile phones more
attractive.
Reducing e-waste is another important favor factor of refurbished smartphones, allowing
the reuse of old smartphones and preventing the increasing number of e-waste. This is an
important point since the refurbished allows the reuse of smart devices that were
previously thrown away or placed in a drawer, thus reducing the amount of electronic
waste on the planet. In this way, second-hand devices can have a premium offer at
affordable prices and, at the same time, reduce electronic waste, contributing to a
sustainable environment and raising awareness of it.
The slowdown in the global smartphone sales in 2016 in giant markets such as Europe,
China or the US is mainly due to the saturation of high-end models, mostly iPhones and
Samsung Galaxy's, leading major brands to adopt new strategies, now in emerging
countries such as India, South Africa or Nigeria, and also starting to sell used mobile
phones, such as Samsung, responding to its decline in their mobile market share. In
Appendix 11, the difference in the growth rate of this market between 2016 and 2017 in
the main markets can be verified. Only in India, according to the Counterpoint
Technology Market Research (2017), the refurbished segment grew close to 25% in 2017,
representing 12 million smartphones sold, mostly Apple and Samsung. As stated by the
same entity (2017), India is among the fastest growing markets in this segment, along
with Africa and Southeast Asia (See Appendix 12).
Source: Statista (2015)
FIGURE 2. MARKET SHARE OF USED SMARTPHONES (%)
WORLDWIDE FROM 2015 TO 2020

7
In 2017, the refurbished segment was even the fastest growing in the global smartphone
market. According to the Counterpoint's Refurbished Smartphone tracker report (2017),
the refurbished smartphones market value grew by 13% in 2017, selling 140 million units,
contrasting with the growth rate of 3% of the global market (See Appendix 13). Already
in 2018, the refurbished segment grew 10% in the second quarter, contrasting with the
declining growth rate of 1% in the global market, in the same period. According to the
same organization, the weight of top brands such as Apple and Samsung, compared to
other brands is even more visible in this segment, totalling three-quarters of the entire
refurbished market and 80% of the total revenue.
1.3.3. THE COMPETITIVE SITUATION
The refurbished smartphone market in Portugal is characterized by being slightly recent
in terms of its longevity, and by having two types of companies: big players with history
in the electronic gadgets industry, such as Worten, Fnac, Radio Popular and The Phone
House; small companies focusing only on second-hand gadgets, such as smartphones,
laptops, smartwatches, tablets, promising high-end technology at an affordable price.
In 2016, along with the Forall Phones appearance, other similar companies arrived at the
national level, offering refurbished smartphones, in some street stores in Porto and
Lisbon. However, these stores did not bring what Forall wanted to bring to the market, an
online presence and a brand that supports the lifestyle and the needs of the consumer.
Once created, in 2016, several electronic retailers operating in Portugal, such as Worten,
Fnac and The Phone House, realizing the value of this market, which grew 13% in that
year (Counterpoint, 2017), and the high margins practiced in this segment, they decided
to move on in this market, pressing Forall. These brands with a sustained position in the
electronic market, have taken advantage of the segment growth, selling second-hand
products such as smartphones, by Apple and Samsung, at much lower prices than the new
mobile phones average. Table 1, provided by Forall Phones, presents the pricing
positioning of the main market players, based on the KuantoKusta price comparison
platform, comparing Forall’s products prices with other competitors, subdivided into
three different categories, usually defined by the brands, according to the smartphone
state, being: A – very good condition, B – good condition, and C – reasonable.

8
IServices, which is specialized in device repairs, also recently started selling refurbished
iPhones, and The Phone House are Forall Phones’ main competitors.
IServices was born in 2011 and is the market leader in Portugal in smartphone repair
services. It specializes in mobile products and technologies, composed by a highly
qualified team. Today it is present from the north to the south of the country, having
physical stores in Braga, Porto, Coimbra, Lisbon, Cascais, Setúbal, Faro and Funchal and
a huge variety of products that can be bought in the digital store or in the physical stores
(new and refurbished top-of-the-range smartphones, protectors screens, headphones,
power banks, speakers and drones) and a good customer support services. Multi-brand
device repair is performed on time regardless of where the equipment is purchased.
The Phone House Portugal is the Forall’s competitor with more history and relevance in
the Portuguese market. It is a telecommunications retailer with about 100 multi-operator
stores. They arrived in the Portuguese market in 1999 and aims to offer the best offer of
telecommunications and multimedia solutions, covering all brands and operators,
achieving a good position in the market. They focus on the smartphone market and
operator services, with integrated solutions for personal, residential and business
customers. They entered in the refurbished segment, selling smartphones (iPhone and
Samsung Galaxy), iPad Tablets and Apple Smartwatches, selling them online and at
physical stores.
Source: Forall Phones (2019)
TABLE 1. PRICING POSITIONING ANALYSIS

9
P-Telemoveis, 12Vinte, and iMobiles have also a good position on the segment, in
Portugal. P-Telemoveis was created in 2005 in Leiria, selling smartphones, accessories,
and providing technical assistance in the repair of technological products and appliances.
Now, it has three stores in the district of Leiria and an online store. This company stands
out for its speed and assertiveness, being the repair of the equipment the core of the
business, promising repairs within a maximum term of five days. In addition to
smartphones, the company invests in qualified technicians who can repair almost all types
of electronic devices, from GPS, home appliances or computers, as well as consoles or
mobile phones. In their online store, they sell everything, from mobile phone covers to
top-of-the-range smartphones, as well as refurbished and used equipment such as Apple
computers.
12vinte is a used and refurbished equipment store, selling only Samsung and Apple
smartphones, MacBook notebooks and Apple smartwatches. Unlike P-Telemóveis,
12vinte has no repair business and only sells in their online store, not having any physical
store. In addition to second-hand handsets, it also sells mobile phone accessories such as
protective covers or tempered glass films.
iMobiles Outlet Portugal is a company that is especially focused on refurbished and semi-
new products, mainly Apple, at an outlet price, online. The company has its office in
Marinha Grande and sells its equipments (smartphones, iPad, and MacBook) on its
website. The distribution is made through Chronopost or CTT services, with prepayment
and collection. iMobiles also provides a repair service for its own products and sells
accessories for smartphones, such as smartphone and iPad chargers, headphones or screen
protectors.
At the European level, the German ReBuy stands out from the others, claiming to be
Europe’s largest recommerce site for electronic goods. This company buys second-hand
products, such as electronics and watches, from 10 product categories, inspects them and
sells them through its website or through marketplaces such as Amazon, eBay or
Gebraucht.de. Founded in 2004, the company is present in Germany, Austria, France, and
the Netherlands, through an online store.

10
1.4. FORALL PHONES – INTERNAL ANALYSIS
1.4.1. BUSINESS IDEA AND HISTORY
Created by José Costa Rodrigues, the company’s current CEO, at the end of 2015, the
Forall Phones brand was born from the desire of the creator to have a top-of-the-line
phone, at that time an iPhone 4S, by all means, costing around 500€, when he was only
16 years old. Due to the smartphone high price, José’s parents refused to pay for it because
of the economic situation of the family at the time. At that moment there was a click, and
José created the business that Forall Phones is, a Portuguese start-up that, in 2018, sold
approximately 4.2 million €. At the time, the 16-year-old decided to sell some belongings,
such as books or video games that he did not need anymore, gathering the money to buy
the so much desired iPhone. Through OLX Marketplace, the young entrepreneur achieved
his goal by buying a second-hand mobile phone. Realizing that it was so easy to achieve
his purchase goal, he decided to sell the phone a month later, still making a profit. It was
here that José saw a business opportunity of buying and selling used smartphones,
creating the Forall Phones, five years later, with only 300€ and without external support.
Before the official registration of the brand, by the end of 2015, José had already decided
to create a network of ambassadors (community shapers), selling smartphones in his high
school through influential friends. Through them, it was possible to share some photos
and descriptions of the products, also earning a commission with every sale made. In just
three months, he made 70.000€. This ambassadors program remains today, focusing on
young university students, the main Forall’s target, young people between 18 and 35
years.
The brand name is quite suggestive: “For all phones”, illustrating the idea that it is
possible for everyone to have a high-quality smartphone, making high-end technology
accessible to everyone.
In the first year, the firm generated 350.000€, just through word-of-mouth and, later,
through an online site. In fact, what at the time seemed to be a simple desire to have a
top-of-the-line mobile phone, had become a profitable business, currently with 61 full-
time employees, 55 in Portugal, five in Spain, and one in China, selling to 16 countries in
Europe (through marketplaces such as Amazon, Backmarket, Allegro, Refurbed and C-
Discount), with six physical stores in Portugal, three stores in Spain, and with the strategic
vision to open 13 stores in Spain by the end of 2019, forming a business that grows

11
annually 757% since 2015. The business of Forall Phones seems simple: sell high-level
refurbished or used smartphones, from Apple and Samsung, at a price up to less than 40
% to the one practiced in the market. In fact, in some smartphones, Forall is really the
market player, in Portugal, practicing the lowest or the second lowest price in the market,
as can be seen in the cases of the iPhone 7 32G and the iPhone X 64G (See Appendix 14).
Keeping the machine well-tuned, supported by young people, is a constant learning
challenge by a company that aims to reach 20 million € in sales by the end of 2019.
Because of that, the company is increasing its team and has sought to recruit people with
more experience for strategic positions.
Actually, the firm aims not only to be number one in Portugal in the refurbished
smartphone industry in the coming years but also in other countries. In the words of
Bernardo Carreiro, Forall’s Financial Controller: “Our goal in terms of positioning is to
be able to have a brand recognized for its youthfulness, adaptability and, more important,
its high awareness as an integral part of a society, both by the mission itself, as well as
the constant awareness of factors such as social responsibility, environmental concerning
and circular economy. We wish that, in a few years’ time, all Europe (who knows, the
world) might know our brand by the very potentiality of its name. We want to be
distinguished for being “for all” – again, on all the issues involving employees, clients,
and any other stakeholder”.
The next steps are to cross the borders, opening stores in Spain and in central Europe, in
order to invest in the Polish market. The idea is to keep the center of the operation in
Lisbon, but the brand also has an office in Madrid, with a full-time team.
The first store opened in October 2017 in Alvalade (Lisbon), and since then, eight more
stores have opened, five in Portugal and three in Spain: Porto (May 2018), Leiria
(November 2018), Coimbra (November 2018), Setúbal (February 2019), Madrid
(February 2019), downtown Lisbon (March 2019), Salamanca (March 2019), and
Barcelona (April 2019). The brand continues to grow, and it is expected that they will
open 13 stores in Spain by the end of 2019. At the national level, the brand intends to
have 10 physical stores by the end of 2019.
1.4.2. OPERATING MODEL AND PRODUCTS
Forall Phones only sells used smartphones, from Apple and Samsung, short-lived or that
were used for display in stores. Appendix 15 presents some of the available products on

12
the brand’s website. The firm buys used smartphones from large retailers, businesses,
private individuals, and telephone operating companies who have used the mobile phones
as a display in their stores, reselling them to the public, as new ones, in their own stores
or on their website and marketplaces. Because the smartphones are on display, they can
no longer be sold at a new mobile phone price.
For Forall’s financial department, the brand business model is the key to the business.
The value chain starts with the purchasing function (99.5% directly with suppliers and
0.5% with customer returns). The suppliers are, in great majority, foreign entities that
suppress the procurement phase. In other words, for brands like Apple and Samsung,
Forall works with entities that already collect thousands of smartphones from
retailers/operators and then they distribute to companies like them. At the moment, the
brand is also working to launch itself on the B2B channel, through vertical integration,
allowing to add this function to its value chain, in order to achieve higher and better
margins.
After receiving the smartphones, they go through a reconditioning process (within the
company) and are later released to the market as the final product.
In addition to smartphones, the company also sells iPad (Apple tablet) and smartphones
accessories, such as protective covers, tempered glass, chargers, power banks, and has a
specialized repair and assistance service. Forall’s control department reviews the
incoming phones and professionally refurbishes them to ensure maximum functionality
and quality. Refurbished phones are sold up to less than 40% of the original price. On the
website, the customer orders the smartphone and receives it within five working days.
Customers can pay by credit card, PayPal, bank transfer or collect on delivery. Each
smartphone has a one-year warranty and can be returned within 14 days (See Appendix
16).
1.4.3. TARGET MARKET
Forall’s main target is young people between 18 and 35 years. Although this is the most
profitable brand target, they believe that there are customers “of all ages”. With more than
300 active ambassadors, José Rodrigues wants to reach out to all Portuguese universities,
investing in direct contact with the consumer that they want to attract and maintain.

13
The main target is characterized as a young population, with little to no annual income,
mainly students, and so their purchasing power is reduced, and many of them are still
depending on their parents. Belonging to Millennials and Generation Z, they are highly
digital and want the latest technology at their fingertips. Today, young people want to be
at the forefront of technology and for them, using an iPhone, for instance, is a social status
need, since they have a very expensive and stylish device, not within everyone’s reach.
In 2014, the International Business Times reported that clothing retail has been surpassed
by gadgets as a social status symbol, emphasizing that clothes might “make the man but
an iPhone makes a teenager”. In Stephanie Wissink’s opinion, senior research analyst at
Piper Jaffray, when young people go shopping, they look for gadgets instead of clothing,
looking for devices of popularity rather than utility. Marcia Flicker, associate professor
in Business Enterprise at Fordham University, reports that technology is making
competition increasingly stronger for teens and young adults, asking when brands like
Apple will release new models to the market because they refuse to be stuck with a
previous slower model.
As technology advances, prices increase, so it is hard to have premium technology at its
market price. This way, the second-hand products offer from Forall Phones intends to
attract this target population, who has little income and who worries about their image
and reputation. That is why the company’s offer is limited to top-of-the-range brands such
as Apple and Samsung.
Despite the start-up’s main revenue source being directly linked to physical stores, digital
has played a significant role in the brand image nowadays, since its communication is
almost exclusively digital, through social networks or digital advertising.
1.5. MARKETING AT FORALL PHONES
1.5.1. E-COMMERCE VS PHYSICAL STORES
Forall Phones engage with its consumers through multiple channels and one of its
competitive advantages is its after-sales service, making the service as personal as
possible in a customer-centric approach. Despite the number of physical stores (nine at
the moment, with the goal of open 10 in Portugal and 13 in Spain until the end of 2019),
the Forall Phones’ business would not have the success that it has today if they hadn’t
invested in digital marketing. In fact, given the store’s location (see Appendix 17), not
being close to high traffic centers, such as historical areas or shopping centers, there are
14
not many occasional buyers, except in the downtown Lisbon store. That is to say, that the
people that go to the store already know what they want and already are aware of the
brand, either because they were bombarded with online ads or through word-of-mouth,
which is pointed out by the CFO of Forall, Manuel Castel-Branco, as a sales booster at
this stage.
The physical stores’ investment approach is due to several factors: firstly, the profile of
the Portuguese population, who, unlike other European societies, still has a great need to
see products before buying them. In general, the Portuguese like to try the product and
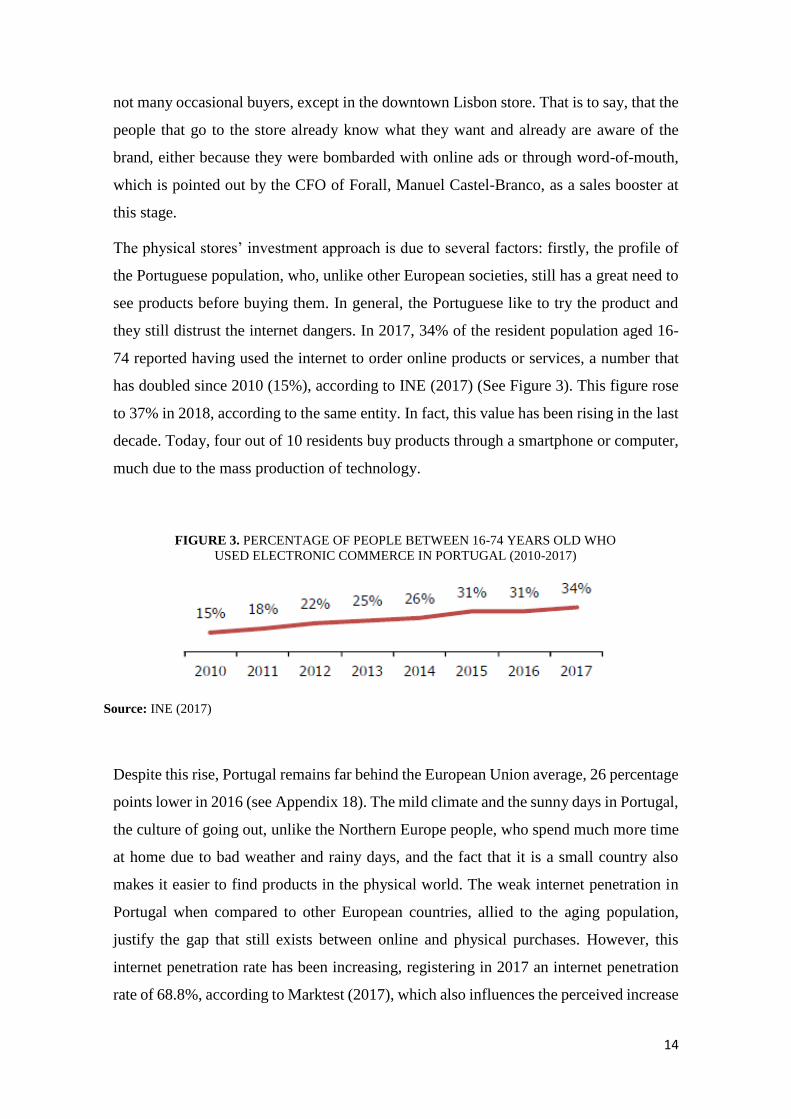
they still distrust the internet dangers. In 2017, 34% of the resident population aged 16-
74 reported having used the internet to order online products or services, a number that
has doubled since 2010 (15%), according to INE (2017) (See Figure 3). This figure rose
to 37% in 2018, according to the same entity. In fact, this value has been rising in the last
decade. Today, four out of 10 residents buy products through a smartphone or computer,
much due to the mass production of technology.
Despite this rise, Portugal remains far behind the European Union average, 26 percentage
points lower in 2016 (see Appendix 18). The mild climate and the sunny days in Portugal,
the culture of going out, unlike the Northern Europe people, who spend much more time
at home due to bad weather and rainy days, and the fact that it is a small country also
makes it easier to find products in the physical world. The weak internet penetration in
Portugal when compared to other European countries, allied to the aging population,
justify the gap that still exists between online and physical purchases. However, this
internet penetration rate has been increasing, registering in 2017 an internet penetration
rate of 68.8%, according to Marktest (2017), which also influences the perceived increase
Source: INE (2017)
FIGURE 3. PERCENTAGE OF PEOPLE BETWEEN 16-74 YEARS OLD WHO
USED ELECTRONIC COMMERCE IN PORTUGAL (2010-2017)

15
of online purchases, previously mentioned (see Appendix 19). In addition to the
characteristics intrinsic to the Portuguese, the product presented by Forall Phones may
sometimes lead to consumer’s distrust. Since the product Forall sells is a refurbished and
not a new phone, the buyer will want to check the smartphone state to corroborate if it is
in great condition.
Forall stores have some common traits (except the downtown Lisbon store): they try to
give continuity to the online customer experience. They are typically small spaces that
end up acting almost as pick-up points but, at the same time, they allow the customer to
have greater confidence in the brand since it has, effectively, a physical space where they
can turn if necessary.
It is important, then, to distinguish the three main direct sales channels to the consumer:
the brand website, the marketplaces (including Amazon) and the physical stores.
However, at Forall Phones, digital and physical channels are not seen as separate and
independent entities. In fact, the brand does not consider itself as a retailer with e-
commerce, but an e-commerce with physical stores/collection points. Physical stores
sales far exceed online sales, including marketplaces and website, but this figure is the
result of Forall’s online excellence and the community shapers performance. In addition,
online marketing allows taking a performance approach to sales scalability. The
distinction between online and offline in this case becomes even more complicated due
to the brand’s business model. Since it is possible to order a smartphone online and picked
it up at the store or ordered it online and get it delivered at home, which makes it almost
impossible to allocate the sale to an independent online or offline marketing effort. This
is why Forall Phones does not break sales into separate compartments, since the buyer
that gets a smartphone in the store might have bought it because he saw an ad on
Facebook, which is an online effort, for example.
Nevertheless, digital channels have been fundamental in the firm’s evolution and
development, since its creation in 2015. Between September and December 2018, where
all the sales channels began to be accounted, Forall sold 20-29% through its website, and
up to almost 12%, over the same period, through marketplaces. Appendix 20 gives the
detailed sales percentages and the number of smartphones sold, per online channel (from
the website in Portugal and in the EU, Amazon, and other marketplaces) and per physical
stores, in the referred months.

16
Despite the hard task separating, in a quantitative way, what is affected to offline and
online, concerning the sale, the digital channels in Forall Phones have a preponderant role
regarding communication, according to José Alves. He believes that the large percentage
of people who go to a Forall physical store, to buy or repair their smartphone, is because
they are aware of the brand, mainly due to any social media promotional campaign, some
Facebook, Instagram or Google ad, or by means of some influencer or shaper. To do this,
the brand’s investment in Search Engine Marketing has been essential for ads highlighting
in search engines, ensuring that consumers find them when searching for semi-used or
refurbished phones. Forall’s SEM strategy was even highlighted as the key to the Black
Friday online campaign, in November 2018, being the best month regarding direct
website sales and return (including all advertising costs).
Due to the weight that mobile use has in online sales, representing about 70%, the brand
also uses Geotargeting that, through the smartphone’s location, can notify the consumer
when he/she is close to a physical store, the information being provided by Google and
Facebook. Hence, this is also why these synergies between offline and online cannot be
split in half, and should not be viewed independently, since one channel influences the
other and vice versa. It should be noted that the brand does not distinguish digital
marketing from marketing, since almost every used marketing tools are digital marketing
tools, and, in José Alves’ words, he believes that “Today, marketing is digital marketing”.
The brand has a strong presence on Facebook, Instagram, Youtube and Linkedin. The
first three serve primarily to engage with consumers and create awareness, to generate
leads, advertising ads and doing cross-sell and up-sell to repeat customers and do
remarketing. It is also here that new products, brand news, discounts, and brand-specific
campaigns are disseminated through videos or images. Linkedin is essentially to
communicate job opportunities and, through Forall Family’s page, promote branded
social activities, as well as attract new students to its shapers’ ambassador program.
In addition to these channels, the brand also uses heavily e-mail marketing, SMS
marketing and Google (through Google shopping, display advertising, paid and organic
search). Appendix 21 identifies all the digital marketing tools used, as well as their
importance to the business and its function. The brand essentially uses all possible digital
channels, with different goals, throughout the conversion funnel. This conversion funnel
is the representation of the steps that a potential customer passes from the first contact

17
with Forall (awareness) to the conversion itself (that can be the final purchase or a lead
generation).
Despite the importance of the brand's website as an e-commerce channel, its main source
of revenue results from physical stores. Between September and December 2018, the sale
stores weight was always over 60%. Figure 4 discriminates the number of smartphones
sold in stores and through e-commerce, between September and December 2018, not
counting sales through Community Shapers. It should be noted that at the end of 2018,
gross sales totalled approximately 4.2 million €.
1.5.2. FORALL FAMILY
With 330 active shapers, 280 university students in Portugal and 50 in Spain, Forall
Phones want to reach to all universities in Portugal and Spain, investing in direct contact
with the consumer (January 2019). The brand is now also working on a pilot project,
Forall Schools, with 10 high school shapers.
The community shapers or ambassadors are the links between the consumer and the
product they want to purchase: smartphones, accessories, and repairs. Hence, Forall
Family is a social network created around the university student, the main target of the
brand, with the goal of achieving all Portuguese young people. The shaper’s role is to
disseminate the product to his/her network, through word-of-mouth or via social media.
The shaper has associated a unique and impersonal promo code that works as a driver of
a future sale, through a discount granted to those who use it, who would not have it
without being in touch with the shaper. In other words, each ambassador, when promoting
Source: Forall Phones (2018)
FIGURE 4. ONLINE AND STORE SMARTPHONE SALES UNITS (SEP-DEC 2018)

18
a Forall product to his/her contacts, will increase the chance to create a future sale through
his/her promo. Those who buy a Forall product through a shaper promo code will get a
discount on the product they are buying, either on the website or at a Forall Phones
physical store, also granting the promo holder a value of 10€. In short, both the shaper
and the consumer win, a win-win relationship that has brought revenue to Forall Phones
and its consumers. 1100 smartphones were sold only through shapers, representing
143.000 €, in Portugal and Spain (by January 2019).
1.5.3. IMPORTANCE OF THE MARKETING DEPARTMENT AT FORALL
As previously noted, the marketing function performed at Forall Phones is critical to the
business. The marketing department is one of the most structured departments of the
company, with three distinct areas: performance, brand (including those who are
responsible for design, communication, store decoration, etc.) and community
(encompassing those who are responsible for the community management). The
organization chart, in Figure 5, discriminates all the positions covered in this department.
It is important to note that, operationally, Forall Phones’ structure is highly horizontal and
there is a lot of involvement of the people of different teams in the marketing strategy
definition.
The marketing department is structured and focused on digital. In fact, in terms of
communication campaigns, it is noteworthy the successive efforts in digital marketing,
with paid ads in search engines and Facebook Ads. This is mainly due to the cost-
effectiveness that online marketing offers, compared to traditional advertising, on TV,
print or radio. Other identified advantages are related to the real-time feedback that online
provides, through platforms such as Google Analytics, which allow taking corrective
actions according to the strategy of each advertisement. That is, if an ad is not having the
FIGURE 5. FORALL PHONE’S MARKETING DEPARTMENT CHART
Source: Forall Phones (2019)

19
desired profitability, through real-time data, it is possible to adjust the strategy and
thereby solve the problem. As a matter of fact, almost all of Forall’s marketing efforts are
related to online and to the ambassador’s network, mentioned above.
All digital marketing brand’s actions are segmented into three different types of clients.
It is through this segmentation that the department channels all its efforts and it is defined
all the marketing strategy, varying from the marketing budget division among all actions.
The brand subdivides the customers into: prospecting customers (people who are not
aware of the brand, not being leads yet, not liking the Facebook or Instagram page, never
looked up the brand, never visited its website, etc.); retargeting (people who have
interacted with the brand but have not bought its products); buyers (brand consumers).
From here, the department splits the budget by each type of client: X% to attract new
clients; Y% for people who know the brand but never bought its products; Z% for cross-
selling or up-selling (encouraging the purchase of a smartphone accessory, for example)
of branded consumers. Through this, it is possible to have a sustainable basis for the entire
digital marketing strategy.
The next step is the goal setting. At Forall Phones, the goal is always to increase the
profitability, at the sales level, of each action. Therefore, by clearly defining the target
audiences, it is possible to delineate how much should desirably be spent on each type of
client and, through this, communicate in a targeted manner to each one of them.
The Figure 6, provided by Forall, summarizes the most important online marketing
platforms for the brand, with three main goals: to create a long-term relationship with the
consumer; to take action by measuring the performance of digital marketing; and to
increase the customer lifetime value through brand loyalty fostering.
Source: Forall Phones (2019)
FIGURE 6. FORALL PHONE’S DIGITAL MARKETING ECOSYSTEM

20
Forall Phones’ finance department monthly defines and updates the marketing budget.
According to the CFO, Manuel Castel-Branco, and the Financial Controller, Bernardo
Carreiro, responsible for the budgeting definition for each channel, the marketing
department is the one that has a more controlled budget level and cannot be compared to
other departments. After the purchasing department, marketing is the department with the
highest budget and value. This budget is also expected to be increased, since it is defined
as a percentage of the firm’s sales, and the sales have been increasing since 2015.
Within the marketing budget, the communication channels where the firm most invests
are social media, search engine marketing, brand makers (influencers), and brand shapers.
Table 2 illustrates the investment weights in each marketing channel, in the last months
of 2018. Google, Facebook, and community shapers represent the three main channels in
terms of marketing investment. It is important to note the weight of Mobile in online
sales. According to José Alves, most consumers order their mobile phone on their
smartphone, at a ratio of 70/30 to the laptop.
The marketing department is of great importance to the business since it provides
decision-making inputs. Because of its importance, there are some goals that should be
achieved, but José Alves affirms that all the pressure he feels to achieve results is due to
his ambitious and result-oriented character, not feeling any extra pressure from either the
CEO or other departments.
Source: Forall Phones (2018)
TABLE 2. FORALL PHONE’S MARKETING INVESTMENT BY CHANNEL
AND COST PER ACQUISITION BY SALE (€) (SEP-DEC 2018)

21
1.6. DIGITAL MARKETING PERFORMANCE MEASUREMENT
1.6.1. BEST PRACTICES IN DIGITAL MARKETING PERFORMANCE
MEASUREMENT
1.6.1.1. THE IMPORTANCE OF MEASUREMENT
In 2016, AdAge published an article that stressed the five Chief Marketing Officer (CMO)
today’s priorities, where two of them had a relation to marketing performance
measurement. The first was measurement and, as highlighted by the article, for it to be
effective, firms should be able to measure the marketing’s impact on business results. The
second was the need to better justify marketing investments. An article by Chief
Marketing (2016) has also identified the six trends of marketing for 2017, and three of
them included marketing measurement. In addition, Forbes (2017) emphasized the
importance of measuring marketing performance. In Laura Patterson’s words (2017),
president and founder of Vision Edge Marketing (VEM), “For today’s marketers, the
challenge really isn’t measurement; there is an abundance of metrics. The challenge is
measuring marketing’s value and performance”.
The Chief Marketing Officer (CMO) Council found that 80% of the CMOs surveyed were
not satisfied with their capability to measure marketing performance (CMO Council,
2009 as cited in Liang, Gao & Ding, 2018).
Despite the rising interest around measuring the effectiveness of marketing activities, few
studies were dedicated to what really drives managerial use of marketing and financial
metrics (Mintz & Currim, 2013). In a special report conducted by American Marketing
Association (AMA) (2015), the results from the CMO Survey in 2014 revealed that only
15% of CMOs were being able to show the impact of social media on business (AMA,
2015). More than six in 10 CMOs affirm that ROI on marketing spending will be the most
important measure of their success and demonstrating a ROI for marketing initiatives is
considered one of the CMO’s task on the to do list (IBM Global CMO Study, 2018). In
fact, an online study of digital marketers developed by Adobe (2013) revealed that 76%
of respondents believed measuring marketing performance was important, but only 29%
felt that they were doing it well (Lopresti, 2014). Accenture’s Insight Driven Marketing
report, a 2001 survey of 175 marketing executives in the United States and the United
Kingdom, reveals that 68% reported having difficulty measuring the ROI of their
marketing campaigns (Lenskold, 2002).

22
For two decades, VEM has been conducting a Marketing Performance Management
(MPM) survey of leaders over a variety of industries. In spite of the focus on data-driven
results, VEM’s studies revealed limited progress regarding marketing performance
measurement efficiency by companies. In 2016, 10% of 446 firms assessed their
marketing organizations as completely ineffective in measuring marketing’s
performance, in comparison to 12% who answered completely effective. For example,
the VEM’s 2010 annual MPM study found that less than half of over 400 companies were
able to establish a clear link, or alignment, between their organizations’ marketing
programs and business outcomes. The value of marketing to their senior management
teams was even lower, underlining the lack of accountability (VEM, 2010).
One of the problems is that many performance metrics of marketing are subjective, such
as attitudes, perceptions, and behaviours of customers. Despite their importance, they are
quite hard to measure in an accurate way and their link with financial or business
outcomes is weak, making it difficult to demonstrate the value of marketing for managers
(Fu, Philips & Philips, 2018). Using large amounts of data is another challenge for
marketers. In spite of this, they are actively pursuing it, in order to improve efficiency
and make strategic decisions.
One-third of marketing organizations should enhance their ability to use data. Data only
has a meaning if it is relevant and can be used to lead to business decisions (VEM, 2017).
For example, despite U.S. corporations spending over 300 billion USD$, each year on
marketing and sales, the resulting benefit is still difficult to evaluate. Hence, the big
challenge for marketers is how to demonstrate value created by marketing programs (Fu
et al., 2018).
1.6.1.2. THE “RIGHT” METRICS
According to Celeste and Moniz (2019), a metric should reveal the strategy firm’s
execution, its health, the potential of its markets, the customer dynamics, and should give
insight for new strategic directions. One of the first pioneers in the area of MPM and the
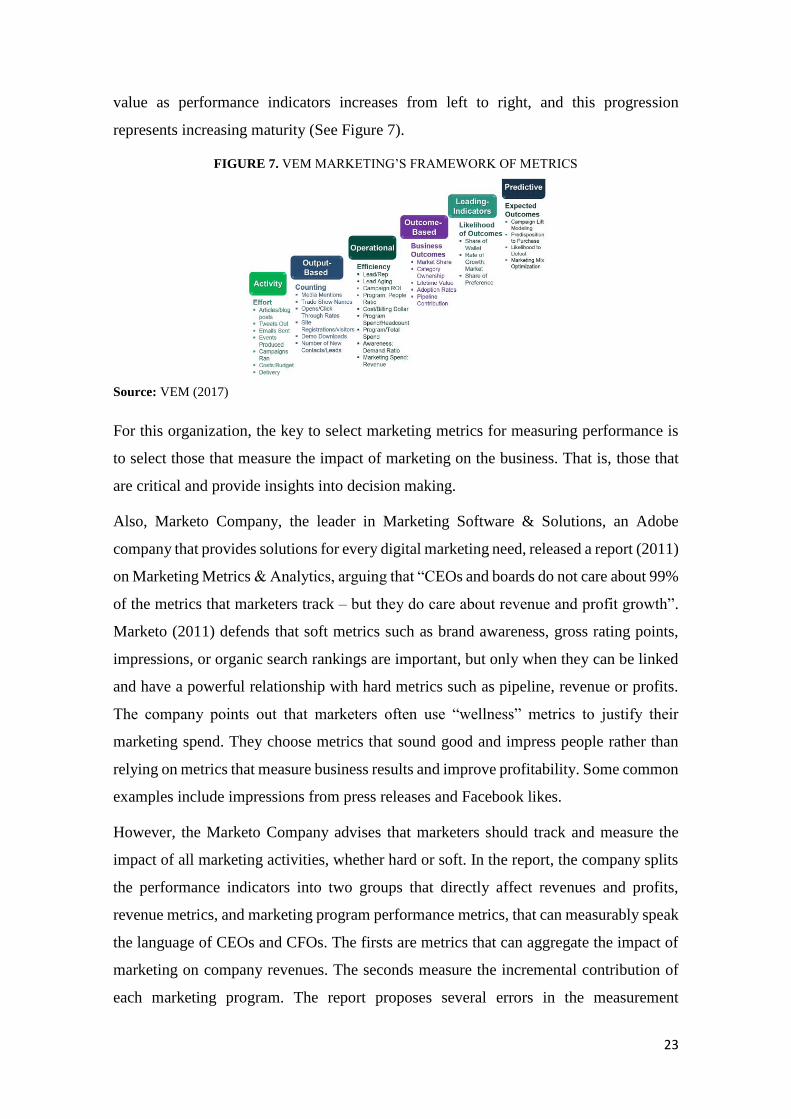
leader in Marketing Measurement & Performance Management, VEM (2017) provides a
measuring framework breaking down the metric in six categories: activity, output-based,
operational, outcome-based, leading indicators and predictive, describing the relationship
and hierarchy of these marketing metrics. Despite each metric category has its value, their
23
value as performance indicators increases from left to right, and this progression
represents increasing maturity (See Figure 7).
For this organization, the key to select marketing metrics for measuring performance is
to select those that measure the impact of marketing on the business. That is, those that
are critical and provide insights into decision making.
Also, Marketo Company, the leader in Marketing Software & Solutions, an Adobe
company that provides solutions for every digital marketing need, released a report (2011)
on Marketing Metrics & Analytics, arguing that “CEOs and boards do not care about 99%
of the metrics that marketers track – but they do care about revenue and profit growth”.
Marketo (2011) defends that soft metrics such as brand awareness, gross rating points,
impressions, or organic search rankings are important, but only when they can be linked
and have a powerful relationship with hard metrics such as pipeline, revenue or profits.
The company points out that marketers often use “wellness” metrics to justify their
marketing spend. They choose metrics that sound good and impress people rather than
relying on metrics that measure business results and improve profitability. Some common
examples include impressions from press releases and Facebook likes.
However, the Marketo Company advises that marketers should track and measure the
impact of all marketing activities, whether hard or soft. In the report, the company splits
the performance indicators into two groups that directly affect revenues and profits,
revenue metrics, and marketing program performance metrics, that can measurably speak
the language of CEOs and CFOs. The firsts are metrics that can aggregate the impact of
marketing on company revenues. The seconds measure the incremental contribution of
each marketing program. The report proposes several errors in the measurement
Source: VEM (2017)
FIGURE 7. VEM MARKETING’S FRAMEWORK OF METRICS
24
performed by marketers, suggesting that the metrics that measure activity, cost, and
quantity are not ideal, but rather they all represent interest to CFOs: revenue, margin,
profit, cash flow, ROI, shareholder value, that is, metrics that are able to show profit and
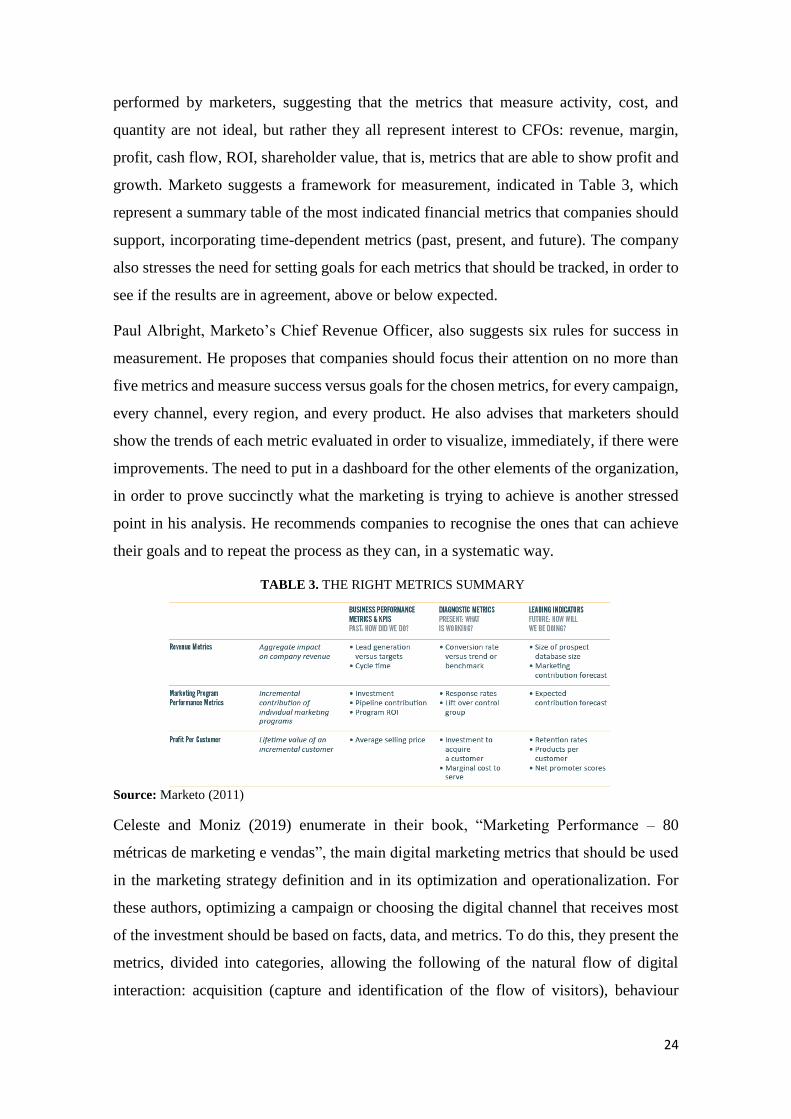
growth. Marketo suggests a framework for measurement, indicated in Table 3, which
represent a summary table of the most indicated financial metrics that companies should
support, incorporating time-dependent metrics (past, present, and future). The company
also stresses the need for setting goals for each metrics that should be tracked, in order to
see if the results are in agreement, above or below expected.
Paul Albright, Marketo’s Chief Revenue Officer, also suggests six rules for success in
measurement. He proposes that companies should focus their attention on no more than
five metrics and measure success versus goals for the chosen metrics, for every campaign,
every channel, every region, and every product. He also advises that marketers should
show the trends of each metric evaluated in order to visualize, immediately, if there were
improvements. The need to put in a dashboard for the other elements of the organization,
in order to prove succinctly what the marketing is trying to achieve is another stressed
point in his analysis. He recommends companies to recognise the ones that can achieve
their goals and to repeat the process as they can, in a systematic way.
Celeste and Moniz (2019) enumerate in their book, “Marketing Performance – 80
métricas de marketing e vendas”, the main digital marketing metrics that should be used
in the marketing strategy definition and in its optimization and operationalization. For
these authors, optimizing a campaign or choosing the digital channel that receives most
of the investment should be based on facts, data, and metrics. To do this, they present the
metrics, divided into categories, allowing the following of the natural flow of digital
interaction: acquisition (capture and identification of the flow of visitors), behaviour
Source: Marketo (2011)
TABLE 3. THE RIGHT METRICS SUMMARY
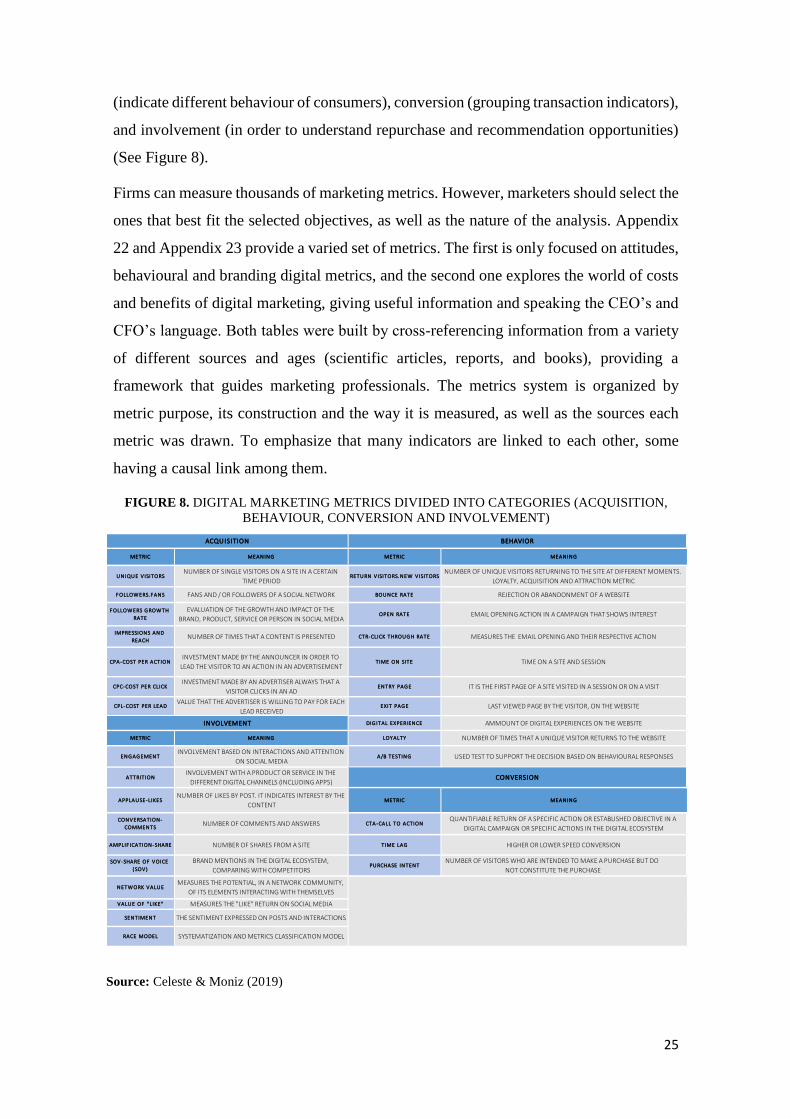
25
(indicate different behaviour of consumers), conversion (grouping transaction indicators),
and involvement (in order to understand repurchase and recommendation opportunities)
(See Figure 8).
Firms can measure thousands of marketing metrics. However, marketers should select the
ones that best fit the selected objectives, as well as the nature of the analysis. Appendix
22 and Appendix 23 provide a varied set of metrics. The first is only focused on attitudes,
behavioural and branding digital metrics, and the second one explores the world of costs
and benefits of digital marketing, giving useful information and speaking the CEO’s and
CFO’s language. Both tables were built by cross-referencing information from a variety
of different sources and ages (scientific articles, reports, and books), providing a
framework that guides marketing professionals. The metrics system is organized by
metric purpose, its construction and the way it is measured, as well as the sources each
metric was drawn. To emphasize that many indicators are linked to each other, some
having a causal link among them.
FIGURE 8. DIGITAL MARKETING METRICS DIVIDED INTO CATEGORIES (ACQUISITION,
BEHAVIOUR, CONVERSION AND INVOLVEMENT)
Source: Celeste & Moniz (2019)
PURCHASE INTENT
QUANTIFIABLE RETURN OF A SPECIFIC ACTION OR ESTABLISHED OBJECTIVE IN A
DIGITAL CAMPAIGN OR SPECIFIC ACTIONS IN THE DIGITAL ECOSYSTEM
NUMBER OF VISITORS WHO ARE INTENDED TO MAKE A PURCHASE BUT DO
NOT CONSTITUTE THE PURCHASE
CONVERSION
METRIC MEANING
HIGHER OR LOWER SPEED CONVERSION
CTA-CALL TO ACTION
TIME LAG
APPLAUSE-LIKES
CONVERSATION-
COMMENTS
INVOLVEMENT
INVOLVEMENT BASED ON INTERACTIONS AND ATTENTION
ON SOCIAL MEDIA
INVOLVEMENT WITH A PRODUCT OR SERVICE IN THE
DIFFERENT DIGITAL CHANNELS (INCLUDING APPS)
NUMBER OF LIKES BY POST. IT INDICATES INTEREST BY THE
CONTENT
NUMBER OF COMMENTS AND ANSWERS
DIG ITAL EXPERIENCE AMMOUNT OF DIGITAL EXPERIENCES ON THE WEBSITE
LOY ALTY NUMBER OF TIMES THAT A UNIQUE VISITOR RETURNS TO THE WEBSITE
A/B TESTING USED TEST TO SUPPORT THE DECISION BASED ON BEHAVIOURAL RESPONSES
TIME ON SITE TIME ON A SITE AND SESSION
ENTRY PAG E IT IS THE FIRST PAGE OF A SITE VISITED IN A SESSION OR ON A VISIT
EXIT PAG E LAST VIEWED PAGE BY THE VISITOR, ON THE WEBSITE
BOUNCE RATE REJECTION OR ABANDONMENT OF A WEBSITE
OPEN RATE EMAIL OPENING ACTION IN A CAMPAIGN THAT SHOWS INTEREST
CTR-CLICK THROUG H RATE MEASURES THE EMAIL OPENING AND THEIR RESPECTIVE ACTION
BEHAVIOR
METRIC MEANING
RETURN V ISITORS.NEW VISITORSNUMBER OF UNIQUE VISITORS RETURNING TO THE SITE AT DIFFERENT MOMENTS.
LOYALTY, ACQUISITION AND ATTRACTION METRIC
ACQUISITION
UNIQUE V ISITORS
F OLLOW ERS.F ANS
F OLLOW ERS G ROW TH
RATE
IMPRESSIONS AND
REACH
NUMBER OF SINGLE VISITORS ON A SITE IN A CERTAIN
TIME PERIOD
FANS AND / OR FOLLOWERS OF A SOCIAL NETWORK
EVALUATION OF THE GROWTH AND IMPACT OF THE
BRAND, PRODUCT, SERVICE OR PERSON IN SOCIAL MEDIA
NUMBER OF TIMES THAT A CONTENT IS PRESENTED
METRIC MEANING
CPA-COST PER ACTION
CPC-COST PER CLICK
CPL-COST PER LEAD
RACE MODEL
MEANING
SOV-SHARE OF VOICE
( SOV)
NETW ORK VALUE
VALUE OF " LIKE"
SENTIMENT
NUMBER OF SHARES FROM A SITE
BRAND MENTIONS IN THE DIGITAL ECOSYSTEM,
COMPARING WITH COMPETITORS
MEASURES THE POTENTIAL, IN A NETWORK COMMUNITY,
OF ITS ELEMENTS INTERACTING WITH THEMSELVES
AMPLIF ICATION-SHARE
METRIC
ENG AG EMENT
ATTRITION
MEASURES THE "LIKE" RETURN ON SOCIAL MEDIA
THE SENTIMENT EXPRESSED ON POSTS AND INTERACTIONS
SYSTEMATIZATION AND METRICS CLASSIFICATION MODEL
INVESTMENT MADE BY THE ANNOUNCER IN ORDER TO
LEAD THE VISITOR TO AN ACTION IN AN ADVERTISEMENT
INVESTMENT MADE BY AN ADVERTISER ALWAYS THAT A
VISITOR CLICKS IN AN AD
VALUE THAT THE ADVERTISER IS WILLING TO PAY FOR EACH
LEAD RECEIVED

26
1.6.1.3. ROI MARKETING
According to Marketo Company (2011), it is important to plan marketing programs
focused on ROI from the beginning. The quantification of the expected result of each
marketing investment is important, to define exactly what will be measured, against the
defined goals. According to the company, the fastest growing companies are those who
measure ROI not only to find out what works, but what works best, as a way to allocate
resources and efforts. The marketing ROI should not only be seen as a report with the
results of the programs being run, but what can result in the decision-making level with
such reports, allowing an improvement in the company’s profits.
Marketo Company reports the ROI measurement method used by Lenskold Group,
dividing marketing ROI planning into three main activities: Establishing targets and ROI
estimates up-front; Designing programs to be measurable; and Focusing on the decisions
that will improve marketing.
The first activity is to quantify the expected results and expectations, through the initial
goals establishment, benchmarks and KPIs for each marketing program. In other words,
the companies must define the objectives and then choose measurable metrics that help
support these objectives. In this way, the CFO will see not only the cost that is required
to invest in marketing but also the benefit that results, making the investment much more
credible. Not all programs may have a complete ROI calculation. The important thing is
to set measurable goals that can measure profits and ROI. Some simpler goals of ROI
include incremental sales revenue, total investment in marketing and sales, etc. Table 4
shows an example of a detailed basic marketing ROI calculation, provided by the
Lenskold Group, capturing all expenses, including variable marketing costs. Lenskold
provides excellent tools for managing ROI marketing, including an online Lead
Generation ROI planning tool. The best marketing ROI plans contain sensitivity analyses,
including the expected case, the best case, and worst-case scenarios, allowing for greater
credibility, showing how changes in various assumptions can affect results. The ROI
calculation must incorporate all relevant expenses, such as the cost of the marketing staff,
and the cost of travel.
In the second activity, there should be a measurement planning, identifying what, when
and how everything will be measured. To set up measurable marketing programs, one
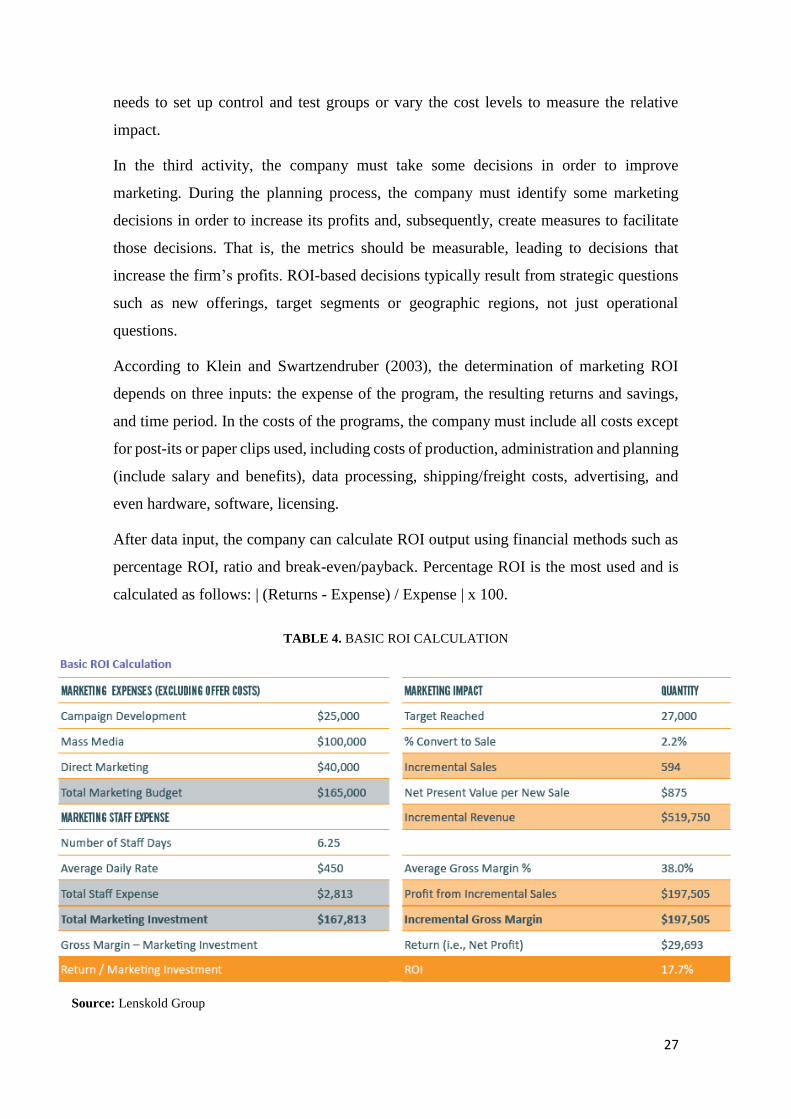
27
needs to set up control and test groups or vary the cost levels to measure the relative
impact.
In the third activity, the company must take some decisions in order to improve
marketing. During the planning process, the company must identify some marketing
decisions in order to increase its profits and, subsequently, create measures to facilitate
those decisions. That is, the metrics should be measurable, leading to decisions that
increase the firm’s profits. ROI-based decisions typically result from strategic questions
such as new offerings, target segments or geographic regions, not just operational
questions.
According to Klein and Swartzendruber (2003), the determination of marketing ROI
depends on three inputs: the expense of the program, the resulting returns and savings,
and time period. In the costs of the programs, the company must include all costs except
for post-its or paper clips used, including costs of production, administration and planning
(include salary and benefits), data processing, shipping/freight costs, advertising, and
even hardware, software, licensing.
After data input, the company can calculate ROI output using financial methods such as
percentage ROI, ratio and break-even/payback. Percentage ROI is the most used and is
calculated as follows: | (Returns - Expense) / Expense | x 100.
Source: Lenskold Group
TABLE 4. BASIC ROI CALCULATION

28
1.6.2. FORALL PHONES DIGITAL MARKETING PERFORMANCE
The digital marketing performance measurement process practiced by Forall Phones has
been one of its competitive advantages, being a key driver of decision-making. José
Alves, Head of Performance of the brand, carries out the measurement process. He is 23
years old but, despite the young age, he has a very robust know-how in this area, due to
its analytical and highly results-oriented profile. This position has a high degree of
importance for the entire organization since it is through it that it is verified if the
department is actually contributing in terms of increased awareness or sales returns, for
example.
When José Alves joined Forall in August 2018, Forall was being composed and the firm’s
performance was not measured as it is now. In fact, these functions fell on João Ribeiro,
the current CMO, and because of the workload he had, the performance measurement
was not the focus, at a time when Forall was taking the first steps towards the success that
has today.
The first step towards all the digital marketing performance process has begun in the
performance ecosystem’s restructuring and professionalization. José Alves divided the
brand communication by customer type: prospecting (people who do not have a relation
with the brand, not having engaged through social networks or visited the website);
retargeting (people who have interacted with the brand but not bought its products); and
buyers (customers who have already purchased Forall products). From here, a more
efficient allocation of the budget is possible, according to each type of client. Thus,
according to the brand’s objectives, the percentage of the budget to reach each type of
customer is defined according to the strategy adopted, which can vary between attracting
new customers or retaining the current ones, through cross-selling or up-selling, for
example.
From there, the timeline and each strategy are set, usually justified by the firm’s main
KPIs, regarding each type of customer. Once defined each strategy timeline, the next step
is the entire measurement process implementation, which begins with the data extraction
and analysis platforms operationalization, as well as everything associated with it, such
as placing the pixels at link tagging for further analysis with Google Analytics. It should
be noted that José Alves has built all reporting files, campaign naming convention, in
order to work the data in Excel, for further segmentation.

29
Since the performance measurement professionalization at Forall, sales have soared
300% and every month the firm achieves records. In fact, the way the company measures
the results, always focused on the measurement and the return in terms of sales, has
contributed greatly to this record. In reality, almost all the used indicators by Forall have
a purpose of measuring profitability, whether it is a return for every euro spent online
(ROAS) or the cost per acquisition (CPA). Some indicators such as cost per click (CPC),
conversion rates, conversions, conversion values, and average order value (AOV) are the
main used by Forall, conveying the benefits and costs’ language of digital marketing.
The fact that marketing is almost all digital, influences not only the results, since it is a
cost-effective solution when compared to mass media, as well as the way it is measured,
through platforms that allow fast feedback and reporting, being able to adjust strategies
to correct deviations. In fact, for José Alves, “the firm’s strategic decisions are today
much more data-driven than they were six months ago. And the trend will always be the
preponderant role of data in all decisions made in all departments of the company”.
Despite the importance he gives to the more accessible information that digital allows
measuring marketing results, José Alves highlights the people, work method and agility
as the keys to this success.
1.6.2.1. FORALL PHONES’ DIGITAL MARKETING PERFORMANCE MEASUREMENT
For José Alves, to be effective, the digital marketing performance measurement process
must have a clear definition of the target audiences, being the booster of defining the main
objectives in each action and each channel.
Usually, the main goal is always to increase sales, in order to quantify and measure the
return on sales of each action and realize which channel is the more profitable one. With
the know-how acquired from past professional experiences and through online learning,
Alves assumes that everything he wants to measure in the firm has to be highly
measurable and quantifiable. Only then he believes that it is possible to know if each
action had the expected return and, it is based on this principle that this marketing
department works. Thus, all the metrics used in all digital marketing actions are
intrinsically linked to two general performance metrics: CPA (cost per acquisition) and
ROA (return on ads spend). These two KPIs support the organization’s marketing
strategy. All other metrics measured by Forall Phones are linked to these ones and are
considered sub-indicators.

30
1.6.2.1.1. GOALS ESTABLISHMENT
The type of digital action and the budget required itself is based on the purpose of the
firm and more specifically on the marketing department goals. After this, the main goals
and the macro indicators are defined and the strategy of how to achieve them is
determined, forming the digital marketing strategy: definition of the digital marketing
channels (search engines, website, social media, e-mail marketing, SMS marketing,
shapers, influencers, etc.), target audience, type of content, resources involved, and
budget required.
Normally, the company defines a sales goal, which depends on many variables, but the
main one is based on the stock that Forall has available. The growth bottleneck is on the
side of the operation at this stage, so the sales are based on the productive capacity of
Forall Phones. Goals are pre-set before, but are always related to increasing sales and
profitability. In some cases, rarely, they work on leads, getting contacts through
newsletter subscriptions, for example. Usually, the main goal is not to raise awareness,
since, in José Alves’s opinion, it is something that cannot be measured in terms of return.
It is based on whether or not these goals are accomplished that Forall relies on whether
or not to change the defined strategy. The objectives defined are usually possible to
measure, in order to be able to transmit quantitative information on whether the strategy
achieves the intended target or whether it has or not profitability. That is, the focus of the
department when developing a Facebook ad, for example, is to know if the customer has
clicked on the ad and then if it has resulted in a sale. The marketing department has
previously defined the KPIs that will measure over the course of digital marketing actions.
These are essentially the CPA and ROAs levels.
The measuring performance process begins at this point, in the key performance levels
establishment. In some rare cases, especially in social media channels, the objectives may
be quite different, such as, to rise the visibility of an ad or a video campaign, for example
on Youtube, but always with an eye on profitability, that is, in the expected return in sales
and if it is or not profitable. In addition, within the Forall Family channel, the main goals
are to raise the awareness and visibility of Forall’s community program, and of the brand
itself.
31
1.6.2.1.2. DATA GATHERING – PLATFORMS OPERATIONALIZATION AND
REPORTING
Once the main objectives (CPA and ROAS) are quantified and the targets defined, the
next step, more operational, is the data gathering. There is a huge amount of data that has
to be collected and then analysed, and it provides insights to the brand about marketing
efforts.
Forall Phones assumes that this phase of the process is a constant challenge, due to the
complexity of integrating data from different platforms, because of the attribution models
of each channel and the different ways of consumer tracking. The brand collects data from
many digital tools, such as Google Ads, Facebook Ads, as well as CRM platforms, such
as 360nrs. This data is, then, analysed and reported through Google Analytics and Excel.
In this sense, the attribution models linked to Facebook Ads are not the same as Google
Analytics, making the analysis more difficult.
In order to monitor the entire data extraction process and ensure that it is analysable, the
firm defines the prioritization of a campaign and ad naming convention, satisfying all the
dimensions that are to be analysed later. At the beginning of each campaign, each link
used to bring traffic to the website is tagged with UTMs or equivalents, allowing Forall
to track traffic sources through the Google Analytics platform, the main platform for
information analysis and performance measurement, allowing to know valuable statistical
information regarding performance and return of each digital marketing campaign.
Through these links tagging, it is possible to know if the data comes from social media,
Google, among others, and then, this data is stored and crossed.
Once labelled, and with all the platforms operational, there is cross-referencing of internal
data with external data, through the interconnection between these platforms, so that
Excel can process the data later, the main work tool for José Alves, allowing most
complex and detailed analyses. Then, the firm creates a dashboard, which is a daily work
tool that consists of data taken from sources: Facebook Business Manager, Google Ads,
and Google Analytics. This data is taken from some reporting automation tools, namely
FAME (Facebook Ads Manager for Excel), Google Analytics Edge and an Excel Macro.
This phase is therefore critical for the success of the process, and it is required a deep
know-how to manage all the platforms and cross all the information, without flaws, so
that it can be interpreted. For Alves, this is the most important phase of the whole process.

32
The key to this process is the construction of reporting files, campaign-naming
convention so that the data can be managed in excel and, in the future, segment the
customers.
1.6.2.1.3. DATA ANALYSIS
Once collected, data has to be analysed in order to provide insights regarding running
campaigns. After setting up his worksheet, José Alves is able to do a detailed analysis of
everything that is happening at the level of digital marketing. Through various platforms
integrated into Excel, performance measurement has become much easier and more
automated. In fact, information can be grouped, and the firm can segment the information
by dimensions: customer, region, device, product, hour of day, age, traffic by
origin/channel or action.
At this analysis point, the campaigns are evaluated concerning some metrics, depending
on each channel that brought traffic to the website: SMS, e-mail, social media, paid
search, organic search, display advertising, google shopping or Forall Shapers and Brand
Makers. As discussed earlier, the focus of this analysis will usually to demonstrate the
profitability of each marketing action, through CPA and ROAS analysis, being key
decision drivers. Combining Google’s performance measurement tools such as Google
Analytics and later Excel, Forall Phones focuses primarily on the financial metrics CPA
and ROAS to measure the effectiveness and efficiency of its marketing efforts.
Tracking CPA allows the cost-per-conversion measurement from start to the end by
incorporating all online advertising costs that were spent, converting a visitor into a
business customer. The return on advertising spend (ROAS) allows to determine the
overall performance of an ad and which campaigns perform best with regard to
profitability. That is, this metric is important to realize the return of the ad for each euro
invested.
In the words of José Alves, the measurable characteristics of Facebook and Google
platforms, allowing them to know which channels most profitable and which campaigns
are generating the most financial return to the firm, lead the company to focus a lot on
this type of analysis. With respect to ROAs, Alves uses a spreadsheet that includes all the
costs that are associated with marketing.

33
Then, as in any analysis, performance measurement goes from generic to specific and
there is special attention to outliers. Analysis such as click through rate (CTR) or cost per
click (CPC) is secondary analyses, that contribute to the mains CPA or ROAs analysis.
Figure 9 provides information from the Forall Phones performance analysis, segmented
by device type, customer type, location, and channel. The analysis is mainly based on the
reach of the advertisement, through the number of impressions, the cost involved, the
clicks (measuring the number of clicks, the associated conversion rates and the cost of
the click (CPC)), as well as the generated return through sales, by measuring the number
of conversions, CPA, ROAS, conversion value, average order value and conversion rates.
For YouTube video campaigns, the brand also seeks to measure other indicators, than
those indicated above, such as the number of video views and cost per view. However,
for José Alves, one more time, if the cost per view is high and if it is not generating sales,
the main indicator, the company should not prolong the campaign.
In terms of community management, Forall seeks to analyse indicators such as customer
engagement with the brand through likes and followers. José Alves is not a fan of a deeper
behavioural analysis since, in his words, measuring brand awareness and engagement is
very difficult, since through questionnaires, for example, the results can be skewed. José
Alves’ focus is, in fact, trying to understand if everything that is done in marketing is
having an impact on the level of sales and profitability, compared to the investment made.
Source: Forall Phones (2019) *All these indicators are interrelated. The values were sanitized and are fictitious but the proportion
and the relationship between the metrics was maintained.
FIGURE 9. FORALL PHONES’ PERFORMANCE ANALYSIS FILE

34
Impression and reach metrics are sometimes also used, such as the number of in-store
visits. When the number is down the department uses this information to do retargeting
and direct specific ads to customers who have not bought products for a long time.
Another indicator that the brand intends to measure in the near future, and is not yet
operational, is the cost of entry in the store. That is, to realize the link between the brand’s
online efforts and store entry by calculating the cost and return of taking a customer to a
store. A possible indicator to measure this metric would be to see which customers, via
smartphone, have clicked on “Get directions” on Google Maps and, actually, entered the
store. Table 5 identifies the metrics system, used by Forall Phones, to get information
from some different digital sources of data.
1.6.2.1.4. THE FEEDBACK FOR STRATEGIC DECISIONS
The chosen KPI’s to track allow a very detailed feedback of what is happening within the
marketing department. Thus, it becomes an important source for strategic decisions, both
at the marketing level and at the firm as a whole, becoming a reliable booster of decision
making, based on the gaps between what was planned and what is actually happening.
After analysing the metrics, it is possible to stress valuable conclusions about the actions
of marketing and all that they entail. To calculate CPA, there are some reasons that can
justify a higher CPA. One of them can be the lower level of the Click Through Rate
(CTR), or because of the high level of the Cost per Click (CPC). In this example, if the
CTR is low, it can be because the brand is not impacting the right people, and the problem
Source: Forall Phones (2019)
TABLE 5. FORALL PHONES’ METRICS SYSTEM
EMAIL COMMUNICATIONS ONLINE ADSSOCIAL MEDIA WEBSITE EVENTS CUSTOMER BLOG
Unubscribe Rate
No of Press Releases Impressions Gross Views Views/Visitors Atendees Churn Rate Posts
Bounce Rate No of InterviewsCost per Click
(CPC) Engagement Unique Views RegistrationsCustomer
Lifetime Value Views/Visitors
Open Rate No of Press EventsCost per
Thousand Impressions (CPM)
Conversions Backlinks Unique Visitors
Click-Through Rate
Cost per Conversion (CPC)
Conversion Rates
Cost per Action (CPA)
Average Order Value
Impression Share
Average Position
MICRO INDICATORS

35
may be the targeting strategy. Hence, it is possible to verify the importance of these KPIs
for decision-making. From here, the firm can adopt a new strategy or just make a few
adjustments, focusing another channel or content, for the specific target that was trying
to reach.
According to José Alves, if any campaign identifies as performing below the
expectations, defined at the beginning of the process, then he will do a deep search to
realize what is happening and he will subsequently take corrective and optimization
actions, trying to correct perceived deviations. The same is true when a given action is
having a higher than expected return, which in this case will serve as a best practice to
replicate in future campaigns.
Forall also uses the used metrics system and segmentation, during this process, for more
strategic and global business decisions. The information collected at the end of a digital
marketing performance measurement process has been used for Forall’s critical options,
such as the opening of new physical stores. Through the aforementioned segmentation, it
is possible to know which regions of Portugal and not only, contribute the most to the
traffic of the brand website and to the sales volume, being key decision drivers for the
firm as a whole. Furthermore, the option for stopping investment or investing in certain
products results from this segmentation. For example, by checking that Samsung
smartphones were not succeeding, Forall decided to discontinue these products online,
only selling them in stores and with the purpose of being completely withdrawn from its
portfolio.
1.6.2.1.5. REPORTING AND COMMUNICATING
Forall Phones has implemented a weekly performance report through a weekly meeting
with Marketing Director, João Ribeiro, after knowing the results of digital marketing
performance in each campaign. In this meeting, the company defines the main next week
objectives, as well as reports the results of the week before.
The main results are presented through marketing dashboards and are reported to
organization key elements, in a monthly meeting, where the CFO, CMO, Financial
Controller and Head of Performance are present.
Figure 10 is an example of a dashboard used in this type of meeting, highlighting the key
metrics, intrinsically linked to the business results, speaking the language of the CFO.

36
This dashboard refers to the conversions and ROAS improvement, from September 2018
to February 2019. In the same figure, it is possible to verify that the best week for the
company, in terms of marketing profitability, was between 19 and 25th of November,
corresponding to the Black Friday week.
In this monthly meeting, the company updates the other departments about what is
happening in the marketing department, regarding financial indicators at the performance
level of the entire department, in order to see if the investment is having the return
expected. Some indicators such as ROAS, conversions or CPA are typical reporting
metrics since they are the main key decision drivers and are used to make strategic
decisions based on them. Hence, the decision as marketing budget division by the
different channels is taken according to their profitability. Even the general marketing
budget increase or decrease is established through certain objectives achievement since
the marketing budget is defined every month by a percentage of sales. Forall only
discloses macro indicators in these monthly meetings, due to their crucial importance.
Micro indicators, which are more operational, are only reported within the marketing
department.
1.6.2.2. THE BLACK FRIDAY CAMPAIGN – ILLUSTRATIVE EXAMPLE OF
PERFORMANCE MEASUREMENT
Forall Phones benchmarked what other brands already are used to do at the end of
November, lowering the price of their products, implementing very high discounts, over
Source: Forall Phones (2019)
FIGURE 10. FORALL PHONES’ PERFORMANCE ANALYSIS DASHBOARD
37
Black Friday’s weekend. The brand decided to launch discounts on all its reused iPhones,
stimulating its mission to boost the consumption of this type of devices, to encourage the
circular economy and to reduce the environmental impact coming from the excessive
purchase of technological equipment. Consequently, Forall Phones wanted to participate
in the celebration of Black Friday with discounts of up to 35% on its black products in
the period between 17 and 23 November. Appendix 24 illustrates some of the posts
published on the brand’s Facebook page within this campaign.
Thus, before starting the consumer discounts, the marketing department had a tough time
planning the season, regarding the needed budget structuring, the target definition and
linked objectives, the content definition and the channels to act, as well as the
performance indicators levels to achieve.
The strategic character that the department has decided to act had a crucial role for the
campaign’ success, being the best brand campaign ever, regarding the smartphones
shipments volume, both in-store and online, as well as in profitability, measured by
ROAS.
At this time, the prices to advertise in online advertising space are more expensive than
usual, since there are many e-commerce advertisers wanting to gain distinction in search
engines, at the same time, in auction systems. Hence, the available slots are limited and
the one wanting to gain prominence, have to pay more, complicating the achievement of
profitability on Black Friday, due to high competitiveness. With this increase in demand,
prices increased a lot, and Forall Phones took care of the matter. Despite the CTRs
increasing, the cost per click increases more, proportionally, than the conversion rate rise,
and the efficiency decreases.
Forall, through José Alves, decided to anticipate the Black Friday announcement
promotions in previous weeks. Since November 1st, they have generated leads (mobile
numbers, forms, etc.) with the message “submit your data to receive early access to our
Black Friday promotions”. In parallel, each week of November, from the beginning of
the month, to the Black Friday day, they placed the “Black Friday price” on certain iPhone
models early, aligning the communication this way and capitalizing immediately the leads
that could anticipate their purchase, diluting sales that would naturally tend to concentrate
at the end of the month.

38
Subsequently, Alves decided to stop most of the usual digital communication channels
and focused his efforts only on direct communication through virtually null media costs
channels, like e-mail and SMS. This decision resulted in the best month ever for the firm,
since they were able to save the investment that would be necessary for a SEM campaign
during the Black Friday days. Anticipating this scenario and, with much lower costs, the
firm obtained the same number of consumers, brutally increasing the profitability of this
campaign, which concluded in a larger volume of sales and a ROAS record. Rather than
investing in typical online advertising, they cut back on the investment, and they had a
much higher return.
1.6.2.3. ROI MARKETING AT FORALL PHONES
Forall Phones still doesn't calculate ROI Marketing. This is explained by the complexity
of assertively measuring this value. For José Alves, variables such as product cost, cost
of each employee, costs with platforms make the calculation difficult, although possible.
At this time, Forall includes as costs of marketing all the costs involved with platforms,
events, communication materials conception (e.g. video) and sponsorships. In the second
phase, soon to be, they also aim to input the team’s salary costs in the general marketing
budget.
In his opinion, what many companies calculate, when they speak of ROI, is effectively
the profitability of the campaigns, by measuring ROAS, just as they do. The financial
analysis at this level, which resembles the ROI calculation, is in fact measured by the
macro indicators they are aiding, CPA and ROAS. Thus, its analysis at this level is
divided into two levels: Level 0 and Level 1:
• Level 0: Characterized by being the most basic level and the basis of performance
analysis. If the mobile phone has a production cost of 100€, having a margin of
50€, and knowing that the brand can spend 20€ to acquire a customer, the efforts
are channelled in this CPA of 20€;
• Level 1: Once the CPA is set, the next step is to work on ROAS, which consists
on the difference in the return that the ads have brought and the spending on the
same ads. Once the ROAS level is set for the campaign to be profitable, the
marketing effort is channelled accordingly.

39
According to José Alves, to work the generic ROI indicator, the complexity required is
much greater, possible through a Data-Driven Attribution Model, and a higher business
volume than Forall Phones has today.
The contribution margin could be a more accessible indicator to calculate, but it would
require separating fixed costs from variable costs, and this is often a challenge. In
addition, this calculation would be possible through the Data-Driven Attribution Model,
which would allow knowing, exactly, where the sale comes from, with 100% certainty.
Without this model, it is impossible to assign a sale to a particular channel because, in the
case of Forall, a customer clicks on a Facebook ad, then clicks on a Google ad, then uses
an ambassador’s promo code in a store, making it impossible to perceive the impact of
each channel, assertively, on the final sale.

40
2. QUESTIONS
2.1. “It was here that José saw a business opportunity of buying and selling used
smartphones, creating the Forall Phones”. Based on that information, try to explain how
some macroeconomic indicators, smartphone market data and other relevant associated
data may have led to the Forall Phones’ business idea.
2.2. Based on the following figure, draw the digital marketing performance measurement
process, adopted by Forall Phones and comment, briefly, based on the knowledge
acquired.
2.3. “Since the performance measurement professionalization at Forall, sales have soared
300% and every month they achieve records”. Based on the case study, comment on this
sentence, and give some justifications for the increase in Forall’s sales.
2.4. Identify the gaps presented in the performance measurement process adopted by
Forall, giving some recommendations to fill them (Suggestion: use information from
chapter 1.6.1. BEST PRACTICES IN DIGITAL MARKETING PERFORMANCE
MEASUREMENT and some other additional scientific articles you may investigate).
2.5. What are the advantages for Forall Phones in calculating the ROI marketing, giving
what can justify an annual ROI Marketing above or below of the expected at the beginning
of the year? What costs would you include in calculating Forall Phones’ annual marketing
ROI? What kind of strategies can be adopted by Forall Phones based on ROI marketing?
2.6. Imagine that Forall Phones aims to increase the sales level of Apple smartphones on
the website, in Portugal. Based on this goal, draw the possible conversion funnel
(awareness, interest, evaluation, purchase), suggesting specific tactics to improve each
goal, also indicating the respective channels and objectives underlying each stage of the
funnel, as well as the KPIs that would measure in each phase, in order to achieve the main
goal outlined.
Source: Järvinen and Karjaluoto (2015)

41
3. APPENDICES
APPENDIX 1. MAP OF THE PERCENTAGE OF PEOPLE LIVING WITH
THE MINIMUM WAGE IN EUROPE
APPENDIX 2. LEVEL OF MINIMUM WAGE IN THE 28 EU MEMBER
STATES
Source: Eurofound (2018)
Source: Eurofound (2018)

42
APPENDIX 3. MEDIUM AVERAGE SALARY (€) IN THE 28 EU
MEMBERS
APPENDIX 4. TAX BURDEN CONTRIBUTION TO GDP (IN %) IN
PORTUGAL FROM 1995-2017
Source: Adecco and Barceló y Asociados (2017)
Source: INE (2017)

43
APPENDIX 5. TAX BURDEN CONTRIBUTION TO GDP IN THE 28
MEMBER STATES (2017)
APPENDIX 6. EVOLUTION OF THE UNEMPLOYMENT RATE (%) IN
PORTUGAL (1983-2017)
Source: Pordata (2017)
Source: INE (2017)

44
APPENDIX 7. UNEMPLOYMENT RATE IN THE EUROPE COUNTRIES
(2018)
APPENDIX 8. MOBILE PHONE PENETRATION RATE (%) IN PORTUGAL
(2004-2018)
APPENDIX 9. NUMBER OF SMARTPHONES SOLD TO END USERS
WORLDWIDE 2007 TO 2017 (IN MILLION UNITS)
Source: Eurostat (2018)
Source: Marktest (2018)
Source: Statista (2017)

45
APPENDIX 10. GLOBAL SMARTPHONE SHIPMENTS RANKING
(MILLION UNITS) AND YOY% GROWTH (2016-2017)
APPENDIX 11. REFURBISHED SMARTPHONES VS NEW SMARTPHONE
SHIPMENTS YOY GROWTH (%) IN EMERGING REFURBISHED
MARKETS
APPENDIX 12. REGIONAL ANNUAL GROWTH COMPARISON IN THE
GLOBAL SMARTPHONE MARKET
Source: IDC (2018)
Source: Counterpoint (2018)
Source: Counterpoint (2017)

46
APPENDIX 13. BIGGEST SMARTPHONE PLAYERS SHIPMENT
VOLUMES (MILLION UNITS) AND MARKET SHARE VARIATION (%)
(2017-2018)
APPENDIX 14. PRICING BENCHMARKING ANALYSIS IPHONE 8 64G &
IPHONE X 64 G
APPENDIX 15. FORALL PHONES PRODUCT OVERVIEW
Source: Counterpoint Research global smartphone market Q4 (2017)
Source: Forall Phones (2019)
Source: Forall Phones Website

47
APPENDIX 16. PAYMENT, RETURNS & WARRANTY
APPENDIX 17. FORALL PHONES STORES LOCATION
APPENDIX 18. PERCENTAGE OF PEOPLE BETWEEN 16-74 YEARS OLD
WHO USED ELECTRONIC COMMERCE IN PORTUGAL (2010-2017)
Source: Forall Phones Website
Source: INE (2017)
Source: Forall Phones Website

48
APPENDIX 19. EVOLUTION OF INTERNET PENETRATION IN
PORTUGAL (1997-2017)
APPENDIX 20. FORALL PHONES’ SALES BY CHANNEL (%) AND
TOTAL SMARTPHONE SALES UNITS (SEP-DEC 2018)
Source: Marktest (2017)
Source: Forall Phones (2018)
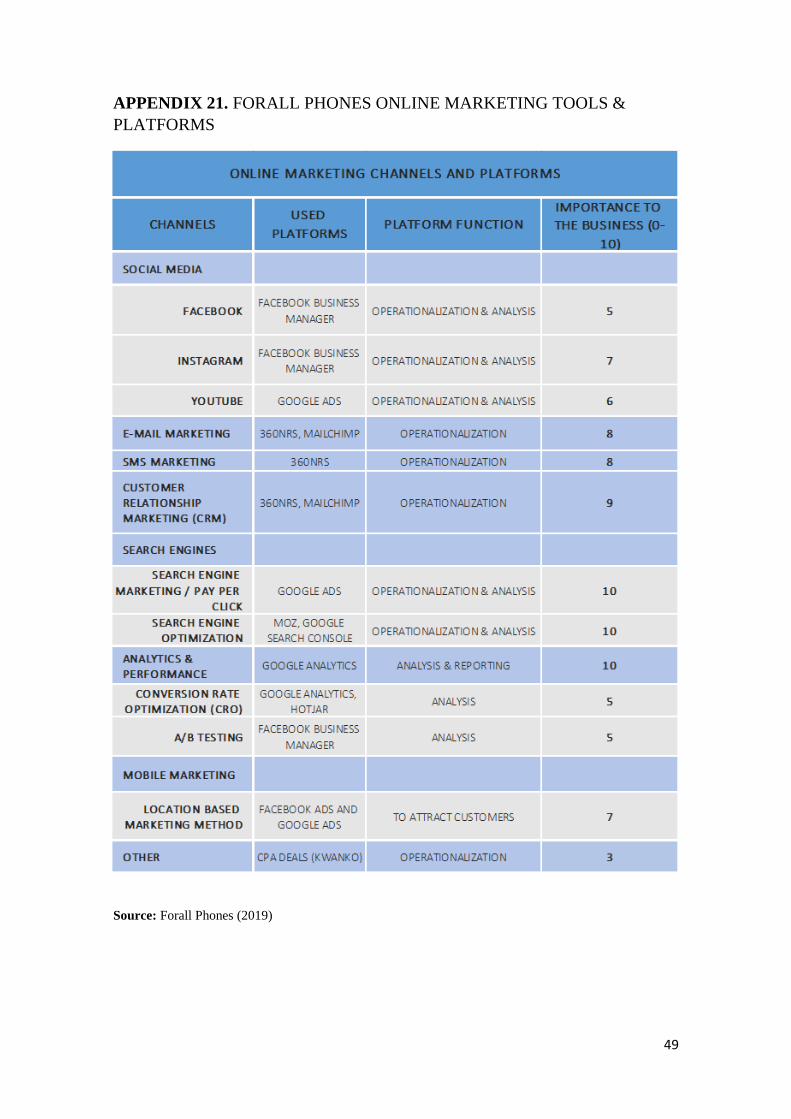
49
APPENDIX 21. FORALL PHONES ONLINE MARKETING TOOLS &
PLATFORMS
Source: Forall Phones (2019)

50
APPENDIX 22. METRICS SYSTEM SUMMARY TABLE (DIGITAL SOFT
METRICS)
Source: Self-Elaboration (2019)
METRICS CONSTRUCTION CONSIDERATIONS SOURCE Notes
Fans, Friends, Followers and
Supporters Number
"Number of individuals joining a
social network"
"Success depends on target group and the social nature of the
product. This metric is unlikely to reflect the ultimate aim of a
marketing campaign"
Mintz & Currim (2013); Spiller & Tuten (2015);
AMA (2015); "Digital Metrics" Playbook (2015);
"Marketing Metrics" Book (2016); "Marketing
Performance-80 métricas de marketing e vendas"
Book (2019)
"Marketing Metrics" Book (2016) Definitions
Engagement Engagement (Likes+Comments+Shares)/Total Fans or Followers x 100%
"To improve this indicator, it is required to assess the best
post moments, to determine engagement objectives, know
the audience and what type of content generates greater
involvement, and analyse and monitor metrics regularly on a
global and network basis"
"Marketing Performance-80 métricas de marketing
e vendas" Book (2019)
"Marketing Performance-80 métricas de
marketing e vendas" Book (2019) Definitions
Share of Conversation"Share of Conversation=Comments about your brand/Total comments
about all brands in your category"
"The number of comments about your brand that are
published outside of your properties, out of the total
published comments about all brands in your category"
"Digital Metrics" Playbook (2015) "Digital Metrics" Playbook (2015) Definitions
Awareness "Percentage of total population that is aware of a brand" "Is this prompted or unprompted awareness?"Mintz & Currim (2013); ); AMA (2015); "Marketing
Metrics" Book (2016); Liang et al . (2018)"Marketing Metrics" Book (2016) Definitions
Posts (Blog, Photo, Video, Tweets),
Dowloads, Comments, Reply
Comments, Mentions, Tags, Pings,
Likes, Ratings, Favorites, Views,
Bookmarks, Subscriptions
"Signals that can tell you what kind of content your audience likes the
most, which, in turn, gives you the opportunity to improve your content
creation strategies by producing more engaging and relevant pieces"
"When people write comments on your posts, you can be
sure that your content was viewed"
Mintz & Currim (2013); Jarvinen & Karjaluoto
(2015); Spiller & Tuten (2015); AMA (2015); Digital
Metrics" Playbook (2015); VisionEdge Marketing
(2017)
"Digital Metrics" Playbook (2015) Definitions
Visitors "The number of unique Web site viewers in a given period"
"Useful in determining the type of traffic generated by a Web
site-a few loyal adherents, or many occasional visitors. The
period over which this metric is measured can be an important
consideration"
Mintz & Currim (2013); Jarvinen & Karjaluoto
(2015); Spiller & Tuten (2015); AMA (2015);
"Marketing Metrics" Book (2016) ; VisionEdge
Marketing (2017); Liang et al. (2018)
"Marketing Metrics" Book (2016) Definitions
Number of website
visits/impressions/visitors and
website visit growth (%) driven per
traffic source
"An impression is generated each time an advertisement is viewed. The
number of impressions achieved is a function of an ad’s reach (the
number of people seeing it), multiplied by its frequency (number of times
they see it)"
"As a metric, impressions do not account for quality of
viewings. In this regard, a glimpse will have less effect than a
detailed study. Impressions are also called exposures and
opportunities-tosee (OTS)"
Mintz & Currim (2013); Jarvinen & Karjaluoto
(2015); Spiller & Tuten (2015); "Marketing Metrics"
Book (2016) ; "Marketing Performance-80 métricas
de marketing e vendas" Book (2019)
"Marketing Metrics" Book (2016) Definitions
Page Views "The number of times a Web page is served"
"Represents the number of Web pages served. Hits, by
contrast, represent pageviews multiplied by the number of
files on a page, making it as much a metric of page design as of
traffic"
Jarvinen & Karjaluoto (2015); "Digital Metrics"
Playbook (2015); "Marketing Metrics" Book (2016)"Marketing Metrics" Book (2016) Definitions
Returning Visitors "The number of visitors that returned to the website""Visitors who come back to the website at least one more
time after their first visit"
"Digital Metrics" Playbook (2015); "Marketing
Performance-80 métricas de marketing e vendas"
Book (2019)
"Digital Metrics" Playbook (2015) Definitions
Open Rate "It is calculated as follows: Emails Opened / Emails Delivered x 100"
"It allows to perceive the performance of a mailing campaign,
to realize which contents are attracting more interest, to
check the best moments for sending, to assist in the
segmentation criteria"
"Marketing Performance-80 métricas de marketing
e vendas" (2019) Book
"Marketing Performance-80 métricas de
marketing e vendas" (2019) Book Definitions
Share of Traffic"The percentage of visits (or unique visitors) your website gets out of the
total visits to all websites in your category"
"You should include visits to your website plus all of your
competitors’ websites in order to calculate the total number
of visits for your category"
"Digital Metrics" Playbook (2015) "Digital Metrics" Playbook (2015) Definitions
Average Frequency"The average number of times that an individual receives an
advertisement, given that he or she is indeed exposed to the ad"
"Frequency is measured only among people who have in fact
seen the advertisement under study""Marketing Metrics" Book (2016) "Marketing Metrics" Book (2016) Definitions
Effective Frequency"The number of times an individual must see an advertisement in order
to register its message"
"As a rule of thumb in planning, marketers often use an
effective frequency of 3. To the extent that it promises to
have a significant impact on campaign results, this assumption
should be tested"
"Marketing Metrics" Book (2016) "Marketing Metrics" Book (2016) Definitions
Effective Reach"Reach achieved among individuals who are exposed to an advertisement
with a frequency greater than or equal to the effective frequency"
"The effective frequency rate constitutes a crucial assumption
in the calculation of this metric"
"Marketing Metrics" Book (2016); "Marketing
Performance-80 métricas de marketing e vendas"
Book (2019)
"Marketing Metrics" Book (2016) Definitions
Average time on site
"Visit length is calculated as the difference between the first and last page
view timestamp of each visit. This means that the actual time spent on
the last page doesn’t get calculated, only the time spent on previous
pages. And visits with just one pageview will get assigned zero time on
site because there is no following pageview timestamp with which to
make the calculation"
"The average length of user visits on your site"
Spiller & Tuten (2015); "Digital Metrics" Playbook
(2015); "Marketing Performance-80 métricas de
marketing e vendas" (2019) Book
"Digital Metrics" Playbook (2015) Definitions
Click Through Rates (CTR)"Number of clickthroughs as a fraction of the number of impressions";
"CTR=Clicks/Ad Impressions"
"An interactive measure of Web advertising. It has great
strengths, but clicks represent only a step toward conversion
and are thus an intermediate advertising goal"
"Digital Metrics" Playbook (2015); "Marketing
Metrics" Book (2016); VisionEdge Marketing
(2017); "Marketing Performance-80 métricas de
marketing e vendas" Book (2019)
"Marketing Metrics" Book (2016) Definitions
Abandonment Rate "The rate of purchases started but not completed"
"Can warn of weak design in an e-commerce site by measuring
the number of potential customers who lose patience with a
transaction process or are surprised and put off by “hidden”
costs revealed toward its conclusion"
"Marketing Metrics" Book (2016) "Marketing Metrics" Book (2016) Definitions
Bounce Rate"Fraction of Web site visitors who view a single page"; "It can be
calculated as follows: Total Abandonments/Total Visits x 100"
"Requires a clear definition of when a visit ends. Usually
considers bounce rate with respect to visits rather than
visitors"
"Marketing Metrics" Book (2016); "Marketing
Performance-80 métricas de marketing e vendas"
Book (2019)
"Marketing Metrics" Book (2016) Definitions;
"Marketing Performance-80 métricas de
marketing e vendas" (2019) Book Definitions
Conversion rates/ Call to Action
(CTA)"Conversion Rate=Conversions/Total Number of visits"
"The percentage of conversions generated by your visitors in a
given time period"
"Digital Metrics" Playbook (2015); Spiller & Tuten
(2015); VisionEdge Marketing (2017); Liang et al.
(2018); "Marketing Performance-80 métricas de
marketing e vendas" Book (2019)
"Digital Metrics" Playbook (2015) Definitions
Gross Rating Points (GRP)"Impressions divided by the number of people in the audience for an
advertisement"
"Impressions expressed in relation to population. GRPs are
cumulative across media vehicles, making it possible to
achieve GRPs of more than 100%. Target Rating Points
(TRPs) are measured in relation to defined target populations"
"Marketing Metrics" Book (2016); "Marketing
Performance-80 métricas de marketing e vendas"
Book (2019)
"Marketing Metrics" Book (2016) Definitions
Net Promotor Score (NPS)"Percentage of customers willing to recommend to others less the
percentage unwilling to recommend the product or service"
"The Net Promoter Score (NPS) is created by subtracting the
percentage of detractors among current customers from the
percentage of promoters among current customers"
Mintz & Currim (2013); "Marketing Metrics" Book
(2016); Liang et al. (2018)"Marketing Metrics" Book (2016) Definitions
Willingness to Recomend "Generally measured via ratings across a 1–5 scale" "Nonlinear in impact"Mintz & Currim (2013), "Marketing Metrics" Book
(2016)"Marketing Metrics" Book (2016) Definitions
Customer Satisfaction"Generally measured on a 1–5 scale, in which customers declare their
satisfaction with brand in general or specific attributes"
"Subject to response bias. Captures views of current
customers, not lost customers. Satisfaction is a function of
expectations"
"Marketing Metrics" Book (2016) "Marketing Metrics" Book (2016) Definitions
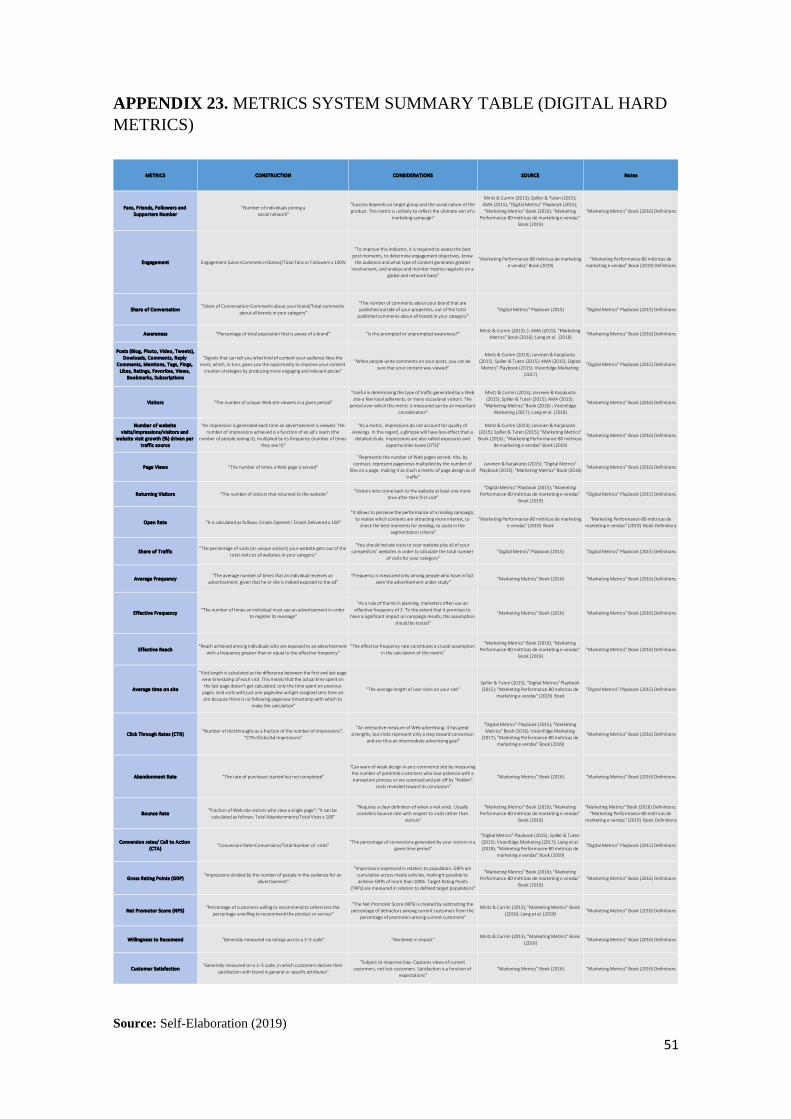
51
APPENDIX 23. METRICS SYSTEM SUMMARY TABLE (DIGITAL HARD
METRICS)
METRICS CONSTRUCTION CONSIDERATIONS SOURCE Notes
Fans, Friends, Followers and
Supporters Number
"Number of individuals joining a
social network"
"Success depends on target group and the social nature of the
product. This metric is unlikely to reflect the ultimate aim of a
marketing campaign"
Mintz & Currim (2013); Spiller & Tuten (2015);
AMA (2015); "Digital Metrics" Playbook (2015);
"Marketing Metrics" Book (2016); "Marketing
Performance-80 métricas de marketing e vendas"
Book (2019)
"Marketing Metrics" Book (2016) Definitions
Engagement Engagement (Likes+Comments+Shares)/Total Fans or Followers x 100%
"To improve this indicator, it is required to assess the best
post moments, to determine engagement objectives, know
the audience and what type of content generates greater
involvement, and analyse and monitor metrics regularly on a
global and network basis"
"Marketing Performance-80 métricas de marketing
e vendas" Book (2019)
"Marketing Performance-80 métricas de
marketing e vendas" Book (2019) Definitions
Share of Conversation"Share of Conversation=Comments about your brand/Total comments
about all brands in your category"
"The number of comments about your brand that are
published outside of your properties, out of the total
published comments about all brands in your category"
"Digital Metrics" Playbook (2015) "Digital Metrics" Playbook (2015) Definitions
Awareness "Percentage of total population that is aware of a brand" "Is this prompted or unprompted awareness?"Mintz & Currim (2013); ); AMA (2015); "Marketing
Metrics" Book (2016); Liang et al . (2018)"Marketing Metrics" Book (2016) Definitions
Posts (Blog, Photo, Video, Tweets),
Dowloads, Comments, Reply
Comments, Mentions, Tags, Pings,
Likes, Ratings, Favorites, Views,
Bookmarks, Subscriptions
"Signals that can tell you what kind of content your audience likes the
most, which, in turn, gives you the opportunity to improve your content
creation strategies by producing more engaging and relevant pieces"
"When people write comments on your posts, you can be
sure that your content was viewed"
Mintz & Currim (2013); Jarvinen & Karjaluoto
(2015); Spiller & Tuten (2015); AMA (2015); Digital
Metrics" Playbook (2015); VisionEdge Marketing
(2017)
"Digital Metrics" Playbook (2015) Definitions
Visitors "The number of unique Web site viewers in a given period"
"Useful in determining the type of traffic generated by a Web
site-a few loyal adherents, or many occasional visitors. The
period over which this metric is measured can be an important
consideration"
Mintz & Currim (2013); Jarvinen & Karjaluoto
(2015); Spiller & Tuten (2015); AMA (2015);
"Marketing Metrics" Book (2016) ; VisionEdge
Marketing (2017); Liang et al. (2018)
"Marketing Metrics" Book (2016) Definitions
Number of website
visits/impressions/visitors and
website visit growth (%) driven per
traffic source
"An impression is generated each time an advertisement is viewed. The
number of impressions achieved is a function of an ad’s reach (the
number of people seeing it), multiplied by its frequency (number of times
they see it)"
"As a metric, impressions do not account for quality of
viewings. In this regard, a glimpse will have less effect than a
detailed study. Impressions are also called exposures and
opportunities-tosee (OTS)"
Mintz & Currim (2013); Jarvinen & Karjaluoto
(2015); Spiller & Tuten (2015); "Marketing Metrics"
Book (2016) ; "Marketing Performance-80 métricas
de marketing e vendas" Book (2019)
"Marketing Metrics" Book (2016) Definitions
Page Views "The number of times a Web page is served"
"Represents the number of Web pages served. Hits, by
contrast, represent pageviews multiplied by the number of
files on a page, making it as much a metric of page design as of
traffic"
Jarvinen & Karjaluoto (2015); "Digital Metrics"
Playbook (2015); "Marketing Metrics" Book (2016)"Marketing Metrics" Book (2016) Definitions
Returning Visitors "The number of visitors that returned to the website""Visitors who come back to the website at least one more
time after their first visit"
"Digital Metrics" Playbook (2015); "Marketing
Performance-80 métricas de marketing e vendas"
Book (2019)
"Digital Metrics" Playbook (2015) Definitions
Open Rate "It is calculated as follows: Emails Opened / Emails Delivered x 100"
"It allows to perceive the performance of a mailing campaign,
to realize which contents are attracting more interest, to
check the best moments for sending, to assist in the
segmentation criteria"
"Marketing Performance-80 métricas de marketing
e vendas" (2019) Book
"Marketing Performance-80 métricas de
marketing e vendas" (2019) Book Definitions
Share of Traffic"The percentage of visits (or unique visitors) your website gets out of the
total visits to all websites in your category"
"You should include visits to your website plus all of your
competitors’ websites in order to calculate the total number
of visits for your category"
"Digital Metrics" Playbook (2015) "Digital Metrics" Playbook (2015) Definitions
Average Frequency"The average number of times that an individual receives an
advertisement, given that he or she is indeed exposed to the ad"
"Frequency is measured only among people who have in fact
seen the advertisement under study""Marketing Metrics" Book (2016) "Marketing Metrics" Book (2016) Definitions
Effective Frequency"The number of times an individual must see an advertisement in order
to register its message"
"As a rule of thumb in planning, marketers often use an
effective frequency of 3. To the extent that it promises to
have a significant impact on campaign results, this assumption
should be tested"
"Marketing Metrics" Book (2016) "Marketing Metrics" Book (2016) Definitions
Effective Reach"Reach achieved among individuals who are exposed to an advertisement
with a frequency greater than or equal to the effective frequency"
"The effective frequency rate constitutes a crucial assumption
in the calculation of this metric"
"Marketing Metrics" Book (2016); "Marketing
Performance-80 métricas de marketing e vendas"
Book (2019)
"Marketing Metrics" Book (2016) Definitions
Average time on site
"Visit length is calculated as the difference between the first and last page
view timestamp of each visit. This means that the actual time spent on
the last page doesn’t get calculated, only the time spent on previous
pages. And visits with just one pageview will get assigned zero time on
site because there is no following pageview timestamp with which to
make the calculation"
"The average length of user visits on your site"
Spiller & Tuten (2015); "Digital Metrics" Playbook
(2015); "Marketing Performance-80 métricas de
marketing e vendas" (2019) Book
"Digital Metrics" Playbook (2015) Definitions
Click Through Rates (CTR)"Number of clickthroughs as a fraction of the number of impressions";
"CTR=Clicks/Ad Impressions"
"An interactive measure of Web advertising. It has great
strengths, but clicks represent only a step toward conversion
and are thus an intermediate advertising goal"
"Digital Metrics" Playbook (2015); "Marketing
Metrics" Book (2016); VisionEdge Marketing
(2017); "Marketing Performance-80 métricas de
marketing e vendas" Book (2019)
"Marketing Metrics" Book (2016) Definitions
Abandonment Rate "The rate of purchases started but not completed"
"Can warn of weak design in an e-commerce site by measuring
the number of potential customers who lose patience with a
transaction process or are surprised and put off by “hidden”
costs revealed toward its conclusion"
"Marketing Metrics" Book (2016) "Marketing Metrics" Book (2016) Definitions
Bounce Rate"Fraction of Web site visitors who view a single page"; "It can be
calculated as follows: Total Abandonments/Total Visits x 100"
"Requires a clear definition of when a visit ends. Usually
considers bounce rate with respect to visits rather than
visitors"
"Marketing Metrics" Book (2016); "Marketing
Performance-80 métricas de marketing e vendas"
Book (2019)
"Marketing Metrics" Book (2016) Definitions;
"Marketing Performance-80 métricas de
marketing e vendas" (2019) Book Definitions
Conversion rates/ Call to Action
(CTA)"Conversion Rate=Conversions/Total Number of visits"
"The percentage of conversions generated by your visitors in a
given time period"
"Digital Metrics" Playbook (2015); Spiller & Tuten
(2015); VisionEdge Marketing (2017); Liang et al.
(2018); "Marketing Performance-80 métricas de
marketing e vendas" Book (2019)
"Digital Metrics" Playbook (2015) Definitions
Gross Rating Points (GRP)"Impressions divided by the number of people in the audience for an
advertisement"
"Impressions expressed in relation to population. GRPs are
cumulative across media vehicles, making it possible to
achieve GRPs of more than 100%. Target Rating Points
(TRPs) are measured in relation to defined target populations"
"Marketing Metrics" Book (2016); "Marketing
Performance-80 métricas de marketing e vendas"
Book (2019)
"Marketing Metrics" Book (2016) Definitions
Net Promotor Score (NPS)"Percentage of customers willing to recommend to others less the
percentage unwilling to recommend the product or service"
"The Net Promoter Score (NPS) is created by subtracting the
percentage of detractors among current customers from the
percentage of promoters among current customers"
Mintz & Currim (2013); "Marketing Metrics" Book
(2016); Liang et al. (2018)"Marketing Metrics" Book (2016) Definitions
Willingness to Recomend "Generally measured via ratings across a 1–5 scale" "Nonlinear in impact"Mintz & Currim (2013), "Marketing Metrics" Book
(2016)"Marketing Metrics" Book (2016) Definitions
Customer Satisfaction"Generally measured on a 1–5 scale, in which customers declare their
satisfaction with brand in general or specific attributes"
"Subject to response bias. Captures views of current
customers, not lost customers. Satisfaction is a function of
expectations"
"Marketing Metrics" Book (2016) "Marketing Metrics" Book (2016) Definitions
Source: Self-Elaboration (2019)

52
APPENDIX 24. BLACK FRIDAY CAMPAIGN COMMUNICATION
POSTED ON FACEBOOK
Source: Forall Phones Facebook Page (2018)

53
4. TEACHING NOTES
4.1. CASE STUDY TARGET
The present case study targets undergraduate and master students, in the areas of
Management, Marketing, Strategy, and Business Administration, who wish to develop or
deepen their knowledge in the digital marketing area, more specifically in the digital
marketing performance measurement area.
In addition, this case was developed for marketers who want to gain insights into
performance measurement subject, as well as tools to make the marketing department
more valuable, by speaking the same language as the CEOs and CFOs.
4.2. PEDAGOGICAL OBJECTIVES
The main aim of this master thesis is to understand the importance of measuring digital
marketing performance, linking marketing efforts to business outcomes, with the example
of a specific firm, a Portuguese start-up, Forall Phones.
Moreover, the objective is to provide more insights into the digital marketing
performance measurement topic, applying digital metrics to a real case and highlighting
the importance of measuring many types of digital metrics and creating specific
performance dashboards.
Then, this pedagogical case study was developed with the following educational
objectives:
1. To realize the impact of good digital marketing performance measurement
practices on the overall firm performance.
2. To do a deep analysis of the market and of the firm under study.
3. To explore what are the marketing key performance metrics that companies
should focus on.
4. To understand the importance of linking digital marketing to business outcomes.
5. To link the insights provided by the digital marketing performance analysis in a
way that supports the firm’ strategy.
6. To improve the digital marketing performance level of Forall Phones, by giving
some recommendations.

54
4.3. LITERATURE REVIEW
4.3.1. MARKETING PERFORMANCE MEASUREMENT
Research in marketing emphasizes the importance of understanding how marketing can
contribute to performance outcomes (Katsikeas, Morgan, Leonidou, & Hult, 2016).
Katsikeas et al. (2016) defended that, to diagnose with accuracy the value that marketing
is creating on the firms, one needs to develop relevant ways to assess performance
outcomes. Marketers are under pressure to provide insights that can be linked to firm
performance and they are trying to respond to this challenge, by investing in measurement
capacities to assess performance (O’Sullivan & Abela, 2007).
Marketing productivity and performance assessment topics consistently rank in the top
research priorities of the MSI, since the beginning of the century (MSI, 2002, 2004 as
cited in O’Sullivan, Abela & Hutchinson, 2009; Seggie et al., 2007). Between 2006 and
2008, MSI highlighted as research priorities the link between marketing metrics and firm
performance. These topics still remain relevant to marketing researchers, the reason
behind this being that marketing has brought restricted input into strategy formulation
(Srivastava, Shervani, & Fahey, 1998 as cited in Seggie et al., 2007), since marketers
were not able to identify and measure its value and impact on firm’s results. E-marketing
spending has grown at a rate of 55% per year since 1995 (McKinsey, 2013), emerging
the need demonstrate value for the business (VEM, 2014).
Clark, Abela, and Amblera (2006) define marketing performance measurement as “a
business process that provides performance feedback to the organization regarding the
results of marketing efforts” (p. 191). Over the years, MSI continuously supported
investigations on marketing metrics, marketing performance measurement, and
marketing accountability (MSI, 2002, 2004, 2006, 2008, 2012 as cited in Liang et al.,
2018). The same organization continues to advocate research on this topic and has
considered that “improving ROI models across all media, digital and non-digital” is a top
research priority topic for 2016-2018 (Fu et al., 2018, p. 9).
The need to link marketing to business performance has been receiving meaningful
importance and has become vital to marketers because now they have to prove the value
of their activities and budgets due to the need of cost reduction by companies, during the
recent global recession (Seggie et al., 2007; Morgan, 2012). Hence, marketing

55
accountability and the measurement of marketing performance are considered impactful
areas for management. This constant demand to treat marketing as a countable science
has led to a large investment in improving marketing performance actions (Liang et al.,
2018). In fact, the link between marketing and firm value is essential to demonstrate the
strategic role that marketing plays within companies, generating cash flows (Rao &
Bharadwaj, 2016). Celeste and Moniz (2019) also reported that the evaluation results of
decision-making, forecasting, commercial and marketing actions, along with the strategic
objectives, are critical to ensure effective management of any company.
O’Sullivan and Abela (2007) argued that marketing performance measurement could be
classified into three main research groups: measurement of marketing productivity,
identification of metrics in use, and measurement of brand equity.
Rust, Ambler, Carpenter, Kumar, and Srivastava (2004) designed the chain of marketing
productivity. This framework, represented in TN Figure 1, covers strategic and tactical
marketing activities, in order to establish a clear link with financial indicators. The
framework begins with marketing strategies, such as promotions, generating, a posteriori,
marketing tactics, such as an advertising campaign or a loyalty campaign. It should be
noted that the framework only covers actions that have expenses related with the
marketing department. Marketing actions can lead to specific attitudes and behavioural
intentions, increasing or decreasing marketing assets such as brand or customer equity.
The authors advise companies to understand “how marketing expenditures influence what
customers know, believe, and feel, and ultimately how they behave” (p. 76). They
emphasize the importance of understanding the link between marketing actions, such as
advertising, and long-term assets like brand equity. Hanssens and Pauwels (2016) stressed
that the causality of this model increases the pressure to use good performance metrics,
establishing causal links with marketing actions.
Katsikeas et al. (2016) developed a long performance evaluation study, analysing the
assessment of performance outcomes in 998 empirical studies published in the top 15
marketing journals from 1981 to 2014. They found that accounting and product market
aspects of performance have dominated the research concerns on the performance
outcomes of marketing and indicators in the areas of financial-market returns were the
ones that most rapidly grew in use in the past decade (Katsikeas et al., 2016).

56
These authors improved some performance frameworks, including Rust et al. (2004)
framework, selecting the major “steps in the creation of operational and organizational
marketing performance outcomes” (p. 2), classifying performance in two main groups:
operational and organizational performance. The authors identified six different aspects
of performance that should be used in performance assessment: customer mindset
outcomes, customer behaviour outcomes, customer-level performance, product market
performance, accounting performance outcomes, and financial-market performance
Outcomes (See TN Figure 2).
Source: Rust et al. (2004)
Source: Katsikeas et al. (2016)
TN FIGURE 1. THE CHAIN OF MARKETING PRODUCTIVITY
TN FIGURE 2. THE MARKETING-PERFORMANCE OUTCOME CHAIN AND
EXAMPLE MEASURES

57
Throughout the last decades, there was also a focus on the impact of marketing on a
company’s competitive advantage (Morgan, 2012). After Porter (1980), this issue
developed many studies. Nevertheless, the effect of marketing on performance outcomes
resides inconclusive (Morgan, 2012). Several reasons are pointed out such as the nature,
number, and diversity of performance outcome measures employed (Hult et al., 2008;
Krasnikov & Jayachandran, 2008 as cited in Katsikeas et al., 2016). Spiller and Tuten
(2015) stressed five common reasons to fail the measurement assessment defended by
Katie Paine in 2012. Some of them are related to the price, the required know-how for
measuring performance, and the need for programs to analyse data. Marketing
performance measurement (MPM) also suffers by focusing on subjective metrics
analysis, such as brand loyalty or customer satisfaction, being difficult to demonstrate
value for top management (Rust et al., 2004; Stewart, 2009). In addition, Hanssens and
Pauwels (2016) suggest that marketing departments are struggling to prove their value
because they are using a variety of multiple different performance metrics, such as
attitudinal (e.g., brand awareness), behavioural (e.g., brand loyalty), and financial (e.g.,
sales revenue), and there is no causal relationship between them, leading to a marketing
devaluation.
The trend of corporations to present accountable results, the dissatisfaction with
traditional metrics, and the internet penetration and availability explain the rising
importance of measuring marketing productivity (Seggie et al., 2007).
The feedback provided by performance measurement is one of the reasons of their
importance since corrective actions can be taken in order to adjust some strategy (Ambler
et al., 2004 as cited in Seggie et al., 2007). Spiller and Tuten (2015) suggest that the
impact of measuring marketing activities has been rising interest as more market
managers found the strategic value the data conveys.
O’Sullivan & Abela (2007) reported that well-handled MPM influenced, positively, the
firm performance, in high-tech companies, also affecting ROA and stock returns. The
authors also suggest that MPM capabilities can affect CEO satisfaction with the
marketing department. In order to achieve a higher satisfaction, marketers should measure
their efforts, by using a meaningful group of metrics, combining financial and non-
financial indicators, allowing a performance monitoring face the established objectives
and competitors performance.

58
Feng, Morgan, and Rego (2015) have also researched U.S technology companies from
1993 to 2008 and they found that, on average, their marketing departments’ power
increased over the time. They reported that there is a positive relationship between
marketing power and short-term future financial efficiency and its longer-term future
shareholder value effectiveness, ensuring that a higher marketing power leads to higher
company performance. The authors suggest that, through objective performance
measures and econometric models, the power of the marketing department can predict
short-term profitability and, as a consequence, longer-term shareholder value.
Liang et al. (2018) also corroborate with it, arguing that firms with a comprehensive
MPM practice promote marketing capabilities and increase firm performance. The
authors advise companies to use MPM practices as a way to enhance marketing plans and
build better relationships with customers. They also infer that companies with better
performance are used to have more comprehensive MPM practices in place. They
recommended that companies use different types of marketing metrics, such as customer
behaviour metrics, financial metrics, and digital metrics to assess the performance of their
marketing activities. They also propose that management teams should use the metrics
over time, monitoring the progress. Confirming the same idea, Luke (2013) supports that
“measuring marketing is an ongoing process of refinement and development” (p. 1).
Kotler and Keller (2007) defined marketing metrics as the tools that help companies
quantify, compare, and interpret their own performance from marketing activities (as
cited in Spiller & Tuten, 2015). In order to assess the marketing performance measures,
Järvinen and Karjaluoto (2015) have underlined the role of metrics at performance
measurement, so they define performance measurement content as “the actual metrics
system that is developed, including what is being measured, what metrics are selected,
and how they are structured as a complete metrics system” (p. 118).
Mintz and Currim (2013) suggest that the larger the number of metrics used, the better is
the perceived performance of the marketing mix, allowing performance monitoring and
benchmarking and, consequently, more complete evaluations of marketing mix activities.
Hence, the combined use of marketing and financial metrics to evaluate marketing-mix
performance can reduce both marketing and financial uncertainty. The same authors refer
that the use of metrics depends on several variables such as firm strategy, metric
orientation, type of marketing mix decision, firm, and environmental characteristics.

59
4.3.2. DIGITAL MARKETING AND DATA GATHERING
Today’s market environment is quickly changing with the emergence of the internet and,
as a result, companies are changing their approach to market products to consumers.
Digital marketing allows reaching a wide target market, at the same time it reduces cost,
in comparison with traditional marketing methods (Manley, 2015).
Celeste and Moniz (2019) argue that, nowadays, digital marketing is an increasingly
necessity for any organization, due the digital channels’ crucial role for any activity
sector, making it crucial for any marketing strategy. For them, the digital boom has
brought not only new business opportunities, new markets, but above all, it has brought
a relationship optimization with the market and with potential customers.
The internet as an essential part of people has reformed the physical and traditional market
into a more convenient digital market space (Varadarajan & Yadav, 2009 as cited in Roy,
Datta & Basu, 2017), making e-commerce an important tool to improve business growth
and interpersonal relationships (Saura, Palos-Sánchez & Sanchéz, 2017). Thus, for
marketing managers, digital marketing is becoming more important and, therefore, they
spend considerable money in its development and implementation (Weinberg & Pehlivan,
2011; Zhao & Zhu, 2010 as cited in Tiago & Veríssimo, 2014). In this way, according to
The CMO Survey 2018, it is expected that the slice of digital marketing in marketing
budgets will increase from 44% to 54% in the next five years.
For Financial Times, digital marketing (DM) is defined as “the marketing of products or
services using digital channels to reach consumers. The key objective is to promote
brands through various forms of digital media”. The same institution argues that DM is
more than internet marketing, including mobile phones, social media marketing, display
advertising, and search engine marketing. Kannan and Li (2017) defined DM as “an
adaptive, technology-enabled process by which firms collaborate with customers and
partners to jointly create, communicate, deliver, and sustain value for all stakeholders”
(p. 23). Alternative options for DM can be “online marketing”, “internet marketing” or
“web marketing” (Todor, 2016).
Mainly, for small businesses, DM is a crucially important opportunity due the relative
costs involved allowing them to compete with bigger firms, so they need to consider how
they can use different digital tools as a way to enhance their customer relationships
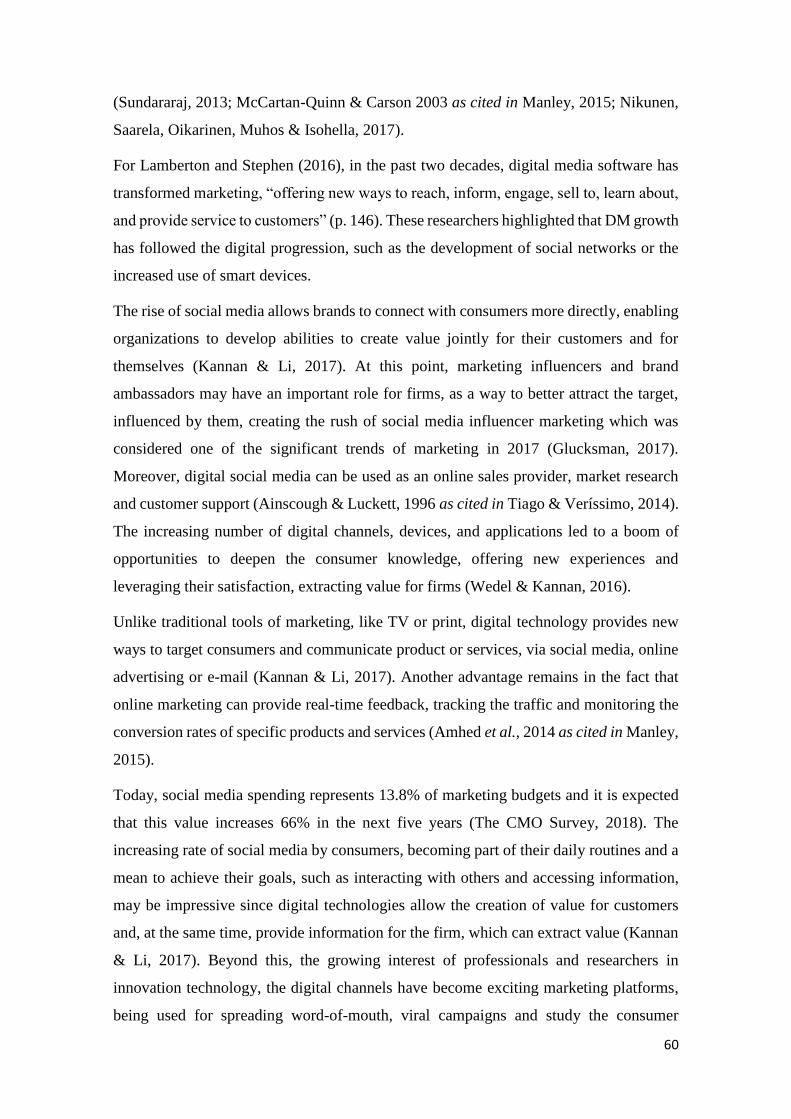
60
(Sundararaj, 2013; McCartan-Quinn & Carson 2003 as cited in Manley, 2015; Nikunen,
Saarela, Oikarinen, Muhos & Isohella, 2017).
For Lamberton and Stephen (2016), in the past two decades, digital media software has
transformed marketing, “offering new ways to reach, inform, engage, sell to, learn about,
and provide service to customers” (p. 146). These researchers highlighted that DM growth
has followed the digital progression, such as the development of social networks or the
increased use of smart devices.
The rise of social media allows brands to connect with consumers more directly, enabling
organizations to develop abilities to create value jointly for their customers and for
themselves (Kannan & Li, 2017). At this point, marketing influencers and brand
ambassadors may have an important role for firms, as a way to better attract the target,
influenced by them, creating the rush of social media influencer marketing which was
considered one of the significant trends of marketing in 2017 (Glucksman, 2017).
Moreover, digital social media can be used as an online sales provider, market research
and customer support (Ainscough & Luckett, 1996 as cited in Tiago & Veríssimo, 2014).
The increasing number of digital channels, devices, and applications led to a boom of
opportunities to deepen the consumer knowledge, offering new experiences and
leveraging their satisfaction, extracting value for firms (Wedel & Kannan, 2016).
Unlike traditional tools of marketing, like TV or print, digital technology provides new
ways to target consumers and communicate product or services, via social media, online
advertising or e-mail (Kannan & Li, 2017). Another advantage remains in the fact that
online marketing can provide real-time feedback, tracking the traffic and monitoring the
conversion rates of specific products and services (Amhed et al., 2014 as cited in Manley,
2015).
Today, social media spending represents 13.8% of marketing budgets and it is expected
that this value increases 66% in the next five years (The CMO Survey, 2018). The
increasing rate of social media by consumers, becoming part of their daily routines and a
mean to achieve their goals, such as interacting with others and accessing information,
may be impressive since digital technologies allow the creation of value for customers
and, at the same time, provide information for the firm, which can extract value (Kannan
& Li, 2017). Beyond this, the growing interest of professionals and researchers in
innovation technology, the digital channels have become exciting marketing platforms,
being used for spreading word-of-mouth, viral campaigns and study the consumer

61
behaviour, much more precisely (Lamberton & Stephen, 2016). Some studies have also
stressed that e-WOM spreading can leverage marketing effectiveness through online
engagement, CTR, and e-satisfaction, leading to loyalty (Gruen, Osmonbekov, &
Czaplewski, 2006 as cited in Roy et al., 2017) and sales (Chevalier & Mayzlin, 2006 as
cited in Roy et al., 2017).
Despite the given importance to DM and social media, professionals assume that
companies do not know how to convert data collected from social media into concrete
strategies, because they are worried about gathering the most data, but not the appropriate
and meaningful data (Grimes, 2013 as cited in Lamberton & Stephen, 2016). VEM (2017)
reports the problem that many marketers have with connecting data to strategic decisions
and efficiency improvement. For example, Saura et al. (2017) found some issues on the
use of developing web analytics research, pointing out that its analysis is not being used
strategically, leading to imprecise outcomes. It is true that customer relationship
management (CRM) and business intelligence technology have made the data more
accessible and its analysis easier (Lenskold, 2002), but some marketers prefer to continue
believing on their intuition and subjective opinions for decision-making (Germann, Lilien
& Rangaswamy, 2013).
According to Xu, Frankwick and Ramirez (2015), companies are more frequently
applying big data analytics (BDA) “such as web analytics, search analytics, search engine
optimization, customer analytics, and pay-per-click management to obtain automated and
customized knowledge” (p. 1563). The CMO Survey 2018 predicts that spending on
marketing analytics will increase more than 200% in the next three years. Big Data has
played a significant role in the marketing process. It is required that companies have
skilled people on gathering useful data, before using metrics and analytics to measure it.
In fact, data has been considered “the oil” of the digital economy (Wedel & Kannan,
2016), but to be relevant, “data must be accessible and integrated”, which is a hard task
because it is provided by different software and different channels (VEM, 2017).
According to a report by VEM (2017), one-third of all marketing firms have to improve
their performance in using data. In fact, social media can provide lots of information, but
some of it is not useful. Despite the decisive role of data in firms, enabling to improve
customer relationships or automate marketing processes in real time (Wedel & Kannan,
2016), the useful data should be analysed, monitoring key performance indicators and
metrics, making it effective (Misirlis & Vlachopoulou, 2018).

62
Hanssens and Pauwels (2016) suggest that if marketing wants to be perceived as a firm’
strategic key, their provided databases should be better combined with the marketing mix
elements, covering customer and marketing data in one platform, providing an effective
view of the marketing value.
4.3.3. DIGITAL MARKETING PERFORMANCE MEASUREMENT
Digital technology has transformed marketing measurement with lots of data, metrics,
and tools (Spiller & Tuten, 2015). With the increasing interaction between customers and
brands, through social media and other digital channels, there was a need to track all these
interactions and realize which channel has better performance (Chaffey & Patron, 2012
as cited in Järvinen & Karjaluoto, 2015).
Web analytics (WA) seems to be the key to help firms on “measurement, collection,
analysis, and reporting of Internet data for the purposes of understanding and optimize
web usage” (Digital Analytics Association, 2008). Nowadays, brands can have access to
consumer behaviour patterns, through advancements in digital and social media that track
consumer’s web activity. These tools allow knowing how many times the brand or
product was mentioned or tracking conversations about a brand or subject (Spiller &
Tuten, 2015).
Web Analytics (WA) might be quantitative or qualitative and should align with DM
objectives and help in strategic decisions, being the basis of assessment DM (Saura et al.,
2017). Once setting the main objectives that depend on budget constraints and data
accuracy, marketers can choose which metrics and KPIs are more useful. For example,
Kaushik (2009) suggests that objectives as revenue increasing, cost reduction and
customer satisfaction and loyalty increasing are usual types of objectives from
quantitative data. Reinforcing this idea, Kaplan & Haenlein (2010) (as cited in Misirlis
& Vlachopoulou, 2018) say that it is important to follow a specific plan including the
metrics choices, otherwise, marketers won’t be able to link data into meaningful insights.
Hence, social media analytics have become important for firms that can extract data from
social networks such as Facebook, LinkedIn, and Google+, giving helpful information
for marketers in an economical measure (Roy et al., 2017).
Nonetheless, despite the importance of WA for measuring digital efforts, DM
effectiveness continues to be an ongoing subject (Saura et al., 2017) and the evidence that
measuring DM performance with WA is leading to an efficiency growing and, as a

63
consequence, is leading to a sales revenue increase (Wilson, 2010) becomes unclear. In
fact, the literature has discussed the benefits of WA employment for DM performance
measurement (Järvinen & Karjaluoto, 2015). In this context, measuring DM efforts and
DM results are two areas of improvement (Xu et al., 2015). Despite all the information
provided by analytics, the marketing value assessment, which is described as “the
identification and measurement of how marketing influences business performance as
well as the accurate calculation of return on marketing investment (ROMI)” remains a
difficult task for marketers, since now they need to integrate lots of data (big and small
data) and marketing analytics in their actions (Hanssens & Pauwels, 2016, p. 173).
Chong, Bian, and Zhang (2016) reported that e-marketing services, such as e-CRM, e-
CSM, e-competitiveness, IS/IT integration and information transparency, have a powerful
positive relationship with SME’s e-marketing performance, influencing firms’ growth,
regardless of the industry. Thus, firms should be informed of the impact of e-marketing
services in performance and should assess the effectiveness of an e-marketing investment.
Järvinen and Karjaluoto (2015) have highlighted the lack of studies regarding why firms
opt for certain WA metrics and ignore others. Marketing performance measurement has
been suffering from a focus on subjective indicators, which are difficult to address
financial outcomes (Stewart, 2009). For example, 80% of American B2C marketers
measure the effectiveness of their social content with social media metrics, being “likes”
the more common indicator (Association of National Advertisers, 2014 as cited in AMA,
2015).
WA can provide objective and quantitative metrics, making the data easier to access,
analyse and communicate to the top management. WA, for example, provides indicators
of the effectiveness of each marketing technique implemented, such as SEO, SEM,
research marketing or content marketing (Saura et al., 2017).
One of the issues regarding this topic is the possible huge number of metrics and the little
agreement among authors about which are the most meaningful (Mavridis & Symeonidis,
2015). Despite the vast number of digital metrics and KPIs, each one of them is fitted to
a specific aspect of the DM plan (Kaushik, 2009; Saura et al., 2017). According to the
AMA (2015), the number of digital metrics has risen to thousands. After Advertising
Research Foundation enumerated 197 metrics to be used on digital channels, AMA
reacted saying that “brands do not need 197 digital metrics or even a tenth…” Thus,
companies should identify which are the most helpful metrics for each situation and each
64
channel, depending on the strategy proposed to accomplish the firm’s goals, in order to
increase visibility and conversion rates (Saura et al., 2017). Moreno, Tejeda, Porcel,
Fujita & Viedma (2015) corroborate that each organization should identify the metrics
they think are the most relevant and meaningful, depending on each campaign and
channel.
In the same direction, Celeste and Moniz (2019) write that there is no single metric that
will serve all companies, each case is a case, depending on its culture, objectives, the
sector of activity, life cycle, orientation to B2C or B2B markets, the benchmarking model,
among other variables. That will determine the greater or lesser applicability of each
metric. Hence, they defend that, due the growing pressure for a cause-and-effect
explanation at all firms’ levels, there is a need for the application of capable metrics to
the reality of each company, allowing a correct vision of its events.
In this context, the increasing pressure for a cause-and-effect explanation at the strategic,
operational, financial and commercial level requires that metrics that are as appropriate
as possible to the reality of each company be used to enable a correct reading of events.
Järvinen and Karjaluoto (2015) developed the first-ever research on how industrial
companies can take advantage of WA to improve their DM performance measurement
practices, studying three companies from three different sectors: steel, machinery, and
paper. The study highlights the importance of managers not focusing on the number of
metrics but designing a metrics system linked to top management objectives. The process
begins with the identification of the main specific KPIs linked to the marketing objectives,
focusing only on the most important objectives. Only after this selection, should the
manager evaluate other metrics for a more extensive analysis of why performance is
above or below the established KPIs. Then, the authors argue that the metrics that
compose the WA metric system should be interrelated, such as the system used by the
steel company, shown in TN Table 1.

65
In fact, the first step in the social media measurement process, for instance, is not the
metric selection, but the business goals establishment, such as an increase in brand
awareness or leads generation (AMA, 2015). AMA (2015) proposes a process of
measuring social media that begins with the main business goals, followed by specific
objectives and the strategies to achieve these objectives, and after the actions that help
strategies, finish with KPIs. Moreover, literature review outlines that the most reliable
metrics depend on the different contracting models used by companies to estimate digital
advertising rates (Saura et al., 2017), as shown in TN Table 2.
Practitioners and researchers conducted many studies, providing lists of metrics in order
to help companies to measure their DM performance. In this way, McKinsey and Google
(2013) developed OMEX (Online Marketing Excellence), an incisive dashboard with 40
dominant DM KPIs. Kelly (2012) launched a manual of measurement of social media
ROI for different strategies, emphasizing the importance of the use of social media and
its link with business outcomes, across the sales funnel. Farris, Bendle, Pfeifer, and
Reibstein (2015) provided a third edition of “The definitive guide to measuring marketing
performance”, outlining the interconnection between all metrics and the financial
Source: Järvinen and Karjaluoto (2015)
Source: Saura et al. (2017)
TN TABLE 1. STEEL’S WEB ANALYTICS METRICS FOR THE DIFFERENT STAGS OF CUSTOMERS’ PATH TO
PURCHASE
TN TABLE 2. TYPE OF ADVERTISING CONTRACTING MODEL
DESCRIPTION
ONE OF THE MOST COMMON WAYS OF BUYING DIGITAL MEDIA
HERE THE ADVERTISER PAYS WHEN A CLICK IS MADE ON AN AD
THE ADVERTISER PAYS WHEN A LEAD FORM IS COMPLETED AND
HERE THE ADVERTISER PAYS ONLY IF A FORM OR LEAD IS MADE
TYPE OF ADVERTISING CONTRACTING MODEL
CPI (COST PER IMPRESSION) OR CPM (COST PER THOUSAND
IMPRESSIONS)
PPC (PAY PER CLICK) AND CPC (PAY PER CLICK)
CPL (COST PER LEAD)
CPA (COST PER ACTION)

66
consequences of marketing actions. AMA (2015) also contributed to the research on this
topic, writing a special report about social media metrics. Marketo (2011) developed an
extensive report that provided a framework for measurement, including a step-by-step
guide to calculate digital marketing ROI.
Some researchers have divided marketing metrics according to their characteristics, in
homologous categories. Spiller and Tuten (2015) propose two big groups of metrics:
financial and non-financial. Tuten and Solomon (2015) categorized metrics in three types:
activity, interaction, and return. Mintz and Currim (2013) grouped performance metrics
according to 10 marketing-mix decisions. VEM (2017) developed a measuring
framework breaking down the metric in six categories: activity, output-based,
operational, outcome-based, leading indicators, and predictive.
4.3.3.1. ALIGNMENT AND ACCOUNTABILITY – INTEGRATING FINANCIAL INDICATORS
Since the beginning of the 80s that firms are concerned with finance, a topic that really
matters for them. This trend has been leading to an increasing pressure to deeply know
the numbers. However, the financial side has rarely been able to measure the values of
intangible subjects, such as branding or marketing, that increase many firms’ value (MSI,
2004).
In a cost reduction era, companies begun shrinking their budgets for all departments, and
marketing is no exception. This way, there is an increased pressure to be more profitable,
and effective strategies are necessary. For this, firms require clear measurements. The
problem is that studying just brand loyalty or customer satisfaction is not enough to prove
the value that would justify a marketing department not being outsourced. Thus, ROI is a
metric widely used to measure the return on the financial value of marketing actions
(VEM, 2017).
There has been an increasing concern in marketing accountability, as reported by Deloitte
(2007) and VEM (2010). VEM (2010) found that more than half of firms’ marketers were
not prepared to align the business outcomes and marketing programs or measuring the
value of marketing to their managers. By treating marketing as an investment rather than
a cost, the need to use financial metrics becomes urgent (Seggie et al., 2007). John
Wannamaker said, “half the money I spend on advertising is wasted; the trouble is, I don’t
know which half.” This remains actual despite the relevant data that today marketers can
access (Spiller & Tuten, 2015).

67
Marketers do not always link the most used metrics to broader business initiatives and,
therefore, they are compromising ongoing investments in marketing (VEM, 2010). A
study conducted by Tiago and Veríssimo (2014) composed by 170 marketing managers
from the largest firms in Portugal showed that managers preferred to measure DM
effectiveness through engagement metrics, such as brand awareness, word-of-mouth buzz
and customer satisfaction rather than more conventional ones, like page views, cost per
thousand impressions and click through rate. Brand awareness or organic reach search
rankings metrics, known as soft metrics, are important but they should be connected,
quantifiable, to hard metrics, like revenues or profits (Marketo, 2011). Estimating the ROI
should be a priority for every marketer in order to prove the value of marketing for the
business. Lenskold (2002) argues that marketers should not ignore other metrics and
goals, but he defends that ROI is unconditionally critical for measuring marketing to
decision-making, maximizing the firm’s profits. In fact, by calculating the marketing
efforts, through ROI calculation, it is possible to recognise that the value and contribution
of marketing actions can be measured in money (Fu et al., 2018).
In an investigation by Järvinen and Karjaluoto (2015), regarding WA use for DM
performance measurement in big industrial companies, one respondent stressed the
importance of financial metrics for DM measurement: “As in all marketing themes, it is
particularly challenging, finding financial metrics that show our return on investment” (p.
122).
Journal of Marketing (2016) has focused its attention on what is missing to marketers to
efficiently measure, showing the value of marketing and three gaps that needed to be
addressed to completely measure and demonstrate its value (Kumar & Reinartz, 2016 as
cited in Fu et al., 2018). They should have trustworthy performance metrics, not only at
behavioural pattern but also at the financial level. They should also predict marketing
investments to performance outcomes. The research still outlines that marketers need to
communicate effectively to demonstrate the value of marketing to stakeholders. Hanssens
and Pauwels (2016) also corroborate that analytic insights are not being communicated
effectively to lead to decisions.
A usual excuse used by marketers failing the link between marketing activities and
financial results is the countless effects of marketing and that these are not always
immediate (Stewart, 2009). Stewart (2009) argues that there are actions with an
immediate and long-term effect and measurement does not necessarily have to be

68
connected to a short-term orientation. Although the future is unpredictable, the need to
establish a link between marketing activities and results is essential, then each action
should be connected to a source of cash flow. The author proposes three different
outcomes groups, linked to marketing activity: short-term (incremental) effects, long-
term (persistent) effects, and real options, illustrated in TN Figure 3.
Despite ROI calculation being difficult and complex, it is not impossible (Luke, 2013).
Many authors have provided some frameworks helping companies to calculate ROI,
varying from a simple math operation (Klein & Swartzendruber, 2003; Saura et al., 2015),
to a more complex concept, hard to calculate (Lenskold, 2002; Luke, 2013; Lopresti,
2014; Suárez & Estevez, 2016; Fu et al., 2018). Fu et al. (2018) argue: “ROI Marketing
represents a standard by which all marketing efforts including advertising, direct
marketing, social media, digital marketing, PR events, point-of-sale marketing, personal
selling, branding, and the like can be linked to the business. ROI Marketing shows the
value of marketing investments in cash and links its contribution to a budget” (p. 9).
The marketers should use marketing ROI as a strategic way and as a decision-making
insight. Klein and Swartzendruber (2003) argue, “marketing ROI can help you make
sound decisions before, during, and after budgeting” (p. 33). Lenskold (2002) has the
same idea, arguing that this measure connects to strategic decisions at all levels of
business, making the budget and resources allocation decisions easier. Fu et al. (2018)
expressed that ROI predicts their impacts on business goals, shows the value of marketing
Source: Stewart (2009)
TN FIGURE 3. TYPES OF RETURN ON MARKETING
ACTIVITIES

69
investments and allows the measuring of online and offline campaigns, projects, events,
and initiatives.
Hanssens and Pauwels (2016) distinguished effectiveness and efficiency as measures of
the value of marketing. Effectiveness has to do with “the ability to reach the goal” and
efficiency is “the ability to do so with the lowest resource usage” (p. 177). Rust et al.
(2004) also stressed this difference, giving an example that price promotions can be
efficient, in a way that they provide short-term revenues, and not effective in a long-term
perspective because they can lead to a loss of brand equity. To measure efficiency, ROI
should be calculated, usually leading to a budget reduction or a reduction in inefficient
marketing actions or programs.
There are plenty of performance metrics, some of them are based on attitudes or
perceptions that are important but are hard to measure, and they are not linked with
financial performance. Knowing which metrics fit in each situation is crucial to improve
and prove the value of marketing. That is why it is mandatory to select the right metrics
(VEM, 2017).
4.3.3.1.1. THE ROI MARKETING METHODOLOGY
Developed by Phillips and Phillips (2007), the ROI methodology is a step-by-step
marketing ROI measurement process that attempts to reply to the need to show the value
of marketing. According to ROI Institute Canada, more than 4000 organizations using the
ROI methodology have reported improvements in programs, group image, and work
relationships. This approach assumes that the company conducts an appropriate analysis
to define the need before the beginning of the method. The first phase starts with the
evaluation planning, that incorporates the objectives, the procedures, the purpose of the
evaluation and the planning of what is going to be measured.
This model encompasses six types of measures or data levels (Level 0: Inputs/Indicators;
Level 1: Reaction and Perceived Value; Level 2: Learning and Confidence; Level 3:
Application and Implementation; Level 4: Impact and Consequences; Level 5: ROI),
throughout the whole process, reflecting a new value methodology. The Philips ROI
Model is an advanced model of Donald Kirkpatrick’s Four-Level Model, which only
contained the reaction, learning, behaviour, and results phases. Philips and Philips (2007)
also added the financial component to the assessment, level 5, with the ROI calculation,
in addition to level 0, which includes the inputs.

70
This method is easy to implement, credible and consistent with 12 guiding principles that
can be replicated in any project or program and speaks the same language as CEOs and
CFOs.
To calculate ROI Marketing, level 5, the impact data is converted into monetary amounts
and compared to all the project costs. This level shows the production, productivity,
revenue, quality, time, cost, efficiencies, and level of customer satisfaction connected to
the project, so it is a crucial step, allowing to show the impact within the organization in
various groups and systems. In the ROI calculation level, the monetary benefits are
compared with the total costs involved (all necessary expenses that supported the
marketing programs, such as initial cost analysis, cost of design, cost of all project
materials, costs of the project team, costs of the facilities, costs of travel, lodging and
meals, administrative costs, and evaluation costs). The value is usually presented in terms
of benefits-to-costs ratio (BCR = Project Benefits / Project Costs), ROI as a percentage
or the payback period.
In 2018, the Philips Model was updated, taking into account digital development,
including DM and social media analysis. Fu et al. (2018) present a new version of the
ROI marketing methodology, illustrating that the value and contribution of most
marketing projects and campaigns, whether offline or online, can be measured in cash.
The authors point out that marketing returns must be measured quantitatively, and for
most marketing investments, there is a way to calculate ROI using accounting practices.
The model proposes a feedback-system intervention, adding value to the ROI marketing
methodology, presenting five important elements: 1) an evaluation framework, 2) the
process model, 3) operating standards and philosophy, 4) case applications and practice,
and 5) implementation (See Figure TN Figure 4). The ROI marketing methodology is
customer focused and specifically designed to provide critical feedback to professionals
and marketing managers. It can be applied to B2C marketing like B2B and internal
marketing. It allows the measurement of both online campaigns (digital and social media
marketing) and offline (direct marketing, points of sale, PR events, salespeople, branding
and advertising) in any industry and marketing field, allowing to show the value and
contribution of the marketing, in cash. The ROI marketing methodology allows keeping

71
the essence of marketing as well as it realizes the impact of marketing on financial results
in a credible and reliable way.
4.3.3.2. MONITORING AND COMMUNICATING THROUGH ACTIONABLE DASHBOARDS
Establishing metrics and key performance indicators can help companies to have a better
picture of the success of their effort. Once companies measure the value of marketing, it
is important to report it to the entire organization, notifying the objectives in marketing
dashboards and adopting the tone of communication of each decision maker (Hanssens
& Pauwels, 2016).
If companies want to be performance oriented, they must align with the business
outcomes and find support in metrics to demonstrate the contribution and impact of
marketing on results by progressively measuring their effectiveness. Hence, the alignment
between marketing and business makes it possible to quantify the value that marketing is
providing to the company. Järvinen and Karjaluoto (2015) emphasize a clear
measurement process for managing WA metrics of a steel company, with a clear
definition of responsibilities for the use of WA data. This process is a good example of
the measurement of the effectiveness, where managers ensure that DM outcomes are
reported directly to top management, reporting the KPIs directly and ensuring the DM’s
contribution to performance. TN Figure 5 shows the process used by the company, which
uses Google Analytics to measure WA by determining the effectiveness of each DM
action and linking it to lead generation, which is stored in CRM over time, recognising
which leads result in sales.
Source: Fu et al. (2018)
TN FIGURE 4. THE ROI MARKETING PROCESS MODEL
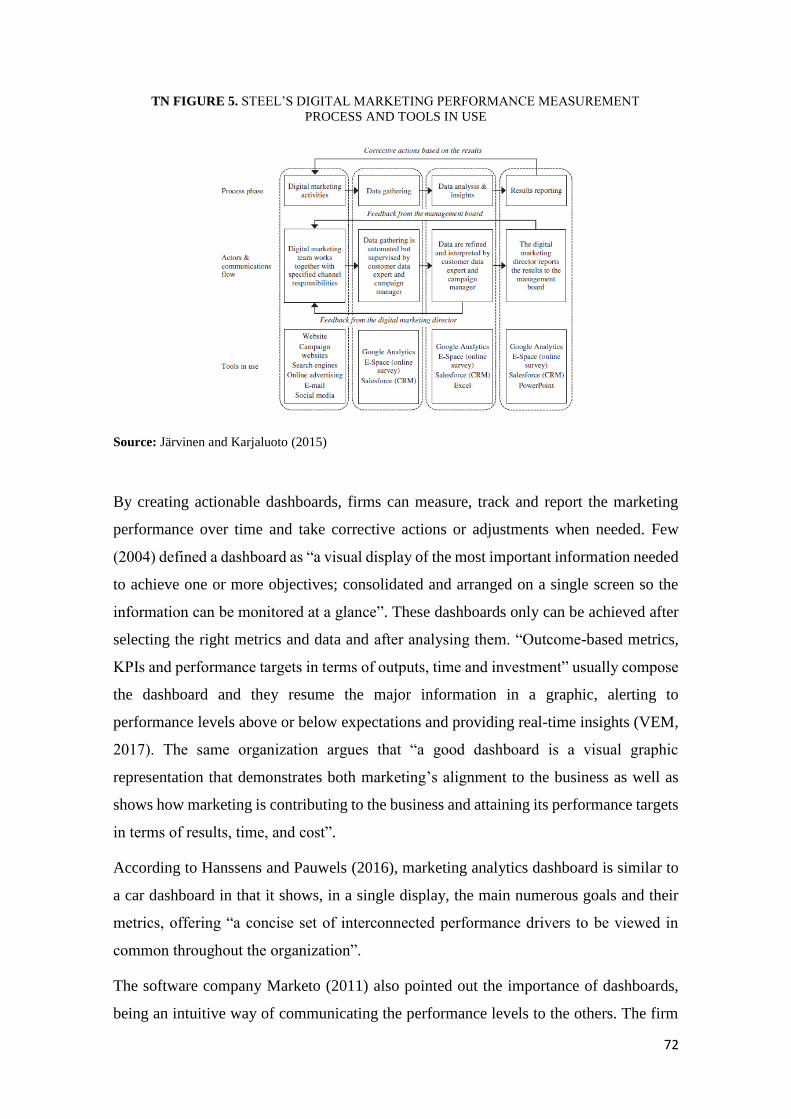
72
By creating actionable dashboards, firms can measure, track and report the marketing
performance over time and take corrective actions or adjustments when needed. Few
(2004) defined a dashboard as “a visual display of the most important information needed
to achieve one or more objectives; consolidated and arranged on a single screen so the
information can be monitored at a glance”. These dashboards only can be achieved after
selecting the right metrics and data and after analysing them. “Outcome-based metrics,
KPIs and performance targets in terms of outputs, time and investment” usually compose
the dashboard and they resume the major information in a graphic, alerting to
performance levels above or below expectations and providing real-time insights (VEM,
2017). The same organization argues that “a good dashboard is a visual graphic
representation that demonstrates both marketing’s alignment to the business as well as
shows how marketing is contributing to the business and attaining its performance targets
in terms of results, time, and cost”.
According to Hanssens and Pauwels (2016), marketing analytics dashboard is similar to
a car dashboard in that it shows, in a single display, the main numerous goals and their
metrics, offering “a concise set of interconnected performance drivers to be viewed in
common throughout the organization”.
The software company Marketo (2011) also pointed out the importance of dashboards,
being an intuitive way of communicating the performance levels to the others. The firm
Source: Järvinen and Karjaluoto (2015)
TN FIGURE 5. STEEL’S DIGITAL MARKETING PERFORMANCE MEASUREMENT
PROCESS AND TOOLS IN USE
73
argues that the best dashboards are not just reports, but catalysts for effective decision-
making, guiding the way that firm’s people think.
4.4. ANALYTICAL FRAMEWORK PRESENTATION
This case was developed based on information grant by Forall Phones, through two
formats: data available from their website and social media, interviews and permanent
contact with José Alves, Head of Performance, and Bernardo Carreiro, Financial
Controller, from Forall Phones, as well as quantitative and qualitative analysis to the
refurbished market, in Portugal.
For a better analysis, the resolution should be based on two types of analysis, quantitative
and qualitative. In this vein, the two approaches complement one another and allow a
better perception of the market under analysis, as well as the firm and its performance
measurement process. Through these analyses, it is expected that students can solve the
case, as well as give recommendations and develop their critical spirit on the subject. The
quantitative analysis tries to help students in the company’s contextualization and its
market, and all that surrounds them, such as external indicators to the firm,
macroeconomic indicators, and market evolution, as well as internal indicators. Hence,
the analysis has its base on the following secondary data sources:
1. Smartphone and refurbished smartphone data:
• Mobile phone and smartphone penetration in Portugal;
• Market share of used smartphones worldwide;
• Smartphone sales worldwide;
• Global smartphone shipments;
• Refurbished vs. new smartphones shipments growth;
• Biggest smartphone players shipment volumes;
• Regional annual comparison in the global smartphone market.
2. Macroeconomic and social indicators data:
• Wages, tax burden contribution and unemployment rates in Europe and Portugal;
• E-commerce penetration in Portugal and Europe;
• Evolution of internet penetration in Portugal.
3. Forall Phones’ internal data:

74
• Pricing positioning analysis;
• Sales by channel and total sales units;
• Marketing investment by channel and cost per acquisition by sale;
• Digital marketing performance analysis file;
• Performance analysis dashboard.
The qualitative analysis intends to complement the quantitative analysis, providing
essential tools for the case study analysis, as well as valuable insights to the subject, due
to its strategic character. Thusly, it is expected that students consider the following
sources of analysis:
• A broad analysis of Forall Phones as a whole such as their history, business idea,
operating model, product assortment, store location, and payment terms.
Furthermore, the focus is on their marketing department: digital marketing tools
and platforms used and their importance to the business, the process of measuring
and everything that it involves, the metric system for measuring campaign
examples;
• Best practices on the subject: metrics choice described in reports, scientific
articles and books, and the processes used in calculating ROI marketing;

75
4.5. ACTION PLAN
TN TABLE 3. ACTION PLAN
Source: Self-Elaboration (2019)
LECTURE OBJECTIVES ACTION PLAN TIME
CASE STUDY DISTRIBUTION BY THE STUDENTS;
SUBJECT SUMMARY AND CASE STUDY PRESENTATION;
INTRODUCTION OF FORALL PHONES AND ITS RESPECTIVE MARKET;
INTRODUCTION OF THE MARKETING PERFORMANCE MEASUREMENT TOPIC, WITH A
SPECIAL FOCUS ON THE DIGITAL MARKETING;
TO GRAB THE ATTENTION TO FINANCIAL METRICS;
GROUP WORKS CREATION (4-5 ELEMENTS), DRAWED IN CLASSROOM
INDIVIDUAL READING OF THE CASE, WITH THE RESPECTIVE ANALYSIS AND IDENTIFICATION
OF THE MAIN TOPICS
BRAINSTORM OF IDEAS IN GROUP, RESULTING FROM THE INDIVIDUAL READINGS
IN-CLASS DISCUSSION ON THE IMPORTANCE OF THE FORALL’S MARKETING DEPARTMENT;
IN-CLASS DISCUSSION ON THE PERFORMANCE MEASUREMENT PROCESS BY FORALL
PHONES;
IN-CLASS DISCUSSION ON FORALL PHONES’ STRONGER AND WEAKER POINTS, IN ITS
MEASUREMENT PROCESS;
TO DO A CONNECTION WITH THE BEST PRACTICES OF DIGITAL MARKETING PERFORMANCE
MEASUREMENT;
PRESENTATION OF THE FIRST THREE CASE QUESTIONS
DEEP CASE STUDY ANALYSIS;
GROUP DISCUSSION;
RESOLUTION OF QUESTIONS;
ADDITIONAL READING OF PAPERS AND BOOKS, AS WELL AS GOOD PRACTICES IN DIGITAL
MARKETING PERFORMANCE MEASUREMENT
IN-CLASS DISCUSSION ON THE BEST PRACTICES OF MEASUREMENT;
DISCUSSION ON THE IMPORTANCE OF MARKETING OBJECTIVES FORMULATION;
DISCUSSION OF THE IMPORTANCE OF MARKETING ROI CALCULATION AND HOW TO
CALCULATE IT;
PRESENTATION OF THE THREE FINAL QUESTIONS
ADDITIONAL RESEARCH EFFORT (BOOKS, BEST PRACTICES, REPORTS AND SCIENTIFIC
ARTICLES READING);
LAST THREE QUESTIONS RESOLUTION
PPT PRESENTATION (30 MIN);
GENERAL EVALUATION OF THE PERFORMANCE MEASUREMENT PROCESS OF FORALL
PHONES;
GIVE SOME RECOMMENDATIONS FOR IMPROVEMENT;
PARALLELISM AND CONNECTION WITH THE THEORETICAL SUBJECT;
EVALUATION AT THE END OF EACH PRESENTATION BY THE TEACHER AND COLLEAGUES (10
MIN)
ASSESSMENTCASE RESOLUTION (50%) + PRESENTATION (30%) + DISCUSSION/GIVEN
RECOMMENDATIONS QUALITY (20%)
DISTRIBUTION OF THE BEST ANSWERS FOR FURTHER STUDY;
FINAL RECOMMENDATIONS TO EACH GROUP;
QUESTIONS AND GENERAL FEEDBACK
45 MINOVERALL FEEDBACKFINAL LECTURE
4TH & 5TH
LECTURE
CASE STUDY PRESENTATION AND
CLASS DISCUSSION180 MIN
90 MIN
CONTINUATION OF THE CASE
PRESENTATION (LAST THREE
QUESTIONS)3RD LECTURE
180 MINCASE RESOLUTION (LAST THREE
QUESTIONS)
OUT OF THE
LECTURE
PRESENTATION OF THE THREE
FIRST QUESTIONS; INTEGRATING
THE THEORETICAL KNOWLEDGE IN
THE CASE
2ND LECTURE 90 MIN
90 MINCASE RESOLUTION (FIRST THREE
QUESTIONS)
OUT OF THE
LECTURE
TO FOSTER THE STUDENTS'
INTEREST AND AWARENESS IN THIS
CASE1ST LECTURE 75 MIN
TO ANALYZE THE CASE STUDY,
LEARNING FROM A REAL PRACTICAL
CASE
OUT OF THE
LECTURE60 MIN

76
4.6. ANIMATION QUESTIONS
• How do you see the evolution of the refurbished smartphone segment in Europe
and Portugal, since 2016?
• Have you heard about Forall Phones? How? Have you bought any Forall’s
products?
• In your opinion, what are the main DM metrics that any firm should track and
why?
• What suggestions would you give to Forall Phones in order to improve their
performance measurement process?
• In your opinion, which stage of the DM performance measurement process has
more impact and importance in the process as a whole?
• What was the main challenge found in the present case? What data should have
been provided for a better understanding of the case?
4.7. CASE STUDY RESOLUTION PROPOSAL
4.7.1. “It was here that José saw a business opportunity of buying and selling used
smartphones, creating the Forall Phones”. Based on that information, try to explain
how some macroeconomic indicators, smartphone market data and other relevant
associated data may have led to the Forall Phones’ business idea.
Since the economic crisis in 2008, Portugal is at the end of Europe’s tail, as reported in
the case study, regarding low minimum wages, the high cost of living compared to the
salary received, medium wages far below the other countries, as well as high tax
contributions to the GDP. In addition, the unemployment rate by 2013 has hit record
values, despite its stabilization, in line with the EU average.
With this bad scenario, the post-crisis years were years of containment for the vast
majority of the Portuguese due to wage cuts and the rise of direct taxes, such as the IRS.
As a result, many consumption patterns and lifestyle habits had to be changed, turning
into a radical change in the hierarchy of priorities in the Portuguese daily life. In addition,
still in 2018, around 22.9% of the population residing in Portugal was covered by the

77
minimum wage (at the date 580 €). In this negative scenario, some “accessory” goods
such as mobile phones were placed in the background, with a 28% decrease in mobile
phones sales in 2008, possibly explained by the crisis, as an IDC researcher defends.
However, in 2010, the number of Portuguese with smartphones began to grow, reaching
almost seven million Portuguese, in a total of nine million mobile phones, being more
and more a growing trend (the smartphone penetration in the Portuguese doubled 32.5%
from 2012 to 75.1% in 2018). In fact, nowadays the smartphone is seen as a fundamental
part of the daily routine, with various models and brands released, for every preference.
Worldwide, the smartphone market has grown in the last decade at an amazing pace, only
declining from 2016 to today.
This decline in the global smartphone market has been pointed to the appearance and the
supported rise of used and refurbished segment that can present considerably lower prices
than those of the new smartphones. This market has gained so much weight that, Deloitte
has quantified it at 17 billion USD$, in 2016 and, according to the same entity, its growth
rate is expected to be 4-5 times higher than the global market, in the next years.
In addition, IDC quantified the market in 2017 was worth 19 billion USD$, and predicts
that, in 2022, it will worth 52.7 billion USD$. As this market grows, the global one has
been growing at much lower rates than the refurbished, since 2016, having a drastic
slowdown compared to previous years (the global market has grown only 3.1% from 2016
to 2017). Used and refurbished smartphones have been responding to some issues that
have led new smartphones to shipments’ ruptures. To point out the much more affordable
prices, allowing consumers to purchase a high-end smartphone at prices 40% lower; the
refresh cycles required; the growing of right-to-repair movement, allowing the increased
life cycle; the circular economy; and the reduction of electronic waste on the planet.
Along with refurbished growth, the cheapest brands have managed to gain prominence in
the global market offering high-end technology at cheaper prices than the ones offered by
iPhone or Samsung, for instance. In this sense, brands like Huawei or Xiaomi justify their
growth and brands such as Samsung also launch their own used mobile phones at lower
prices, answering to the lost revenue and market share.
Combining these very positive market indicators and the Portuguese and European
economic indicators, Forall Phones was created, exactly in the year in which the trend
began to reverse and the used mobile phones began to gain greater prominence. In this

78
context, the company that sold, essentially, second-hand and refurbished smartphones,
entered the Portuguese market, followed later by some prestigious players with a
sustained positioning in the electronic market in Portugal, such as Fnac, Worten or Radio
Popular.
Forall’s commitment to physical stores combined with digital is also due to a great
knowledge of the Portuguese market and the typical consumer, who still prefers to try the
product in the store. By taking advantage of e-commerce growth, as well as the evolution
of Internet penetration in Portugal, online also has an outstanding role, serving as a
launching pad for in-store purchases.
The following figure summarizes the sources of indicators that may have led to the
creation of Forall Phones.
TN FIGURE 6. INDICATORS THAT MAY HAVE LED TO THE CREATION OF FORALL PHONES
Source: Self-Elaboration (2019)

79
4.7.2. Based on the following figure, draw the digital marketing performance
measurement process, adopted by Forall Phones and comment, briefly, based on the
knowledge acquired.
The digital marketing performance measurement process that Forall adopts has a very
clear direction and organization, in which all steps are interconnected and depend on each
other. In a first stage, the objectives to be established (sales and profitability levels) based
on the type of customer to be achieved, allow strategists to align the entire digital
marketing plan, including, for instance, channels to choose from, as well as the content
and message to communicate. Afterwards, it is important to have all data extraction,
analysis and reporting files and platforms well standardized, as a way to take relevant and
unbiased conclusions from them.
Through continuous monitoring of the campaigns and actions performance, through
strategic and result-oriented KPIs, and strict costs and budget control, the firm is able to
adopt strategies at an operational level, correcting perceived gaps almost in real time. This
TN FIGURE 7. DIGITAL MARKETING PERFORMANCE MEASUREMENT PROCESS ADOPTED BY FORALL
PHONES
Source: Self-Elaboration (2019)

80
allows a continuous improvement of actions. The company constantly tries to perceive
the gaps from the established objectives, whilst assessing what caused them. The same
happens when the results exceed previous forecasts, so that those good practices can be
replicated in the future.
With constant contact between departments, the process becomes even richer, as it allows
other areas to combine information that stems from the marketing performance
assessment. Through this monthly report, the financial department not only guides the
marketing department towards a better costs control, but also receives critical and
accurate information about the results, allowing them to effectively evaluate their
investments. This two-way flow allows for seamless transparency and feedback between
areas, leading marketing to be seen not only as just another department, but as an area
that is creating value for both customer and business. Specific strategies such as the
discontinuation of specific smartphone models, the decision of opening new stores or to
segment different customer profiles are a product of this comprehensive analysis, through
the continuous creation of synergies between departments that complement each other.
To summarize, the process described above has the following advantages:
• The focus on what is really measurable – use of quantifiable and measurable
metrics, speaking the financial language;
• The focus on cost vs. benefit relationship allows a constant monitoring of the
campaign costs against what they are giving of return, being to take corrective
actions, fixing deviations;
• There is an alignment between the marketing and financial departments, allowing
the reporting of results to other elements of the organization, being possible to
communicate and share the value of marketing department, guaranteeing also
transparency;
• There is a clear focus on results: lead to the final purchase or, in rare cases, get
leads;
• The monthly communication and reporting of results allow an inherent linking of
marketing with other departments, conveying valuable information about the most
profitable products, as well as the consumer behaviour during all the process,
giving valuable and reliable strategic insights;

81
• The segmentation by type of client allows a more effective budget management,
improving the profitability;
• The system of data integration, between the different digital platforms, allows
giving credibility to the data analysed, allowing, safely, to know that there is no
biased data, not leading to bad decision-making by the department.
4.7.3. “Since the performance measurement professionalization at Forall, sales have
soared 300% and every month they achieve records”. Based on the case study,
comment on this sentence, and give some justifications for the increase in Forall’s
sales.
According to the information presented in the case, the level of sales of Forall Phones,
since the arrival of José Alves to the firm, has beaten records behind records. The
professionalization of the marketing department was one of the main changes in the whole
company. In fact, after that Forall began looking at marketing as a huge source of revenue
and as a main key to the business.
The brand, allying itself with digital marketing, can, at the same time, gain efficiency at
the cost-benefit level, and measure the entire online customer journey, from the first click
on the online ad to the purchase itself. In this sense, the professionalization of the
performance measurement of the firm allows, through all digital platforms, to measure
the benefits and costs, while studying trends and customer behaviours. It can also give
real-time feedback on each campaign, channel used, type of customer, and about the
accomplishment of the proposed objectives, and the motives for that. Through this real
time measurement, it is possible to adopt corrective strategies (such as, a different
approach on target or channel to act), or even a change in the strategy, in a much faster
way than using traditional communication. This immediate feedback allows constant
customization to each type of customer, profile, purchase, making it unique.
Forall Phones, by using essentially measurable and quantifiable metrics such as CPA,
ROAS, conversions, conversion value, average order per value, can measure what is
having return and what is not, conveying a much more quantifiable vision of what is being
done in the marketing department. That is, when Forall advertises on Facebook, it is
concerned to know essentially its cost (the cost of acquisition per customer) and compare
it with the associated benefit (the return on ads spending), the level of sales achieved and
the associated margin to the same. As noted, the marketing department is very focused
82
on everything that is possible to quantify in value and not on subjective metrics, such as
engagement or awareness, or video or ad views. This way of measuring everything that
is quantifiable, makes it possible to turn the marketing department into a valued
department within the organization, since it is linked entirely to what the finance
department wants to see in the end: return, profitability, sales and growth.
Furthermore, it is important to note that through this measurement process, it is also
possible to know which actions are the most successful and which are the most profitable
channels and the most profitable type of client, giving insights to the strategy. That is,
with this information it is possible to allocate much better the marketing budget in what
it is intended to achieve and to channel the effort on the most profitable channels and
clients.
The fact that digital dominates almost all Forall’s marketing investment becomes
important as it is possible to know instantly whether the proposed objectives are being
met or not and why. Hence, it results in a better budget management: if Forall wants to
reach a particular type of customer and is spending X, but at the same time is able to reach
customer type Y, it can spend more for X and less to Y, making the process much more
efficient. In fact, what the firm wants is efficiency: with little resources, achieve much
more, and with this rationalization of the budget, through the information of essentially
financial metrics, this efficiency is possible. The strategy used in the Black Friday case is
an example of a good measurement process and strategy at the same time. When the
company realized that the costs were going to increase in online advertising space, it
began to advertise online before Black Friday (achieving a much lower CPA), and later,
using cheaper communication channels (such as SMS and e-mail). This allowed a much
higher profitability, turning November into the best month in ROAS, since the creation
of Forall.
In spite of that, there is no concrete proof that this professionalization of performance
measurement has led to the firm’s current success, it certainly created a great impact,
corresponding also with the increase in the number of smartphones sold online in recent
months. The company places a lot of trust in the marketing department, being the one that
has a more structured budget and where the firm invests more, along with the operations
department.
The type of KPIs measured, using digital marketing platforms, allows also to know the
regions with the greatest number of mobile phones sold, and that is useful information for

83
the stores that have been opening in the country and in Spain. That is, there is also an
indirect relationship between performance measurement and the increase of stores, and
consequently the increase in the total Forall’s sales and revenue.
Nonetheless, this analysis should also consider other indicators, since it would be unfair
to just highlight the marketing department as the only success point of the firm. The
operations department is critical, as it depends on Forall’s production capacity that the
brand can sell more. In fact, operations are signalled as the bottleneck of the company,
this time.
In addition, the number of stores, since José Alves joined the company, has been
increasing. In August 2018, when he began its job, there were only two stores, seven
fewer stores than there are today. Since stores are the main source of revenue for the
brand, and as seen in Figure 4 and Appendix 20, it is expected that the number of
smartphones increase. However, online sales have been increasing over time, as covered
in Appendix 20. The impact of word-of-mouth through Forall Family program has also
been a relevant key in this business having been responsible for 1100 sales, representing
143.000€ saved (March 2019).
As a result, Forall’s exposition level increases as the number of stores and the number of
ambassadors increases, being the result of a solid workforce and not a single and isolated
factor. Several interrelated causes may have contributed to the increase in sales, which
means that the firm has grown at an amazing rate. Nonetheless, the way that Forall
measures its marketing efforts has been a competitive advantage of the company,
resulting mainly from the following factors: the know-how of the department that allows
the monitoring of the entire process as well as the standardization of all platforms.
Through this know-how, along with a clear goals definition, linked to the business results,
with a clear definition of target, that allows a greater allocation of the budget and a greater
efficiency, allied to a reduced and objective number of metrics, most of them financial,
make this process as one of the keys to success of this firm, which is growing visibly.
4.7.4. Identify the gaps presented in the performance measurement process adopted
by Forall, giving some recommendations to fill them (Suggestion: use information
from chapter 1.6.1. BEST PRACTICES IN DIGITAL MARKETING
PERFORMANCE MEASUREMENT and some other additional scientific articles
you may investigate).

84
Despite all the Forall Phones’ digital marketing performance measurement being very
focused on measurable metrics, such as return and revenue metrics, it also has some
limitations, according to some academics and practitioners.
Hence, the following shortcomings are highlighted, with respective suggestions for
improvement
• The lack of metric causality and the short-term focus – At Forall Phones, there is
a clear focus on a metrics system based on the trade-off between cost and benefit of
marketing actions. That allows a valuation of the department within the organization,
conveying a real concern in cost optimization and trying to prove the benefits of its
action, being aligned later with the firm as a whole, which is still growing. However,
it should be noted that the company is very focused on the short term. That is, on
directing efforts to generate immediate sales and not in the long-term relationship with
consumers. Despite the retargeting efforts, for example, there is no clear objective to
ensure that the customer is no longer out of his field of action and that the relationship
will be lasting, justifying the fact that the marketing department does not worry too
much about measuring behavioural metrics, such as awareness, engagement, or
loyalty.
Rust et al. (2004) developed the chain of marketing productivity, which provides
insight into this causality between marketing strategies and marketing actions, with
the business results, which depend directly on the impact that marketing actions and
strategies have on the consumer and then on financial results. That is, everything starts
with the defined strategy, tapering into a specific marketing action, with the goal of
creating a relationship with the customer. This action may have a consumer impact,
such as an increasing in satisfaction, which may have an impact on both the financial
level (which can result in a purchase) and the value of marketing (increase the brand
equity);
• The lack of soft measures – Although the focus on subjective metrics is difficult to
create value for top management (Rust et al., 2004; Stewart, 2009), in a long-term
perspective, this may become valuable. Thus, according to Hanssens and Pauwels
(2016), the causality of this model forces companies to choose good performance
metrics that can establish these intrinsic relationships between all the performance
levels. These authors also argue that the devaluation of marketing is due even to this
absence of a relationship between the multiple metrics analysed, such as attitudinal

85
(e.g., brand awareness), behavioural (e.g., brand loyalty), and financial (e.g., sales
revenue).
Following this idea and following the model of Katsikeas et al. (2016), covered in TN
Figure 2, it is realizable that the company covers both organizational performance and
operational performance. However, in operational performance, the field of
“Customer Mindset” with the metrics assessment such as brand equity, satisfaction or
attitudinal loyalty, as well as “customer level performance”, with performance metrics
such as share of wallet and lifetime value, are not so focused by the company, losing
some connection with the other fields. According to the Marketing Performance
Outcome Chain, the fields are interconnected, and the financial results are intrinsically
linked to a better performance in customer mindset, customer behaviour, product-
market performance, and customer-level performance.
In addition, O’Sullivan et al. (2007) argue that to increase CEO satisfaction with the
marketing department, it should be combined with both financial metrics and
nonfinancial indicators. Liang et al. (2018) also advocate the use of different types of
marketing metrics, such as customer behaviour metrics, financial metrics, and digital
metrics;
• The lack of benchmark monitoring – O’Sullivan et al. (2007) argue that the metrics
should be monitored against the established objectives and with respect to the
competitors, being a pointed failure presented in Forall’s measurement process,
having an absence of benchmarking in this sense;
• The number of metrics used – There is some disagreement about this topic in the
literature. For some authors, such as Mintz and Currim (2013), the greater the number
of metrics used, the better the marketing mix performance, allowing monitoring and
benchmarking. On the other hand, Moreno et al. (2015) agree that each company
should identify which metrics it considers most relevant, depending on the type of
campaign or channel. With the same idea, Celeste and Moniz (2019) argue that there
is no metric that will serve every company, because the choice will depend on the
business, customer orientation, culture, activity, etc. However, Forall Phones should
evaluate whether it will make sense to evaluate more metrics depending on the
channel chosen or its action;
• The focus on ROAS and not on ROI – ROAS calculation only provides information
about the return of ads. That is, it allows to know the profitability of online campaigns,
86
including only the digital costs associated with the campaign. While ROAS gives the
online ads profitability, ROI gives the profitability of all marketing department,
including all the marketing department costs, calculated for any period of time.
Despite its complexity, the firm has enough data to calculate it and, through it, to
realize not only if the ad had a return, but also if the entire department had a return,
monitoring everything they spend, consume and work;
• The demanding work of managing data alone – Almost the entire measurement
process passes exclusively through the hands of José Alves, Head of Performance of
the brand, which can become unsustainable. With the growth of the brand, Forall
should focus on hiring more digital marketing performance analysts, in order to
complement the work of Alves. At this moment, if any platform fails, if any data is
not effectively collected, the probability of failure is huge, if José Alves is not present.
In the same sense, also the automation of the whole process still cannot respond to
predictable behaviour by the consumer in the future;
• Online and Offline as a whole – Forall Phones does not separate what is online from
what is offline because of the complexity it would require and because online efforts
seem to result in offline buying, eventually becoming a driver for the final purchase.
However, there is no data to support this relationship, there being no way to know,
for sure, that the purchase in the store was due to an online effort of the brand;
• Inefficient Data Reporting – The main platform for collecting, analysing and
producing data reports from the different sources that generate traffic to the Forall
website is Google Analytics and, later, Excel for future and deeper and complex
analysis. This means that they must be very inefficient in their processes. Google
already provides a platform, called Google Data Studio, that allows the same, without
using Excel, reporting data in an easier way, allowing to incorporate in the same
platform data from many sources, such as Facebook, Google, and E-mail, for free and,
once installed, the data is automatically renewed. It can be a more efficient and
alternative option to the use and the time spent in data standardizing that will be read
in Excel, later. With this solution, Forall would save a lot of time, work and errors.
Recommendation of new metrics to measure:
In addition to ROI Marketing, other hard and soft metrics would also be important and
relevant to quantify the value of marketing of Forall Phones, such as:
• Payback, knowing the time needed to recover the marketing investment;

87
• Share of Wallet, which helps identifying which customers the firm should invest the
most;
• Breakeven Point, realizing the level of sales needed to cover all costs associated with
marketing, variable and fixed;
• Break-even for profitability, measuring the sales volume required to reach a certain
established sales level;
• Effectiveness, comparing the results obtained with those expected;
• Efficiency, measuring the ability to properly manage resources;
as well as soft metrics, like:
• Net Promoter Scores (NPS), which allows to measure the degree to which the
current customers will recommend a Forall’s product;
• Willingness to Recommend, letting to know the strength of loyalty, potential impact
on others; and
• Customer Satisfaction, providing the likelihood of repurchase.
4.7.5. What are the advantages for Forall Phones in calculating the ROI marketing,
giving what can justify an annual ROI Marketing above or below of the expected at
the beginning of the year? What costs would you include in calculating Forall
Phones’ annual marketing ROI? What kind of strategies can be adopted by Forall
Phones based on ROI marketing?
The ROI calculation is one of the most important indicators used in e-commerce, allowing
the measurement of the viability of the business and the return of investments made to
attract and retain customers, as well as lead to the final purchase. Through it, companies
can make more precise decisions regarding the allocation of the available resources.
Forall, by not calculating the ROI of marketing department, cannot provide to the finance
department all its value and all its contribution. In fact, Lenskold (2002) argued that this
is an indispensable KPI to measure marketing performance and is essential for decision-
making. Klein et al. (2003) argue that ROI marketing can help companies making
decisions before, during and after budgeting. Fu et al. (2018) also argued that through
their calculation, companies could perceive the value and contribution of marketing

88
actions in terms of money. Through this, it is possible to achieve conclusions about the
behaviour of online and offline campaigns, projects, events, and initiatives.
In addition, ROI marketing may not only be the return on investment, in monetary terms,
but also at the level of brand equity. That is, the return that the firm managed to obtain in
terms of brand equity, with the money invested (Stewart, 2009).
Focusing on the financial value of ROI aims to give information about what marketing is
generating in terms of cash. That is, for every euro invested in marketing, what is the
return that this department is generating? Thus, when there is a ROI prediction at the
beginning of the year, many factors can justify a variation of this number that quantifies
the value of marketing. In the case of Forall Phones, as in any other firm, the ROI
calculation becomes useful as a way to allocate resources and manage the budget,
according to the most profitable channels or actions for the brand.
The marketing ROI forecast needs a full forecast of the costs and benefits that will result
from the brand marketing actions, whether monthly, yearly, or other period of time, or
even per campaign. The forecast and the realized one may not hit right and this deep
analysis of what can cause these gaps, can have a crucial impact on the business, requiring
a constant monitoring.
The firm must include all costs associated with the marketing activity. In this case, as
digital dominates, most of the costs are due to digital marketing efforts. Thus, it is
important to define what Forall can define as being its cost structure, and then, from there,
try to perceive each variation individually.
Forall shall include in the ROI calculation all the fixed and variable costs associated with
the marketing department. Following the Lenskold Group method, Forall Phones, at least,
should include the next following costs for the ROI calculation:
• All costs involving the main strategies used on digital, such as SEO, SEM, social
media marketing, content marketing, e-mail marketing, online advertising, mobile
marketing, and affiliate marketing costs;
• Within each strategy, the most operational and tactical costs of each, such as online
display advertising (banner ads, retargeting, remarketing), video advertising ads, paid
search ads, google shopping ads, affiliate costs, lead generation, e-mail, SMS, mobile,
and social media;

89
• Also, it is important to determine the costs with brand makers (influencers) and
brand shapers (ambassadors), since they are two of the main sources of traffic to
the website and revenue;
• The costs with the platforms associated to each medium and tool, must also be
discriminated, since they belong to the marketing budget field. Thusly, costs with
analytics, marketing automation and research, as well as online testing
implementation, should be accounted for the marketing budget;
• The costs involved with discounts granted through ambassadors, influencers and
other discounts should also be calculated;
• There are also some costs that should be linked to the marketing department, such as
costs related with sponsorship and brand events, including all expenses with food,
accommodation and marketing staff labour costs (totalling not only the salary, but
also the benefits per worker).
In ROI forecast, the more detailed it is, the greater the reliability of its number, allowing
more credible strategic decisions and a better rationalization of the budget and
optimization of the investment, such as the reduction of expenses and the growth of
profits.
Structuring the expected costs and benefits, in the calculation of the ROI, it is possible to
perceive what varied and to be able to attribute causes for these perceived gaps. These
gaps may be caused by internal factors of the company, or external factors, arising from
the competition and the market itself. In the case of Forall Phones, a gap from the ROI
forecast may be due to several factors, such as better or worse product, channel or
campaign performance, or simply because competitors have launched a new product on
the market, thus gaining customers from Forall. TN Figure 8 attempts to cover some of
the ROI variations that may occur, trying to give some justification for these gaps.
A good ROI planning and its constant monitoring will allow the company to manage its
budget, investment and resources (whether human, physical or digital) more efficiently.
The firm knows where the flaws and overruns are coming from and the degree of the gap
between the expected and the realized, recognizing that the more detailed this analysis,
the greater the degree of confidence in it, becoming a key indicator of measurement.
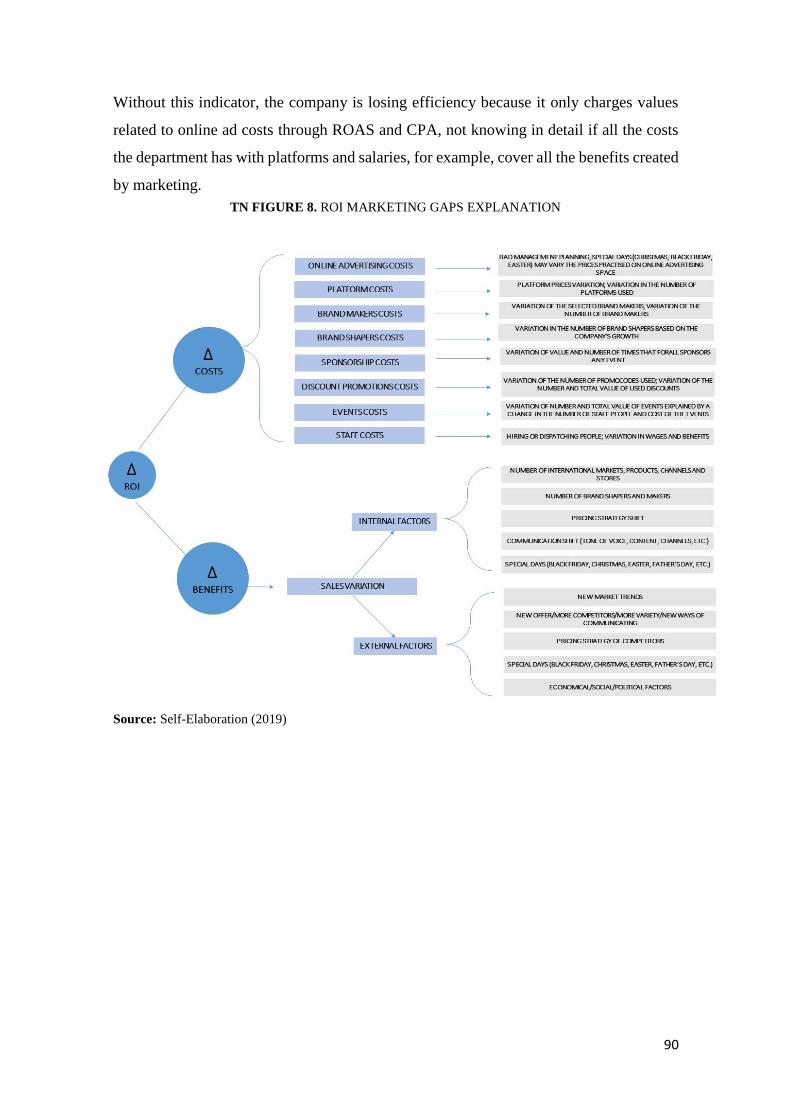
90
Without this indicator, the company is losing efficiency because it only charges values
related to online ad costs through ROAS and CPA, not knowing in detail if all the costs
the department has with platforms and salaries, for example, cover all the benefits created
by marketing.
TN FIGURE 8. ROI MARKETING GAPS EXPLANATION
Source: Self-Elaboration (2019)

91
4.7.6. Imagine that Forall Phones aims to increase the sales level of Apple
smartphones on the website, in Portugal. Based on this goal, draw the possible
conversion funnel (awareness, interest, evaluation, purchase), suggesting specific
tactics to improve each goal, also indicating the respective channels and objectives
underlying each stage of the funnel, as well as the KPIs that would measure in each
phase, in order to achieve the main goal outlined.
TN TABLE 4. DIGITAL MEASUREMENT PLAN OF FORALL PHONES - RESOLUTION PROPOSAL
Source: Self-Elaboration (2019)

92
4.8. CASE STUDY RESOLUTION SLIDES
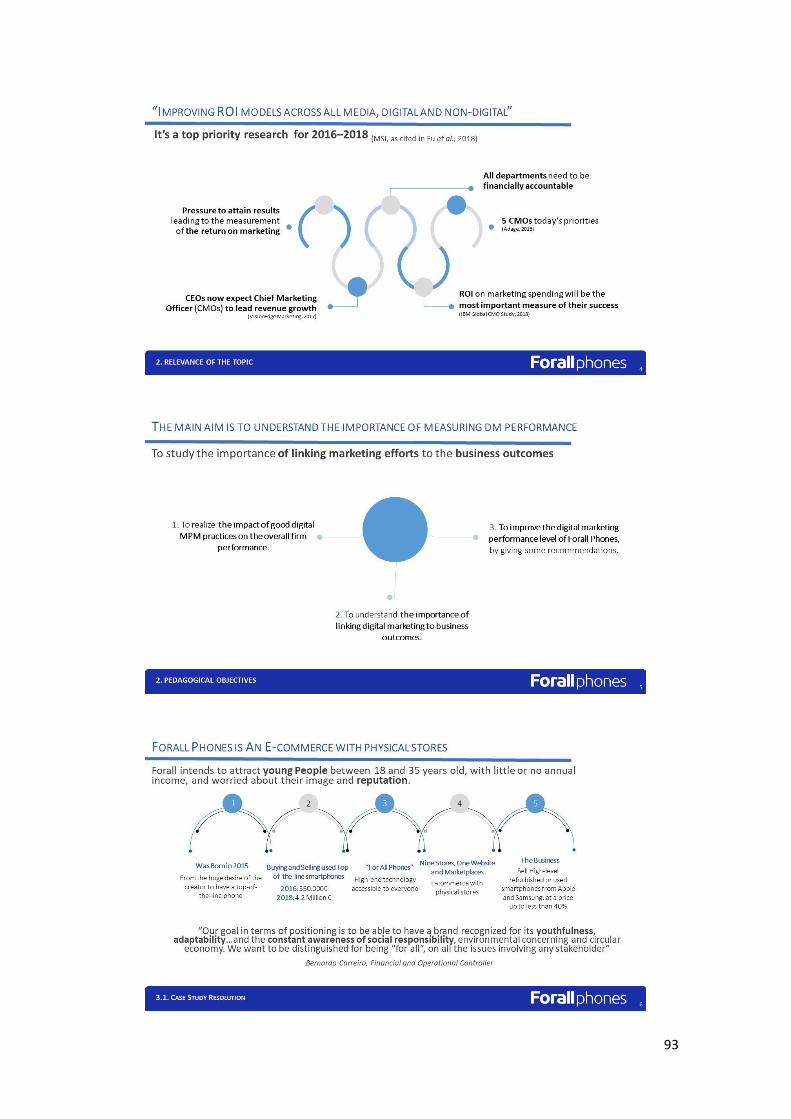
93
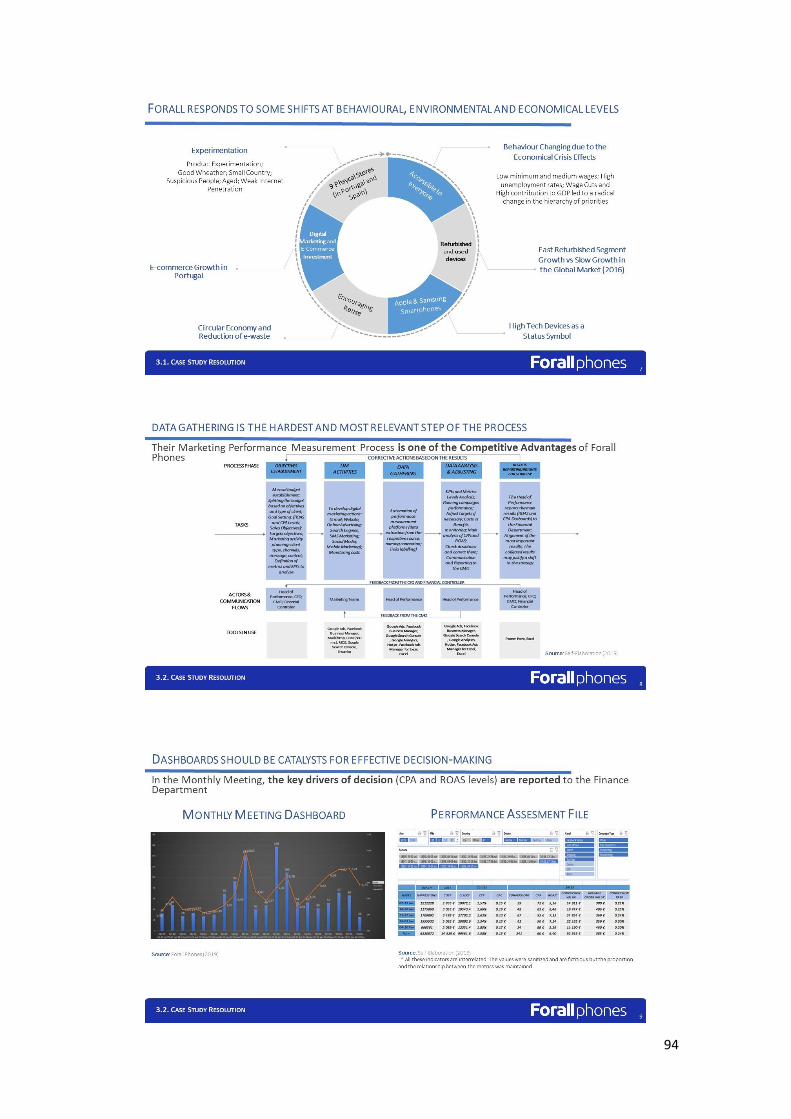
94

95
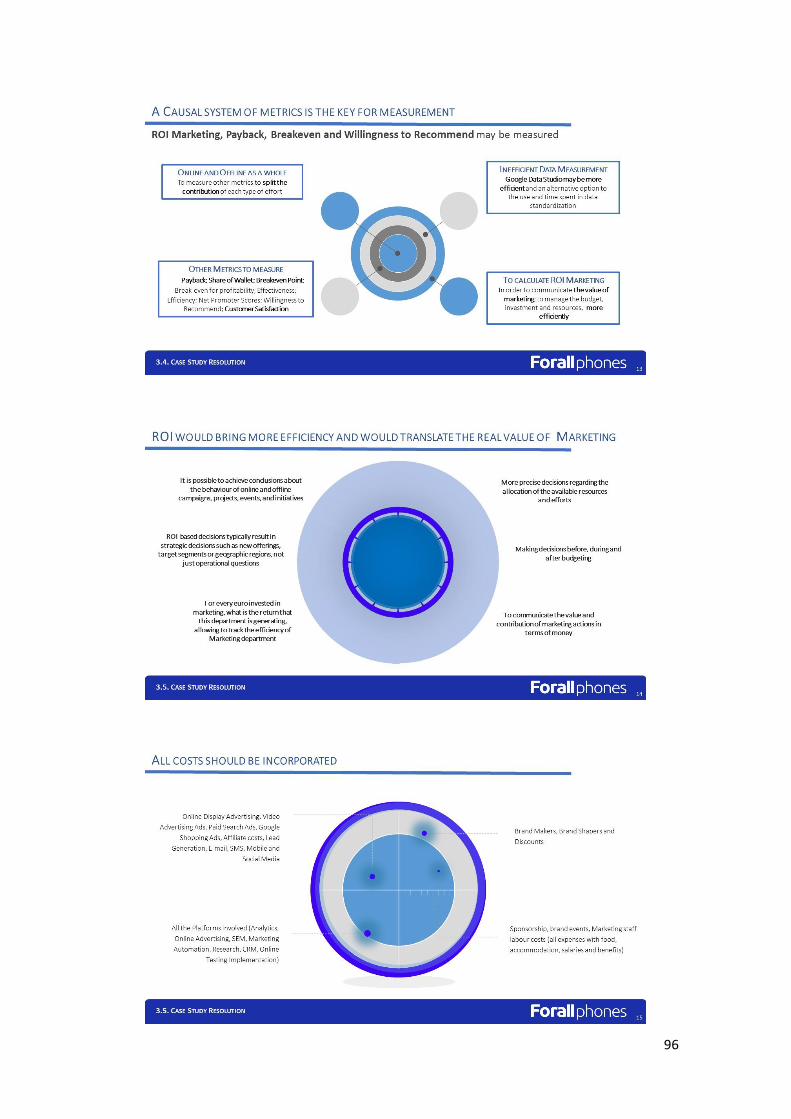
96

97

98
5. MANAGEMENT LESSONS AND MAIN CONCLUSIONS
Today, with companies facing cost containment, all departments must find ways to
present evidence of their value through their contributions. In this sense, any department
must be financially accountable, in order to justify more investment. With this in mind,
marketing, which is often seen as a department that does not add value and contribution
to companies, frequently focused on subjective measures, has today, more than ever, to
prove its real value. Marketing is not just a department that creates costs, but above all,
gives results and it should be seen as an investment.
Therefore, it is crucial for companies to be able to measure their efforts through effective
MPM practices. With the advancements that digital provides, this process has become
simpler and more immediate, allowing much faster feedbacks and, through it, making
possible to take corrective actions, not only at operational level, but also at a strategic
level. For instance, companies can now measure some digital efforts, such as online
advertising, through platforms like Google Analytics or Google Data Studio, enabling
them to measure their actions more effectively, knowing almost everything about what is
happening on their website and whom their customers are. In fact, digital platforms allow
knowing the source that generates traffic to the website, as well as the type of customer,
the gadgets used, location, and much more relevant information that the firm can use for
future marketing actions. Hence, tracking the entire customer journey, companies can
adopt solutions tailored to each profile, also known as personas.
However, despite being easier to measure and track consumers, digital also has some
drawbacks, such as the data extraction from a large number of platforms, due the wide
variety of attribution models, which can sometimes lead to bad decision-making based on
this biased data. That is, data extraction is one of the most important steps in the process
of measuring the digital marketing performance, demanding a deep know-how in this area
and critical spirit to know how to interpret it.
The costs and benefits trade-off monitoring has a crucial role in the analysis because
through it companies know the real profitability of each campaign, action or channel.
Because of this, in the data analysis step, it is important to look at what CEOs and CFOs
really want to see: revenue and profits. That is, marketers must test, in a quantitative way,
their metrics and KPIs that are deeply essential for decision-making, looking at metrics
such as CPA, ROAS, conversions, revenue, sales and margin, in order to be aligned with

99
the firm’s main goals. Consequently, they must define quantifiable metrics and monitor
them throughout the campaigns and, based on them, lead to strategic, and not only
operational decisions. Forall Phones is a practical example of the use of good MPM
practices, which looks at marketing as a discipline that creates value for the company,
being one of the departments that brings the most profits and one of the most invested in
by the firm itself. In this way, it is also important that marketers communicate and report
their main results to the other departments, promoting transparency and credibility, just
as Forall Phones does.
In line with the main research objectives, the Forall Phones example proved the
importance of measuring digital marketing performance, using financial metrics, which
have a much more direct link to business outcomes. Through the example given in this
case study, it was also possible to provide more insights into the digital marketing
performance measurement topic, applying digital metrics to a real case.
Through this example, it was possible to explore the importance of choosing metrics that
are more closely related to the overall results of the company and can serve as a good
practice to be followed by other companies that are looking to strengthen their digital
marketing performance measurement process. Through this choice, it is possible to
connect the insights provided by the digital marketing performance in a way that supports
the firm's strategy. That is, by using essentially numerical analysis, based on sales,
margins and profitability variations, and comparing them with all costs involved, these
essentially measurable indicators allow to make decisions to a much more strategic and
global level of the whole organization.
That is, all decisions are based on profitability and sales increasing. In fact, the
professionalization of the entire department, since José Alves has begun his functions,
became crucial, considering that revenues and profits have soared. With his entry, more
campaigns ran, and more stores opened, but he brought new measurement methods,
which through his know-how, have made possible a better clarification of the types of
client to achieve. Furthermore, he was also responsible for the clearer definition of goals
to achieve, a more effective data extraction and analysis, and a better standardization of
platforms, since he has built all reporting files and campaign naming convention, in order
to analyse further ahead. In this way, it is possible a better budget allocation, based on
reliable data that is reported by the platforms, which were standardized before.

100
The example referenced in the Black Friday campaign is a good example for other
companies to follow, based on an effective measurement and planning process of the
activities. This campaign was, in fact, one of the most profitable to the company, through
good MPM practices and everything that these involve, realizing the impact of good
digital marketing performance measurement practices in the overall firm performance.
Through this way of measuring, Forall Phones allocates its efforts according to the most
profitable channels, type of ad, content, type of strategy, target, location, and products.
Choosing hard metrics rather than soft metrics has its advantages, but the last ones should
not be excluded from the analysis either. All types of metrics have their significant role.
To be effective, they should be seen not as isolated metrics, but as an interconnected
system, depending on one another, and are linked to top management objectives. Then,
companies should understand the links that all actions have with each other and not rule
out metrics such as engagement, satisfaction or awareness, a failure pointed out to Forall
Phones. These kinds of measures can, inclusively, lead to an increase in revenue, and as
a consequence, an increase not only in ROI, but also in brand equity. The use of subjective
metrics has been one of the problems pointed to performance measurement, but only
when they are used without any purpose, where there is no clear link between them and
the value created by marketing. Therefore, it is important to measure not only, for
instance, the number of views of a video ad on YouTube, but also what it has brought to
the brand in terms of outcomes.
The ROI marketing prediction is the main flaw pointed to Forall Phones. In fact, it is a
negative point in its measurement process, taking into account that it becomes a great
decision-making variable. In order to improve the digital marketing performance level of
Forall Phones, they may really quantify what marketing is offering to the organization,
both in terms of revenue and in terms of image. That is, the company can know what the
return of the department is, by every single euro invested. There are many methods to
calculate this indicator, but the basic principle is the same: calculate the return and
subtract from the all of the marketing expenses. Thus, everything that is used in marketing
should be considered a cost, because only in this way, it is possible to quantify the whole
department and not only a small part of the marketing (as it is the case of Forall Phones,
which only calculates ROAS, not imputing wages and benefits costs).

101
To summarize, the more detailed the forecast, with all incorporated costs, the more
relevant this indicator becomes. Therefore, Forall Phones or any other company can
understand the gaps between the ROI forecasting and what actually happened, trying to
assign causes and, with that information, make decisions. Hence, ROI is an indicator that
conveys efficiency, so it should be used by marketers to communicate and report their
value to all stakeholders involved, making it possible to take decisions before, during and
after budgeting, allowing an improvement in the firm’s profits.

102
6. BIBLIOGRAPHY
12vinte. (n.d.). Retrieved February 2019, from 12vinte:
http://www.12vinte.com/?fbclid=IwAR33Hi0Y-gOLzQ4Ym2Od-
nJRWZPVPSOy3fohKjRpYuxgDtk7a5GBLt4FoI4
Almeida, M. d. (2019, March). 35,4% do PIB. Carga fiscal atingiu novo máximo
histórico em 2018. Retrieved from https://observador.pt/2019/03/26/354-do-pib-
carga-fiscal-atingiu-novo-maximo-historico-em-2018/
American Marketing Association. (2015). SOCIAL MEDIA SUCCESS METRICS:
SPECIAL REPORT.
Andrus, A. (2018). What is ROAS? The Complete Guide to Using Return on Ad Spend
[CALCULATOR]. Retrieved from Disruptive Advertising:
https://www.disruptiveadvertising.com/marketing/roas-return-on-ad-spend/
Aulakh, G. (2018, May). Refurbished smartphones market set to grow by 27% in 2
years as new players join the segment. Retrieved from
https://economictimes.indiatimes.com/tech/hardware/refurbished-smartphones-
market-set-to-grow-by-27-in-2-years-as-new-players-join-the-
segment/articleshow/64281551.cms
Barómetro de Telecomunicações- Grupo Marktest. (2018). 3 em 4 utilizadores de
telemóvel usa smartphone. Retrieved from
https://www.marktest.com/wap/a/n/id~2350.aspx
Barómetro de Telecomunicações-Grupo Marktest. (2018). Penetração de smartphone
continua a aumentar. Retrieved from
https://www.marktest.com/wap/a/n/id~23fd.aspx
Bokil, S. (2016, November). Global market for used and refurbished smartphones to
grow to 222.6 M units in 2020: IDC. Retrieved from
https://www.fonearena.com/blog/204414/global-market-for-used-and-
refurbished-smartphones-to-grow-to-222-6-m-units-in-2020-idc.html
Bolton, R. N. (2004). Linking Marketing to Financial Performance and Firm Value.
Journal of Marketing, 68(4), pp. 73-75.
Brafton. (2018). How to Measure Digital Marketing Effectiveness: 2018 Edition.
Bratt, S. (2017, March). Refurbished Mobile Device Market: The New Smartphone
Frontier. Retrieved March 2017, from http://blog.hylamobile.com/refurbished-
mobile-device-market-new-recycling-frontier
Celeste, P., & Moniz, L. B. (2019). Marketing Performance 80 métricas de marketing e
vendas. Clube do Autor.
Chaffey, D., & Patron, M. (2012). From web analytics to digital marketing
optimization: Increasing the commercial value of digital analytics. Journal of
Direct, Data and Digital Marketing Practice, 14(1), pp. 30–45.
Chong, W. K., Bian, D., & Zhang, N. (2016). E-marketing services and e-marketing
performance: the roles of innovation, knowledge complexity and environmental

103
turbulence in influencing the relationship. Journal of Marketing Management,
32(1-2), pp. 149-178.
Clark, B. H., Abela, A. V., & Ambler, T. (2006). An information processing model of
marketing performance measurement. Journal of Marketing Theory and
Practice, 14(3), pp. 191–208.
Coelho, M. I. (2018, March). Smartphones recondicionados: o que são e quais as
vantagens? Retrieved from Ppl Ware:
https://pplware.sapo.pt/gadgets/smartphones-recondicionados-vantagens/
Degeler, A. (2018, June). French refurbished electronics marketplace Back Market
raises $48 million to double down on North America. Retrieved from
https://tech.eu/brief/french-refurbished-electronics-marketplace-back-market-
raises-48-million-double-north-america/
Deloitte. (2007). In the dark. What boards and executives don’t know about the health
of their businesses.
Deloitte. (2016). Used smartphones: the $17 billion market you may never have heard
of - TMT Predictions 2016. Retrieved from
https://www2.deloitte.com/me/en/pages/technology-media-and-
telecommunications/articles/tmt-pred16-telecomm-used-smartphones-17-billion-
market.html
Deloitte, Duke Fuqua, American Marketing Association. (2018). The CMO Survey-
Highlights and Insights Report.
DeNinno, N. (2014, May). Teen Clothing Retail Trumped By Gadgets, Food As Status
Symbol. Retrieved from https://www.ibtimes.com/teen-clothing-retail-trumped-
gadgets-food-status-symbol-1588959
Dillet, R. (2018). Back Market raises $48 million for its refurbished device marketplace.
Retrieved from https://techcrunch.com/2018/06/13/back-market-raises-48-
million-for-its-refurbished-device-marketplace/?guccounter=1
Eos-Intelligence. (2016, December). Refurbished Smartphones – the Future of High-end
Devices in Emerging Markets. Retrieved from https://www.eos-
intelligence.com/perspectives/consumer-goods-retail/refurbished-smartphones-
the-future-of-high-end-devices-in-emerging-markets/
Eurofound. (2018). Statutory minimum wages 2018. Retrieved from
https://www.eurofound.europa.eu/publications/report/2018/statutory-minimum-
wages-in-the-eu-2018
European Central Bank. (2019, January). Retrieved 2019, from European Central Bank:
https://sdw.ecb.europa.eu/quickview.do?SERIES_KEY=132.STS.M.PT.S.UNE
H.RTT000.4.000
Eurostat. (2019, February). Retrieved from Eurostat Statistics Explained:
https://ec.europa.eu/eurostat/statistics-
explained/index.php/Unemployment_statistics
Exame. (2018, May). Portugueses têm de trabalhar quatro meses para ganhar o salário
de um dinamarquês. Retrieved from Exame: http://visao.sapo.pt/exame/2018-05-

104
26-Portugueses-tem-de-trabalhar-quatro-meses-para-ganhar-o-salario-de-um-
dinamarques
Executive Digest. (2010, March). Mercado Português de Telemóveis Decresceu 7% em
2009, Afirma a IDC. Retrieved from https://executivedigest.sapo.pt/mercado-
portugues-de-telemoveis-decresceu-7-em-2009-afirma-a-idc/
Farris, P. W., Bendle, N. T., Pfeifer, P. E., & Reibstein, D. J. (2015). The Manager's
Guide to Measuring Marketing Performance Third Edition.
Feng, H., Morgan, N. A., & Rego, L. L. (2015). Marketing Department Power and Firm
Performance. Journal of Marketing, 79(5), pp. 1-20.
Few, S. (2004). Information Dashboard Design: The Effective Visual Communication of
Data.
Financial Times. (n.d.). Financial Times. Retrieved October 2018, from Lexicon
Financial Times: http://lexicon.ft.com/Term?term=digital-marketing
Forall Family. (n.d.). Retrieved November 2019, from Forall Family:
https://forallfamily.com/pt-pt/
Forall Family. (n.d.). Retrieved November 2018, from Forall Family:
https://forallfamily.com/vendas/
Forall Phones. (n.d.). Retrieved November 2018, from Forall Phones:
https://forallphones.com/collections/iphones-baratos-usados-e-
recondicionados?sort_by=best-selling
Forall Phones. (n.d.). Retrieved November 2018, from Forall Phones:
https://forallphones.com/
Forall Phones. (2019, January). Forall Phones crescimento e números - Apoio a
trabalhos Universitários. Retrieved from
https://forallphones.com/blogs/blog/forall-phones-crescimento-e-numeros-
apoio-a-trabalhos-universitarios
Forbes. (2016, August). Why Samsung Is Planning To Sell Refurbished Smartphones.
Retrieved from
https://www.forbes.com/sites/greatspeculations/2016/08/29/why-samsung-is-
planning-to-sell-refurbished-smartphones/#32415d993b6f
Fu, F. Q., Philips, J. J., & Phillips, P. P. (2018). ROI MARKETING: MEASURING,
DEMONSTRATING, AND IMPROVING VALUE. Performance Improvement,
57(2), pp. 6-13.
Germann, F., Lilien, G. L., & Rangaswamy, A. (2013). Performance implications of
deploying marketing analytics. International Journal of Research in Marketing,
30(2), pp. 114-128.
Glucksman, M. (2017). The Rise of Social Media Influencer Marketing on Lifestyle
Branding: A Case Study of Lucie Fink. Elon University, Strategic
Communications.
Grupo Marktest. (2017). 5,9 milhões de utilizadores de Internet em Portugal. Retrieved
from https://www.marktest.com/wap/a/n/id~22ba.aspx

105
GSMA Intelligence. (2018). Global Mobile Trends What’s driving the mobile industry?
Retrieved from
https://www.gsmaintelligence.com/research/?file=8535289e1005eb248a54069d
82ceb824&download
Guerra, A. R. (2016, November). Mercado de smartphones usados valerá 30 mil
milhões de dólares em 2020. Retrieved from https://www.bit.pt/mercado-
smartphones-usados-valera-30-mil-milhoes-dolares-
2020/?inf_by=5c2ce4a7671db8e6778b4f02
Hanssens, D. M., & Pauwels, K. H. (2016). Demonstrating the Value of Marketing.
Journal of Marketing, 80(6), pp. 173-190.
Hieronimus, F., & Kullmann, M. (2013). Is your online marketing any good? McKinsey
& Company.
Hollander, R. (2017, September). Two-thirds of the world's population are now
connected by mobile devices. Retrieved from
https://www.businessinsider.com/world-population-mobile-devices-2017-9
IBM Institute for Business Value. (2018). The modern marketing mandate - Global C-
suite Study 19th edition.
IDC. (2016). Worldwide Market for Used Smartphones Forecast to Grow to 222.6
Million Units in 2020, According to IDC. Retrieved from
https://www.idc.com/getfile.dyn?containerId=prUS41929916&attachmentId=47
247794
imobiles. (n.d.). Retrieved November 2019, from imobiles:
https://www.imobiles.pt/?gclid=Cj0KCQiAsdHhBRCwARIsAAhRhskOtF2vSq
vgl2A0FykjW8RD0Ro5vTF1P9h2Gvc7tDc05JGeBs0xPPgaAmaGEALw_wcB
INE, Pordata. (2019, March). Retrieved from Pordata:
https://www.pordata.pt/Portugal/Taxa+de+desemprego+total+e+por+sexo+(perc
entagem)-550
Instituto Nacional de Estatística. (2017). Sociedade da Informação e do Conhecimento
Inquérito à Utilização de Tecnologias da Informação e da Comunicação pelas
Famílias 2017. Retrieved from
https://www.ine.pt/xportal/xmain?xpid=INE&xpgid=ine_destaques&DESTAQ
UESdest_boui=281439920&DESTAQUESmodo=2
Instituto Nacional de Estatística. (2018, May). Carga fiscal aumenta para 34,7% do
PIB - 2017. Retrieved from Instituto Nacional de Estatística:
https://www.ine.pt/xportal/xmain?xpid=INE&xpgid=ine_destaques&DESTAQ
UESdest_boui=315155988&DESTAQUESmodo=2
iServices. (n.d.). Retrieved May 2019, from iServices: https://iservices.pt/sobre-nos
Järvinen, J., & Karjaluoto, H. (2015). Industrial Marketing Management. The use of
Web analytics for digital marketing, 50, pp. 117–127.
Kang, T. (2018, March). The Surprising Growth of Used Smartphones. Retrieved from
https://www.counterpointresearch.com/surprising-growth-used-smartphones/

106
Kannan, P. K., & Li, H. A. (2016). Digital marketing: A framework, review and
research agenda. International Journal of Research in Marketing, 34(1), pp. 22-
45.
Katsikeas, C. S., Morgan, N. A., Leonidou, L. C., & Hult, G. T. (2016). Assessing
Performance Outcomes. Journal of Marketing, 80(2), pp. 1-20.
Kaushik, A. (2009). Web Analytics 2.0: The Art of Online Accountability and Science of
Customer Centricity. USA.
Kelly, N. (2012). How to Measure Social Media A Step-By-Step Guide to Developing
and Assessing Social Media ROI.
Kennedy, H. (2016, December 15). www.adage.com. Retrieved October 10, 2018, from
Adage: https://adage.com/article/small-agency-diary/things-cmos-2017/307136/
Klein, A., & Swartzendruber, T. (2003). A User's Guide to Marketing ROI. Marketing
Health Services, 23(3), pp. 33-36.
Lamberton, C., & Stephen, A. T. (2016). Thematic Exploration of Digital,Social Media,
and Mobile Marketing: Research Evolution from 2000 to 2015 and an Agenda
for Future Inquiry. Journal of Marketing, 80(6), pp. 146-172.
Laranjeiro, A. (2019, January). Forall Phones de malas aviadas para Madrid já a pensar
em crescer. Retrieved from Dinheiro Vivo:
https://www.dinheirovivo.pt/empresas/forall-phones-de-malas-aviadas-1/
Lenskold Group. (n.d.). Retrieved January 2019, from Lenskold Group:
http://www.lenskold.com/
Lenskold, J. D. (2002). Marketing ROI: playing to win. Marketing Management, 11(3),
pp. 30-34.
Leone, C. (2018, September). How Much Should You Budget For Marketing In 2019?
Retrieved from https://www.webstrategiesinc.com/blog/how-much-budget-for-
online-marketing-in-2014
Liang, X., Gao, Y., & Ding, Q. S. (2018). “What you measure is what you will
get”?:Exploring the effectiveness of marketing performance measurement
practices. Cogent Business & Management, 5(1), pp. 1-12.
Lopresti, M. J. (2014). Overcoming the Challenges of Calculating Digital Marketing
ROI. ECONTENT, 37(6), pp. 6-10.
Luke, K. (2013). Measuring Marketing ROI. Journal of Financial Planning;, 26(2), pp.
19-21.
Lyman, C. (2017, January 23). /www.forbes.com. Retrieved October 20, 2018, from
Forbes: https://www.forbes.com/sites/forbesagencycouncil/2017/01/23/is-2017-
the-year-agile-marketing-goes-mainstream/#1dab8d5f63f1
Machado, M. P. (2017, October). Forall Phones. Como um miúdo de 16 anos criou uma
empresa com um iPhone usado. Retrieved from Observador:
https://observador.pt/2017/10/03/forall-phones-como-um-miudo-de-16-anos-
criou-uma-empresa-com-um-iphone-usado/
107
Manley, L. (2015). The use of traditional versus e-marketing in SMEs in a developing
country: A comparative analysis. Journal of Governance and Regulation, 4(1),
pp. 202-212.
Marketo. (2011). The Definitive Guide Marketing Metrics & Analytics.
Mavridis, T., & Symeonidis, A. L. (2015). Identifying valid search engine ranking
factors in a Web 2.0. Engineering Applicationsof Artificial Intelligence, 41(3),
pp. 75–91.
Medium Corporation. (2018, June). The Refurbished Phones Market: Outlook Through
2022. Retrieved from https://medium.com/@GalaxyeSolution/the-refurbished-
phones-market-outlook-through-2022-f17791aa24a3
Méndez, M. S., & Estevez, M. (2016). Calculation of marketing ROI in marketing mix
models, from ROMI, to marketing-created value for shareholders, EVAM.
Universia Business Review, pp. 18-45.
Mintz, O. M., & Currim, I. S. (2013). What Drives Managerial Use of Marketing and
Financial Metrics and Does Metric Use Affect Performance of Marketing-Mix
Activities? Journal of Marketing, 77(2), pp. 17-40.
Mishra, V. (n.d.). Growth of Refurbished Smartphones in Emerging Markets. Retrieved
October 2018, from https://www.counterpointresearch.com/increasing-growth-
emerging-markets-refurbished-smartphone-segment/
Misirlis, N., & Vlachopoulou, M. (2018). Social media metrics and analytics in
marketing – S3M: A mapping literature. International Journal of Information
Management, 38(1), pp. 270–276.
Moreno, J., Tejeda, A., Porcel, C., Fujita, H., & Viedma, E. (2015). A system to enrich
marketing customers acquisition and retention campaigns using social media
information. J. Serv. Res., 80, pp. 163–179.
Morgan, N. A. (2012). Marketing and business performance. Journal of the Academy of
Marketing Science, 40(1), pp. 102–119.
Muller, B. (2016, December 13). www.chiefmarketer.com. Retrieved October 7, 2018,
from Chief Marketer: https://www.chiefmarketer.com/6-marketing-trends-for-
2017/
Nikunen, T., & Saarela, M. (2017). Micro-Enterprises’ Digital Marketing Tools for
Building Customer Relationships. Management, 12(2), pp. 171-188.
O’Sullivan, D., & Abela, A. V. (2007). Marketing Performance Measurement Ability
and Firm Performance. Journal of Marketing, 71(2), pp. 79-93.
Oliveira, P. M. (n.d.). Samsung vai começar a vender smartphones recondicionados.
Retrieved from http://exameinformatica.sapo.pt/noticias/mercados/2016-08-22-
Samsung-vai-comecar-a-vender-smartphones-recondicionados
Optimize Smart. (n.d.). Retrieved February 2019, from Optimize Smart:
https://www.optimizesmart.com/roi-analysis-google-analytics/
O'Sullivan , D., Abela, A. V., & Hutchinson , M. (2009). Marketing performance
measurement and firm performance Evidence from the European high-
technology. European Journal of Marketing, 43(5/6), pp. 843-862.
108
Patterson, L. (2017, March 2). www.marketingprofs.com/. Retrieved October 1, 2018,
from Marketing Profs:
https://www.marketingprofs.com/articles/2017/31683/marketing-activity-
metrics-mean-little-heres-how-to-really-prove-marketings-value
Peixoto, M. (2018, May). INE confirma carga fiscal em máximos, mas Portugal
continua abaixo da média europeia. Retrieved from Jornal de Negócios:
https://www.jornaldenegocios.pt/economia/impostos/detalhe/ine-confirma-
carga-fiscal-em-maximos-mas-portugal-continua-abaixo-da-media-europeia
Pereira, C. A. (2018, May). Portugal é dos países da Europa onde o salário mínimo mais
pesa. Retrieved from Jornal de Negócios:
https://www.jornaldenegocios.pt/economia/emprego/mercado-de-
trabalho/detalhe/portugal-e-dos-paises-da-europa-onde-o-salario-minimo-mais-
pesa
Pereira, J. P. (2018, March). Compras online crescem, mas continuam longe da média
europeia. Retrieved from
https://www.publico.pt/2018/11/21/tecnologia/noticia/compras-online-crescem-
portugal-ine-comercio-1851938
Persistence Market Research. (2018). Global Market Study on Refurbished and Used
Mobile Phones: Herculean Growth in e-Waste to Make Used and Refurbished
Phones a Prominent Choice among Consumers. Retrieved from
https://www.persistencemarketresearch.com/market-research/refurbished-and-
used-mobile-phones-market.asp
Philips, J. J., & Philips, P. P. (2007). SHOW ME THE MONEY: THE USE OF ROI IN
PERFORMANCE IMPROVEMENT, PART 1. Performance Improvement,
46(9), 8-22.
P-Telemóveis. (n.d.). Retrieved December 2019, from P-Telemóveis:
https://ptelemoveis.pt/s/sobre-nos/
Quevedo, E., Bequin, D., & Read, M. (2015). Digital Metrics Playbook Measuring your
Online Branding Strategies. Retrieved from
http://digitalmetricsplaybook.com/the-kpi-dashboard/
Redação Jornal de Leiria. (2018, June). P-Telemóveis repara o seu telemóvel em cinco
dias (ou menos). Retrieved from https://www.jornaldeleiria.pt/noticia/p-
telemoveis-repara-o-seu-telemovel-em-cinco-dias-ou-menos-8858
Ribeiro, L. R. (2018, December). Retrieved from Jornal de Notícias:
https://www.jn.pt/economia/interior/salario-minimo-portugues-sobe-mas-ainda-
e-dos-mais-baixos-10316015.html
Ribeiro, L. R. (2018, April). Quais os países com maior poder de compra. Compare com
Portugal. Retrieved from Dinheiro Vivo:
https://www.dinheirovivo.pt/economia/galeria/portugal-mantem-se-como-47o-
pais-mais-rico-do-mundo-per-capita-1/
Rodriguez, K. (2018, March). German recommerce site ReBuy raises $26 million U.S.
Retrieved from https://aimgroup.com/2018/03/07/german-recommerce-site-
rebuy-raises-26-million-u-s-2/

109
ROI Institute Canada. (n.d.). Retrieved April 2019, from ROI Institute Canada:
https://roiinstitutecanada.com/roi-methodology/
Roy, G., Datta, B., & Basu, R. (2016). Trends and Future Directions in Online
Marketing Research. Journal of Internet Commerce, 16(1), pp. 1-31.
Roy, S. (2014, November). Status Insanity: Why the iPhone Is the Perfect Status
Symbol. Retrieved from https://www.huffingtonpost.com/sandip-roy/status-
insanity-why-the-i_b_5801748.html
Rust, R. T., Ambler, T., Carpenter, G. S., Kumar, V., & Srivastava, R. K. (2004).
Measuring Marketing Productivity: Current Knowledge and Future Directions.
Journal of Marketing, 68(4), pp. 76-89.
Salvador, S. (2018, December). Espanha aprova salário mínimo de 900 euros e novo
nome do aeroporto de Barcelona. Retrieved from Diário de Notícias:
https://www.dn.pt/mundo/interior/espanha-decide-sobre-salario-minimo-de-900-
euros-e-novo-nome-do-aeroporto-de-barcelona-10351193.html
SAPO Tek. (2018, March). Taxa de penetração de telemóveis em Portugal nos 96,5%.
Retrieved from https://tek.sapo.pt/mobile/equipamentos/artigos/taxa-de-
penetracao-de-telemoveis-em-portugal-nos-965
Saura, J. R., Palos-Sánchez, P., & Suárez, L. C. (2017). Understanding the Digital
Marketing Environment with KPIs andWeb Analytics. Future Internet, 9(4), pp.
1-13.
Scarsella, A., & Stofega, W. (2018). Worldwide Used Smartphone Forecast, 2018–
2022. Retrieved from https://www.idc.com/getdoc.jsp?containerId=US43760618
Schell, S. (2013). ROI Institute Canada - Proving Value, Impact and ROI.
Seggie, S. H., Cavusgil, E., & Phelan, S. E. (2007). Measurement of return on
marketing investment: A conceptual framework and the future of marketing
metrics. Industrial Marketing Management, 36(6), pp. 834-841.
Spiller, L., & Tuten, T. (2015). Integrating Metrics Across the Marketing Curriculum:
The Digital and Social Media Opportunity. Journal of Marketing Education,
37(2).
Statista. (2015). Wholesale revenue of refurbished smartphone market worldwide from
2014 to 2017 (in billion U.S. dollars). Retrieved from
https://www.statista.com/statistics/744259/worldwide-market-revenue-
refurbished-smartphone/
Statista. (2017). Number of smartphones sold to end users worldwide from 2007 to 2018
(in million units). Retrieved from
https://www.statista.com/statistics/263437/global-smartphone-sales-to-end-
users-since-2007/
Stewart, D. W. (2009). Marketing accountability: Linking marketing actions to financial
results. Journal of Business Research, 62(6), pp. 636-643.
The Adecco Group. (2018). Se amplía la diferencia entre el salario medio español y el
de la Unión Europea: de un 15,4% a un 18%. Retrieved from

110
https://adecco.es/wp-content/uploads/2018/05/NdP-VI-Monitor-Adecco-
Salarios.-Parte-II.pdf
The Phone House. (n.d.). Retrieved April 2019, from The Phone House:
https://www.phonehouse.pt/pt/quem-somos_543.html
The Phone House. (n.d.). Retrieved April 2019, from The Phone House:
https://www.phonehouse.pt/pt/telemoveis/usados-ph-selection_879.html
Tiago, M. T., & Veríssimo, J. M. (2014). Digital Marketing and Social Media: Why
Bother? Business Horizons, 57(6), pp. 703-708.
Todor, R. D. (2016). Blending traditional and digital marketing. Bulletin of the
Transilvania University of Brasov. Series V: Economic Sciences, 9(1), pp. 51-
56.
Toister, J. (2016, October). The Philips ROI Methodology. Retrieved from
https://www.lynda.com/Higher-Education-tutorials/Phillips-ROI-
Methodology/479801/552853-
4.html?fbclid=IwAR2uqoB5TU6hC7Z7mVy9NlJwbwbmp4-
wGAZS8KrkcrcU8oP88d_COpXRdnw
Tuten, T., & Solomon, M. (2015). Social media marketing (2nd ed.). Thousand Oaks,
CA: Sage.
Vasconcelos, B. (2018, July). Salário mínimo: Onde é mais baixo e onde é mais alto na
Europa. Retrieved from Economia ao Minuto:
https://www.noticiasaominuto.com/economia/1054429/salario-minimo-onde-e-
mais-baixo-e-onde-e-mais-alto-na-europa
VisionEdge Marketing. (2010). Alignment and Accountability: The Two Anchors of
Marketing Effectiveness.
VisionEdge Marketing. (2014). The Link Between Marketing Performance Management
and Value Creation.
VisionEdge Marketing. (2016). How to make progress on your marketing excellence
journey.
VisionEdge Marketing. (2017). Cooking Up the Best Marketing Performance.
VisionEdge Marketing. (2017). How to maximize your marketing effectiveness:
Aligning your strategy with marketing execution.
Web Analytics Association. (n.d.). www.digitalanalyticsassociation.org. Retrieved
November 2018, from Web Analytics Association:
https://www.digitalanalyticsassociation.org/Files/PDF_standards/WebAnalytics
Definitions
Webber, R. (2017, December). Forbes CommunityVoice Connecting expert
communities to the Forbes audience.What is This? Retrieved from
https://www.forbes.com/sites/forbesfinancecouncil/2017/12/22/used-
smartphone-industry-on-the-rise/#3b90018ef1b3
Wedel, M., & Kannan, P. K. (2016). Marketing Analytics for Data-Rich Environments.
Journal of Marketing, 80(6), pp. 97-121.

111
Wegwood, L. (2017). Assessing your marketing ROI. NZ Business + Management,
31(8), pp. 51-51.
Wilson, R. D. (2010). Using clickstream data to enhance business‐to‐business web site
performance. Journal of Business & Industrial Marketing, 25(3), pp. 177-187.
Worten. (n.d.). Retrieved January 2019, from Worten:
https://www.worten.pt/telemoveis-e-pacotes-tv/telemoveis-
recondicionados/recondicionado-smartphone-iphone-6-16gb-cinzento-sideral-
6393166
Xu, Z., Frankwick, G. L., & Ramirez, E. (2016). Effects of big data analytics and
traditional marketing analytics on new product success: A knowledge fusion
perspective. Journal of Business Research, 69(5), pp. 1562–1566.
Related Documents