digital study REPORT TO THE ONTARIO COMMUNITY NEWSPAPERS ASSOCIATION © Borrell Associates Inc. | 201

Welcome message from author
This document is posted to help you gain knowledge. Please leave a comment to let me know what you think about it! Share it to your friends and learn new things together.
Transcript

digital stud yREPORT TO THE ONTARIO COMMUNITY NEWSPAPERS ASSOCIATION
© Borrell Associates Inc. | 201

© Borrell Associates Inc. 2
REPORT TO THE ONTARIO COMMUNITY NEWSPAPERS ASSOCIATION | 201
We acknowledge the financial support of the Government of Canada throughthe Canada Periodical Fund of the Department of Canadian Heritage.
Overview p. 3
Executive Summary p. 4
Survey of community newspapers in the U.S. p. 6
2011 community newspaper revenue survey p. 7
Benchmarking of U.S. newspapers p. 8
Questions posed by the OCNA p. 16
Analysis and Recommendations p. 22
Appendix A p. 24
Appendix B Best Practices: powerpoint slides, supplied separately
The content of this study represents the opinions of the authors and does not necessarily represent the policies or the views of the Department of Canadian Heritage or of the Government of Canada.
© Borrell Associates Inc. 3
REPORT TO THE ONTARIO COMMUNITY NEWSPAPERS ASSOCIATION | 201
Overview
Borrell Associates was commissioned by the Ontario Community Newspapers
Association (OCNA) in September 2012 to study community newspaper publishing in the
U.S. and Canada. The intent of the study, which is partially funded by the Department of
Canadian Heritage, is to provide data, research and context for OCNA to develop a viable
online strategy for independently-owned papers in Canada.
This report introduces and discusses:
■ The state of affairs for U.S. community newspapers
■ Data from the 2011 community newspaper revenue survey conducted for Newspapers
Canada
■ Revenue benchmarking of U.S. newspapers
■ Answers to narrative questions posed by the OCNA
■ A digital dashboard that can help community newspapers measure their progress in
growing their digital ventures.

© Borrell Associates Inc. 4
REPORT TO THE ONTARIO COMMUNITY NEWSPAPERS ASSOCIATION | 201
Executive summaryThis study identifies ways in which independent community newspapers in Canada can achieve significant growth in their online advertising revenues. These revenues may be critical to the continued survival of community papers because, as we’ve seen, online revenue can supplement total advertising by 10% to as much as 25% — monies that will certainly help community-based newspapers remain innovative and responsive to the communities they serve. Without digital ventures, and the economic mechanism to support them, these smaller papers could eventually face extinction amid the fast-changing habits of consumers.
When it comes to digital revenues, there is a gap not only with the provincial chain-owned newspapers (for which there are obvious reasons, including circulation, size of markets, and the level of support) but also with U.S. community newspapers of comparable dimensions. We identified four factors that might assist:
➠ Content strategies that will generate online traffic
➠ At the association level, development of templated ad-serving and related technology solutions that will provide a simple and inexpensive means for independent papers to carry adverts on their websites
➠ At the association level, online ad sales services that will direct national and regional advertising to participating sites
➠ At the local level, and perhaps on a part-time basis, hiring online-only sales reps and where feasible partnering with other local media to support the investment [NB: although we believe that print sales reps are not ideally equipped to sell online ads, as they focus on upsells rather than new opportunities, the smallest papers and/or those unable to develop alliances with other media may not have any alternative]
Ontario independent community newspapers report median online advertising revenue of zero. There are a few exceptions. A few papers, typically larger-circulation and with a topical focus (religion, politics), generate significant online income. But while 75% of non-chain papers have a website, they have not yet found a way to monetize their online presence. In addition, 25% of the papers do not even have a website. The pattern is similar across the country.
The U.S. experience is different. Independent community newspapers hold a rising share of their total gross revenue from online advertising. Papers with a circulation of less than 6,000 are earning a median of more than $7 per unit of print circulation [online revenue divided by circulation: e.g. $35,000 from online advertising, weekly circulation of 5,000 = $7 per unit of print circulation] and an average of nearly $15. Those numbers include independent and group-owned titles. Even if the independents are averaging only half of those levels, they are still significantly ahead of the Canadian industry.
There is a context that should frame the initiatives that we recommend. Community newspapers have strong relationships with the communities they serve, and more so — at least in smaller population markets — than any other type of local media. They are therefore ideally placed to extend their reach and to capture the migration to online, both news/information and advertising. If they fail to seize those opportunities, though, they will lose business, perhaps permanently, to new and more nimble online businesses unencumbered by the costs of running a newspaper.

© Borrell Associates Inc. 5
REPORT TO THE ONTARIO COMMUNITY NEWSPAPERS ASSOCIATION | 201
The future of classified advertising is uncertain in both print and online. The local/hyperlocal focus of community newspapers can certainly be exploited, but real estate (especially the “for sale” sector) is almost certainly lost. The recruitment vertical is now largely captured by the jobs boards and, at the lower-paid end of the market, by free listings. There may be some room still for community papers to carry this advertising on their websites, but there is no serious. revenue to be generated. Of the three main classified advertising categories, that leaves just auto, for which community newspaper websites may be an effective way to connect local sellers with local buyers, especially for pre-owned vehicles.
We believe that an attainable target over the next 5 to 7 years for community newspapers is to have 25% of revenue from online operations, with that revenue accounting for 5 points of operating profit [i.e. total revenue $100, profit from online $5].
© Borrell Associates Inc. 6
REPORT TO THE ONTARIO COMMUNITY NEWSPAPERS ASSOCIATION | 201
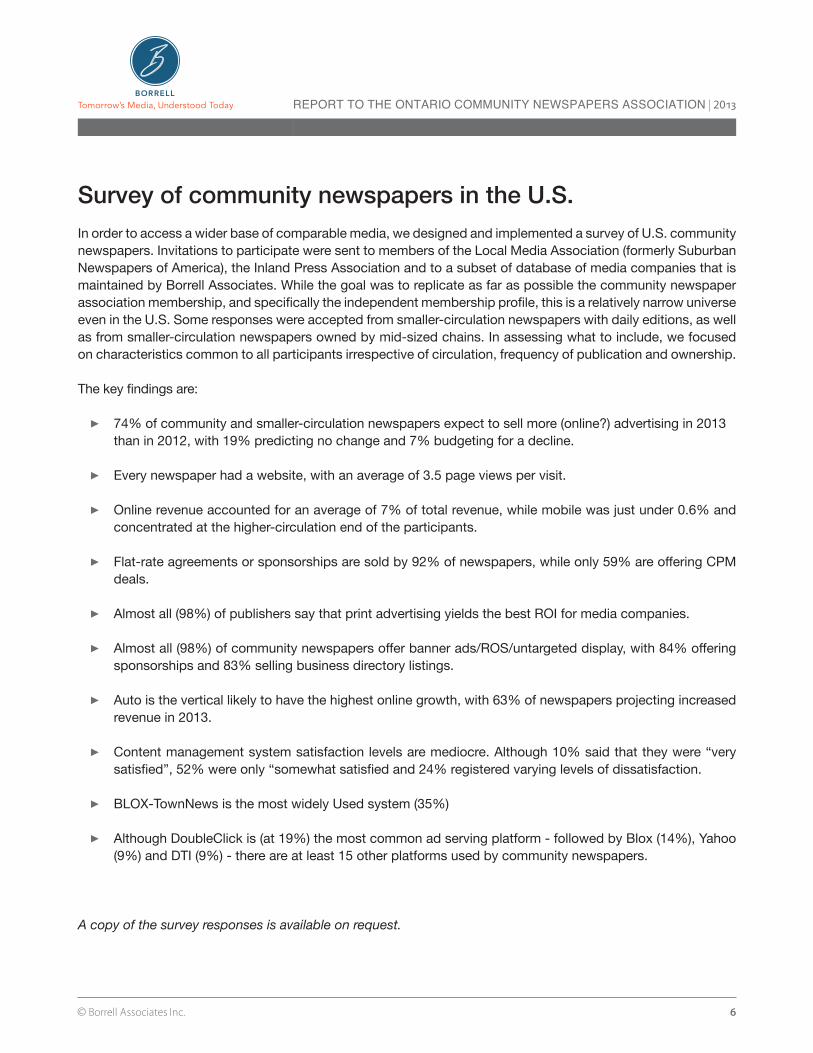
Survey of community newspapers in the U.S.In order to access a wider base of comparable media, we designed and implemented a survey of U.S. community newspapers. Invitations to participate were sent to members of the Local Media Association (formerly Suburban Newspapers of America), the Inland Press Association and to a subset of database of media companies that is maintained by Borrell Associates. While the goal was to replicate as far as possible the community newspaper association membership, and specifically the independent membership profile, this is a relatively narrow universe even in the U.S. Some responses were accepted from smaller-circulation newspapers with daily editions, as well as from smaller-circulation newspapers owned by mid-sized chains. In assessing what to include, we focused on characteristics common to all participants irrespective of circulation, frequency of publication and ownership.
The key findings are:
▶ 74% of community and smaller-circulation newspapers expect to sell more (online?) advertising in 2013 than in 2012, with 19% predicting no change and 7% budgeting for a decline.
▶ Every newspaper had a website, with an average of 3.5 page views per visit.
▶ Online revenue accounted for an average of 7% of total revenue, while mobile was just under 0.6% and concentrated at the higher-circulation end of the participants.
▶ Flat-rate agreements or sponsorships are sold by 92% of newspapers, while only 59% are offering CPM deals.
▶ Almost all (98%) of publishers say that print advertising yields the best ROI for media companies.
▶ Almost all (98%) of community newspapers offer banner ads/ROS/untargeted display, with 84% offering sponsorships and 83% selling business directory listings.
▶ Auto is the vertical likely to have the highest online growth, with 63% of newspapers projecting increased revenue in 2013.
▶ Content management system satisfaction levels are mediocre. Although 10% said that they were “very satisfied”, 52% were only “somewhat satisfied and 24% registered varying levels of dissatisfaction.
▶ BLOX-TownNews is the most widely Used system (35%)
▶ Although DoubleClick is (at 19%) the most common ad serving platform - followed by Blox (14%), Yahoo (9%) and DTI (9%) - there are at least 15 other platforms used by community newspapers.
A copy of the survey responses is available on request.
© Borrell Associates Inc. 7
REPORT TO THE ONTARIO COMMUNITY NEWSPAPERS ASSOCIATION | 201
2011 community newspaper revenue survey The annual surveys of community newspaper revenue since 2009 have shown virtually no change in the monetization of online advertising by independent papers. This is what was in the analysis provided to Newspapers Canada:
Online advertising increased by 35.3% over 2010. The revenues reported in this category for 2011 differed markedly in some cases from the previous year. These variances were reported entirely by larger chains and do not appear to have any obvious explanation, except in one case where increases reflect the adoption of new strategies and platforms. As in previous years, the great majority of independents continue to report zero revenue from online.
Nationally, online advertising accounts for 3.6% of total advertising, compared to 2.8% in 2010 and 2.2% in 2009. Again, almost all of this is earned by the chains. In the U.S., the smaller independent weekly newspapers [in 2010] report an average of more than $3 per unit of circulation from online, with some in the $30-$50 range. This generally reflects their local market dominance, and as this is usually a characteristic of Canadian weeklies, there is significant upside here for the industry as accessible and affordable platforms become available.
Focusing on Ontario, the estimate of revenue from online advertising by independent papers was closer to 2%; most of that was reported by a single publication with an atypical readership; and the median was zero. Low survey participation by independents may conceal some success stories, but by any reckoning the transition to online is proving a challenge for the sector, with no discernible change between 2009 and 2011. The pattern is broadly the same in other provinces, with almost all of the online revenue earned by chain-owned papers whose online advertising sales and websites were centrally managed and staffed. It must also be noted that there is a correlation between circulation and online revenue, and that for the most part the chain-owned papers have unpaid circulation that is approx. 50% higher than controlled circulation independents.

© Borrell Associates Inc. 8
REPORT TO THE ONTARIO COMMUNITY NEWSPAPERS ASSOCIATION | 201
Benchmarking of U.S. newspapers Drawing on the data submitted to the Borrell revenue and benchmarking surveys, these charts set out key metrics for U.S. community newspapers. These cannot be seen as hard targets for Canadian papers, but there is a loose and delayed correlation between online advertising in the two countries, although with the important qualifiers that (a) the U.S. industry is between two and four years ahead of Canada in growth of online advertising and (b) Canadian advertising neither grew nor fell as sharply as was experienced in some sectors of U.S. newspaper publishing — this was especially the case with daily newspapers but seems also to apply to community newspapers.
The minimalist data on Canadian independent community newspaper online revenues precludes a direct benchmarking analysis. What these charts do, though, is depict the state of online advertising for comparable U.S. publications and they can therefore be used to showcase what might be realistic medium/long-term targets.
CHART 1
Median Annual $ Change in Online Revenues
Median Annual $ Change in Online Revenues Median Annual % ‘07-’08 ‘08-’09 ‘09-’10 ‘10-’11 ‘11-’12
Circ 50k+ 3% -13% 10% 12% 15%
Circ 25–50k 13% -5% 10% 15% 13%
Circ 12.5–25k 13% -5% 10% 15% 21%
Circ 6–12.5k 20% -15% 11% 15% 21%
Circ <6k 50% -20% 14% 15% 28%
In 2007-2008 the smallest advertisers were finally jumping into digital advertising, often with the new digital offerings from their local community newspaper. The recession caused many of them to pull back from their digital experiments, while their larger, more digitally experienced competitors maintained or grew their online campaigns. As confidence returns to the market, smaller advertisers have resumed their efforts to bring digital advertising up to the share it holds in the ad budgets of larger advertisers.

© Borrell Associates Inc. 9
REPORT TO THE ONTARIO COMMUNITY NEWSPAPERS ASSOCIATION | 201
CHART 2
Online revenue per unit of circulation (2011)
This chart shows what a community newspaper can earn from digital advertising, expressed as revenue per unit of circulation. While a popular (and easily calculated) metric it has two limitations: it can rise simply because circulation may be slipping; and it ignores completely the broader issue of market share.
$0.00Circ 50k+
$10.00
$20.00
$30.00
$40.00
$50.00
$60.00
Circ 25 - 50k Circ 12.5 - 25k Circ 6 - 12.5k Circ <6k
2011 Rev/Circ Median Average n
Circ 50+ $49.11 $55.69 165
Circ 25–50 $31.05 $32.87 174
Circ 12.5–25 $25.62 $28.37 168
Circ 6–12.5 $14.63 $19.79 218
Circ <6 $7.38 $14.76 250
Independent $16.03 $23.17 52
Chain $18.32 $28.72 944
© Borrell Associates Inc. 10
REPORT TO THE ONTARIO COMMUNITY NEWSPAPERS ASSOCIATION | 201
$0.00Circ 50k+
$1.00
$2.00
$3.00
$4.00
$5.00
$6.00
Circ 25 - 50k Circ 12.5 - 25k Circ 6 - 12.5k Circ <6k
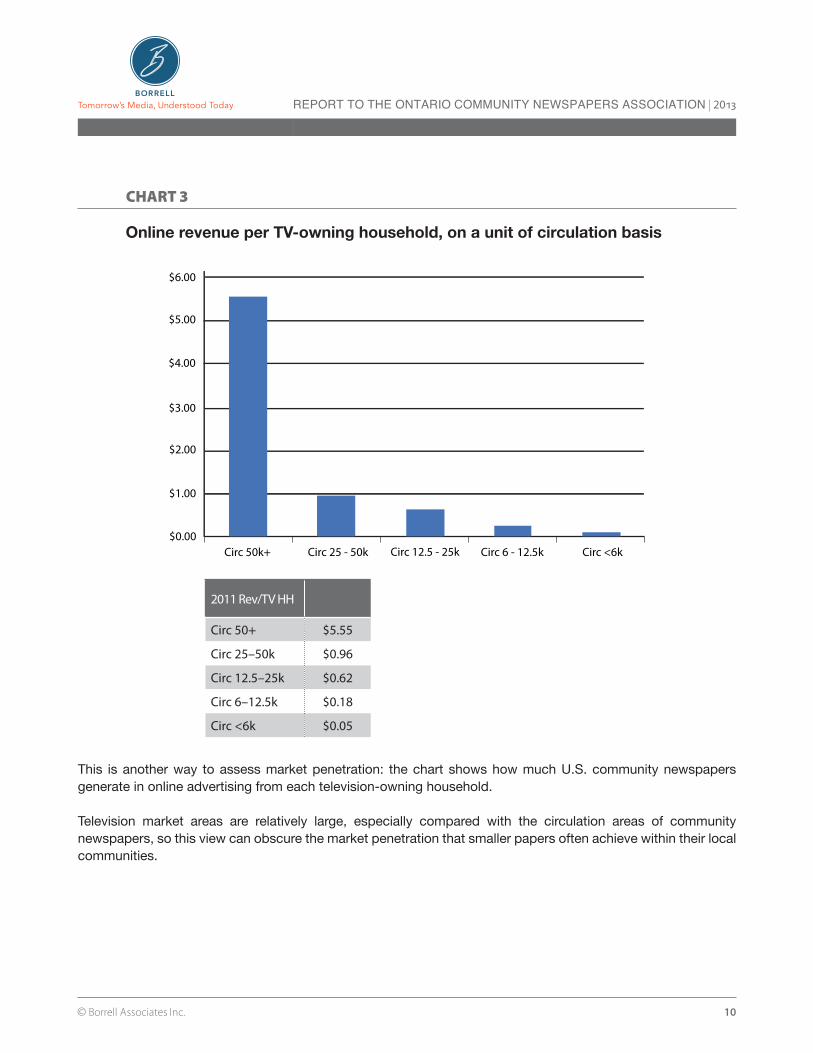
CHART 3
Online revenue per TV-owning household, on a unit of circulation basis
2011 Rev/TV HH
Circ 50+ $5.55
Circ 25–50k $0.96
Circ 12.5–25k $0.62
Circ 6–12.5k $0.18
Circ <6k $0.05
This is another way to assess market penetration: the chart shows how much U.S. community newspapers generate in online advertising from each television-owning household.
Television market areas are relatively large, especially compared with the circulation areas of community newspapers, so this view can obscure the market penetration that smaller papers often achieve within their local communities.

© Borrell Associates Inc. 11
REPORT TO THE ONTARIO COMMUNITY NEWSPAPERS ASSOCIATION | 201
CHART 4
The Better Metric: Market Share
The vast majority of media companies track year-over-year growth in new media revenues, but fail to monitor market share. Many newspapers prefer to define their digital market opportunities by the boundaries of their print circulation. But like TV signals, the Internet can reach well beyond circulation boundaries and serve larger market regions. The top performers don’t view their Internet opportunity through a newspaper lens, and they don’t dwell on year-over-year growth. They focus on achieving maximum share of a broad digital marketing area. When they do, they are often able to achieve 10% to as much as 28% market share over a large market area.
Borrell Associates has defined 513 Digital Marketing Regions (DMRs) that cover the U.S. and provide a more relevant market definition for digital properties than the areas that are traditionally used by other media. DMRs are based on the local concentrations of online advertising detected by Borrell’s ad spending model. Even with this more granular frame of reference, there is still significant up-side potential for digital market share growth among smaller newspapers.
DMR Share n
Daily, 30k+ 10.66% 249
Daily, 10-30k 0.26% 245
Daily, <10k 0.41% 268
Weekly, 10k+ 0.10% 77
Weekly, 4-10k 0.05% 72
Weekly, <4k 0.06% 79
0%
2%
4%
6%
8%
10%
12%
Weekly, 4-10k Weekly, <4kWeekly, 10k+Daily, <10kDaily, 10-30kDaily, 30k+
2011 DMR Share, by Type & Circ.

© Borrell Associates Inc. 12
REPORT TO THE ONTARIO COMMUNITY NEWSPAPERS ASSOCIATION | 201
CHART 5
Online Salespeople, by Circulation
0%
1%
2%
3%
4%
5%
6%
20112010200920082007
Circ 50k+
Circ 25 - 50k
Circ 12.5 - 25k
Circ 6 - 12.5k
Circ <6k
Median # Salespeople 2007 2008 2009 2010 2011
Circ 50k+ 2.0 3.0 4.0 4.0 5.0
Circ 25–50k 0.0 0.0 0.5 0.0 1.3
Circ 12.5–25k 0.0 0.0 0.0 1.0 1.0
Circ 6–12.5k 0.0 0.0 0.0 0.0 0.0
Circ <6k 0.0 0.0 0.0 0.0 0.0
Although not surprising, small-circulation independents almost never have even one sales person focused on online advertising. Given the differences in selling print and online advertising, this limits the effectiveness of the overall sales efforts; and it almost always limits online sales to upsells to print advertising clients rather than targeting potential online-only opportunities. In light of the costs at the per-paper level, though, this situation is not likely to be remedied except through some form of collective and/or association-led solution.
Borrell Associates’ recent survey of local media sales managers found that sales teams that include a dedicated online-only salesperson had a better understanding as a group of how digital products can serve an advertiser’s needs than teams that did not have an online specialist. This correlates with higher online revenue for all members of a sales team that has a dedicated online rep compared with sales teams that do not.

© Borrell Associates Inc. 13
REPORT TO THE ONTARIO COMMUNITY NEWSPAPERS ASSOCIATION | 201
CHART 6
Yes Dedicated AEs
No Dedicated AEs
Poor
Average
Good
Excellent
Outstanding
0% 25% 50% 75% 100%
N=202
How well sales reps understand how our digital products can serve an advertiser’s needs
Data All
$146,500
No Dedicated AEs Dedicated AEs Newsp-NoOnline AEs
Newsp-YesOnline AEs
TV-No Online AEs
TV-Yes Online AEs
$73,300
$185,900
$77,400
$195,500
$70,300
$208,200
Source: Borrell Associates Inc. Digital Sales Account Executive Survey, Nov. 2011-Jan. 20 N-223
Gross OnlineRevenue
per Sales Rep(Online $ divided by
all reps sellingdigital products)
© Borrell Associates Inc. 14
REPORT TO THE ONTARIO COMMUNITY NEWSPAPERS ASSOCIATION | 201
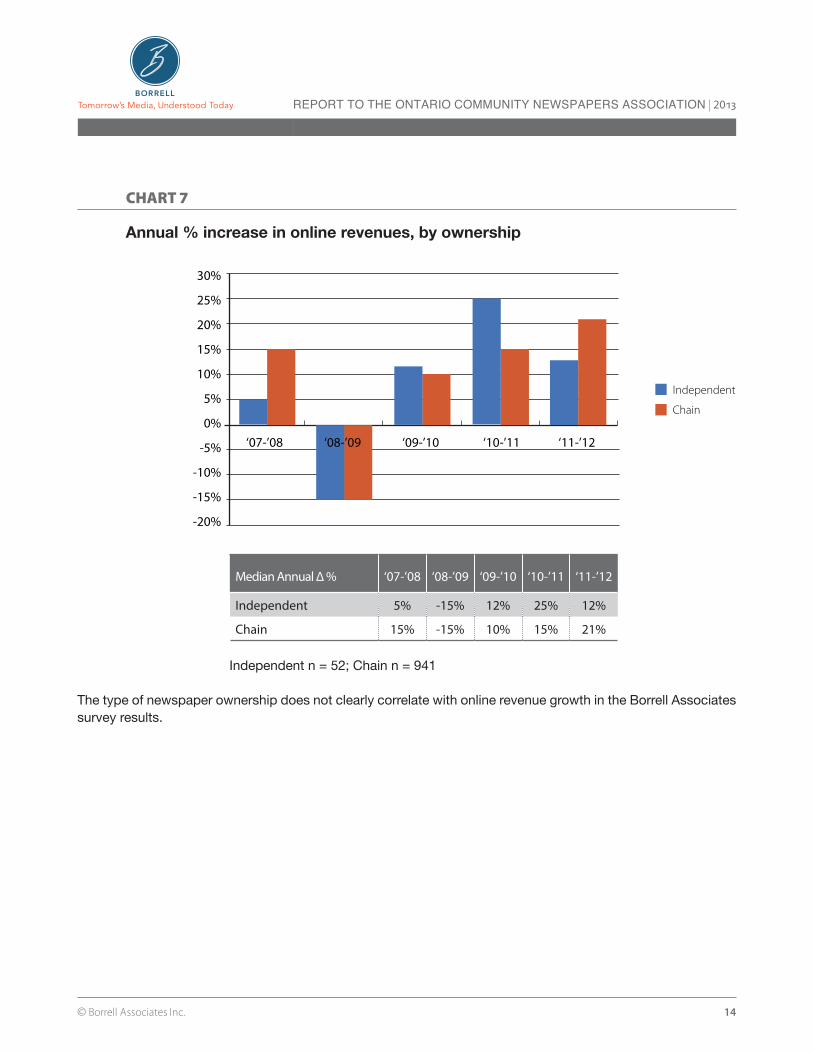
CHART 7
Annual % increase in online revenues, by ownership
Independent
Chain
‘07-’08 ‘08-’09 ‘09-’10 ‘10-’11 ‘11-’12
30%
25%
20%
15%
10%
5%
0%
-5%
-10%
-15%
-20%
Median Annual Δ % ‘07-’08 ‘08-’09 ‘09-’10 ‘10-’11 ‘11-’12
Independent 5% -15% 12% 25% 12%
Chain 15% -15% 10% 15% 21%
Independent n = 52; Chain n = 941
The type of newspaper ownership does not clearly correlate with online revenue growth in the Borrell Associates survey results.

© Borrell Associates Inc. 15
REPORT TO THE ONTARIO COMMUNITY NEWSPAPERS ASSOCIATION | 201
CHART 8
Median number of online salespeople by ownership
0.0
0.5
1.0
1.5
2.0
2.5
20112010200920082007
Independent
Chain
2007 2008 2009 2010 2011
Independent 1.0 1.8 2.0 0.0 0.3
Chain 1.0 1.3 0.8 0.0 1.0
Independent n = 52; Chain n = 941
Independent papers appear to have been more aggressive about adding online salespeople prior to the recession and more cautious about rebuilding their online sales forces after the total retreat that both types made in response to the downturn. This reflects the chains’ developing commitment to digital sales coupled with their ability to invest more, and sooner, after the recession.

© Borrell Associates Inc. 16
REPORT TO THE ONTARIO COMMUNITY NEWSPAPERS ASSOCIATION | 201
Questions posed by the OCNA
The OCNA Board, on reviewing the study parameters, identified additional questions that couldn’t easily fit into the proposed survey. These questions were reviewed by company executives led by Gordon Borrell (CEO) who supplied these answers:
Emerging partnership models with local business (e.g. daily deals, local merchant auctions) and the attendant revenue expectations.
Local media companies are taking a more active role in their relationship with local advertisers, going beyond simply selling them advertisements to offer marketing partnerships in which the advertiser pays based on the performance of a campaign, as measured by click-throughs, coupon redemptions, registrations or other quantifiable results.
The “Daily Deals” space spiked about a year ago but is beginning to fizzle. Groupon, which accounts for about half of the activity in this space, has seen its average revenue per active customer fall 16 percent in the past year and the company is attempting to diversify into a variety of other marketing, inventory and payment services. The main problem has been a lack of repeat business resulting from the deals — on which merchants tend to lose money in the first place.
Local merchant auctions have seen mixed results. Newspapers that have supported their auction service in print have done the best — providing a fee listing in a print product, with the merchant paying only if the item is sold.
The most significant emerging partnership model for newspapers involves providing an array of “digital agency services” that local advertisers need but don’t know how to manage. These include, but aren’t limited to:
Web Design/MaintenanceReputation ManagementListings Claiming/Optimizing Web HostingOpt-in List ManagementOnline Ad Design Online Agency/Exchange FeesSearch Engine Optimization (SEO)App DevelopmentSocial Media ManagementBlog ManagementOnline Contest/Game DevelopmentEmail Management Site Visitor AnalyticsOnline Video ProductionDigital Press Release ManagementEmail List PurchasingOnline Consulting and Research
Self-serve models for these types of services fail, especially in small markets, so it is not worth the development cost; these services must be sold.
As media become more accountable and are being forced to market themselves, providing services like these to local advertisers represent a way forward. Local advertisers need these types of services, but they need them in the context of an ongoing relationship with a trusted, knowledgeable advisor.

© Borrell Associates Inc. 17
REPORT TO THE ONTARIO COMMUNITY NEWSPAPERS ASSOCIATION | 201
How news sites are using social media to deliver content and generate revenue
“News site” and “revenue” are not always found together these days; local websites that see the Internet as a commerce utility rather than as an information source tend to do better financially.
Many reporters have been tasked with tweeting or posting something about the stories they are working on, sometimes as teasers and often in an effort to unearth sources or examples to support a story that is in the making. At larger papers the marketing director tweets about topics of interest to local advertisers. Examples of active posters to Facebook and Twitter can be found at the Grand Haven (MI) Tribune and the Worcester (MA) Telegram & Gazette. This activity generates traffic and referrals, which are indirectly linked to revenue.
Many papers solicit ideas, photos and videos from the public. Services such as CellJournalist.com provide technical platforms that enable local newspapers to tap into and organize user-generated content that is extending the eyes and ears of local media companies beyond cute pet pictures into breaking news events. Meporter.com has included a point system for frequent contributors that converts their activity into goods and services from local advertisers.
“Must have” components needed by a news site to drive traffic
Email sharing has declined significantly in favor of users posting items directly to Facebook. Facebook and other sharing tools such as Twitter, LinkedIn, Instagram, Pinterest and RSS appear in “share bars” accompanying every story in online publications that are serious about driving traffic through social networking.
One key to effective use of sharing tools is to write intriguing “People Magazine-style” headlines that pique interest rather than give away the punchline. “What Happened When Harry Met Sally” will attract more clicks than “Sally Gives Harry Thumbs Down.”
Q 38. Which of the following advertising and marketing support services do you currently purchase or would like to have available from your media providers? [Select all that apply.] N = 876
Web design & hosting leads digital ‘support’ needs
Website design and hostingSocial networking support (building and updating)
Lead generation programsEmail solutions supportGraphic design Services
Event marketing supportTraining/education/workshops in digital marketing
Marketing intelligenceMedia planning and placement
Video productionStrategic planning services
Media campaign managementSelf-serve display advertising solution
Transaction enabling servicesNone of these
Source: SMB Survey Wave 10, Q3-4 2012; © 2013 Borrell Associates Inc.

© Borrell Associates Inc. 18
REPORT TO THE ONTARIO COMMUNITY NEWSPAPERS ASSOCIATION | 201
What community newspapers are doing on the web that they cannot do in print (e.g. breaking news, video)
iNK Barrel Video Networks is one of several vendors that provide tools that enable smaller papers to broadcast live local events on the internet; high school sports and community meetings are typical applications. The company also lets papers tap into the revenue opportunities inherent in libraries of “on-demand” videos, which advertisers are finding useful if they offer products or services that require consumer education prior to a sale — an online “infomercial” of two to ten minutes may not be viewed often, but people who opt to see it are probably excellent prospects. Some advertisers have produced their own videos, but most benefit from access to professional production services. Video content can be shared among local properties. It can be difficult for smaller papers to use streaming video profitably because the streams cost money every time a user accesses one, and the revenue potential is usually limited.
Larger papers use platforms like Cinesport that share interviews with professional athletes and coaches, enabling newspapers to compete with television.
Breaking news online is most effective for content that falls outside the print cycle of the newspaper. However, newspapers must avoid over-using the web for “breaking news” that is not really breaking news to prevent erosion of the print product.
Metrics demanded by advertisers
At the local newspaper level, the metrics demanded by smaller advertisers at this point have been minimal because the advertisers generally don’t know what metrics to ask for. However, they will eventually judge the medium based on results, and they are being trained in this regard by the analytics provided by Facebook and Twitter. There is still a “herd” component to online ad purchases by smaller advertisers; research conducted among local advertisers by Borrell Associates shows significant regional and vertical-market variations in online ad-buying patterns.
2%
38%
Q 16 How do you measure the success of social marketing programs you have attempted? Which are your key metrics? N= 754
59%
52%
40%
44%
New customers
Additional fans, friends, followers
Visits to your own website
New contact information (email, phone, ect.)
Visits to your Social Network pages
Sales volume
Store visits
New lead generation
None of above
Other
36%
31%
28%
9%
Measures of Social Media Success
Source: SMB Survey Wave 10, Q3-4 2012; © 2013 Borrell Associates Inc.

© Borrell Associates Inc. 19
REPORT TO THE ONTARIO COMMUNITY NEWSPAPERS ASSOCIATION | 201
For Advertisers, is ROI defined the same for digital ads as it is for print advertising? And, is ROI defined the same for different types of digital advertising?
Advertisers tend to believe that ROI is defined the same way for print and digital ads, but there generally isn’t a number they can assign to their investment in either medium. The digital environment creates an expectation of “quantifiability” and is not perceived as a branding channel, so advertisers can be less forgiving when digital ads do not generate directly attributable results. Ads in the newspaper are perceived as more of a branding effort so they are not measured as harshly as online.
What is replacing print flyers, directories, and coupons on the Web? And, what are successful newspapers doing on the Web to retain this business.
` Facebook pages and nicely designed email newsletters are replacing print flyers. ` Google keywords and online business directories are replacing print directories. ` Print coupons are being eroded by “Deal of the Day” offerings online, and “coupon-clipping” consumers are learning to check
advertiser sites directly for coupon offers.
However, Scarborough data shows that printed coupons are not diminishing; people are using both. There are many sources of coupons, including in-store, mailed, in-newspaper and online, that co-exist at this point, but mobile coupons may change the balance as digital Usage shifts to tablets and smartphones.
Coupon usage patterns are different online than in print. In print there is an important element of serendipity in coupons — you don’t often know in advance what you are looking for — whereas when you go to the web for a coupon you typically have a specific item in mind.
Newspapers have generally been keeping their print coupon business up by attempting to maintain circulation rather than translating them to the web. Newspaper companies including Cox, Scripps, Gannett, Hearst, MediaNews Group, McClatchy, and The Washington Post are behind a venture called Wanderful, whose first product, FindNSave, lets consumers browse and print coupons that have been converted from print.
What are community news websites doing in the U.S. to capture real estate advertising revenues that are migrating to the web? Are there combo packages being offered? How are newspapers managing the relationship with the National Association of Realtors members? Are sites opening up new offerings to private sale listings?
U.S. newspapers are not doing well in real estate; they appear to have lost that franchise. Newspapers developed bad relationships with agents and brokers over many years, so they were eager to get out of newspapers when the web gave them the opportunity to put listings on their own sites. There is not much the papers can do to recover that business because listings are free on competing sites and no print/online package will fly when the customer doesn’t believe in the print product anymore.
A couple of alternative approaches have been attempted. In Los Angeles, a paper is pursuing the For Sale by Owner (FSBO) market, offering to advertise a property until it sells and taking a portion of the commission. It is too early to tell if this is a sustainable business. A paper in Denver hired a licensed broker, marketed homes in the paper for free, and took a percentage of the selling price. Local brokers saw that as unfair and threatened to pull their remaining (mostly branding) ads from the paper, and the broker experiment was scaled way back.
Another route is to partner with pure-plays like Trulia and Zillow, but in that case the newspaper is lending its brand to help build the brand of a competitor. We have not heard whether the short-term revenue from these arrangements has made them worth the long-term price.

© Borrell Associates Inc. 20
REPORT TO THE ONTARIO COMMUNITY NEWSPAPERS ASSOCIATION | 201
What are the successful sales force and incentive structures that organizations are using to sell print and digital in parallel?
In general at smaller newspapers, the print sellers are the only people selling digital ads; there is not enough interest or funding to hire digital-only reps. This puts the papers in a bind unless the owners are willing to invest, because these sellers are selling digital ads to buyers who happen to be advertising in the newspaper. This limits digital sales to a small sub-set of the universe of potential online advertisers, and also erodes the print budgets of those advertisers.
The most successful newspapers (e.g., Metroland) invest in ongoing training for their sales teams on digital products.
Gatehouse, Holden-Landmark in Boston and others are creating “digital marketing agencies” staffed by sellers with a strategic focus on acquiring new customers. This requires making an investment that can pay off in less than a year because there is no technology or infrastructure required. We expect this trend to become more pronounced in 2013.
Sales incentive structures were described in detail in our January report on Digital Account Executives. Successful practitioners typically provide a spiff for digital sales because the prices are lower. There is often a bonus for the person who sells the most digital advertising.
What new lines of advertising/service providing are community newspapers getting into that are actually working?
The main new line of ad services is the digital agency approach mentioned in the first question.
What does success look like for digital operations of a community news operation? Is success defined in terms of profit margin, overall % of revenue from digital, number of clients buying digital, etc.?
For a community newspaper, digital operations are tightly integrated into the rest of the business and typically function as more of a sustaining strategy than as a disruptive model. As such, they serve to help make advertising more accountable to advertisers: a digital/print package can demonstrate the efficacy of print.
Success on the advertising side in this context requires happy advertisers, who are looking for clicks and pageviews. On the news side, success is measured in clicks, the number of reader submissions and other measures of reader interaction.
In terms of revenues, smaller newspapers are still typically bringing in less than 7 percent of their total revenue from their digital operations; best-practice levels are in the 10 to 15 percent range. Very few are tracking the share of total local digital ad spending that they are capturing or how that is changing over time, although larger papers are shifting their attention from revenue growth to share growth so they can avoid being lulled by revenue increases that are in fact not keeping pace with the growth of local digital ad spending. We hope to see that practice spread to smaller papers in the future.
Smaller papers are not typically tracking the number of businesses that they are serving with digital advertising.
Overall, smaller newspapers tend not to have the resources required to aggressively grow their digital revenues. In the face of the strict financial controls that are required in that environment it is difficult to fund radical innovation on the digital side, so the focus tends to be on finding ways to make print more accountable to advertisers and thus sustain the print side of the business.
Larger media companies are using a digital benchmarking dashboard developed by Borrell Associates and honed by our clients at Deseret Digital Media. See Appendix A for details.

© Borrell Associates Inc. 21
REPORT TO THE ONTARIO COMMUNITY NEWSPAPERS ASSOCIATION | 201
Based on current trends, what will a successful community news operation’s P&L Statement look like in 5 years, in broad terms?
For a newspaper company to achieve 25 percent of its revenue from digital products would be admirable. McClatchy and the New York Times are at this level already; most other large newspapers are at about 15 percent.
Revenue from display advertising would decline from 50 percent now to 20 percent, with the gap filled by sales of digital agency products that don’t look like traditional advertising but are fundamentally important to digital marketing for local businesses.
Revenue from display advertising would decline from 50 percent now to 20 percent, with the gap filled by sales of digital agency products that don’t look like traditional advertising but are fundamentally important to digital marketing for local businesses.
For example:
■ A small chain of hamburger restaurants in Dallas called Scottie P’s has stopped all banner advertising on local websites and is now engaging in text messaging to a customer base of about 500 people. Scott sends text messages when he wants to drive restaurant traffic, offering 2-for-one hamburgers or free drinks. Text messaging is a service, not advertising.
■ Black White Dress Shop (a chain) uses geofencing to send text messages to customers who come within 1 mile of a store, encouraging them to come in. No more banner ad purchases by this group.
■ Federated Media, one of the largest ad agencies, announced last November it was eliminating all banner ad buys. It’s buying “conversational media.” Translated: Social media. http://thenextweb.com/media/2012/11/09/federated-media-kills-off-display-ads-shifting-focus-to-native-advertising-and-programmatic-media/
Even with 25 percent of revenue coming from digital products, smaller papers will still be operating at profit margins that won’t be higher than 25 percent. That means that only 5 or 6 percent of the newspaper’s total margin will come from the digital side.

© Borrell Associates Inc. 22
REPORT TO THE ONTARIO COMMUNITY NEWSPAPERS ASSOCIATION | 201
Analysis and RecommendationsBased on the U.S. survey, Canadian independently-owned community newspapers are generating significantly less online revenue than their U.S. counterparts.
When comparing the performance of U.S. and Canadian daily newspapers, there is a well-established lag of about three years. In other words, all other things being equal, Canadian daily newspapers should, by 2016, be at or close to where the U.S. dailies are now — although by then, of course, the U.S. papers may have pulled further ahead. But when looking at community newspapers and especially the independents, there are signs that all other things may not be equal. Whereas U.S. papers have seen progressive growth in online advertising, the Canadian have remained at or close to zero. This is of concern in the short-term as print advertising stagnates or declines. It is of greater long-term concern for two reasons:
■ That trend is likely to continue, tugging sharply at profits ■ Low barriers to entry will result in new competitors for online advertising
So, while the reasons can be debated, as can reasonable targets for online advertising, the status quo clearly threatens the survival of independent community newspapers in Canada.
As the U.S. survey showed, while the chain-owned papers seem to have some standardization of providers and solutions, the independents are highly fragmented. This hasn’t totally impeded their online progress but it does shine a spotlight on what the chains have that the independents do not:
■ strategic planning ■ investment in technology ■ sales resources ■ content strategies ■ online traffic
The question that arises is, how can the Canadian independents be assisted in establishing an effective online revenue stream? Given that median online revenue has remained stuck at zero for three years, our analysis points to two key drivers:
■ Each paper needs to ensure a robust online news and information presence in order to drive traffic. ■ The costs and strategic and technical support need to be managed on behalf of the papers, and the
newspaper associations are the logical vehicle for this.
We have not researched the correlation between traffic and advertising revenue, but clearly advertisers are more likely to be drawn to sites that can demonstrate the best profile in terms of uniques, visits and page views. These factors also shape the terms on which online advertising is sold. Effective content strategies are therefore essential, drawing on elements that newspapers can do more effectively online than in print, such as breaking news, real-time information, and video, but which also support the print brand. The newspaper associations might be able to assist their members by developing guidelines and facilitating access to editorial, web design and technical support.
© Borrell Associates Inc. and Deseret Media Appendix A 23
REPORT TO THE ONTARIO COMMUNITY NEWSPAPERS ASSOCIATION | 201
Larger papers operating in major metropolitan markets are better advised to approach online as a disruptive model, with its own editorial and sales functions. Community newspapers, though, typically treat their online operations as a sustaining strategy. The average revenue for an independent community newspaper in Ontario is less than $450,000 and the median is even lower, and so an integrated editorial and sales operation is the only realistic approach, even though online advertising is more effectively sold with a dedicated online sales function. At a minimum, though, smaller market papers could gain advantage by hiring a dedicated digital consultant to assist their staff in selling and posting copy or handling social media. And at the OCNA level, an online sales concentration is essential for national and regional advertising if the goal is to progress beyond upsells to print advertisers.
Central to this initiative is a technical component that will enable even the smallest newspapers to have a robust and well-supported platform, along with ad design and serving capabilities. The average revenue of a community newspaper too low to enable owners to invest in new technologies. And, as our U.S. survey showed, there is a lack of IT standardization among the smaller newspapers. This almost certainly impedes development and growth. If the associations intend to take a leadership role in kick-starting online growth for its independent members, this will be much less complicated if those members are running the same platforms for their advertising. The solution might be adapted from what is working for the chain-owned papers, acquired externally or be developed as a hybrid.
We recommend an approach to business planning that reviews market share. This is touched on tangentially in chart 4, and there are two key points:
■ the reach of online advertising is much greater than local print circulation ■ even if there is progressive growth in online revenues, that does not represent progress if the market is
growing at even faster rate and it may indicate a threat as other media companies expand their reach
Based on work that we did in 2008 for the American Press Institute, it may be possible to design generic ad spend estimates for the small markets served by community newspapers.
Finally, while an effective online strategy is essential, we want to stress that measuring share on the print side is probably more important than measuring it on the online side. The community newspaper at its core is print. And everything is tied to that. Keeping an eye on print share will keep community newspapers in line with market growth/shrinkage in print, rather than going out of sync and losing focus on something that generates more than 90% of revenues.

© Borrell Associates Inc. and Deseret Media Appendix A 24
REPORT TO THE ONTARIO COMMUNITY NEWSPAPERS ASSOCIATION | 201
“General Business Metrics(Source: Company financials, Borrell Associates Inc.)”
Best Practice
My Org. Lagging Tracking Leading Benchmarks
% Total Ad Revenue from Digital 25% 10% 18% 25%As traditional media is disrupted by digital media, a grow-ing percentage of media are companies’ revenue must come from digital.
“Operating Profit Margin(Less business development investment)”
5% - 10% 0% 5% 10%
It is critical that online general managers show that their core online business is profitable, excluding new investments in emerging products, which might take the overall business slightly negative.
Revenue % — Display Advertising 55% 75% 65% 55%Display advertising is the “low-hanging fruit.” Developing digital services is more difficult; but this must be done to become sustainable.
Revenue % — Digital Services 45% 25% 35% 45%Digital services needs to grow and as a component of rev-enue; these services often will increase access to clients who normally wouldn’t buy display and traditional advertising.
Services Best Practice
My Org. Lagging Tracking Leading Benchmarks
Share of Local Online Ad Spending15%-18% 10% 12% 15% Businesses should be capturing at least 15% of local online
spending, and the maximum expected is 30%.
Overall Growth Rate 30% 10% 20% 30%Digital services and non-advertising will show much higher growth, offset by advertising and more “traditional” banner advertising.
Display Advertising Metrics Best Practice
My Org. Lagging Tracking Leading Benchmarks
% of Online Revenue from Legacy Advertisers
45% 65% 55% 45%To truly grow a “new” business with digital, you will need to significantly grow the business from those who do not advertise with your legacy business. This metric lets you gauge your progress toward generating a new business.
% of Online Revenue from Digital-Only Advertisers
55% 35% 45% 55% The inverse of the legacy measurement.
% of Local Business Units that are Current Display Advertising Clients
20% 8% 13% 20%Your goal should be to use the internet to reach out to more and more businesses. Combined, your legacy and online businesses should create customer relationships with 20% of the businesses in your market.
% of Local Business Units that are Current Display Advertising and Digital Services Clients
40% 15% 25% 40%By combining display advertising and digital services, you should be able to reach 40% of the businesses in your market.
% of Inventory Direct Sold 85% 15% 50% 85%Although this can be a BHAG, best-practice businesses that can sell 85% of their inventory direct not only maximize rev-enue potential but also ensure highest quality, brand-safe advertisers and typically show higher performance.
% Inventory Remnant 15% 85% 50% 15%What isn’t direct-sold is remnant and typically is at a very low eCPM, not to mention often lower quality not necessar-ily brand-safe.
Ad Fill Rate 95% 85% 90% 95%Firing blanks doesn’t look good on the site, and it’s not good for the user experience. Ensure that y our waterfall and dill strategies (passbacks, etc.) are optimized to fill as many ad calls as possible.
Appendix A “Digital Media Business Model Dashboard”

© Borrell Associates Inc. and Deseret Media Appendix A 25
REPORT TO THE ONTARIO COMMUNITY NEWSPAPERS ASSOCIATION | 201
Direct eCPM $10.00 $6.00 $8.00 $10.00 The highest CPMs come from direct advertisers who pay for premium placements and long-term opportunities.
Remnant eCPM $1.00 $0.60 $0.80 $1.00
Site eCPM $8.65 $1.41 $4.40 $8.65 The higher the eCPM, the higher the revenue recognized, as long as sell-through is maximized.
Dynamic Pricing 5 3 4 5RTB, self-serve, dynamic rate cards, price elasticity analysis, linked to sales channels: how many of these have you implemented?
Display Advertising Metrics Best Practice
My Org. Lagging Tracking Leading Benchmarks
Digital $ as a multiple of digital sellers’ salaries
2x 1x 1.5x 2x Should be 2x digital sellers’ salaries; it usually takes a year to reach that level.
% Digital $ per Legacy Seller 15% 5% 10% 15% Higher for Classifieds; lower for National.
Digital Advertising Skills 5 3 4 5Targeting skills, pricing, digital competitive analysis/eco-system, IAB formats, digital advertising value proposition: Do you certify and train on these? How many of these have you implemented?
% of Advertisers Buying Digital Products 25% 5% 15% 25% This will accelerate to more than 50% by 2015
Frequency of Selling High-Impact Ads 5 3 4 5Corner peels, skins, flyouts, expandables, video, interstitials, roadblocks, sponsorships, native advertising, etc.: How many of these have you implemented?
% of Revenue from Video 5% 1% 3% 5% Video is one of the fastest-growing digital ad formats, and it typically is a higher-performing vehicle.
% of Revenue from Mobile 5% 1% 3% 5%Mobile is another fast-growing digital ad format, but spend isn’t matched up with time spent, nor have most companies implemented a solid mobile strategy.
Email Best Practice
My Org. Lagging Tracking Leading Benchmarks
% of Email Addresses of All Adults 50% 30% 40% 50%This assumes you have at least one email address for each adult in your market. Each adult on average has at least two email addresses.
How Robust is Your Email/Database Strategy?
5% 3 4 5Do you have an annual send strategy, is your email database segmented and modeled, are you testing, are you CAN-SPAM compliant and do you have a dedicated email/database marketing manager?
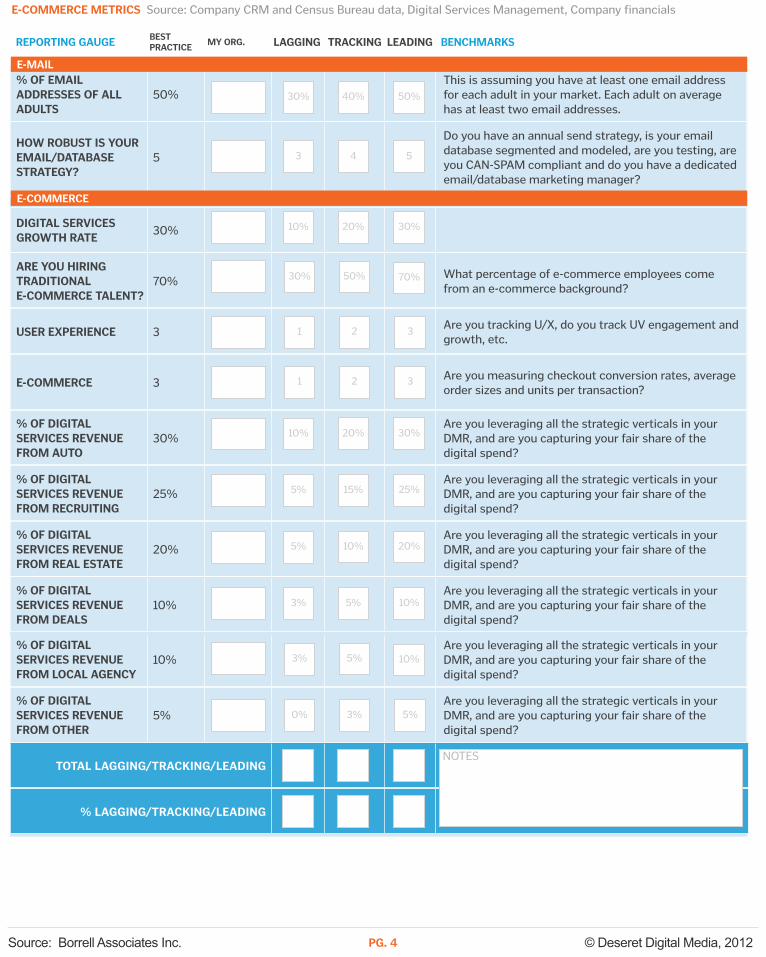
E-Commerce Best Practice
My Org. Lagging Tracking Leading Benchmarks
Digital Services Growth Rate 30% 10% 20% 30%
Are You Hiring Traditional E-Commerce Talent?
70% 30% 50% 70% What percentage of e-commerce employees come from an e-commerce background?
User Experience 3 1 2 3 Are you tracking user experience (U/X)? Do you track Unique Visitor engagement and growth?
Appendix A “Digital Media Business Model Dashboard”

© Borrell Associates Inc. and Deseret Media Appendix A 26
REPORT TO THE ONTARIO COMMUNITY NEWSPAPERS ASSOCIATION | 201
E-Commerce 3 1 2 3 Are you measuring checkout conversion rates, average order sizes and units per transaction?
% of Digital Services Revenue from: Best Practice
My Org. Lagging Tracking Leading Benchmarks
Auto 30% 10% 20% 30%
Recruiting 25% 5% 15% 25%
Real Estate 20% 5% 10% 20%
Deals 10% 5% 5% 10%
Local Agency 10% 3% 5% 10%
Other Sources 5% 0% 3% 5%
Are you leveraging all the strategic verticals in your DMR (Digital Marketing Region), and are you capturing your fair share of the digital spend?
Appendix A “Digital Media Business Model Dashboard”

© Deseret Digital Media, 2012Source: Borrell Associates Inc.
RepoRting gauge best pRactice
my oRg. Lagging tRacking Leading benchmaRks
% totaL ad Revenue fRom digitaL
25% As traditional media is disrupted by digital media, a
growing percentage of media are companies’ revenue must come from digital.
opeRating pRofit maRgin
5%-10% We suggest 5%-7% for newly organized/re-energized
organizations, inching up to 30%-35% EBITDA in ensuing years.
opeRating pRofit maRgin (Less business deveLopment investment)
5%-10%
It is critical that online general managers show that their core online business is profitable, excluding new investments in emerging products, which might take the overall business slightly negative.
Revenue % — dispLay adveRtising
55% Display advertising is the “low-hanging fruit.”
Developing digital services is more difficult; but this must be done to become sustainable.
Revenue % — digitaL seRvices
45%
Digital services needs to grow and as a component of revenue; these services often will increase access to clients who normally wouldn’t buy display and traditional advertising.
shaRe of LocaL onLine ad spending
15%-18%
Businesses should be capturing at least 15% of local online spending, and the maximum expected is 30%.
oveRaLL gRowth Rate
30% Digital services and non-advertising will show much
higher growth, offset by advertising and more “traditional” banner advertising.
totaL Lagging/tRacking/Leading
% Lagging/tRacking/Leading
10%
0%
0%
75%
25%
10%
10%
18%
5%
5%
65%
35%
12%
20%
25%
10%
10%
55%
45%
15%
30%
geneRaL business metRics Source: Company financials, Borrell Associates Inc.
Business Model Dashboard
pg. 1
NOTES
Adapted from

© Deseret Digital Media, 2012Source: Borrell Associates Inc.
RepoRting gauge best pRactice
my oRg. Lagging tRacking Leading benchmaRks
dispLay adveRtising metRics
% of onLine Revenue fRom Legacy adveRtiseRs
45%
To truly grow a “new” business with digital, you will need to significantly grow the business from those who do not advertise with your legacy businesses. This metric lets you gauge the progress toward generating new business.
% of onLine Revenue fRom digitaL — onLy adveRtiseRs
55%
The inverse of the legacy measurement.
% of LocaL business units that aRe cuRRent dispLay adveRtising cLients
20%
Your goal should be to use the Internet as a medium that helps you reach out to more and more businesses. Combined, your legacy and online businesses should be able to create customer relationships with 20% of the businesses in your market.
% of LocaL business units that aRe cuRRent dispLay adveRtising and digitaL seRvices cLients
40% By combining display advertising and digital services,
you should be able to reach 40% of the businesses in your market.
% inventoRy diRect soLd
85%
Although this can be a BHAG, best-practice businesses that can sell 85% or their inventory direct not only maximize revenue potential but also ensure highest quality, brand-safe advertisers and typically show higher performance.
% inventoRy Remnant
15% What isn’t direct-sold is remnant and typically is at a
very low eCPM, not to mention often lower quality and not necessarily brand-safe.
ad fiLL Rate 95%
Firing blanks doesn't look good on the site, and it's not good for user experience. Ensure that your waterfall and fill strategies (passbacks, etc.) are optimized to fill as many ad calls as possible.
diRect ecpm $10.00The highest CPMs come from direct advertisers who pay for premium placements and long-term opportunities.
Remnant ecpm $1.00Remnant CPM is typically low, but by maximizing waterfall and passbacks, it’s possible to achieve a higher-than-normal CPM.
site ecpm $8.65The higher the eCPM, the higher the revenue recognized, as long as sell-through is maximized.
dynamic pRicing 5 RTB, self-serve, dynamic rate cards, price elasticity analysis, linked to sales channels: How many of these have you implemented?
digitaL $ as muLtipLe of digitaL seLLeR’s saLaRy
2x
Should be 2X digital seller’s salary; it usually takes a year to reach that level.
65%
35%
7.5%
15%
15%
85%
85%
$6
$0.60
$1.41
55%
45%
12.5%
25%
50%
50%
90%
$8
$0.80
$4.40
45%
55%
20%
40%
85%
15%
95%
$10
$1.00
$8.65
Source: Company CRM and DOL/SBA data, AdOps, Sales Management, Company financials
pg. 2
3
1x
4
1.5x
5
2x

© Deseret Digital Media, 2012Source: Borrell Associates Inc.
% digitaL $ peR Legacy seLLeR
15% Classifieds should be higher; national accounts lower.
digitaL adveRtising skiLLs
5
Targeting skills, pricing, digital competitive analysis/ecosystem, IAB formats, digital advertising value proposition: Do you certify and train on these? How many of these have you implemented?
% of adveRtiseRs buying taRgeted pRoducts
25% This will accelerate from 2013-2015 and will exceed 50%.
fRequency of seLLing high-impact ads
5
Corner peels, skins, flyouts, expandables, video, interstitials, roadblocks, sponsorships, native advertising, etc.: How many of these have you implemented?
% Revenue — video 5%
Video is one of the fastest-growing digital ad formats, and it typically is a higher–performing vehicle.
% Revenue — mobiLe 5%Mobile is another fast-growing digital ad format, but spend isn’t matched up with time spent, nor have most companies implemented a solid mobile strategy.
totaL Lagging/tRacking/Leading
% Lagging/tRacking/Leading
RepoRting gauge best pRactice
my oRg. Lagging tRacking Leading benchmaRks
5%
3
5%
3
1%
1%
10%
4
15%
4
3%
3%
15%
5
25%
4
5%
5%
Source: Company CRM and DOL/SBA data, AdOps, Sales Management, Company financialsdispLay adveRtising metRics (continued)
pg. 3
NOTES
© Deseret Digital Media, 2012Source: Borrell Associates Inc.
% of emaiL addResses of aLL aduLts
50% This is assuming you have at least one email address
for each adult in your market. Each adult on average has at least two email addresses.
how Robust is youR emaiL/database stRategy?
5
Do you have an annual send strategy, is your email database segmented and modeled, are you testing, are you CAN-SPAM compliant and do you have a dedicated email/database marketing manager?
RepoRting gauge best pRactice
my oRg. Lagging tRacking Leading benchmaRks
3
30%
4
40%
5
50%
e-commeRce metRics Source: Company CRM and Census Bureau data, Digital Services Management, Company financials
pg. 4
% of digitaL seRvices Revenue fRom LocaL agency
10%Are you leveraging all the strategic verticals in your DMR, and are you capturing your fair share of the digital spend?
% of digitaL seRvices Revenue fRom otheR
5%Are you leveraging all the strategic verticals in your DMR, and are you capturing your fair share of the digital spend?
totaL Lagging/tRacking/Leading
% Lagging/tRacking/Leading
3%
0%
5%
3%
10%
5%
NOTES
digitaL seRvices gRowth Rate
30%
aRe you hiRing tRaditionaL e-commeRce taLent?
70%
What percentage of e-commerce employees come from an e-commerce background?
useR expeRience 3Are you tracking U/X, do you track UV engagement and growth, etc.
e-commeRce 3
Are you measuring checkout conversion rates, average order sizes and units per transaction?
% of digitaL seRvices Revenue fRom auto
30% Are you leveraging all the strategic verticals in your DMR, and are you capturing your fair share of the digital spend?
% of digitaL seRvices Revenue fRom RecRuiting
25% Are you leveraging all the strategic verticals in your
DMR, and are you capturing your fair share of the digital spend?
% of digitaL seRvices Revenue fRom ReaL estate
20% Are you leveraging all the strategic verticals in your
DMR, and are you capturing your fair share of the digital spend?
% of digitaL seRvices Revenue fRom deaLs
10%Are you leveraging all the strategic verticals in your DMR, and are you capturing your fair share of the digital spend?
10%
30%
1
1
10%
5%
5%
3%
20%
50%
2
2
20%
15%
10%
5%
30%
70%
3
3
30%
25%
20%
10%
e-commeRce
1

Coupons are a great way to enhance a directory listing and directory listings are a great way
to boost SEO for your site and the local business’s website.to boost SEO for your site and the local business’s website.
2

We had entries that ran the gamut from the quintessential walleye caught on a northern
Minnesota lake to Alaskan salmon, Caribbean sailfish, Gulf of Mexico barracuda, even some Minnesota lake to Alaskan salmon, Caribbean sailfish, Gulf of Mexico barracuda, even some
sharks. The best photo contests are around kids and animals. This one combined them
both.
3

Groupon is the best known provider of the deal of the day.
Forbes declared Groupon the fastest growing company – EVER – in August of last year and
estimated its revenue for 2010 to come in at $500 Million.
It started as a small blog in the fall of 2008 and has grown to become a force with an
estimated value of $15 Billion at an upcoming IPO.
They’ve even started signing deals with newspapers such as McClatchy Corp, as announced
in July.
We’re hearing from some papers that they do not share in ownership of the e-mail
addresses with Groupon and that there is a strong risk that partnerships like this will end
once all of the paper’s email addresses have been harvested by the deals partner.
4

So, if you want to participate in the fastest growing business model online today, how do
you do it in a way that maximizes revenue and grows your database of customers? Partner you do it in a way that maximizes revenue and grows your database of customers? Partner
with a company that gives you ownership over the product.
This is an example of The Capitol Dish, a Deal a Day platform offered by The Washington
Post. Secondstreet Media powers this platform.
5

Collect Emails and segment lists to deliver more targeted deals.
6

7

8

9
10

11
Related Documents


