DIGITAL DOORWAYS AND THE ANALYSIS OF SOFTWARE APPLICATION USAGE IN ‘UNASSISTED LEARNING’ ENVIRONMENTS IN IMPOVERISHED SOUTH AFRICAN COMMUNITIES by KIM LAWRENCE GUSH submitted in accordance with the requirements for the degree of MASTER OF TECHNOLOGIAE in the subject INFORMATION TECHNOLOGY at the UNIVERSITY OF SOUTH AFRICA SUPERVISOR: PROF M R DE VILLIERS MARCH 2011

Welcome message from author
This document is posted to help you gain knowledge. Please leave a comment to let me know what you think about it! Share it to your friends and learn new things together.
Transcript
DIGITAL DOORWAYS AND THE ANALYSIS OF SOFTWARE
APPLICATION USAGE IN ‘UNASSISTED LEARNING’
ENVIRONMENTS IN IMPOVERISHED SOUTH AFRICAN
COMMUNITIES
by
KIM LAWRENCE GUSH
submitted in accordance with the requirements for
the degree of
MASTER OF TECHNOLOGIAE
in the subject
INFORMATION TECHNOLOGY
at the
UNIVERSITY OF SOUTH AFRICA
SUPERVISOR: PROF M R DE VILLIERS
MARCH 2011
I declare that DIGITAL DOORWAYS AND THE ANALYSIS OF SOFTWARE APPLICATION USAGE IN ‘UNASSISTED LEARNING’ ENVIRONMENTS IN IMPOVERISHED SOUTH
AFRICAN COMMUNITIES is my own work, and that all sources used or quoted in the study have been indicated and acknowledged by means of complete references.
___________________________ ________________Kim Lawrence Gush Date
Abstract
The Digital Doorway (DD) project provides computing infrastructure in impoverished
communities in South Africa. DD terminals offer opportunities for unassisted- and peer-
assisted learning of basic computer skills, and varying computing activities ranging from
entertainment, to independent research.
This study addresses software application usage, and how it relates to user demographics (age
and gender) and location, in order to better understand both the user base, and the nature and
extent of DD interactions.
A mixed-methods approach is employed, involving log-files, interviews, questionnaires, and
naturalistic observation; to build up a holistic picture of application usage and user behaviour
at selected sites.
Important issues with respect to ICT for Education and Development in the DD context, are
addressed. Analysis of the data indicates notable trends, and relationships between age,
gender, location, and application usage. User behaviour and environmental effects on usage
are discussed, and recommendations provided for future DDs and similar initiatives.
Keywords: Computer literacy; Community informatics; Design-based research; Digital
divide; Digital Doorway; ICT in education; ICT for development; Mixed-methods research;
Technologically disadvantaged; Unassisted learning
iii

Afrikaanse opsomming
Die Digitale Deur (“Digital Doorway”) (DD) projek verskaf rekenaar-infrastruktuur aan arm
gemeenskappe in Suid-Afrika. DD terminale bied geleenthede vir selfstandig-en
portuurgroep-ondersteunde leer van basiese rekenaarvaardighede, asook 'n verskeidenheid van
rekenaar-aktiwiteite wat wissel van vermaak tot onafhanklike navorsing.
Hierdie studie spreek die gebruik van sagteware toepassings aan en spesifiek met betrekking
tot die demografie van gebruikers (ouderdom en geslag) en ligging van terminale, om
sodoende die verbruikersbasis, asook die aard en omvang van DD interaksies beter te
verstaan.
'n Benadering wat ‘n kombinasie van metodes, insluitende log-leêrs (“log files”), onderhoude,
vraelyste, asook natuurlike waarnemings gebruik, is toegepas om sodoende 'n holistiese
profiel van die gebruik van toepassings, asook verbruikersgedrag op geselekteerde terreine te
bepaal.
Belangrike aspekte van IKT (Inligting en Kommunikasie-Tegnologie) vir Onderrig en
Ontwikkeling in die DD konteks word aangespreek. Resultate van data analises dui op
beduidende tendense en verwantskappe tussen ouderdom, geslag, ligging en
gebruikstoepassing. Verbruikersgedrag, asook die effek van die omgewing op sagteware-
gebruik, word bespreek en aanbevelings vir toekomstige DDs en soortgelyke inisiatiewe
gemaak.
iv

Acknowledgements
I wish to express my gratitude to:
Professor Ruth de Villiers, my supervisor, for your friendship, encouragement, meticulous attention to detail, and valuable guidance throughout this study;
Hélène Müller, for all your valuable assistance with the statistical analysis;
Dr. Filistéa Naudé, for your assistance with administration, and sourcing articles;
Wambui Gititu, for assistance in proof-reading much of this work;
The Council for Scientific and Industrial Research (CSIR) and Department of Science and Technology (DST), for supporting and funding the Digital Doorway project;
The Meraka Institute, for allowing me time to complete this study;
The Digital Doorway team: Grant, Ronel, Ofentse, and Louis and his crew;
Mmamakanye, Nare, Charles and Bonang, for your assistance during the site visits;
My family and friends, for your love and encouragement;
&
Our Heavenly Father, the author of life and source of true wisdom.
v
Table of Contents
Abstract ...................................................................................................................................iii
Afrikaanse opsomming ............................................................................................................iv
Acknowledgements ..................................................................................................................v
Chapter 1 Introduction ..........................................................................................................................1
1.1 Introduction.....................................................................................................................21.2 Problem statements..........................................................................................................3
1.2.1 General problem statement, and the Digital Doorway............................................31.2.2 Specific problem statement......................................................................................31.2.3 Motivation for the study..........................................................................................3
1.3 Objectives of the research...............................................................................................41.4 Research design and methodology..................................................................................7
1.4.1 Structure of the study: the ‘building’.......................................................................71.4.2 Research model. ‘Framework for design’...............................................................91.4.3 Simplified representation of the research process...................................................9
1.5 Assumptions, limitations and delineations....................................................................101.6 Ethical aspects...............................................................................................................121.7 Dissertation chapter layout............................................................................................13
Chapter 2 Literature study of related work in South Africa and India ..........................................15
2.1 Introduction...................................................................................................................162.2 Information and communication technologies for development (ICT4D)....................162.3 Digital Exclusion...........................................................................................................182.4 Multiple dimensions of the digital divide......................................................................192.5 The Indian ‘Hole-in-the-Wall’ project...........................................................................202.6 A place for constructivism.............................................................................................272.7 Other initiatives aimed at providing computer training in impoverished areas............282.8 Summary of chapter......................................................................................................30
Chapter 3 Literature study of users and software application usage ................................................31
3.1 Introduction...................................................................................................................323.2 Related studies...............................................................................................................323.3 ‘Census at school’ results, 2009....................................................................................343.4 Related work in Australia, 2001-2002...........................................................................373.5 Summary of chapter......................................................................................................40
vi

Chapter 4 The Digital Doorway intervention – background information...........................................43
4.1 Introduction...................................................................................................................444.2 Cwili installation...........................................................................................................444.3 Subsequent Digital Doorways.......................................................................................454.4 Design-based research approach...................................................................................464.5 Evaluation......................................................................................................................504.6 Digital Doorway design improvements.........................................................................514.7 Progressive expansion of Digital Doorway pedagogical goals.....................................544.8 Massification Phase.......................................................................................................564.9 Hardware and software specifications...........................................................................574.10 Software applications used as content.........................................................................584.11 Context of use..............................................................................................................60
4.11.1 Physical environment...........................................................................................604.11.2 Social environment..............................................................................................614.11.3 Organisational environment.................................................................................634.11.4 Technical environment.........................................................................................63
4.12 Effective versus ineffective installations.....................................................................634.13 Summary of chapter....................................................................................................65
Chapter 5 Research design and methodology.........................................................................................67
5.1 Introduction...................................................................................................................685.2 Overall research design and process.............................................................................685.3 Research methods and methodologies overview...........................................................705.4 Research questions revisited.........................................................................................725.5 Quantitative study..........................................................................................................73
5.5.1 Quantitative data processing, overview.................................................................735.5.2 Quantitative data collection...................................................................................755.5.3 Categorisation of quantitative data........................................................................755.5.4 Selection of sites for quantitative study.................................................................785.5.5 Quantitative data analysis......................................................................................79
5.6 Qualitative study............................................................................................................805.6.1 Research methods for qualitative data, overview..................................................805.6.2 Selection of sites and participants for qualitative study........................................805.6.3 Qualitative data collection ....................................................................................815.6.4 Approach to the analysis of qualitative data .........................................................81
5.7 Summary of chapter......................................................................................................85
Chapter 6 Quantitative data collection and analysis ..........................................................................87
6.1 Introduction...................................................................................................................886.2 Data collection process and format of raw data............................................................88
6.2.1 Data collection mechanism 1.................................................................................886.2.2 Data collection mechanism 2.................................................................................89
vii
6.2.3 Data transfer mechanism.......................................................................................906.2.4 Data extraction.......................................................................................................90
6.3 Data cleaning.................................................................................................................916.4 Log file interrogation tool.............................................................................................926.5 Extraction of ‘per user’ log files....................................................................................93
6.5.1 Steps taken to arrive at meaningful data................................................................936.5.2 Data validity...........................................................................................................96
6.6 Sites, application hit-counts, and users.........................................................................966.6.1 Site selection..........................................................................................................966.6.2 Site details..............................................................................................................996.6.3 Self-registered users versus age...........................................................................1026.6.4 Account usage......................................................................................................102
6.7 Quantitative analysis for Research Question 1............................................................1046.7.1 Percentage total registered users per age group...................................................1046.7.2 Percentage of total hits per age group .................................................................1066.7.3 Comparison of age distributions per site.............................................................1066.7.4 Usage statistics per age group, per site................................................................1096.7.5 Usage findings - general categories.....................................................................1096.7.6 Significance of relationship between application usage and age category..........1126.7.7 Usage findings - specific categories....................................................................1156.7.8 Discussion............................................................................................................119
6.8 Quantitative analysis for Research Question 2............................................................1206.8.1 Gender-related registration findings....................................................................1206.8.2 Gender-related hit-count findings .......................................................................1236.8.3 Gender-related usage of general categories.........................................................1276.8.4 Gender by applications: Pearson’s (c x r) Chi-square .......................................1306.8.5 Discussion............................................................................................................131
6.9 Quantitative analysis for Research Question 3............................................................1326.9.1 Libraries, schools, FETs and public locations (a comparison)............................1326.9.2 General category usage per location grouping....................................................1336.9.3 Significance of relationship between application usage and location.................1356.9.4 Specific category usage by location grouping.....................................................1366.9.5 Which applications are underutilised by the intended target groups?.................140
6.10 Applicability to Research Question 4........................................................................1416.10.1 Do the results of RQ1, RQ2 and RQ3 help in better understanding the desires and needs of target users?..............................................................................................1416.10.2 What lessons are learned for future development, selection and presentation of applications?..................................................................................................................143
6.11 Summary of chapter..................................................................................................144
Chapter 7 Qualitative study – on-site interactions and analyses........................................................145
7.1 Introduction.................................................................................................................1467.2 Data collection methods..............................................................................................1467.3 Site and participant selection for interactions.............................................................1477.4 Design of questions ....................................................................................................148
viii
7.5 Results.........................................................................................................................1497.5.1 Site 1: Gatang high school...................................................................................1507.5.2 Site 2: Soshanguve Fablab...................................................................................1557.5.3 Site 3: Emjindini library......................................................................................1607.5.4 Msunduzi Customer Centre.................................................................................1667.5.5 Comparison tables...............................................................................................170
7.6 Discussion...................................................................................................................1717.7 Summary of chapter....................................................................................................175
Chapter 8 Discussion and conclusions ..................................................................................................177
8.1 Introduction.................................................................................................................1788.2 General discussion on DD usage.................................................................................1788.3 RQ1: What categories of applications are used by various age groups on Digital Doorways?..........................................................................................................................1808.4 RQ2: Does gender have an impact on extent of use and on application usage?.........1818.5 RQ3: How does the physical situation of the computer kiosk affect the types of applications accessed?........................................................................................................1838.6 RQ4: What is the relevance and applicability of these results to future unassisted learning terminals? ............................................................................................................1858.7 Effectiveness of a mixed-methods approach...............................................................1868.8 Recommendations.......................................................................................................1868.9 Future research...........................................................................................................1918.10 Conclusion.................................................................................................................191
References ............................................................................................................................195
Appendix A – Log file extracts ..............................................................................................203
Appendix B – Code listings ...................................................................................................204
Appendix C: Data cleaning as applied to original site list ....................................................214
Appendix D: Assignment of applications to general categories ...........................................218
Appendix E: Quantitative data tables ....................................................................................221
Appendix F: Consent forms and ethical clearance ................................................................228
Appendix G: Interview/questionnaire template ..................................................................231
Appendix H: Qualitative study data selection ......................................................................233
Appendix I: Glossary and acronyms ....................................................................................234
Appendix J: Attached CD contents ......................................................................................235
ix
List of Figures
Figure 1.1: Research Question 1 & 2: Illustration A...................................................................6Figure 1.2: Research Question 1 & 2: Illustration B...................................................................6Figure 1.3: Research project structure and layering....................................................................7Figure 1.4: Research design, adapted from Creswell (2009:5)...................................................9Figure 1.5: Research process (Oates, 2006:33).........................................................................10Figure 1.6: Chapter layout and interrelationships.....................................................................14Figure 2.1: Users at a ‘Hole-in-the-Wall’ site, India.................................................................24Figure 2.2: ‘Hole-in-the-Wall’ site, 40 minutes drive from Jaisalmer, India............................24Figure 3.1: Facilities and services at schools (Statistics South Africa, 2010:22).....................35Figure 3.2: Favourite subject by gender, grades 3 to 7 (Statistics South Africa, 2010:37).......35Figure 3.3: Favourite subject by gender, grades 8 to 12 (Statistics South Africa, 2010:38).....36Figure 3.4: Access to goods/services in the community (Statistics South Africa, 2010 :38)....36Figure 4.1: Official launch of the Cwili DD, 2002...................................................................44Figure 4.2: Collaborative usage amongst users, both young and old, at the Cwili site............45Figure 4.3: Amiel and Reeves (2008:34) diagram: predictive versus DBR..............................48Figure 4.4: Simple representation of the research and implementation process (Gush et al., 2011:104)..................................................................................................................................48Figure 4.5: Digital Doorway hardware variations.....................................................................53Figure 4.6: Digital Doorway sites as of March 2009................................................................56Figure 4.7: Digital Doorway physical characteristics...............................................................57Figure 4.8: Top view, showing the server and client positions.................................................58Figure 4.9: First-tier ‘Programs’ menu......................................................................................59Figure 4.10: First-tier ‘Resources’ menu..................................................................................59Figure 4.11: Space is at a premium at the single terminal device.............................................60Figure 4.12: Visibility of content reduced by reflections off a scratched and dirty screen.......61Figure 4.13: Wear and tear on touch-pad..................................................................................61Figure 4.14: Children and community champion interact at the single terminal device.........61Figure 4.15a: Interaction around a multi-terminal DD: notice users in brown and white hats.62Figure 4.15b: These users have swapped hats as well as learning! .........................................62Figure 4.16: Ineffective system (Gush et al., 2011)..................................................................64Figure 4.17: Effective system (Gush et al., 2011).....................................................................65Figure 5.1: Research design, adapted from Creswell (2009:5).................................................68Figure 5.2: Research process, adapted from Oates (2006:33)..................................................69Figure 5.3: Mixed-methods, sequential design (Creswell, 2009).............................................70Figure 5.4: Process from raw data to visualisation...................................................................74Figure 5.5: Main components of quantitative data collection and analysis..............................79Figure 5.6: Data analysis in qualitative research (Creswell, 2009:185) ..................................83Figure 6.1: DD login screen......................................................................................................88
x
Figure 6.2: User registration form.............................................................................................89Figure 6.3: Data transmission...................................................................................................90Figure 6.4: Non-standard age entries........................................................................................92Figure 6.5: Interesting age entries.............................................................................................92Figure 6.6: Log file interrogation tool (simple representation).................................................93Figure 6.7: Vezebuhle application launch example...................................................................95Figure 6.8: Overall usage by females........................................................................................95Figure 6.9: Log details for sites – example segment.................................................................97Figure 6.10: Subset 10 selection...............................................................................................98Figure 6.11: Selected Digital Doorway sites.............................................................................99Figure 6.12: Number of users versus hit-count.......................................................................103Figure 6.13: Number of users versus hit-count cumulative....................................................103Figure 6.14: Registered users per age group...........................................................................105Figure 6.15: Age distribution of registered users (75 sites)....................................................105Figure 6.16: Percentage of total hits per age group................................................................106Figure 6.17: Kwam-Hlonipha, Limpopo.................................................................................106Figure 6.18: Vezebuhle, Mpumalanga....................................................................................106Figure 6.19: Elandskraal, Limpopo.........................................................................................107Figure 6.20: Emjindini, Mpumalanga.....................................................................................107Figure 6.21: Kanyamazane, Mpumalanga..............................................................................107Figure 6.22: Letaba FET 2, Limpopo......................................................................................107Figure 6.23: Letaba FET Giyani, Limpopo.............................................................................108Figure 6.24: Msunduzi, KwaZulu-Natal.................................................................................108Figure 6.25: Soshunguve Fablab, Gauteng.............................................................................108Figure 6.26: Kagung, Northern Cape......................................................................................108Figure 6.27: Application hits per age grouping and category (gender independent)..............111Figure 6.28: Specific category usage (percentages) per age group.........................................118Figure 6.29: Percentage of registered users per gender..........................................................120Figure 6.30: Percentage of registered users per age group (males and females) ...................121Figure 6.31: Percentage registered males and females, per age group...................................122Figure 6.32: Percentage of total hits by gender.......................................................................123Figure 6.33: Percentage of total hits per age group (males and females)...............................124Figure 6.34: Average hits per user, male and female..............................................................125Figure 6.35: Percentage of male hits for a particular category versus total male hits, and percentage of female hits per category versus total female hits..............................................128Figure 6.36: Percentage of male and female hits for a particular category versus total hits. .128Figure 6.37: Application hits per age grouping and category (males)....................................129Figure 6.38: Application hits per age grouping and category (females).................................130Figure 6.39: General category usage percentages, per location grouping..............................133Figure 6.40: Specific application versus location...................................................................137Figure 6.41: Specific application categories versus location, stacked....................................138Figure 6.42: Hit-counts for 156 sites......................................................................................139
xi
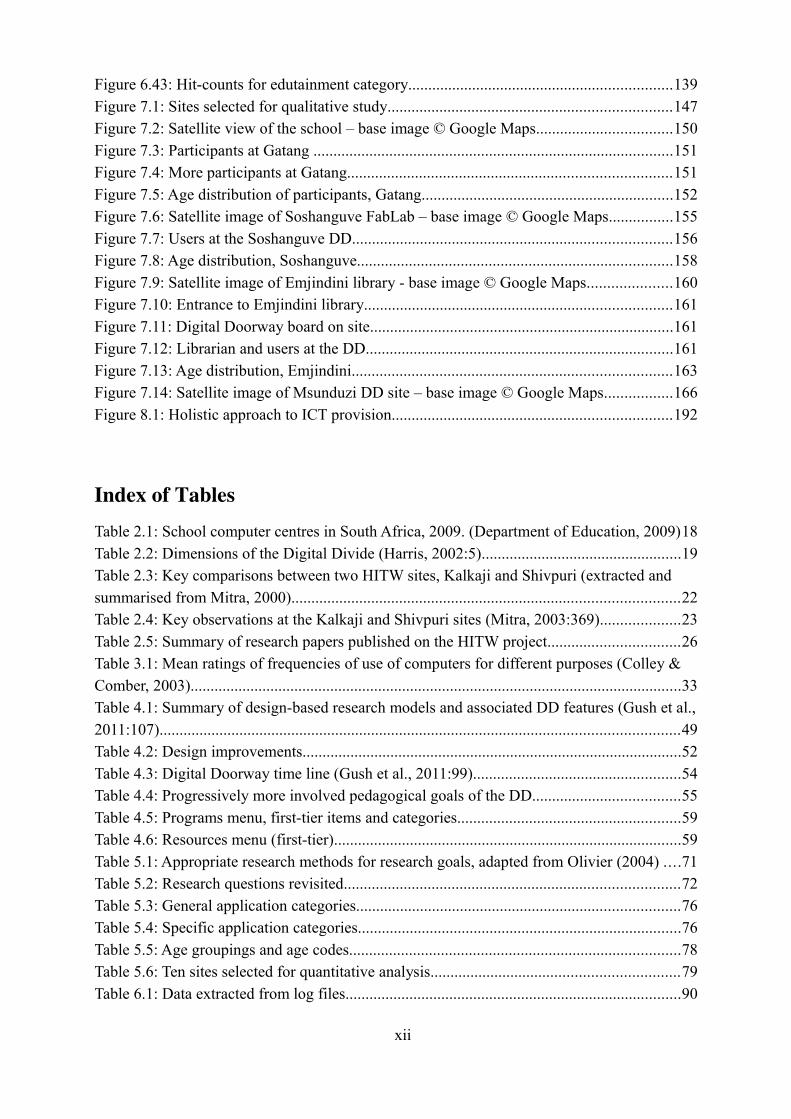
Figure 6.43: Hit-counts for edutainment category..................................................................139Figure 7.1: Sites selected for qualitative study.......................................................................147Figure 7.2: Satellite view of the school – base image © Google Maps..................................150Figure 7.3: Participants at Gatang ..........................................................................................151Figure 7.4: More participants at Gatang.................................................................................151Figure 7.5: Age distribution of participants, Gatang...............................................................152Figure 7.6: Satellite image of Soshanguve FabLab – base image © Google Maps................155Figure 7.7: Users at the Soshanguve DD................................................................................156Figure 7.8: Age distribution, Soshanguve...............................................................................158Figure 7.9: Satellite image of Emjindini library - base image © Google Maps.....................160Figure 7.10: Entrance to Emjindini library.............................................................................161Figure 7.11: Digital Doorway board on site............................................................................161Figure 7.12: Librarian and users at the DD.............................................................................161Figure 7.13: Age distribution, Emjindini................................................................................163Figure 7.14: Satellite image of Msunduzi DD site – base image © Google Maps.................166Figure 8.1: Holistic approach to ICT provision......................................................................192
Index of Tables
Table 2.1: School computer centres in South Africa, 2009. (Department of Education, 2009)18Table 2.2: Dimensions of the Digital Divide (Harris, 2002:5)..................................................19Table 2.3: Key comparisons between two HITW sites, Kalkaji and Shivpuri (extracted and summarised from Mitra, 2000).................................................................................................22Table 2.4: Key observations at the Kalkaji and Shivpuri sites (Mitra, 2003:369)....................23Table 2.5: Summary of research papers published on the HITW project.................................26Table 3.1: Mean ratings of frequencies of use of computers for different purposes (Colley & Comber, 2003)...........................................................................................................................33Table 4.1: Summary of design-based research models and associated DD features (Gush et al., 2011:107)..................................................................................................................................49Table 4.2: Design improvements...............................................................................................52Table 4.3: Digital Doorway time line (Gush et al., 2011:99)....................................................54Table 4.4: Progressively more involved pedagogical goals of the DD.....................................55Table 4.5: Programs menu, first-tier items and categories........................................................59Table 4.6: Resources menu (first-tier).......................................................................................59Table 5.1: Appropriate research methods for research goals, adapted from Olivier (2004) ....71Table 5.2: Research questions revisited....................................................................................72Table 5.3: General application categories.................................................................................76Table 5.4: Specific application categories.................................................................................76Table 5.5: Age groupings and age codes...................................................................................78Table 5.6: Ten sites selected for quantitative analysis..............................................................79Table 6.1: Data extracted from log files....................................................................................90
xii

Table 6.2: The ten sites selected for detailed analysis...............................................................98Table 6.3: Site location categories..........................................................................................100Table 6.4: The ten sites chosen for this quantitative study, in seven different location categories................................................................................................................................101Table 6.5: Age category, and number of registered users per category ..................................102Table 6.6: Percentage registered users per age group.............................................................105Table 6.7: Per-site hit-count, per age group............................................................................110Table 6.8: Chi-square for age versus application usage..........................................................112Table 6.9: Cochran-Armitage age-trend tests on three pairs of application usage variables. .114Table 6.10: Hit-count for specific categories (per age group) ................................................116Table 6.11: Hit-count percentages (per age group) ................................................................117Table 6.12: Registered users per gender.................................................................................120Table 6.13: Registered users per gender, per age group..........................................................121Table 6.14: Percentage registered males and females, per age group.....................................122Table 6.15: Total hits per gender, per age group.....................................................................124Table 6.16: Account usage indicators......................................................................................125Table 6.17: Hits per user, per site............................................................................................126Table 6.18: Gender versus hit-count and reg. users................................................................126Table 6.19: Percentage of males and females accessing each category..................................127Table 6.20: Gender versus application category, cell Chi-square values................................130Table 6.21: Site categories......................................................................................................132Table 6.22: Chi-square for location versus application category............................................135Table 6.23: General category hit-counts for 156 sites.............................................................139Table 6.24: Edutainment breakdown.......................................................................................139Table 6.25: The effect of local games on edutainment category hit percentage.....................140Table 7.1: Gender perceptions.................................................................................................153Table 7.2: Site comparisons 1: demographics and usage patterns..........................................170Table 7.3: Site comparisons 2: gender perceptions and usage preferences.............................171
Index of Code Segments
Code_segment 6.1: Script example – unique user names.........................................................94Code_segment 6.2: Script example - application launches per age category...........................94Code_segment 6.3: Script example - application launches in edutainment category per age category.....................................................................................................................................94Code_segment 6.4: Percentage edutainment application launches versus total application launches in age category zero...................................................................................................95Code_segment 6.5: Vezebuhle application launch code...........................................................95Code_segment 6.6: Determining overall usage by females......................................................95
xiii

– 1 – Introduction
Chapter 1 – Introduction 1

1.1 Introduction
Computers are increasingly more pervasive in current society. Whether for work- or leisure
related activities, there is an ever increasing demand for computer- and information literacy
skills amongst users of all age groups and origins. Rural and impoverished communities in
South Africa and Africa are no exception. Eisenberg, Lowe and Spitzer (2008:39) describe
information and technology (IT) literacy as the ‘basic skills set of the 21st century’, however,
access to physical infrastructure and appropriate software to enable the acquisition of these
skills, is limited. In 2009, a mere 23% of schools in South Africa were equipped with
computer centres (Department of Education, 2009). There is also a dearth of computer
teachers in rural South African schools. There is a need for computer infrastructure, computer
literacy training and relevant content in impoverished areas with technologically-
disadvantaged populations. Further, given the short supply of computer infrastructure, the
existing capacity should be used in the most effective ways possible.
Increased access to computer technology and the development of computer skills may be
accomplished in various ways, including the accelerated roll out of computer laboratories and
information kiosks. However, a previously little-explored alternative, which may co-exist
with other support facilities, is the provision of resources for independent unassisted learning,
peer-assisted learning or minimally invasive education (MIE) (Gush & de Villiers, 2010;
Mitra, 2000). According to Dangwal, Jha and Kapur (2006:295): ‘MIE demonstrates a special
case of the interplay of information technology (computers) and learning processes and
emphasises the role of self-directed and participatory learning’.
In 2002, the Meraka Institute (Information and Communications Technology Unit) of the
Council for Scientific and Industrial Research (CSIR) in Pretoria, initiated a cross-disciplinary
project known as the ‘Digital Doorway’ (Smith, Cambridge & Gush, 2005). The Digital
Doorway (DD) is a standalone rugged multi-terminal computer system that is placed at
various strategic sites in impoverished areas of South Africa. Multiple DD sites – over 200 –
are currently in operation as of 2011. The DD is designed for independent, open-ended use,
where learning takes place without formal training. The target group comprises users of all
ages, but primarily youth between the ages of 10 and 25.
The research study described in this dissertation is concerned with the usage of software
applications on the DDs. The study is situated within a variety of disciplines including
education and e-learning, community informatics, software design and social aspects. The
problem statements to follow serve as a foundation and motivation for the research.
2 Chapter 1 – Introduction
1.2 Problem statements
1.2.1 General problem statement, and the Digital Doorway
In many marginalised and impoverished South African communities, computer infrastructure,
computer centres, computer teachers and basic computer literacy skills are limited or non-
existent. How can this situation be addressed?
Various attempts are being made to engage with this problem. The DD project is one such
initiative – deploying freely accessible, rugged computer kiosks, for informal unsupervised
learning in the basic use of computers; the development of information literacy skills; and the
provision of a variety of educational, recreational and informational content.
1.2.2 Specific problem statement
Where socio-technical solutions such as the DD have been implemented, resources are often
extremely limited and need to be shared between many individuals in the community. The
software resources should thus be used in the most efficient way possible, in order to achieve
maximum effect. Inherent to making these resources more efficient, is a clear understanding
of how they are being used, both from a social and physical perspective, as well as from a
software usage perspective. The latter requires research into usage of the applications, in order
to better understand the extent of their use; and the usage patterns of various types of users.
This leads us to the main objectives of this study, which is to accurately determine the type
and frequency of software applications accessed at DD kiosks, and to determine the
relationships between specific application usage and user demographics (age and gender), as
well as between application usage and site location.
The complexity of the problem, due to the many different software applications available to
users, may be simplified – for the purposes of this research – in two ways: i) grouping
applications with shared characteristics into broad categories, and ii) limiting the study to a
subset of the total possible sites.
1.2.3 Motivation for the study
This study is motivated by a need to better understand the usage of information and
communication technologies (ICTs) in rural and impoverished areas, particularly in cases
where previous exposure to technology has been non-existent.
Chapter 1 – Introduction 3

The following quotes highlight the potential for ICTs to bring about social change, and the
importance of appropriate content:
‘If wisely used, investments in information, knowledge, and ICTs can help
generate wealth and jobs, build bridges between governments and citizens, forge
relations among organisations and communities, and improve the delivery of
essential services to poor people. While some people are sceptical about their
direct contribution to poverty alleviation, there are signs that ICTs can contribute
to development goals - if they are used properly. Proper use is crucial and is
based on local needs and circumstances. [Proper use] requires actions to enhance
the connectivity of countries and people, to ensure that the new tools are
accessible, and to foster and develop suitable content.’ (Ballantyne, Labelle &
Rudgard, 2000:1-2).
‘Use of ICTs is limited by lack of awareness and skills, and by insufficient access
to trained personnel, know how, equipment, services and infrastructure. The
initial and recurring costs of acquiring a computer and an Internet connection are
often prohibitive. A lack of appropriate content can also limit use.’ (Ballantyne,
Labelle & Rudgard, 2000:2).
In a study on the feasibility of ICT diffusion and use amongst rural women in South Africa
(Kwake, Ocholla & Adigun, 2006), the researchers mention the importance of appropriate
content, both in terms of language and subject matter, as well as the need to significantly
reduce the hindrances to accessibility, either before or during the provision of the technology.
The DD kiosks, which form part of a countrywide learning and information access platform,
were installed in order to help meet identified needs, through unassisted learning, or
‘unsupervised computer use’ (van Cappelle, Evers & Mitra, 2004:1). The understanding
gained from this research will assist in the customisation of future DD content, and inform the
researcher as to the effectiveness of the unassisted- and peer-assisted learning paradigms.
1.3 Objectives of the research
This research therefore aims to analyse application usage and user activity at a representative
selection of DD computer terminals in rural and impoverished communities in South Africa,
in order to better understand the activities of the users.
This research sets out to answer the following questions:
4 Chapter 1 – Introduction
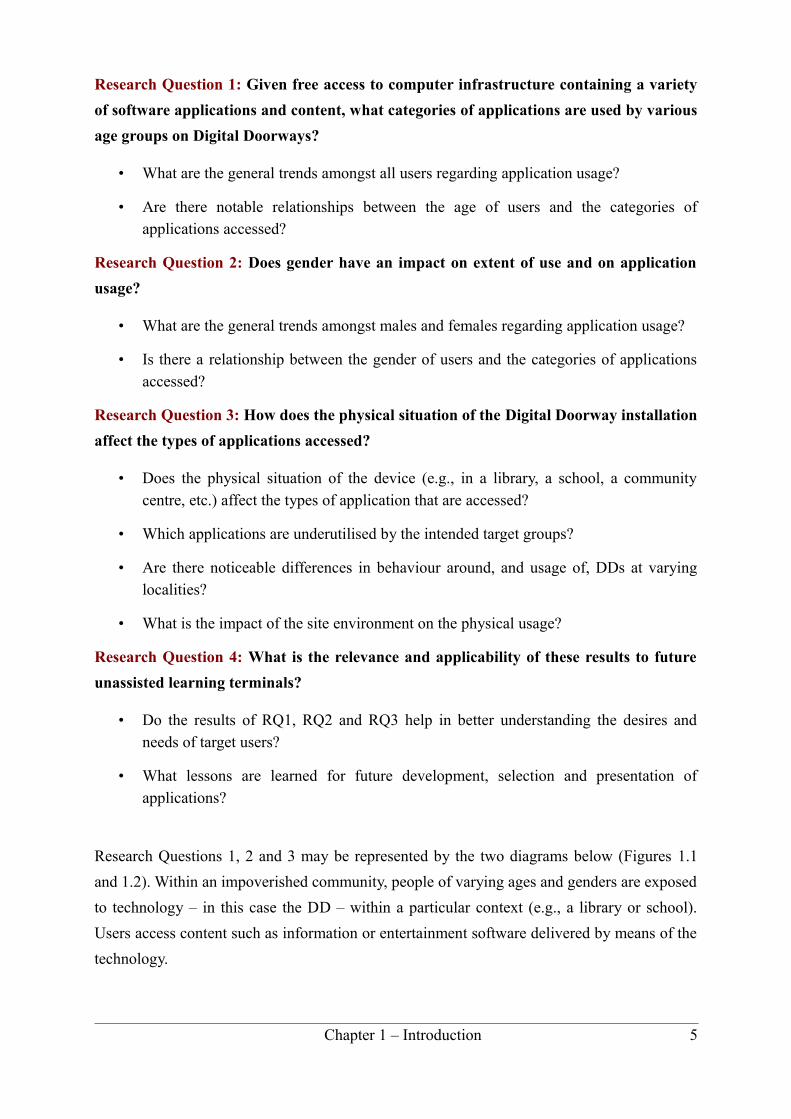
Research Question 1: Given free access to computer infrastructure containing a variety
of software applications and content, what categories of applications are used by various
age groups on Digital Doorways?
• What are the general trends amongst all users regarding application usage?
• Are there notable relationships between the age of users and the categories of applications accessed?
Research Question 2: Does gender have an impact on extent of use and on application
usage?
• What are the general trends amongst males and females regarding application usage?
• Is there a relationship between the gender of users and the categories of applications accessed?
Research Question 3: How does the physical situation of the Digital Doorway installation
affect the types of applications accessed?
• Does the physical situation of the device (e.g., in a library, a school, a community centre, etc.) affect the types of application that are accessed?
• Which applications are underutilised by the intended target groups?
• Are there noticeable differences in behaviour around, and usage of, DDs at varying localities?
• What is the impact of the site environment on the physical usage?
Research Question 4: What is the relevance and applicability of these results to future
unassisted learning terminals?
• Do the results of RQ1, RQ2 and RQ3 help in better understanding the desires and needs of target users?
• What lessons are learned for future development, selection and presentation of applications?
Research Questions 1, 2 and 3 may be represented by the two diagrams below (Figures 1.1
and 1.2). Within an impoverished community, people of varying ages and genders are exposed
to technology – in this case the DD – within a particular context (e.g., a library or school).
Users access content such as information or entertainment software delivered by means of the
technology.
Chapter 1 – Introduction 5

The green and red lines highlight the research questions of interest, namely i) the relationships
between users and content (applications accessed by users), and ii) the relationships between
context (or location) and content accessed.
The above diagram may be expanded to include specifics as they relate to this study, pictured
in Figure 1.2.
6 Chapter 1 – Introduction
Figure 1.1: Research Question 1 & 2: Illustration A
Figure 1.2: Research Question 1 & 2: Illustration B
ContextImpoverished communitiesOften ruralLibrarySchoolCommunity centre
Technology(Digital Doorways)
Content(applications)Various categoriesEducation, Reference,Games etc.
UsersDifferent agesMale / female
Research relationships between: Context and content accessed Users and content accessed
contexttechnology
contentusers
1.4 Research design and methodology
1.4.1 Structure of the study: the ‘building’
This research project is a subset of the greater Digital Doorway project in which the
researcher has been involved since its inception in 2002. The Digital Doorway is a cross-
disciplinary research and implementation project that spans a wide range of disciplines, the
most important ones being systems engineering (hardware design and software
implementation), informal learning (unassisted or peer-assisted learning) and community
informatics – a blend of technological and social factors (Stillman & Linger, 2009).
‘Completing a research project is like completing a building. Your ultimate goal when
constructing the building may be to have a roof over your head. Before you can put the roof
up, however, you have to erect the walls; and before you can erect the walls, you have to lay
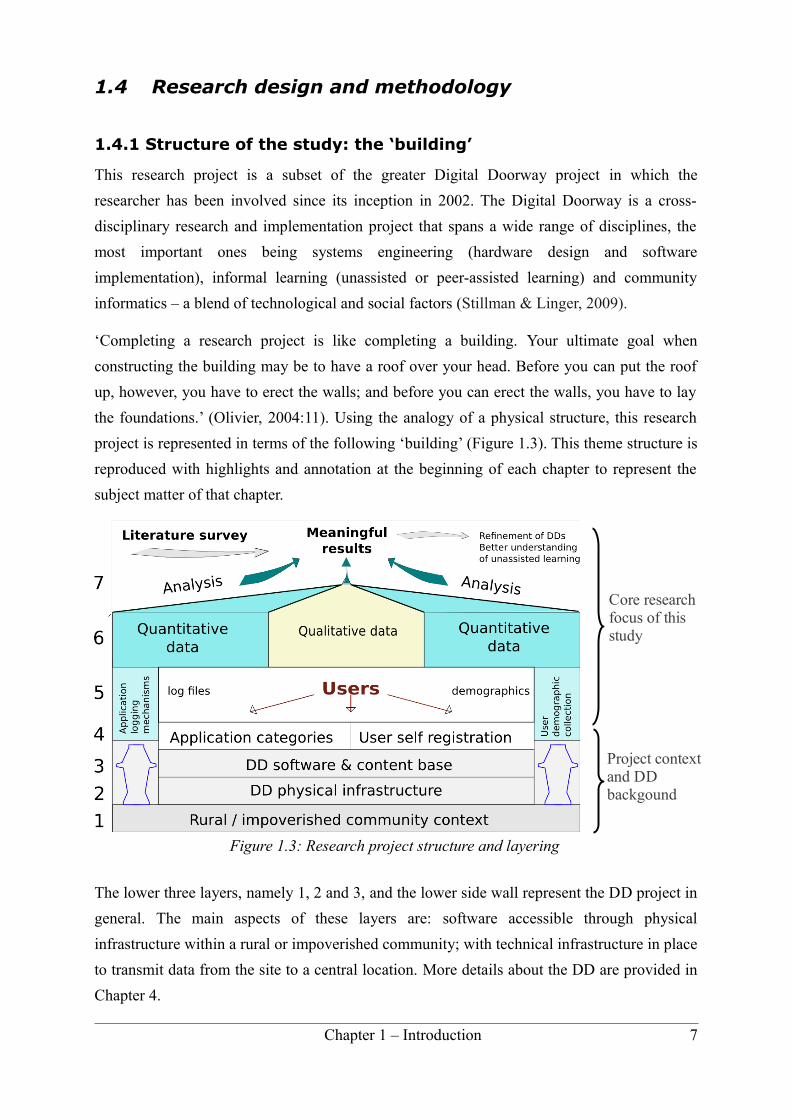
the foundations.’ (Olivier, 2004:11). Using the analogy of a physical structure, this research
project is represented in terms of the following ‘building’ (Figure 1.3). This theme structure is
reproduced with highlights and annotation at the beginning of each chapter to represent the
subject matter of that chapter.
The lower three layers, namely 1, 2 and 3, and the lower side wall represent the DD project in
general. The main aspects of these layers are: software accessible through physical
infrastructure within a rural or impoverished community; with technical infrastructure in place
to transmit data from the site to a central location. More details about the DD are provided in
Chapter 4.
Chapter 1 – Introduction 7
Figure 1.3: Research project structure and layering
Core research focus of this study
Project context and DD backgound
Layer 1: The environment into which the DD computers are placed – always impoverished,
often rural and remote.
Layer 2: The physical DD hardware.
Layer 3: The operating system and software applications accessible on the computers.
Layers 4 to 6 represent the core focus of this research study. Data is collected on user
demographics (through a user self-registration process) and usage of the built-in software
applications. Applications are categorised into major groups of education, games, reference,
office, system, video/audio and edutainment. The analysis of application usage, as well as
relationships between demographics and application usage are combined with the findings of
qualitative studies and literature survey support. This will provide results relevant to both the
academic community and practitioners involved in the deployment of similar systems in the
future.
Layer 4: Each of the applications is assigned a unique category. Data collection occurs by
means of wrapper scripts and registration forms embedded in the software. Each new user to
register a user name at a DD, inputs age, gender and various demographic details. Each menu
item in the applications and resources menus is wrapped in a script that records date, time and
user name of each application hit.
Layer 5: Users represent a diverse collection of people of both genders from a variety of
backgrounds and age groups. They access the content on the DD and in so doing, populate log
files of data; a core element in this study.
Layer 6: Quantitative data is collected from the log files and categorised, in order to facilitate
analysis. Qualitative data collection is done by means of interviews, questionnaires, and
observation.
Layer 7: Quantitative data is analysed in order to shed light on how applications are being
used and how application usage relates to demographics of users. Qualitative data is analysed
to provide further illumination on specific cases.
Results from the layer 7 analysis provides primary data. This data, together with a survey of
related literature, which forms secondary data, is used to inform future refinements on
community informatics projects in general and the DDs in particular. The data also provides
generalised results on trends in application usage amongst impoverished users of different
ages, genders, and backgrounds.
8 Chapter 1 – Introduction
1.4.2 Research model. ‘Framework for design’
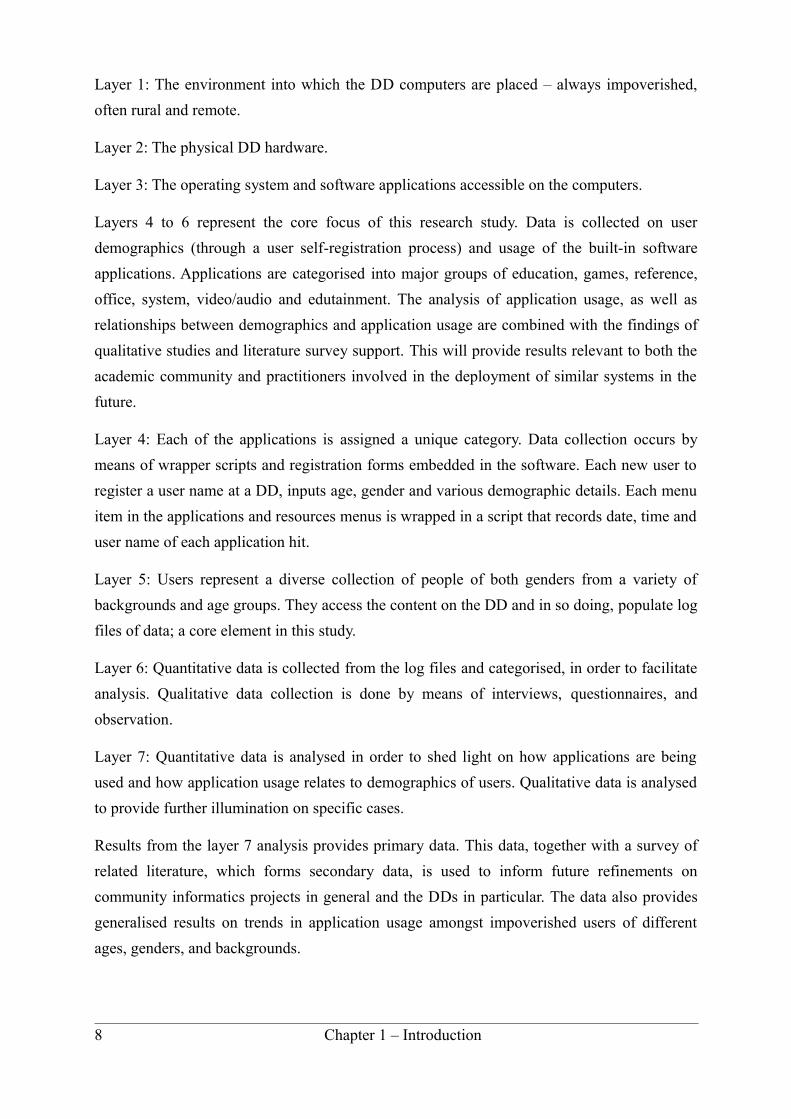
Figure 1.4, based on Creswell (2009:5), illustrates the overall research design of this study,
the details of which are covered in Chapter 5. Under each of Creswell's three components of
design, namely philosophical worldviews, selected strategies of inquiry, and research
methods, respectively, those applied in the present study are highlighted in red blocks.
This study uses a mixed-methods strategy of inquiry; an advocacy/ participatory as well as
pragmatic philosophical worldview; and research methods that involve progressing from the
initial research questions, through data collection and analysis, interpretation, write-up and
validation.
1.4.3 Simplified representation of the research process
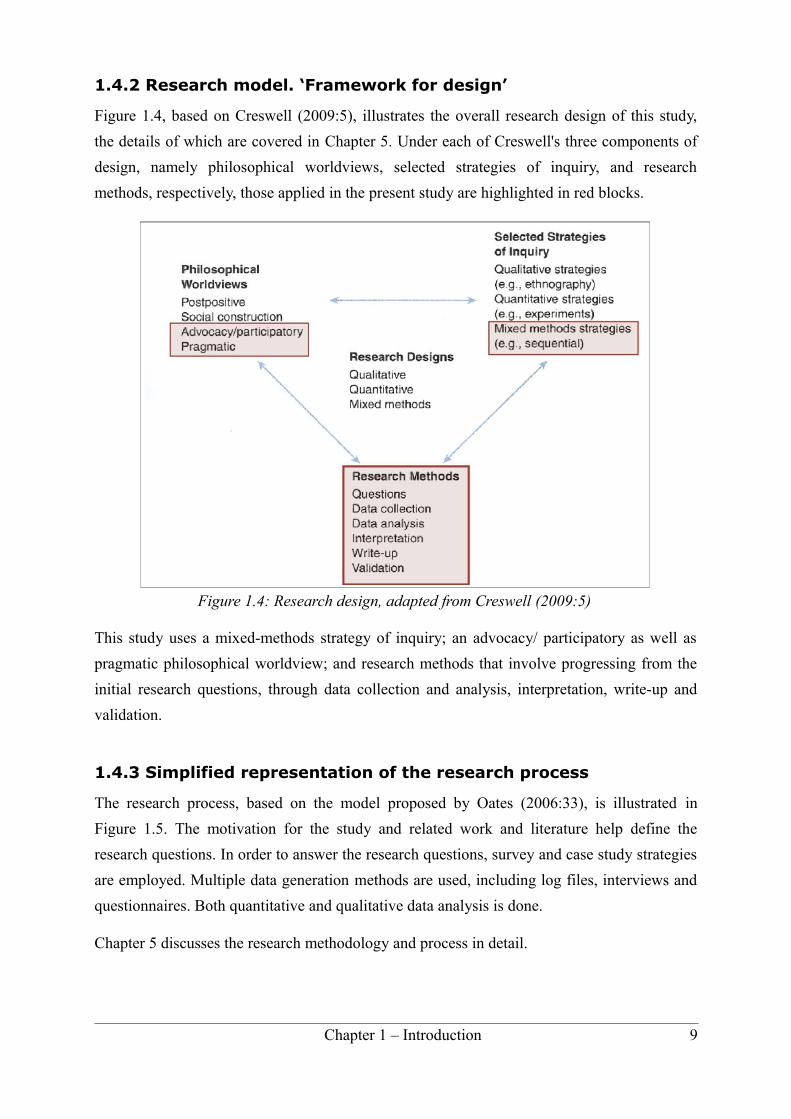
The research process, based on the model proposed by Oates (2006:33), is illustrated in
Figure 1.5. The motivation for the study and related work and literature help define the
research questions. In order to answer the research questions, survey and case study strategies
are employed. Multiple data generation methods are used, including log files, interviews and
questionnaires. Both quantitative and qualitative data analysis is done.
Chapter 5 discusses the research methodology and process in detail.
Chapter 1 – Introduction 9
Figure 1.4: Research design, adapted from Creswell (2009:5)
1.5 Assumptions, limitations and delineations
This study aims to extract the most accurate and meaningful information possible from the
data obtained, however, certain assumptions, limitations and delineations need to be
mentioned. While specifics will emerge in subsequent chapters, the most important ones are
listed below:
Assumptions:
The following assumptions have been made:
• That data input by users (age, gender etc.) is correct. Attempts have been made to identify incorrect data and eliminate it from the study datasets.
• Where analysis of the data results leads to recommendations and general comments, it is assumed that the data under study is a good representation of the complete data of the population under consideration.
• It is assumed that users have an adequate understanding of the English language and that the answers provided via the user self-registration form and in the interviews/questionnaires are accurate representations of what the user wished to communicate.
Limitations:
The main limitations and constraints of this study are:
• The study is limited by the amount and accuracy of the data, which was obtained as per the next bullet.
• The study is restricted to a specific set of sites, selected by well-defined criteria to establish (in the case of the quantitative study) a representative sample.
10 Chapter 1 – Introduction
Figure 1.5: Research process (Oates, 2006:33)
Literature review
Research Questions
Case Studies
Strategies Data generation methods
Log FilesMulti-siteSurvey
Interviews Questionnaires
Observation
Data analysis
Quantitative
Qualitative
Motivation
• Most analysis of the quantitative data is limited to registered users only.
• The quantitative study is based on ten selected sites, and the qualitative study is limited to four selected sites.
• Due to various software instantiations in the field, a small percentage of the applications were not present on all DDs. These applications will be under-represented when compared with applications that are present on every machine. The categorisation of applications in this study however, reduces the impact of these discrepancies, though the reality of this situation needs to be mentioned.
• The intention is that no limitations should be imposed on use of DDs at the various sites. For example, children should be able to use DD terminals at libraries and community centres, and in schools, adult users from the community should be allowed to use DDs after school hours. Nevertheless, due to the vagaries of human behaviour and policies of administrators, it cannot be guaranteed that this open-door policy is implemented across the board.
More details regarding the limitations of the log file analysis, are:
• The quantitative log files do not record applications launched from the command line. It is possible that certain technologically advanced users may, on occasions, use this method to launch applications, which would then not be logged. This would be of greater concern if this study was a comparison between novice users and expert users, however, the very small percentage of applications possibly launched in this manner is unlikely to significantly affect the results.
• As it is only possible to compare age and gender differences of application usage for registered users, much of the analysis excludes data obtained for guest users. The latter may, however, be used to look at general trends in site-for-site comparisons. Approximately ten percent of total usage was by registered users.
Delineations:
The following delineations are applicable:
• It is not the purpose of this study to investigate learning per se. The study does not investigate long-term educational effects of unassisted learning.
• The research focuses on the nature and extent of usage of the various software packages installed on DDs. The term ‘unassisted learning’ in the title serves as an adjective, not as the subject or object of the study. The term is used in the title to set the context for the usage analysis.
• The study does not include detailed analysis of sociological aspects of users' circumstances outside the DD context.
Chapter 1 – Introduction 11
• The study excludes the possible implications of language differences on application usage.
• The set of over 200 DD sites distributed around South Africa was reduced to 156 candidate sites for investigation. From the 156 sites, criteria were used to filter out a sample of 10 representative sites for quantitative analysis.
• DD sites outside South Africa were not included in this study.
• Interview/questionnaire data was limited to 60 users, from four sites.
1.6 Ethical aspects
From the initial phase of the DD project, great care has been taken to ensure that relevant
community leaders at each of the proposed installation sites were consulted and included in
the research process. They were informed of the project objectives and consulted on possible
locations for the DD terminals. Moreover, they assisted in the appointment of site custodians
to clean and restart the machine when necessary, as well as to report any hardware or software
failures. This consultation with the community members obtains buy-in to the DD concept
and remains a key component of each installation.
Users at the original sites (where permanent security cameras were installed) were informed
via a note on the user desktop background that all activity was being monitored. Observations
of user behaviour at such sites were kept anonymous. Individual names of users were also not
associated with the behaviour observed by researchers. In the present study, visual data is
limited to anonymous snap shots of activity for illustration purposes.
All research in this study involving user registration data and user log files upholds the rights
of a user to privacy through the use of pseudonyms rather than real names. Case study
analysis did not link personal user information (e.g., name, phone number or address) to data
from that user.
In the case of interviews, the user, custodian, or facilitator signed a consent form, agreeing to
participation in the research study. Participants were informed of the purposes of the study,
before being interviewed, or completing the question template.
While it is impossible to foresee every consequence of a research and implementation project
such as the DD, the primary goal was, and still is, to improve the lives of the users.
Ultimately, the community is the primary reason for the research, rather than mere involuntary
participants in the research process. In the words of Olivier (2004:24), ‘the participants are
treated as ends themselves, rather than merely as means to an end’.
12 Chapter 1 – Introduction
For these reasons the researcher is confident that the DD project, and this associated study,
both maintain acceptable, uncompromising ethical principles.
An application for ethical clearance, along with consent forms and an outline of the topics and
questions addressed in the interviews/questionnaires was submitted for approval to the Ethical
Clearance Committee of the College of Science Engineering and Technology at UNISA.
The UNISA Ethical Clearance Agreement and the consent forms are included in Appendix F.
1.7 Dissertation chapter layout
The study is composed of the following parts:
Chapter 1: Introduction
Chapters 2 to 4: Theory and background information
Chapters 2 and 3 present the findings from a literature review focused on work related to the
DD project; ICT in rural South Africa; unassisted learning and e-learning initiatives; and
software usage in various contexts. Chapter 4 describes the DD intervention in general,
helping to place this study in context.
Chapter 2: Literature study of related work in South Africa and India;
Chapter 3: Literature study of users and software application usage;
Chapter 4: The Digital Doorway intervention – background information;
Chapters 5 to 7: Practical component
Chapter 5 describes the details of the research design and methodology while Chapter 6 goes
on to describe the quantitative analysis of log files obtained from a selection of DD sites with
particular reference to the research questions highlighted earlier. Chapter 7 describes the
qualitative findings obtained from site visits, during which observation, interviews, and
questionnaires were used at certain designated sites, to build up a richer sense of activities and
software usage at these sites.
Chapter 5: Research design and methodology;
Chapter 6: Quantitative data collection and analysis;
Chapter 7: Qualitative study – on-site interactions and analyses;
Chapter 1 – Introduction 13
Chapter 8: Discussion and conclusions
This section sums up the study with closing discussions and conclusions.
Appendices
Additional code listings, tables, figures, and information related to, but not included in,
Chapters 1 to 8.
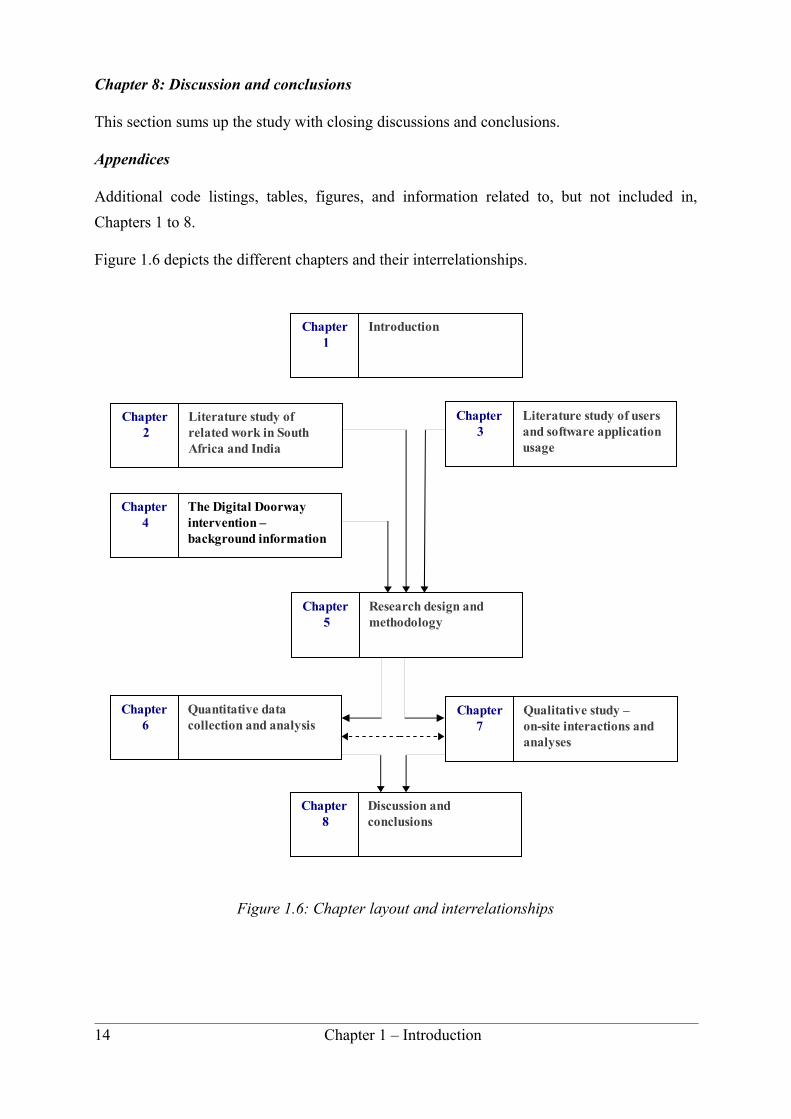
Figure 1.6 depicts the different chapters and their interrelationships.
14 Chapter 1 – Introduction
Figure 1.6: Chapter layout and interrelationships
Qualitative study – on-site interactions and analyses
Chapter7
Research design and methodology
Chapter 5
Discussion and conclusions
Chapter 8
Literature study of users and software application usage
Chapter 3
Literature study of related work in South Africa and India
Chapter 2
IntroductionChapter 1
The Digital Doorway intervention – background information
Chapter 4
Quantitative data collection and analysis
Chapter 6

– 2 – Literature study of related work in South Africa and India
There is creative reading as well as creative writing.
– Ralph Waldo Emerson
Chapter 2 – Literature study of related work in South Africa and India 15
2.1 Introduction
Primarily, this chapter overviews relevant aspects of the information and communication
technologies for development (ICT4D) domain, and looks at previous studies in the area of
unassisted learning in impoverished and technologically barren societies. Due to the novelty
of this type of system, there are few precedents discussed in the literature, apart from the
pioneering work in India, of Dr. Mitra, which is discussed in some detail in Section 2.5. The
chapter also covers aspects of ICT in rural South Africa and some e-learning concepts related
to the DD project. Some notable observations regarding application usage, age, gender and
location emerge while studying these other projects. Certain concepts encountered in the
literature are applied to features and characteristics of the DD.
2.2 Information and communication technologies for
development (ICT4D)
Various existing social and societal problems create barriers to people owning and using
information and communication technologies (ICTs). These problems include illiteracy;
cultural barriers; lack of computer skills; insufficient technological knowledge; restricted
access to computers; lack of Internet access; and inadequate usage opportunities (Ngcobo &
Herselman, 2007). Local economic development in rural South Africa is severely
compromised by a lack of infrastructure, services and know-how, especially in the ICT arena
(Jacobs & Herselman, 2005).
ICT4D relates to application of ICTs within a community in order to improve the social or
economic lives of the members of that community. The term community informatics (CI) is
used to describe the convergence of communities and informatics. With informatics implying
more than computer science alone, but rather ‘the capacity to act on and through the
technology with which one is working... the applications of its technology, ...its use in and on
the world in which we are living’ (Gurstein, 2000:i). Furthermore,
‘Community informatics pays attention to physical communities and the design and implementation of technologies and applications, which enhance and promote their objectives. CI begins with ICT, as providing resources and tools that communities and their members can use for local economic, cultural, and civic development, and community health and environmental initiatives among others. CI includes the technology/ICT and the ‘user’ (and the ‘uses’), and is as concerned with community processes, user access, and technology usability as it is with systems analysis and hardware or software design’ (Gurstein, 2000:i).
16 Chapter 2 – Literature study of related work in South Africa and India

Gurstein (2010) also uses the term digital transition, referring to when a country (or
community) moves from a pre-digital, largely manual framework of communications and
transaction management, to one that is digitally based.
Raju (2004), in his paper entitled ‘A case for harnessing information technology for rural
development’, refers to the digital divide and its various dimensions, as understood by Norris:
‘The concept of the digital divide is understood as a multidimensional phenomenon encompassing three distinct aspects. The ‘‘global divide’’ refers to the divergence of Internet access between industrialized and developing societies. The ‘‘social divide’’ concerns the gap between the information rich and poor in each nation. Finally, within the online community, the ‘‘democratic divide’’ signifies the difference between those who do and do not use the panoply of digital resources to engage, mobilize and participate in public life’ (Norris, P, cited by Raju (2004:234)).
Whether we talk about bridging a digital divide, or promoting a digital transition, the process
of achieving successful ICT4D interventions requires certain steps: understanding the
problem, access to technology, sustainability of the technology, and social/resource factors
(Herselman and Britton, 2002). With an intervention such as the DD, it is not sufficient to
provide the technology, and even make it sustainable, without understanding the community
and its problems, and involving the social aspects surrounding the technology. Thus the socio-
technical nature of this study.
Fernandes, Jagdale and Fernandes (2007) mention that the digital divide goes beyond the
concepts of infrastructure and connectivity, relating also to learning and training so that
‘individuals can use, leverage, and benefit from the infrastructure’ (Fernandes, Jagdale &
Fernandes, 2007:74).
Following a study on three rural communities in KwaZulu-Natal involving semi-structured
interviews and questionnaires regarding the use and benefits of ICTs to those communities,
Ngcobo and Herselman (2007) identify the following factors of greatest importance:
• Stimulating a positive attitude towards change in the context of introduction of ICTs;
• Ensuring that the technologies are appropriate;
• Combining traditional and modern technologies;
• Empowering communities to lead their own development; and
• Recognising the importance of technology, as well as the necessity for it to be appropriate and sustainable.
Chapter 2 – Literature study of related work in South Africa and India 17

2.3 Digital Exclusion
According to Herselman and Britton (2002), resource-deprived learners have less opportunity
to take part in the information-based economy, which is increasingly reliant on computers.
They have little involvement in the education, training, entertainment and commercial
activities afforded to resource-enabled people. Those who lack access to ICT tools are
increasingly at a disadvantage, which necessitates raising the level of digital inclusion by
increasing access to and use of tools of the digital age. Herselman and Britton further state
that the very technologies that cause the rift between the digital haves and have-nots may be
used to bridge that rift. Importantly, the problem of digital exclusion needs to be viewed
holistically, addressing areas of resource inequalities, financial access, cognitive access and
content access.
The DD project is concerned with each of these aspects, addressing resource inequality by
providing infrastructure; financial limitations by making the systems free and accessible to
anyone; cognitive aspects by encouraging self-learning; and content access by being a
repository of information (Gush, de Villiers, Smith & Cambridge, 2011). The goal is to
provide rural telecommunications infrastructure in such a way that all stakeholders benefit
(Andrew & Petkov, 2003).
Table 2.1 gives an indication of the computer penetration in South African schools for all nine
provinces. It is clear from these figures, that most provinces, with the exception of Gauteng,
Northern Cape and Western Cape, are badly under-serviced. Provinces with penetration below
20% are highlighted in red.
Table 2.1: School computer centres in South Africa, 2009. (Department of Education, 2009)
Province Number of Schools
With Computer Centre
% With Computer Centre
Eastern Cape 5715 596 10
Free State 1643 353 21
Gauteng 1994 1510 76
KwaZuluNatal 5835 982 17
Limpopo 3918 428 11
Mpumalanga 1540 254 16
North West 1740 391 22
Northern Cape 609 314 52
Western Cape 1466 886 60
Total 24460 5714 23
18 Chapter 2 – Literature study of related work in South Africa and India

In a study on the feasibility of ICT diffusion and use amongst rural women in South Africa
(Kwake, Ocholla & Adigun, 2006), the researchers surveyed 200 participants in rural and
impoverished areas of South Africa on their perceptions of the benefits of ICT. The survey
revealed that a large percentage (28.5%) of the participants felt that ICTs were unavailable or
inaccessible to them and difficult to use. A further 12.5% indicated that ICTs were costly and
unaffordable. These were responses to an open-ended question on the use and availability of
ICTs in the participant’s community.
As is evident from these responses, accessibility to affordable infrastructure and usability
were important considerations in the minds of the participants in the research. Kwake,
Ocholla and Adigun also mention the importance of appropriate content, both in terms of
language and subject matter, as well as the need to significantly reduce the hindrances to
accessibility, either before or during the provision of the technology.
2.4 Multiple dimensions of the digital divide
According to Harris (2002), in a study of ICT for poverty alleviation in a global context, the
elimination of problems due to the digital divide requires more than merely providing access
to technologies. The provision of telecommunications infrastructure is necessary, yet is an
insufficient means of promoting economic development. The author states: ‘the digital divide
goes beyond access to the technology and can be expressed in terms of multiple dimensions.
If societies wish to share the benefits of access to technology, then further provisions have to
be implemented in order to address all the dimensions of the digital divide’ (Harris, 2002:4).
Harris proposes a set of dimensions and associated proposals to overcome issues of the digital
divide. Those dimensions are summarised in Table 2.2 below. The mention of ‘sufficient and
appropriate content’ is particularly pertinent to this study.
Table 2.2: Dimensions of the Digital Divide (Harris, 2002:5)
Dimension Explanation
Service availability The services made available through the use of ICTs should be freely available to all who might wish to make use of them.
Awareness All stakeholders should be aware of how they might be able to use ICTs for their own benefit.
Opportunity to learn and use new media
All community members should have the opportunity to attain computer literacy.
Mastery of technologies
Stakeholders should understand which tools are best suited for which tasks.
Chapter 2 – Literature study of related work in South Africa and India 19

Experience All stakeholders should be able to accumulate sufficient experience with the use of ICTs to enable them to fully exploit their potential.
Skills All stakeholders should have the right skills for performing ICT related tasks.
Support All stakeholders should have access to appropriate assistance when required so as to support them in using ICTs effectively.
Attitudes (motivation)
Everyone is encouraged to participate in the sharing of benefits available from equal access to ICTs.
Content Sufficient and appropriate content should be available to enable everyone to gain benefit from ICTs.
Cultural The other dimensions are adapted as required to the cultures of all potential users.
Disability The other dimensions are adaptable as required, so that disability is not a barrier to equal enjoyment of the benefits of ICTs.
Linguistic The other dimensions are adaptable as required, so that language is not a barrier to equal enjoyment of the benefits of ICTs.
Gender The other dimensions are adaptable as required, so that gender is not a barrier to equal enjoyment of the benefits of ICTs.
Empowerment of civil society
Structural, political, and governance factors should not impede equal enjoyment of the benefits of ICTs.
This holistic view of the digital divide and associated provision of ICT in the context of a
complex social environment is echoed in the study by Snyman and Snyman (2003), ‘Getting
information to disadvantaged rural communities: the centre approach’, in which the
researchers investigate ICT factors in multi-purpose community centres (MPCCs) and tele-
centres in South Africa. In the study, numerous social, technical and operational problems
emerge. They highlight an important point that ‘the assumption in many tele-centre projects,
that providing ICT equipment will automatically mean that useful information will be made
available to those who need it, is increasingly being questioned’ (Snyman & Snyman,
2003:105). A thorough understanding of context, as well as of usage of ICT infrastructure is
necessary for effective ICT4D; merely providing technology is not sufficient.
2.5 The Indian ‘Hole-in-the-Wall’ project
As mentioned in Gush and de Villiers (2010), in 1999, Dr. Sugata Mitra of the National
Institute of Information Technologies in India (NIIT) commenced a project known as the
‘Hole-in-the-Wall’ experiment (HITW), based around the following hypothesis:
‘The acquisition of basic computing skills by any set of children can be achieved through
incidental learning provided the learners are given access to a suitable computing
20 Chapter 2 – Literature study of related work in South Africa and India
facility, with entertaining and motivating content and some minimal (human) guidance’
(Mitra 2000:3).
Mitra and Rana (2001) placed a computer in a specially constructed hole in the wall between
the NIIT headquarters and the neighbouring slum, in the Kalkaji region of New Delhi. The
computer ran on a Windows operating system and was connected to the Internet. A touch-pad,
but no keyboard functionality, was provided. The objectives of the experiment, as stated by
the researchers, were to find out :
(i) whether potential users would use a PC-based outdoor Internet kiosk in India without
any instruction; and
(ii) whether a PC-based Internet kiosk could operate without supervision in an outdoor
location (Mitra & Rana, 2001:224).
They observed that the site was visited mainly by children aged 5 to 16 years old, most of
whom did not attend school, and had no previous exposure to computers. The adult women of
the slum never used the computer, citing reservations about not knowing the language, or how
to use the computer (Mitra & Rana, 2001:226). The contrast between these two groups, both
of whom had no prior experience of computing, is notable and indicates a greater openness to
technology on the part of children. Various qualitative observations of user behaviour around
the computer were recorded by those researchers, including the following:
• Basic browsing and drawing skills were picked up within a few days, with the more advanced skills (such as cutting and pasting) becoming evident within a month.
• Adults did not attempt to learn or use the kiosk.
• The most commonly used applications were MS Paint and Internet Explorer.
• Children understood the functionality of items such as the mouse pointer and the hourglass, and invented their own vocabulary for them.
• In an exhibition of peer tutoring and learning, children taught each other what they had learned.
• Parents saw the benefit of the kiosk, though primarily as a benefit for their children, rather than themselves.
• Children were strongly opposed to the idea of its removal.
What does it mean to be ‘computer literate’? In the HITW experiment, a computer literate
child was defined as one who could switch on a PC; draw a picture using a paint application;
perform basic computer functions such as using folders, short-cuts, copy and paste; navigate
web pages; and send and receive email (Mitra, 2000).
Chapter 2 – Literature study of related work in South Africa and India 21
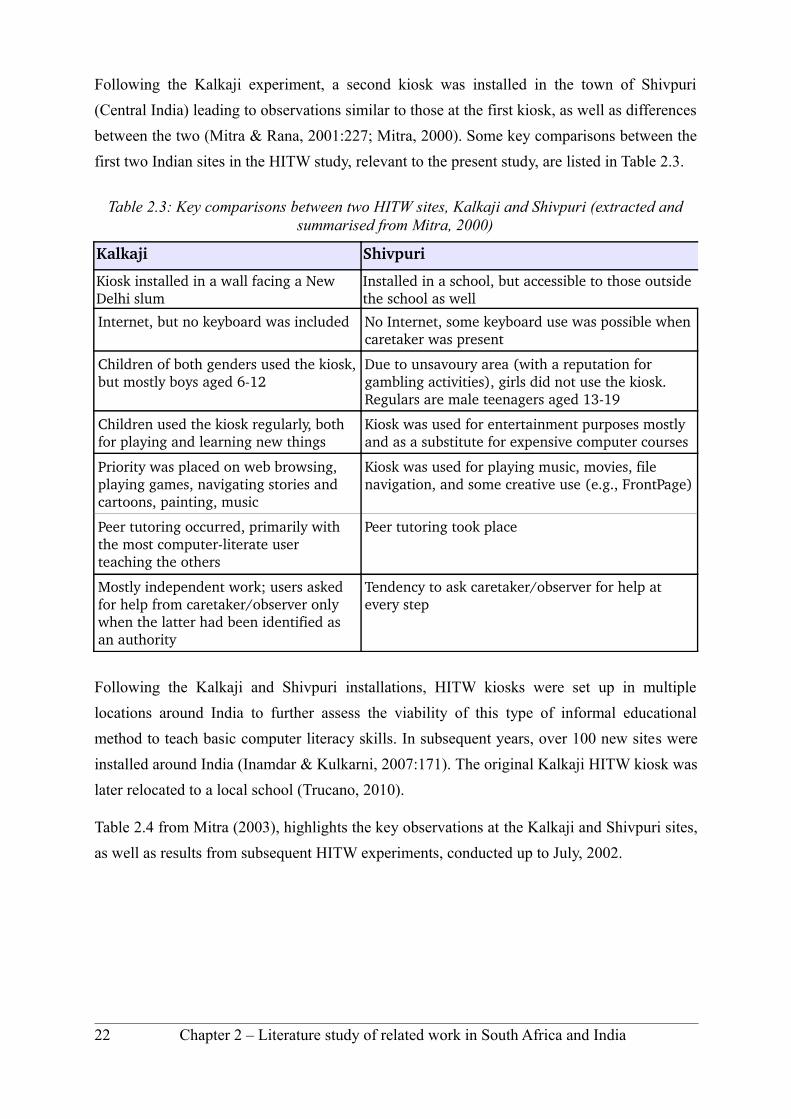
Following the Kalkaji experiment, a second kiosk was installed in the town of Shivpuri
(Central India) leading to observations similar to those at the first kiosk, as well as differences
between the two (Mitra & Rana, 2001:227; Mitra, 2000). Some key comparisons between the
first two Indian sites in the HITW study, relevant to the present study, are listed in Table 2.3.
Table 2.3: Key comparisons between two HITW sites, Kalkaji and Shivpuri (extracted and summarised from Mitra, 2000)
Kalkaji Shivpuri
Kiosk installed in a wall facing a New Delhi slum
Installed in a school, but accessible to those outside the school as well
Internet, but no keyboard was included No Internet, some keyboard use was possible when caretaker was present
Children of both genders used the kiosk, but mostly boys aged 612
Due to unsavoury area (with a reputation for gambling activities), girls did not use the kiosk. Regulars are male teenagers aged 1319
Children used the kiosk regularly, both for playing and learning new things
Kiosk was used for entertainment purposes mostly and as a substitute for expensive computer courses
Priority was placed on web browsing, playing games, navigating stories and cartoons, painting, music
Kiosk was used for playing music, movies, file navigation, and some creative use (e.g., FrontPage)
Peer tutoring occurred, primarily with the most computerliterate user teaching the others
Peer tutoring took place
Mostly independent work; users asked for help from caretaker/observer only when the latter had been identified as an authority
Tendency to ask caretaker/observer for help at every step
Following the Kalkaji and Shivpuri installations, HITW kiosks were set up in multiple
locations around India to further assess the viability of this type of informal educational
method to teach basic computer literacy skills. In subsequent years, over 100 new sites were
installed around India (Inamdar & Kulkarni, 2007:171). The original Kalkaji HITW kiosk was
later relocated to a local school (Trucano, 2010).
Table 2.4 from Mitra (2003), highlights the key observations at the Kalkaji and Shivpuri sites,
as well as results from subsequent HITW experiments, conducted up to July, 2002.
22 Chapter 2 – Literature study of related work in South Africa and India

Table 2.4: Key observations at the Kalkaji and Shivpuri sites (Mitra, 2003:369)
Place LocationNumber of computers
Duration of study
Key observations
Kalkaji Slum, south east of Delhi
1 January 1999,ongoing
First observations of self organised learning. Peer tutoring. Lack of correlation with social or economic factors as far as child learning is concerned.
Shivpuri Small town in Madhya Pradesh, central India
1 May 1999 – July 1999
First observations of the actual process of discovery and peer tutoring among children. Kalkaji results successfully replicated.
Madantusi Village in Uttar Pradesh, north eastern India
1 June 2000,ongoing
All results replicated. Self learning of English language observed. First comments from adults about the occurrence of desirable behavioural changes in children. Equal numbers of boys and girls.
Madangir Resettlement colonies, south east of Delhi,
30 November 2001,ongoing
First instances of adult vandalism at kiosks. Location and orientation as important factors for kiosk safety and usage. The need for remote monitoring technology.
Sindhudurg Fishing and other villages in Maharashtra, western coast of India,
10 April 2002,ongoing
All results replicated rapidly. Sometimes more girls than boys. English is not a barrier. Games and painting dominate usage in the absence of the Internet. Local teacher reports 10% of the curriculum completed without assistance in one month.
Future plans
All over India 66 August 2002 – 2004, planned
To provide final verification of all hypotheses of minimally invasive education (MIE).
Following the development and implementation of an icon test by colleagues of Mitra in
which children were given icons to identify, so as to establish the degree to which computer
learning had taken place, Mitra proposed a tri-part pedagogy for learners to acquire the
necessary competence. Two of these three bands did not require the direct intervention of a
knowledgeable teacher, and were achievable through technology access and peer learning
Chapter 2 – Literature study of related work in South Africa and India 23

alone (Mitra 2003). This ‘minimally invasive education’ (MIE), ‘self-assisted learning’ and
‘peer-assisted learning’ approach forms the core educational method on which both the HITW
and the DD projects are based.
The following photos of HITW sites (Figures 2.1 and 2.2) were taken by the researcher of this
present study, on an academic visit to India in 2003.
Following the initial successes of the HITW project, Hole in the Wall Education Limited
(HiWEL) was formed as a cooperative effort between NIIT and the International Finance
Corporation. As of 2010, over 300 learning stations had been deployed by HiWEL throughout
India, retaining the MIE) approach.
24 Chapter 2 – Literature study of related work in South Africa and India
Figure 2.2: ‘Hole-in-the-Wall’ site, 40 minutes drive from Jaisalmer, India
Figure 2.1: Users at a ‘Hole-in-the-Wall’ site, India
The HiWEL initiative faces some serious social-, educational-, and long-term sustainability
challenges, as Arora (2010) points out in a study entitled ‘Hope-in-the-wall? A digital promise
for free learning’:
‘While the HiWEL initiative is commendable, it raises some challenging questions. Is
collaborative learning a natural or a taught process? Is informal and public learning
inherently more equitable and democratic? What kinds and depths of learning are
achievable? What, if any, is the role of the teacher and/or mediators in this process?
What are the benchmarks for success and failure, and how do these differ from those in
conventional learning? And is this approach sustainable?’ (Arora, 2010:691).
These questions are posed in the light of two failed HITW sites in the Central Himalayas. In
particular, the exact role of schools as custodians of the sites, is questioned, as well as the
kinds of content, instruction, and curriculum material that should be allowed to ‘seep into
these relatively free spaces without compromising on the underlying trends of innovative
pedagogy’ (Arora, 2010:700).
Table 2.5 below summarises further research papers that have been published on the HITW
project. The research clearly indicates that the HITW sites helped with children's computer
literacy education, as well as contributing positively to wider learning (e.g., mathematics).
According to de Boer (2009), a knowledge of user behaviours in a typical environment could
be used to optimise the kiosks in that area. Optimisation would be achieved through the
customisation of educational games and software, either for group or for solo work. In
addition, it would involve the creation of community action plans for kiosk usage, based on
site demographics.
A further aspect mentioned by de Boer is the effect that media attention and researcher
intervention have on kiosk users, contributing to increased interest and sustained use by users.
Applying de Boer's point to the present study, however, it is not possible to maintain media
and researcher involvement at all of the 200+ DD sites in South Africa. For this reason, the
quantitative data retrieved from sites, independently of direct researcher intervention, has
great value in analysing what is happening at the sites in a naturalistic environment ‘when no
one is watching’.
Chapter 2 – Literature study of related work in South Africa and India 25

Table 2.5: Summary of research papers published on the HITW project
Title and authors Key Findings
‘Computer skills development by children using HoleintheWall facilities in rural India’, by Parimala Inamdar, 2004
Children who had learned at the HITW kiosk were able to complete the computer science curricular examination without being taught the subject.
‘Acquisition of computing literacy on shared public computers: children and the HoleintheWall’,by Sugata Mitra, Ritu Dangwal, Shiffon Chatterjee, Swati Jha, Ravinder S. Bisht, Preeti Kapur, 2005
Groups of children were able to use computers and the Internet on their own, irrespective of upbringing or location. Group selfinstruction is as effective as classroom instruction, while being less expensive and independent of teachers.
‘Self organising systems for mass computer literacy: Findings from the HoleintheWall experiments’,by Sugata Mitra, 2005
Following a nine month computer literacy focus group testing study at HITW sites, it became apparent that children were able to master basic computer skills irrespective of upbringing or location.
‘Public computing, computer literacy and educational outcome: children and computers in rural India’,by Ritu Dangwal, 2005
Various tests including the icon test clearly demonstrated that learning had taken place. Danwal uses the term ‘playground computing’.
‘Impact of minimally invasive education on children: an Indian perspective’, by Ritu Dangwal, Swati Jha, Preeti Kapur, 2006
MIE provides an alternative educational approach in contemporary times, especially in developing nations. An important aspect is peer group learning which enhances the goal setting behaviour among children at the kiosk.
‘HoleintheWall computer kiosks foster mathematics achievement – A comparative study’, by Parimala Inamdar, Arun Kulkarni, 2007
A comparative study was conducted, investigating the impact of HITW kiosks on achievement in school examinations. Kiosks were loaded with educational games and videos in the subjects of Mathematics, English and Science. Comparative tests were carried out between kiosk users and nonkiosk users, before kiosk installation and 2.5 years after installation. A significant impact was found on examination results in the subject of Mathematics.
‘The relationship between environmental factors and usage behaviours at HoleintheWall computers’, by Jennifer deBoer, 2009
Some behavioural patterns emerged from a study involving multiple HITW sites. Typical urban children were dedicated independent users of kiosks, while rural children were more likely to use the computers in groups. Both communities displayed different kinds of sustained interest in the kiosks. The largest category of users was aged between 11 and 12 years old, and there were more boys than girls at the kiosks (girlboy ration of 0.83). The average age of girls was younger than that of boys (11.37 versus 12.37). As the girls matured, they became reluctant to visit the kiosks where older boys were present.
26

2.6 A place for constructivism
A number of broad philosophically-based views have been proposed to help educators better
understand how learners learn. Three major learning paradigms are behaviourism,
cognitivism, and constructivism. On a scale of didactic learning theory through exploratory
learning theory (didactic being more authoritarian instruction), the constructivist ethos would
be situated in the extreme exploratory zone, while behaviourism would be in the extreme
didactic zone, and cognitivism somewhere in the middle (de Villiers, 2005:352). The one
most closely aligned with unassisted learning kiosks is constructivism.
According to de Villiers (2006), constructivist philosophy as it relates to e-learning, exhibits
the characteristics of personal knowledge construction and interpretation, active learning,
anchored instruction, and multiple perspectives. Constructivist mechanisms include problem-
based learning, open-ended learning environments, and flexible learning within ill-structured
domains. There is no direct instruction in constructivism. Rather, the learner is active in a
user-centric environment aimed at promoting active involvement and situated learning that
can be applied in the real world (de Villiers, 2006:4). ‘The knowledge that students finally
acquire is only the knowledge they have actively constructed themselves, not the information
transmitted to them ready-made’ (Salomon & Almog, 1998).
Constructivism is a recognised approach to education in the HITW initiative. As Mitra and
Rana (2001) state: ‘One of the foundational premises is that children actively construct their
knowledge rather than simply absorbing ideas spoken at them by teachers. It posits that
children actually invent their ideas. They assimilate new information to simple, pre-existing
notions, and modify their understanding in light of new data. In the process, their ideas gain in
complexity and power, and with appropriate support they develop critical insight into how
they think and what they know about the world’ (Mitra and Rana, 2001:4).
Application to the Digital Doorway
The DD uses a predominantly constructivist approach to education. For this reason, users are
left to discover for themselves applications and resources on the DD. Users discover new
aspects of computers as they interact with the device, and build up their own ‘reality’ of how
computers function and what they can be used for. ‘Constructivism emphasizes the learner
exploring, experimenting, doing research, asking questions, and seeking answers’ (Alessi &
Trollip, 2001:33). The analysis of usage and user interactions at the DD sites in this study will
provide insight into these areas.
Chapter 2 – Literature study of related work in South Africa and India 27
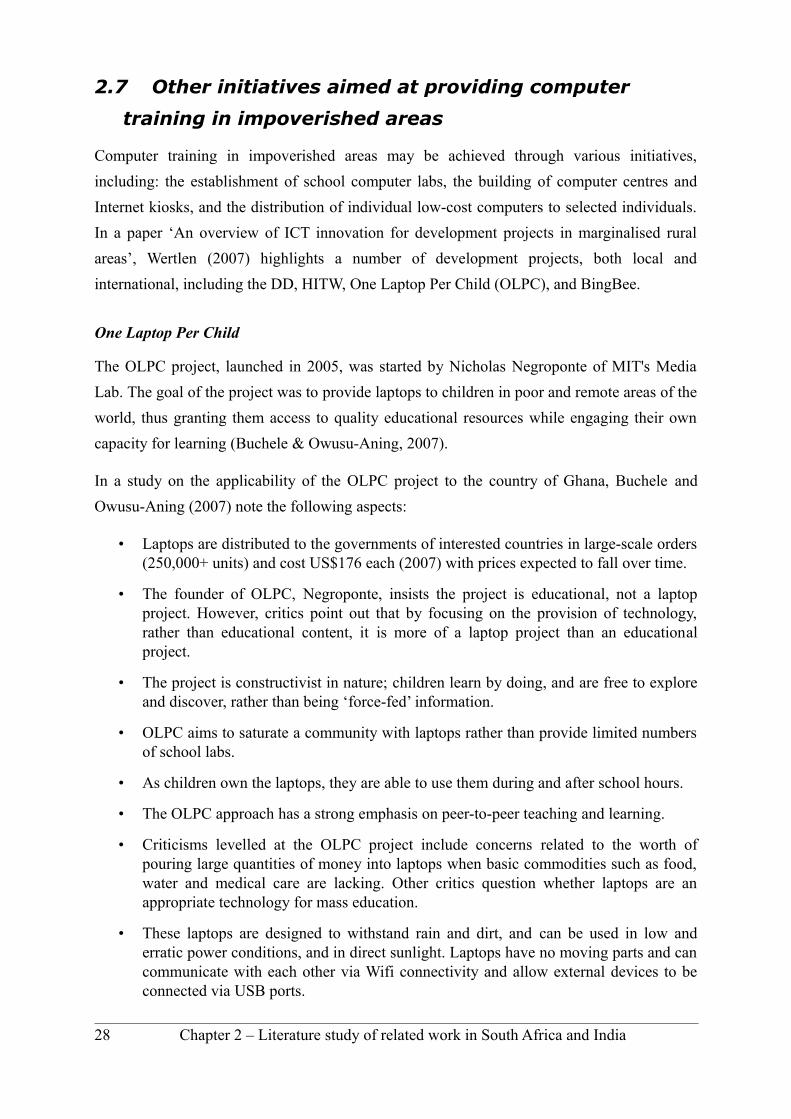
2.7 Other initiatives aimed at providing computer
training in impoverished areas
Computer training in impoverished areas may be achieved through various initiatives,
including: the establishment of school computer labs, the building of computer centres and
Internet kiosks, and the distribution of individual low-cost computers to selected individuals.
In a paper ‘An overview of ICT innovation for development projects in marginalised rural
areas’, Wertlen (2007) highlights a number of development projects, both local and
international, including the DD, HITW, One Laptop Per Child (OLPC), and BingBee.
One Laptop Per Child
The OLPC project, launched in 2005, was started by Nicholas Negroponte of MIT's Media
Lab. The goal of the project was to provide laptops to children in poor and remote areas of the
world, thus granting them access to quality educational resources while engaging their own
capacity for learning (Buchele & Owusu-Aning, 2007).
In a study on the applicability of the OLPC project to the country of Ghana, Buchele and
Owusu-Aning (2007) note the following aspects:
• Laptops are distributed to the governments of interested countries in large-scale orders (250,000+ units) and cost US$176 each (2007) with prices expected to fall over time.
• The founder of OLPC, Negroponte, insists the project is educational, not a laptop project. However, critics point out that by focusing on the provision of technology, rather than educational content, it is more of a laptop project than an educational project.
• The project is constructivist in nature; children learn by doing, and are free to explore and discover, rather than being ‘force-fed’ information.
• OLPC aims to saturate a community with laptops rather than provide limited numbers of school labs.
• As children own the laptops, they are able to use them during and after school hours.
• The OLPC approach has a strong emphasis on peer-to-peer teaching and learning.
• Criticisms levelled at the OLPC project include concerns related to the worth of pouring large quantities of money into laptops when basic commodities such as food, water and medical care are lacking. Other critics question whether laptops are an appropriate technology for mass education.
• These laptops are designed to withstand rain and dirt, and can be used in low and erratic power conditions, and in direct sunlight. Laptops have no moving parts and can communicate with each other via Wifi connectivity and allow external devices to be connected via USB ports.
28 Chapter 2 – Literature study of related work in South Africa and India

• The software running on the laptop is open source and employs an operating system known as Sugar, which occupies very little memory. Collaborative functions between laptops are possible due to the Wifi connectivity.
• Applications on the laptop include word processing, a web browser, email, a chat facility, media player, drawing tools, basic language programming, encyclopaedia, and calculator.
• Various hardware and software additions are included to prevent theft of the device
Application to the Digital Doorway
While the hardware and business approaches of the OLPC project are very different to the
DD, several of the philosophical goals are the same: providing computer literacy and
information literacy skills to impoverished communities; allowing users to explore and learn
in their own time and at their own pace, in a constructivist manner; maintaining an open
source software policy; accessible hardware and infrastructure provision, in areas where it is
lacking; and forging specific learning opportunities where they had previously not been
available.
The DD, however, is designed to be a fixed point of learning and social activity in a
community centre, library or school, where members of the community come together and
learn, both individually and together with peers. Security of the infrastructure is achieved
through the appointment of a site champion. Also, the robustness of the housing, and the fact
that the device is heavy and bolted to the ground, provide additional safety features. The
primary goal of the DD is to provide basic computer skills training, enabling users to become
familiar with a computer keyboard and touch-pad, opening and closing programs, navigating
menus etc. Secondary goals include the provision of information for school projects, adult
learning, providing entertainment, and stimulating creativity.
BingBee
This is an information kiosk designed to be deployed in marginalised communities in South
Africa, with the aim of improving educational levels of street children. The device is fully
contained behind a shop front window and incorporates various innovative technologies, such
as ‘fabric distortion’ finger tracking (Slay, Wentworth & Locke, 2006). The secure design of
the BingBee kiosk makes it ideal for deployment at locations that are susceptible to vandalism
(Thinyane, Slay, Terzoli & Clayton, 2006). A test site of ten kiosks has been operational in
Fingo Village, Grahamstown, South Africa, since 2006, and has successfully met the
expectations of the developers (Wentworth, 2010).
Chapter 2 – Literature study of related work in South Africa and India 29
2.8 Summary of chapter
This chapter addressed aspects of ICT4D, that are applicable to this study, including
community informatics and digital exclusion. The chapter also presented the multiple
dimensions of the digital divide, as well as the need for adequate contextual understanding in
infrastructure deployment. The Indian HITW project and associated studies, were presented in
some detail. The educational philosophy of constructivism was mentioned and other computer
training initiatives were discussed.
The following chapter (Chapter 3), extends the literature survey by addressing relevant studies
involving users and software application usage.
30 Chapter 2 – Literature study of related work in South Africa and India
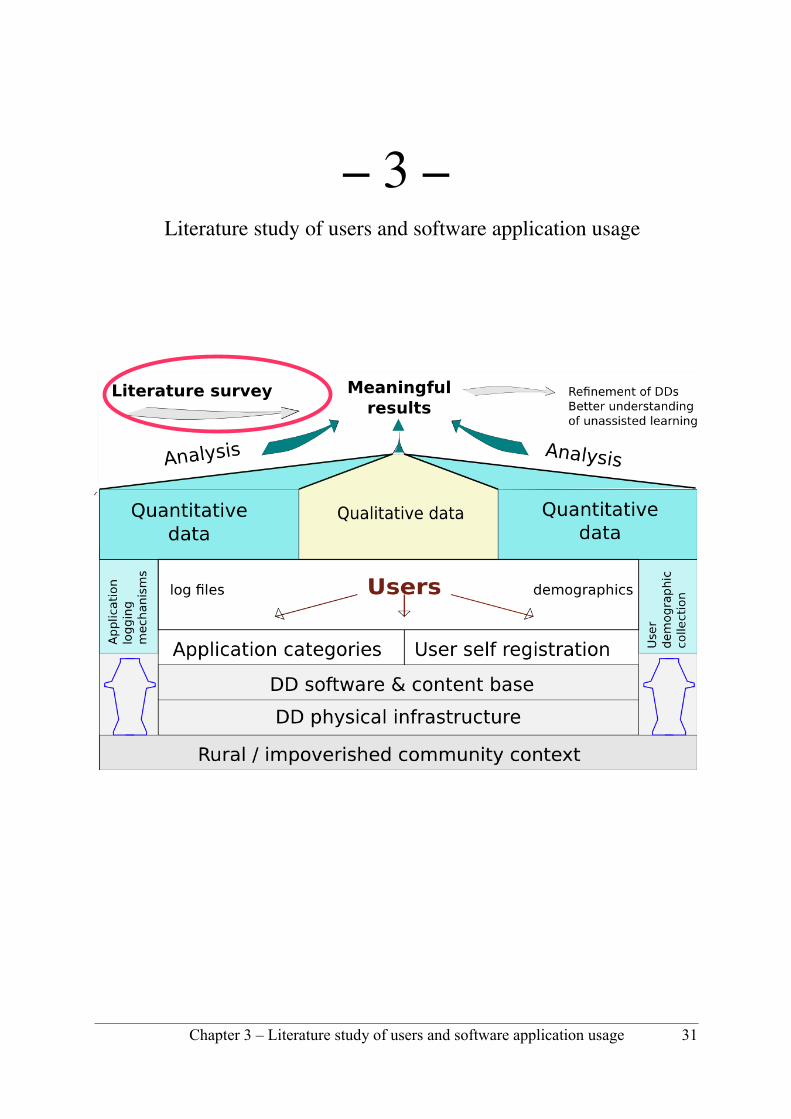
– 3 – Literature study of users and software application usage
Chapter 3 – Literature study of users and software application usage 31

3.1 Introduction
Many studies have been conducted on the differences in computer use, and attitudes towards
computers, by users of different ages and genders, in a variety of contexts. The studies most
closely linked to this research study are those of the Indian HITW project, as mentioned in the
previous chapter. Studies on computer usage in South Africa amongst users in remote
unsupervised locations, where usage is completely user-controlled, have not hitherto been
conducted. However, lessons from related studies can prove valuable in analysing general
trends in software usage in different contexts.
The studies from the United Kingdom and Australia described in Sections 3.2 and 3.4, while
dating back seven to eight years, are still insightful, given that impoverished communities in
South Africa are at least eight to ten years behind first world countries, in terms of
technological advancement such as access to ICT and the Internet. E.g. see Barton, Amory-
Mazaudier, Barry et al. (2009).
3.2 Related studies
Colley and Comber (2003) examined changes in computer experience and attitudes over a
period of time between 11–12 year-old, and 15–16 year-old males and females in schools in
the United Kingdom. According to their research findings, females have less experience in
computers and are less favourable towards them than males. In 1990, boys exhibited a more
favourable attitude towards computers, holding the perception that they were more suitable
for males than for females. Males used them more than females at home, for a range of
applications including word processing, maths, programming, graphics and games. Mention is
made of a study examining computer use and attitudes among college students with enhanced
access to computers (Mitra A. et al., 2001, cited by Colley and Comber, 2003). Females held a
less positive view of computers than males, and used them less, despite excellent access for
both genders.
Results from a second study by Colley and Comber (2003), showed that more boys than girls
had access to, and were owners of, console game computers (e.g., Sony Playstation). Boys
also rated themselves more highly in terms of computing ability than girls. Regarding
application category preferences, boys were seen to prefer music technology and computer
games. Amongst the 11–12 year-olds, graphics applications were used more frequently by
girls than boys, whereas the 15–16 year-old boys used graphics applications more frequently
than girls of that age. Overall, computer games were used more frequently among younger
32 Chapter 3 – Literature study of users and software application usage
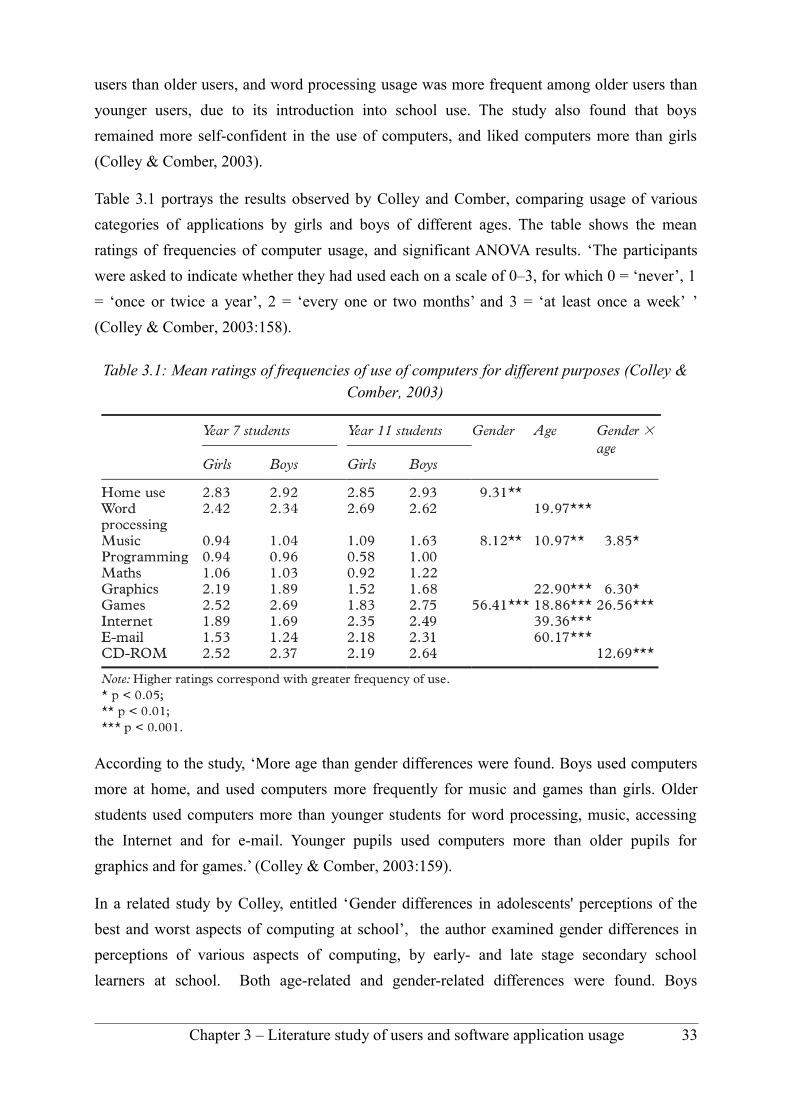
users than older users, and word processing usage was more frequent among older users than
younger users, due to its introduction into school use. The study also found that boys
remained more self-confident in the use of computers, and liked computers more than girls
(Colley & Comber, 2003).
Table 3.1 portrays the results observed by Colley and Comber, comparing usage of various
categories of applications by girls and boys of different ages. The table shows the mean
ratings of frequencies of computer usage, and significant ANOVA results. ‘The participants
were asked to indicate whether they had used each on a scale of 0–3, for which 0 = ‘never’, 1
= ‘once or twice a year’, 2 = ‘every one or two months’ and 3 = ‘at least once a week’ ’
(Colley & Comber, 2003:158).
According to the study, ‘More age than gender differences were found. Boys used computers
more at home, and used computers more frequently for music and games than girls. Older
students used computers more than younger students for word processing, music, accessing
the Internet and for e-mail. Younger pupils used computers more than older pupils for
graphics and for games.’ (Colley & Comber, 2003:159).
In a related study by Colley, entitled ‘Gender differences in adolescents' perceptions of the
best and worst aspects of computing at school’, the author examined gender differences in
perceptions of various aspects of computing, by early- and late stage secondary school
learners at school. Both age-related and gender-related differences were found. Boys
Chapter 3 – Literature study of users and software application usage 33
Table 3.1: Mean ratings of frequencies of use of computers for different purposes (Colley & Comber, 2003)

displayed a greater affinity for games, while girls indicated a more work-oriented approach,
and liking for e-mail (Colley & Comber, 2003).
In a study on ‘Content creation for ICT development projects: Integrating normative
approaches and community demand’, Roman and Colle (2003), emphasise that the term
information and communications technologies (ICTs), relates more to the actual information
transfer and communication that takes place, rather than to the computer, the Internet or
telephone lines. The authors stress the importance of relevant content in community
development and poverty alleviation. Roman and Colle (2003), further report on a needs
assessment study conducted in three villages in India where tele-centres were to be installed.
Preliminary results from the study indicated differences in information uses and patterns
depending on gender, age and occupation of participants. With regard to content, the study
indicated a need for agricultural information by farmers in the village, as well as the need for
children's education and health information by women in the villages. In addition, youth of
the villages indicated an interest in information on employment opportunities.
Dangwal (2005) reports on results of studies conducted on school children in rural India,
where a HITW kiosk was situated. Evaluation was conducted on the children’s ability to learn
to operate the computer. Measures were made of the effect of such ‘playground computing’ on
educational outcome. Various measurement tools were employed by the researchers, including
the icon association inventory (IAI) where children had to identify the function of software
icons before and after a period of using the kiosk. Results indicated a dramatic increase in the
percentage of icons correctly identified after a period of nine months, supporting the
hypothesis that minimally invasive education, through exposure to the kiosks, could improve
computer literacy in users.
3.3 ‘Census at school’ results, 2009
The following figures from the results of the 2009 ‘Census at school’ conducted by Statistics
South Africa (2010), provide insight into the need for DDs in South Africa and indications
about preferred subjects (by gender and grade). These results are relevant to this study, as they
help explain the observed differences in application accesses (application ‘hit-counts’)
discussed in later chapters.
Figure 3.1 indicates that almost 35% of South African schools do not have electricity;
approximately 25% have a school library; 53% have a computer (but not necessarily computer
classes); and a very low percentage (approximately 15%) have email and Internet.
34 Chapter 3 – Literature study of users and software application usage
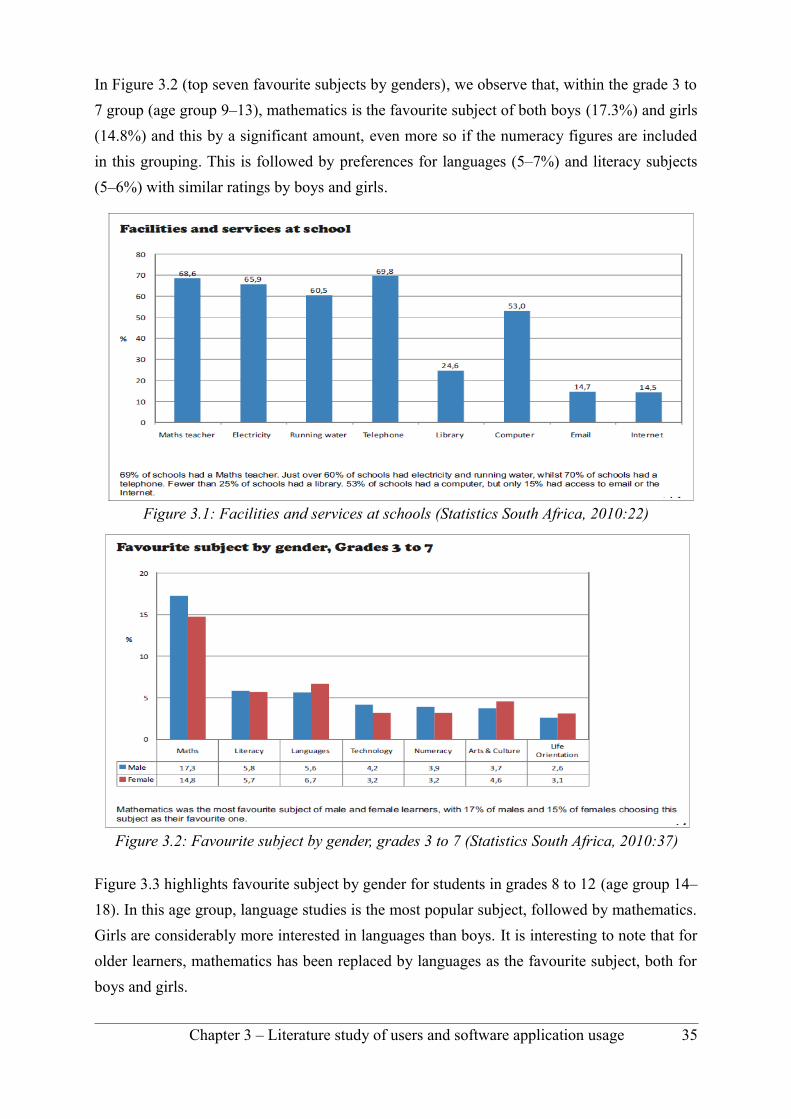
In Figure 3.2 (top seven favourite subjects by genders), we observe that, within the grade 3 to
7 group (age group 9–13), mathematics is the favourite subject of both boys (17.3%) and girls
(14.8%) and this by a significant amount, even more so if the numeracy figures are included
in this grouping. This is followed by preferences for languages (5–7%) and literacy subjects
(5–6%) with similar ratings by boys and girls.
Figure 3.3 highlights favourite subject by gender for students in grades 8 to 12 (age group 14–
18). In this age group, language studies is the most popular subject, followed by mathematics.
Girls are considerably more interested in languages than boys. It is interesting to note that for
older learners, mathematics has been replaced by languages as the favourite subject, both for
boys and girls.
Chapter 3 – Literature study of users and software application usage 35
Figure 3.1: Facilities and services at schools (Statistics South Africa, 2010:22)
Figure 3.2: Favourite subject by gender, grades 3 to 7 (Statistics South Africa, 2010:37)
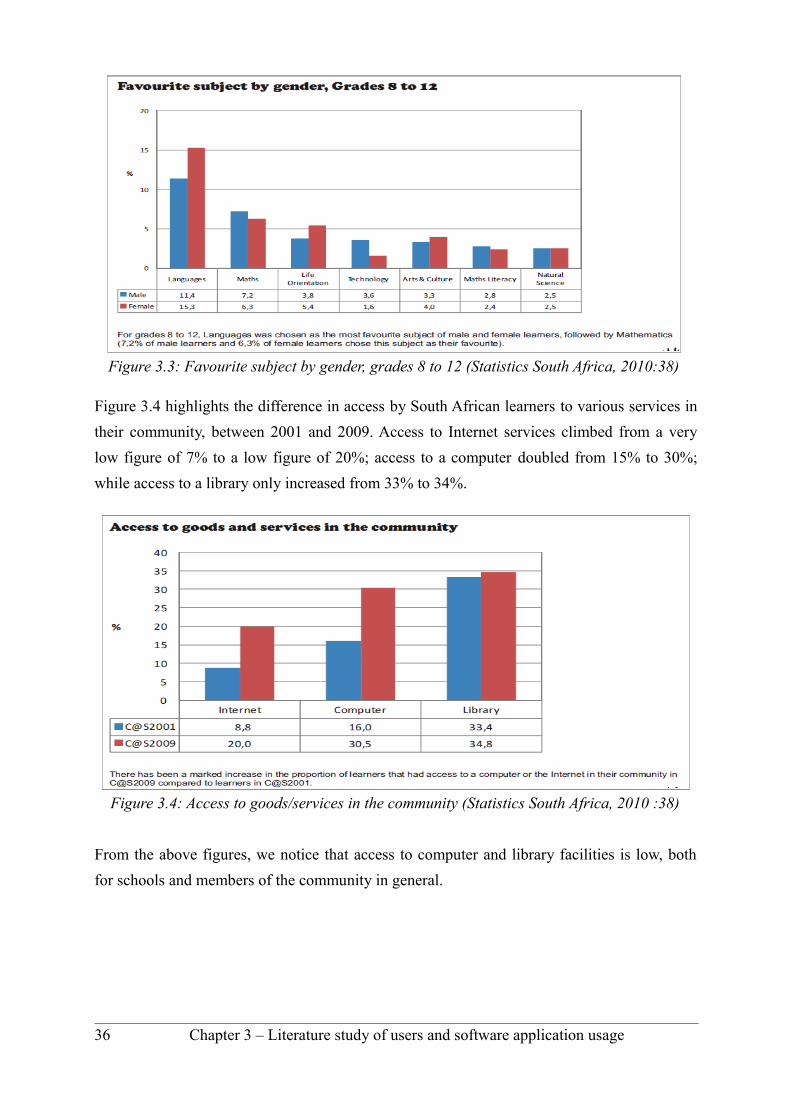
Figure 3.4 highlights the difference in access by South African learners to various services in
their community, between 2001 and 2009. Access to Internet services climbed from a very
low figure of 7% to a low figure of 20%; access to a computer doubled from 15% to 30%;
while access to a library only increased from 33% to 34%.
From the above figures, we notice that access to computer and library facilities is low, both
for schools and members of the community in general.
36 Chapter 3 – Literature study of users and software application usage
Figure 3.4: Access to goods/services in the community (Statistics South Africa, 2010 :38)
Figure 3.3: Favourite subject by gender, grades 8 to 12 (Statistics South Africa, 2010:38)
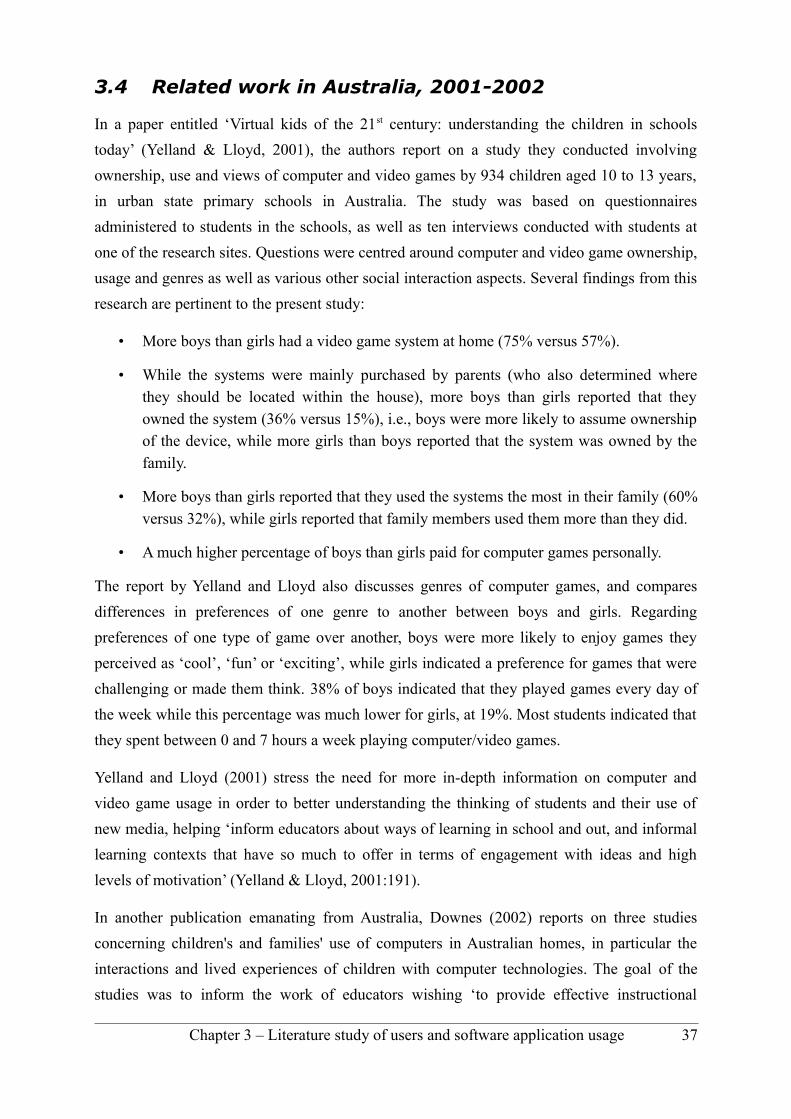
3.4 Related work in Australia, 2001-2002
In a paper entitled ‘Virtual kids of the 21st century: understanding the children in schools
today’ (Yelland & Lloyd, 2001), the authors report on a study they conducted involving
ownership, use and views of computer and video games by 934 children aged 10 to 13 years,
in urban state primary schools in Australia. The study was based on questionnaires
administered to students in the schools, as well as ten interviews conducted with students at
one of the research sites. Questions were centred around computer and video game ownership,
usage and genres as well as various other social interaction aspects. Several findings from this
research are pertinent to the present study:
• More boys than girls had a video game system at home (75% versus 57%).
• While the systems were mainly purchased by parents (who also determined where they should be located within the house), more boys than girls reported that they owned the system (36% versus 15%), i.e., boys were more likely to assume ownership of the device, while more girls than boys reported that the system was owned by the family.
• More boys than girls reported that they used the systems the most in their family (60% versus 32%), while girls reported that family members used them more than they did.
• A much higher percentage of boys than girls paid for computer games personally.
The report by Yelland and Lloyd also discusses genres of computer games, and compares
differences in preferences of one genre to another between boys and girls. Regarding
preferences of one type of game over another, boys were more likely to enjoy games they
perceived as ‘cool’, ‘fun’ or ‘exciting’, while girls indicated a preference for games that were
challenging or made them think. 38% of boys indicated that they played games every day of
the week while this percentage was much lower for girls, at 19%. Most students indicated that
they spent between 0 and 7 hours a week playing computer/video games.
Yelland and Lloyd (2001) stress the need for more in-depth information on computer and
video game usage in order to better understanding the thinking of students and their use of
new media, helping ‘inform educators about ways of learning in school and out, and informal
learning contexts that have so much to offer in terms of engagement with ideas and high
levels of motivation’ (Yelland & Lloyd, 2001:191).
In another publication emanating from Australia, Downes (2002) reports on three studies
concerning children's and families' use of computers in Australian homes, in particular the
interactions and lived experiences of children with computer technologies. The goal of the
studies was to inform the work of educators wishing ‘to provide effective instructional
Chapter 3 – Literature study of users and software application usage 37
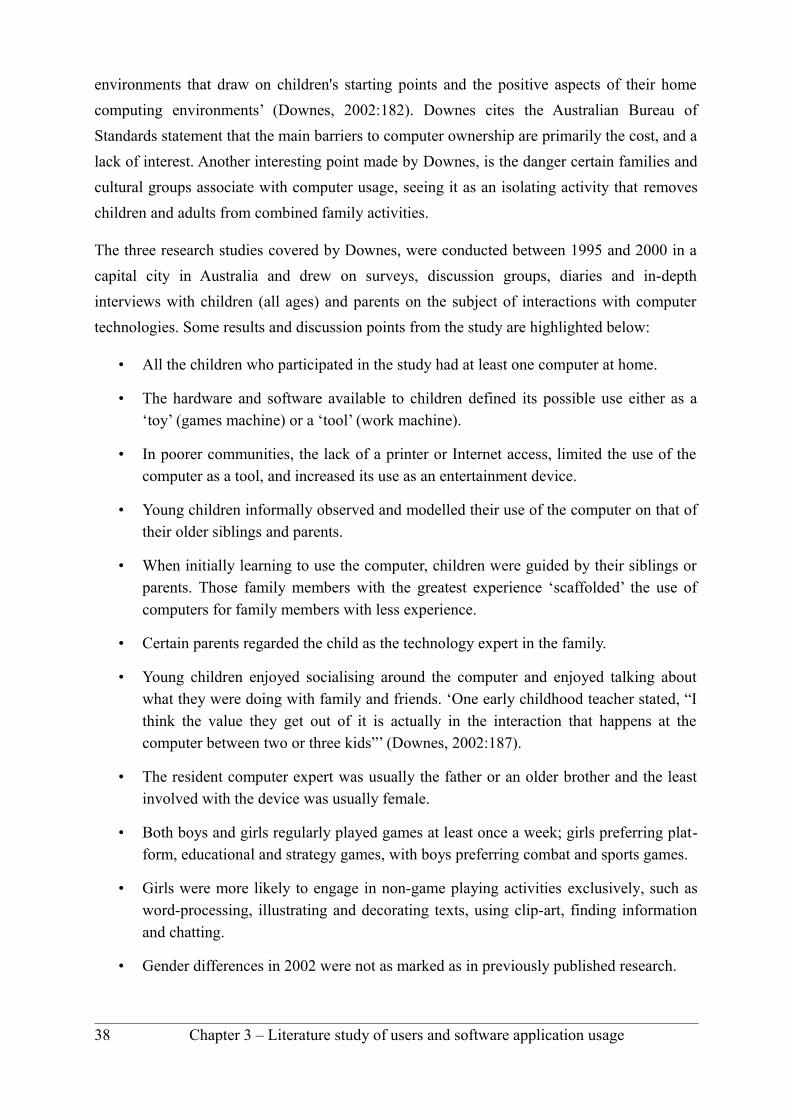
environments that draw on children's starting points and the positive aspects of their home
computing environments’ (Downes, 2002:182). Downes cites the Australian Bureau of
Standards statement that the main barriers to computer ownership are primarily the cost, and a
lack of interest. Another interesting point made by Downes, is the danger certain families and
cultural groups associate with computer usage, seeing it as an isolating activity that removes
children and adults from combined family activities.
The three research studies covered by Downes, were conducted between 1995 and 2000 in a
capital city in Australia and drew on surveys, discussion groups, diaries and in-depth
interviews with children (all ages) and parents on the subject of interactions with computer
technologies. Some results and discussion points from the study are highlighted below:
• All the children who participated in the study had at least one computer at home.
• The hardware and software available to children defined its possible use either as a ‘toy’ (games machine) or a ‘tool’ (work machine).
• In poorer communities, the lack of a printer or Internet access, limited the use of the computer as a tool, and increased its use as an entertainment device.
• Young children informally observed and modelled their use of the computer on that of their older siblings and parents.
• When initially learning to use the computer, children were guided by their siblings or parents. Those family members with the greatest experience ‘scaffolded’ the use of computers for family members with less experience.
• Certain parents regarded the child as the technology expert in the family.
• Young children enjoyed socialising around the computer and enjoyed talking about what they were doing with family and friends. ‘One early childhood teacher stated, “I think the value they get out of it is actually in the interaction that happens at the computer between two or three kids”’ (Downes, 2002:187).
• The resident computer expert was usually the father or an older brother and the least involved with the device was usually female.
• Both boys and girls regularly played games at least once a week; girls preferring plat-form, educational and strategy games, with boys preferring combat and sports games.
• Girls were more likely to engage in non-game playing activities exclusively, such as word-processing, illustrating and decorating texts, using clip-art, finding information and chatting.
• Gender differences in 2002 were not as marked as in previously published research.
38 Chapter 3 – Literature study of users and software application usage

• Seventy-four percent of children participating in the survey, attributed their improved school performance to having a computer at home, specifically in relation to researching information, thinking skills and reading, and mathematics skills.
• The studies revealed a positive linear correlation between frequency of computer use and age, with older children using the computer more frequently and for longer periods than younger children.
• Children in upper secondary school tended to use computers about four or five times a week.
• Children preferred to use a computer at home than at school, citing familiarity with the home computer, more control and choice at home, not having to share with others, and less time restrictions on usage at home.
• All the children expressed a positive attitude and high comfort level with computer use.
• Main computer activities mentioned by users were game playing, writing, editing, decorating texts, completing projects, and locating information.
• The boundary between play and work was often blurred and younger children's descriptions of activities often included the word ‘play’, e.g., ‘play the encyclopaedia’. Children would switch between periods of playful activity and purposeful tasks (e.g., homework).
• Game playing decreased significantly at the beginning of high school and task-oriented activities increased (e.g., making presentations or web pages for school).
• Children who regularly used a computer at home for entertainment and work activities were ‘predisposed to exploratory learning and learning by doing, at least when using computers’ (Downes, 2002:193).
• Some key aspects contributing to successful experiences with exploratory learning in the home computer environment were: sufficient time for self-directed exploration, a relaxed atmosphere, some degree of control, the level of expertise in the home, social interactions, and the blending of playful and purposeful activities.
• ‘One parent summarised the lack of congruence between school and home environments by saying that “they are freer to explore and discover at home, which is hugely beneficial, whereas at school, it's a pretty tight sort of context, and so their learning will be fairly restricted”’ (Downes, 2002:194).
• The use of digital resources is a social activity that encourages risk-taking and challenges children's thinking through the process of exploratory learning.
Chapter 3 – Literature study of users and software application usage 39
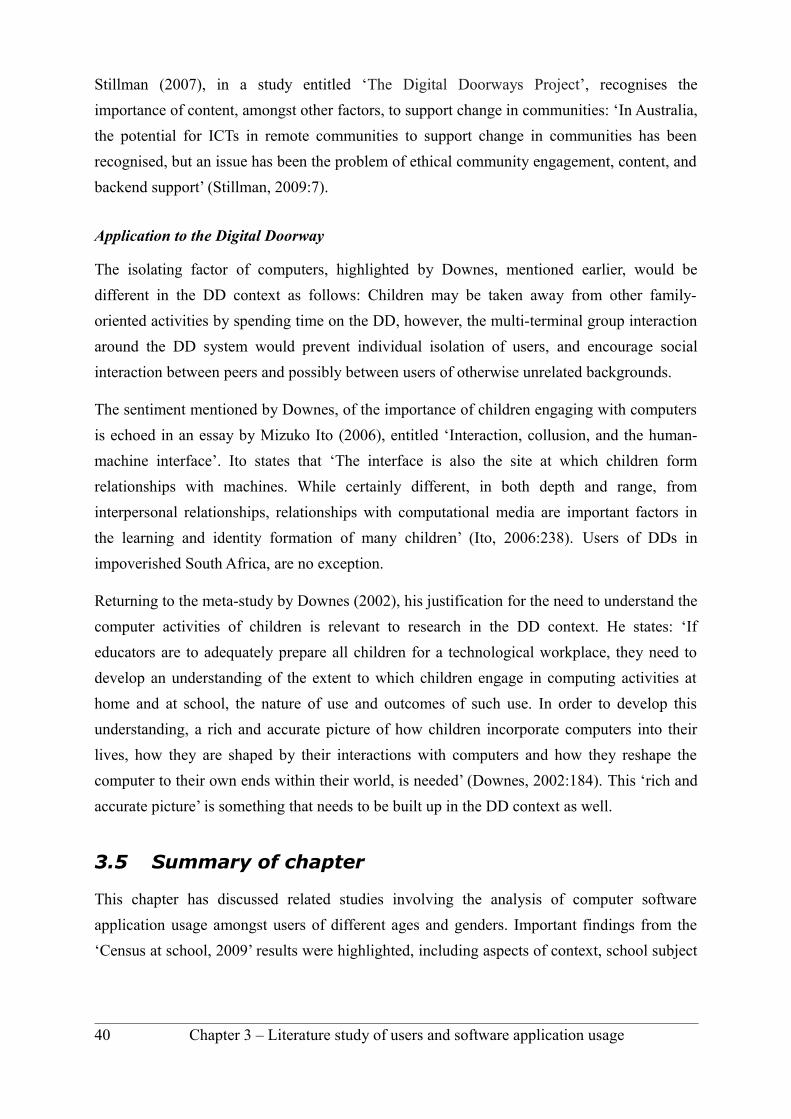
Stillman (2007), in a study entitled ‘The Digital Doorways Project’, recognises the
importance of content, amongst other factors, to support change in communities: ‘In Australia,
the potential for ICTs in remote communities to support change in communities has been
recognised, but an issue has been the problem of ethical community engagement, content, and
backend support’ (Stillman, 2009:7).
Application to the Digital Doorway
The isolating factor of computers, highlighted by Downes, mentioned earlier, would be
different in the DD context as follows: Children may be taken away from other family-
oriented activities by spending time on the DD, however, the multi-terminal group interaction
around the DD system would prevent individual isolation of users, and encourage social
interaction between peers and possibly between users of otherwise unrelated backgrounds.
The sentiment mentioned by Downes, of the importance of children engaging with computers
is echoed in an essay by Mizuko Ito (2006), entitled ‘Interaction, collusion, and the human-
machine interface’. Ito states that ‘The interface is also the site at which children form
relationships with machines. While certainly different, in both depth and range, from
interpersonal relationships, relationships with computational media are important factors in
the learning and identity formation of many children’ (Ito, 2006:238). Users of DDs in
impoverished South Africa, are no exception.
Returning to the meta-study by Downes (2002), his justification for the need to understand the
computer activities of children is relevant to research in the DD context. He states: ‘If
educators are to adequately prepare all children for a technological workplace, they need to
develop an understanding of the extent to which children engage in computing activities at
home and at school, the nature of use and outcomes of such use. In order to develop this
understanding, a rich and accurate picture of how children incorporate computers into their
lives, how they are shaped by their interactions with computers and how they reshape the
computer to their own ends within their world, is needed’ (Downes, 2002:184). This ‘rich and
accurate picture’ is something that needs to be built up in the DD context as well.
3.5 Summary of chapter
This chapter has discussed related studies involving the analysis of computer software
application usage amongst users of different ages and genders. Important findings from the
‘Census at school, 2009’ results were highlighted, including aspects of context, school subject
40 Chapter 3 – Literature study of users and software application usage
preference and access to services. Related studies involving computer usage in Australia were
presented, including their applicability to the DD project.
In the following chapters, we move from a general perspective of ICT4D and unassisted e-
learning projects in South Africa and abroad, to the specifics of the DD project. Chapter 4
describes DDs and their context, followed by an explanation in Chapter 5 of the research
design and methods used. Chapters 6 to 8 describe the quantitative and qualitative studies on
application usage.
Chapter 3 – Literature study of users and software application usage 41

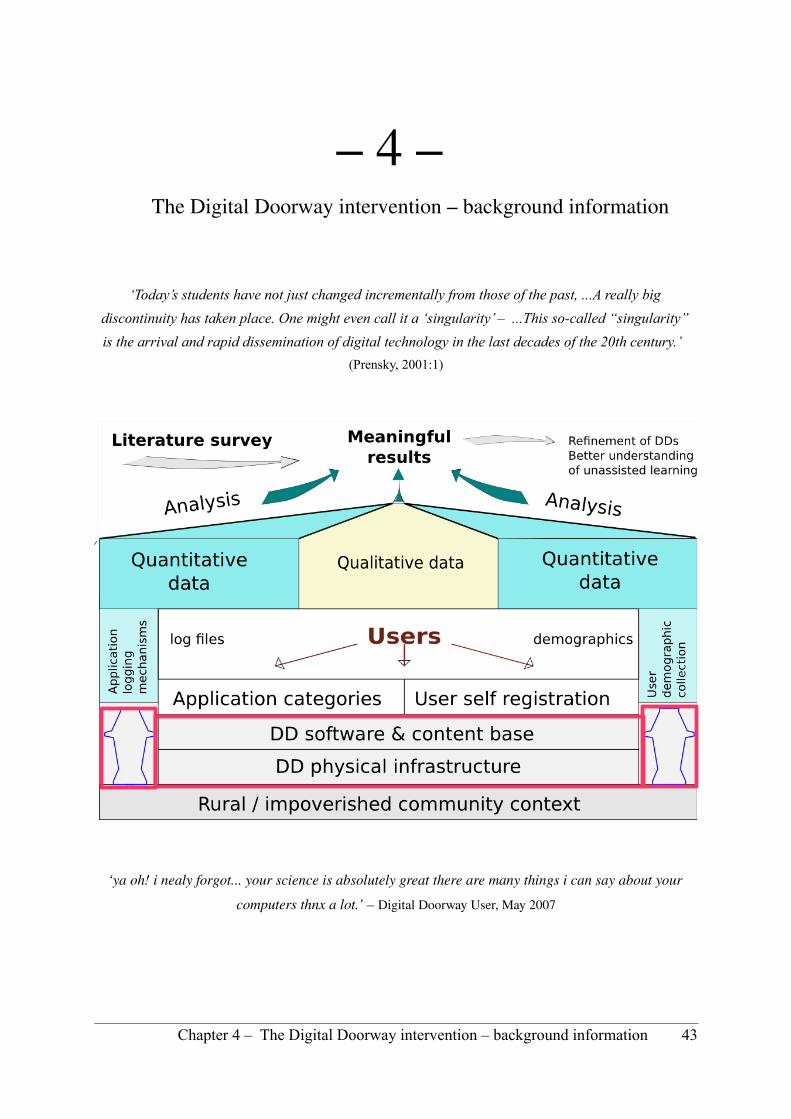
– 4 – The Digital Doorway intervention – background information
‘Today’s students have not just changed incrementally from those of the past, ...A really big
discontinuity has taken place. One might even call it a ‘singularity’ – ...This so-called “singularity”
is the arrival and rapid dissemination of digital technology in the last decades of the 20th century.’
(Prensky, 2001:1)
‘ya oh! i nealy forgot... your science is absolutely great there are many things i can say about your
computers thnx a lot.’ – Digital Doorway User, May 2007
Chapter 4 – The Digital Doorway intervention – background information 43
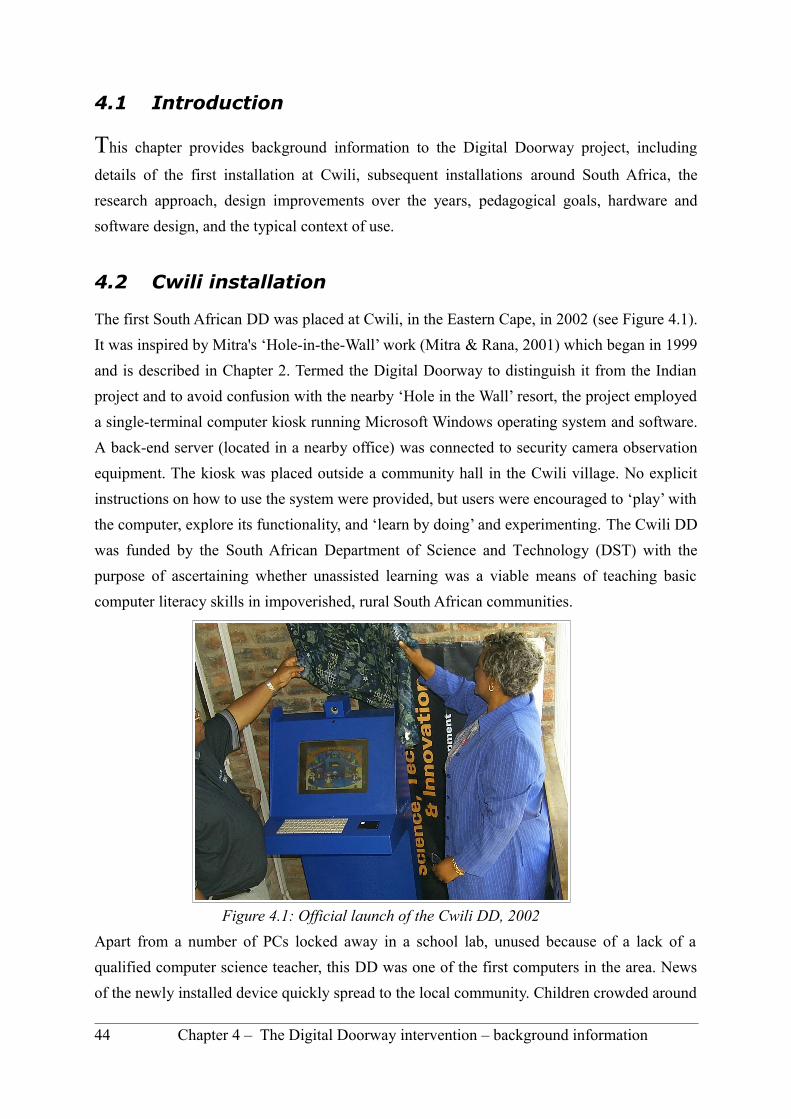
4.1 Introduction
This chapter provides background information to the Digital Doorway project, including
details of the first installation at Cwili, subsequent installations around South Africa, the
research approach, design improvements over the years, pedagogical goals, hardware and
software design, and the typical context of use.
4.2 Cwili installation
The first South African DD was placed at Cwili, in the Eastern Cape, in 2002 (see Figure 4.1).
It was inspired by Mitra's ‘Hole-in-the-Wall’ work (Mitra & Rana, 2001) which began in 1999
and is described in Chapter 2. Termed the Digital Doorway to distinguish it from the Indian
project and to avoid confusion with the nearby ‘Hole in the Wall’ resort, the project employed
a single-terminal computer kiosk running Microsoft Windows operating system and software.
A back-end server (located in a nearby office) was connected to security camera observation
equipment. The kiosk was placed outside a community hall in the Cwili village. No explicit
instructions on how to use the system were provided, but users were encouraged to ‘play’ with
the computer, explore its functionality, and ‘learn by doing’ and experimenting. The Cwili DD
was funded by the South African Department of Science and Technology (DST) with the
purpose of ascertaining whether unassisted learning was a viable means of teaching basic
computer literacy skills in impoverished, rural South African communities.
Apart from a number of PCs locked away in a school lab, unused because of a lack of a
qualified computer science teacher, this DD was one of the first computers in the area. News
of the newly installed device quickly spread to the local community. Children crowded around
44 Chapter 4 – The Digital Doorway intervention – background information
Figure 4.1: Official launch of the Cwili DD, 2002
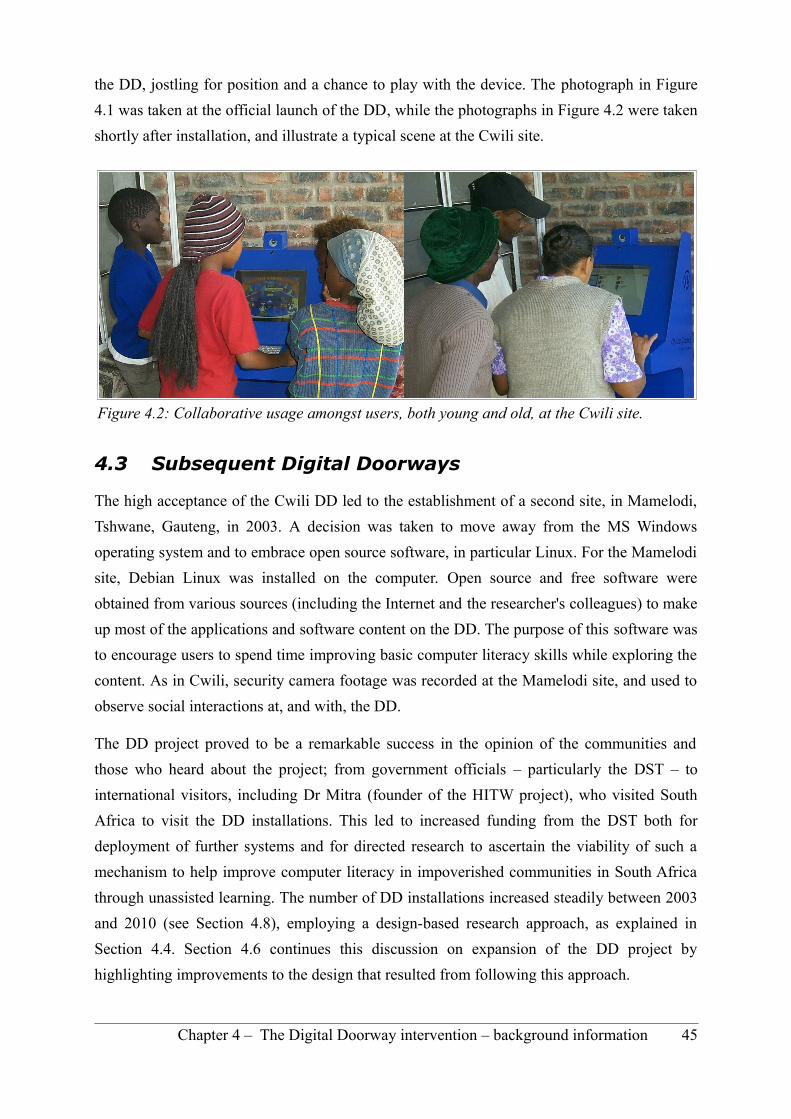
the DD, jostling for position and a chance to play with the device. The photograph in Figure
4.1 was taken at the official launch of the DD, while the photographs in Figure 4.2 were taken
shortly after installation, and illustrate a typical scene at the Cwili site.
4.3 Subsequent Digital Doorways
The high acceptance of the Cwili DD led to the establishment of a second site, in Mamelodi,
Tshwane, Gauteng, in 2003. A decision was taken to move away from the MS Windows
operating system and to embrace open source software, in particular Linux. For the Mamelodi
site, Debian Linux was installed on the computer. Open source and free software were
obtained from various sources (including the Internet and the researcher's colleagues) to make
up most of the applications and software content on the DD. The purpose of this software was
to encourage users to spend time improving basic computer literacy skills while exploring the
content. As in Cwili, security camera footage was recorded at the Mamelodi site, and used to
observe social interactions at, and with, the DD.
The DD project proved to be a remarkable success in the opinion of the communities and
those who heard about the project; from government officials – particularly the DST – to
international visitors, including Dr Mitra (founder of the HITW project), who visited South
Africa to visit the DD installations. This led to increased funding from the DST both for
deployment of further systems and for directed research to ascertain the viability of such a
mechanism to help improve computer literacy in impoverished communities in South Africa
through unassisted learning. The number of DD installations increased steadily between 2003
and 2010 (see Section 4.8), employing a design-based research approach, as explained in
Section 4.4. Section 4.6 continues this discussion on expansion of the DD project by
highlighting improvements to the design that resulted from following this approach.
Chapter 4 – The Digital Doorway intervention – background information 45
Figure 4.2: Collaborative usage amongst users, both young and old, at the Cwili site.
4.4 Design-based research approach
The following excerpt from the book ‘ICTs for Global Development and Sustainability:
Practice and Applications’ addresses the underlying research design of the DD:
‘What is the underlying research design of the Digital Doorway? The answer to this
question is intrinsically related to the DD’s main purpose. Is it an implementation of the
emergent discipline of community informatics (CI) or is it first and foremost an edu-
cational system? If the former, then its research design requires a theoretical foundation
that integrates and directs CI’s double agenda of information systems (IS) problem
solving and practical community problem solving (Stillman & Linger, 2009). If, on the
other hand, it is primarily a technology to support learning, then it requires grounding in
a research methodology that emanates from the educational sciences. A study by de
Villiers (2007) on interpretive research models for informatics takes cognisance of
Walsham’s (1995) work on interpretivism and addresses design- and development
research which, de Villiers posits, are implemented in IS as design-science research and
in educational technology as design-based research’ (Gush et al., 2011:103).
When the DD project commenced in 2002, no explicit research methodology was identified.
However, as the project progressed, it became clear that this development was a true
implementation of design research (DR) – also known as design-based research (DBR) in the
context of education. The main characteristics of DR as laid out by Wilson (2004:82) in an
article entitled ‘Designing E-Learning Environments for Flexible Activity and Instruction’
are:
• Locally situated within a professional or learning context.
• Responds to difficult problems encountered in practice rather than seeking to validate theory.
• Typically, examines whole systems rather than narrow slices of concern.
• Is eclectic in research method.
• Is more concerned with external use and relevance rather than control of internal sources of error.
• Is respectful of practitioner expertise and practices.
• Is somewhat grounded in theory, with theory exploration perhaps a part of the research questions.
• Is aimed to yield knowledge that can be appropriated by practitioners.
• Is concerned about values, equity and justice, not just technical efficiency.
46 Chapter 4 – The Digital Doorway intervention – background information

Digital Doorway context and development in the light of Wilson's design research
characteristics.
The DDs are indeed locally situated within the learning context, which may be a school,
library, community hall or similar site, the idea being to bring technology and content to areas
otherwise overlooked in this regard. The project responds to the difficult problem of enabling
impoverished communities to acquire computer literacy skills by tackling the problem directly
(through actual interventions) rather than seeking to merely validate theory. DDs are
concerned with social, technical, and educational challenges. Researchers examine these
challenges holistically through various methods such as observation, interviews, and log file
analysis. The DDs rely on the expertise of the designers and engineers to achieve a successful
installation and are indeed concerned with external use of the systems within a community
environment. The theory that under-girds the project is one of unassisted learning and peer-
assisted learning, both of which continue to be explored as the project progresses. The
knowledge gained from this project can be appropriated by practitioners in other initiatives
seeking to increase computer literacy skills in a similar fashion. Finally, by seeking to assist
the most impoverished communities in South Africa, it is clear that the DD project is
concerned with equity and social justice.
Predictive versus design-based research approaches
Figure 4.3, from Amiel and Reeves (2008:34), highlights the differences between the
predictive and design-based research approaches. The third and fourth blocks in the DBR
process – iterative cycles of testing and refinement of solutions and practice, and reflection –
are particularly appropriate to the DD development and dissemination, which employed, and
continue to employ, iterative cycles of design, installation, testing and analysis, reflection,
refinement and redesign.
The research and implementation process can be simply described as follows: ‘The project
followed an iterative process of design, implement, observe/evaluate, analyse, modify,
redesign, implement, observe, ...as the practices of the DD progressed further to meet real-
world needs, the iterative research processes became a series of cycles. The underlying
research paradigm moved beyond classic action research to become an example of design-
based research (DBR)’ (Gush et al., 2011:104). This is shown in Figure 4.4 below.
‘DBR fosters cross-disciplinary work – for example, in the DD project, engineers, educational
researchers and sociologists were involved. This collaborative approach leads to insights in
unpredictable real-world settings (Kelly, 2003). In complex and ill-structured environments,
the design of artefacts and the development of theories proceed concurrently, informing each
Chapter 4 – The Digital Doorway intervention – background information 47
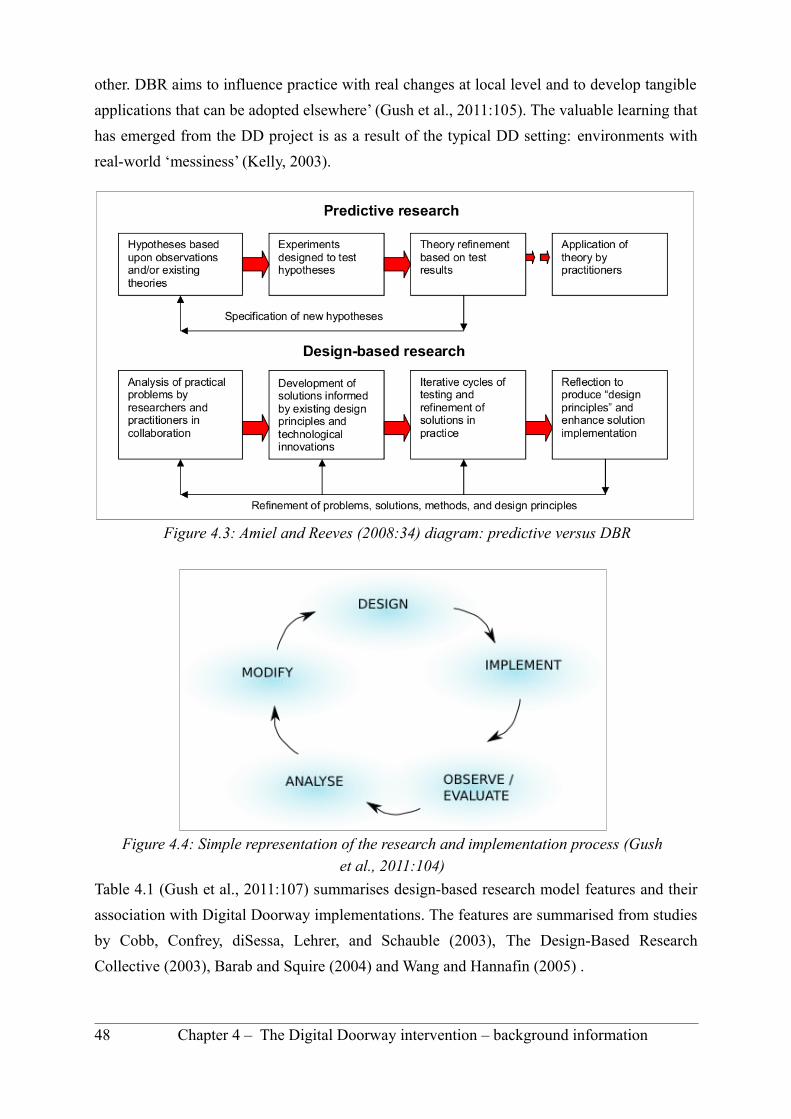
other. DBR aims to influence practice with real changes at local level and to develop tangible
applications that can be adopted elsewhere’ (Gush et al., 2011:105). The valuable learning that
has emerged from the DD project is as a result of the typical DD setting: environments with
real-world ‘messiness’ (Kelly, 2003).
Table 4.1 (Gush et al., 2011:107) summarises design-based research model features and their
association with Digital Doorway implementations. The features are summarised from studies
by Cobb, Confrey, diSessa, Lehrer, and Schauble (2003), The Design-Based Research
Collective (2003), Barab and Squire (2004) and Wang and Hannafin (2005) .
48 Chapter 4 – The Digital Doorway intervention – background information
Figure 4.3: Amiel and Reeves (2008:34) diagram: predictive versus DBR
Figure 4.4: Simple representation of the research and implementation process (Gush et al., 2011:104)
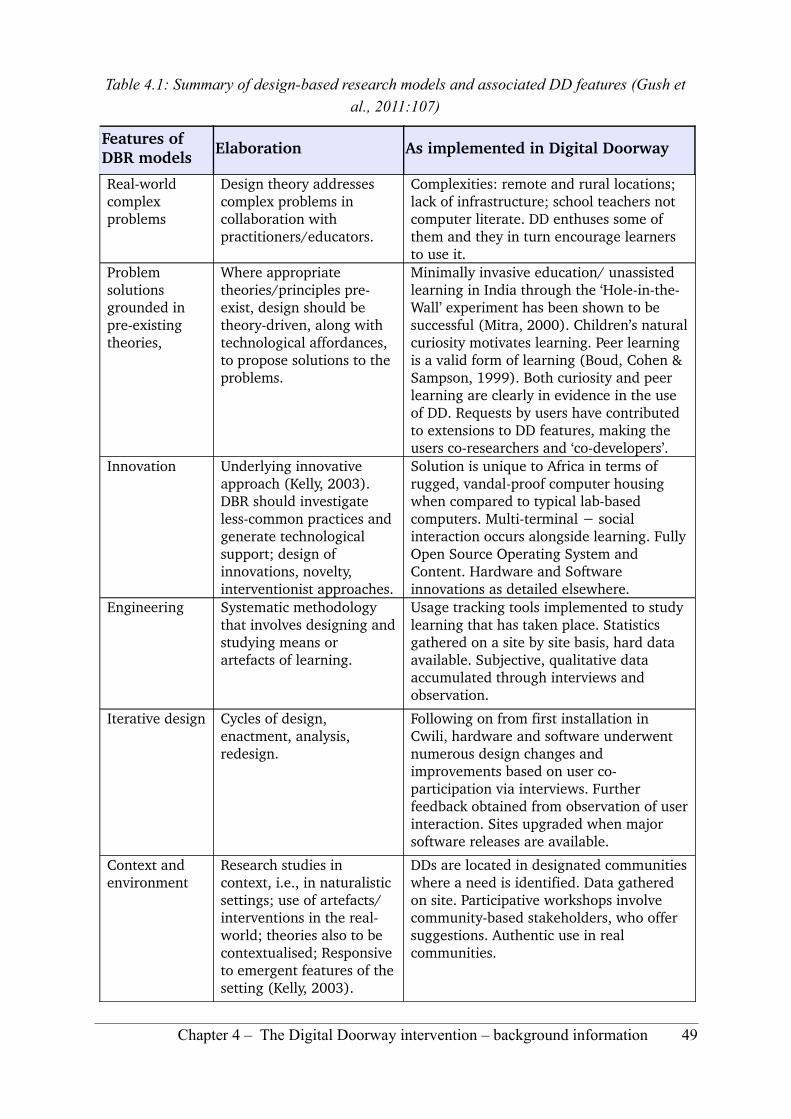
Table 4.1: Summary of design-based research models and associated DD features (Gush et al., 2011:107)
Features of DBR models
Elaboration As implemented in Digital Doorway
Realworld complex problems
Design theory addresses complex problems in collaboration with practitioners/educators.
Complexities: remote and rural locations; lack of infrastructure; school teachers not computer literate. DD enthuses some of them and they in turn encourage learners to use it.
Problem solutions grounded in preexisting theories,
Where appropriate theories/principles preexist, design should be theorydriven, along with technological affordances, to propose solutions to the problems.
Minimally invasive education/ unassisted learning in India through the ‘HoleintheWall’ experiment has been shown to be successful (Mitra, 2000). Children’s natural curiosity motivates learning. Peer learning is a valid form of learning (Boud, Cohen & Sampson, 1999). Both curiosity and peer learning are clearly in evidence in the use of DD. Requests by users have contributed to extensions to DD features, making the users coresearchers and ‘codevelopers’.
Innovation Underlying innovative approach (Kelly, 2003). DBR should investigate lesscommon practices and generate technological support; design of innovations, novelty, interventionist approaches.
Solution is unique to Africa in terms of rugged, vandalproof computer housing when compared to typical labbased computers. Multiterminal − social interaction occurs alongside learning. Fully Open Source Operating System and Content. Hardware and Software innovations as detailed elsewhere.
Engineering Systematic methodology that involves designing and studying means or artefacts of learning.
Usage tracking tools implemented to study learning that has taken place. Statistics gathered on a site by site basis, hard data available. Subjective, qualitative data accumulated through interviews and observation.
Iterative design Cycles of design, enactment, analysis, redesign.
Following on from first installation in Cwili, hardware and software underwent numerous design changes and improvements based on user coparticipation via interviews. Further feedback obtained from observation of user interaction. Sites upgraded when major software releases are available.
Context and environment
Research studies in context, i.e., in naturalistic settings; use of artefacts/ interventions in the realworld; theories also to be contextualised; Responsive to emergent features of the setting (Kelly, 2003).
DDs are located in designated communities where a need is identified. Data gathered on site. Participative workshops involve communitybased stakeholders, who offer suggestions. Authentic use in real communities.
Chapter 4 – The Digital Doorway intervention – background information 49

Empirical research
Studying tangible, realworld products, which ideally, should be usable elsewhere, i.e., influence on teaching, learning and training practice. Data collection and analysis.
Data collection through observation of learners and video data, interviews and surveys. Instruments: automated logging/recording of usage statistics. Knowledge obtained from these systems transferable to similar installations elsewhere.
Participants as collaborators
Participants are not merely subjects, but can be coparticipants in the research.
In day or halfday workshops, community leaders and, in some cases, other community members joined Meraka researchers as coparticipants to discuss aspects of DD implementation and usage.
Refining the artefact/system
Using formative evaluation to derive research findings; design and explore artefacts, environments, etc. with rigorous inquiry methods to refine them and define new design principles.
Hardware progression from single terminal to 4terminal to spacesaving 3terminal. Further work led to a DD for disabled users and a desktop variety. Software refined based on experience gained from previous versions. Content increased to meet the needs of the users.
Output products:
Useful realworld products Development of theory
Realworld products: technical and methodological tools; frameworks; interventions; curricula. These offer immediate value in the environment of use.Theories that are generated, evaluated and refined in a reflective cycle. They provide a set of theoretical constructs that can be transferred and adapted beyond the initial environment.
Success of initial prototypes led to rollout of more DDs. Poor electricity supply at some sites and unsuitable venues led to solarpowered DD container. Desktopunit, singleterminal DD. Production of a DD Software DVD. Teachers (e.g., Gatang high school) realised the value of the DD as an information resource, sending pupils there to do homework research. Theories developed around effective and ineffective systems (deployment strategies) and dealing with the rural context in the design of technology.
Pragmatic The theories developed should do real work and be supported by evidencebased claims about learning.
The success of the DD in teaching basic ICT literacy has resulted in the deployment of multiple machines, nationwide. Evidence seen in the feedback received, and social assessment of users.
Synergy Design and research; theory and practice; are advanced concurrently.
Project has a deployment and research phase, mutually feeding into and affecting each other.
4.5 Evaluation
Validation is ‘the process of testing whether the program meets its goals in the real learning
environment’ and ‘the true test of a program occurs when it is exposed to a large number of
learners in their natural setting for learning’ (Alessi and Trollip, 2001:553).
50 Chapter 4 – The Digital Doorway intervention – background information

What has been said about validation of software, can be applied to the entire Digital Doorway
solution and its evaluation, or to rephrase Alessi by replacing certain terms: the true test of a
Digital Doorway occurs when it is exposed to a large number of users in their natural setting.
Four levels of evaluating instructional multimedia, initially proposed by Donald KirkPatrick,
are mentioned by Alessi and Trollip (KirkPatrick, 1998, cited in Alessi and Trollip, 2001).
These levels for training in general, are:
1) Assessing reaction and attitude – how much do users like it?
2) Assessing learning – are users learning what was intended?
3) Assessing behaviour change in the intended environment – are learners using what they have learned?
4) Assessing results and return on investment – was the system worth all the effort?
The present study into application usage, is a major component in the current assessment of
DDs (see Figure 4.4). It provides insight about reactions to, and attitudes towards, the DDs, as
well as insight into usage of content. In addition, usage analysis is an important cog in the
DBR approach, where one of the goals is to improve the inbuilt software applications in terms
of relevance and effectiveness, through an iterative process.
While DBR is the research paradigm underlying the general cyclic development, evaluation,
and progression of the DD, the particular methodology of the present study is a mixed-
methods approach, comprising a quantitative study and a qualitative study (see Chapter 5, on
research design and methodology).
‘The computer tool most overlooked for evaluation is the learning program itself. A program
may have built-in collection of data that will assist in its own evaluation’ (Alessi & Trollip,
2001:557). Chapter 6, on quantitative analysis of log files, demonstrates the value of using the
‘program’ itself for evaluation. This study, together with Gush (2008), forms the first
comprehensive study of application and user logs. The qualitative studies discussed in
Chapter 7, provide further insight into application usage.
4.6 Digital Doorway design improvements
Table 4.2 highlights some of the issues and problems that became evident after installation, as
well as corresponding improvements that were implemented in subsequent designs. The
issues encountered, ranged from social to technical. Solutions were informed by observations
and feedback from actual implementations and evaluations in the field, as described in
Section 4.4 (see Figure 4.4), making this a true case of on-site learning.
Chapter 4 – The Digital Doorway intervention – background information 51

Table 4.2: Design improvements
Issue/Problem Improvement
1 Difficulty experienced by nonEnglish speaking users in understanding the log in procedure and supporting tutorials
Catering for multiple languages through the translation of onscreen instructions and tutorial menus.
2 Difficulty experienced by system maintainers in performing remote management and monitoring on the proprietary operating system (MS Windows). Inability to customise closed (non open source) code.
Improvement of remote monitoring and management of systems as well as customisation facilities for the software, by moving from a proprietary (MS Windows) operating system with closed (nonmodifiable) code, to an open source operating system with open (modifiable) code.
3 Crowding around DD terminals, and the restrictions resulting from many users at a single terminal.
Progression from a single terminal device to a multiterminal device.
4 Damage and wearandtear to the keyboards over time, due to frequent use in an unsupervised context.
Progression from lowquality plastic keyboards, through ‘industrial’ keyboards, to final establishment of expensive metal vandalproof keyboards with touchpads.
5 Lack of direct feedback from he community. The need for cleaning and turning on and off the DD.
Appointment of site champions.
6 The need to obtain user experience feedback/suggestions/requests
Implementation of a software feedback mechanism where users can input text into a form that gets sent back to a central server.
7 Content not always relevant to users in rural areas.
Provision of additional content focused on the needs of rural areas (e.g., agriculture, finding employment, HIVAIDS information).
8 Physical location of the DD (e.g., enclosed room versus open verandah); the impact of this on who used the DD.
Discerning selection of physical locations of DD housing, taking into account each particular context and environment.
9 Desktop and file system liable to become ‘cluttered’ due to extensive use of the same guest accounts over weeks and months.
The use of scripts to restore guest user accounts on a daily basis.
10 The need to understand application usage and demographic information of users.
The implementation of user detail logging and application usage logging for improved understanding of user demographics and application usage.
11 Requests from users for functionality to enable them to save their work or content from the DD on a personal device.
The provision (at certain sites) of external USB ports to allow external access to information on the DD.
12 Slots or openings on the housing would attract bubble gum or other detritus.
The provision of wireless (bluetooth) dongle and software to enable downloading of information to cell phones.
52 Chapter 4 – The Digital Doorway intervention – background information
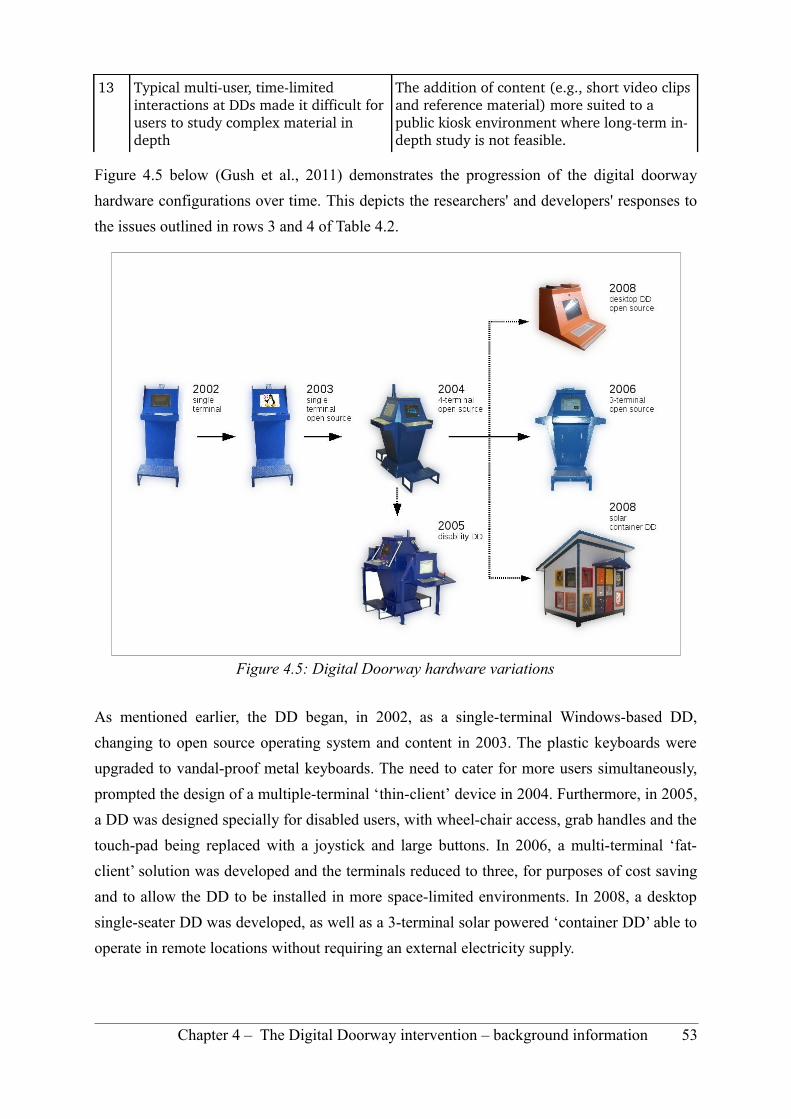
13 Typical multiuser, timelimited interactions at DDs made it difficult for users to study complex material in depth
The addition of content (e.g., short video clips and reference material) more suited to a public kiosk environment where longterm indepth study is not feasible.
Figure 4.5 below (Gush et al., 2011) demonstrates the progression of the digital doorway
hardware configurations over time. This depicts the researchers' and developers' responses to
the issues outlined in rows 3 and 4 of Table 4.2.
As mentioned earlier, the DD began, in 2002, as a single-terminal Windows-based DD,
changing to open source operating system and content in 2003. The plastic keyboards were
upgraded to vandal-proof metal keyboards. The need to cater for more users simultaneously,
prompted the design of a multiple-terminal ‘thin-client’ device in 2004. Furthermore, in 2005,
a DD was designed specially for disabled users, with wheel-chair access, grab handles and the
touch-pad being replaced with a joystick and large buttons. In 2006, a multi-terminal ‘fat-
client’ solution was developed and the terminals reduced to three, for purposes of cost saving
and to allow the DD to be installed in more space-limited environments. In 2008, a desktop
single-seater DD was developed, as well as a 3-terminal solar powered ‘container DD’ able to
operate in remote locations without requiring an external electricity supply.
Chapter 4 – The Digital Doorway intervention – background information 53
Figure 4.5: Digital Doorway hardware variations

Table 4.3, from Gush, de Villiers et al. (2011), highlights the key milestones of the DD project
from initial catalyst to current deployment status.
Table 4.3: Digital Doorway time line (Gush et al., 2011:99)
Year Digital Doorway milestone
1999Dr Sugata Mitra of NIIT, India trials a mechanism to observe ‘unassisted learning’ of a computer system in his ‘Hole In The Wall’ (HITW) project
20002001 Mitra's MIE concept proven to be successful in India (Mitra, 2000)
2002Digital Doorway project commences in South Africa with introduction of singleterminal device (Gush, Smith & Cambridge, 2004)
20022004Similar findings on the success of unassisted learning validated in South Africa
2003Migration to fully open source software begins with the introduction of the Debian operating system (Gush, 2004)
20044terminal DD housings introduced, together with improved open source based operating system
2005Project expanded to 24 diverse sites around South Africa for comparison purposes
2006 Xubuntu 3terminal diskless ‘fat client’ solution developed
2007Project expansion to 100+ threeterminal sites, software refinement, initial wireless network integration prototypes
2008Further scaling up (deployment of over 200 units) and system refinement. Additional singleterminal desktop system designed. Prototype solarpowered standalone container system developed
2009Solar powered container systems deployed in rural locations. Formulation of an independent entity to manage installation and maintenance of DDs commences.
As was stated earlier, the development process was one of design-implement-analyse-
improve-implement, and followed the design research (DR) approach, which in the context of
educational technology is termed design-based research (DBR) (see Section 4.4).
4.7 Progressive expansion of Digital Doorway
pedagogical goals
The primary goal of the DD is to provide a technological enabler that moves the learner from
a state of ignorance of computers and their use (novice user), to a state of competence
(experienced user). No time frame is specified for this process as the user is self-taught and
self-directed. This goal may be broken into a discrete set of progressively more involved
pedagogical sub-goals, as illustrated in Table 4.4.
54 Chapter 4 – The Digital Doorway intervention – background information
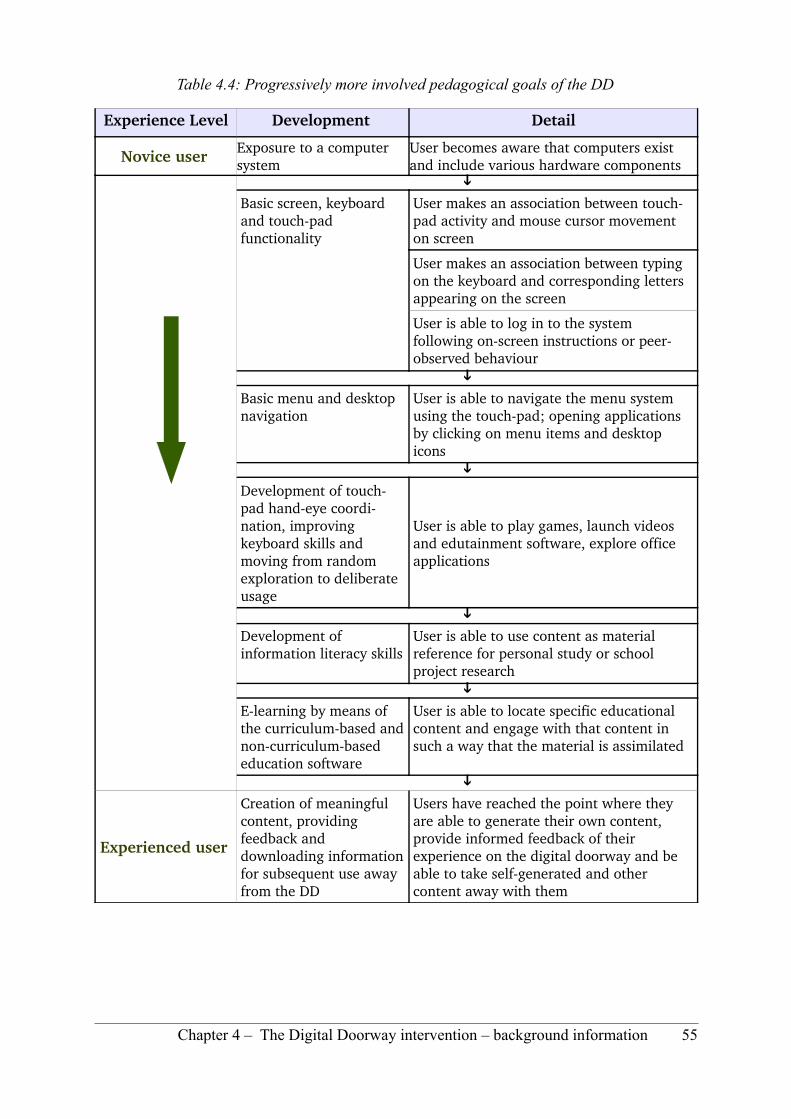
Table 4.4: Progressively more involved pedagogical goals of the DD
Experience Level Development Detail
Novice user Exposure to a computer system
User becomes aware that computers exist and include various hardware components
↓
Basic screen, keyboard and touchpad functionality
User makes an association between touchpad activity and mouse cursor movement on screen
User makes an association between typing on the keyboard and corresponding letters appearing on the screen
User is able to log in to the system following onscreen instructions or peerobserved behaviour
↓
Basic menu and desktop navigation
User is able to navigate the menu system using the touchpad; opening applications by clicking on menu items and desktop icons
↓
Development of touchpad handeye coordination, improving keyboard skills and moving from random exploration to deliberate usage
User is able to play games, launch videos and edutainment software, explore office applications
↓
Development of information literacy skills
User is able to use content as material reference for personal study or school project research
↓
Elearning by means of the curriculumbased and noncurriculumbased education software
User is able to locate specific educational content and engage with that content in such a way that the material is assimilated
↓
Experienced user
Creation of meaningful content, providing feedback and downloading information for subsequent use away from the DD
Users have reached the point where they are able to generate their own content, provide informed feedback of their experience on the digital doorway and be able to take selfgenerated and other content away with them
Chapter 4 – The Digital Doorway intervention – background information 55
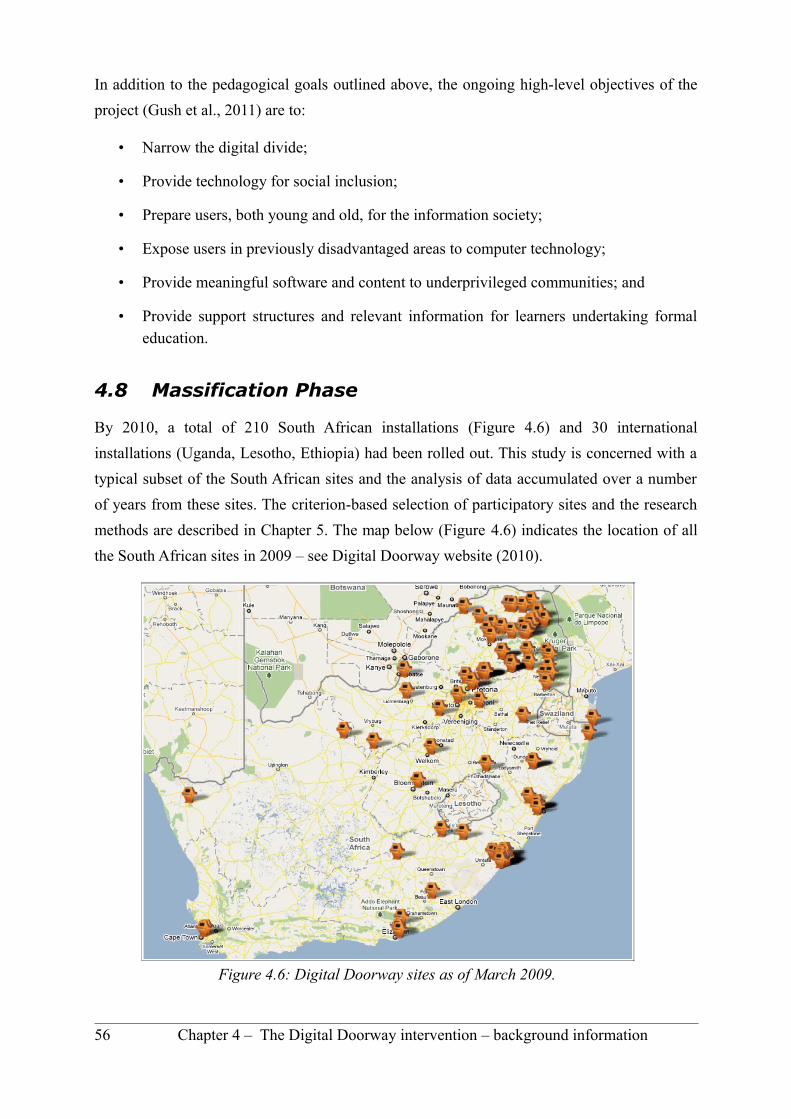
In addition to the pedagogical goals outlined above, the ongoing high-level objectives of the
project (Gush et al., 2011) are to:
• Narrow the digital divide;
• Provide technology for social inclusion;
• Prepare users, both young and old, for the information society;
• Expose users in previously disadvantaged areas to computer technology;
• Provide meaningful software and content to underprivileged communities; and
• Provide support structures and relevant information for learners undertaking formal education.
4.8 Massification Phase
By 2010, a total of 210 South African installations (Figure 4.6) and 30 international
installations (Uganda, Lesotho, Ethiopia) had been rolled out. This study is concerned with a
typical subset of the South African sites and the analysis of data accumulated over a number
of years from these sites. The criterion-based selection of participatory sites and the research
methods are described in Chapter 5. The map below (Figure 4.6) indicates the location of all
the South African sites in 2009 – see Digital Doorway website (2010).
56 Chapter 4 – The Digital Doorway intervention – background information
Figure 4.6: Digital Doorway sites as of March 2009.
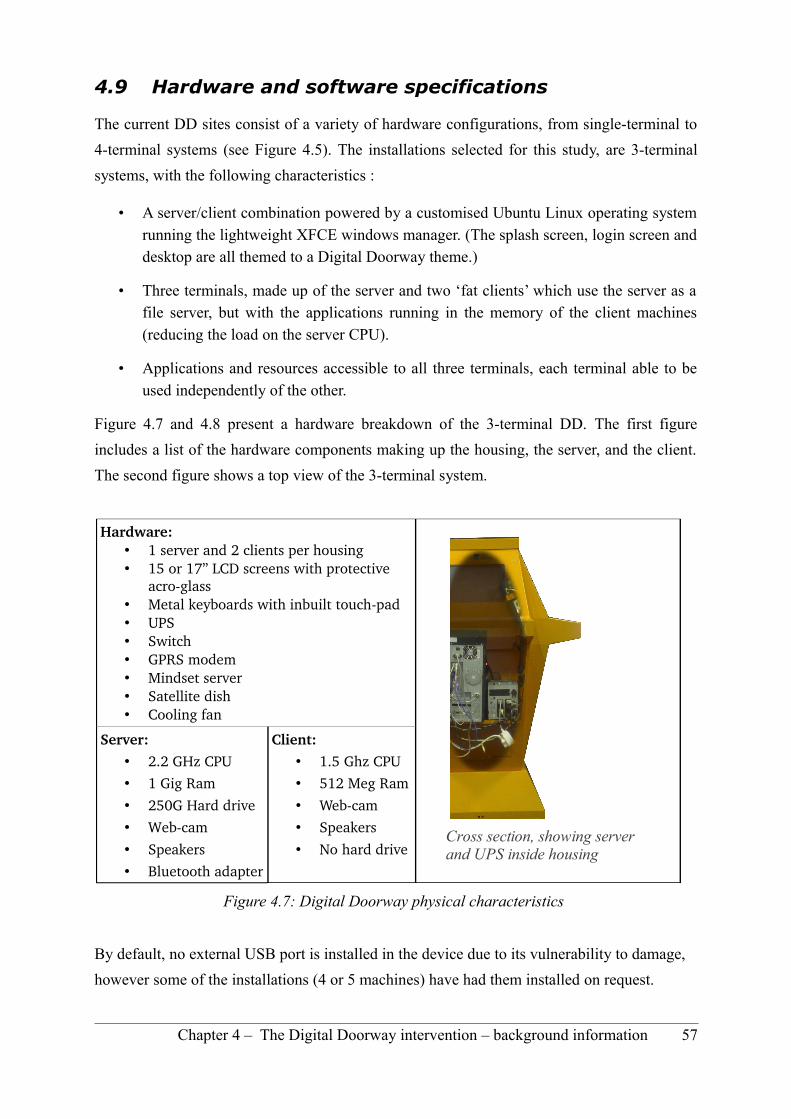
4.9 Hardware and software specifications
The current DD sites consist of a variety of hardware configurations, from single-terminal to
4-terminal systems (see Figure 4.5). The installations selected for this study, are 3-terminal
systems, with the following characteristics :
• A server/client combination powered by a customised Ubuntu Linux operating system running the lightweight XFCE windows manager. (The splash screen, login screen and desktop are all themed to a Digital Doorway theme.)
• Three terminals, made up of the server and two ‘fat clients’ which use the server as a file server, but with the applications running in the memory of the client machines (reducing the load on the server CPU).
• Applications and resources accessible to all three terminals, each terminal able to be used independently of the other.
Figure 4.7 and 4.8 present a hardware breakdown of the 3-terminal DD. The first figure
includes a list of the hardware components making up the housing, the server, and the client.
The second figure shows a top view of the 3-terminal system.
By default, no external USB port is installed in the device due to its vulnerability to damage,
however some of the installations (4 or 5 machines) have had them installed on request.
Chapter 4 – The Digital Doorway intervention – background information 57
Hardware:• 1 server and 2 clients per housing• 15 or 17” LCD screens with protective
acroglass • Metal keyboards with inbuilt touchpad• UPS• Switch• GPRS modem• Mindset server• Satellite dish• Cooling fan
Server:• 2.2 GHz CPU• 1 Gig Ram
• 250G Hard drive• Webcam
• Speakers• Bluetooth adapter
Client:• 1.5 Ghz CPU• 512 Meg Ram
• Webcam• Speakers
• No hard drive
Figure 4.7: Digital Doorway physical characteristics
Cross section, showing server and UPS inside housing
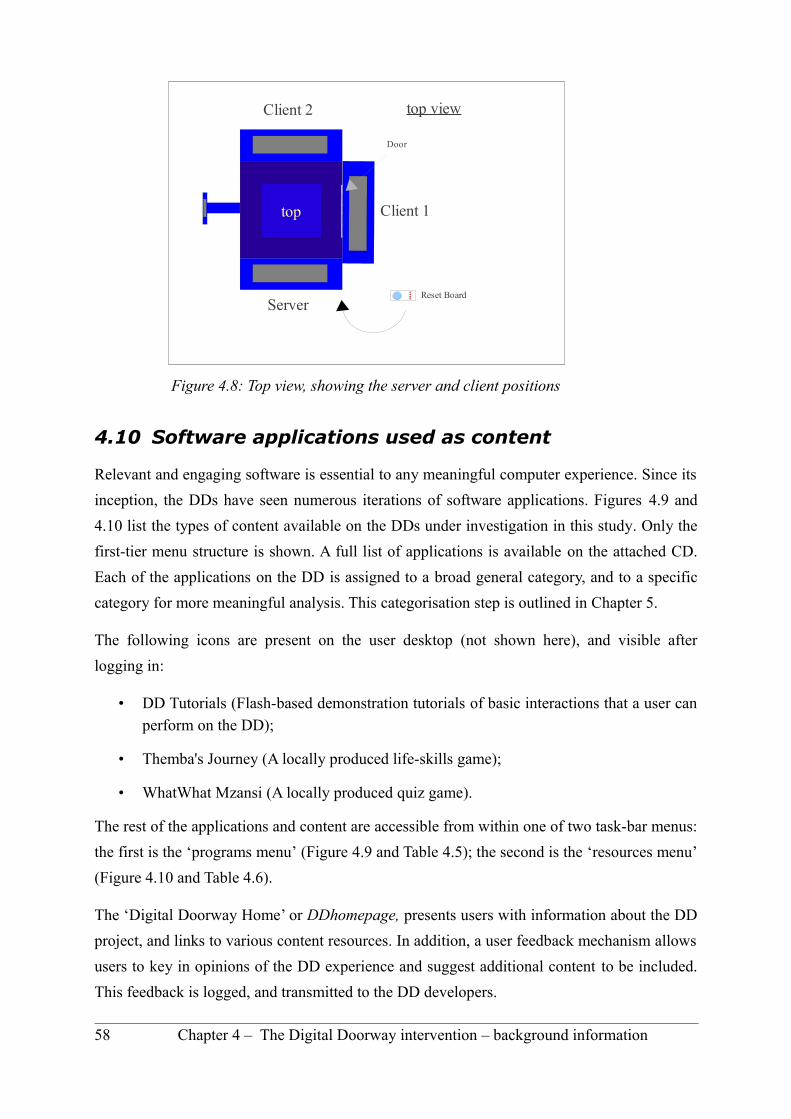
4.10 Software applications used as content
Relevant and engaging software is essential to any meaningful computer experience. Since its
inception, the DDs have seen numerous iterations of software applications. Figures 4.9 and
4.10 list the types of content available on the DDs under investigation in this study. Only the
first-tier menu structure is shown. A full list of applications is available on the attached CD.
Each of the applications on the DD is assigned to a broad general category, and to a specific
category for more meaningful analysis. This categorisation step is outlined in Chapter 5.
The following icons are present on the user desktop (not shown here), and visible after
logging in:
• DD Tutorials (Flash-based demonstration tutorials of basic interactions that a user can perform on the DD);
• Themba's Journey (A locally produced life-skills game);
• WhatWhat Mzansi (A locally produced quiz game).
The rest of the applications and content are accessible from within one of two task-bar menus:
the first is the ‘programs menu’ (Figure 4.9 and Table 4.5); the second is the ‘resources menu’
(Figure 4.10 and Table 4.6).
The ‘Digital Doorway Home’ or DDhomepage, presents users with information about the DD
project, and links to various content resources. In addition, a user feedback mechanism allows
users to key in opinions of the DD experience and suggest additional content to be included.
This feedback is logged, and transmitted to the DD developers.
58 Chapter 4 – The Digital Doorway intervention – background information
Figure 4.8: Top view, showing the server and client positions
top
Server
Client 2
Client 1
Reset Board
Door
top view

Table 4.5: Programs menu, first-tier items and categories
DDhomepage
File-manager
Web-cam
Edutainment/
Office/
Games/
Internet/
Science/
Run Custom Program
Information on the project, user feedback form and links to popular resources
Application to allow navigation of all files on the DD
Simple web-cam viewing application
Sub menu containing edutainment applications
Sub menu containing office applications (e.g., word processor, spreadsheet)
Sub menu containing games
Sub menu containing Firefox browser and applications for inter-DD comms
Sub menu containing science simulations and various science applications
Quick launcher for any program whose name is known to the user
Table 4.6: Resources menu (first-tier)
Mindset
Simulations
Wikipedia
Agriculture/
AudioBooks/
Computers/
Crafts/
Fun/
Health+Safety/
Literature/
RealWorld/
Science/
Curriculum-based content (grades 10-12)
Science simulations, direct link
Encyclopaedia, direct link
Sub menu of agricultural documents
Sub menu of audio clips
Sub menu of computer-programming documents
Sub menu of craft related documents
Sub menu of various fun documents and movies
Sub menu of electricity safety and health information
Sub menu of literature resources
Sub menu of documents related to employment and policies
Sub menu of science documents and videos
Chapter 4 – The Digital Doorway intervention – background information 59
Figure 4.10: First-tier ‘Resources’ menu
Figure 4.9: First-tier ‘Programs’ menu

4.11 Context of use
This section describes the environmental factors and requirements present at a typical DD
installation site. Environmental requirements – context of use – of a human-computer system
are described by Sharp, Preece and Rogers (2007), and comprise four components, namely:
i) Physical environment;
ii) Social environment;
iii) Organisational environment; and
iv) Technical environment.
These are used as sub-headers to structure the discussion following.
4.11.1 Physical environment
The physical environment in which a DD is located is typically on a verandah of a public
building (such as a library, school or post office), and therefore exposed to dust and high
temperatures on hot days. The area immediately around the device may become crowded (see
Figure 4.11, captured from a security camera video) and noisy, affecting usage, both in terms
of content choice and the ability of a user to absorb information.
The plexi-glass protective screens over the LCD screens pick up dirt and scratches over time
and result in reduced screen visibility. Certain terminals facing outwards from a verandah are
effected by sunlight reflecting off the screens during the day, reducing visibility and
60 Chapter 4 – The Digital Doorway intervention – background information
Figure 4.11: Space is at a premium at the single terminal device.

consequently the physical usability of the content. This impacts negatively on usage and on
the ability of users to control their DD experience,
The image in Figure 4.12 below shows an extreme case of poor visibility affecting usage and
usability, while Figure 4.13 shows the wear and tear on the keyboard and touch-pad after a
number of years in the field. Figure 4.13 is also a good indication that the DD is being well
used. The four arrow keys, enter key, and left touch-pad button are the most worn, while the
blue powder coating around the edge of the keyboard has been worn off by hands repeatedly
rubbing against it.
4.11.2 Social environment
The social environment, especially during the first few weeks of installation of a new DD, is
typically one of crowded, interested collaboration. Younger users tend to jostle each other for
position and an opportunity to use the
device. Older users are more cautious and
likely to request instruction from a site
administrator (or researcher).
In Figure 4.14 we observe how children
(mostly females in this instance) crowd
around the single terminal device in Cwili,
while the official site champion (or
caretaker), looks on and provides some
verbal assistance.
Chapter 4 – The Digital Doorway intervention – background information 61
Figure 4.12: Visibility of content reduced by reflections off a scratched and dirty screen. Figure 4.13: Wear and tear on touch-pad
Figure 4.14: Children and community champion interact at the single terminal device
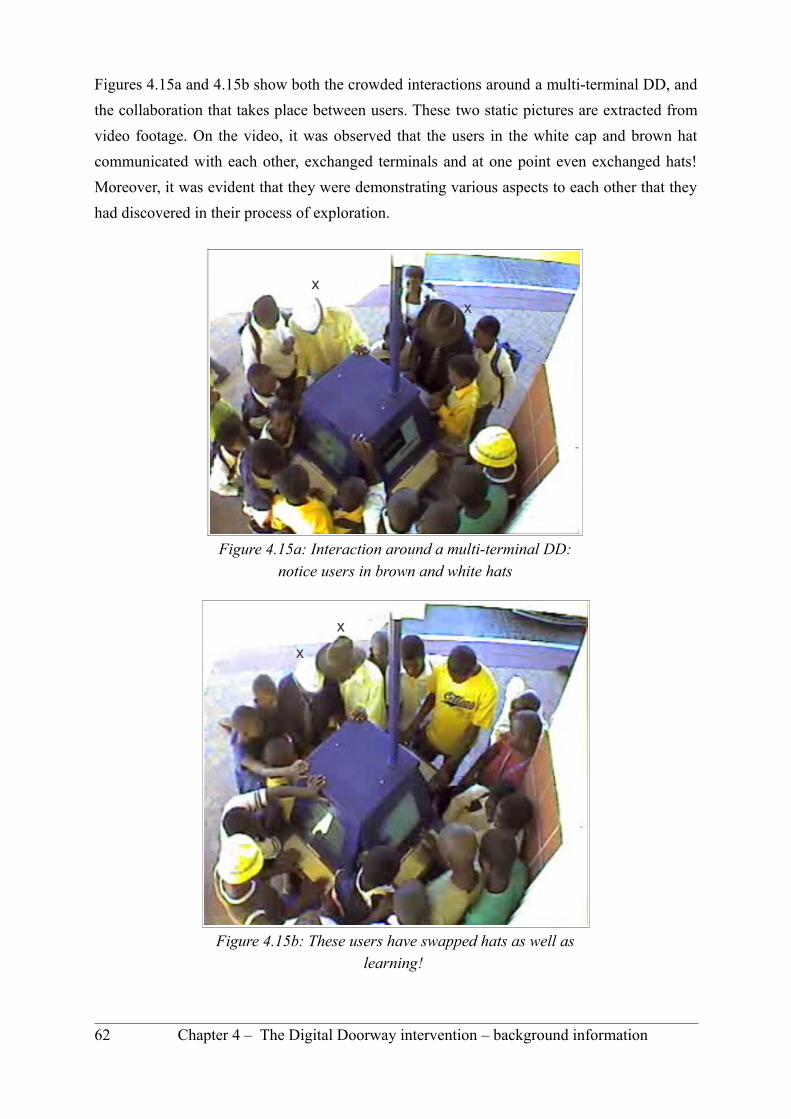
Figures 4.15a and 4.15b show both the crowded interactions around a multi-terminal DD, and
the collaboration that takes place between users. These two static pictures are extracted from
video footage. On the video, it was observed that the users in the white cap and brown hat
communicated with each other, exchanged terminals and at one point even exchanged hats!
Moreover, it was evident that they were demonstrating various aspects to each other that they
had discovered in their process of exploration.
62 Chapter 4 – The Digital Doorway intervention – background information
Figure 4.15a: Interaction around a multi-terminal DD: notice users in brown and white hats
Figure 4.15b: These users have swapped hats as well as learning!
xx
xx
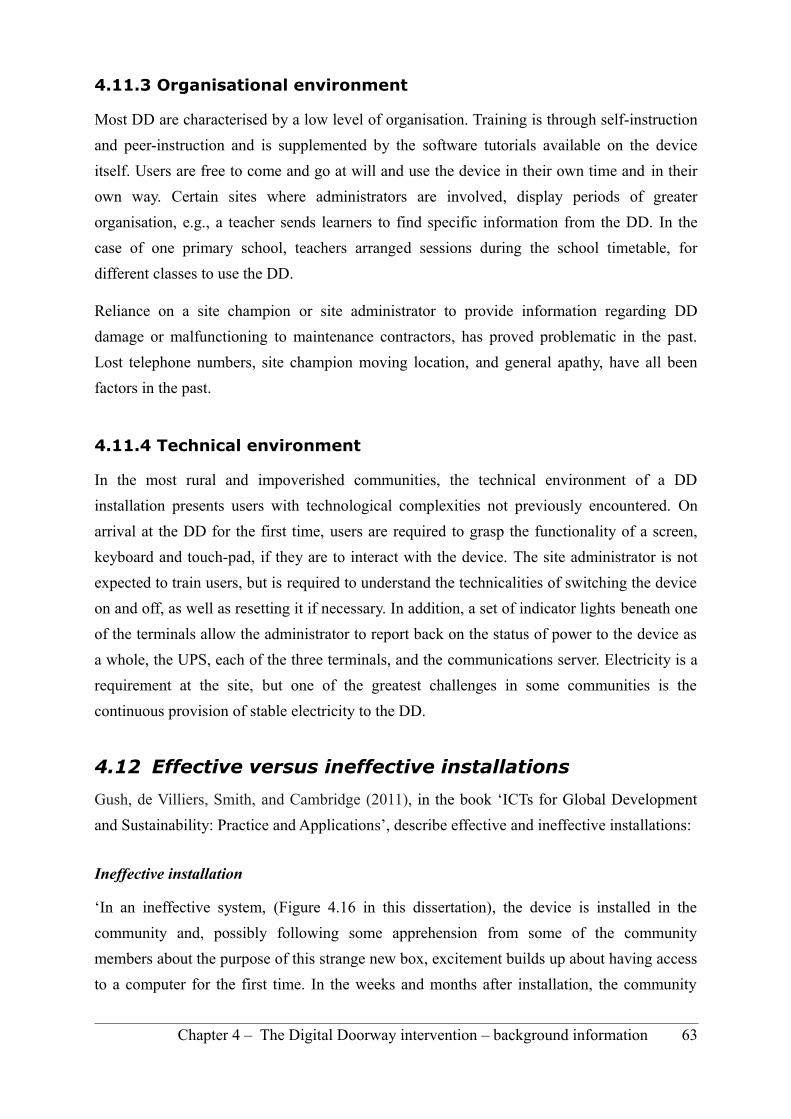
4.11.3 Organisational environment
Most DD are characterised by a low level of organisation. Training is through self-instruction
and peer-instruction and is supplemented by the software tutorials available on the device
itself. Users are free to come and go at will and use the device in their own time and in their
own way. Certain sites where administrators are involved, display periods of greater
organisation, e.g., a teacher sends learners to find specific information from the DD. In the
case of one primary school, teachers arranged sessions during the school timetable, for
different classes to use the DD.
Reliance on a site champion or site administrator to provide information regarding DD
damage or malfunctioning to maintenance contractors, has proved problematic in the past.
Lost telephone numbers, site champion moving location, and general apathy, have all been
factors in the past.
4.11.4 Technical environment
In the most rural and impoverished communities, the technical environment of a DD
installation presents users with technological complexities not previously encountered. On
arrival at the DD for the first time, users are required to grasp the functionality of a screen,
keyboard and touch-pad, if they are to interact with the device. The site administrator is not
expected to train users, but is required to understand the technicalities of switching the device
on and off, as well as resetting it if necessary. In addition, a set of indicator lights beneath one
of the terminals allow the administrator to report back on the status of power to the device as
a whole, the UPS, each of the three terminals, and the communications server. Electricity is a
requirement at the site, but one of the greatest challenges in some communities is the
continuous provision of stable electricity to the DD.
4.12 Effective versus ineffective installations
Gush, de Villiers, Smith, and Cambridge (2011), in the book ‘ICTs for Global Development
and Sustainability: Practice and Applications’, describe effective and ineffective installations:
Ineffective installation
‘In an ineffective system, (Figure 4.16 in this dissertation), the device is installed in the
community and, possibly following some apprehension from some of the community
members about the purpose of this strange new box, excitement builds up about having access
to a computer for the first time. In the weeks and months after installation, the community
Chapter 4 – The Digital Doorway intervention – background information 63
becomes familiar with the device and if there is no updating of content – possible via a
satellite download – then users become bored and interest wanes. If there is no hardware
maintenance, eventually a component will fail and the community is left with a white
elephant. The resulting disillusionment of community members leaves the community in a
state worse than before the device was installed. ’ (Gush et al., 2011:117).
Effective installation
‘In an effective system, (Figure 4.17 in this dissertation), the content is updated regularly, and
proper system maintenance is carried out. Failing components are repaired or replaced within
a few days of failure. The community is involved from the outset and users take ownership of
the equipment (cleaning the device and surrounding area, advertising the fact that the DD
exists, informing maintenance teams of failures). The level of computer literacy of users
increases. Users regularly use the device both for learning and fact finding. Peer learning
takes place as knowledge is transferred between users. Proficient users are eventually able to
generate their own content and the device is an undisputed boon to the community.
Experience has shown that the DD sites which become ineffective over time, do so due to two
main reasons: firstly, hardware failure - due to a lack of adequate system maintenance and a
lack of community ‘ownership’ of the unit - and secondly, lack of new and stimulating
content. On the other hand, where community ownership, proper system maintenance and
relevant content updates are present, the site grows in popularity and becomes effective in
terms of ICT literacy and community engagement. ’ (Gush et al., 2011:118).
64 Chapter 4 – The Digital Doorway intervention – background information
Figure 4.16: Ineffective system (Gush et al., 2011)
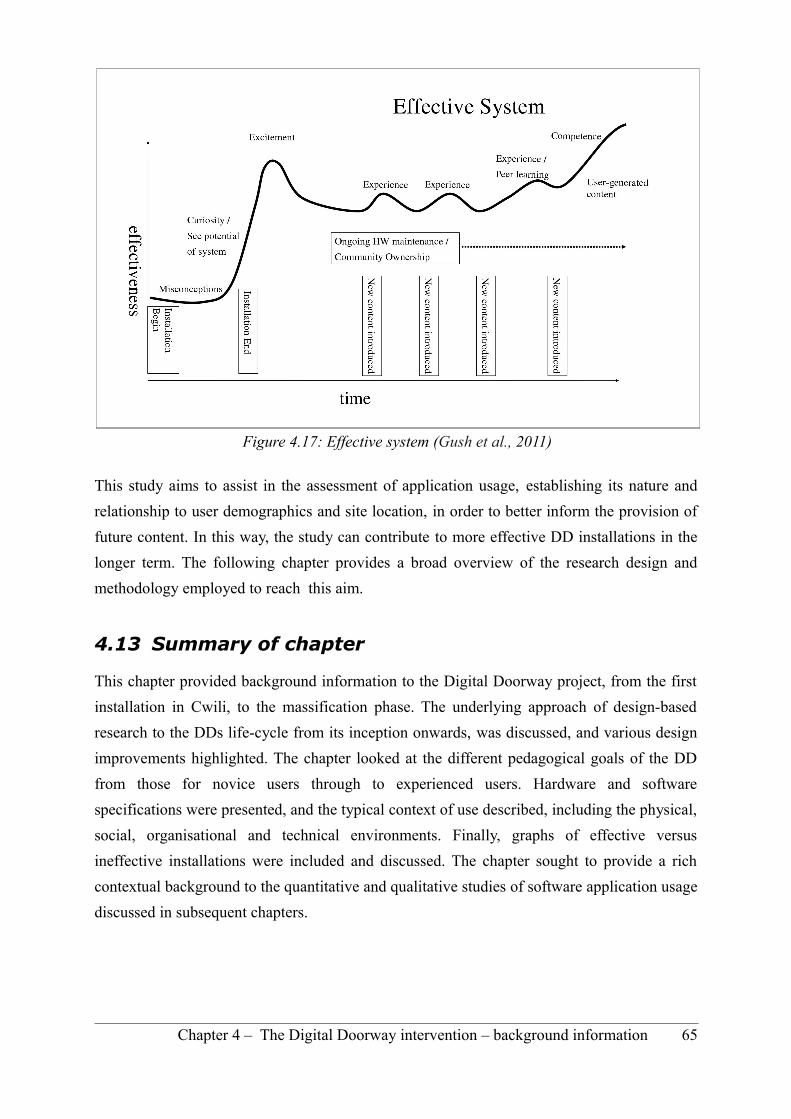
This study aims to assist in the assessment of application usage, establishing its nature and
relationship to user demographics and site location, in order to better inform the provision of
future content. In this way, the study can contribute to more effective DD installations in the
longer term. The following chapter provides a broad overview of the research design and
methodology employed to reach this aim.
4.13 Summary of chapter
This chapter provided background information to the Digital Doorway project, from the first
installation in Cwili, to the massification phase. The underlying approach of design-based
research to the DDs life-cycle from its inception onwards, was discussed, and various design
improvements highlighted. The chapter looked at the different pedagogical goals of the DD
from those for novice users through to experienced users. Hardware and software
specifications were presented, and the typical context of use described, including the physical,
social, organisational and technical environments. Finally, graphs of effective versus
ineffective installations were included and discussed. The chapter sought to provide a rich
contextual background to the quantitative and qualitative studies of software application usage
discussed in subsequent chapters.
Chapter 4 – The Digital Doorway intervention – background information 65
Figure 4.17: Effective system (Gush et al., 2011)

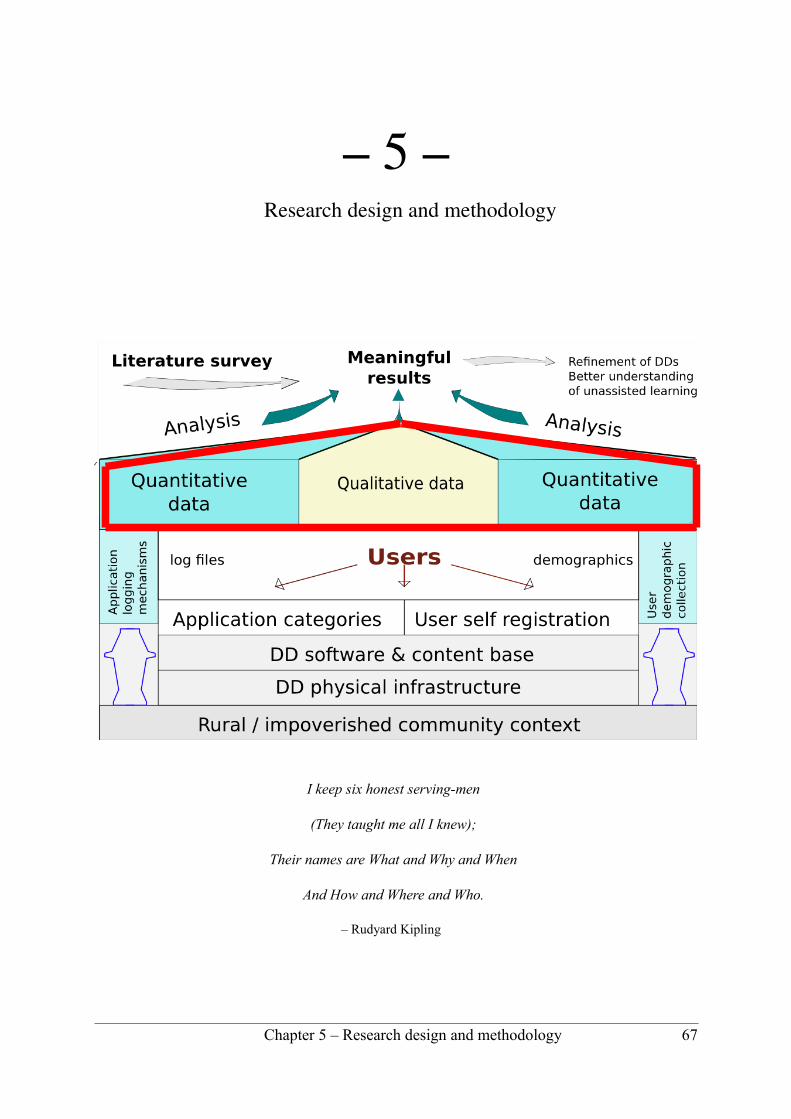
– 5 – Research design and methodology
I keep six honest serving-men
(They taught me all I knew);
Their names are What and Why and When
And How and Where and Who.
– Rudyard Kipling
Chapter 5 – Research design and methodology 67

5.1 Introduction
This chapter addresses the research design of the current study, detailing aspects of: overall
research design and process; research methods and methodologies; data collection methods
for both quantitative and qualitative components of the mixed-methods approach; site
selection for quantitative log file analysis; site and participant selection for qualitative studies;
categorisation of data; data cleaning approaches; and an overview of the data analysis
approaches. Sections 5.2 and 5.3 provide an overview of the research design, processes and
methods. Section 5.4 tabulates where, within the study, the research questions are addressed
directly. Section 5.5 outlines the quantitative study, while Section 5.6 outlines the qualitative
study.
5.2 Overall research design and process
The underlying research model of the study was presented in Section 1.4.2 (See Figure 1.4),
and is repeated here as Figure 5.1.
Using this framework as a guide, it emerges that this study contains the following elements:
Philosophical worldviews: The philosphical worldview could be described as advocacy/
participatory as well as pragmatic. It is of an advocacy/participatory nature in that there are
68 Chapter 5 – Research design and methodology
Figure 5.1: Research design, adapted from Creswell (2009:5)
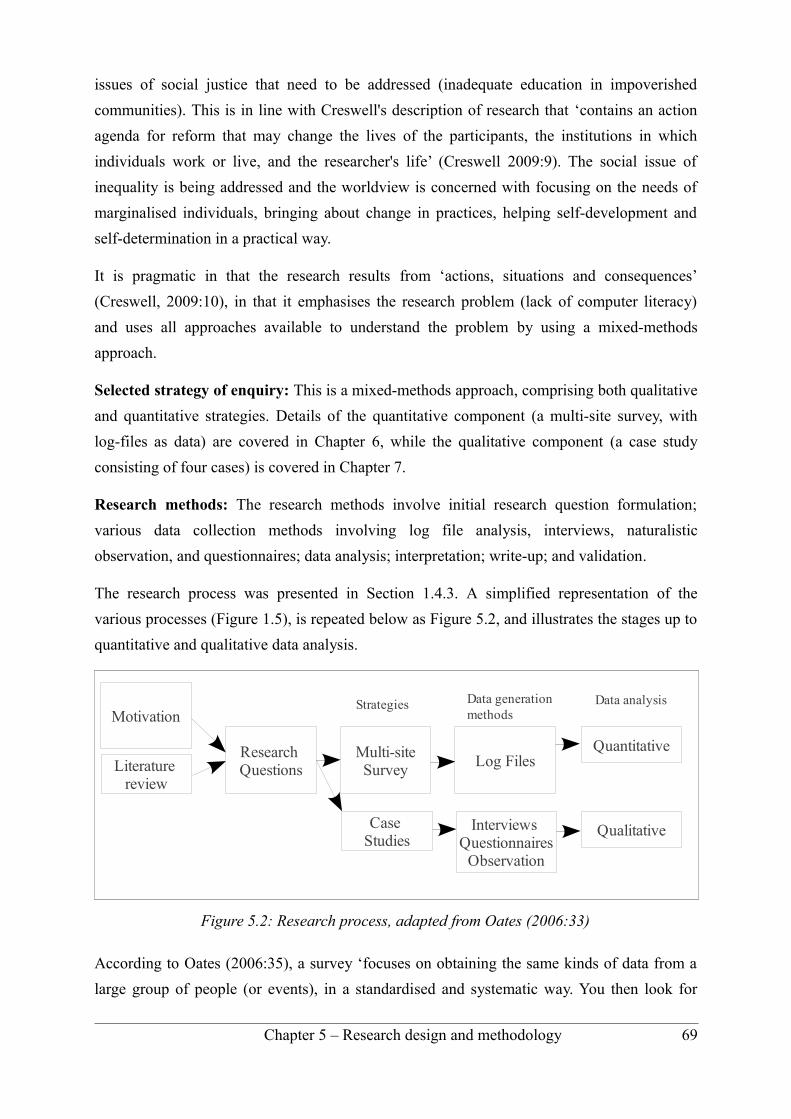
issues of social justice that need to be addressed (inadequate education in impoverished
communities). This is in line with Creswell's description of research that ‘contains an action
agenda for reform that may change the lives of the participants, the institutions in which
individuals work or live, and the researcher's life’ (Creswell 2009:9). The social issue of
inequality is being addressed and the worldview is concerned with focusing on the needs of
marginalised individuals, bringing about change in practices, helping self-development and
self-determination in a practical way.
It is pragmatic in that the research results from ‘actions, situations and consequences’
(Creswell, 2009:10), in that it emphasises the research problem (lack of computer literacy)
and uses all approaches available to understand the problem by using a mixed-methods
approach.
Selected strategy of enquiry: This is a mixed-methods approach, comprising both qualitative
and quantitative strategies. Details of the quantitative component (a multi-site survey, with
log-files as data) are covered in Chapter 6, while the qualitative component (a case study
consisting of four cases) is covered in Chapter 7.
Research methods: The research methods involve initial research question formulation;
various data collection methods involving log file analysis, interviews, naturalistic
observation, and questionnaires; data analysis; interpretation; write-up; and validation.
The research process was presented in Section 1.4.3. A simplified representation of the
various processes (Figure 1.5), is repeated below as Figure 5.2, and illustrates the stages up to
quantitative and qualitative data analysis.
According to Oates (2006:35), a survey ‘focuses on obtaining the same kinds of data from a
large group of people (or events), in a standardised and systematic way. You then look for
Chapter 5 – Research design and methodology 69
Figure 5.2: Research process, adapted from Oates (2006:33)
Literature review
Research Questions
Case Studies
Strategies Data generation methods
Log FilesMulti-siteSurvey
Interviews Questionnaires
Observation
Data analysis
Quantitative
Qualitative
Motivation
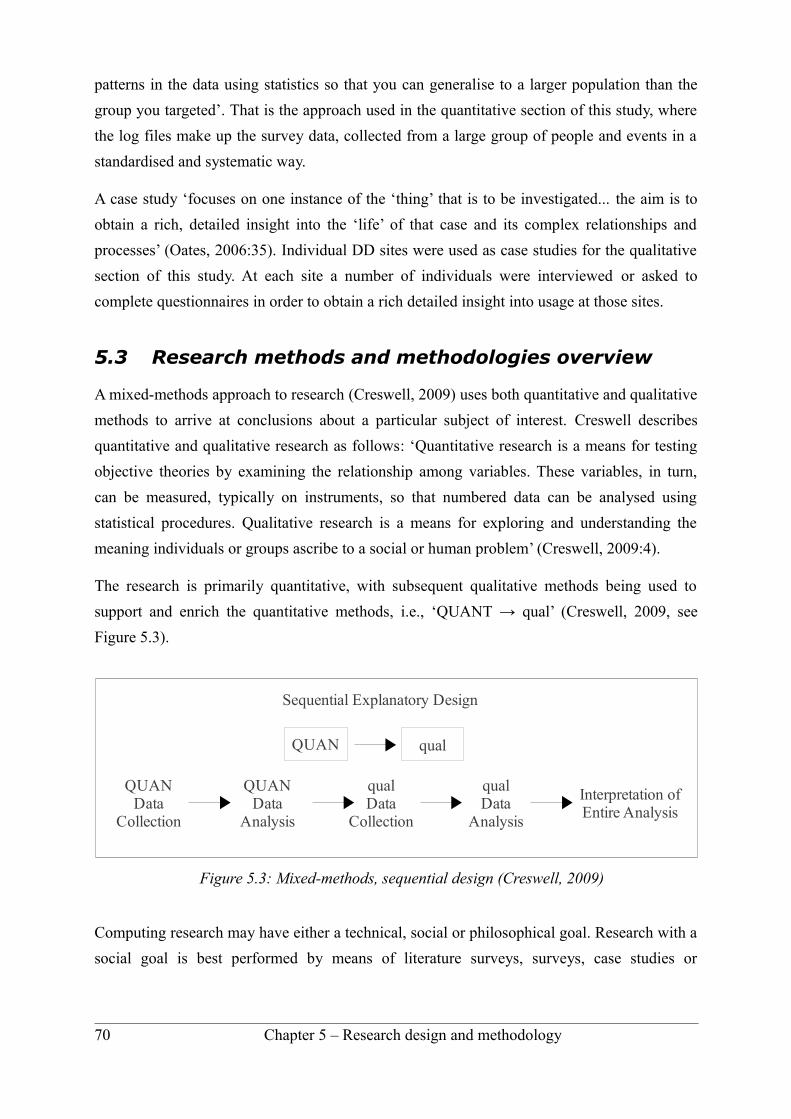
patterns in the data using statistics so that you can generalise to a larger population than the
group you targeted’. That is the approach used in the quantitative section of this study, where
the log files make up the survey data, collected from a large group of people and events in a
standardised and systematic way.
A case study ‘focuses on one instance of the ‘thing’ that is to be investigated... the aim is to
obtain a rich, detailed insight into the ‘life’ of that case and its complex relationships and
processes’ (Oates, 2006:35). Individual DD sites were used as case studies for the qualitative
section of this study. At each site a number of individuals were interviewed or asked to
complete questionnaires in order to obtain a rich detailed insight into usage at those sites.
5.3 Research methods and methodologies overview
A mixed-methods approach to research (Creswell, 2009) uses both quantitative and qualitative
methods to arrive at conclusions about a particular subject of interest. Creswell describes
quantitative and qualitative research as follows: ‘Quantitative research is a means for testing
objective theories by examining the relationship among variables. These variables, in turn,
can be measured, typically on instruments, so that numbered data can be analysed using
statistical procedures. Qualitative research is a means for exploring and understanding the
meaning individuals or groups ascribe to a social or human problem’ (Creswell, 2009:4).
The research is primarily quantitative, with subsequent qualitative methods being used to
support and enrich the quantitative methods, i.e., ‘QUANT → qual’ (Creswell, 2009, see
Figure 5.3).
Figure 5.3: Mixed-methods, sequential design (Creswell, 2009)
Computing research may have either a technical, social or philosophical goal. Research with a
social goal is best performed by means of literature surveys, surveys, case studies or
70 Chapter 5 – Research design and methodology
Sequential Explanatory Design
QUAN qual
QUANData
Collection
QUANData
Analysis
qualData
Collection
qualData
Analysis
Interpretation of Entire Analysis
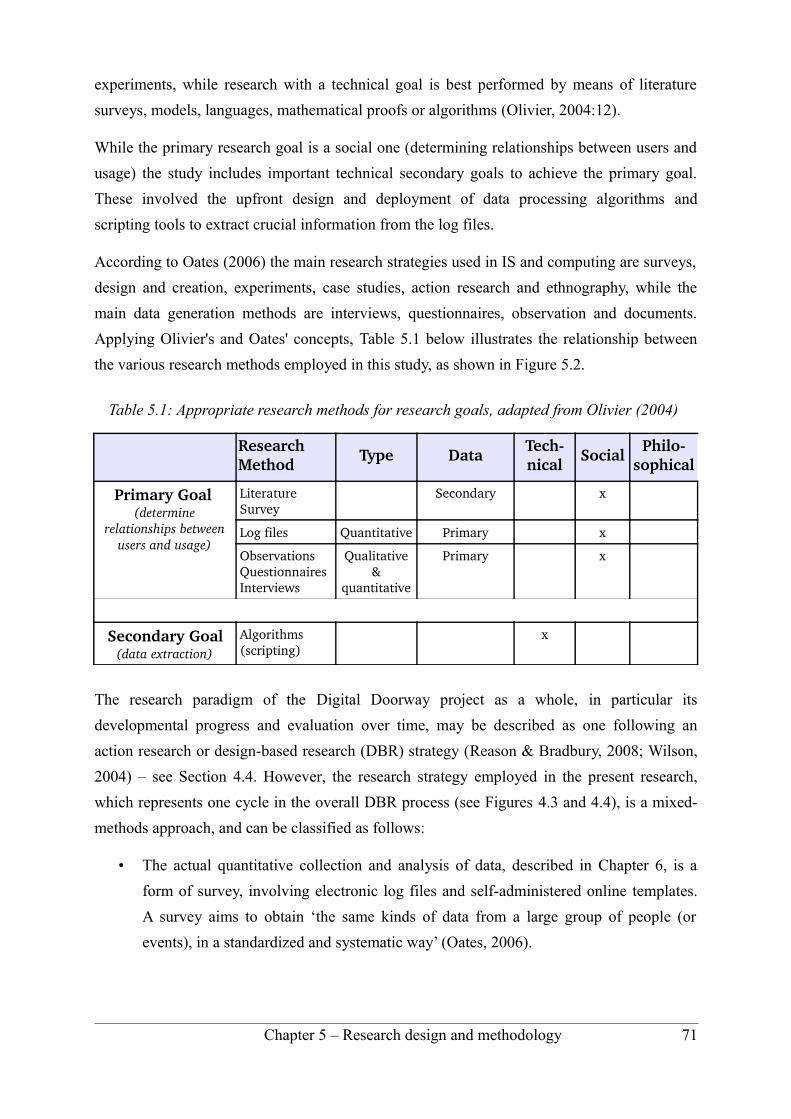
experiments, while research with a technical goal is best performed by means of literature
surveys, models, languages, mathematical proofs or algorithms (Olivier, 2004:12).
While the primary research goal is a social one (determining relationships between users and
usage) the study includes important technical secondary goals to achieve the primary goal.
These involved the upfront design and deployment of data processing algorithms and
scripting tools to extract crucial information from the log files.
According to Oates (2006) the main research strategies used in IS and computing are surveys,
design and creation, experiments, case studies, action research and ethnography, while the
main data generation methods are interviews, questionnaires, observation and documents.
Applying Olivier's and Oates' concepts, Table 5.1 below illustrates the relationship between
the various research methods employed in this study, as shown in Figure 5.2.
Table 5.1: Appropriate research methods for research goals, adapted from Olivier (2004)
Research Method Type Data Tech
nical Social Philosophical
Primary Goal (determine
relationships between users and usage)
Literature Survey
Secondary x
Log files Quantitative Primary x
ObservationsQuestionnairesInterviews
Qualitative &
quantitative
Primary x
Secondary Goal (data extraction)
Algorithms(scripting)
x
The research paradigm of the Digital Doorway project as a whole, in particular its
developmental progress and evaluation over time, may be described as one following an
action research or design-based research (DBR) strategy (Reason & Bradbury, 2008; Wilson,
2004) – see Section 4.4. However, the research strategy employed in the present research,
which represents one cycle in the overall DBR process (see Figures 4.3 and 4.4), is a mixed-
methods approach, and can be classified as follows:
• The actual quantitative collection and analysis of data, described in Chapter 6, is a
form of survey, involving electronic log files and self-administered online templates.
A survey aims to obtain ‘the same kinds of data from a large group of people (or
events), in a standardized and systematic way’ (Oates, 2006).
Chapter 5 – Research design and methodology 71
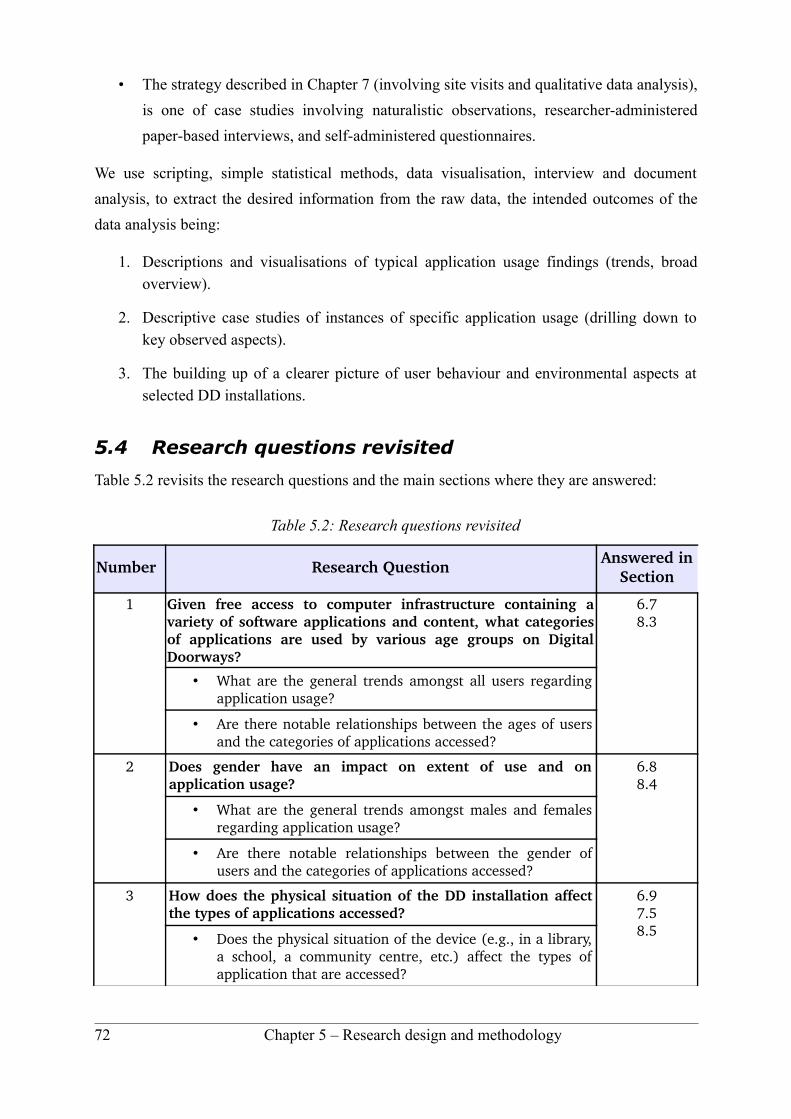
• The strategy described in Chapter 7 (involving site visits and qualitative data analysis),
is one of case studies involving naturalistic observations, researcher-administered
paper-based interviews, and self-administered questionnaires.
We use scripting, simple statistical methods, data visualisation, interview and document
analysis, to extract the desired information from the raw data, the intended outcomes of the
data analysis being:
1. Descriptions and visualisations of typical application usage findings (trends, broad overview).
2. Descriptive case studies of instances of specific application usage (drilling down to key observed aspects).
3. The building up of a clearer picture of user behaviour and environmental aspects at selected DD installations.
5.4 Research questions revisited
Table 5.2 revisits the research questions and the main sections where they are answered:
Table 5.2: Research questions revisited
Number Research Question Answered in Section
1 Given free access to computer infrastructure containing a variety of software applications and content, what categories of applications are used by various age groups on Digital Doorways?
6.78.3
• What are the general trends amongst all users regarding application usage?
• Are there notable relationships between the ages of users and the categories of applications accessed?
2 Does gender have an impact on extent of use and on application usage?
6.88.4
• What are the general trends amongst males and females regarding application usage?
• Are there notable relationships between the gender of users and the categories of applications accessed?
3 How does the physical situation of the DD installation affect the types of applications accessed?
6.97.58.5• Does the physical situation of the device (e.g., in a library,
a school, a community centre, etc.) affect the types of application that are accessed?
72 Chapter 5 – Research design and methodology

• Which applications are underutilised by the intended target groups?
• Are there noticeable differences in behaviour around, and usage of, DDs at varying localities?
• What is the impact of the site environment on the physical usage?
4 What is the relevance and applicability of these results to future unassisted learning terminals?
6.107.68.68.8
• Do the results of RQ1, RQ2 and RQ3 help in better understanding the desires and needs of target users?
• What lessons are learned for future development, selection and presentation of applications?
5.5 Quantitative study
This section details the steps taken, and tools created, to do quantitative data analysis on
application usage on the DDs. Section 5.5.1 gives a broad overview of the process and
outlines the main steps necessary to process the available log files. Section 5.5.2 explains the
data collection process, and Section 5.5.3 describes the categorisation of data elements.
Section 5.5.4 highlights the process of selecting specific sites to investigate in this study
Finally, Section 5.5.5 overviews the key elements in the quantitative analysis of the data.
5.5.1 Quantitative data processing, overview
Over the years, large quantities of DD data on user demographics and application usage have
been recorded by various means, including electronic log files and user-generated infor-
mation. A huge volume of information is available from the 200+ sites, most of it formally
extracted since 2007 or 2008 (see Table 6.4), although many sites have been in operation
considerably longer. In addition to the complexity of processing thousands of lines of log
files, a further complexity was presented by the heterogeneity due to varying types and
structures of data stored in these logs.
The log file analysis set out to quantitatively answer the first three research questions of the
study, listed in Section 5.4 – regarding application usage data and its relation to user
demographics, as well as provide data to help answer Research Question 4. The purpose is to
better understand both the user base and interaction with the systems. The quantitative study
also aimed to draw out further research questions that could subsequently be answered
through the qualitative research covered in Chapter 7. However, before the data could be
effectively used, various sub-processes had to be conducted.
Chapter 5 – Research design and methodology 73
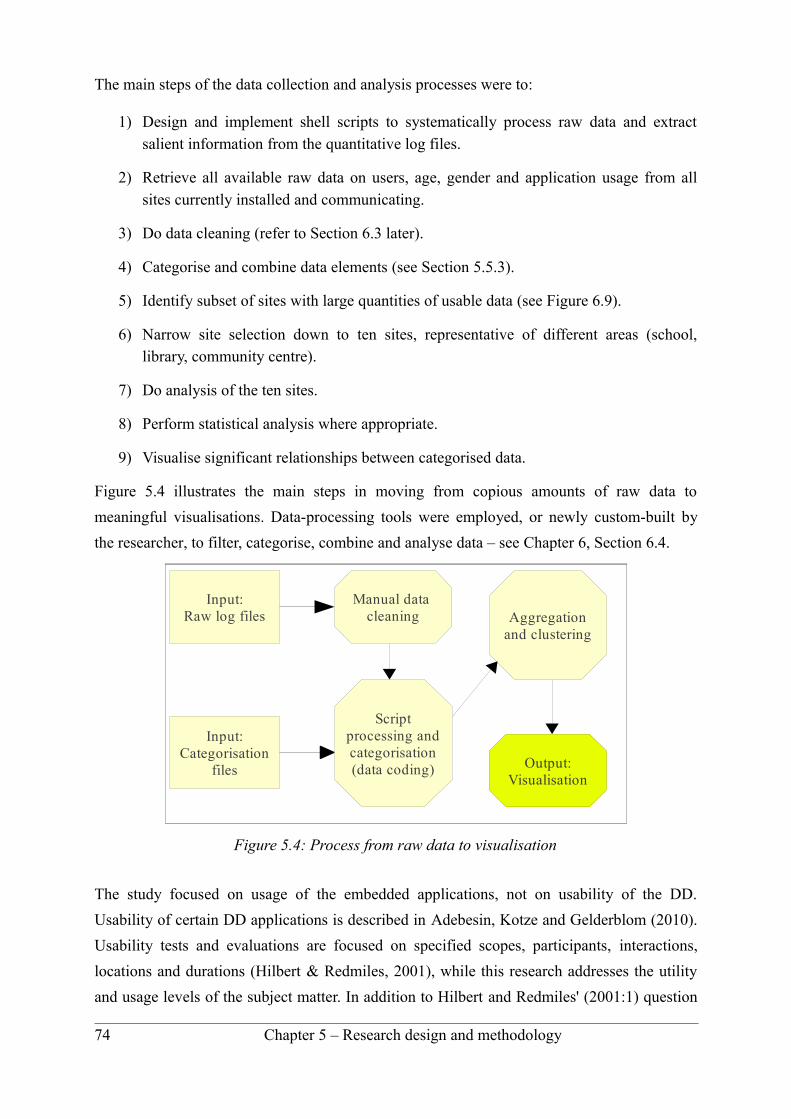
The main steps of the data collection and analysis processes were to:
1) Design and implement shell scripts to systematically process raw data and extract salient information from the quantitative log files.
2) Retrieve all available raw data on users, age, gender and application usage from all sites currently installed and communicating.
3) Do data cleaning (refer to Section 6.3 later).
4) Categorise and combine data elements (see Section 5.5.3).
5) Identify subset of sites with large quantities of usable data (see Figure 6.9).
6) Narrow site selection down to ten sites, representative of different areas (school, library, community centre).
7) Do analysis of the ten sites.
8) Perform statistical analysis where appropriate.
9) Visualise significant relationships between categorised data.
Figure 5.4 illustrates the main steps in moving from copious amounts of raw data to
meaningful visualisations. Data-processing tools were employed, or newly custom-built by
the researcher, to filter, categorise, combine and analyse data – see Chapter 6, Section 6.4.
The study focused on usage of the embedded applications, not on usability of the DD.
Usability of certain DD applications is described in Adebesin, Kotze and Gelderblom (2010).
Usability tests and evaluations are focused on specified scopes, participants, interactions,
locations and durations (Hilbert & Redmiles, 2001), while this research addresses the utility
and usage levels of the subject matter. In addition to Hilbert and Redmiles' (2001:1) question
74 Chapter 5 – Research design and methodology
Figure 5.4: Process from raw data to visualisation
Input:Raw log files
Manual data cleaning
Scriptprocessing andcategorisation(data coding)
Input:Categorisation
files
Aggregationand clustering
Output:Visualisation

of ‘Where should scarce design, implementation, testing, and usability evaluation resources
be focused in order to produce the greatest benefit for users?’ one can also enquire: ‘Where
should Digital Doorway content resources be focused to produce the greatest benefit for
users?’ (Gush and de Villiers, 2010). This study will assist in the focusing of such resources,
for the future benefit of users.
5.5.2 Quantitative data collection
As explained in the previous subsection, data for the quantitative study was retrieved from log
files of a subset of ten of all current sites. Each DD has mechanisms for the collection and
transfer of log files of user details and application usage statistics. This user demographic
information is collected through a ‘self-registration’ procedure, whereby a user can create a
unique user name and enter details of name, age, gender, home language and preferred
language, into a registration template. Users are also able to log in as ‘guest users’. All user-
created files saved by guest users are erased daily, however, all application logs, including hits
by both guest- and registered users, are stored for later retrieval. Application log files for guest
users are many times larger than those for registered users, however, unlike the latter, guest
files are not linked to age and gender data, and therefore cannot be used for analysis involving
age and gender. Guest logs are still valuable for analysis involving location.
Each application on the Digital Doorway is launched from a wrapper script that records the
time of launch and user name of the person launching it. This information is stored in a text
file on the server. All log files are compressed and transmitted daily via GPRS (cellular)
backbone to a central server. This collection of compressed log files from all sites can be
analysed to provide insight into application usage, especially with regard to general trends and
preferences (Gush, 2008). Section 6.2 provides greater detail on the data collection process.
5.5.3 Categorisation of quantitative data
According to Olivier (2004), the creation of categories, in and of itself, is a form of
interpretation. In total there were over 5300 registered users and over one million application
launches (hit-counts) by users, distributed over all of the DD sites, in the two years for which
data was logged. To make the large quantities of data manageable, applications and ages were
grouped into categories, and a selection (of the total possible sites), chosen for this study.
Chapter 5 – Research design and methodology 75
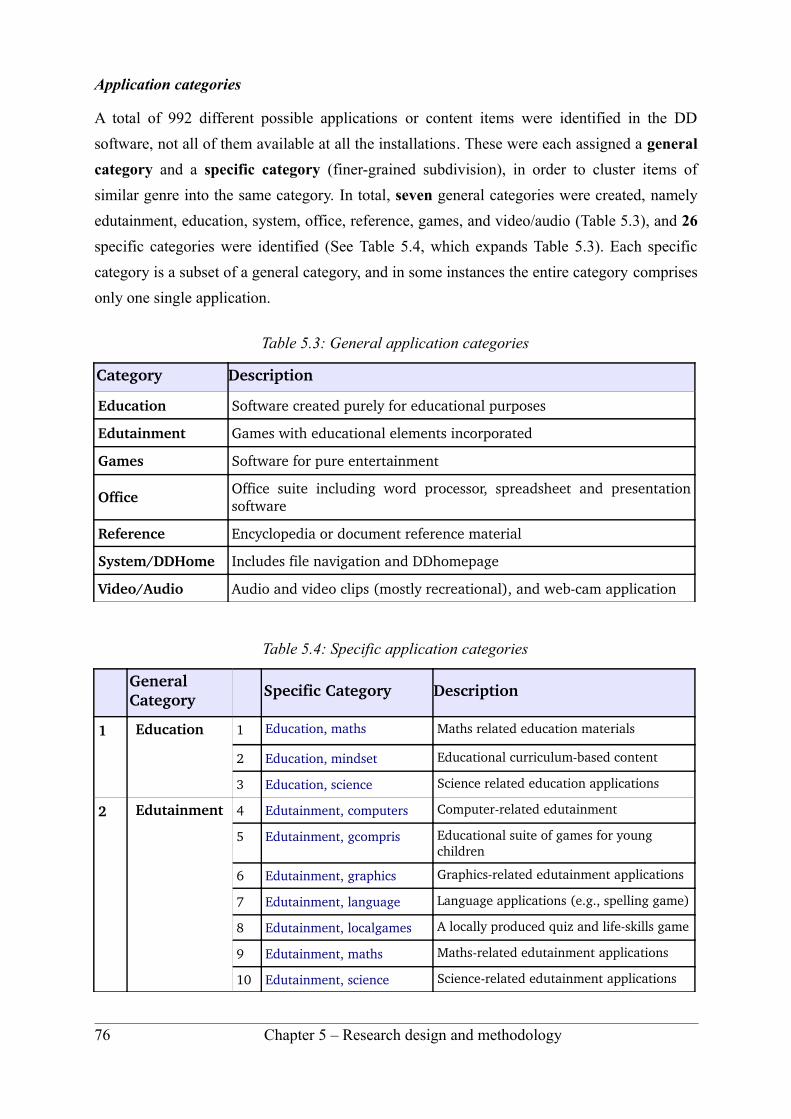
Application categories
A total of 992 different possible applications or content items were identified in the DD
software, not all of them available at all the installations. These were each assigned a general
category and a specific category (finer-grained subdivision), in order to cluster items of
similar genre into the same category. In total, seven general categories were created, namely
edutainment, education, system, office, reference, games, and video/audio (Table 5.3), and 26
specific categories were identified (See Table 5.4, which expands Table 5.3). Each specific
category is a subset of a general category, and in some instances the entire category comprises
only one single application.
Table 5.3: General application categories
Category Description
Education Software created purely for educational purposes
Edutainment Games with educational elements incorporated
Games Software for pure entertainment
Office Office suite including word processor, spreadsheet and presentation software
Reference Encyclopedia or document reference material
System/DDHome Includes file navigation and DDhomepage
Video/Audio Audio and video clips (mostly recreational), and webcam application
Table 5.4: Specific application categories
General Category Specific Category Description
1 Education 1 Education, maths Maths related education materials
2 Education, mindset Educational curriculumbased content
3 Education, science Science related education applications
2 Edutainment 4 Edutainment, computers Computerrelated edutainment
5 Edutainment, gcompris Educational suite of games for young children
6 Edutainment, graphics Graphicsrelated edutainment applications
7 Edutainment, language Language applications (e.g., spelling game)
8 Edutainment, localgames A locally produced quiz and lifeskills game
9 Edutainment, maths Mathsrelated edutainment applications
10 Edutainment, science Sciencerelated edutainment applications
76 Chapter 5 – Research design and methodology
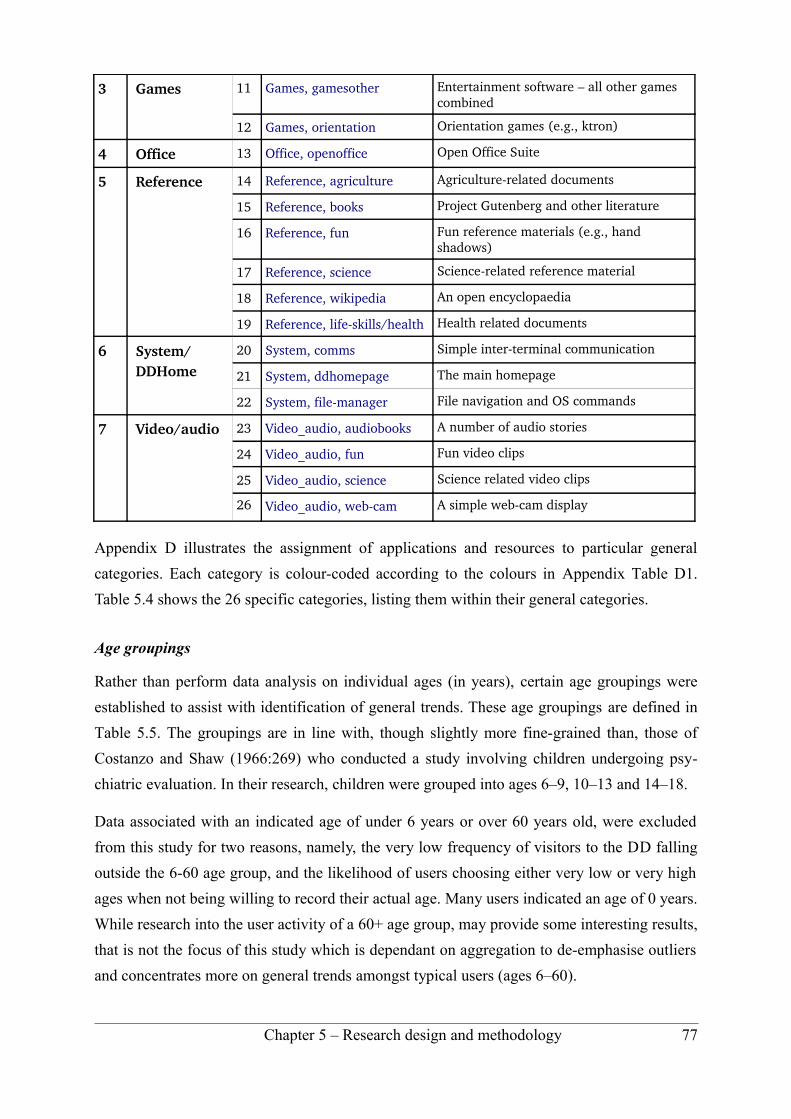
3 Games 11 Games, gamesother Entertainment software – all other games combined
12 Games, orientation Orientation games (e.g., ktron)
4 Office 13 Office, openoffice Open Office Suite
5 Reference 14 Reference, agriculture Agriculturerelated documents
15 Reference, books Project Gutenberg and other literature
16 Reference, fun Fun reference materials (e.g., hand shadows)
17 Reference, science Sciencerelated reference material
18 Reference, wikipedia An open encyclopaedia
19 Reference, lifeskills/health Health related documents
6 System/DDHome
20 System, comms Simple interterminal communication
21 System, ddhomepage The main homepage
22 System, filemanager File navigation and OS commands
7 Video/audio 23 Video_audio, audiobooks A number of audio stories
24 Video_audio, fun Fun video clips
25 Video_audio, science Science related video clips
26 Video_audio, webcam A simple webcam display
Appendix D illustrates the assignment of applications and resources to particular general
categories. Each category is colour-coded according to the colours in Appendix Table D1.
Table 5.4 shows the 26 specific categories, listing them within their general categories.
Age groupings
Rather than perform data analysis on individual ages (in years), certain age groupings were
established to assist with identification of general trends. These age groupings are defined in
Table 5.5. The groupings are in line with, though slightly more fine-grained than, those of
Costanzo and Shaw (1966:269) who conducted a study involving children undergoing psy-
chiatric evaluation. In their research, children were grouped into ages 6–9, 10–13 and 14–18.
Data associated with an indicated age of under 6 years or over 60 years old, were excluded
from this study for two reasons, namely, the very low frequency of visitors to the DD falling
outside the 6-60 age group, and the likelihood of users choosing either very low or very high
ages when not being willing to record their actual age. Many users indicated an age of 0 years.
While research into the user activity of a 60+ age group, may provide some interesting results,
that is not the focus of this study which is dependant on aggregation to de-emphasise outliers
and concentrates more on general trends amongst typical users (ages 6–60).
Chapter 5 – Research design and methodology 77

Table 5.5: Age groupings and age codes
Description Age range
Typical junior primary school learners 6–9
Typical senior primary school learners 10–13
Typical secondary school learners 14–17
Postschool and tertiary level (FET College) learners 18–21
Young adults 22–25
Older adults 26–60
Gender groupings
There are three gender groupings: male, female and unspecified. The user registration form
had unspecified as the default value, and users had the option of either specifying a gender or
not.
Location groupings
Four location groupings were selected, namely: schools; libraries; FET Colleges; and public
locations (MPCC, informal market etc.). See Section 6.6.1.
5.5.4 Selection of sites for quantitative study
The analysis of complete sets of logged data from multiple sites and multiple end-users
affords opportunities to identify aggregated trends and occurrences (Gush and de Villiers,
2010). The overall aim of the log file analysis was to gain a representative snapshot of the
nature and extent of usage of the software applications provided with DD terminals and to
investigate how usage relates to user demographics. To this end, a small, but heterogeneous
and representative, set of locations and sites was selected for in-depth quantitative
investigation. The sites were selected using purposive sampling (Oates, 2006), chosen to
provide a representative sample of sites that were likely to generate valuable data. With this
goal, the following criteria were established to select ten sites from the approximately 210
operational DD sites in South Africa (see Section 6.6.1):
• Site diversity in terms of type of venue (library, community centre, school etc.);
• Numbers of registered users per site – sites with the highest numbers;
• Hit-counts per user – highest hit-counts;
• Region – both rural and township;
• Geographical – multiple provinces.
78 Chapter 5 – Research design and methodology
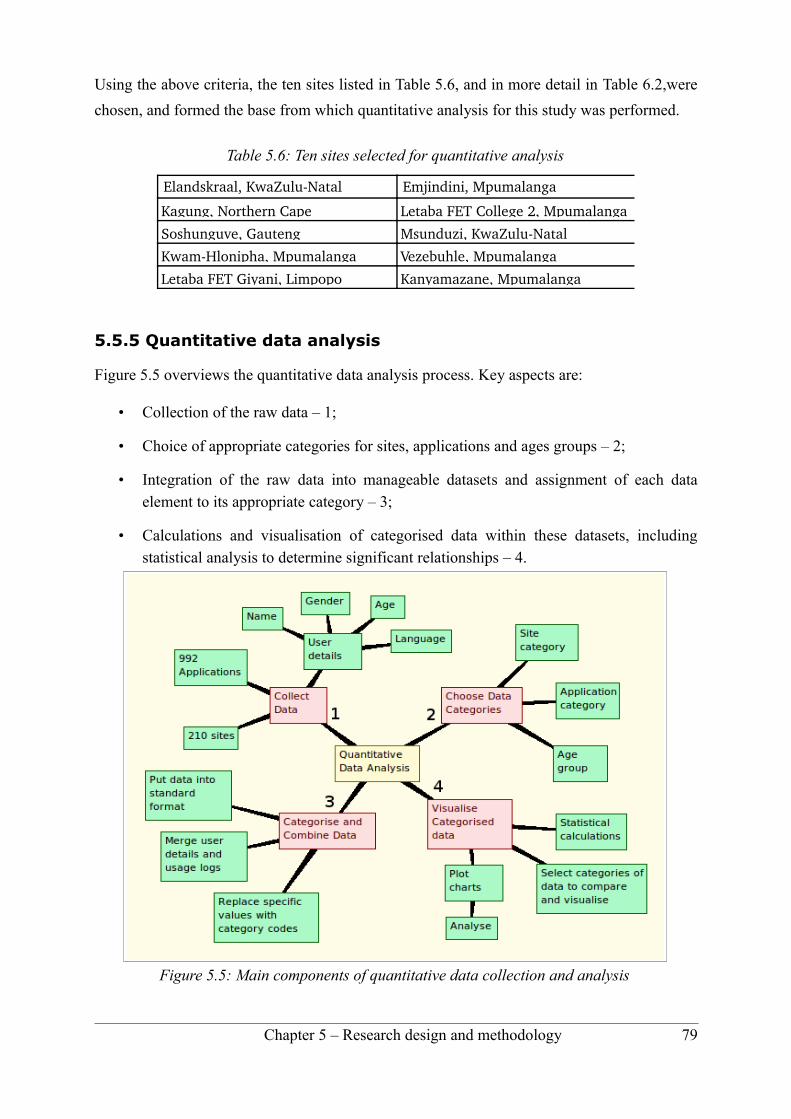
Using the above criteria, the ten sites listed in Table 5.6, and in more detail in Table 6.2,were
chosen, and formed the base from which quantitative analysis for this study was performed.
Table 5.6: Ten sites selected for quantitative analysis
Elandskraal, KwaZuluNatal Emjindini, Mpumalanga
Kagung, Northern Cape Letaba FET College 2, Mpumalanga
Soshunguve, Gauteng Msunduzi, KwaZuluNatal
KwamHlonipha, Mpumalanga Vezebuhle, Mpumalanga
Letaba FET Giyani, Limpopo Kanyamazane, Mpumalanga
5.5.5 Quantitative data analysis
Figure 5.5 overviews the quantitative data analysis process. Key aspects are:
• Collection of the raw data – 1;
• Choice of appropriate categories for sites, applications and ages groups – 2;
• Integration of the raw data into manageable datasets and assignment of each data element to its appropriate category – 3;
• Calculations and visualisation of categorised data within these datasets, including statistical analysis to determine significant relationships – 4.
Chapter 5 – Research design and methodology 79
Figure 5.5: Main components of quantitative data collection and analysis
5.6 Qualitative study
This section details the steps taken to do qualitative data collection and analysis on
application usage and user behaviour at selected DDs. The qualitative data from these case
studies, involving naturalistic observations, interviews and questionnaires, was used in
conjunction with quantitative data from the log files, to form a detailed holistic view of
application usage at the sites. Section 5.6.1 gives an overview of the research methods used in
the qualitative study. Section 5.6.2 discusses the selection of sites and participants, while
Section 5.6.3 presents the methods used in data collection. Finally, Section 5.6.4 covers the
qualitative data analysis approach.
5.6.1 Research methods for qualitative data, overview
‘Qualitative research is a means for exploring and understanding the meaning individuals or
groups ascribe to a social or human problem. The process of research involves emerging
questions and procedures, data typically collected in the participant's setting, data analysis
inductively building from particulars to general themes, and the researcher making
interpretations of the meaning of the data’ (Creswell 2009:4).
The present qualitative study entailed performing site visits to selected DD installations, and
completing semi-structured interviews and researcher-assisted questionnaires, with users of
DD terminals, in order to get first hand reports of application usage. Naturalistic observation
was used to supplement findings from the other methods.
A further purpose of the site visits was to clarify certain issues arising from the quantitative
log file analysis, and to serve as a means of validating particular demographic data (e.g.,
average age of users) obtained from the log files. Furthermore, the study provided valuable
information on the physical environments, and situations encountered by users on a day-to-
day basis.
A further source of qualitative data was the user comments from the online feedback
mechanism mentioned in Section 4.10. These are included in Section 7.6.
5.6.2 Selection of sites and participants for qualitative study
Four heterogeneous sites were selected using both convenience sampling (site 1), and
purposive sampling (sites 2, 3 & 4) (Oates, 2006). Participants were selected using a
combination of convenience sampling, and snowball sampling (Oates, 2006) as participants,
in turn, found other users in the area who also came to the site and took part in the study.
80 Chapter 5 – Research design and methodology

The following four sites were chosen for the qualitative study (see Section 7.3):
• Site 1: Gatang High School, Mamelodi, Gauteng;
• Site 2: Soshanguve Fablab, Gauteng;
• Site 3: Emjindini Library, Mpumalanga;
• Site 4: Msunduzi Customer Care Centre, KwaZulu-Natal.
5.6.3 Qualitative data collection
At each site, a combination of semi-structured interviews, questionnaires, and observation,
was used to obtain data of user experience at the DDs.
According to Oates, (2006:188), in semi-structured interviews: ‘You have a list of themes to
be covered and questions you want to ask, but you are willing to change the order of questions
depending on the flow of the conversation and you might ask additional questions if your
interviewee brings up issues you had not prepared for. The interviewees are able to speak with
more detail on the issues you raise, and introduce issues of their own that they think relevant
to your themes’.
A questionnaire, on the other hand, is ‘a pre-defined set of questions assembled in a pre-
determined order... providing the researcher with data that can be analysed and interpreted’
(Oates, 2006:219). A researcher-administered questionnaire is a form of structured interview.
The intention at the sites was to conduct semi-structured interviews with administrators and
users of the DDs, based on a set of questions in an interview question template.
Observation at each involved the taking of field notes and photographs on site, with particular
attention to user activity and environmental factors (such as site position, locality, proximity
to schools, time of day, operational conditions, distractions/interferences etc.). These notes
and photographs were used to formulate the general site descriptions in Section 7.5.
Researcher notes from interviews, questionnaire data, and general observational data at the
sites, were used to build up a case study of four cases, one for each site. Data was collated
into a spreadsheet for ease of comparison.
5.6.4 Approach to the analysis of qualitative data
According to Creswell, qualitative data analysis involves a number of stages, namely:
preparing the data for analysis; analysing the data in different ways; reaching deeper and
deeper understanding of the data; representing the data in some way and finally interpreting
Chapter 5 – Research design and methodology 81
the larger meaning of the data (Creswell, 2009). Various qualitative analysis approaches exist,
and are outlined in the next paragraph, followed by an explication of the approach followed in
the present study.
Grounded theory has systematic steps that involve generating categories of information (open
coding), selecting a particular category and placing it within a theoretical model (axial
coding), and then developing a story from the interconnection of categories (selective coding)
(Creswell 2009). Case study and ethnography research involve a detailed description of the
environment or individuals, followed by the analysis of the data for themes and issues.
(Creswell, 2009). In their paper entitled ‘Theory building from cases: opportunities and
challenges’, Eisenhardt and Graebner provide the following description: ‘Case studies are
rich, empirical descriptions of particular instances of a phenomenon that are typically based
on a variety of data sources’ (Eisenhardt & Graebner, 2007, citing Yin, 1994). The central
idea of case study research is to use cases as a basis from which to develop theory. The
researcher recognises patterns of relationships within and across cases and from these
patterns, theory emerges. Case studies ‘emphasize the rich, real-world context in which the
phenomena occur’ (Eisenhardt & Graebner, 2007:25). Other qualitative analysis methods
include phenomeno-logical research and narrative research.
This study involves qualitative analysis, inspecting the data to identify the occurrence of
themes, and reporting on those themes as they relate to the research questions. Since four
distinctive sites were chosen, the analysis is a type of case study research. The particular
‘cases’, or sites, were selected both to highlight individual differences between sites, and find
commonalities in usage behaviour across sites.
Creswell emphasises the process of moving from specific details to more general
observations, involving multiple levels of analysis, highlighted in Figure 5.6.
As mentioned earlier, raw data was obtained through observation, questionnaires and
interviews. The data was recorded through photographs, in field notes and on the question
templates themselves. All this data was collated and consolidated in a spreadsheet and word
processor for comparison and analysis. Answers to questions were grouped into categories
(e.g., age-related, gender-related, usage-related). The data was analysed for specific themes
that emerged within each category. The themes and descriptions from the text were then
related to the research questions, and interpreted in the light of the study as a whole, including
lessons learned for future software configurations and installations.
The process was not completely linear, and the researcher revisited descriptions and themes as
others emerged, refining them as new information came to light, as is done in grounded
82 Chapter 5 – Research design and methodology

theory, paying attention to validity (checking for the accuracy of the findings) and reliability
of the data (ensuring that the analysis approach was consistent across different researchers and
different sites). Reliability procedures included ensuring that different researchers transcribed
the data to a spreadsheet in a standard way, and checking that the captured data was correctly
transcribed.
Validity strategies mentioned by Creswell (2009), include:
• Triangulating different data sources;
• Member checking, taking reports back to participants;
• Using rich, thick descriptions to convey findings;
• Clarifying the bias the researcher brings to the study;
• Presenting negative or discrepant information that runs counter to the themes;
• Spending prolonged time in the field.
Chapter 5 – Research design and methodology 83
Figure 5.6: Data analysis in qualitative research (Creswell, 2009:185)
Of the strategies mentioned above, those most pertinent to this study were: triangulation –
through the use of multiple case study sites and participants; the use of rich, thick descriptions
(Section 7.5); and presenting negative and discrepant information. Participants were
encouraged to be as open and honest as possible, and the researcher attempted to present the
information as objectively as possible, thus minimising ‘researcher-bias’ in presenting the
results.
In his ‘Introduction to case study’, Tellis (1997), describes a study involving the ‘examination
of managerial and economic aspects of the rapid acquisitions of information technology’
(Tellis, 1997:2), in the context of academic instructional and research computing. According
to Tellis, case study is a research method most strongly associated with the field of sociology
and must incorporate the views of the ‘actors’ in the case under study and satisfy the ‘three
tenets of the qualitative method: describing, understanding and explaining’ (Tellis, 1997:4).
This is the aim of the descriptions in Section 7.5.
Creswell presents an alternative conceptualisation to the coding (topic identification) of
qualitative data (Creswell, 2009:187, citing Bogdan and Biklen, 1992). Possible codes to look
for in this suggestion include:
• Setting and context codes;
• Subjects' perspectives and ways of thinking about people and objects;
• Process and activity codes;
• Relationship and social structure codes.
The approach in this study was to use a combination of predetermined and emerging topics.
The former arising from the research questions, the latter emerging from the data after the site
visits were completed.
The analysis approach to this part of the study was mainly interpretivist in nature. A good
summary of the interpretivist paradigm is found on the website of the Robert Wood Johnson
foundation (RWJF, 2008):
‘The interpretivist paradigm posits that researchers' values are inherent in all phases of the
research process. Truth is negotiated through dialogue.
• Findings or knowledge claims are created as an investigation proceeds. That is, findings emerge through dialogue in which conflicting interpretations are negotiated among members of a community.
84 Chapter 5 – Research design and methodology
• Pragmatic and moral concerns are important considerations when evaluating interpretive science. Fostering a dialogue between researchers and respondents is critical. It is through this dialectical process that a more informed and sophisticated understanding of the social world can be created.
• All interpretations are based in a particular moment. That is, they are located in a particular context or situation and time. They are open to re-interpretation and negotiation through conversation.
• Interpretive approaches rely heavily on naturalistic methods (interviewing and observation and analysis of existing texts).
• These methods ensure an adequate dialogue between the researchers and those with whom they interact in order to collaboratively construct a meaningful reality.
• Generally, meanings are emergent from the research process.
• Typically, qualitative methods are used.’ (RWJF, 2008)
According to Miles and Huberman (1994), qualitative analysis consists of three main activity
flows: data reduction (the simplification and transformation of available data); data display
(assembling the information in an organised way to enable conclusion drawing); and
conclusion drawing and verification (deciding what the data means).
Further details on the qualitative data collection process and site selection, as well as results
from the analysis of data from the site visits, are presented in Chapter 7.
5.7 Summary of chapter
This chapter presented an overview of the research design and process of the current study,
highlighting a mixed-methods strategy of enquiry and various primary goals. The research
questions were revisited and the research methods for quantitative and qualitative data
analysis discussed. The chapter explained site selection criteria and presented ten sites chosen
for quantitative data analysis and visualisation. The process of categorising the quantitative
data into manageable categories was explained, and the various elements in each category laid
out. Finally, research methods, and data collection and analysis approaches for qualitative data
were discussed.
The chapter sets the foundation for Chapters 6 and 7 which, respectively, discuss the
quantitative and qualitative studies. The mixed-methods strategy is consolidated in Chapter 8,
where pertinent discussions and findings from the study as a whole, are presented.
Chapter 5 – Research design and methodology 85

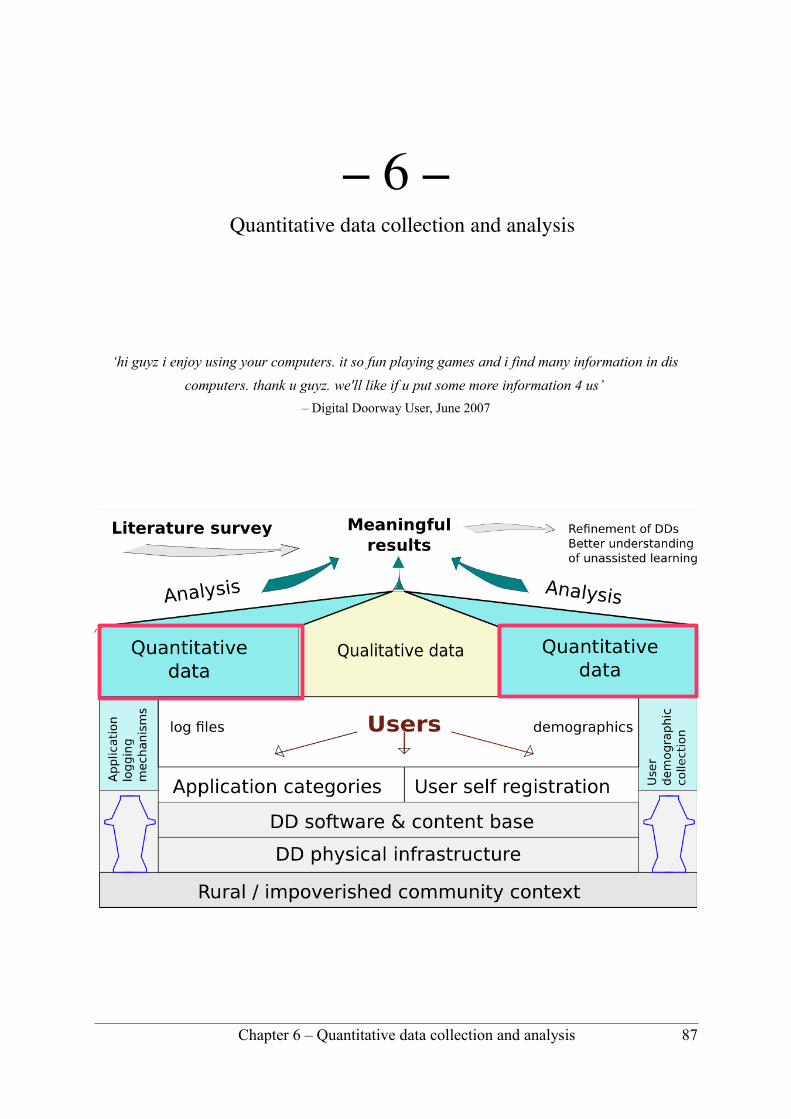
– 6 – Quantitative data collection and analysis
‘hi guyz i enjoy using your computers. it so fun playing games and i find many information in dis
computers. thank u guyz. we'll like if u put some more information 4 us’
– Digital Doorway User, June 2007
Chapter 6 – Quantitative data collection and analysis 87
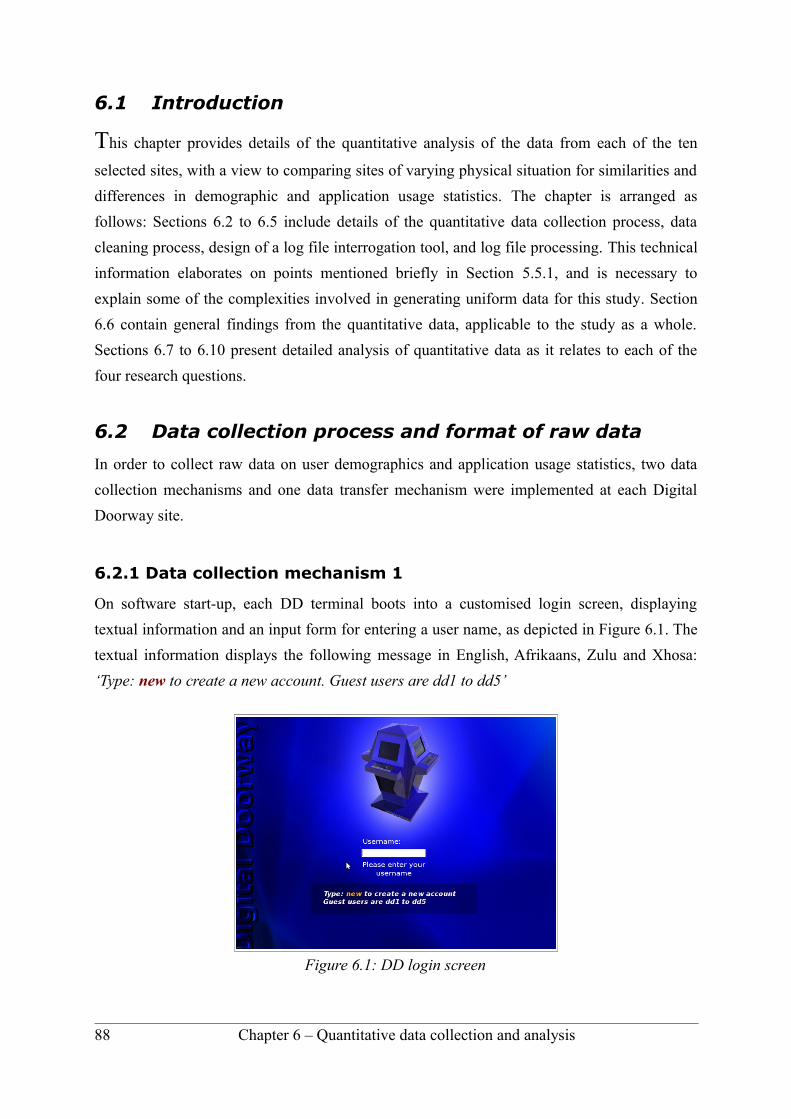
6.1 Introduction
This chapter provides details of the quantitative analysis of the data from each of the ten
selected sites, with a view to comparing sites of varying physical situation for similarities and
differences in demographic and application usage statistics. The chapter is arranged as
follows: Sections 6.2 to 6.5 include details of the quantitative data collection process, data
cleaning process, design of a log file interrogation tool, and log file processing. This technical
information elaborates on points mentioned briefly in Section 5.5.1, and is necessary to
explain some of the complexities involved in generating uniform data for this study. Section
6.6 contain general findings from the quantitative data, applicable to the study as a whole.
Sections 6.7 to 6.10 present detailed analysis of quantitative data as it relates to each of the
four research questions.
6.2 Data collection process and format of raw data
In order to collect raw data on user demographics and application usage statistics, two data
collection mechanisms and one data transfer mechanism were implemented at each Digital
Doorway site.
6.2.1 Data collection mechanism 1
On software start-up, each DD terminal boots into a customised login screen, displaying
textual information and an input form for entering a user name, as depicted in Figure 6.1. The
textual information displays the following message in English, Afrikaans, Zulu and Xhosa:
‘Type: new to create a new account. Guest users are dd1 to dd5’
88 Chapter 6 – Quantitative data collection and analysis
Figure 6.1: DD login screen

Users proceed to take one of three possible courses of action:
1. Login as a guest user;
2. Login with a previously created user account;
3. Create a new user account.
In the first scenario, logging in as a guest user, no user demographic information is collected,
and the user is taken directly to the guest desktop environment. In the second scenario, users
enter their login name and password, and are then directed to their own desktop environment.
The desktop environments for users and guests initially look identical, however, any changes
that the user makes to their own desktop are permanent, while guest desktops are restored to
their default state each evening, all saved files within the guest home directory being erased.
The third scenario takes the user to a screen for creating their own user name and specifying
various demographic details, as shown in Figure 6.2.
The following information is requested in the template: full name; user name; password; age;
gender; home language; and preferred language. This information is stored as a text file on the
DD server, and later transmitted to a central server.
6.2.2 Data collection mechanism 2
Each software application on the DD menu is embedded within a script that records:
• Which application was accessed.
• The name of the user accessing the application.
• The time and date of access.
Chapter 6 – Quantitative data collection and analysis 89
Figure 6.2: User registration form

Application log file data is accumulated per user name, and each evening the various log files
are compressed into a single file, named with the current date. In a case where the Mindset
server has been down for more than a day, log files from previous days are compressed with
log files for the current day. Examples are included in Appendix A.
6.2.3 Data transfer mechanism
Each evening, provided the communication server (Mindset server) connectivity was up, the
user registration file was uploaded to the Mindset server, and transmitted via the GPRS
modem to a central server, accessible to the DD researchers. Thereafter, the file resided under
a sub-directory named after the DD site name. The process is depicted in Figure 6.3.
6.2.4 Data extraction
Using shell scripts written by the researcher specifically for this study, the data in Table 6.1
was extracted from the raw data for each of the 210 DD sites. This data could then be used for
site selection (see Section 6.6.1), and further analysis.
Table 6.1: Data extracted from log files
• number of sites• location information for each site• number of sites with data• number of days of data per site• number of registered users per site• start and end dates of data per site• total number of application
launches per site• total number of registered user
application launches per site• number of registered females per
site• number of registered males per site
• age grouping per site• overall age grouping• application usage per age group
(overall)• application usage per age group (site
specific)• application usage per gender (overall)• application usage per gender (site
specific)• categorised application usage per site
and overall for each age group• categorised application usage per site
and overall for each gender
90 Chapter 6 – Quantitative data collection and analysis
Figure 6.3: Data transmission
User namePasswordAgeGenderHome languagePreferred language
register.dd Gprs network
CentralServer
Retrievalfor analysis
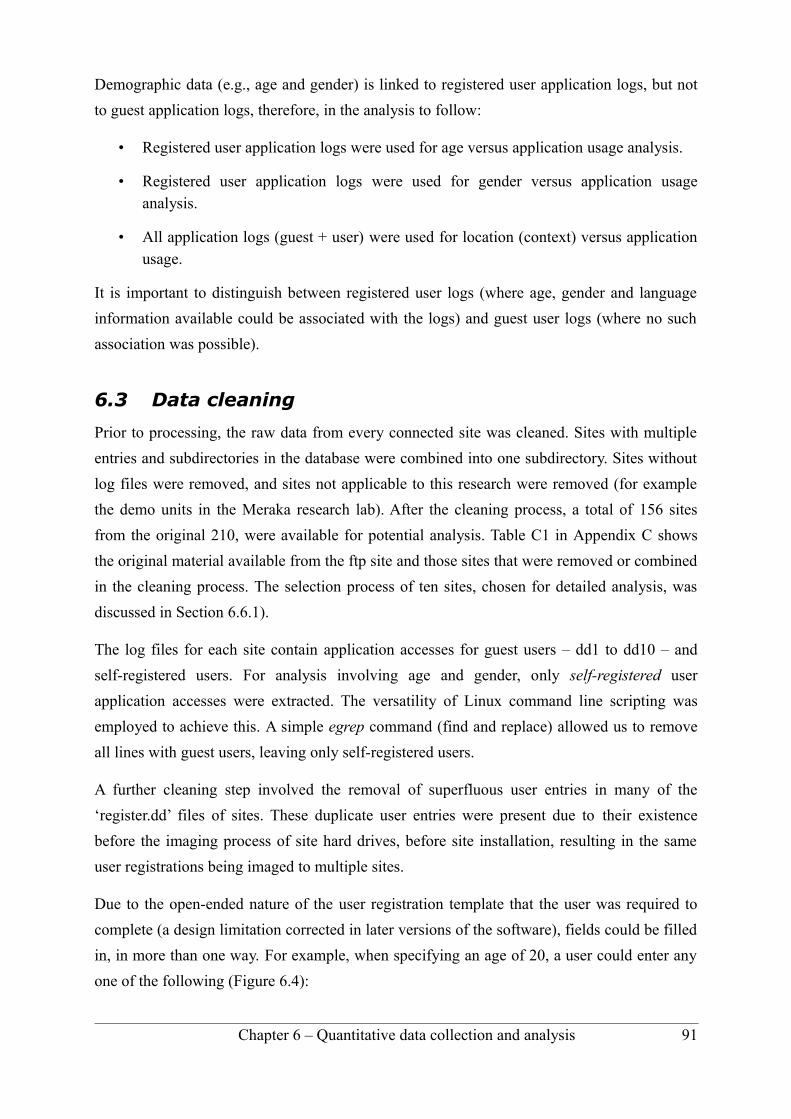
Demographic data (e.g., age and gender) is linked to registered user application logs, but not
to guest application logs, therefore, in the analysis to follow:
• Registered user application logs were used for age versus application usage analysis.
• Registered user application logs were used for gender versus application usage analysis.
• All application logs (guest + user) were used for location (context) versus application usage.
It is important to distinguish between registered user logs (where age, gender and language
information available could be associated with the logs) and guest user logs (where no such
association was possible).
6.3 Data cleaning
Prior to processing, the raw data from every connected site was cleaned. Sites with multiple
entries and subdirectories in the database were combined into one subdirectory. Sites without
log files were removed, and sites not applicable to this research were removed (for example
the demo units in the Meraka research lab). After the cleaning process, a total of 156 sites
from the original 210, were available for potential analysis. Table C1 in Appendix C shows
the original material available from the ftp site and those sites that were removed or combined
in the cleaning process. The selection process of ten sites, chosen for detailed analysis, was
discussed in Section 6.6.1).
The log files for each site contain application accesses for guest users – dd1 to dd10 – and
self-registered users. For analysis involving age and gender, only self-registered user
application accesses were extracted. The versatility of Linux command line scripting was
employed to achieve this. A simple egrep command (find and replace) allowed us to remove
all lines with guest users, leaving only self-registered users.
A further cleaning step involved the removal of superfluous user entries in many of the
‘register.dd’ files of sites. These duplicate user entries were present due to their existence
before the imaging process of site hard drives, before site installation, resulting in the same
user registrations being imaged to multiple sites.
Due to the open-ended nature of the user registration template that the user was required to
complete (a design limitation corrected in later versions of the software), fields could be filled
in, in more than one way. For example, when specifying an age of 20, a user could enter any
one of the following (Figure 6.4):
Chapter 6 – Quantitative data collection and analysis 91
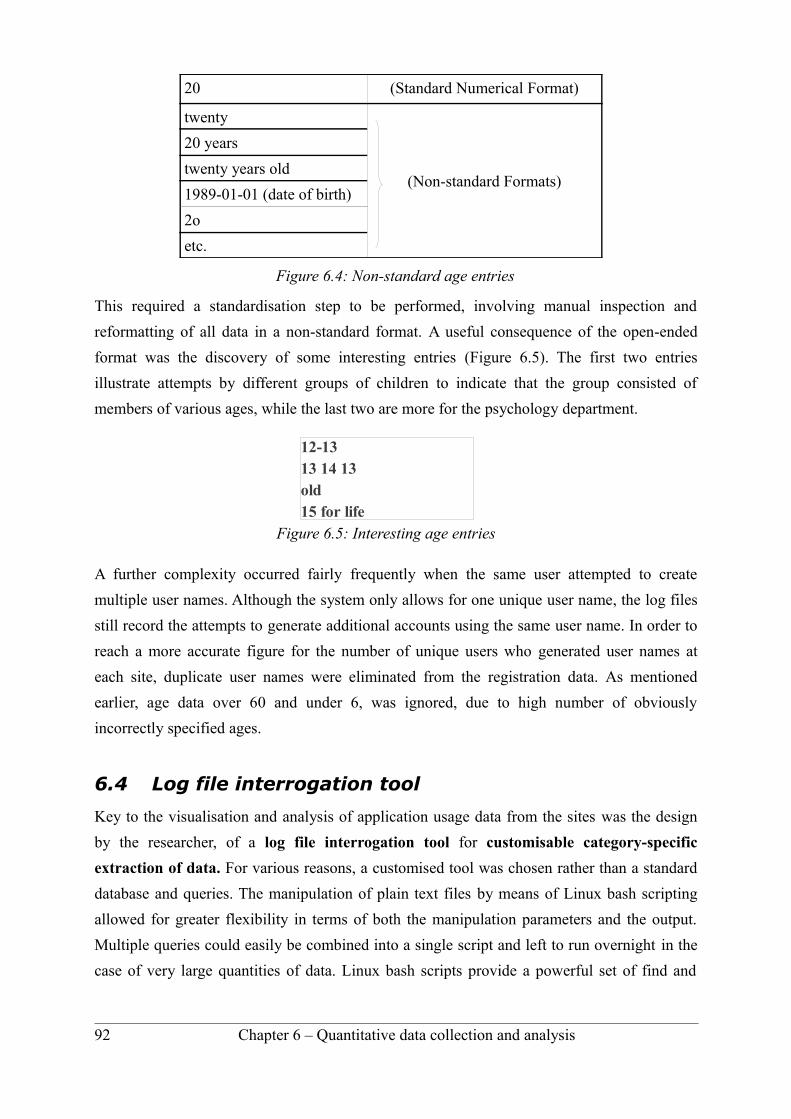
20 (Standard Numerical Format)
twenty
(Non-standard Formats)
20 years
twenty years old
1989-01-01 (date of birth)
2o
etc.
Figure 6.4: Non-standard age entries
This required a standardisation step to be performed, involving manual inspection and
reformatting of all data in a non-standard format. A useful consequence of the open-ended
format was the discovery of some interesting entries (Figure 6.5). The first two entries
illustrate attempts by different groups of children to indicate that the group consisted of
members of various ages, while the last two are more for the psychology department.
A further complexity occurred fairly frequently when the same user attempted to create
multiple user names. Although the system only allows for one unique user name, the log files
still record the attempts to generate additional accounts using the same user name. In order to
reach a more accurate figure for the number of unique users who generated user names at
each site, duplicate user names were eliminated from the registration data. As mentioned
earlier, age data over 60 and under 6, was ignored, due to high number of obviously
incorrectly specified ages.
6.4 Log file interrogation tool
Key to the visualisation and analysis of application usage data from the sites was the design
by the researcher, of a log file interrogation tool for customisable category-specific
extraction of data. For various reasons, a customised tool was chosen rather than a standard
database and queries. The manipulation of plain text files by means of Linux bash scripting
allowed for greater flexibility in terms of both the manipulation parameters and the output.
Multiple queries could easily be combined into a single script and left to run overnight in the
case of very large quantities of data. Linux bash scripts provide a powerful set of find and
92 Chapter 6 – Quantitative data collection and analysis
Figure 6.5: Interesting age entries
12-1313 14 13old15 for life
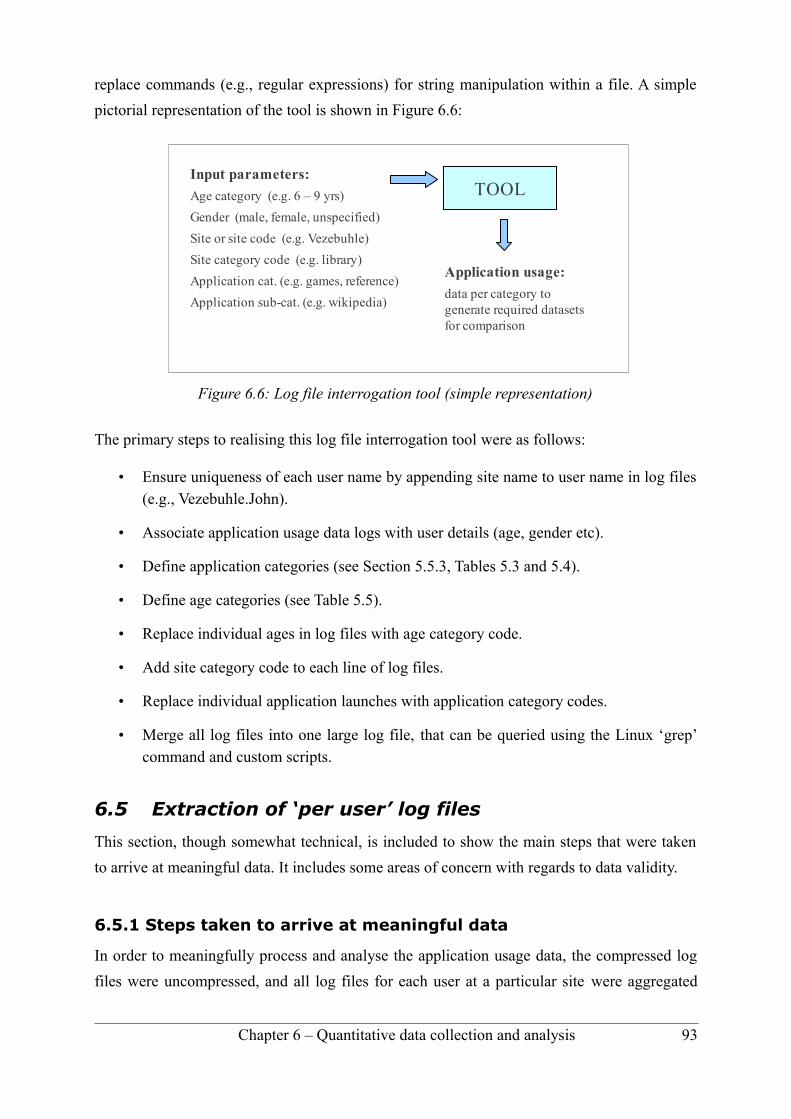
replace commands (e.g., regular expressions) for string manipulation within a file. A simple
pictorial representation of the tool is shown in Figure 6.6:
The primary steps to realising this log file interrogation tool were as follows:
• Ensure uniqueness of each user name by appending site name to user name in log files (e.g., Vezebuhle.John).
• Associate application usage data logs with user details (age, gender etc).
• Define application categories (see Section 5.5.3, Tables 5.3 and 5.4).
• Define age categories (see Table 5.5).
• Replace individual ages in log files with age category code.
• Add site category code to each line of log files.
• Replace individual application launches with application category codes.
• Merge all log files into one large log file, that can be queried using the Linux ‘grep’ command and custom scripts.
6.5 Extraction of ‘per user’ log files
This section, though somewhat technical, is included to show the main steps that were taken
to arrive at meaningful data. It includes some areas of concern with regards to data validity.
6.5.1 Steps taken to arrive at meaningful data
In order to meaningfully process and analyse the application usage data, the compressed log
files were uncompressed, and all log files for each user at a particular site were aggregated
Chapter 6 – Quantitative data collection and analysis 93
Figure 6.6: Log file interrogation tool (simple representation)
Input parameters:
Age category (e.g. 6 – 9 yrs)
Gender (male, female, unspecified)
Site or site code (e.g. Vezebuhle)
Site category code (e.g. library)
Application cat. (e.g. games, reference)
Application sub-cat. (e.g. wikipedia)
Application usage:
data per category to generate required datasets for comparison
TOOL
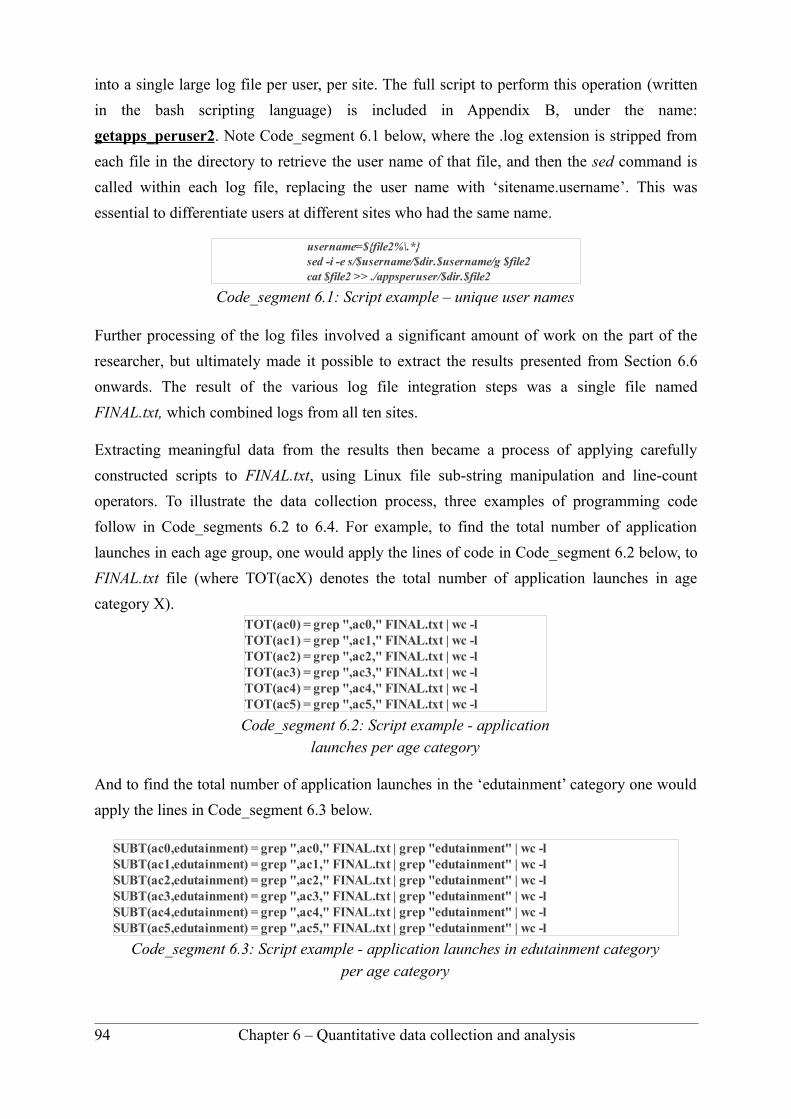
into a single large log file per user, per site. The full script to perform this operation (written
in the bash scripting language) is included in Appendix B, under the name:
getapps_peruser2. Note Code_segment 6.1 below, where the .log extension is stripped from
each file in the directory to retrieve the user name of that file, and then the sed command is
called within each log file, replacing the user name with ‘sitename.username’. This was
essential to differentiate users at different sites who had the same name.
Further processing of the log files involved a significant amount of work on the part of the
researcher, but ultimately made it possible to extract the results presented from Section 6.6
onwards. The result of the various log file integration steps was a single file named
FINAL.txt, which combined logs from all ten sites.
Extracting meaningful data from the results then became a process of applying carefully
constructed scripts to FINAL.txt, using Linux file sub-string manipulation and line-count
operators. To illustrate the data collection process, three examples of programming code
follow in Code_segments 6.2 to 6.4. For example, to find the total number of application
launches in each age group, one would apply the lines of code in Code_segment 6.2 below, to
FINAL.txt file (where TOT(acX) denotes the total number of application launches in age
category X).
And to find the total number of application launches in the ‘edutainment’ category one would
apply the lines in Code_segment 6.3 below.
94 Chapter 6 – Quantitative data collection and analysis
Code_segment 6.1: Script example – unique user names
username=${file2%\.*} sed -i -e s/$username/$dir.$username/g $file2 cat $file2 >> ./appsperuser/$dir.$file2
Code_segment 6.2: Script example - application launches per age category
TOT(ac0) = grep ",ac0," FINAL.txt | wc -lTOT(ac1) = grep ",ac1," FINAL.txt | wc -lTOT(ac2) = grep ",ac2," FINAL.txt | wc -lTOT(ac3) = grep ",ac3," FINAL.txt | wc -lTOT(ac4) = grep ",ac4," FINAL.txt | wc -lTOT(ac5) = grep ",ac5," FINAL.txt | wc -l
Code_segment 6.3: Script example - application launches in edutainment category per age category
SUBT(ac0,edutainment) = grep ",ac0," FINAL.txt | grep "edutainment" | wc -lSUBT(ac1,edutainment) = grep ",ac1," FINAL.txt | grep "edutainment" | wc -lSUBT(ac2,edutainment) = grep ",ac2," FINAL.txt | grep "edutainment" | wc -lSUBT(ac3,edutainment) = grep ",ac3," FINAL.txt | grep "edutainment" | wc -lSUBT(ac4,edutainment) = grep ",ac4," FINAL.txt | grep "edutainment" | wc -lSUBT(ac5,edutainment) = grep ",ac5," FINAL.txt | grep "edutainment" | wc -l
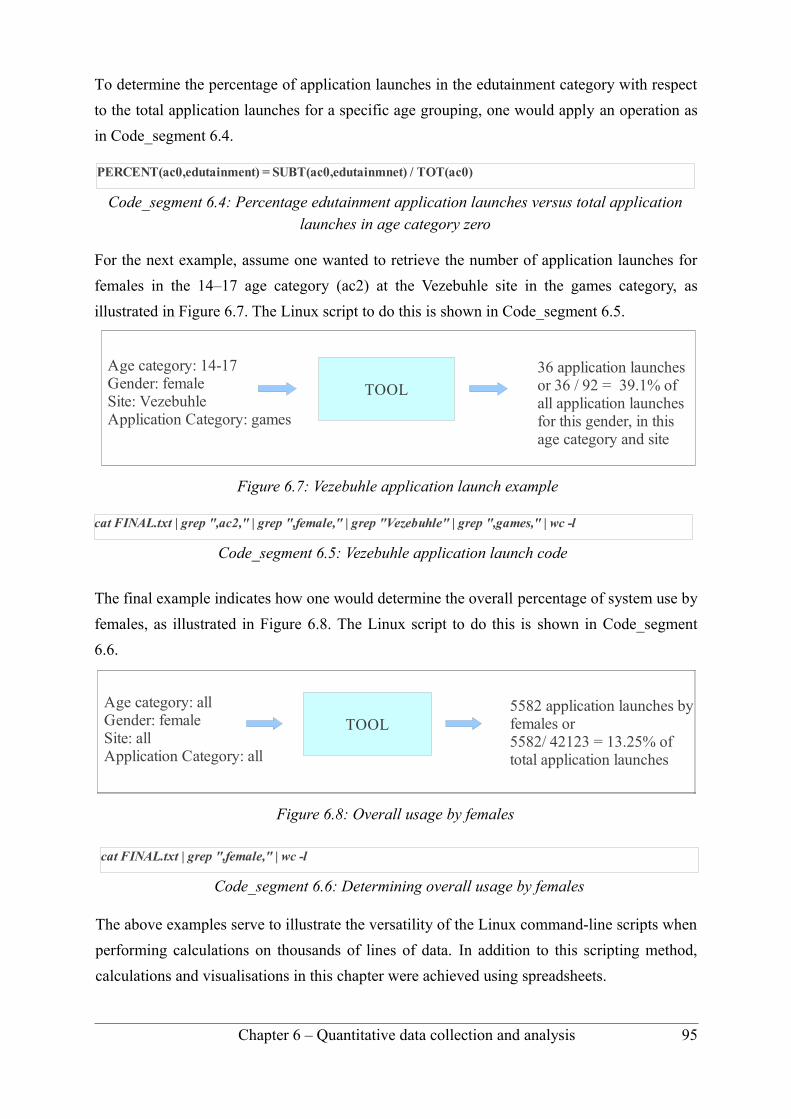
To determine the percentage of application launches in the edutainment category with respect
to the total application launches for a specific age grouping, one would apply an operation as
in Code_segment 6.4.
For the next example, assume one wanted to retrieve the number of application launches for
females in the 14–17 age category (ac2) at the Vezebuhle site in the games category, as
illustrated in Figure 6.7. The Linux script to do this is shown in Code_segment 6.5.
The final example indicates how one would determine the overall percentage of system use by
females, as illustrated in Figure 6.8. The Linux script to do this is shown in Code_segment
6.6.
The above examples serve to illustrate the versatility of the Linux command-line scripts when
performing calculations on thousands of lines of data. In addition to this scripting method,
calculations and visualisations in this chapter were achieved using spreadsheets.
Chapter 6 – Quantitative data collection and analysis 95
Figure 6.8: Overall usage by females
Figure 6.7: Vezebuhle application launch example
Code_segment 6.4: Percentage edutainment application launches versus total application launches in age category zero
PERCENT(ac0,edutainment) = SUBT(ac0,edutainmnet) / TOT(ac0)
Code_segment 6.5: Vezebuhle application launch code
cat FINAL.txt | grep ",ac2," | grep ",female," | grep "Vezebuhle" | grep ",games," | wc -l
Code_segment 6.6: Determining overall usage by females
cat FINAL.txt | grep ",female," | wc -l
Age category: 14-17Gender: femaleSite: VezebuhleApplication Category: games
36 application launches or 36 / 92 = 39.1% of all application launches for this gender, in this age category and site
TOOL
5582 application launches by females or5582/ 42123 = 13.25% of total application launches
TOOL
Age category: allGender: femaleSite: allApplication Category: all
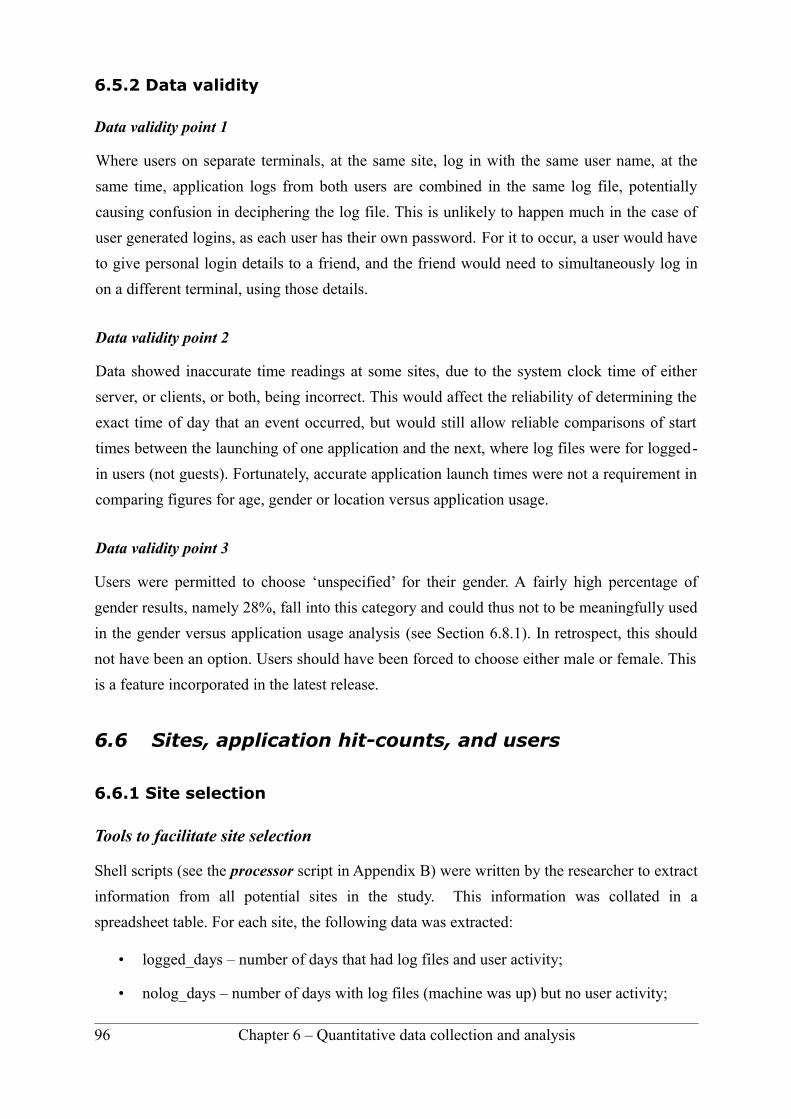
6.5.2 Data validity
Data validity point 1
Where users on separate terminals, at the same site, log in with the same user name, at the
same time, application logs from both users are combined in the same log file, potentially
causing confusion in deciphering the log file. This is unlikely to happen much in the case of
user generated logins, as each user has their own password. For it to occur, a user would have
to give personal login details to a friend, and the friend would need to simultaneously log in
on a different terminal, using those details.
Data validity point 2
Data showed inaccurate time readings at some sites, due to the system clock time of either
server, or clients, or both, being incorrect. This would affect the reliability of determining the
exact time of day that an event occurred, but would still allow reliable comparisons of start
times between the launching of one application and the next, where log files were for logged-
in users (not guests). Fortunately, accurate application launch times were not a requirement in
comparing figures for age, gender or location versus application usage.
Data validity point 3
Users were permitted to choose ‘unspecified’ for their gender. A fairly high percentage of
gender results, namely 28%, fall into this category and could thus not to be meaningfully used
in the gender versus application usage analysis (see Section 6.8.1). In retrospect, this should
not have been an option. Users should have been forced to choose either male or female. This
is a feature incorporated in the latest release.
6.6 Sites, application hit-counts, and users
6.6.1 Site selection
Tools to facilitate site selection
Shell scripts (see the processor script in Appendix B) were written by the researcher to extract
information from all potential sites in the study. This information was collated in a
spreadsheet table. For each site, the following data was extracted:
• logged_days – number of days that had log files and user activity;
• nolog_days – number of days with log files (machine was up) but no user activity;
96 Chapter 6 – Quantitative data collection and analysis
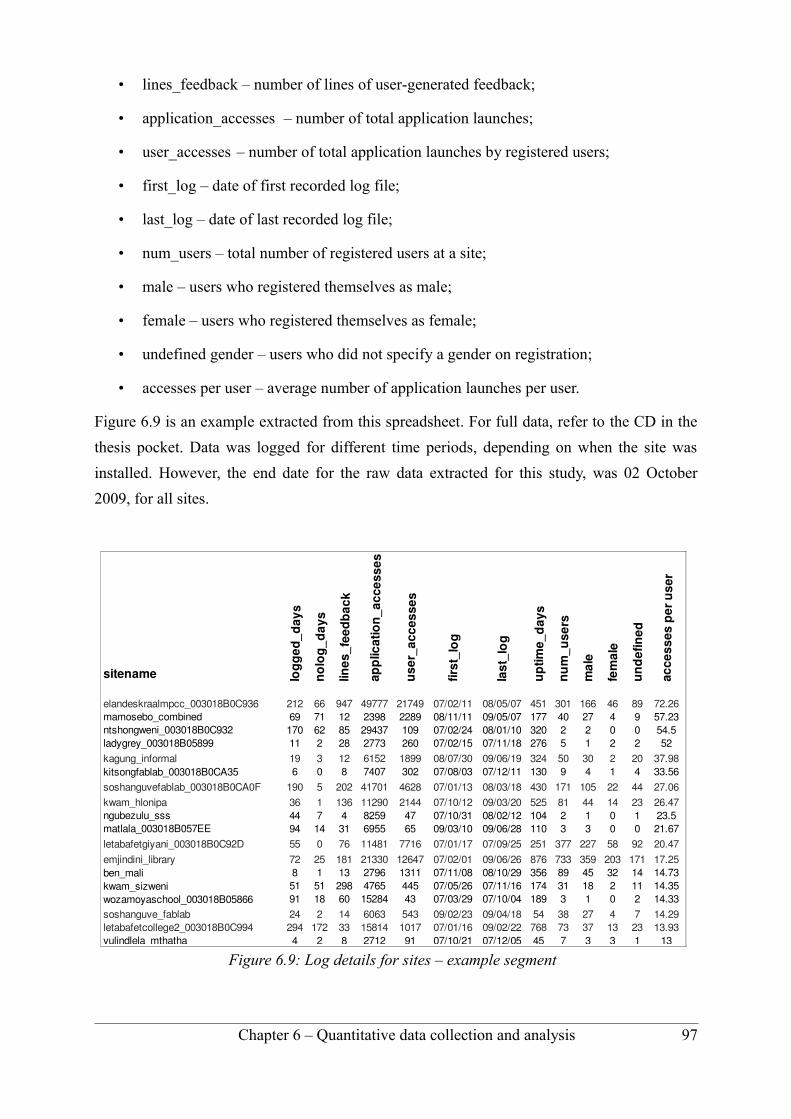
• lines_feedback – number of lines of user-generated feedback;
• application_accesses – number of total application launches;
• user_accesses – number of total application launches by registered users;
• first_log – date of first recorded log file;
• last_log – date of last recorded log file;
• num_users – total number of registered users at a site;
• male – users who registered themselves as male;
• female – users who registered themselves as female;
• undefined gender – users who did not specify a gender on registration;
• accesses per user – average number of application launches per user.
Figure 6.9 is an example extracted from this spreadsheet. For full data, refer to the CD in the
thesis pocket. Data was logged for different time periods, depending on when the site was
installed. However, the end date for the raw data extracted for this study, was 02 October
2009, for all sites.
Chapter 6 – Quantitative data collection and analysis 97
Figure 6.9: Log details for sites – example segment
212 66 947 49777 21749 07/02/11 08/05/07 451 301 166 46 89 72.2669 71 12 2398 2289 08/11/11 09/05/07 177 40 27 4 9 57.23170 62 85 29437 109 07/02/24 08/01/10 320 2 2 0 0 54.511 2 28 2773 260 07/02/15 07/11/18 276 5 1 2 2 5219 3 12 6152 1899 08/07/30 09/06/19 324 50 30 2 20 37.986 0 8 7407 302 07/08/03 07/12/11 130 9 4 1 4 33.56
190 5 202 41701 4628 07/01/13 08/03/18 430 171 105 22 44 27.0636 1 136 11290 2144 07/10/12 09/03/20 525 81 44 14 23 26.4744 7 4 8259 47 07/10/31 08/02/12 104 2 1 0 1 23.594 14 31 6955 65 09/03/10 09/06/28 110 3 3 0 0 21.6755 0 76 11481 7716 07/01/17 07/09/25 251 377 227 58 92 20.4772 25 181 21330 12647 07/02/01 09/06/26 876 733 359 203 171 17.258 1 13 2796 1311 07/11/08 08/10/29 356 89 45 32 14 14.7351 51 298 4765 445 07/05/26 07/11/16 174 31 18 2 11 14.3591 18 60 15284 43 07/03/29 07/10/04 189 3 1 0 2 14.3324 2 14 6063 543 09/02/23 09/04/18 54 38 27 4 7 14.29
letabafetcollege2_003018B0C994 294 172 33 15814 1017 07/01/16 09/02/22 768 73 37 13 23 13.934 2 8 2712 91 07/10/21 07/12/05 45 7 3 3 1 1350 4 681 19593 1841 07/02/24 08/10/06 590 143 50 22 71 12.8737 9 0 2396 1137 09/05/08 09/06/26 49 99 31 6 62 11.4813 3 4 285 65 08/10/31 08/12/19 49 6 5 1 0 10.8335 49 6 239 21 06/12/05 07/04/13 129 2 2 0 0 10.512 2 0 4511 49 08/05/09 08/09/10 124 5 2 0 3 9.897 6 90 16595 624 07/02/11 07/11/14 276 65 22 7 36 9.616 1 5 3056 853 08/05/08 08/06/24 47 89 63 17 9 9.58145 43 76 46257 103 08/02/15 08/11/21 280 11 7 0 4 9.3684 0 180 25082 8957 07/03/07 07/09/15 192 961 518 113 332 9.323 3 6 37 37 06/11/30 06/12/04 4 4 3 1 0 9.2529 12 5 1784 268 05/02/22 09/06/10 1569 31 15 2 14 8.65116 561 0 786 76 07/05/11 09/06/28 779 9 5 3 1 8.44
letabafetcollege1_003018B0CA7C 151 79 70 11283 302 07/01/16 08/03/20 429 36 17 10 9 8.3911 1 20 4611 2976 07/06/30 07/10/07 99 374 206 66 102 7.9668 39 83 5740 421 08/02/10 08/06/30 141 55 31 7 17 7.65
sitename
elandeskraalmpcc_003018B0C936mamosebo_combinedntshongweni_003018B0C932ladygrey_003018B05899kagung_informalkitsongfablab_003018B0CA35soshanguvefablab_003018B0CA0Fkwam_hlonipangubezulu_sssmatlala_003018B057EEletabafetgiyani_003018B0C92Demjindini_libraryben_malikwam_sizweniwozamoyaschool_003018B05866soshanguve_fablab
vulindlela_mthathamsunduzi_003018B0C8CAmamosebo_combinedmooifontein_003018A7E64Dmeraka_dd1skhosana_seclepellehighschool_003018B0C930elandeskraal_mpccpampier_003018B05838vezebuhleovccernter_003018B0CAACmeraka_003018A69499kgabang_combinedbloemfonteinfablab_003018B0C9A1
kwam_vezebuhlekanyamazane_library
logg
ed_d
ays
nolo
g_da
ys
lines
_fee
dbac
k
appl
icat
ion_
acce
sses
user
_acc
esse
s
first
_log
last
_log
uptim
e_da
ys
num
_use
rs
mal
e
fem
ale
unde
f ined
acce
sses
per
use
r
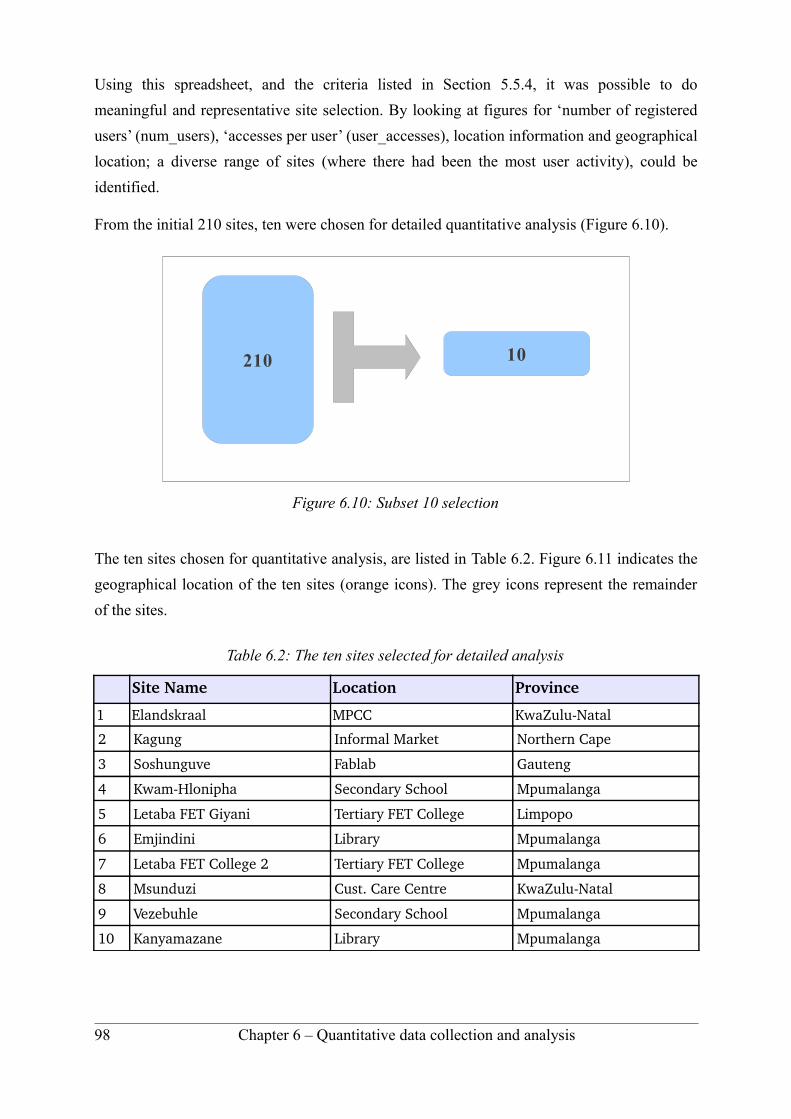
Using this spreadsheet, and the criteria listed in Section 5.5.4, it was possible to do
meaningful and representative site selection. By looking at figures for ‘number of registered
users’ (num_users), ‘accesses per user’ (user_accesses), location information and geographical
location; a diverse range of sites (where there had been the most user activity), could be
identified.
From the initial 210 sites, ten were chosen for detailed quantitative analysis (Figure 6.10).
The ten sites chosen for quantitative analysis, are listed in Table 6.2. Figure 6.11 indicates the
geographical location of the ten sites (orange icons). The grey icons represent the remainder
of the sites.
Table 6.2: The ten sites selected for detailed analysis
Site Name Location Province
1 Elandskraal MPCC KwaZuluNatal
2 Kagung Informal Market Northern Cape
3 Soshunguve Fablab Gauteng
4 KwamHlonipha Secondary School Mpumalanga
5 Letaba FET Giyani Tertiary FET College Limpopo
6 Emjindini Library Mpumalanga
7 Letaba FET College 2 Tertiary FET College Mpumalanga
8 Msunduzi Cust. Care Centre KwaZuluNatal
9 Vezebuhle Secondary School Mpumalanga
10 Kanyamazane Library Mpumalanga
98 Chapter 6 – Quantitative data collection and analysis
Figure 6.10: Subset 10 selection
210 10
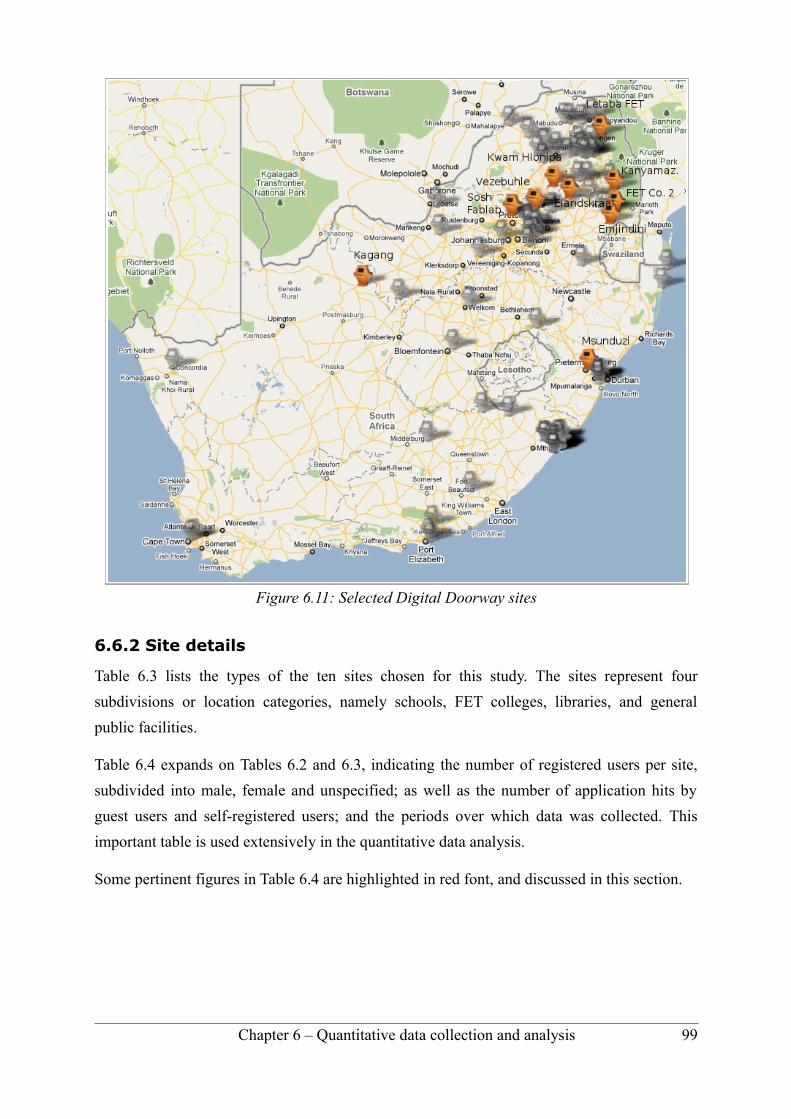
6.6.2 Site details
Table 6.3 lists the types of the ten sites chosen for this study. The sites represent four
subdivisions or location categories, namely schools, FET colleges, libraries, and general
public facilities.
Table 6.4 expands on Tables 6.2 and 6.3, indicating the number of registered users per site,
subdivided into male, female and unspecified; as well as the number of application hits by
guest users and self-registered users; and the periods over which data was collected. This
important table is used extensively in the quantitative data analysis.
Some pertinent figures in Table 6.4 are highlighted in red font, and discussed in this section.
Chapter 6 – Quantitative data collection and analysis 99
Figure 6.11: Selected Digital Doorway sites
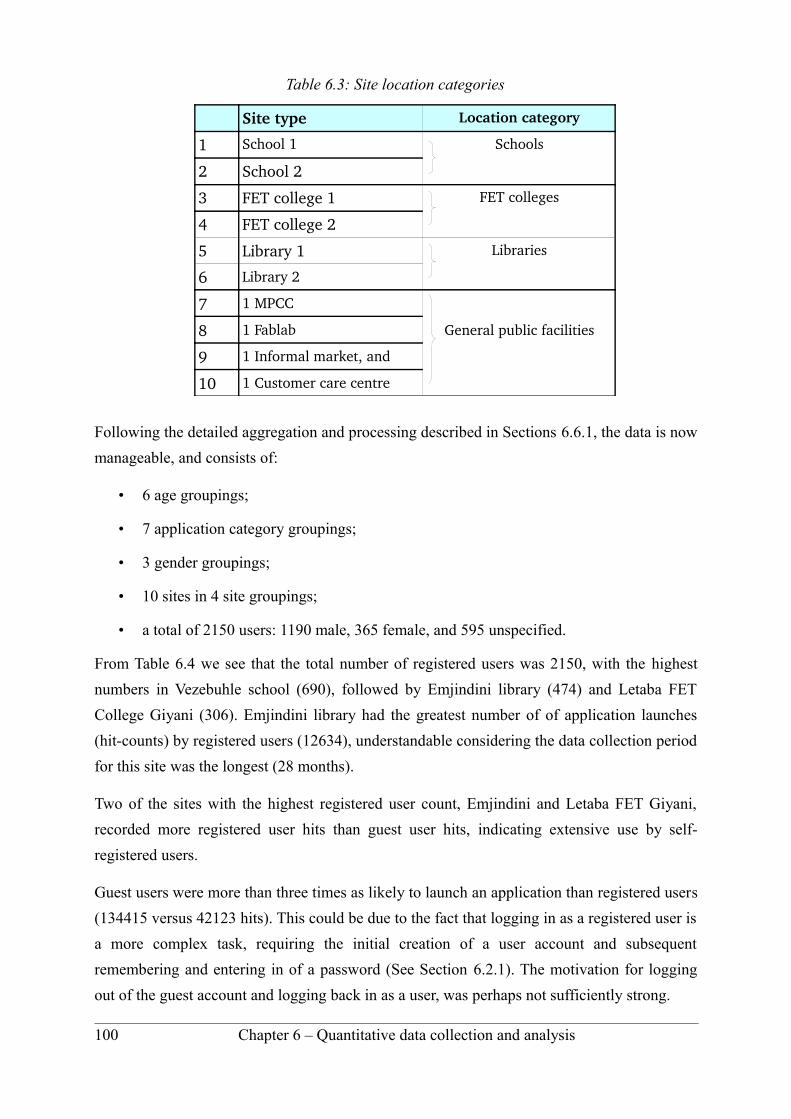
Table 6.3: Site location categories
Site type Location category
1 School 1 Schools
2 School 2
3 FET college 1 FET colleges
4 FET college 2
5 Library 1 Libraries
6 Library 2
7 1 MPCC
General public facilities8 1 Fablab
9 1 Informal market, and
10 1 Customer care centre
Following the detailed aggregation and processing described in Sections 6.6.1, the data is now
manageable, and consists of:
• 6 age groupings;
• 7 application category groupings;
• 3 gender groupings;
• 10 sites in 4 site groupings;
• a total of 2150 users: 1190 male, 365 female, and 595 unspecified.
From Table 6.4 we see that the total number of registered users was 2150, with the highest
numbers in Vezebuhle school (690), followed by Emjindini library (474) and Letaba FET
College Giyani (306). Emjindini library had the greatest number of of application launches
(hit-counts) by registered users (12634), understandable considering the data collection period
for this site was the longest (28 months).
Two of the sites with the highest registered user count, Emjindini and Letaba FET Giyani,
recorded more registered user hits than guest user hits, indicating extensive use by self-
registered users.
Guest users were more than three times as likely to launch an application than registered users
(134415 versus 42123 hits). This could be due to the fact that logging in as a registered user is
a more complex task, requiring the initial creation of a user account and subsequent
remembering and entering in of a password (See Section 6.2.1). The motivation for logging
out of the guest account and logging back in as a user, was perhaps not sufficiently strong.
100 Chapter 6 – Quantitative data collection and analysis
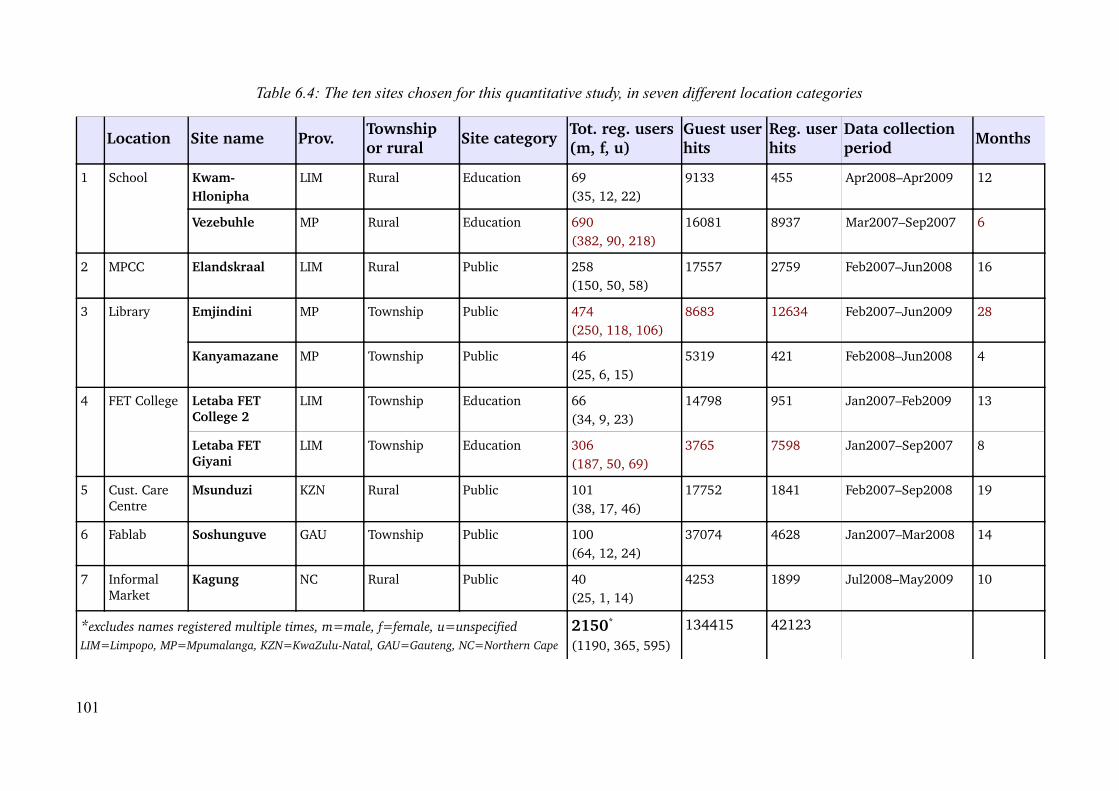
Table 6.4: The ten sites chosen for this quantitative study, in seven different location categories
Location Site name Prov.Township or rural Site category
Tot. reg. users (m, f, u)
Guest user hits
Reg. user hits
Data collection period Months
1 School KwamHlonipha
LIM Rural Education 69 (35, 12, 22)
9133 455 Apr2008–Apr2009 12
Vezebuhle MP Rural Education 690 (382, 90, 218)
16081 8937 Mar2007–Sep2007 6
2 MPCC Elandskraal LIM Rural Public 258 (150, 50, 58)
17557 2759 Feb2007–Jun2008 16
3 Library Emjindini MP Township Public 474 (250, 118, 106)
8683 12634 Feb2007–Jun2009 28
Kanyamazane MP Township Public 46 (25, 6, 15)
5319 421 Feb2008–Jun2008 4
4 FET College Letaba FET College 2
LIM Township Education 66 (34, 9, 23)
14798 951 Jan2007–Feb2009 13
Letaba FET Giyani
LIM Township Education 306 (187, 50, 69)
3765 7598 Jan2007–Sep2007 8
5 Cust. Care Centre
Msunduzi KZN Rural Public 101 (38, 17, 46)
17752 1841 Feb2007–Sep2008 19
6 Fablab Soshunguve GAU Township Public 100 (64, 12, 24)
37074 4628 Jan2007–Mar2008 14
7 Informal Market
Kagung NC Rural Public 40 (25, 1, 14)
4253 1899 Jul2008–May2009 10
*excludes names registered multiple times, m=male, f=female, u=unspecifiedLIM=Limpopo, MP=Mpumalanga, KZN=KwaZuluNatal, GAU=Gauteng, NC=Northern Cape
2150* (1190, 365, 595)
134415 42123
101
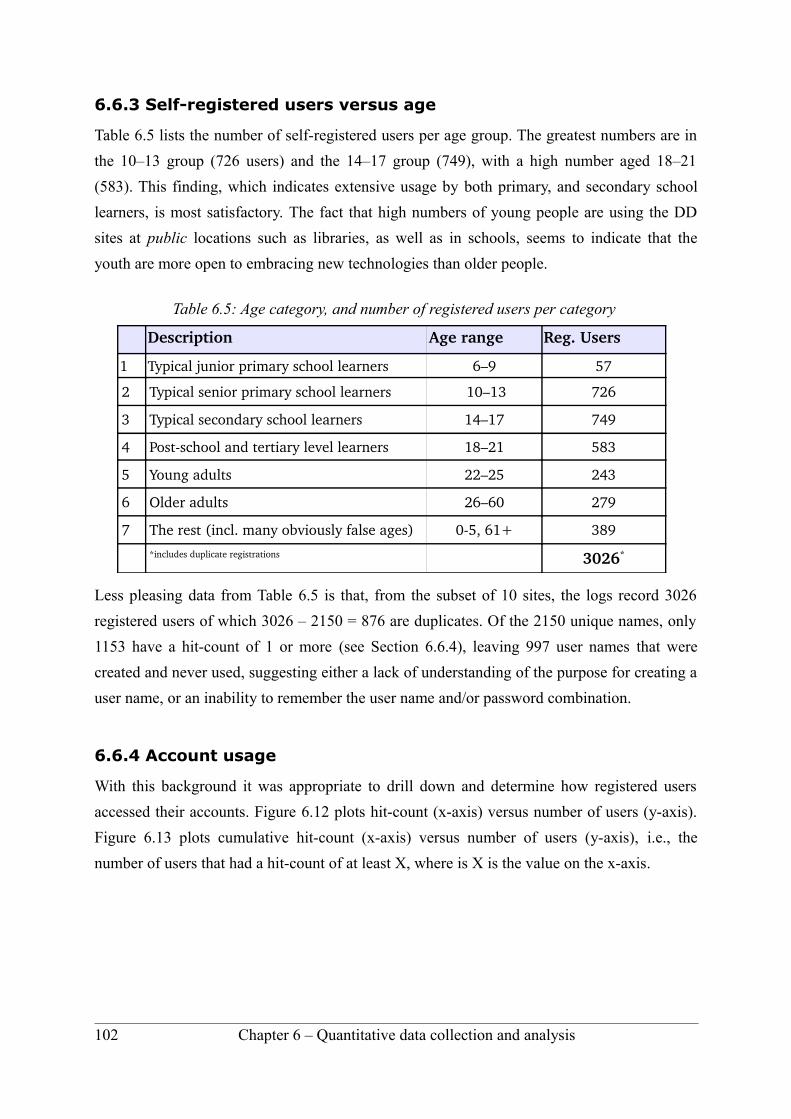
6.6.3 Self-registered users versus age
Table 6.5 lists the number of self-registered users per age group. The greatest numbers are in
the 10–13 group (726 users) and the 14–17 group (749), with a high number aged 18–21
(583). This finding, which indicates extensive usage by both primary, and secondary school
learners, is most satisfactory. The fact that high numbers of young people are using the DD
sites at public locations such as libraries, as well as in schools, seems to indicate that the
youth are more open to embracing new technologies than older people.
Table 6.5: Age category, and number of registered users per category
Description Age range Reg. Users
1 Typical junior primary school learners 6–9 57
2 Typical senior primary school learners 10–13 726
3 Typical secondary school learners 14–17 749
4 Postschool and tertiary level learners 18–21 583
5 Young adults 22–25 243
6 Older adults 26–60 279
7 The rest (incl. many obviously false ages) 05, 61+ 389
*includes duplicate registrations 3026*
Less pleasing data from Table 6.5 is that, from the subset of 10 sites, the logs record 3026
registered users of which 3026 – 2150 = 876 are duplicates. Of the 2150 unique names, only
1153 have a hit-count of 1 or more (see Section 6.6.4), leaving 997 user names that were
created and never used, suggesting either a lack of understanding of the purpose for creating a
user name, or an inability to remember the user name and/or password combination.
6.6.4 Account usage
With this background it was appropriate to drill down and determine how registered users
accessed their accounts. Figure 6.12 plots hit-count (x-axis) versus number of users (y-axis).
Figure 6.13 plots cumulative hit-count (x-axis) versus number of users (y-axis), i.e., the
number of users that had a hit-count of at least X, where is X is the value on the x-axis.
102 Chapter 6 – Quantitative data collection and analysis
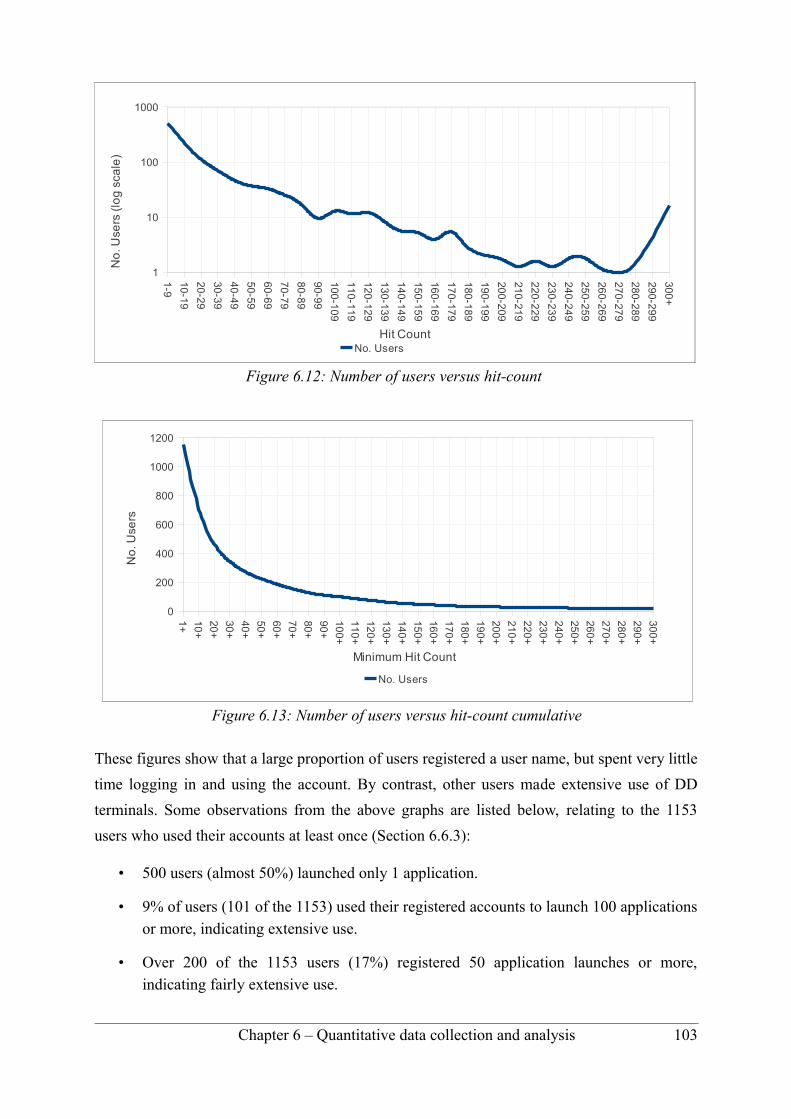
Figure 6.12: Number of users versus hit-count
1+
10+
20+
30+
40+
50+
60+
70+
80+
90
+
100+
110
+
120
+
130
+
140
+
150
+
160
+
170
+
18
0+
190+
200
+
210
+
220
+
230
+
240
+
250
+
260
+
270
+
280
+
290
+
300+
0
200
400
600
800
1000
1200
No. Users
Minimum Hit Count
No
. Use
rs
Figure 6.13: Number of users versus hit-count cumulative
These figures show that a large proportion of users registered a user name, but spent very little
time logging in and using the account. By contrast, other users made extensive use of DD
terminals. Some observations from the above graphs are listed below, relating to the 1153
users who used their accounts at least once (Section 6.6.3):
• 500 users (almost 50%) launched only 1 application.
• 9% of users (101 of the 1153) used their registered accounts to launch 100 applications or more, indicating extensive use.
• Over 200 of the 1153 users (17%) registered 50 application launches or more, indicating fairly extensive use.
Chapter 6 – Quantitative data collection and analysis 103
1-9
10-1
9
20-2
9
30-3
9
40-4
9
50-5
9
60-6
9
70-7
9
80-8
9
90-9
9
100
-10
9
110
-11
9
120
-12
9
130
-13
9
140
-14
9
150
-15
9
160
-16
9
170
-17
9
180
-18
9
190
-19
9
200
-20
9
210
-21
9
220
-22
9
230
-23
9
240
-24
9
250
-25
9
260
-26
9
270
-27
9
280
-28
9
290
-29
9
300
+
1
10
100
1000
No. UsersHit Count
No
. Use
rs (
log
sca
le)
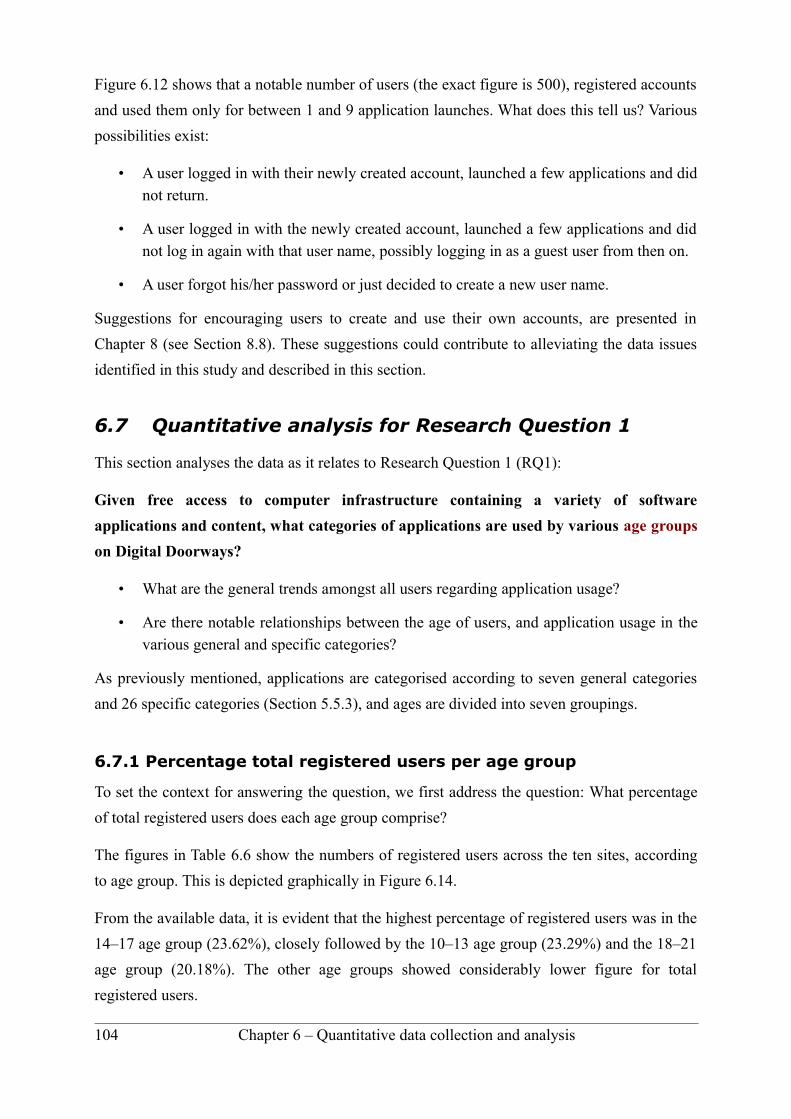
Figure 6.12 shows that a notable number of users (the exact figure is 500), registered accounts
and used them only for between 1 and 9 application launches. What does this tell us? Various
possibilities exist:
• A user logged in with their newly created account, launched a few applications and did not return.
• A user logged in with the newly created account, launched a few applications and did not log in again with that user name, possibly logging in as a guest user from then on.
• A user forgot his/her password or just decided to create a new user name.
Suggestions for encouraging users to create and use their own accounts, are presented in
Chapter 8 (see Section 8.8). These suggestions could contribute to alleviating the data issues
identified in this study and described in this section.
6.7 Quantitative analysis for Research Question 1
This section analyses the data as it relates to Research Question 1 (RQ1):
Given free access to computer infrastructure containing a variety of software
applications and content, what categories of applications are used by various age groups
on Digital Doorways?
• What are the general trends amongst all users regarding application usage?
• Are there notable relationships between the age of users, and application usage in the various general and specific categories?
As previously mentioned, applications are categorised according to seven general categories
and 26 specific categories (Section 5.5.3), and ages are divided into seven groupings.
6.7.1 Percentage total registered users per age group
To set the context for answering the question, we first address the question: What percentage
of total registered users does each age group comprise?
The figures in Table 6.6 show the numbers of registered users across the ten sites, according
to age group. This is depicted graphically in Figure 6.14.
From the available data, it is evident that the highest percentage of registered users was in the
14–17 age group (23.62%), closely followed by the 10–13 age group (23.29%) and the 18–21
age group (20.18%). The other age groups showed considerably lower figure for total
registered users.
104 Chapter 6 – Quantitative data collection and analysis
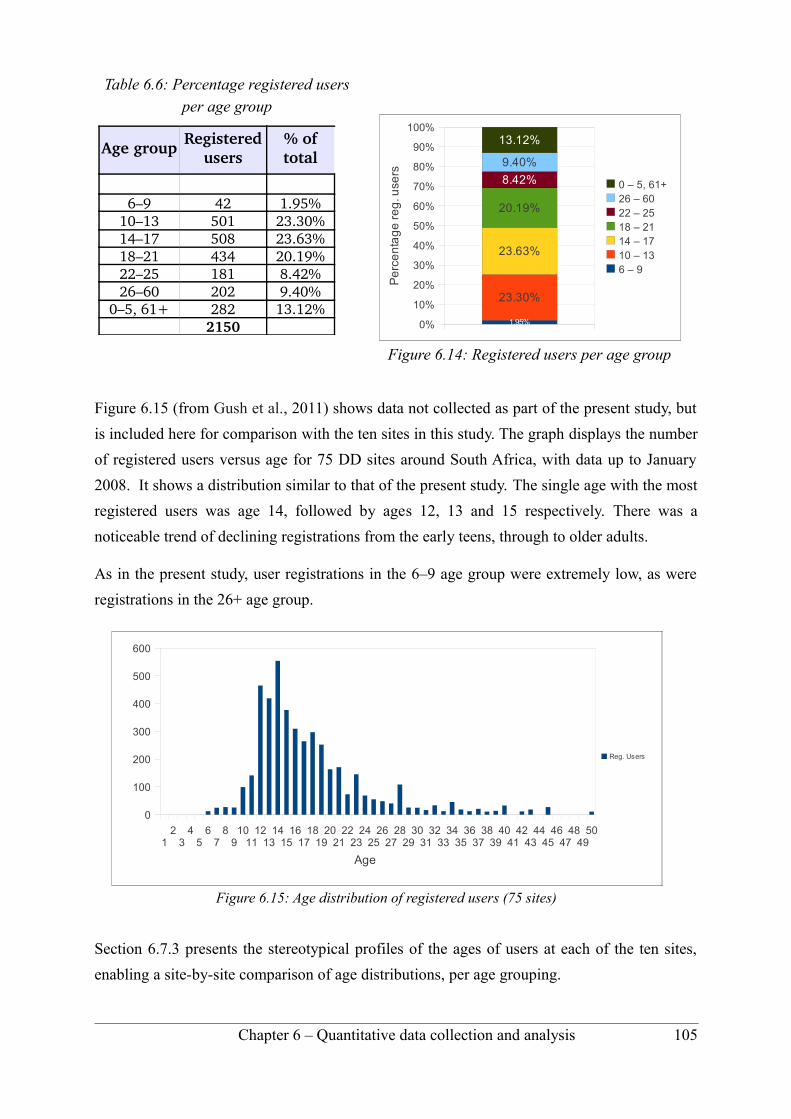
Table 6.6: Percentage registered users per age group
Age groupRegistered
users% of total
6–9 42 1.95%10–13 501 23.30%14–17 508 23.63%18–21 434 20.19%22–25 181 8.42%26–60 202 9.40%
0–5, 61+ 282 13.12%2150
Figure 6.15 (from Gush et al., 2011) shows data not collected as part of the present study, but
is included here for comparison with the ten sites in this study. The graph displays the number
of registered users versus age for 75 DD sites around South Africa, with data up to January
2008. It shows a distribution similar to that of the present study. The single age with the most
registered users was age 14, followed by ages 12, 13 and 15 respectively. There was a
noticeable trend of declining registrations from the early teens, through to older adults.
As in the present study, user registrations in the 6–9 age group were extremely low, as were
registrations in the 26+ age group.
Section 6.7.3 presents the stereotypical profiles of the ages of users at each of the ten sites,
enabling a site-by-site comparison of age distributions, per age grouping.
Chapter 6 – Quantitative data collection and analysis 105
Figure 6.14: Registered users per age group
Figure 6.15: Age distribution of registered users (75 sites)
12
34
56
78
910
1112
1314
1516
1718
1920
2122
2324
2526
2728
2930
3132
3334
3536
3738
3940
4142
4344
4546
4748
4950
0
100
200
300
400
500
600
Reg. Users
Age
0%
10%
20%
30%
40%
50%
60%
70%
80%
90%
100%
1.95%
23.30%
23.63%
20.19%
8.42%
9.40%
13.12%
0 – 5, 61+26 – 6022 – 2518 – 2114 – 1710 – 136 – 9
Pe
rce
nta
ge
re
g. u
sers
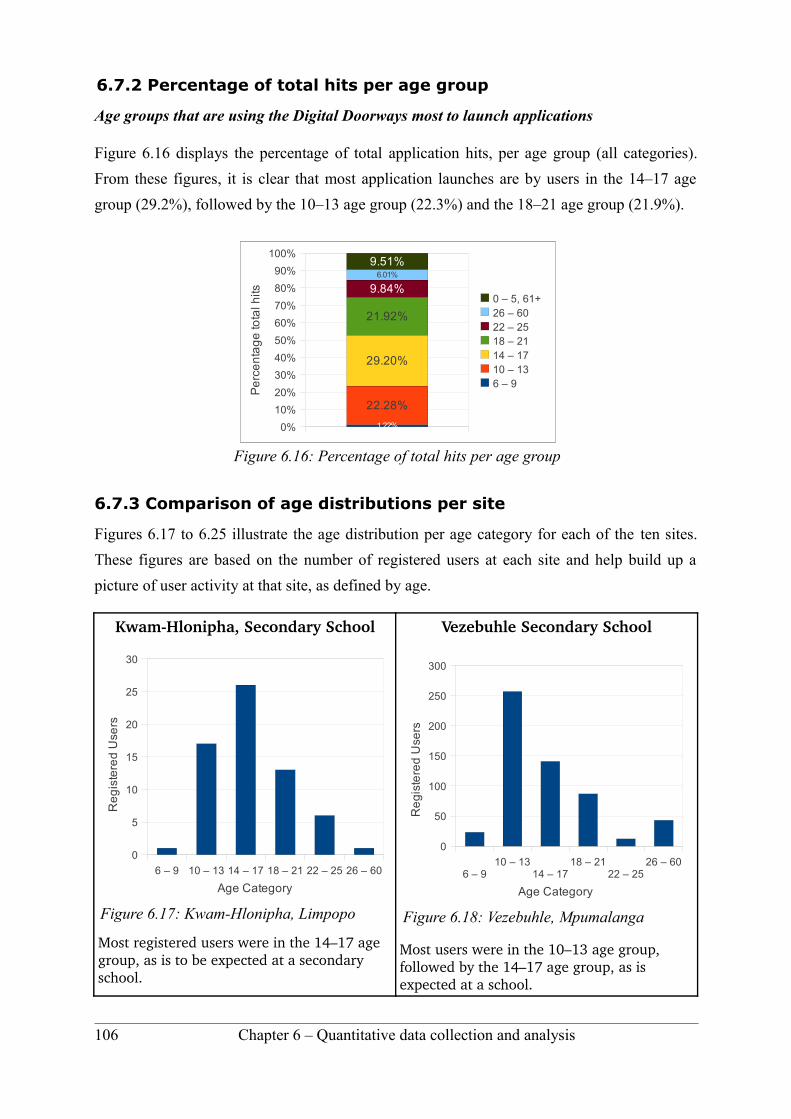
6.7.2 Percentage of total hits per age group
Age groups that are using the Digital Doorways most to launch applications
Figure 6.16 displays the percentage of total application hits, per age group (all categories).
From these figures, it is clear that most application launches are by users in the 14–17 age
group (29.2%), followed by the 10–13 age group (22.3%) and the 18–21 age group (21.9%).
6.7.3 Comparison of age distributions per site
Figures 6.17 to 6.25 illustrate the age distribution per age category for each of the ten sites.
These figures are based on the number of registered users at each site and help build up a
picture of user activity at that site, as defined by age.
KwamHlonipha, Secondary School
Most registered users were in the 14–17 age group, as is to be expected at a secondary school.
Vezebuhle Secondary School
Most users were in the 10–13 age group, followed by the 14–17 age group, as is expected at a school.
106 Chapter 6 – Quantitative data collection and analysis
Figure 6.16: Percentage of total hits per age group
0%
10%
20%
30%
40%
50%
60%
70%
80%
90%
100%
1.22%
22.28%
29.20%
21.92%
9.84%6.01%
9.51%
0 – 5, 61+26 – 6022 – 2518 – 2114 – 1710 – 136 – 9
Pe
rce
nta
ge
tot a
l hits
Figure 6.17: Kwam-Hlonipha, Limpopo
6 – 9 10 – 13 14 – 17 18 – 21 22 – 25 26 – 60
0
5
10
15
20
25
30
Age Category
Re
gis
tere
d U
s ers
Figure 6.18: Vezebuhle, Mpumalanga
6 – 910 – 13
14 – 1718 – 21
22 – 2526 – 60
0
50
100
150
200
250
300
Age Category
Re
gis
tere
d U
s ers
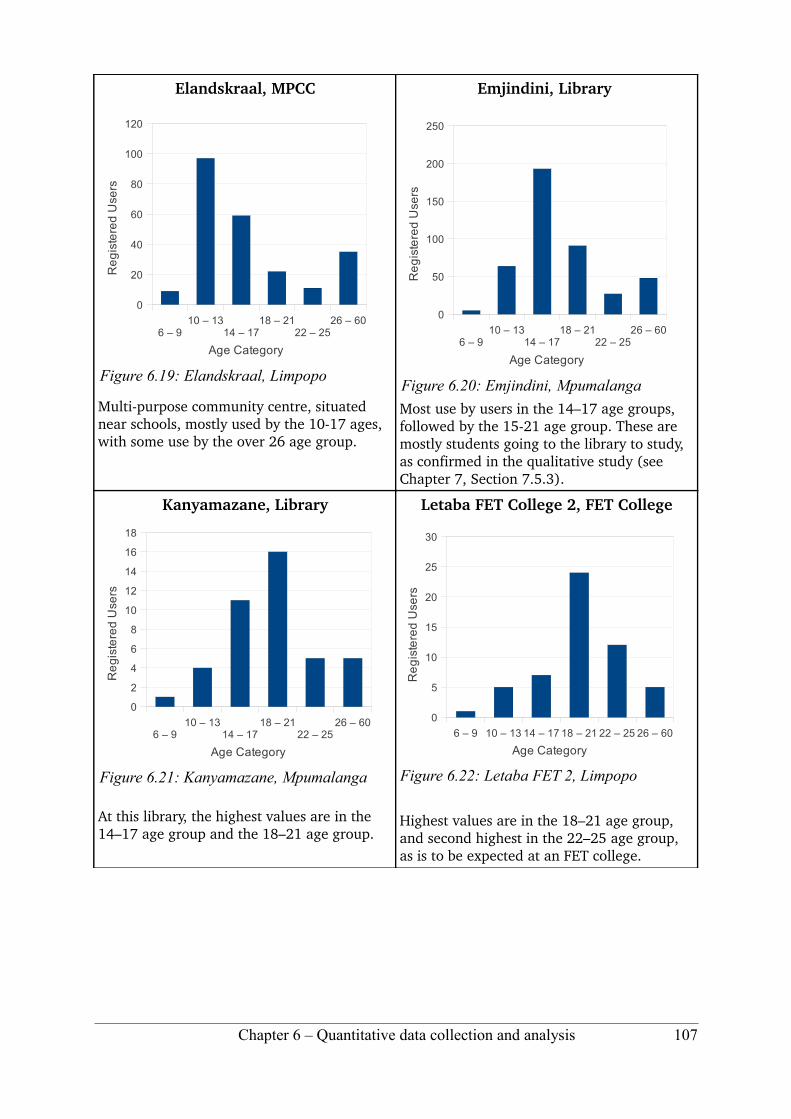
Elandskraal, MPCC
Multipurpose community centre, situated near schools, mostly used by the 1017 ages, with some use by the over 26 age group.
Emjindini, Library
Most use by users in the 14–17 age groups, followed by the 1521 age group. These are mostly students going to the library to study, as confirmed in the qualitative study (see Chapter 7, Section 7.5.3).
Kanyamazane, Library
At this library, the highest values are in the 14–17 age group and the 18–21 age group.
Letaba FET College 2, FET College
Highest values are in the 18–21 age group, and second highest in the 22–25 age group, as is to be expected at an FET college.
Chapter 6 – Quantitative data collection and analysis 107
Figure 6.19: Elandskraal, Limpopo
6 – 910 – 13
14 – 1718 – 21
22 – 2526 – 60
0
20
40
60
80
100
120
Age Category
Re
gis
tere
d U
s ers
Figure 6.20: Emjindini, Mpumalanga
6 – 910 – 13
14 – 1718 – 21
22 – 2526 – 60
0
50
100
150
200
250
Age Category
Re
gis
tere
d U
s ers
Figure 6.21: Kanyamazane, Mpumalanga
6 – 910 – 13
14 – 1718 – 21
22 – 2526 – 60
0
2
4
6
8
10
12
14
16
18
Age Category
Re
gis
tere
d U
s ers
Figure 6.22: Letaba FET 2, Limpopo
6 – 9 10 – 13 14 – 17 18 – 21 22 – 25 26 – 60
0
5
10
15
20
25
30
Age Category
Re
gis
tere
d U
s ers
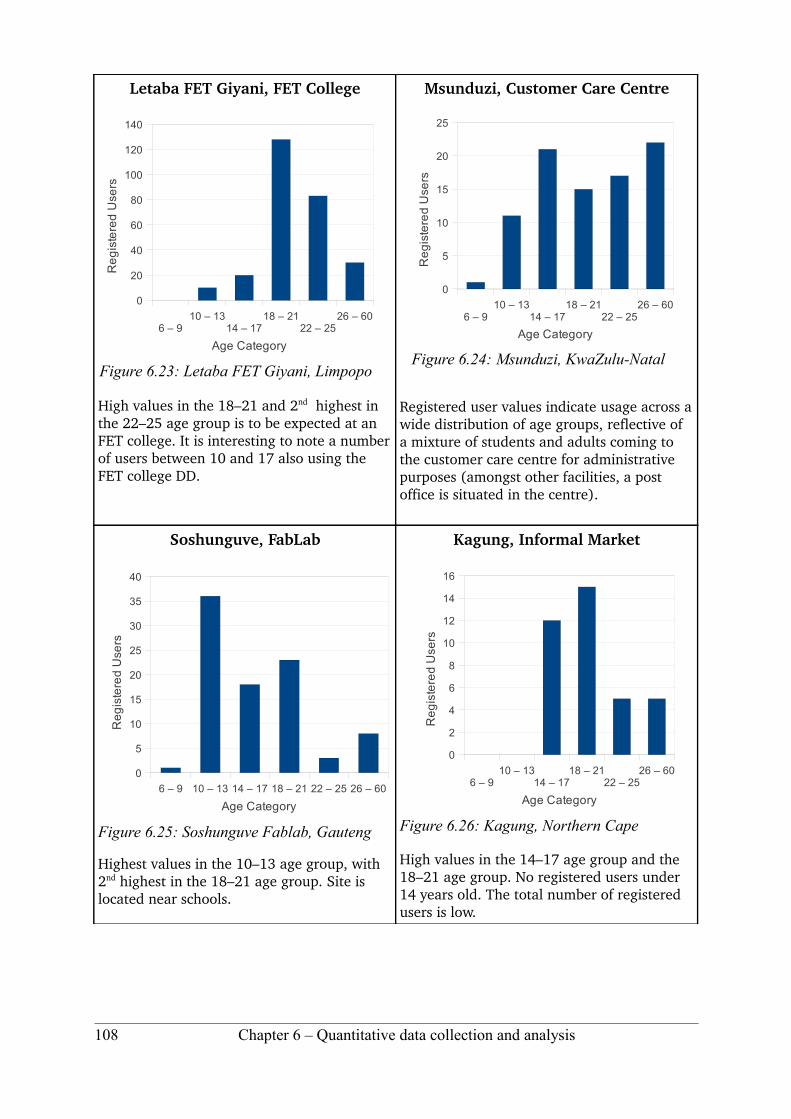
Letaba FET Giyani, FET College
High values in the 18–21 and 2nd highest in the 22–25 age group is to be expected at an FET college. It is interesting to note a number of users between 10 and 17 also using the FET college DD.
Msunduzi, Customer Care Centre
Registered user values indicate usage across a wide distribution of age groups, reflective of a mixture of students and adults coming to the customer care centre for administrative purposes (amongst other facilities, a post office is situated in the centre).
Soshunguve, FabLab
Highest values in the 10–13 age group, with 2nd highest in the 18–21 age group. Site is located near schools.
Kagung, Informal Market
High values in the 14–17 age group and the 18–21 age group. No registered users under 14 years old. The total number of registered users is low.
108 Chapter 6 – Quantitative data collection and analysis
Figure 6.23: Letaba FET Giyani, Limpopo
6 – 910 – 13
14 – 1718 – 21
22 – 2526 – 60
0
20
40
60
80
100
120
140
Age Category
Re
gis
tere
d U
s ers
Figure 6.24: Msunduzi, KwaZulu-Natal
6 – 910 – 13
14 – 1718 – 21
22 – 2526 – 60
0
5
10
15
20
25
Age Category
Re
gis
tere
d U
s ers
Figure 6.25: Soshunguve Fablab, Gauteng
6 – 9 10 – 13 14 – 17 18 – 21 22 – 25 26 – 60
0
5
10
15
20
25
30
35
40
Age Category
Re
gis
tere
d U
s ers
Figure 6.26: Kagung, Northern Cape
6 – 910 – 13
14 – 1718 – 21
22 – 2526 – 60
0
2
4
6
8
10
12
14
16
Age Category
Re
gis
tere
d U
s ers
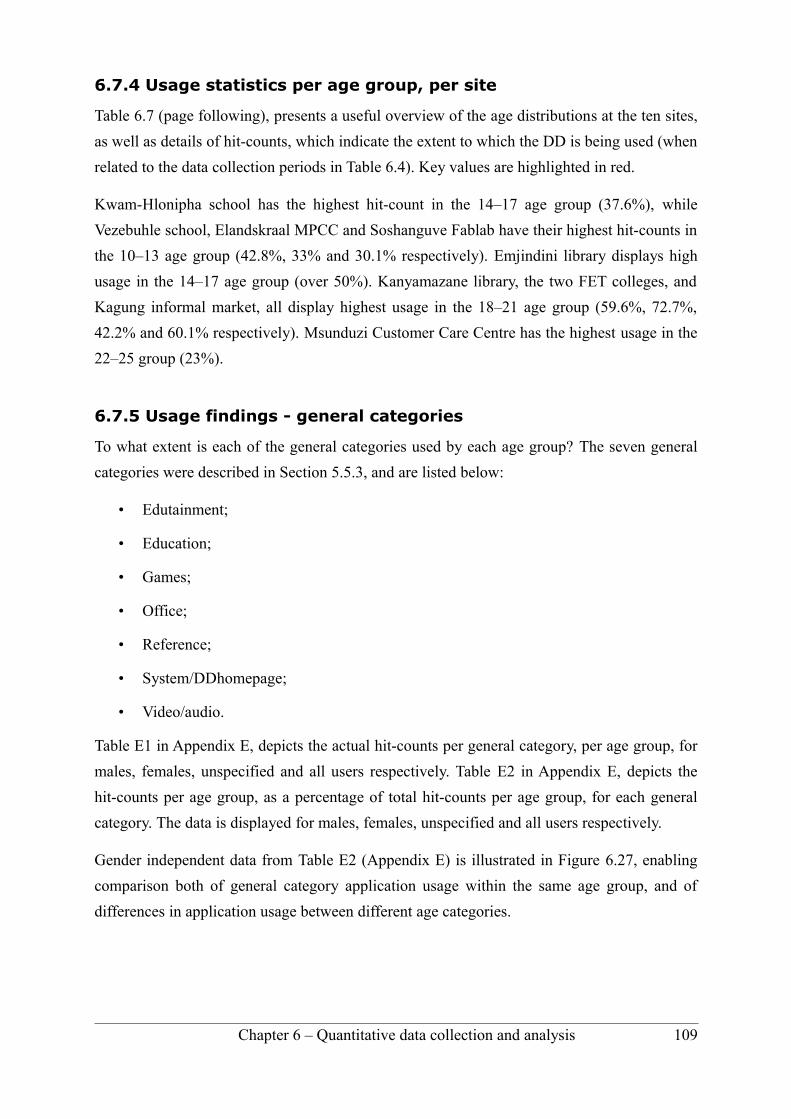
6.7.4 Usage statistics per age group, per site
Table 6.7 (page following), presents a useful overview of the age distributions at the ten sites,
as well as details of hit-counts, which indicate the extent to which the DD is being used (when
related to the data collection periods in Table 6.4). Key values are highlighted in red.
Kwam-Hlonipha school has the highest hit-count in the 14–17 age group (37.6%), while
Vezebuhle school, Elandskraal MPCC and Soshanguve Fablab have their highest hit-counts in
the 10–13 age group (42.8%, 33% and 30.1% respectively). Emjindini library displays high
usage in the 14–17 age group (over 50%). Kanyamazane library, the two FET colleges, and
Kagung informal market, all display highest usage in the 18–21 age group (59.6%, 72.7%,
42.2% and 60.1% respectively). Msunduzi Customer Care Centre has the highest usage in the
22–25 group (23%).
6.7.5 Usage findings - general categories
To what extent is each of the general categories used by each age group? The seven general
categories were described in Section 5.5.3, and are listed below:
• Edutainment;
• Education;
• Games;
• Office;
• Reference;
• System/DDhomepage;
• Video/audio.
Table E1 in Appendix E, depicts the actual hit-counts per general category, per age group, for
males, females, unspecified and all users respectively. Table E2 in Appendix E, depicts the
hit-counts per age group, as a percentage of total hit-counts per age group, for each general
category. The data is displayed for males, females, unspecified and all users respectively.
Gender independent data from Table E2 (Appendix E) is illustrated in Figure 6.27, enabling
comparison both of general category application usage within the same age group, and of
differences in application usage between different age categories.
Chapter 6 – Quantitative data collection and analysis 109
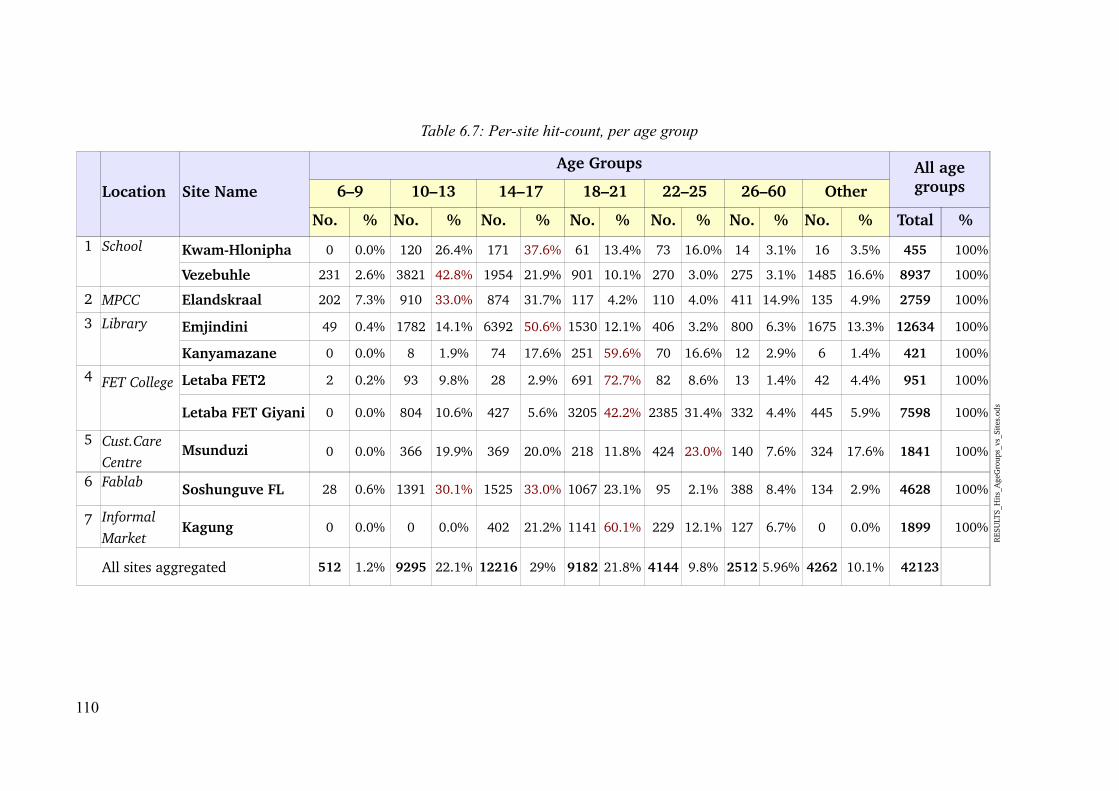
Table 6.7: Per-site hit-count, per age group
Location Site Name
Age Groups All age groups
RES
ULT
S_H
its_
Age
Gro
ups_
vs_S
ites
.ods
6–9 10–13 14–17 18–21 22–25 26–60 Other
No. % No. % No. % No. % No. % No. % No. % Total %
1 School KwamHlonipha 0 0.0% 120 26.4% 171 37.6% 61 13.4% 73 16.0% 14 3.1% 16 3.5% 455 100%
Vezebuhle 231 2.6% 3821 42.8% 1954 21.9% 901 10.1% 270 3.0% 275 3.1% 1485 16.6% 8937 100%
2 MPCC Elandskraal 202 7.3% 910 33.0% 874 31.7% 117 4.2% 110 4.0% 411 14.9% 135 4.9% 2759 100%
3 Library Emjindini 49 0.4% 1782 14.1% 6392 50.6% 1530 12.1% 406 3.2% 800 6.3% 1675 13.3% 12634 100%
Kanyamazane 0 0.0% 8 1.9% 74 17.6% 251 59.6% 70 16.6% 12 2.9% 6 1.4% 421 100%
4 FET College Letaba FET2 2 0.2% 93 9.8% 28 2.9% 691 72.7% 82 8.6% 13 1.4% 42 4.4% 951 100%
Letaba FET Giyani 0 0.0% 804 10.6% 427 5.6% 3205 42.2% 2385 31.4% 332 4.4% 445 5.9% 7598 100%
5 Cust.Care Centre
Msunduzi 0 0.0% 366 19.9% 369 20.0% 218 11.8% 424 23.0% 140 7.6% 324 17.6% 1841 100%
6 Fablab Soshunguve FL 28 0.6% 1391 30.1% 1525 33.0% 1067 23.1% 95 2.1% 388 8.4% 134 2.9% 4628 100%
7 Informal Market
Kagung 0 0.0% 0 0.0% 402 21.2% 1141 60.1% 229 12.1% 127 6.7% 0 0.0% 1899 100%
All sites aggregated 512 1.2% 9295 22.1% 12216 29% 9182 21.8% 4144 9.8% 2512 5.96% 4262 10.1% 42123
110
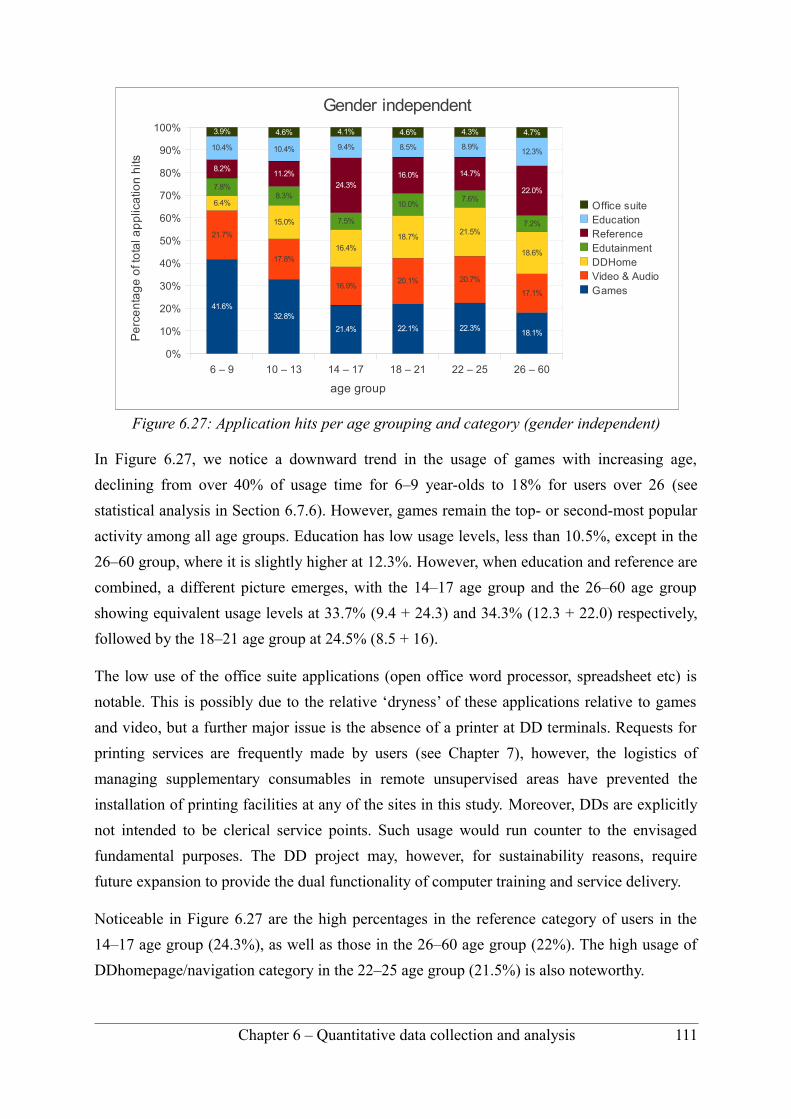
In Figure 6.27, we notice a downward trend in the usage of games with increasing age,
declining from over 40% of usage time for 6–9 year-olds to 18% for users over 26 (see
statistical analysis in Section 6.7.6). However, games remain the top- or second-most popular
activity among all age groups. Education has low usage levels, less than 10.5%, except in the
26–60 group, where it is slightly higher at 12.3%. However, when education and reference are
combined, a different picture emerges, with the 14–17 age group and the 26–60 age group
showing equivalent usage levels at 33.7% (9.4 + 24.3) and 34.3% (12.3 + 22.0) respectively,
followed by the 18–21 age group at 24.5% (8.5 + 16).
The low use of the office suite applications (open office word processor, spreadsheet etc) is
notable. This is possibly due to the relative ‘dryness’ of these applications relative to games
and video, but a further major issue is the absence of a printer at DD terminals. Requests for
printing services are frequently made by users (see Chapter 7), however, the logistics of
managing supplementary consumables in remote unsupervised areas have prevented the
installation of printing facilities at any of the sites in this study. Moreover, DDs are explicitly
not intended to be clerical service points. Such usage would run counter to the envisaged
fundamental purposes. The DD project may, however, for sustainability reasons, require
future expansion to provide the dual functionality of computer training and service delivery.
Noticeable in Figure 6.27 are the high percentages in the reference category of users in the
14–17 age group (24.3%), as well as those in the 26–60 age group (22%). The high usage of
DDhomepage/navigation category in the 22–25 age group (21.5%) is also noteworthy.
Chapter 6 – Quantitative data collection and analysis 111
Figure 6.27: Application hits per age grouping and category (gender independent)
6 – 9 10 – 13 14 – 17 18 – 21 22 – 25 26 – 60
0%
10%
20%
30%
40%
50%
60%
70%
80%
90%
100%
41.6%32.8%
21.4% 22.1% 22.3%18.1%
21.7%
17.8%
16.9%20.1% 20.7%
17.1%
6.4%
15.0%
16.4%
18.7%21.5%
18.6%
7.8%8.3%
7.5%
10.0%7.6%
7.2%
8.2%11.2%
24.3%16.0% 14.7%
22.0%
10.4% 10.4% 9.4% 8.5% 8.9%12.3%
3.9% 4.6% 4.1% 4.6% 4.3% 4.7%
Gender independent
Office suiteEducationReferenceEdutainmentDDHomeVideo & AudioGames
age group
Pe
rce
nta
ge
of t
ota
l ap
plic
atio
n h
its

6.7.6 Significance of relationship between application usage and age category
Pearson's Chi-square test
Pearson's Chi-square test for a (row x column) frequency table is used to determine the degree
of statistical significance between age category and application category usage. Table E3 (in
Appendix E), displays application usage hit-counts versus age categories for all users
regardless of gender. In addition, Table E3 displays the cell Chi-square values for each entry.
Data for users in the 0–5, 61+ category were excluded from the analysis. The resultant Chi-
square calculation is:
Table 6.8: Chi-square for age versus application usage
Statistic DF ValueChiSquare 30 1325.6277
Sample Size = 37852
The Pearson’s Chi-square statistic with a value of 1325.63 is statistically highly significant.
The probability associated with the Chi-square statistic is less than 0.001, which indicates
significance on the 0.1% level of significance. Statistical significance in this instance means
that the two variables that are represented by the rows and columns of the frequency table
(age and user application, Table E3) are statistically significantly dependent. (The null
hypothesis examined with Chi-square tests of this nature always states that the two variables
are independent of one another). Dependence implies that application use is dependent on age,
or changes with age. Stated differently, dependence implies that, for a specific age group
(row), the distribution of application-use over the various applications (all columns) for that
age group differs from another/ or some other age group usage distributions. The distribution
of usage-proportion differs.
Since the cell-Chi-square value-entries of individual cells in Table E3 add up to the Pearson
Chi-square statistic above, the individual cell-chi-square values can assist in identifying
usage-distributions that differ significantly for different age groups. For example, age groups
6–9 and 14–17, differ with respect to the use of games versus referencing applications – 41%
of total application use of 6-9 year-olds is devoted to games, and 8% to referencing
applications; as compared to 21% games and 24% referencing usage by 14–17 year-olds.
Another example would be the 10–13 year group compared to the 26+ group: their games
application usage and reference application usage patterns differ significantly. A final
example would be comparing the 6–9 and 10–13 year age groups, where usage patterns on
games, DDhomepage, and referencing, differ statistically.
112 Chapter 6 – Quantitative data collection and analysis
Trend tests
The same reasoning can be followed to compare how, over age categories, usage of two or
more applications differs. For Table E3, this approach was taken one step further by
comparing the usage ratio of pairs of columns in Trend tests. The purpose of these specific
tests is to determine whether trends in application usage over age, differ statistically
significantly between applications. The specific type of test is referred to as the Cochran-
Armitage Trend test. Three separate, pairwise tests are presented in Table 6.9, to investigate
trend differences over age between,
• Games and video/audio;
• Games and DDhomepage;
• Games and reference.
The first section of Table 6.9 presents the usage frequencies and percentages, and the second
section, the test statistics and significance measures.
Interpretation of Table 6.9
Significance on the 0.1% level of significance is associated with the three Chi-square statistics
of 192.05, 401.24, and 880.84, for the three age versus 2-factor application usage frequency
tables respectively. This implies that there are statistically significant relationships
(dependencies) between the frequency usage of games and video/audio; games and
DDhomepage; and games and reference.
The second test, the Cochran-Armitage trend test, confirms the statistical significance of the
dependencies, but also indicates the type of relationship that exists between the frequency
proportions of paired applications. The trend test examines the statistical significance of a
trend in binomial proportions over the levels of age categories. If a statistically significant
trend is established (as has been done in the three instances), this implies that the proportion
of row frequencies (frequency proportions between column 1 and total row frequencies) in
column 1 (the first usage variable in this instance, which will be ‘games’) either decrease or
increase over classification categories (increase in age). At the same time, proportion of row
frequencies of column 2 – the paired application category usage–will decrease or increase
adversely. The value of the Cochran-Armitage trend test statistic assists in this respect: if the
value is negative, the proportions trend over the column 1 variable is decreasing, and the row-
proportions trend of the second column variable is increasing.
Chapter 6 – Quantitative data collection and analysis 113

Since all three trend test statistics were negative in this instance (and highly significant with
associated probabilities of less than 0.0001), statistically significant decreasing age-related
trends were established for the pair-wise tests of games versus video/audio, DDhomepage and
referencing. In other words: over ascending age categories;
• There is a statistically significant decreasing trend in games utilisation and increasing trend in video/audio utilisation;
• There is a statistically significant decreasing trend in games utilisation and increasing DDhomepage utilisation trend;
• There is a statistically significant decreasing trend in games utilisation and increasing referencing utilisation.
These trends can be visualised by referring back to Figure 6.27.
Table 6.9: Cochran-Armitage age-trend tests on three pairs of application usage variables
Age cat. Games Video/audio
Total Games DD home
Total Games Reference
TotalFrequency
Cell ChiSq.Row %
69213
4.151865.74
1115.544334.26
324 21333.59386.59
3347.07513.41
246 21328.17583.53
4239.19116.47
255
1013304748.0964.83
165364.2235.17
4700 304779.80668.60
1395111.8331.40
4442 3047187.6874.52
1042261.0625.48
4089
14172606
1.469855.84
20611.962744.16
4667 26064.217556.06
20435.91
43.94
4649 2606121.9546.88
2953169.6453.12
5559
18212018
14.83552.48
182719.81147.52
3845 201815.24553.50
175421.36346.50
3772 20180.014258.02
14600.019841.98
3478
2225919
8.664651.89
85211.57148.11
1771 91920.76550.22
91129.09849.78
1830 9191.140760.26
6061.586739.74
1525
2660454
5.023651.47
4286.708548.53
882 45413.46549.13
47018.86950.87
924 45429.43645.13
55240.94554.87
1006
Total 9257 6932 16189 9257 6606 15863 9257 6655 15912
Test statisticsPearson’s Chisquare = 192.05,
Pr <0.0001***Chisquare = 401.24,
Pr <0.0001***Chisquare = 880.84,
Pr <0.0001***CochranArmitage trend test
Zstatistic= 12.31Onesided Pr < Z is,
<0.0001***
Zstatistic= 17.76Onesided Pr < Z is,
<0.0001***
Zstatistic= 15.42Onesided Pr < Z is,
<0.0001***Significance legend: * : Significance on the 5% level of significance (probability is less than 0.05) ** : Significance on the 1% level of significance (probability is less than 0.01) *** : Significance on the 0.1% level of significance (probability is less than 0,001)
114 Chapter 6 – Quantitative data collection and analysis
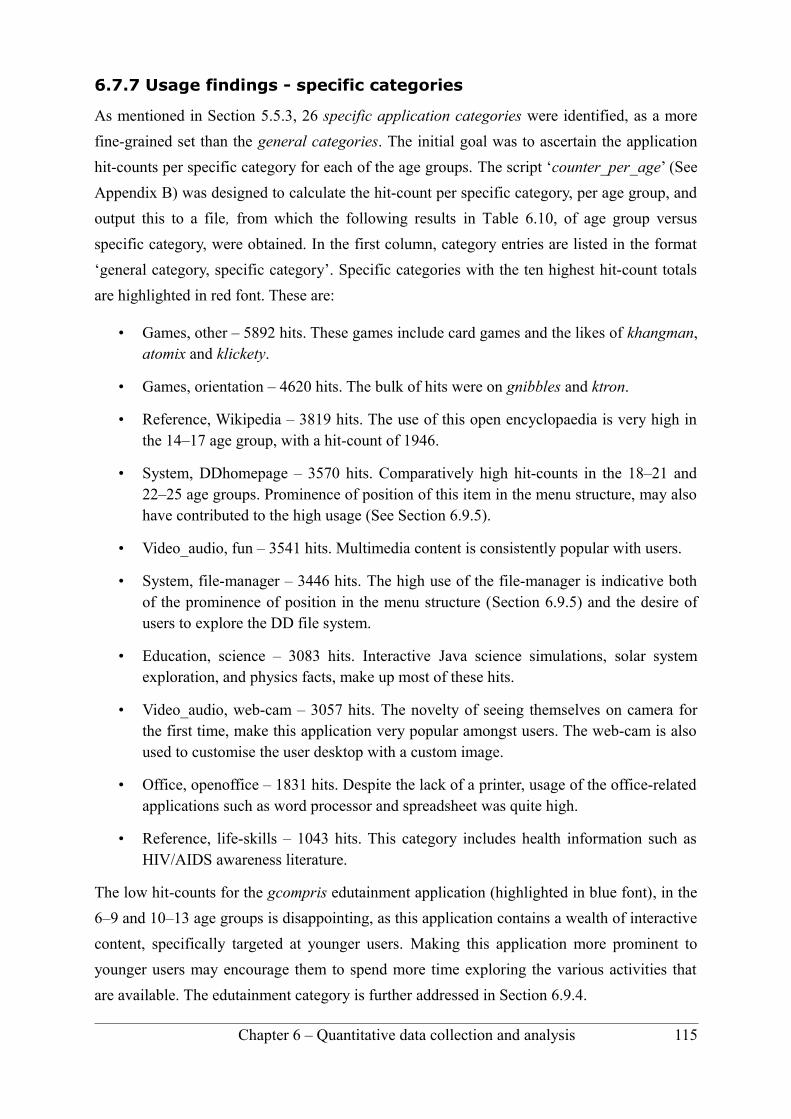
6.7.7 Usage findings - specific categories
As mentioned in Section 5.5.3, 26 specific application categories were identified, as a more
fine-grained set than the general categories. The initial goal was to ascertain the application
hit-counts per specific category for each of the age groups. The script ‘counter_per_age’ (See
Appendix B) was designed to calculate the hit-count per specific category, per age group, and
output this to a file, from which the following results in Table 6.10, of age group versus
specific category, were obtained. In the first column, category entries are listed in the format
‘general category, specific category’. Specific categories with the ten highest hit-count totals
are highlighted in red font. These are:
• Games, other – 5892 hits. These games include card games and the likes of khangman, atomix and klickety.
• Games, orientation – 4620 hits. The bulk of hits were on gnibbles and ktron.
• Reference, Wikipedia – 3819 hits. The use of this open encyclopaedia is very high in the 14–17 age group, with a hit-count of 1946.
• System, DDhomepage – 3570 hits. Comparatively high hit-counts in the 18–21 and 22–25 age groups. Prominence of position of this item in the menu structure, may also have contributed to the high usage (See Section 6.9.5).
• Video_audio, fun – 3541 hits. Multimedia content is consistently popular with users.
• System, file-manager – 3446 hits. The high use of the file-manager is indicative both of the prominence of position in the menu structure (Section 6.9.5) and the desire of users to explore the DD file system.
• Education, science – 3083 hits. Interactive Java science simulations, solar system exploration, and physics facts, make up most of these hits.
• Video_audio, web-cam – 3057 hits. The novelty of seeing themselves on camera for the first time, make this application very popular amongst users. The web-cam is also used to customise the user desktop with a custom image.
• Office, openoffice – 1831 hits. Despite the lack of a printer, usage of the office-related applications such as word processor and spreadsheet was quite high.
• Reference, life-skills – 1043 hits. This category includes health information such as HIV/AIDS awareness literature.
The low hit-counts for the gcompris edutainment application (highlighted in blue font), in the
6–9 and 10–13 age groups is disappointing, as this application contains a wealth of interactive
content, specifically targeted at younger users. Making this application more prominent to
younger users may encourage them to spend more time exploring the various activities that
are available. The edutainment category is further addressed in Section 6.9.4.
Chapter 6 – Quantitative data collection and analysis 115
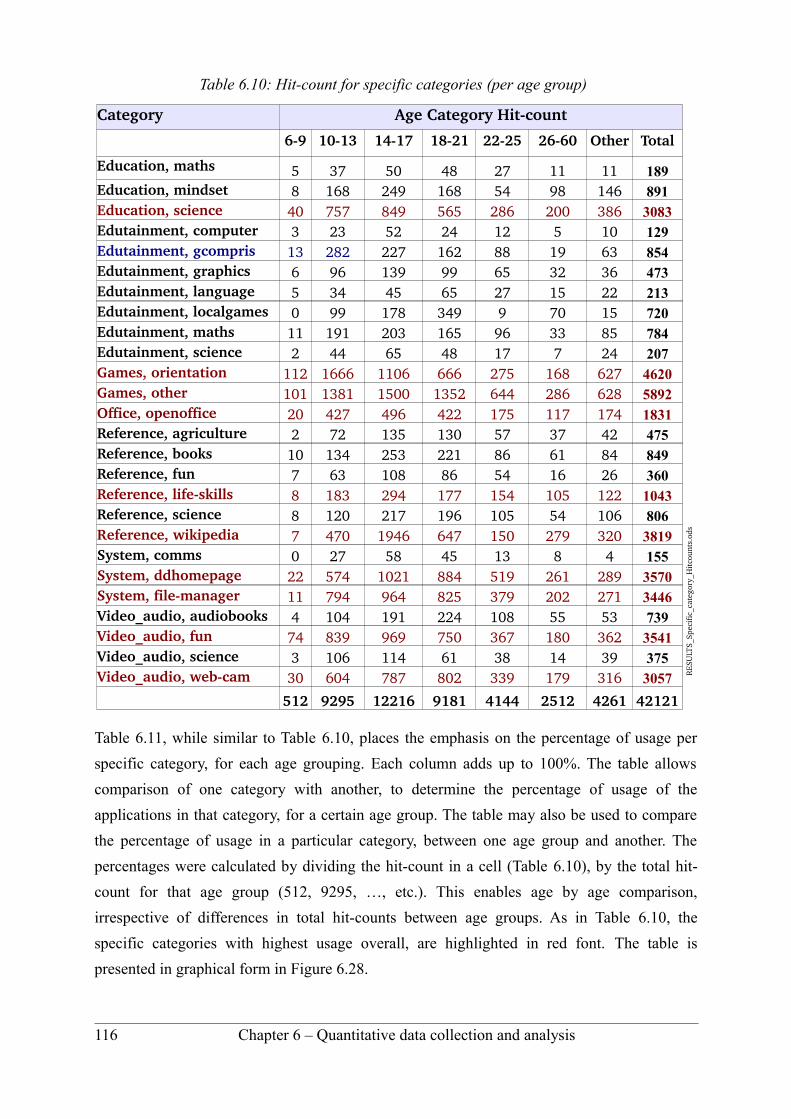
Table 6.10: Hit-count for specific categories (per age group)
Category Age Category Hitcount
RES
ULT
S_Sp
ecifi
c_ca
tego
ry_H
itco
unts
.ods
69 1013 1417 1821 2225 2660 Other Total
Education, maths 5 37 50 48 27 11 11 189Education, mindset 8 168 249 168 54 98 146 891Education, science 40 757 849 565 286 200 386 3083Edutainment, computer 3 23 52 24 12 5 10 129Edutainment, gcompris 13 282 227 162 88 19 63 854Edutainment, graphics 6 96 139 99 65 32 36 473Edutainment, language 5 34 45 65 27 15 22 213Edutainment, localgames 0 99 178 349 9 70 15 720Edutainment, maths 11 191 203 165 96 33 85 784Edutainment, science 2 44 65 48 17 7 24 207Games, orientation 112 1666 1106 666 275 168 627 4620Games, other 101 1381 1500 1352 644 286 628 5892Office, openoffice 20 427 496 422 175 117 174 1831Reference, agriculture 2 72 135 130 57 37 42 475Reference, books 10 134 253 221 86 61 84 849Reference, fun 7 63 108 86 54 16 26 360Reference, lifeskills 8 183 294 177 154 105 122 1043Reference, science 8 120 217 196 105 54 106 806Reference, wikipedia 7 470 1946 647 150 279 320 3819System, comms 0 27 58 45 13 8 4 155System, ddhomepage 22 574 1021 884 519 261 289 3570System, filemanager 11 794 964 825 379 202 271 3446Video_audio, audiobooks 4 104 191 224 108 55 53 739Video_audio, fun 74 839 969 750 367 180 362 3541Video_audio, science 3 106 114 61 38 14 39 375Video_audio, webcam 30 604 787 802 339 179 316 3057
512 9295 12216 9181 4144 2512 4261 42121
Table 6.11, while similar to Table 6.10, places the emphasis on the percentage of usage per
specific category, for each age grouping. Each column adds up to 100%. The table allows
comparison of one category with another, to determine the percentage of usage of the
applications in that category, for a certain age group. The table may also be used to compare
the percentage of usage in a particular category, between one age group and another. The
percentages were calculated by dividing the hit-count in a cell (Table 6.10), by the total hit-
count for that age group (512, 9295, …, etc.). This enables age by age comparison,
irrespective of differences in total hit-counts between age groups. As in Table 6.10, the
specific categories with highest usage overall, are highlighted in red font. The table is
presented in graphical form in Figure 6.28.
116 Chapter 6 – Quantitative data collection and analysis
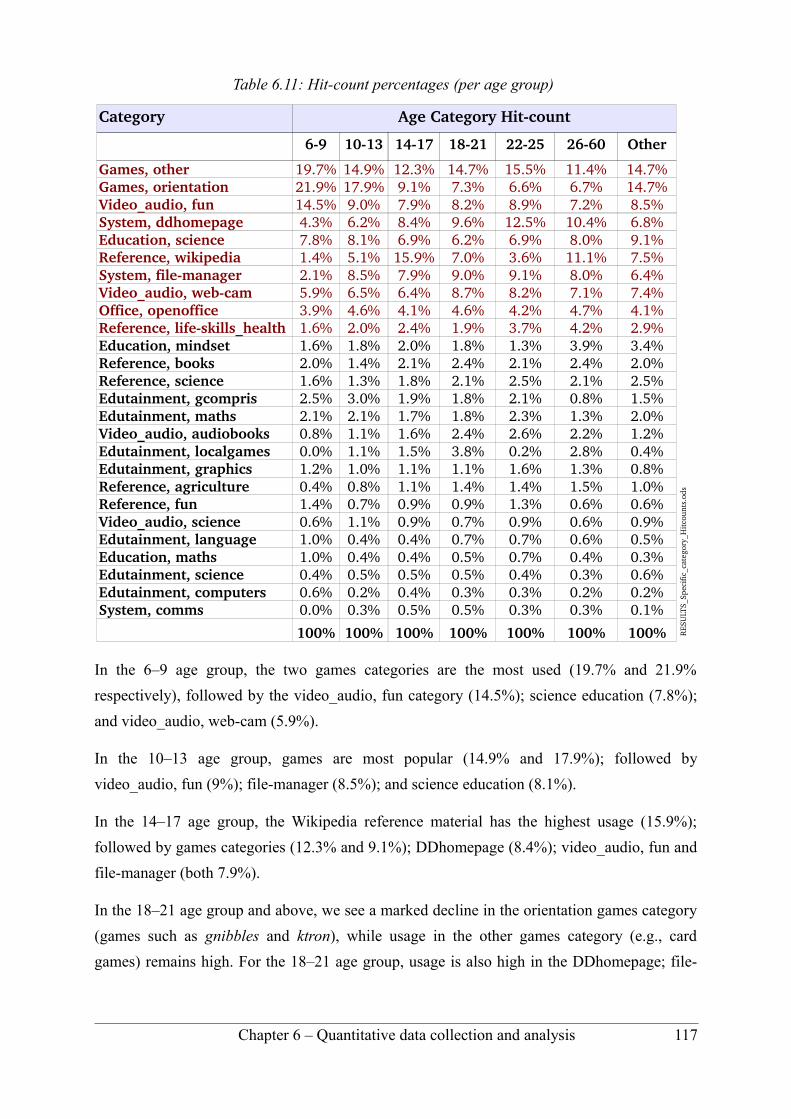
Table 6.11: Hit-count percentages (per age group)
Category Age Category Hitcount
RES
ULT
S_Sp
ecifi
c_ca
tego
ry_H
itco
unts
.ods
69 1013 1417 1821 2225 2660 Other
Games, other 19.7% 14.9% 12.3% 14.7% 15.5% 11.4% 14.7%Games, orientation 21.9% 17.9% 9.1% 7.3% 6.6% 6.7% 14.7%Video_audio, fun 14.5% 9.0% 7.9% 8.2% 8.9% 7.2% 8.5%System, ddhomepage 4.3% 6.2% 8.4% 9.6% 12.5% 10.4% 6.8%Education, science 7.8% 8.1% 6.9% 6.2% 6.9% 8.0% 9.1%Reference, wikipedia 1.4% 5.1% 15.9% 7.0% 3.6% 11.1% 7.5%System, filemanager 2.1% 8.5% 7.9% 9.0% 9.1% 8.0% 6.4%Video_audio, webcam 5.9% 6.5% 6.4% 8.7% 8.2% 7.1% 7.4%Office, openoffice 3.9% 4.6% 4.1% 4.6% 4.2% 4.7% 4.1%Reference, lifeskills_health 1.6% 2.0% 2.4% 1.9% 3.7% 4.2% 2.9%Education, mindset 1.6% 1.8% 2.0% 1.8% 1.3% 3.9% 3.4%Reference, books 2.0% 1.4% 2.1% 2.4% 2.1% 2.4% 2.0%Reference, science 1.6% 1.3% 1.8% 2.1% 2.5% 2.1% 2.5%Edutainment, gcompris 2.5% 3.0% 1.9% 1.8% 2.1% 0.8% 1.5%Edutainment, maths 2.1% 2.1% 1.7% 1.8% 2.3% 1.3% 2.0%Video_audio, audiobooks 0.8% 1.1% 1.6% 2.4% 2.6% 2.2% 1.2%Edutainment, localgames 0.0% 1.1% 1.5% 3.8% 0.2% 2.8% 0.4%Edutainment, graphics 1.2% 1.0% 1.1% 1.1% 1.6% 1.3% 0.8%Reference, agriculture 0.4% 0.8% 1.1% 1.4% 1.4% 1.5% 1.0%Reference, fun 1.4% 0.7% 0.9% 0.9% 1.3% 0.6% 0.6%Video_audio, science 0.6% 1.1% 0.9% 0.7% 0.9% 0.6% 0.9%Edutainment, language 1.0% 0.4% 0.4% 0.7% 0.7% 0.6% 0.5%Education, maths 1.0% 0.4% 0.4% 0.5% 0.7% 0.4% 0.3%Edutainment, science 0.4% 0.5% 0.5% 0.5% 0.4% 0.3% 0.6%Edutainment, computers 0.6% 0.2% 0.4% 0.3% 0.3% 0.2% 0.2%System, comms 0.0% 0.3% 0.5% 0.5% 0.3% 0.3% 0.1%
100% 100% 100% 100% 100% 100% 100%
In the 6–9 age group, the two games categories are the most used (19.7% and 21.9%
respectively), followed by the video_audio, fun category (14.5%); science education (7.8%);
and video_audio, web-cam (5.9%).
In the 10–13 age group, games are most popular (14.9% and 17.9%); followed by
video_audio, fun (9%); file-manager (8.5%); and science education (8.1%).
In the 14–17 age group, the Wikipedia reference material has the highest usage (15.9%);
followed by games categories (12.3% and 9.1%); DDhomepage (8.4%); video_audio, fun and
file-manager (both 7.9%).
In the 18–21 age group and above, we see a marked decline in the orientation games category
(games such as gnibbles and ktron), while usage in the other games category (e.g., card
games) remains high. For the 18–21 age group, usage is also high in the DDhomepage; file-
Chapter 6 – Quantitative data collection and analysis 117
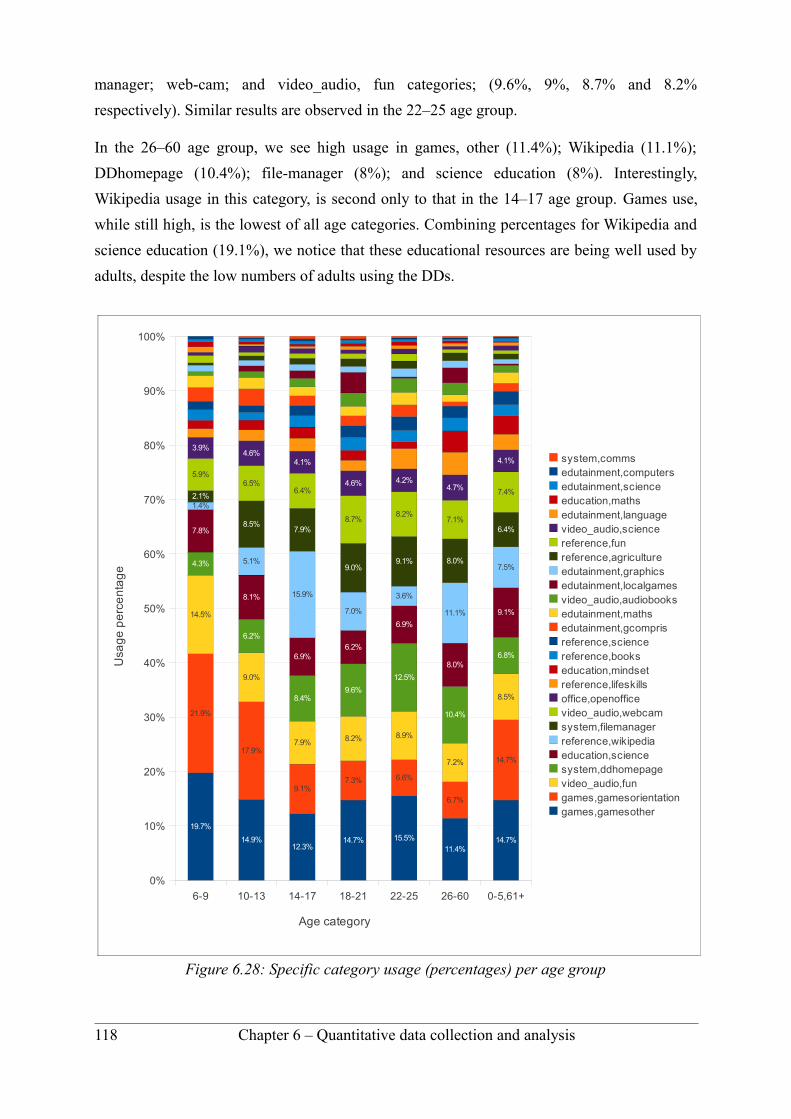
manager; web-cam; and video_audio, fun categories; (9.6%, 9%, 8.7% and 8.2%
respectively). Similar results are observed in the 22–25 age group.
In the 26–60 age group, we see high usage in games, other (11.4%); Wikipedia (11.1%);
DDhomepage (10.4%); file-manager (8%); and science education (8%). Interestingly,
Wikipedia usage in this category, is second only to that in the 14–17 age group. Games use,
while still high, is the lowest of all age categories. Combining percentages for Wikipedia and
science education (19.1%), we notice that these educational resources are being well used by
adults, despite the low numbers of adults using the DDs.
118 Chapter 6 – Quantitative data collection and analysis
Figure 6.28: Specific category usage (percentages) per age group
6-9 10-13 14-17 18-21 22-25 26-60 0-5,61+
0%
10%
20%
30%
40%
50%
60%
70%
80%
90%
100%
19.7%
14.9%12.3%
14.7% 15.5%
11.4%14.7%
21.9%
17.9%
9.1%7.3% 6.6%
6.7%
14.7%
14.5%
9.0%
7.9% 8.2% 8.9%
7.2%
8.5%
4.3%
6.2%
8.4%9.6%
12.5%
10.4%
6.8%
7.8%
8.1%
6.9%6.2%
6.9%
8.0%
9.1%
1.4%
5.1%
15.9%
7.0%
3.6%
11.1%
7.5%
2.1%
8.5%7.9%
9.0%9.1% 8.0%
6.4%
5.9%6.5%
6.4%
8.7%8.2%
7.1%
7.4%
3.9%4.6%
4.1%
4.6% 4.2%4.7%
4.1% system,commsedutainment,computersedutainment,scienceeducation,mathsedutainment,languagevideo_audio,sciencereference,funreference,agricultureedutainment,graphicsedutainment,localgamesvideo_audio,audiobooksedutainment,mathsedutainment,gcomprisreference,sciencereference,bookseducation,mindsetreference,lifeskillsoffice,openofficevideo_audio,webcamsystem,filemanagerreference,wikipediaeducation,sciencesystem,ddhomepagevideo_audio,fungames,gamesorientationgames,gamesother
Age category
Usa
ge
pe
rce
nta
ge
Figures E1 to E4 in Appendix E, show similar information to Table 6.10, Table 6.11, and
Figure 6.28, regarding specific categorised application usage by the various age groups. The
figures show both actual hit-counts, and percentages of total usage per age group. The
assignment of specific categories to general categories is indicated by means of colour boxes.
The results again indicate high games, multimedia and reference usage, but disappointingly
low usage of edutainment and certain reference materials, which were deliberatively placed in
DDs for their value in education.
6.7.8 Discussion
Coming back to our sub questions, ‘what are the general trends amongst all users regarding
application usage?’, and ‘are there notable relationships between the age of users and the
categories of applications accessed?’ we see that there are noticeable trends in the general
categories of games usage, reference application usage and system/DDhomepage usage.
High registrations and hit-counts were recorded in the 10–21 age group. On a per-site basis,
ages of registered users varied according to location, as well as being influenced by the site
surroundings (e.g. see Figure 6.19, Elandskraal MPCC, where high values of youths between
10 and 17 are as a result of nearby schools). Registrations at some sites were markedly higher
than at others (see Table 6.4).
There was a noticeable downward trend in games usage, with increasing age. Office
applications and educational resources were underutilised among all ages.
In the statistical analysis of the data, it became clear that age does statistically significantly
affect application choice, and that the most significant trends were observed between the
games category usage and video/audio, DDhomepage, and reference applications.
Specific category findings highlighted high usage of applications in the orientation games,
other games, Wikipedia, DDhomepage and fun video/audio categories; with some noticeable
variations when analysed per age category, e.g., high use of the Wikipedia in the 14–17 age
group (Table 6.10).
The low overall use of applications by adults (e.g. 26+) is a cause of concern. However, we
have an interesting duality in this 26–60 age group. Firstly, total registration and usage is low
– a negative finding, see Figure 6.14 (9.39% of total registered users), and Figure 6.16 (6.01%
of total hit-counts). Nevertheless, much of the usage that occurs is focused on knowledge
acquisition – a positive finding, emphasised in the discussion of Figure 6.27. Recom-
mendations for addressing the challenge of low usage by adults, are suggested in Section 8.8.
Chapter 6 – Quantitative data collection and analysis 119
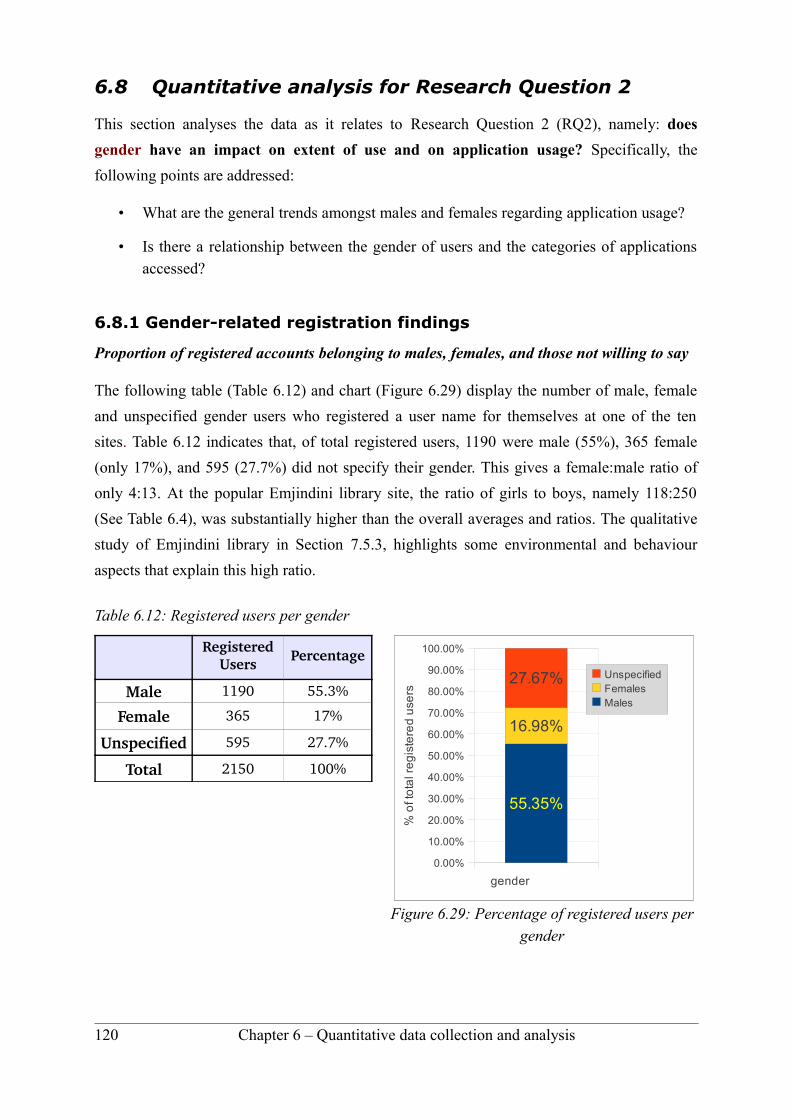
6.8 Quantitative analysis for Research Question 2
This section analyses the data as it relates to Research Question 2 (RQ2), namely: does
gender have an impact on extent of use and on application usage? Specifically, the
following points are addressed:
• What are the general trends amongst males and females regarding application usage?
• Is there a relationship between the gender of users and the categories of applications accessed?
6.8.1 Gender-related registration findings
Proportion of registered accounts belonging to males, females, and those not willing to say
The following table (Table 6.12) and chart (Figure 6.29) display the number of male, female
and unspecified gender users who registered a user name for themselves at one of the ten
sites. Table 6.12 indicates that, of total registered users, 1190 were male (55%), 365 female
(only 17%), and 595 (27.7%) did not specify their gender. This gives a female:male ratio of
only 4:13. At the popular Emjindini library site, the ratio of girls to boys, namely 118:250
(See Table 6.4), was substantially higher than the overall averages and ratios. The qualitative
study of Emjindini library in Section 7.5.3, highlights some environmental and behaviour
aspects that explain this high ratio.
Table 6.12: Registered users per gender
Registered Users Percentage
Male 1190 55.3%
Female 365 17%
Unspecified 595 27.7%
Total 2150 100%
120 Chapter 6 – Quantitative data collection and analysis
Figure 6.29: Percentage of registered users per gender
0.00%
10.00%
20.00%
30.00%
40.00%
50.00%
60.00%
70.00%
80.00%
90.00%
100.00%
55.35%
16.98%
27.67% UnspecifiedFemalesMales
gender
% o
f to
tal r
eg
iste
red
use
rs
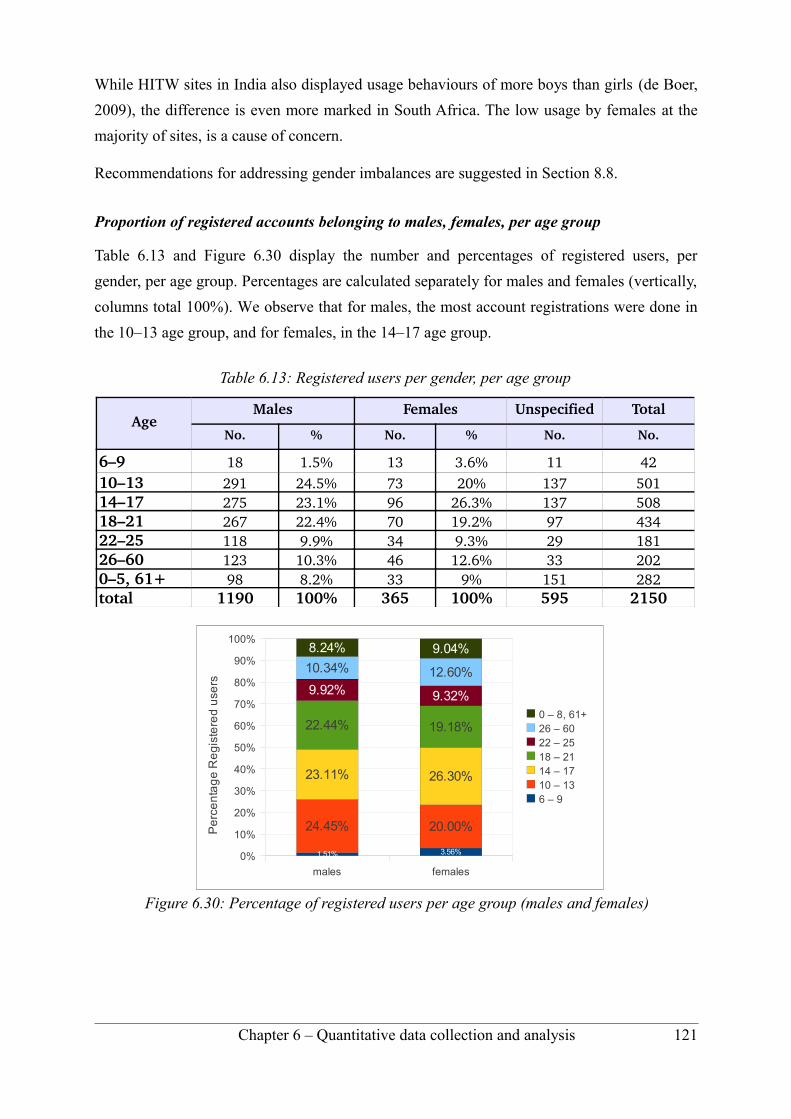
While HITW sites in India also displayed usage behaviours of more boys than girls (de Boer,
2009), the difference is even more marked in South Africa. The low usage by females at the
majority of sites, is a cause of concern.
Recommendations for addressing gender imbalances are suggested in Section 8.8.
Proportion of registered accounts belonging to males, females, per age group
Table 6.13 and Figure 6.30 display the number and percentages of registered users, per
gender, per age group. Percentages are calculated separately for males and females (vertically,
columns total 100%). We observe that for males, the most account registrations were done in
the 10–13 age group, and for females, in the 14–17 age group.
Table 6.13: Registered users per gender, per age group
AgeMales Females Unspecified Total
No. % No. % No. No.
6–9 18 1.5% 13 3.6% 11 4210–13 291 24.5% 73 20% 137 50114–17 275 23.1% 96 26.3% 137 50818–21 267 22.4% 70 19.2% 97 43422–25 118 9.9% 34 9.3% 29 18126–60 123 10.3% 46 12.6% 33 2020–5, 61+ 98 8.2% 33 9% 151 282total 1190 100% 365 100% 595 2150
Chapter 6 – Quantitative data collection and analysis 121
Figure 6.30: Percentage of registered users per age group (males and females)
males females
0%
10%
20%
30%
40%
50%
60%
70%
80%
90%
100%
1.51% 3.56%
24.45% 20.00%
23.11% 26.30%
22.44% 19.18%
9.92% 9.32%
10.34% 12.60%
8.24% 9.04%
0 – 8, 61+26 – 6022 – 2518 – 2114 – 1710 – 136 – 9
Pe
rce
nta
ge
Re
gis
tere
d u
ser s
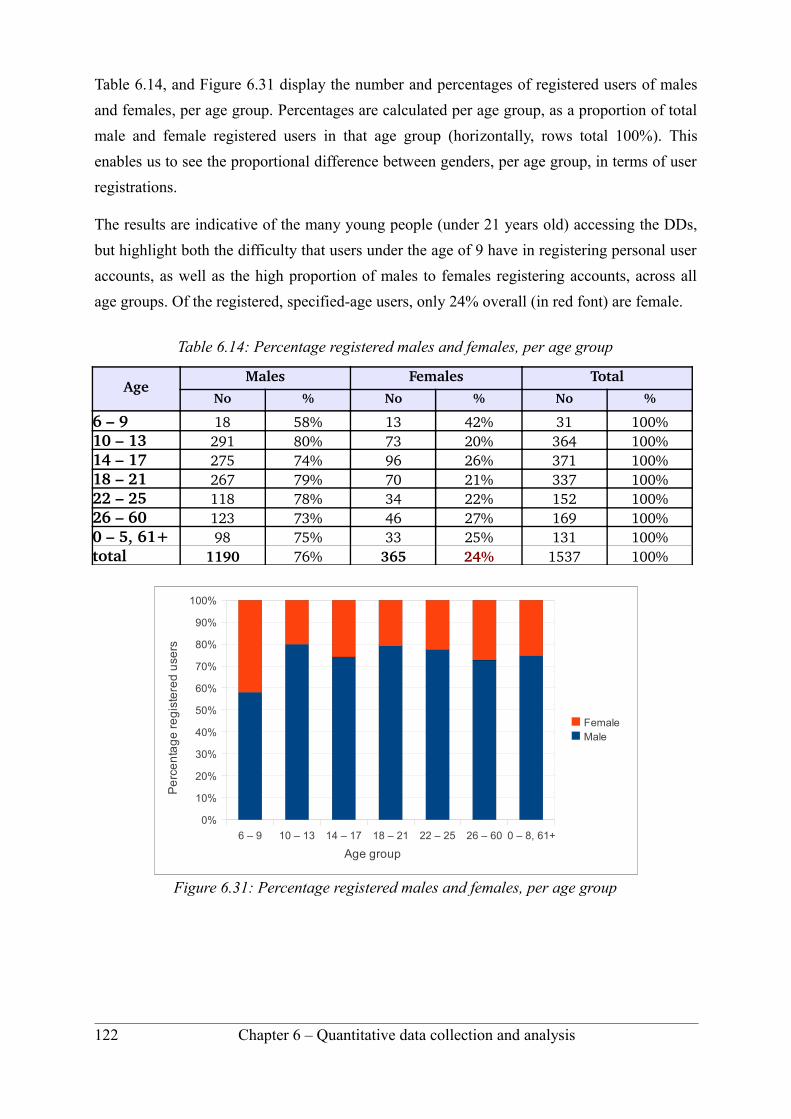
Table 6.14, and Figure 6.31 display the number and percentages of registered users of males
and females, per age group. Percentages are calculated per age group, as a proportion of total
male and female registered users in that age group (horizontally, rows total 100%). This
enables us to see the proportional difference between genders, per age group, in terms of user
registrations.
The results are indicative of the many young people (under 21 years old) accessing the DDs,
but highlight both the difficulty that users under the age of 9 have in registering personal user
accounts, as well as the high proportion of males to females registering accounts, across all
age groups. Of the registered, specified-age users, only 24% overall (in red font) are female.
Table 6.14: Percentage registered males and females, per age group
AgeMales Females Total
No % No % No %
6 – 9 18 58% 13 42% 31 100%10 – 13 291 80% 73 20% 364 100%14 – 17 275 74% 96 26% 371 100%18 – 21 267 79% 70 21% 337 100%22 – 25 118 78% 34 22% 152 100%26 – 60 123 73% 46 27% 169 100%0 – 5, 61+ 98 75% 33 25% 131 100%total 1190 76% 365 24% 1537 100%
122 Chapter 6 – Quantitative data collection and analysis
Figure 6.31: Percentage registered males and females, per age group
6 – 9 10 – 13 14 – 17 18 – 21 22 – 25 26 – 60 0 – 8, 61+
0%
10%
20%
30%
40%
50%
60%
70%
80%
90%
100%
FemaleMale
Age group
Pe
rce
nta
ge
re
gis
tere
d u
sers
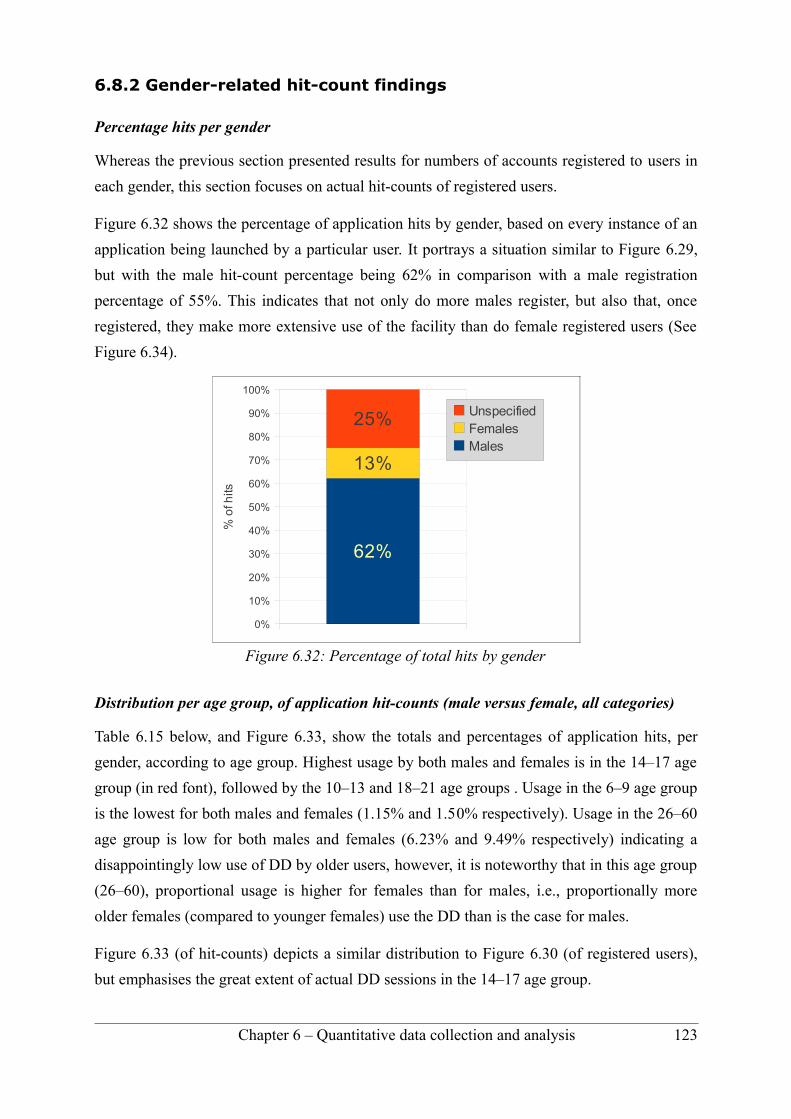
6.8.2 Gender-related hit-count findings
Percentage hits per gender
Whereas the previous section presented results for numbers of accounts registered to users in
each gender, this section focuses on actual hit-counts of registered users.
Figure 6.32 shows the percentage of application hits by gender, based on every instance of an
application being launched by a particular user. It portrays a situation similar to Figure 6.29,
but with the male hit-count percentage being 62% in comparison with a male registration
percentage of 55%. This indicates that not only do more males register, but also that, once
registered, they make more extensive use of the facility than do female registered users (See
Figure 6.34).
Distribution per age group, of application hit-counts (male versus female, all categories)
Table 6.15 below, and Figure 6.33, show the totals and percentages of application hits, per
gender, according to age group. Highest usage by both males and females is in the 14–17 age
group (in red font), followed by the 10–13 and 18–21 age groups . Usage in the 6–9 age group
is the lowest for both males and females (1.15% and 1.50% respectively). Usage in the 26–60
age group is low for both males and females (6.23% and 9.49% respectively) indicating a
disappointingly low use of DD by older users, however, it is noteworthy that in this age group
(26–60), proportional usage is higher for females than for males, i.e., proportionally more
older females (compared to younger females) use the DD than is the case for males.
Figure 6.33 (of hit-counts) depicts a similar distribution to Figure 6.30 (of registered users),
but emphasises the great extent of actual DD sessions in the 14–17 age group.
Chapter 6 – Quantitative data collection and analysis 123
Figure 6.32: Percentage of total hits by gender
0%
10%
20%
30%
40%
50%
60%
70%
80%
90%
100%
62%
13%
25% UnspecifiedFemalesMales
% o
f hits
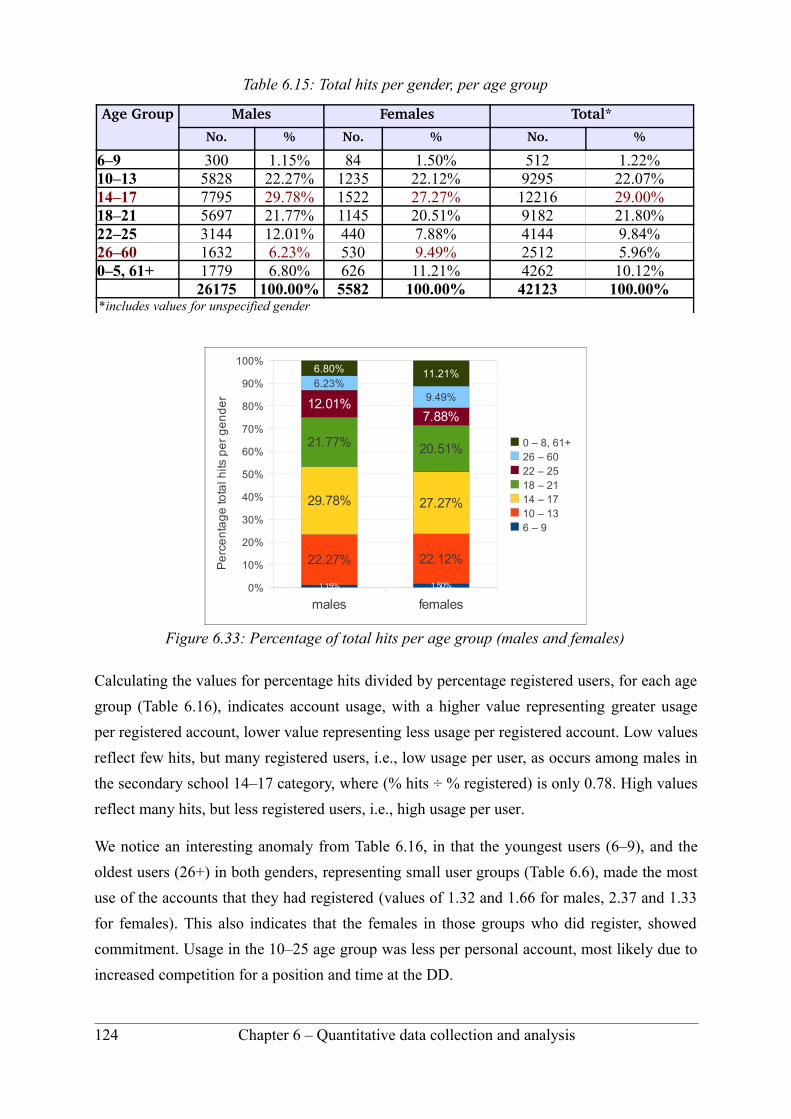
Table 6.15: Total hits per gender, per age group
Age Group Males Females Total*
No. % No. % No. %
6–9 300 1.15% 84 1.50% 512 1.22%10–13 5828 22.27% 1235 22.12% 9295 22.07%14–17 7795 29.78% 1522 27.27% 12216 29.00%18–21 5697 21.77% 1145 20.51% 9182 21.80%22–25 3144 12.01% 440 7.88% 4144 9.84%26–60 1632 6.23% 530 9.49% 2512 5.96%0–5, 61+ 1779 6.80% 626 11.21% 4262 10.12%
26175 100.00% 5582 100.00% 42123 100.00%*includes values for unspecified gender
Calculating the values for percentage hits divided by percentage registered users, for each age
group (Table 6.16), indicates account usage, with a higher value representing greater usage
per registered account, lower value representing less usage per registered account. Low values
reflect few hits, but many registered users, i.e., low usage per user, as occurs among males in
the secondary school 14–17 category, where (% hits ÷ % registered) is only 0.78. High values
reflect many hits, but less registered users, i.e., high usage per user.
We notice an interesting anomaly from Table 6.16, in that the youngest users (6–9), and the
oldest users (26+) in both genders, representing small user groups (Table 6.6), made the most
use of the accounts that they had registered (values of 1.32 and 1.66 for males, 2.37 and 1.33
for females). This also indicates that the females in those groups who did register, showed
commitment. Usage in the 10–25 age group was less per personal account, most likely due to
increased competition for a position and time at the DD.
124 Chapter 6 – Quantitative data collection and analysis
Figure 6.33: Percentage of total hits per age group (males and females)
males females0%
10%
20%
30%
40%
50%
60%
70%
80%
90%
100%
1.15% 1.50%
22.27% 22.12%
29.78% 27.27%
21.77% 20.51%
12.01%7.88%
6.23%9.49%
6.80% 11.21%
0 – 8, 61+26 – 6022 – 2518 – 2114 – 1710 – 136 – 9
Pe
rce
nta
ge
tot a
l hits
pe
r g
en
de
r
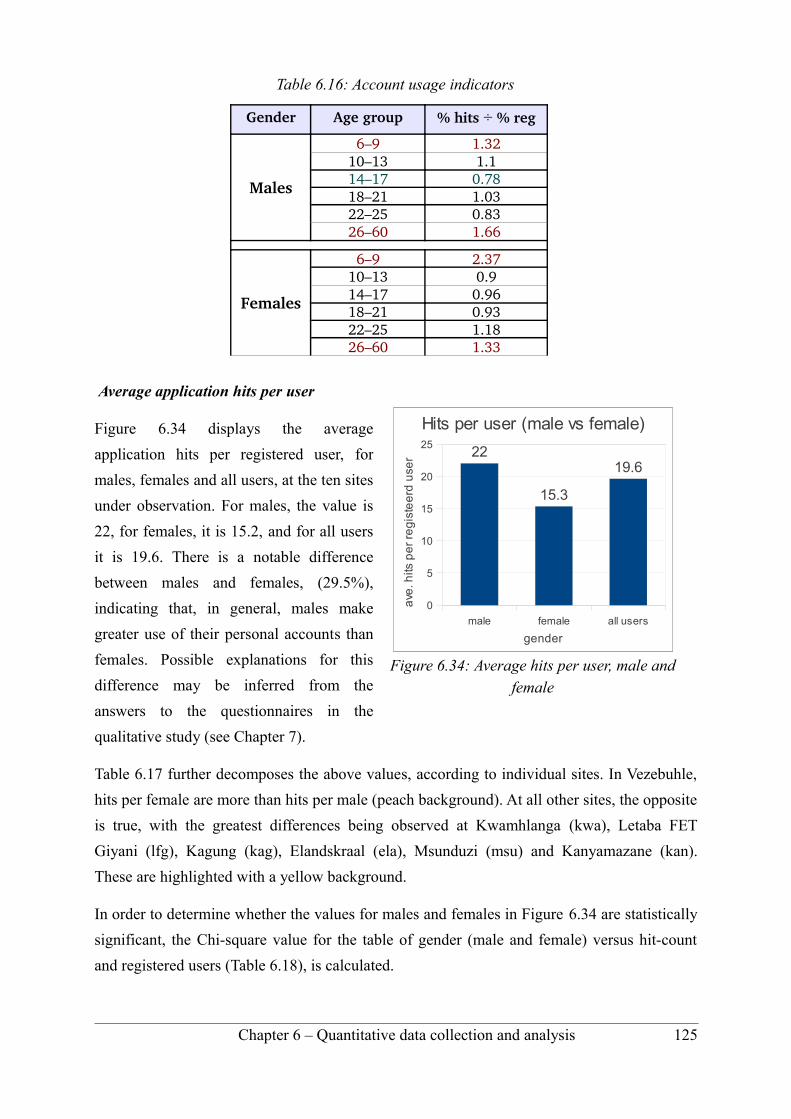
Table 6.16: Account usage indicators
Gender Age group % hits ÷ % reg
Males
6–9 1.3210–13 1.114–17 0.7818–21 1.0322–25 0.8326–60 1.66
Females
6–9 2.3710–13 0.914–17 0.9618–21 0.9322–25 1.1826–60 1.33
Average application hits per user
Figure 6.34 displays the average
application hits per registered user, for
males, females and all users, at the ten sites
under observation. For males, the value is
22, for females, it is 15.2, and for all users
it is 19.6. There is a notable difference
between males and females, (29.5%),
indicating that, in general, males make
greater use of their personal accounts than
females. Possible explanations for this
difference may be inferred from the
answers to the questionnaires in the
qualitative study (see Chapter 7).
Table 6.17 further decomposes the above values, according to individual sites. In Vezebuhle,
hits per female are more than hits per male (peach background). At all other sites, the opposite
is true, with the greatest differences being observed at Kwamhlanga (kwa), Letaba FET
Giyani (lfg), Kagung (kag), Elandskraal (ela), Msunduzi (msu) and Kanyamazane (kan).
These are highlighted with a yellow background.
In order to determine whether the values for males and females in Figure 6.34 are statistically
significant, the Chi-square value for the table of gender (male and female) versus hit-count
and registered users (Table 6.18), is calculated.
Chapter 6 – Quantitative data collection and analysis 125
Figure 6.34: Average hits per user, male and female
male female all users
0
5
10
15
20
2522
15.3
19.6
Hits per user (male vs female)
gender
ave
. hits
pe
r re
gis
tee
rd u
ser
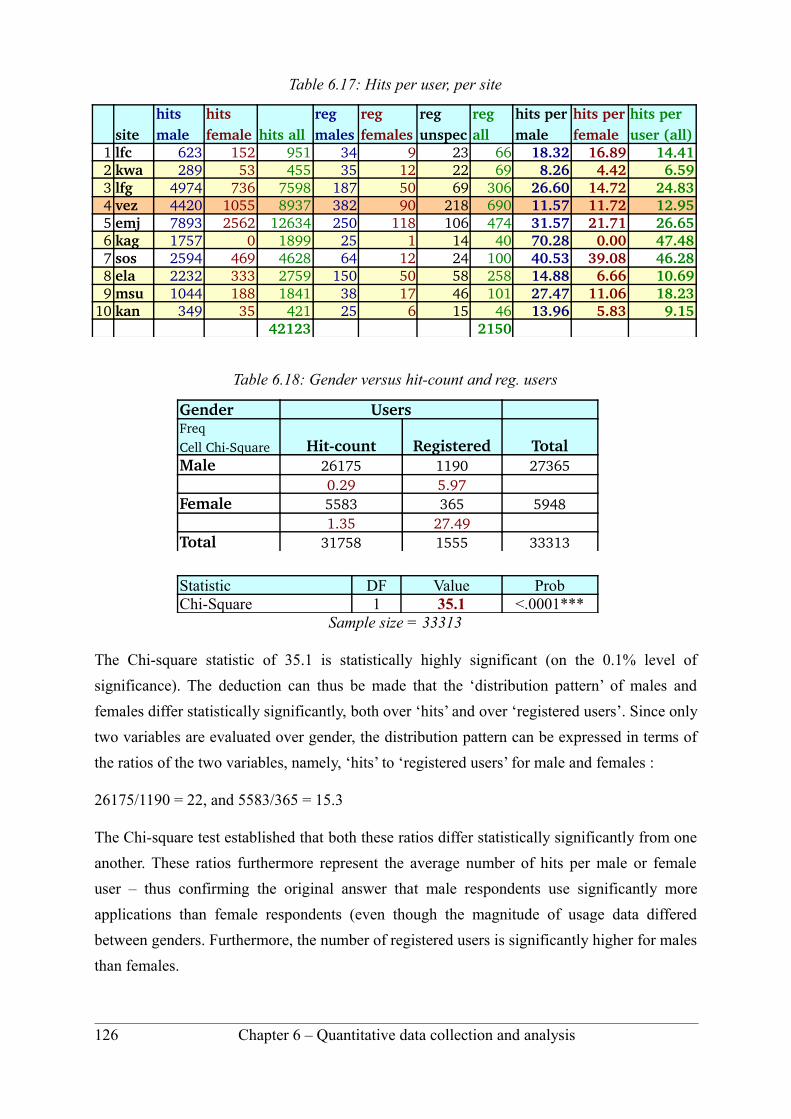
Table 6.17: Hits per user, per site
sitehits male
hits female hits all
reg males
reg females
reg unspec
reg all
hits per male
hits per female
hits per user (all)
1 lfc 623 152 951 34 9 23 66 18.32 16.89 14.412 kwa 289 53 455 35 12 22 69 8.26 4.42 6.593 lfg 4974 736 7598 187 50 69 306 26.60 14.72 24.834 vez 4420 1055 8937 382 90 218 690 11.57 11.72 12.955 emj 7893 2562 12634 250 118 106 474 31.57 21.71 26.656 kag 1757 0 1899 25 1 14 40 70.28 0.00 47.487 sos 2594 469 4628 64 12 24 100 40.53 39.08 46.288 ela 2232 333 2759 150 50 58 258 14.88 6.66 10.699 msu 1044 188 1841 38 17 46 101 27.47 11.06 18.23
10 kan 349 35 421 25 6 15 46 13.96 5.83 9.1542123 2150
Table 6.18: Gender versus hit-count and reg. users
Gender UsersFreq Cell ChiSquare Hitcount Registered TotalMale 26175 1190 27365
0.29 5.97Female 5583 365 5948
1.35 27.49Total 31758 1555 33313
Statistic DF Value ProbChi-Square 1 35.1 <.0001***
Sample size = 33313
The Chi-square statistic of 35.1 is statistically highly significant (on the 0.1% level of
significance). The deduction can thus be made that the ‘distribution pattern’ of males and
females differ statistically significantly, both over ‘hits’ and over ‘registered users’. Since only
two variables are evaluated over gender, the distribution pattern can be expressed in terms of
the ratios of the two variables, namely, ‘hits’ to ‘registered users’ for male and females :
26175/1190 = 22, and 5583/365 = 15.3
The Chi-square test established that both these ratios differ statistically significantly from one
another. These ratios furthermore represent the average number of hits per male or female
user – thus confirming the original answer that male respondents use significantly more
applications than female respondents (even though the magnitude of usage data differed
between genders. Furthermore, the number of registered users is significantly higher for males
than females.
126 Chapter 6 – Quantitative data collection and analysis

6.8.3 Gender-related usage of general categories
Figures 6.35 and 6.36 are representations of the values in Table 6.19, and show the percentage
of males and females accessing the various general categories (Gush and de Villiers, 2010).
Values for registered users of unspecified gender, are excluded. Figure 6.35 (from column 3 of
Table 6.19), shows the values for each gender as a percentage of the total values for that
gender, attempting to determine if different genders show a preference for different general
categories of applications. The greatest difference between values for males and females is
noticeable in the reference and DDhomepage categories, where the ratios of male to female
usage of these categories are approximately 3:4 and 13:10 respectively, indicating that
females allocated a proportionally greater amount of their time to reference, than males; while
males allocated a proportionally greater amount of their time to exploration of the file system,
than females. The difference in edutainment, is predominantly due to the popular ‘TuxMaths’
game, which (from detailed log file analysis) males prefer over females. Figure 6.36 (from the
last two columns of Table 6.19), shows the values for each gender as percentage of the total
values (both genders combined), i.e., highlighting the greater use by males than females.
Table 6.19: Percentage of males and females accessing each category
General Application
Category
Usage of applications according to gender (M=male,F=female)
Totals per gender % of app. usage per gender
% of total usage (M+F) of ALL applications
M F M F M F Games 6035 1396 23.5% 25.1% 19.3% 4.5%Reference 4328 1247 16.8% 22.4% 13.8% 4.0%Video/audio 4757 1060 18.5% 19.1% 15.2% 3.4%DDhome and nav. 4650 768 18.1% 13.8% 14.9% 2.5%Education 2527 525 9.8% 9.4% 8.1% 1.7%Edutainment 2282 334 8.9% 6.0% 7.3% 1.1%Office suite 1119 226 4.4% 4.1% 3.6% 0.7%
Total 25698 5556 100% 100%82% 18%
100%
While useful trends and generalisation can be extracted from the categorised data above, a
complete understanding of the usage patterns is only possible when referring to the
composition (in terms of applications) of each category. Nevertheless, it is clear from Table
6.19 that for males, games are most popular, followed by video and audio and the
DDhomepage and navigation applications; with females, games are seen to be the most
popular, followed by reference material and video and audio content. Figure 6.36 reinforces
the finding of low usage by females of content in general, compared to males.
Chapter 6 – Quantitative data collection and analysis 127

Figure 6.35: Percentage of male hits for a particular category versus total male hits, and percentage of female hits per category versus total female hits
The data can be further analysed by investigating general category usage by males and
females in each of the age groups. Data for males and females from Table E2 (Appendix E) is
illustrated in Figures 6.37 and 6.38 below.
In the 6–9 age group, games usage by females is considerably higher than by males (56%
compared to 31.7%). Video and audio application usage is similar (29.5% and 25.7%) while
applications in the education category were used more by males (14.7% compared to 2.4%).
In the 10–13 age group, games usage is approximately equal at around 29%, while females
made greater use of the video/audio, and reference applications (23.5% versus 17.1%, and
17.4% versus 12.6% respectively). Males made greater use of the DDhomepage and
navigation applications (18.6% versus 10.6%).
128 Chapter 6 – Quantitative data collection and analysis
GA
ME
S %
RE
FE
RE
NC
E %
VID
EO
_AU
DIO
%
DD
HO
ME
_N
AV
. %
ED
UC
AT
ION
%
ED
UT
AIN
ME
NT
%
OF
FIC
E S
UIT
E %
0.00%
5.00%
10.00%
15.00%
20.00%
25.00%
30.00%
MalesFemales
category
% o
f hits
Figure 6.36: Percentage of male and female hits for a particular category versus total hits
GA
ME
S
RE
FE
RE
NC
E
VID
EO
_AU
DIO
DD
HO
ME
_N
AV
.
ED
UC
AT
ION
ED
UT
AIN
ME
NT
OF
FIC
E S
UIT
E
0.00%
5.00%
10.00%
15.00%
20.00%
25.00%
MalesFemales
category
% o
f hits
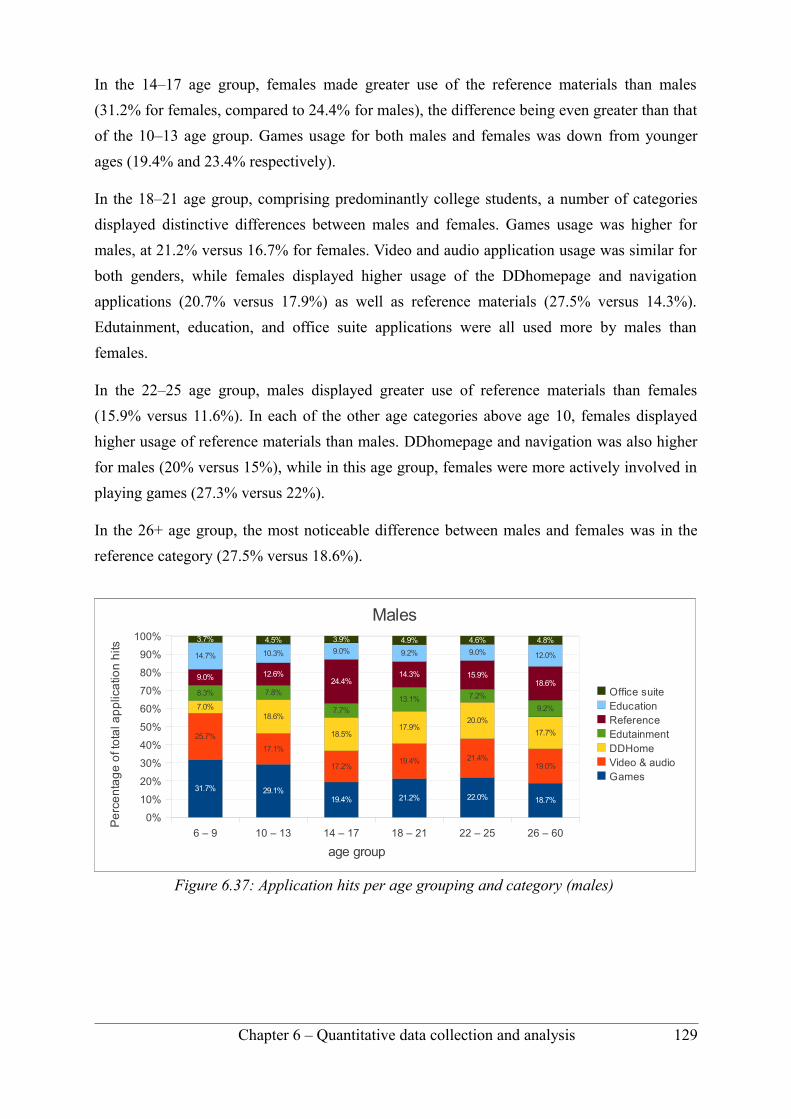
In the 14–17 age group, females made greater use of the reference materials than males
(31.2% for females, compared to 24.4% for males), the difference being even greater than that
of the 10–13 age group. Games usage for both males and females was down from younger
ages (19.4% and 23.4% respectively).
In the 18–21 age group, comprising predominantly college students, a number of categories
displayed distinctive differences between males and females. Games usage was higher for
males, at 21.2% versus 16.7% for females. Video and audio application usage was similar for
both genders, while females displayed higher usage of the DDhomepage and navigation
applications (20.7% versus 17.9%) as well as reference materials (27.5% versus 14.3%).
Edutainment, education, and office suite applications were all used more by males than
females.
In the 22–25 age group, males displayed greater use of reference materials than females
(15.9% versus 11.6%). In each of the other age categories above age 10, females displayed
higher usage of reference materials than males. DDhomepage and navigation was also higher
for males (20% versus 15%), while in this age group, females were more actively involved in
playing games (27.3% versus 22%).
In the 26+ age group, the most noticeable difference between males and females was in the
reference category (27.5% versus 18.6%).
Chapter 6 – Quantitative data collection and analysis 129
Figure 6.37: Application hits per age grouping and category (males)
6 – 9 10 – 13 14 – 17 18 – 21 22 – 25 26 – 60
0%
10%
20%
30%
40%
50%
60%
70%
80%
90%
100%
31.7% 29.1%19.4% 21.2% 22.0% 18.7%
25.7%
17.1%
17.2%19.4% 21.4%
19.0%
7.0%18.6%
18.5%17.9%
20.0%
17.7%
8.3% 7.8%
7.7%
13.1% 7.2%
9.2%
9.0% 12.6%24.4%
14.3% 15.9%18.6%
14.7% 10.3% 9.0% 9.2% 9.0% 12.0%
3.7% 4.5% 3.9% 4.9% 4.6% 4.8%
Males
Office suiteEducationReferenceEdutainmentDDHomeVideo & audioGames
age group
Pe
rce
nta
ge
of t
ota
l ap
plic
atio
n h
its
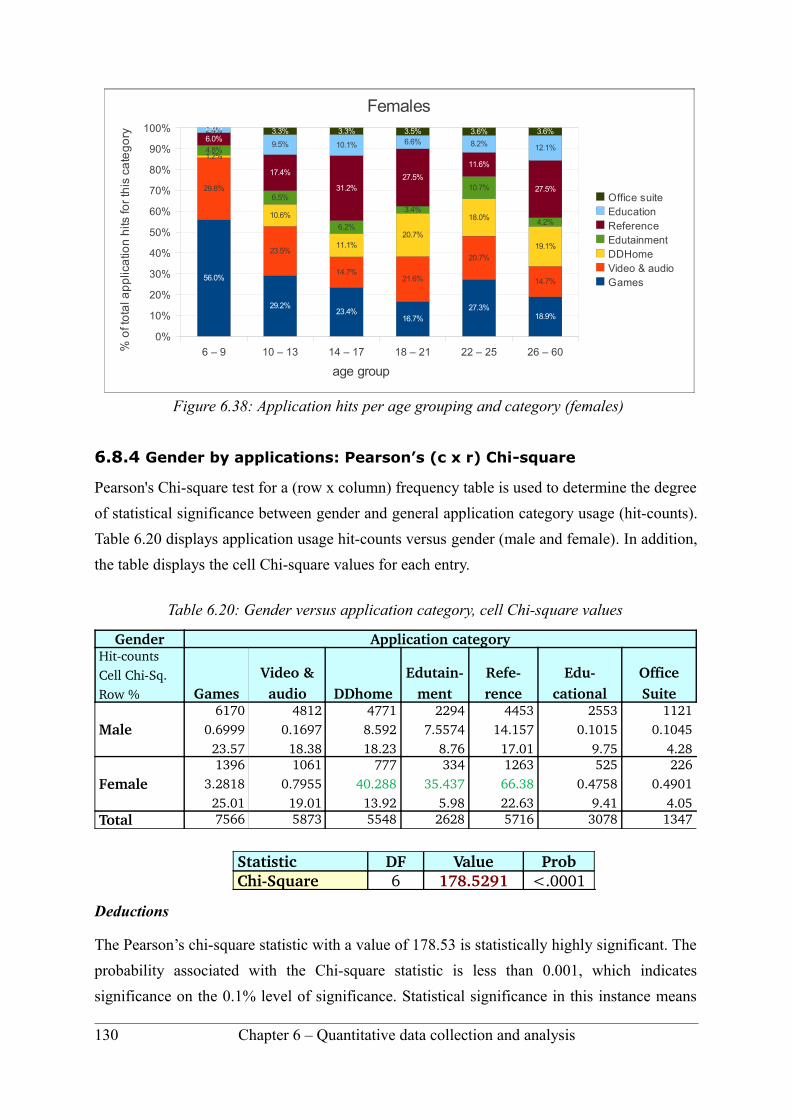
6.8.4 Gender by applications: Pearson’s (c x r) Chi-square
Pearson's Chi-square test for a (row x column) frequency table is used to determine the degree
of statistical significance between gender and general application category usage (hit-counts).
Table 6.20 displays application usage hit-counts versus gender (male and female). In addition,
the table displays the cell Chi-square values for each entry.
Table 6.20: Gender versus application category, cell Chi-square values
Gender Application categoryHitcountsCell ChiSq.Row % Games
Video & audio DDhome
Edutain ment
Refe rence
Edu cational
Office Suite
Male6170
0.699923.57
48120.1697
18.38
47718.59218.23
22947.5574
8.76
445314.157
17.01
25530.1015
9.75
11210.1045
4.28
Female1396
3.281825.01
10610.7955
19.01
77740.288
13.92
33435.437
5.98
126366.3822.63
5250.4758
9.41
2260.4901
4.05Total 7566 5873 5548 2628 5716 3078 1347
Statistic DF Value ProbChiSquare 6 178.5291 <.0001
Deductions
The Pearson’s chi-square statistic with a value of 178.53 is statistically highly significant. The
probability associated with the Chi-square statistic is less than 0.001, which indicates
significance on the 0.1% level of significance. Statistical significance in this instance means
130 Chapter 6 – Quantitative data collection and analysis
Figure 6.38: Application hits per age grouping and category (females)
6 – 9 10 – 13 14 – 17 18 – 21 22 – 25 26 – 60
0%
10%
20%
30%
40%
50%
60%
70%
80%
90%
100%
56.0%
29.2%23.4%
16.7%27.3%
18.9%
29.8%
23.5%
14.7%21.6%
20.7%
14.7%
1.2%
10.6%
11.1%20.7%
18.0%
19.1%
4.8%
6.5%
6.2%
3.4%
10.7%
4.2%
6.0%
17.4%
31.2%27.5%
11.6%
27.5%
2.4%
9.5% 10.1% 6.6% 8.2% 12.1%
0.0% 3.3% 3.3% 3.5% 3.6% 3.6%
Females
Office suiteEducationReferenceEdutainmentDDHomeVideo & audioGames
age group
% o
f to
tal a
pp
l ica
tion
hits
for
this
ca
teg
ory
that the two variables that are represented by the rows and columns of the frequency tables
(gender and application hit-counts) are statistically significantly dependent. (The null
hypothesis examined with Chi-square tests of this nature always states that the two variables
are independent of one another). Dependence implies that application use patterns differ
between genders. Stated differently, and viewed from a row-wise approach, dependence
implies that for a specific gender group (row), the distribution of application-use over the
various applications (all columns) differs significantly between male and female. That is, the
distribution of usage-proportion differs.
Since the cell-Chi-square value-entries of individual cells add up to the Pearson Chi-square
statistic, the individual cell-Chi-square values can assist in identifying those applications that
cause application usage patterns to differ statistically significantly between males and
females. Thus, row wise comparisons indicate, for example that females tend to spend –
proportionally – statistically significantly less time on DDhomepage and edutainment than
males, and more time on accessing reference-related applications. The latter point reinforces
that, while overall usage by females is low, the usage that does occur demonstrates more
committed use of educational reference material such as encyclopaedia access.
6.8.5 Discussion
Returning to our sub-questions on gender and application usage, we note that the general
trend is for significantly more males than females to register user accounts (approximately 3:1
ratio). Greatest number of registrations by males was in the 10–13 age group, while greatest
number of registrations by females was in the 14–17 age group. Actual hit-count figures were
greatest for both males and females in the 14–17 age group.
While the dominance of users in the 10–21 age groups is understandable, considering that
many of the sites are at, or near, schools or colleges, the issue of gender imbalance at DDs is a
cause for concern, since the intention is for them to be equally beneficial to both genders.
Recommendations to address this are suggested in Section 8.8.
Some important findings regarding gender-related application usage per general category
were made in Section 6.8.3. These could assist in a more targeted content-presentation
mechanism in future DD software releases.
Chapter 6 – Quantitative data collection and analysis 131
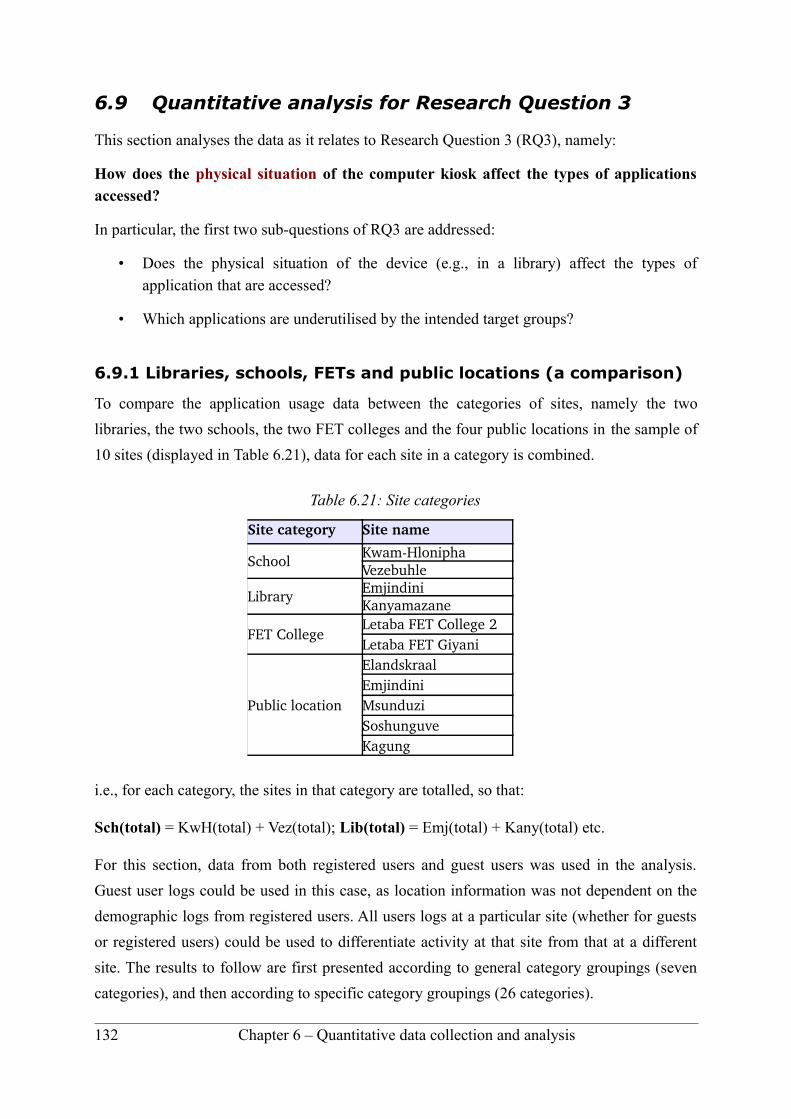
6.9 Quantitative analysis for Research Question 3
This section analyses the data as it relates to Research Question 3 (RQ3), namely:
How does the physical situation of the computer kiosk affect the types of applications accessed?
In particular, the first two sub-questions of RQ3 are addressed:
• Does the physical situation of the device (e.g., in a library) affect the types of application that are accessed?
• Which applications are underutilised by the intended target groups?
6.9.1 Libraries, schools, FETs and public locations (a comparison)
To compare the application usage data between the categories of sites, namely the two
libraries, the two schools, the two FET colleges and the four public locations in the sample of
10 sites (displayed in Table 6.21), data for each site in a category is combined.
Table 6.21: Site categories
Site category Site name
School KwamHloniphaVezebuhle
Library EmjindiniKanyamazane
FET CollegeLetaba FET College 2Letaba FET Giyani
Public location
ElandskraalEmjindiniMsunduzi Soshunguve Kagung
i.e., for each category, the sites in that category are totalled, so that:
Sch(total) = KwH(total) + Vez(total); Lib(total) = Emj(total) + Kany(total) etc.
For this section, data from both registered users and guest users was used in the analysis.
Guest user logs could be used in this case, as location information was not dependent on the
demographic logs from registered users. All users logs at a particular site (whether for guests
or registered users) could be used to differentiate activity at that site from that at a different
site. The results to follow are first presented according to general category groupings (seven
categories), and then according to specific category groupings (26 categories).
132 Chapter 6 – Quantitative data collection and analysis
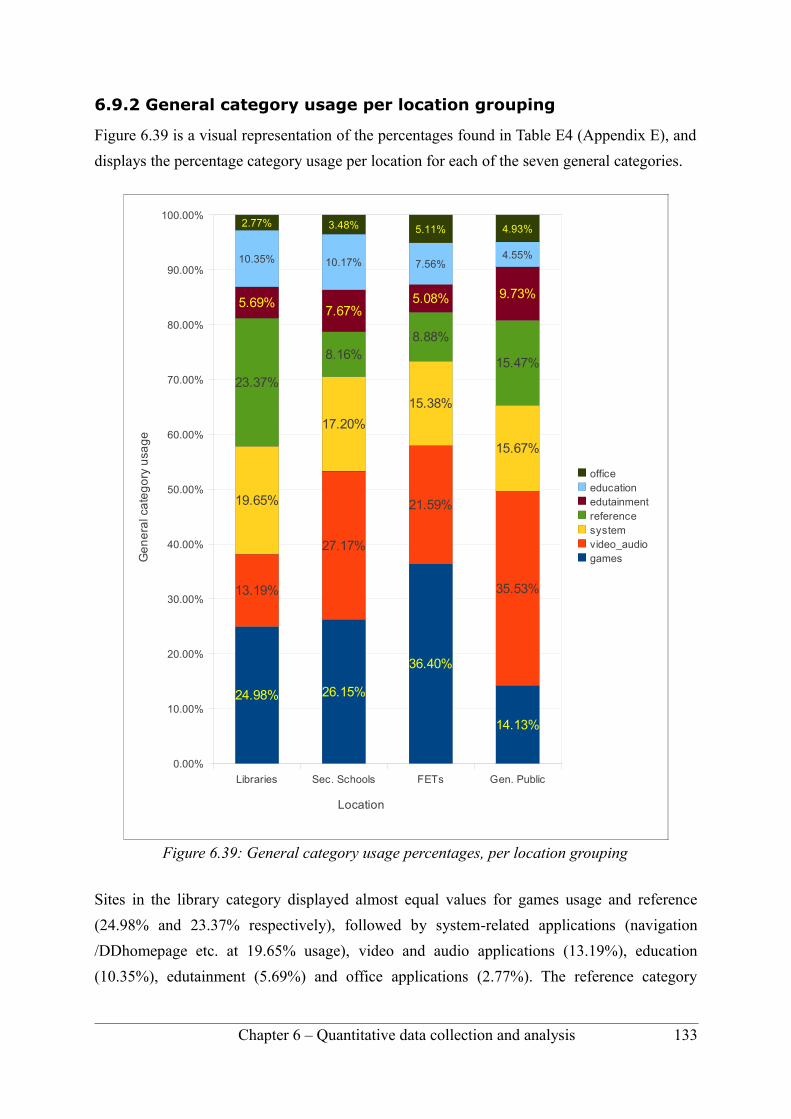
6.9.2 General category usage per location grouping
Figure 6.39 is a visual representation of the percentages found in Table E4 (Appendix E), and
displays the percentage category usage per location for each of the seven general categories.
Sites in the library category displayed almost equal values for games usage and reference
(24.98% and 23.37% respectively), followed by system-related applications (navigation
/DDhomepage etc. at 19.65% usage), video and audio applications (13.19%), education
(10.35%), edutainment (5.69%) and office applications (2.77%). The reference category
Chapter 6 – Quantitative data collection and analysis 133
Figure 6.39: General category usage percentages, per location grouping
Libraries Sec. Schools FETs Gen. Public
0.00%
10.00%
20.00%
30.00%
40.00%
50.00%
60.00%
70.00%
80.00%
90.00%
100.00%
24.98% 26.15%
36.40%
14.13%
13.19%
27.17%
21.59%
35.53%
19.65%
17.20%
15.38%
15.67%
23.37%
8.16%8.88%
15.47%
5.69%7.67%
5.08% 9.73%
10.35% 10.17% 7.56%4.55%
2.77% 3.48% 5.11% 4.93%
officeeducationedutainmentreferencesystemvideo_audiogames
Location
Ge
ne
ral c
ate
go
ry u
sag
e
percentage (predominantly composed of the Wikipedia open encyclopaedia) was greatest for
libraries than any other location category. While the graphs of age group versus application
usage (Figures 6.27 and 6.28) indicated proportionally high usage of reference and Wikipedia
material by the 14–17 age group, Figure 6.39 provides the additional insight that reference
and Wikipedia use within that age group is predominantly by school students visiting
libraries, and much less so by students using the DDs in schools (8.16%). Further insight into
usage of library DDs, is given in the subsequent qualitative analysis (Section 7.5.3).
Sites in the secondary schools category displayed high usage in the games category and the
video/audio applications (26.15% and 27.17% respectively), followed by system-related
applications (DDhomepage/file-navigation etc., at 17.20% usage), education applications
(10.17%), reference (8.16%), edutainment (7.67%) and office applications (3.48%). While the
DDs at schools were used, to some extent, for school reference (confirmed during site visits),
the numbers indicate that users at schools were more interested in using the DD for
entertainment and exploration than reference. Further insight into usage at schools is given in
the subsequent qualitative analysis (Section 7.5.1).
It is of note that FET colleges showed highest usage in the games category (36.4%), higher
than any other location category. Second highest is video and audio (21.59%), followed by
system/DDhomepage (15.38%), reference (8.88%), education (7.56%), office (5.11%) and
edutainment (5.08%). While still low, office application usage is higher at FET colleges than
any other location category, despite there not being printers attached to the DDs. The low use
of reference applications indicates that the reference resources on the DD are inadequate, or
inappropriate, for FET college level students.
Sites in the general public category displayed highest usage in the video/audio category
(35.53%), followed by system and navigation (15.67%), reference (15.47%) and games
(14.13%). On the lower end were edutainment (9.73%), education (4,55%) and office
applications (4.93%).
The popularity of multimedia content (video/audio) in public locations such as community
centres and informal markets could be exploited by delivering content targeted at these
locations, in this format.
Educational resources are under utilised (4.55%, less than half the usage levels for secondary
schools and libraries). Exploration through the use of the file navigation and DDhomepage
facilities is still a strong element of user activity in public locations, with reference materials
being used considerably more than both secondary schools and FET colleges.
134 Chapter 6 – Quantitative data collection and analysis

6.9.3 Significance of relationship between application usage and location
As in the case for application usage versus age, Pearson's Chi-square test for a (row x column)
frequency table is used to determine the degree of statistical significance between location
category and application category usage. Table E7 in Appendix E displays application usage
hit-counts versus location categories. In addition, the table displays the cell Chi-square values
for each entry (highlighted in red). The resultant Chi-square calculation is presented below
(Table 6.22):
Table 6.22: Chi-square for location versus application category
Statistic DF ValueChiSquare 18 16112
Sample Size = 176336
The Pearson’s Chi-square statistic with a value of 16112 is statistically highly significant. The
probability associated with the Chi-square statistic is less than 0.001, which indicates
significance on the 0.1% level of significance. Statistical significance in this instance means
that location and user application usage are statistically significantly dependent. Dependence
implies that application usage is dependent on location, or, stated differently, that for a
specific location category, the distribution of application-use over the various applications (all
columns) for that location, differs from other location usage distributions.
Since the cell-chi-square value-entries of individual cells in Table E7 add up to the Pearson
Chi-square statistic above, the individual cell-Chi-square values can assist in identifying
usage-distributions that differ significantly for different locations. For example, libraries and
FET colleges, differ with respect to the use of games versus referencing applications, with
FET colleges displaying proportionally higher use of games, and lower use of reference
material, than libraries.
Knowing that location and application usage are significantly dependent, provides a
motivation for customising content on a location-specific basis. Considering DD location, in
addition to the previous factors of age and gender, will allow for more effective content
development and sourcing. More fine-grained analysis of significant correlations between
location and software applications, would be valuable in assessing the impact of location-
targeted content (e.g. school curriculum-based materials in schools).
Chapter 6 – Quantitative data collection and analysis 135
6.9.4 Specific category usage by location grouping
While Sections 6.9.2 and 6.9.3 relate to the seven general categories of software applications,
this section focuses on the specific categories as defined in Section 5.5.3. Figures 6.40 and
6.41 are based on the percentages in Table E5, in Appendix E (with actual values in Table E6).
The graphs display the percentage usage for each of the 26 specific categories, for the four
location categories (libraries, secondary schools, FET colleges and general public locations).
Each location category's percentages are calculated independently of the other location
categories (see Table E5), making allowance for differing total hit-counts per category, while
enabling comparison between categories; e.g., all values in the ‘libraries’ category add up to
100%.
Figure 6.40 is ‘category-prioritised’, displaying percentages as horizontal bars on a specific
category by specific category basis. Each location is represented by a different colour. Figure
6.41 is ‘location-prioritised’, each stacked bar chart representing a location category, and
different colours representing different specific application categories. This Figure is a fine-
grained version of Figure 6.39, allowing for more specific analysis of the categories of
applications being accessed in each location grouping.
Games usage in both the games categories is higher at the FET colleges than any of the other
location categories (21.87% and 14.53% of total application usage at the colleges).
Comparing this to Figures 6.27 and 6.28 which compare age group to application usage,
reveals that users in FET colleges (mostly in the 18–21 age group, see Figures 6.22 and 6.23)
are more likely to use the DD for playing games than other users of their age outside FET
colleges.
The fine-grained resolution of Figure 6.40 (as compared to Figure 6.39), allows us to better
understand which of the specific category items are being used, and to what extent. Clearly
the Wikipedia application (reference,wikipedia) is being used extensively in libraries. Health
and life-skills content (reference,lifeskills/health), though not extensively used, is used more
at libraries, FET colleges and public locations than at schools (3.18%, 2.95%, 3.52% and
1.92% respectively).
We notice users at secondary schools making the greatest use of entertaining video clips
(video_audio, fun) and the web-cam. The one- to two-minute science-related video clips (in
video_audio, science category) were used to a far greater extent by users at public locations
than at any other (6.83% versus approximately 1%). Fun videos and the web-cam were also
used extensively at these public locations.
136 Chapter 6 – Quantitative data collection and analysis

Chapter 6 – Quantitative data collection and analysis 137
Figure 6.40: Specific application versus location
video_audio,webcam
video_audio,science
video_audio,fun
video_audio,audiobooks
system,filemanager
system,ddhomepage
system,comms
reference,wikipedia
reference,science
reference,lifeskills/health
reference,fun
reference,books
reference,agriculture
office,openoffice
games,orientation
games,gamesother
edutainment,localgames
edutainment,science
edutainment,maths
edutainment,language
edutainment,graphics
edutainment,gcompris
edutainment,computers
education,science
education,mindset
education,maths
0.00%2.00%
4.00%6.00%
8.00%10.00%
12.00%14.00%
16.00%18.00%
20.00%22.00%
24.00%
Libraries Sec. Schools FETs Gen. Public
% Total Site Hits
Sp
eci
fic C
ate
go
ry
site_graphs_latest2.ods

Figure 6.41 extends Figure 6.39 to fine-grained detail using a similar colour-coding notation.
It presents the same data as Figure 6.40, while giving a better impression of usage on a per-
location basis. The extent of video_audio category usage at general public locations is
noticeable (red/orange coloured blocks), as well as games usage at FET colleges (upper set of
blue coloured blocks). Reference material usage (green) is highest for libraries, followed by
general public locations. The low use, across locations, of applications in the edutainment
categories (lower dark red blocks) and education categories (lower light blue blocks) is
evident. Fairly uniform block distribution in the general public category suggests more
random usage at these locations, while uneven distribution and some large blocks in the other
locations suggest a more targeted approach to usage, consistent with a fairly static user base,
i.e., many of the same users returning to the DD to perform similar tasks as before.
138 Chapter 6 – Quantitative data collection and analysis
Figure 6.41: Specific application categories versus location, stacked
Libraries Sec. Schools FETs Gen. Public
0%
10%
20%
30%
40%
50%
60%
70%
80%
90%
100%
0.48% 0.88% 0.54% 0.38%1.90% 1.66% 1.02% 0.69%
7.96% 7.62%6.01%
3.48%
0.37% 0.38%
0.25%
0.21%
1.83% 1.67%
0.84%2.64%
1.08% 2.95%
1.43%1.22%
0.27%0.23%
0.36%0.26%
0.84%0.09%
0.00% 3.33%
0.80%0.78%
0.36%0.43%
1.17%0.96%
1.16%1.21%
1.02%1.05%
1.14%
2.25%0.80%
1.22%
1.07%
2.57%3.18%
1.92%
2.95%
3.52%2.47% 1.78%
1.34%
2.65%
14.72%
1.23%
1.22%
3.26%
2.77%
3.48%
5.11%
4.93%
4.37%
0.45%
0.00%
3.07%
10.75%
9.62%
8.83%
5.69%
4.53%
7.13%
6.55%
6.91%
15.49%
18.42%
21.87%7.19%
9.49%
7.73%14.53%
6.95%
1.14%
2.33%
2.34%
6.93%
5.63%
13.15%
9.73%
11.28%
0.80%
0.99%
1.09%
6.83%
5.63%
10.70%8.43%
10.49%
video_audio,webcamvideo_audio,sciencevideo_audio,funvideo_audio,audiobooksgames,orientationgames,gamesothersystem,filemanagersystem,ddhomepagesystem,commsoffice,openofficereference,wikipediareference,sciencereference,lifeskills/healthreference,funreference,booksreference,agricultureedutainment,scienceedutainment,mathsedutainment,localgamesedutainment,languageedutainment,graphicsedutainment,gcomprisedutainment,computerseducation,scienceeducation,mindseteducation,maths
Location category
Pe
rce
nta
ge
us a
ge
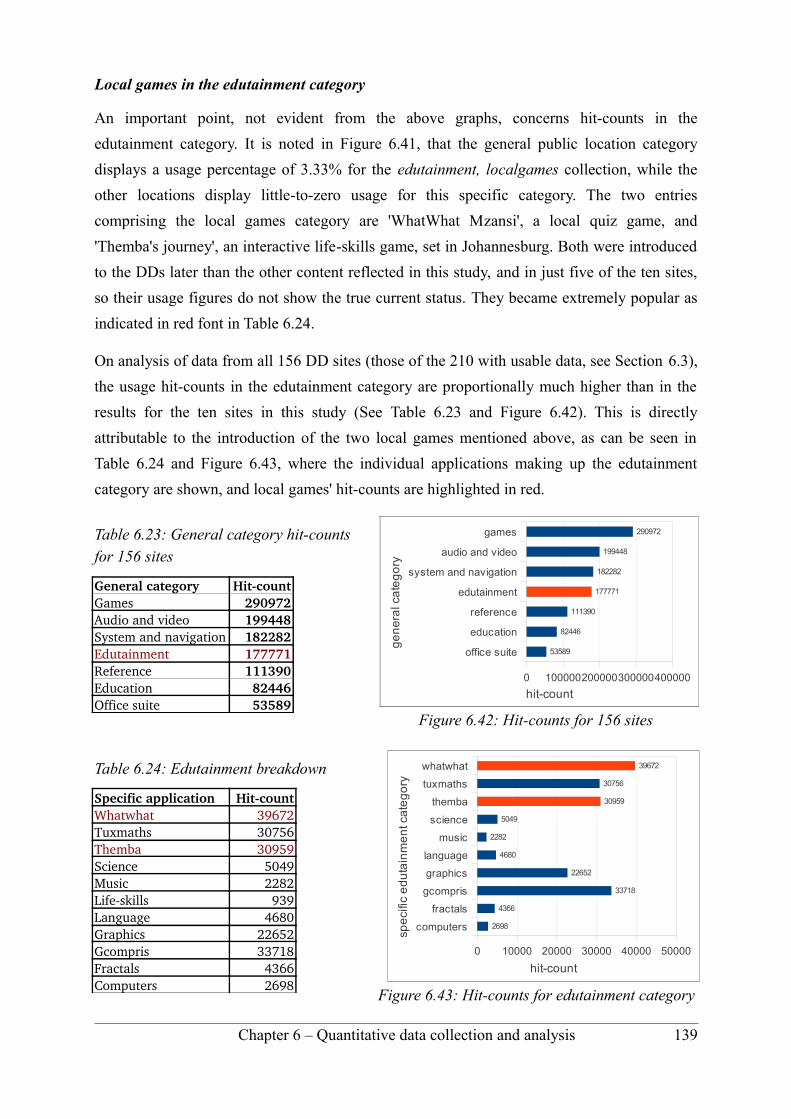
Local games in the edutainment category
An important point, not evident from the above graphs, concerns hit-counts in the
edutainment category. It is noted in Figure 6.41, that the general public location category
displays a usage percentage of 3.33% for the edutainment, localgames collection, while the
other locations display little-to-zero usage for this specific category. The two entries
comprising the local games category are 'WhatWhat Mzansi', a local quiz game, and
'Themba's journey', an interactive life-skills game, set in Johannesburg. Both were introduced
to the DDs later than the other content reflected in this study, and in just five of the ten sites,
so their usage figures do not show the true current status. They became extremely popular as
indicated in red font in Table 6.24.
On analysis of data from all 156 DD sites (those of the 210 with usable data, see Section 6.3),
the usage hit-counts in the edutainment category are proportionally much higher than in the
results for the ten sites in this study (See Table 6.23 and Figure 6.42). This is directly
attributable to the introduction of the two local games mentioned above, as can be seen in
Table 6.24 and Figure 6.43, where the individual applications making up the edutainment
category are shown, and local games' hit-counts are highlighted in red.
Table 6.23: General category hit-counts for 156 sites
General category HitcountGames 290972Audio and video 199448System and navigation 182282Edutainment 177771Reference 111390Education 82446Office suite 53589
Table 6.24: Edutainment breakdown
Specific application HitcountWhatwhat 39672Tuxmaths 30756Themba 30959Science 5049Music 2282Lifeskills 939Language 4680Graphics 22652Gcompris 33718Fractals 4366Computers 2698
Chapter 6 – Quantitative data collection and analysis 139
Figure 6.42: Hit-counts for 156 sites
office suite
education
reference
edutainment
system and navigation
audio and video
games
0 100000200000300000400000
53589
82446
111390
177771
182282
199448
290972
hit-count
ge
ne
ral c
ate
go
ry
Figure 6.43: Hit-counts for edutainment category
computers
fractals
gcompris
graphics
language
music
science
themba
tuxmaths
whatwhat
0 10000 20000 30000 40000 50000
2698
4366
33718
22652
4680
2282
5049
30959
30756
39672
hit-count
spe
cific
ed
uta
i nm
en
t ca
teg
or y
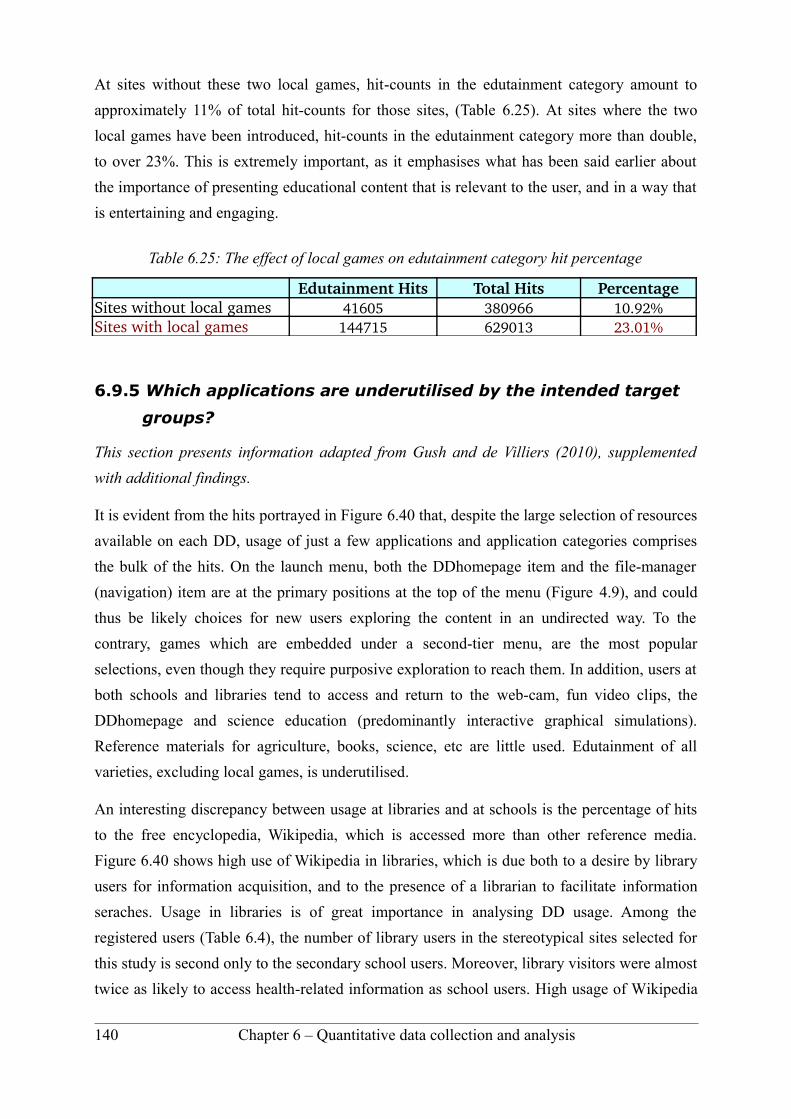
At sites without these two local games, hit-counts in the edutainment category amount to
approximately 11% of total hit-counts for those sites, (Table 6.25). At sites where the two
local games have been introduced, hit-counts in the edutainment category more than double,
to over 23%. This is extremely important, as it emphasises what has been said earlier about
the importance of presenting educational content that is relevant to the user, and in a way that
is entertaining and engaging.
Table 6.25: The effect of local games on edutainment category hit percentage
Edutainment Hits Total Hits PercentageSites without local games 41605 380966 10.92%Sites with local games 144715 629013 23.01%
6.9.5 Which applications are underutilised by the intended target
groups?
This section presents information adapted from Gush and de Villiers (2010), supplemented
with additional findings.
It is evident from the hits portrayed in Figure 6.40 that, despite the large selection of resources
available on each DD, usage of just a few applications and application categories comprises
the bulk of the hits. On the launch menu, both the DDhomepage item and the file-manager
(navigation) item are at the primary positions at the top of the menu (Figure 4.9), and could
thus be likely choices for new users exploring the content in an undirected way. To the
contrary, games which are embedded under a second-tier menu, are the most popular
selections, even though they require purposive exploration to reach them. In addition, users at
both schools and libraries tend to access and return to the web-cam, fun video clips, the
DDhomepage and science education (predominantly interactive graphical simulations).
Reference materials for agriculture, books, science, etc are little used. Edutainment of all
varieties, excluding local games, is underutilised.
An interesting discrepancy between usage at libraries and at schools is the percentage of hits
to the free encyclopedia, Wikipedia, which is accessed more than other reference media.
Figure 6.40 shows high use of Wikipedia in libraries, which is due both to a desire by library
users for information acquisition, and to the presence of a librarian to facilitate information
seraches. Usage in libraries is of great importance in analysing DD usage. Among the
registered users (Table 6.4), the number of library users in the stereotypical sites selected for
this study is second only to the secondary school users. Moreover, library visitors were almost
twice as likely to access health-related information as school users. High usage of Wikipedia
140 Chapter 6 – Quantitative data collection and analysis
by 14–17 year-olds is heavily influenced by the fact that Emjindini Library has the largest
base of registered users, over 50% of which are in this age group, and who use Wikipedia
regularly. At other venues too, (e.g., Gatang high school, not featured in the quantitative
study) users are explicitly required by teachers to source information for school projects from
the DD.
A site visit to the Emjindini library provided further insight into the behaviour of users and the
relationship between the users and the librarian, and how that relationship influenced
application usage patterns (see Section 7.5.3).
At FET colleges, games usage in both games categories was very high, as was usage of the
web-cam and fun video applications. This indicates that students were using the DDs
primarily for recreation, rather than for educational learning and reference. These latter
underutilised categories could be bolstered through the addition of content that is more
engaging to young adults, and more appropriate in terms of educational level. Further research
studies, specifically targeted at college students, could prove valuable in this regard.
6.10 Applicability to Research Question 4
This section investigates the relevance and applicability of the previous quantitative results, to
future unassisted learning terminals, exploring the following sub-questions:
• Do the results of RQ1, RQ2 and RQ3 help in better understanding the desires and needs of target users?
• What lessons are learned for future development, selection and presentation of applications?
6.10.1 Do the results of RQ1, RQ2 and RQ3 help in better understanding the desires and needs of target users?
The results of research questions 1, 2 and 3, do indeed help us to better understand the desires
and needs of target users. The results of Research Question 1 help us understand the
following:
• The registration procedure needs to be simplified and made more accessible.
• Younger users need better guidance on creating and using self-registered accounts.
• There needs to be more on-screen guidance for self-registered account creation, and logging in, to encourage user account usage over guest accounts.
Chapter 6 – Quantitative data collection and analysis 141
• Terminals would benefit from tutorials and vocalised multilingual guides, providing direction to new users, and informing about content available at the DDs
• Games are most popular with younger users and college students.
• Older users are keen to explore and navigate their own way through the system.
• There are too few users in the 26–60 age group, perhaps indicating that they are not
being adequately catered for. However, much of the usage that does occur in this age
group is for reference and other educational content.
• Encyclopaedia reference material is a valuable addition to the DD content, and is
being extensively used by many younger- and, to a lesser degree, older users.
The results of Research Question 2 help us understand the following:
• Many more males than females are coming to the DDs and registering their own accounts.
• At certain sites, the female to male ratio is considerably higher than at other sites.
• Females that register accounts, are not using the DDs as much as males.
• Gender influences general application category usage to some extent (i.e., there is statistically significant association between gender and certain categories, e.g., reference).
• There is proportionally more use by females than males of reference material.
The results of Research Question 3 help us understand the following:
• Location has an effect on the ages of users as well as the types of applications accessed.
• There is a high usage of entertainment and multimedia content at all locations.
• There is a need for content customised to the type of location where the DD is located.
• Local content that is both educational and engaging is very popular. Content of this nature provides an ideal opportunity to combine education and entertainment, in a meaningful manner. These is a need for creative designers to rise to this opportunity.
• Many content resources on the DD are underutilised, requiring interventions to increase usage.
• Given the popularity of recreational video content, this format should be further exploited for the presentation of educational and informational content relevant to the target users at a location.
142 Chapter 6 – Quantitative data collection and analysis
6.10.2 What lessons are learned for future development, selection and presentation of applications?
From analysis to date of the carefully-selected sample of log files, it emerged that DDs are
being used by thousands of users from a variety of age groups, with the bulk of users being
males between 10 and 21. Usage by females is approximately 25% to 30% of total usage,
which is inadequate. The interface and content needs to be made more female-friendly, and
supporting structures put in place to encourage female users.
The DD experience is aimed to be self-directed and enjoyable for all community users. It
results in valuable peer-assistance (noted in previous observation studies), implicit learning
and computer literacy. However, it became clear that useful educational material and sources
of knowledge enrichment are underutilised.
Given the lack of facilities at many schools, such as a school library, computer classes, or
even electricity (see Section 3.3), any additional resource that can help educate school-going
learners should be used to its maximum potential. The results above indicate that in most
instances, the usage of DDs is biased in favour of games usage. There is great potential for
using games to deliver educational content, however, the low use of the edutainment software
appears to indicate that more could be done in this regard and that content on future DDs
should perhaps be adjusted to reduce the amount of purely recreational games, and increase
the number of edutainment type games.
Considering the results that emerged from the census 2009 survey involving students'
favourite subject at school, it was noted that maths was favoured by students in grade 3 to 7,
followed by languages, while students in grades 8 to 12 favoured language subjects, followed
by maths subjects (Figures 3.2 and 3.3). Future DD installations would benefit from the
addition of relevant language-related content.
Should the content on the DD be tailored to the favourite subjects of the majority of users, or
should engaging content be used to direct user's attention to less known subjects that may
enrich the users' lives? Either way, users should be encouraged to explore and engage with
the full spectrum of available content.
Figure 3.4 indicated that community access to library services in South Africa, did not
increase much between 2001 and 2009. The high use of the Wikipedia encyclopaedia
application at Emjindini library demonstrated the potential for a DD to supplement traditional
library services, particular information provision for school projects. In communities where a
library is not present, a DD may provide a low-cost, alternative information resource.
Chapter 6 – Quantitative data collection and analysis 143
Given that much of the educational material and information resources on the DD are being
underutilised, how should these issues be addressed?
First, efforts could be made to explicitly encourage use of the direct educational material.
Without changing the ethos of unassisted, non-invasive learning, supportive signposting
measures could be sought. Users might benefit from clear visual guides explaining the various
types of content available, either in the form of an online document (immediately accessible
on logging in) or eye-catching laminated posters attached to the unit itself, recommending use
of particular applications and customised to the type of site. It is also important that the best-
practice efforts used at particular venues such as Emjindini library (see Section 7.5.3) should
be explicitly documented and advocated to facilitators elsewhere such as school principals,
teachers and community librarians.
Second, modifications could be made to existing underutilised software, and new applications
could be incorporated or developed, with a view to integration of educational aspects into
game or audio/video presentation formats, which are the most popular. Reference material
could be made prominent in the user interface to stimulate greater usage. Content choice and
design would benefit from such efforts. The position of items within the menu system
influences the number of launches, therefore sequencing should be carefully designed to cater
for novice users. In such processes, the findings of the CSIR's Meraka group investigating DD
usability (Adebesin, Kotzé & Gelderblom, 2010), should be noted and applied.
Finally, developers could investigate the feasibility of deploying different software releases,
depending on location, and typical user demographics at that location, e.g., one version for
schools, and another for public places, and another for libraries.
6.11 Summary of chapter
This chapter provided details of the quantitative analysis of data from ten selected sites, with
a view of comparing sites of varying physical situation for similarities and differences in
demographic and application usage statistics. The chapter provided technical information
necessary to explain some of the complexities involved in generating uniform data for this
study. Details were included of the quantitative data collection process, data cleaning process,
design of a log file interrogation tool, and log file processing. In addition, the chapter
provided general findings from the quantitative data, applicable to the study as a whole, and
discussed the analysis of quantitative data as it relates to each of the four research questions.
144 Chapter 6 – Quantitative data collection and analysis

– 7 – Qualitative study – on-site interactions and analyses
‘it's me again this time i want to here from u’ – June, 2007
‘the digital doorway is de best cus we get 2 c other parts of de world’ – May, 2007
‘i would love to know more about java world.to get to produce my own catoon and themes, get to
make drawings come alive and to know which movement to attach to them’ – March, 2009
Chapter 7 – Qualitative study – on-site interactions and analyses 145
7.1 Introduction
This chapter details empirical data obtained from visits to a selection of DD sites. The visits
were conducted to build up a rich supporting picture of user activity and perceptions at the
sites, based on qualitative methods, with some quantitative data emerging in the process.
One of the strengths of qualitative data collection is that it focuses on naturally occurring,
ordinary events in natural settings, presenting a good picture to the researcher of what the
‘real life’, ‘lived experiences’ of people in that setting, are like (Miles and Huberman, 1994).
Creswell describes the most important characteristics of qualitative research: it occurs in
natural settings; the researcher is a key instrument; there are typically multiple sources of
data; data analysis is inductive; participants' meanings are most important; the research
process is emergent (not tightly prescribed); researchers often use a theoretical lens (e.g.,
gender or culture); inquiry is interpretive; the study is holistic in its approach (Creswell,
2009).
In addition to collecting first-hand data to provide insight into the main focus points of the
research questions (age and application usage; gender and application usage; location and
application usage; and applicability of the data to future DDs), some valuable insights
concerning the DD environment, and its effect on usage, emerged. The descriptions and
anecdotes that emerged from the site visits relate to particular instances, and thus cannot be
generalised, however, they do serve to illustrate situations that impact on the usage
experience.
Following the three activity flows of Miles and Huberman (1994) touched on in Section 5.6.4,
data reduction and display is performed in Section 7.5; while conclusion and verification is
performed in Section 7.6 and Chapter 8.
7.2 Data collection methods
As mentioned in Section 5.6.1, data for this section of the study was retrieved from semi-
structured interviews, naturalistic observation and questionnaires, at actual sites. Semi-
structured interviews, researcher-assisted questionnaires, and observation, were used at three
of the sites, while semi-structured interviews and observation were used at the fourth site.
Interviews were conducted with administrators based on the question template in Appendix G.
End-users were either guided through the question template by the researcher, or filled it in
independently as a questionnaire. While the bulk of the data was qualitative, certain
quantitative data (e.g., age, gender) was also collected and analysed.
146 Chapter 7 – Qualitative study – on-site interactions and analyses
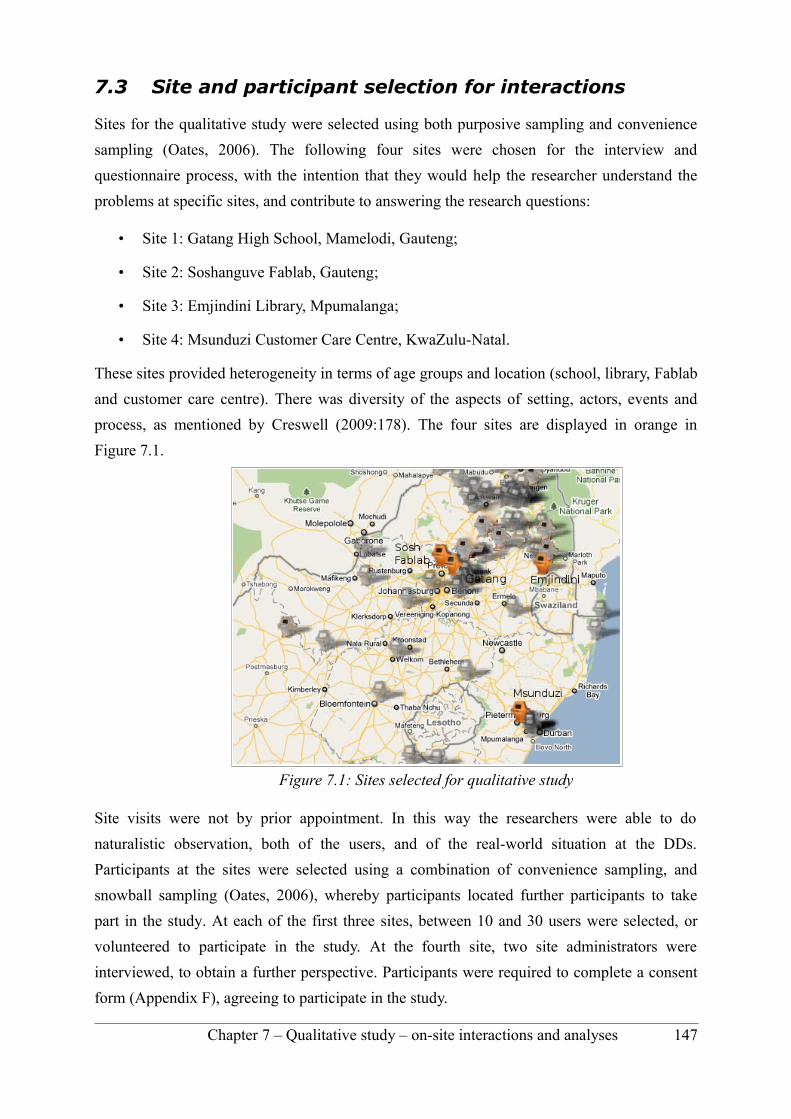
7.3 Site and participant selection for interactions
Sites for the qualitative study were selected using both purposive sampling and convenience
sampling (Oates, 2006). The following four sites were chosen for the interview and
questionnaire process, with the intention that they would help the researcher understand the
problems at specific sites, and contribute to answering the research questions:
• Site 1: Gatang High School, Mamelodi, Gauteng;
• Site 2: Soshanguve Fablab, Gauteng;
• Site 3: Emjindini Library, Mpumalanga;
• Site 4: Msunduzi Customer Care Centre, KwaZulu-Natal.
These sites provided heterogeneity in terms of age groups and location (school, library, Fablab
and customer care centre). There was diversity of the aspects of setting, actors, events and
process, as mentioned by Creswell (2009:178). The four sites are displayed in orange in
Figure 7.1.
Site visits were not by prior appointment. In this way the researchers were able to do
naturalistic observation, both of the users, and of the real-world situation at the DDs.
Participants at the sites were selected using a combination of convenience sampling, and
snowball sampling (Oates, 2006), whereby participants located further participants to take
part in the study. At each of the first three sites, between 10 and 30 users were selected, or
volunteered to participate in the study. At the fourth site, two site administrators were
interviewed, to obtain a further perspective. Participants were required to complete a consent
form (Appendix F), agreeing to participate in the study.
Chapter 7 – Qualitative study – on-site interactions and analyses 147
Figure 7.1: Sites selected for qualitative study
These four sites provide valuable insight into user activity and application usage at DDs,
however, the sample is too small to be able to generalise these findings to DD sites in general.
7.4 Design of questions
Users were asked to respond to a set of pre-determined questions – either verbally (in
interviews), or in written form, by completing the interview template independently, as a
questionnaire. The researchers provided assistance where required. Questions were chosen to
address issues of age, gender, environment, and application usage. Topics are included below,
broken down per research question in this study. The template is given in Appendix G.
Relevant to all or most research questions:
• Is the Digital Doorway useful?
• What is your favourite Digital Doorway game?
• What is your favourite Digital Doorway program (other than games)?
• Why is it your favourite program?
• Tell us what you like to do on the Digital Doorway (e.g., play games; school work; reference; video/audio; DDhomepage; educational programs; office programs;
• What other software (programs) would you like on the Digital Doorway?
• What other information would you like on the Digital Doorway?
• What else would you like on a Digital Doorway?
• Has the DD helped you learn how to use a computer?
Relevant to RQ 1 – age versus categories of applications:
• How old are you?
• How long have you been using the DD?
• What time of day do you normally use the DD?
• How many times a week do you normally come here?
• How long do you spend per session?
Relevant to RQ 2 – gender versus usage:
• Male/Female?
• Who uses the Digital Doorway the most, boys, girls or don't know?
• Why is this, do you think?
• Are there enough programs for girls? Yes or no, please comment;
148 Chapter 7 – Qualitative study – on-site interactions and analyses
Relevant to RQ 3 – location versus usage:
• Site name;
• What language do you speak at home?
• What language would you prefer to use on a computer?
• What are your favourite games and programs?
• What additional programs, information, content, would you like on the DD?
Relevant to RQ 4 – future DDs:
• What other software (programs) would you like on the Digital Doorway?
• What other information would you like on the Digital Doorway?
• What else would you like on a Digital Doorway?
• Has the DD helped you learn how to use a computer, yes or no?
• Do you use the DD on your own; or together with friends (size of group?);
• Do you prefer to learn a computer on your own; or with friends; or at school?
7.5 Results
The results below attempt to describe, understand and explain user activity at each of the sites
visited, and are presented as follows:
• Section 7.5.1: Gatang High School;
• Section 7.5.2: Soshanguve Fablab;
• Section 7.5.3: Emjindini Library;
• Section 7.5.4: Msunduzi Customer Care Centre.
Each site section contains a site description, an activity description, participant details, general
usage findings, gender and age issue, and user requests. Comparisons between sites are tabled
in Section 7.5.5.
The discussion in Section 7.6 revisits some of the findings from each of the sites, highlighting
a number of external and internal factors influencing application usage. Finally, noticeable
themes from user comments in the online feedback mechanism, are presented.
Chapter 7 – Qualitative study – on-site interactions and analyses 149

7.5.1 Site 1: Gatang high school
Site description
GPS coordinates: 25˚ 43'18.5 S, 28˚ 23'43.14 E
Environment: A large, noisy, urban high school (1000+ pupils), in an impoverished district of
Mamelodi, an urban settlement north of Pretoria. The school is located near informal
settlements (see Figure 7.2).
Principal researcher was assisted by: Ms. Mmamakanye Pitse Boshomane.
Activity description
Date and time of visit: 15 September 2010, 12:00.
Two researchers from the CSIR drove to Gatang High school to commence with the study. On
arrival at the school, it was noted that only one DD terminal out of three, was fully functional.
One terminal had a black screen, and one terminal had a malfunctioning keyboard.
The screens were scratched and visibility was poor due to light reflecting off the screen. No-
one was using the DD on arrival, however, after the researchers commenced with the study,
user activity around the single operational terminal picked up rapidly.
150 Chapter 7 – Qualitative study – on-site interactions and analyses
Figure 7.2: Satellite view of the school – base image © Google Maps
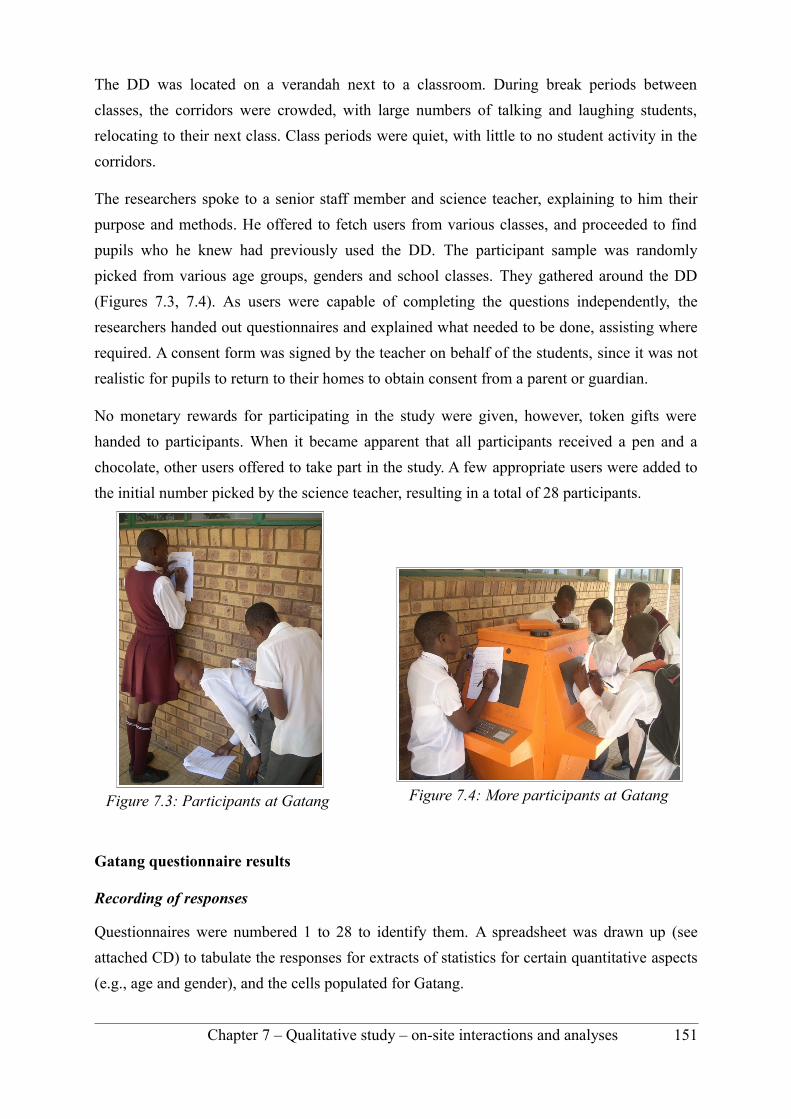
The DD was located on a verandah next to a classroom. During break periods between
classes, the corridors were crowded, with large numbers of talking and laughing students,
relocating to their next class. Class periods were quiet, with little to no student activity in the
corridors.
The researchers spoke to a senior staff member and science teacher, explaining to him their
purpose and methods. He offered to fetch users from various classes, and proceeded to find
pupils who he knew had previously used the DD. The participant sample was randomly
picked from various age groups, genders and school classes. They gathered around the DD
(Figures 7.3, 7.4). As users were capable of completing the questions independently, the
researchers handed out questionnaires and explained what needed to be done, assisting where
required. A consent form was signed by the teacher on behalf of the students, since it was not
realistic for pupils to return to their homes to obtain consent from a parent or guardian.
No monetary rewards for participating in the study were given, however, token gifts were
handed to participants. When it became apparent that all participants received a pen and a
chocolate, other users offered to take part in the study. A few appropriate users were added to
the initial number picked by the science teacher, resulting in a total of 28 participants.
Gatang questionnaire results
Recording of responses
Questionnaires were numbered 1 to 28 to identify them. A spreadsheet was drawn up (see
attached CD) to tabulate the responses for extracts of statistics for certain quantitative aspects
(e.g., age and gender), and the cells populated for Gatang.
Chapter 7 – Qualitative study – on-site interactions and analyses 151
Figure 7.3: Participants at Gatang Figure 7.4: More participants at Gatang
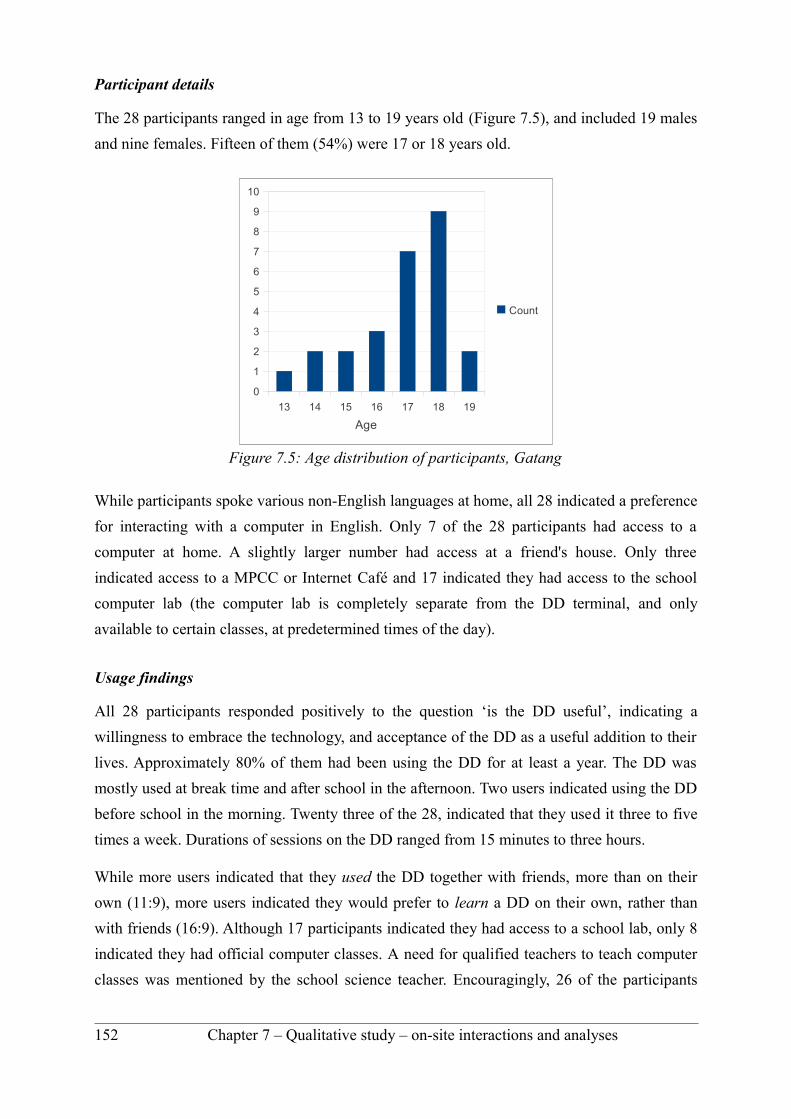
Participant details
The 28 participants ranged in age from 13 to 19 years old (Figure 7.5), and included 19 males
and nine females. Fifteen of them (54%) were 17 or 18 years old.
While participants spoke various non-English languages at home, all 28 indicated a preference
for interacting with a computer in English. Only 7 of the 28 participants had access to a
computer at home. A slightly larger number had access at a friend's house. Only three
indicated access to a MPCC or Internet Café and 17 indicated they had access to the school
computer lab (the computer lab is completely separate from the DD terminal, and only
available to certain classes, at predetermined times of the day).
Usage findings
All 28 participants responded positively to the question ‘is the DD useful’, indicating a
willingness to embrace the technology, and acceptance of the DD as a useful addition to their
lives. Approximately 80% of them had been using the DD for at least a year. The DD was
mostly used at break time and after school in the afternoon. Two users indicated using the DD
before school in the morning. Twenty three of the 28, indicated that they used it three to five
times a week. Durations of sessions on the DD ranged from 15 minutes to three hours.
While more users indicated that they used the DD together with friends, more than on their
own (11:9), more users indicated they would prefer to learn a DD on their own, rather than
with friends (16:9). Although 17 participants indicated they had access to a school lab, only 8
indicated they had official computer classes. A need for qualified teachers to teach computer
classes was mentioned by the school science teacher. Encouragingly, 26 of the participants
152 Chapter 7 – Qualitative study – on-site interactions and analyses
Figure 7.5: Age distribution of participants, Gatang
13 14 15 16 17 18 19
0
1
2
3
4
5
6
7
8
9
10
Count
Age
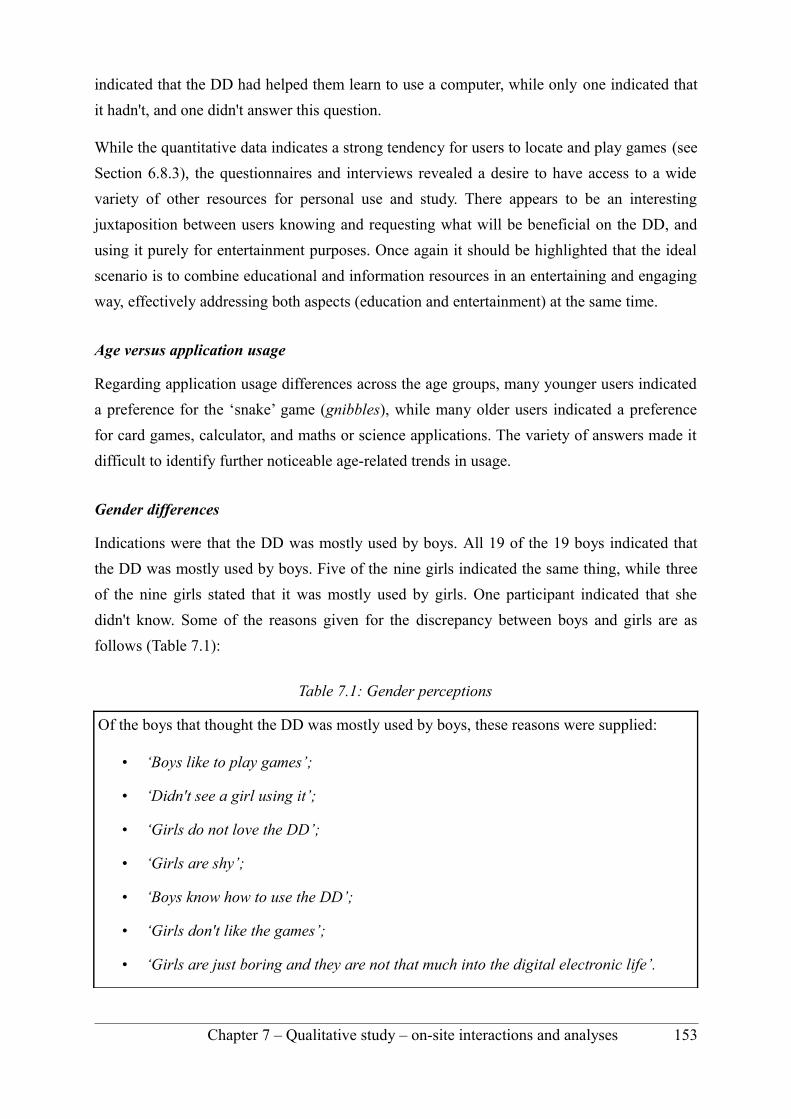
indicated that the DD had helped them learn to use a computer, while only one indicated that
it hadn't, and one didn't answer this question.
While the quantitative data indicates a strong tendency for users to locate and play games (see
Section 6.8.3), the questionnaires and interviews revealed a desire to have access to a wide
variety of other resources for personal use and study. There appears to be an interesting
juxtaposition between users knowing and requesting what will be beneficial on the DD, and
using it purely for entertainment purposes. Once again it should be highlighted that the ideal
scenario is to combine educational and information resources in an entertaining and engaging
way, effectively addressing both aspects (education and entertainment) at the same time.
Age versus application usage
Regarding application usage differences across the age groups, many younger users indicated
a preference for the ‘snake’ game (gnibbles), while many older users indicated a preference
for card games, calculator, and maths or science applications. The variety of answers made it
difficult to identify further noticeable age-related trends in usage.
Gender differences
Indications were that the DD was mostly used by boys. All 19 of the 19 boys indicated that
the DD was mostly used by boys. Five of the nine girls indicated the same thing, while three
of the nine girls stated that it was mostly used by girls. One participant indicated that she
didn't know. Some of the reasons given for the discrepancy between boys and girls are as
follows (Table 7.1):
Table 7.1: Gender perceptions
Of the boys that thought the DD was mostly used by boys, these reasons were supplied:
• ‘Boys like to play games’;
• ‘Didn't see a girl using it’;
• ‘Girls do not love the DD’;
• ‘Girls are shy’;
• ‘Boys know how to use the DD’;
• ‘Girls don't like the games’;
• ‘Girls are just boring and they are not that much into the digital electronic life’.
Chapter 7 – Qualitative study – on-site interactions and analyses 153
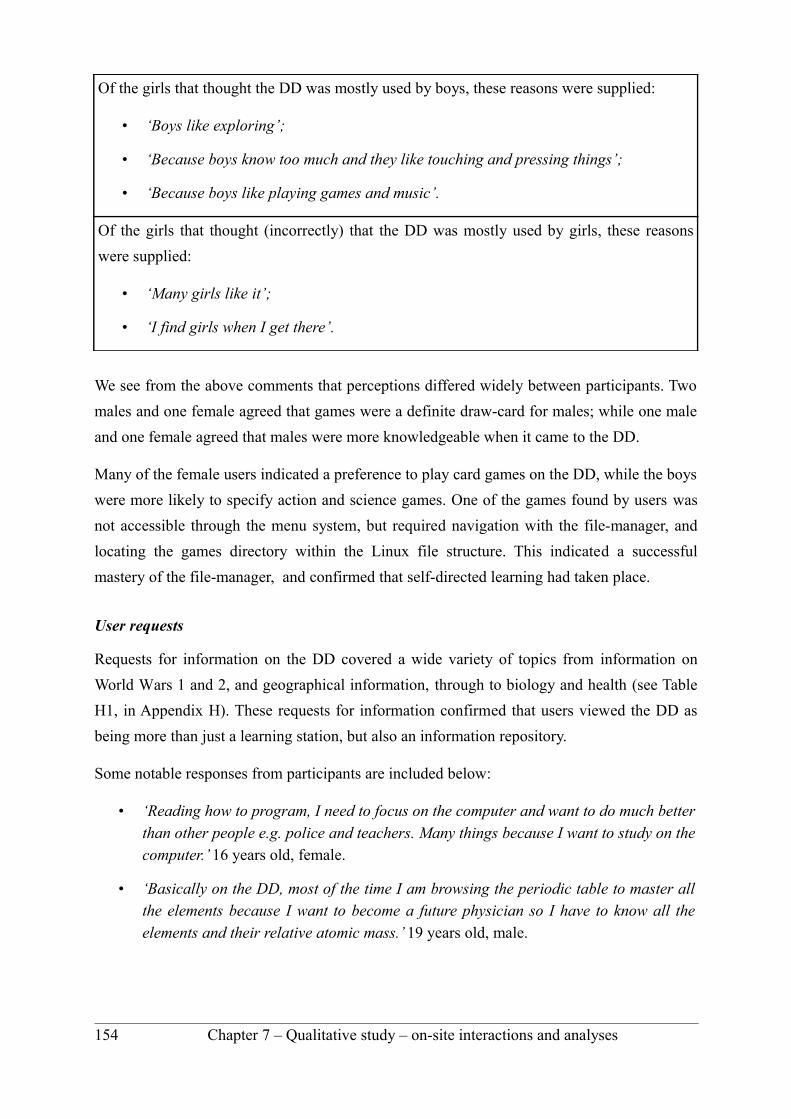
Of the girls that thought the DD was mostly used by boys, these reasons were supplied:
• ‘Boys like exploring’;
• ‘Because boys know too much and they like touching and pressing things’;
• ‘Because boys like playing games and music’.
Of the girls that thought (incorrectly) that the DD was mostly used by girls, these reasons
were supplied:
• ‘Many girls like it’;
• ‘I find girls when I get there’.
We see from the above comments that perceptions differed widely between participants. Two
males and one female agreed that games were a definite draw-card for males; while one male
and one female agreed that males were more knowledgeable when it came to the DD.
Many of the female users indicated a preference to play card games on the DD, while the boys
were more likely to specify action and science games. One of the games found by users was
not accessible through the menu system, but required navigation with the file-manager, and
locating the games directory within the Linux file structure. This indicated a successful
mastery of the file-manager, and confirmed that self-directed learning had taken place.
User requests
Requests for information on the DD covered a wide variety of topics from information on
World Wars 1 and 2, and geographical information, through to biology and health (see Table
H1, in Appendix H). These requests for information confirmed that users viewed the DD as
being more than just a learning station, but also an information repository.
Some notable responses from participants are included below:
• ‘Reading how to program, I need to focus on the computer and want to do much better than other people e.g. police and teachers. Many things because I want to study on the computer.’ 16 years old, female.
• ‘Basically on the DD, most of the time I am browsing the periodic table to master all the elements because I want to become a future physician so I have to know all the elements and their relative atomic mass.’ 19 years old, male.
154 Chapter 7 – Qualitative study – on-site interactions and analyses
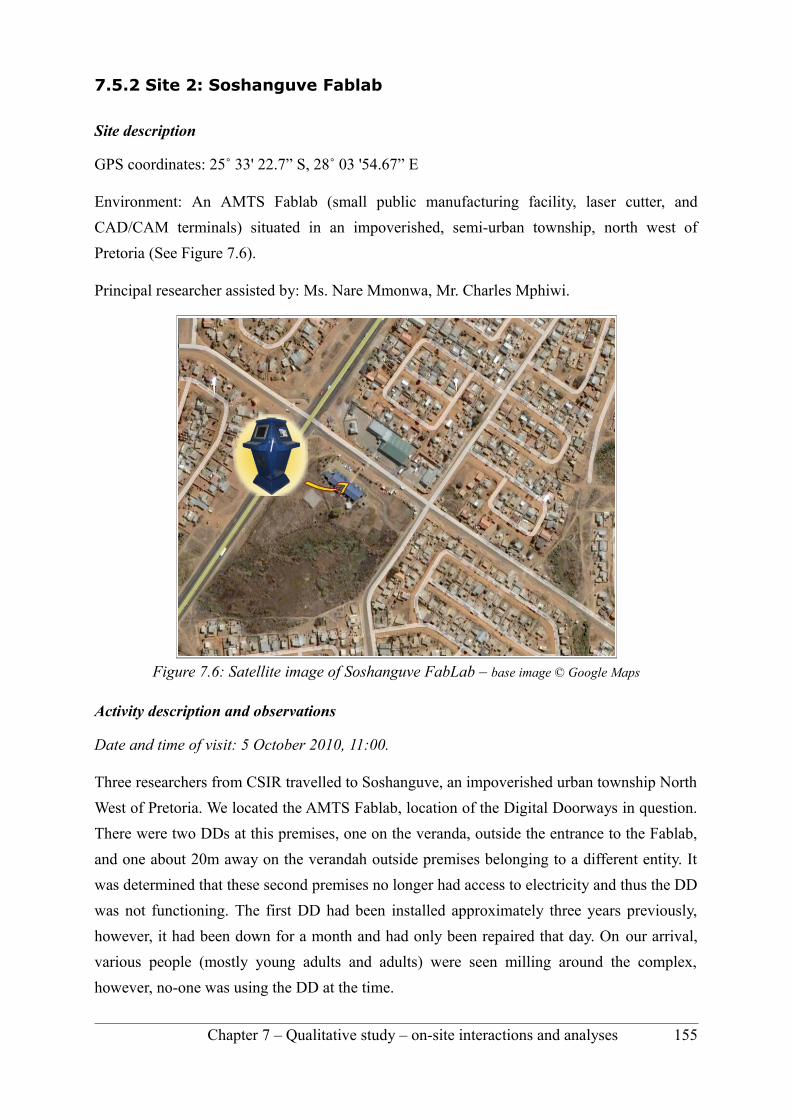
7.5.2 Site 2: Soshanguve Fablab
Site description
GPS coordinates: 25˚ 33' 22.7” S, 28˚ 03 '54.67” E
Environment: An AMTS Fablab (small public manufacturing facility, laser cutter, and
CAD/CAM terminals) situated in an impoverished, semi-urban township, north west of
Pretoria (See Figure 7.6).
Principal researcher assisted by: Ms. Nare Mmonwa, Mr. Charles Mphiwi.
Activity description and observations
Date and time of visit: 5 October 2010, 11:00.
Three researchers from CSIR travelled to Soshanguve, an impoverished urban township North
West of Pretoria. We located the AMTS Fablab, location of the Digital Doorways in question.
There were two DDs at this premises, one on the veranda, outside the entrance to the Fablab,
and one about 20m away on the verandah outside premises belonging to a different entity. It
was determined that these second premises no longer had access to electricity and thus the DD
was not functioning. The first DD had been installed approximately three years previously,
however, it had been down for a month and had only been repaired that day. On our arrival,
various people (mostly young adults and adults) were seen milling around the complex,
however, no-one was using the DD at the time.
Chapter 7 – Qualitative study – on-site interactions and analyses 155
Figure 7.6: Satellite image of Soshanguve FabLab – base image © Google Maps
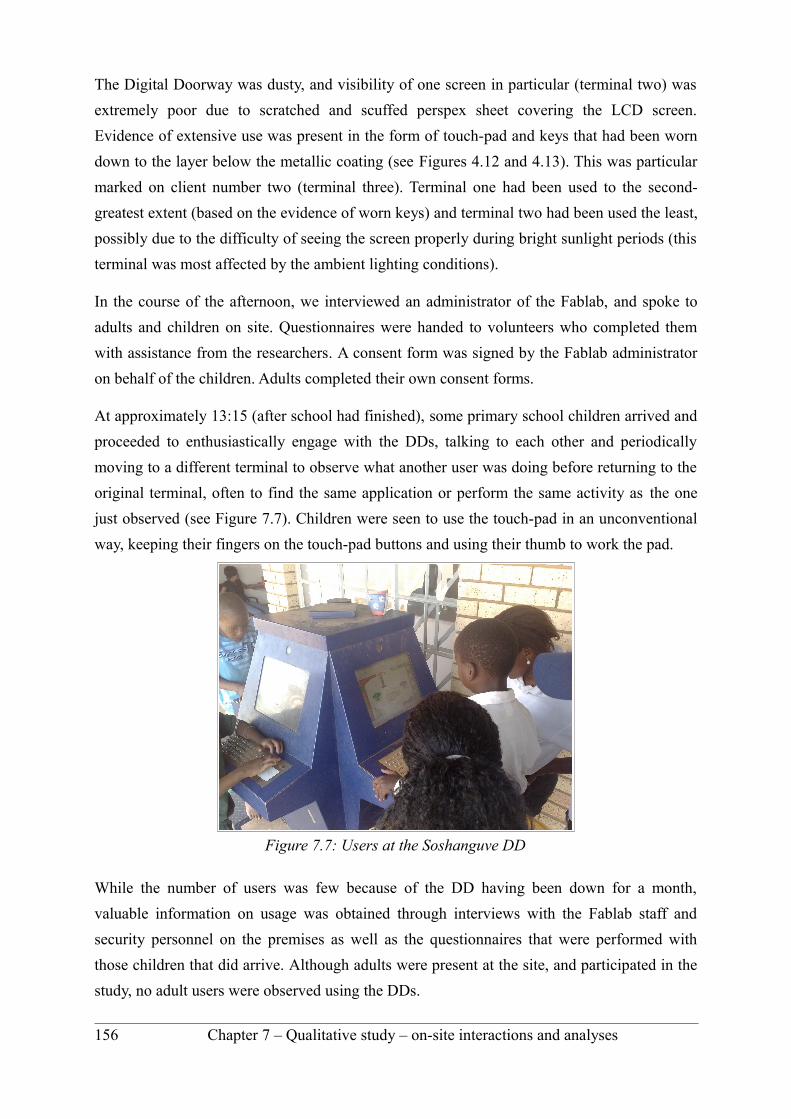
The Digital Doorway was dusty, and visibility of one screen in particular (terminal two) was
extremely poor due to scratched and scuffed perspex sheet covering the LCD screen.
Evidence of extensive use was present in the form of touch-pad and keys that had been worn
down to the layer below the metallic coating (see Figures 4.12 and 4.13). This was particular
marked on client number two (terminal three). Terminal one had been used to the second-
greatest extent (based on the evidence of worn keys) and terminal two had been used the least,
possibly due to the difficulty of seeing the screen properly during bright sunlight periods (this
terminal was most affected by the ambient lighting conditions).
In the course of the afternoon, we interviewed an administrator of the Fablab, and spoke to
adults and children on site. Questionnaires were handed to volunteers who completed them
with assistance from the researchers. A consent form was signed by the Fablab administrator
on behalf of the children. Adults completed their own consent forms.
At approximately 13:15 (after school had finished), some primary school children arrived and
proceeded to enthusiastically engage with the DDs, talking to each other and periodically
moving to a different terminal to observe what another user was doing before returning to the
original terminal, often to find the same application or perform the same activity as the one
just observed (see Figure 7.7). Children were seen to use the touch-pad in an unconventional
way, keeping their fingers on the touch-pad buttons and using their thumb to work the pad.
While the number of users was few because of the DD having been down for a month,
valuable information on usage was obtained through interviews with the Fablab staff and
security personnel on the premises as well as the questionnaires that were performed with
those children that did arrive. Although adults were present at the site, and participated in the
study, no adult users were observed using the DDs.
156 Chapter 7 – Qualitative study – on-site interactions and analyses
Figure 7.7: Users at the Soshanguve DD
Twelve questionnaires were completed under the guidance of the researchers, and the
following semi-structured interview conducted.
Semi-structured interview – site administrator
Participant: A male volunteer worker at the AMTS Fablab, in his twenties or early thirties.
According to him, users were mostly aged between 7 and 19 years, with the most consistent
users being those in grades 10, 11 and 12. The most popular time to use the DD was between
2pm and 5pm, after which the complex was locked, except on occasions where the Fablab
staff were under work pressure, in which case the security guard would be required to lock the
facilities at a later hour, and users could access the DD for longer periods than usual. The
complex was also open every Saturday between 7am and 5pm.
His impression was that users were mainly girls, however, a number of respondents in the
questionnaires indicated that more boys than girls used the DD. This agreed with the findings
in Table 6.4, of more males than females registering accounts. At the time of the visit, only
males were observed using the DD, however, a number of girls were in the area and
acknowledged having used the DD before.
The interview respondent believed that there were enough programs for girls especially in
light of all the educational resources on the DD, but that there was always a need for further
educational resources. He had noticed that the Mindset educational content was popular, and
did not know which of the games users preferred. When asked what other programs he
thought would be beneficial on the DD, he named a vector graphics program (Inkscape).
However, he was unaware that this application was already on the DD.
When asked which additional information he thought users would require on the DD, he
mentioned employment resources, typing-skills development, and computer literacy courses.
A further request involved linking the DD to PCs within the neighbouring computer school
and providing other PCs on the premises (inside the Fablab), with access to the content on the
DD. He stressed the need for an external USB port, particular for school learners to be able to
save information from the DD.
When asked if he thought the DD helped learners acquire basic computer skills he responded
in the affirmative, adding that there was value in acquiring ‘science and technology
knowledge’ and ‘promoting debate amongst learners’; referring to the collaborative nature of
learning at the DD terminals.
Chapter 7 – Qualitative study – on-site interactions and analyses 157

Regarding awareness of the DDs, he mentioned that teachers at nearby schools had been
informed of the DD's presence, and regularly sent school children to the DD to access
information. Awareness campaigns promoting the DD had been conducted two years
previously, as well as the previous year. These campaigns had involved visits to schools,
where teachers were informed of the DD facility.
Soshanguve questionnaire results
Recording of responses
Questionnaires were numbered 1 to 12 to identify them. Additions were made to the previous
spreadsheet, and the cells populated for the Soshanguve site, for identifying the particular
themes and patterns that occurred there.
Participant details
The twelve participants ranged in age from 9 to 35 years old (Figure 7.8) and comprised nine
males and three females. There was a representative distribution across the age spectrum.
While all participants were familiar with the DD, and had spent time using it, not all of them
interacted with it during the course of the afternoon.
Users in Soshanguve displayed a varied
mix of home languages. Nine of the twelve
participants indicated a preference to
interact with a computer in English. For
most users in this case study, the DD was
not the only PC they had access to, with
eight users having access to a home PC as
well. Despite this, all twelve participant
indicated that the DD was useful.
Usage findings
Half the users (six) indicated that they used
the DD alone, while five users specified they used it in a group of friends. A high percentage
of users (eight of the twelve) displayed a preference for learning computers alone. Only one
user indicated the availability of school computer classes.
158 Chapter 7 – Qualitative study – on-site interactions and analyses
Figure 7.8: Age distribution, Soshanguve
9 10 18 19 21 23 27 29 35
0
0.5
1
1.5
2
2.5
Count
Age
Ten of the twelve participants indicated that the DD had helped them learn how to use a
computer. Of the users who indicated that they played games on the DD, a variety of
favourites emerged, from card games to action games and maths and science games. Some
older users indicated that they did not play games on the DD, rather using it for searching for
information. A number of users showed a preference for using the encyclopaedia (Wikipedia)
to find information. Another favourite was watching movies. There seemed to be a general
desire to have access to information and to increase their knowledge.
The site administrator displayed enthusiasm regarding the facility, and was particularly
interested in the possibility of more advanced customisation of the DD, as he stated: ‘Play
around with settings, trying to integrate a wireless feature into it. Make sure people can print
out information and log into the machine from remote PCs’.
Gender differences
Participants indicated that the DD was mostly used by boys. One of reasons for this appeared
to be that boys dominated the use of the machine and did not allow girls to use it as
highlighted by the following comment by a 21 year-old male: ‘Girls don't have time to use
the DD as it is always being occupied by boys’. Six users felt that there were enough
applications for girls. Five did not specify or indicated that they didn't know. Another user, a
19 year-old female, stated: ‘Girls like fun and interesting games. The latest ones’.
Some further notable questionnaire responses:
• ‘Boys do not give girls a chance to use the machine’ 18 year-old male.
• ‘Boys like games. Girls will be mostly researching, doing their homework’ 35 year-old female.
• ‘Boys play games, girls do homework’ 10 year-old male.
User requests
Requests for applications included Internet, email, social media, graphics applications, audio
facilities and more games (see Table H1). The requirement for business information,
geography information and local content (councillor-ships and youth organisations in the
area) reflected a more mature user base in this interview and questionnaire session, than had
been the case at the Gatang location (Section 7.5.1). The proximity to the Fablab might also
have affected the demographics of the typical DD user and associated requests for further
content.
Chapter 7 – Qualitative study – on-site interactions and analyses 159

Awareness
Despite the promotion at schools in previous years, some participants indicated a general lack
of understanding of the purpose of the DD, as the following comment highlights:
• ‘Most people they don't know that DD is for free. If people can receive pamphlets and information about DD’ 29 year-old male
While many users become aware of the DD through word of mouth, there is an ongoing need for explicit promotion and publicity of the DDs, especially amongst older users (see Section 8.8 on DD awareness).
7.5.3 Site 3: Emjindini library
Site description
GPS coordinates: 25˚ 46’ 29.15” S 31˚ 01’ 48.44” E
Environment: A satellite library in Emjindini township, outside the small town of Barberton,
Mpumalanga. The area is semi-urban, with a combination of RDP houses and more expensive
houses (see Figure 7.9).
Principal researcher assisted by: Ms. Nare Mmonwa, Mr. Charles Phiri, Ms. Bonang Tselane.
160 Chapter 7 – Qualitative study – on-site interactions and analyses
Figure 7.9: Satellite image of Emjindini library - base image © Google Maps
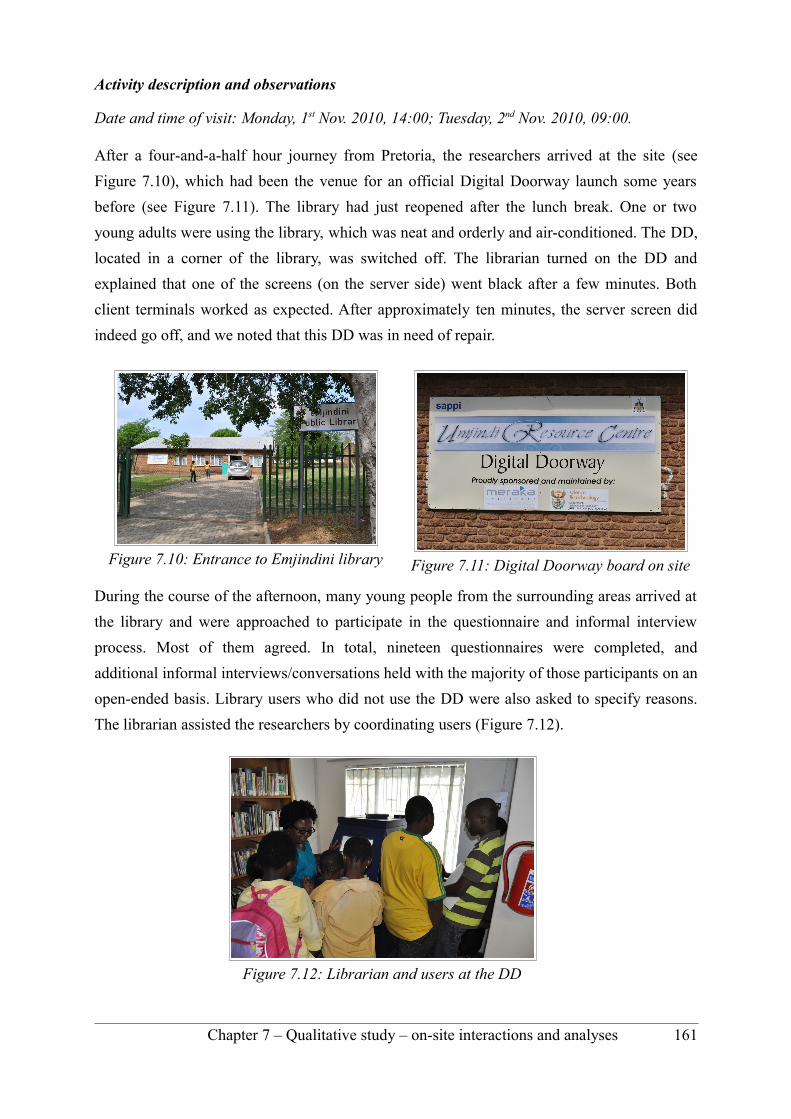
Activity description and observations
Date and time of visit: Monday, 1st Nov. 2010, 14:00; Tuesday, 2nd Nov. 2010, 09:00.
After a four-and-a-half hour journey from Pretoria, the researchers arrived at the site (see
Figure 7.10), which had been the venue for an official Digital Doorway launch some years
before (see Figure 7.11). The library had just reopened after the lunch break. One or two
young adults were using the library, which was neat and orderly and air-conditioned. The DD,
located in a corner of the library, was switched off. The librarian turned on the DD and
explained that one of the screens (on the server side) went black after a few minutes. Both
client terminals worked as expected. After approximately ten minutes, the server screen did
indeed go off, and we noted that this DD was in need of repair.
During the course of the afternoon, many young people from the surrounding areas arrived at
the library and were approached to participate in the questionnaire and informal interview
process. Most of them agreed. In total, nineteen questionnaires were completed, and
additional informal interviews/conversations held with the majority of those participants on an
open-ended basis. Library users who did not use the DD were also asked to specify reasons.
The librarian assisted the researchers by coordinating users (Figure 7.12).
Chapter 7 – Qualitative study – on-site interactions and analyses 161
Figure 7.12: Librarian and users at the DD
Figure 7.11: Digital Doorway board on siteFigure 7.10: Entrance to Emjindini library
Snapshots of user experiences observed
The majority of library users were under the age of twenty. Older users did enter the library,
but were not seen to use the DD. On the following morning, the library was very quiet, and
the few young adults who came in, all indicated that they had not used the DD before, and
were content to locate information in the traditional book-based manner. They also indicated
that they were unaware of the benefits of a computer. This implies that a potential opportunity
exists to make these users aware of the resources and learning opportunities afforded by the
DD.
Mention was made of the DD being potentially noisy when lots of school children were using
it, disturbing other users in the library. Options for locating the DD outside the library should
be considered for this reason.
Some users were unaware that the information they were seeking was available on the DD,
and had to be shown how to access the encyclopaedia and search for a particular topic of
interest. One boy requested information on the local area of Barberton. The researcher showed
him an encyclopaedia search that did indeed return information on Barberton. The
introduction of a prominent content search icon, in later DD releases will help facilitate self-
discovery of this important resource.
Another boy (15 years old) indicated that he was ‘not interested in computers’ although he
had access to a computer at home. He indicated that he would use the DD for school research,
but did not like the idea of having to copy information from the screen, and requested that
printer facilities be included.
Many requests were made for the ability to print documents from the DD. There was a printer
in the library, that the librarian could use to print documents from her computer. The option to
connect the DD to that printer was viable, given the controlled environment of the library. The
librarians were very involved with the young people, helping them find books and research
material, and encouraging them to participate in the research study, as well as perform
information searches at the DD.
Some of the girls mentioned that boys didn’t use the computer but rather picked up books, and
that the girls used the computer the most. The quantitative study revealed that the boy to girl
user registration ratio was approximately 2:1 (Table 6.4), however, that figure does not reflect
day-to-day, or week-to-week changes in behaviour or gender distribution.
162 Chapter 7 – Qualitative study – on-site interactions and analyses

Emjindini questionnaire results
Recording of responses
Questionnaires were numbered 1 to 18 to identify them. Further additions and refinements
were made to the spreadsheet previously drawn up for the first two sites, and the cells
populated for Emjindini.
Participant details
The eighteen participants ranged in age from 10 to 39 years old (Figure 7.13), and included
seven males and eleven females.
While participants mostly spoke Siswati at home, all eighteen indicated a preference for
interacting with a computer in English. Nine participants had access to a home PC, while six
had access to a PC at a friend's house.
Usage findings
Sixteen participants felt that the DD was useful. Eleven users had been using the DD for over
a year. The DD was predominantly used in the afternoon (fifteen of the eighteen users), with
eight of the participants using it less than twice a week; five using it three to four times a
week; and a further five interacting five or more times a week. Ten users indicated that they
spent between one and two hours per session on the DD.
Ten users indicated that they used the DD for homework. This corresponded with a high
percentage of users who indicated use of the reference resources and encyclopaedia for
finding information. Seven indicated that they had school computer classes, while six other
Chapter 7 – Qualitative study – on-site interactions and analyses 163
Figure 7.13: Age distribution, Emjindini
10 11 13 14 15 16 17 18 21 39
0
0.5
1
1.5
2
2.5
3
3.5
Count
Age
school-age users did not. Sixteen of the eighteen participants explained that the DD had
helped them learn how to use a computer, while only one stated that he had learned elsewhere.
Some users mentioned that the librarian discouraged users from playing games, however, for
those that did play games, card games and action games were the most popular. One user
mentioned finding the game titled ‘X-moto’ (not directly accessible via the standard menu).
Users at Emjindini evidenced a preference for using the open encyclopaedia application,
Wikipedia, DD resources and the Celestia space simulation application, as well as playing
games. The most common response to ‘Why is that your favourite application?’ was ‘It helps
me with my homework’. Other user activity included watching movies.
An important issue was addressed with regard to Wikipedia: the researchers determined that it
was extensively used, due to users being encouraged to search for information on the DD for
school projects, both by the librarians and (according to the librarian) by schools in the area.
Users were enthusiastic about the DD and keen to learn more. Two boys, aged 13 years,
showed an eagerness to discover more about the DD. When informed that the software would
be upgraded in the near future, they were quick to enquire as to the exact date this would
happen.
One user (aged 17) indicated that he had not learned to use a computer by accessing the DD,
as he had a computer at home. He stated, however, that the DD was useful and entertaining.
He used it both to play games and for research. He had discovered a gamed called X-moto
that was not accessible from the menu system. On being asked how he had located the game,
he mentioned three different ways the game could be accessed: through the file-manager,
navigating to a games directory; via the ‘run custom program’ option in the menu; or by
opening a terminal window and typing in the name of the game. This indicated that he was
indeed computer-literate and had grasped various ways of accessing software applications on
the DD, showing resourcefulness in reaching his goal.
The same user requested Internet services and a 3D landscape-generating application.
Gender differences
In contrast to the other sites, indications were that Emjindini library DD was used more by
girls than boys. Seven respondents indicated that the DD was used more by girls, while only
four believed it was used more by boys. Table 6.4 indicates that, on average over a 28 month
period, twice as many males than females registered user accounts, but a 1:2 female:male
ratio shows notably higher usage by females than elsewhere.
164 Chapter 7 – Qualitative study – on-site interactions and analyses

Some gender-related comments are included below:
• ‘Girls use computer boys use books’;
• ‘Both gender because they all need to use it for homework and projects’;
• ‘Because I think girls like things like beauty’;
• ‘Its because boys are the ones who do their homework’;
• ‘Because it doesn’t have some information that girls usually like the most, like gossiping’, female 16
Twelve respondents indicated there were enough applications for girls.
User requests
Some interesting requests emerged, including the desire for a printer to be hooked up to the
DD and the ability for users to take pictures and upload them to the Internet. When asked
what additional information would be useful on the DD, responses were varied, from celebrity
gossip and music videos to health and nature information (see Table H1). Some notable
responses were:
• ‘Information about school things and cultural stuff, political information. They also should access TV in the Internet for developing technology but not unnecessary stuff that make children not concentrate on school work. Music is also appropriate in there.’ 17 year-old female;
• ‘If you fixed the printer. Because we need information but it is difficult for us to print. Internet also. We need a separate space for DD because we make a lot of noise, others are busy studying inside the library and they complain.’ 13 year-old female;
• ‘There are great things here for everyone’ 21 year-old female.
Discussion
The overall impression of the site was one of a well-managed library facility, where visitors
were enthusiastic about learning, and willing to embrace whatever technology was available.
While the librarians indicated that they required advanced instruction on the use of the DD, so
that they could further instruct users, they were enthusiastic about encouraging users to use
the DD on their own, to find information.
The researcher felt that some basic instruction on the DD to the librarians would be beneficial. Such instruction would enable them to give users an idea of the content on the DD and the potential for finding information. Thereafter, the users would have enough interest, expertise, and motivation to explore the DD independently.
Chapter 7 – Qualitative study – on-site interactions and analyses 165

7.5.4 Msunduzi Customer Centre
Site description
GPS coordinates: 29˚ 39’ 56.25” S, 30° 38’ 11.39” E
Environment: The DD was situated on the verandah of a customer care centre building,
surrounded by a collection of municipal offices, a post office, and a library that was situated
inside a recycled shipping container. The complex is located within a sprawling rural
development in a hilly area of KwaZulu-Natal (see Figure 7.14). The area is named after the
Msunduzi river, which flows through the region.
Activity description and observations
Date and time of visit: 11 November 2010, 15:00.
The researcher arrived at the site at approximately 3pm. Contact was made with two staff
workers in the municipal complex who agreed to be interviewed. These were a librarian at the
container library, and a lady responsible for cleaning of the complex.
The fact that the researcher was from the organisation that had developed and installed the
device, had the potential to influenced the interview participants to bias their answers to
favourable ones. For this reason, they were specifically asked to provide open, honest
responses.
166 Chapter 7 – Qualitative study – on-site interactions and analyses
Figure 7.14: Satellite image of Msunduzi DD site – base image © Google Maps
On arrival at the site, it was noted that the DD had been switched off, hence there was no user
activity. According to the staff workers, the reason for this was that, up until a few weeks
earlier, the library, which assumed responsibility for the machine, had not contributed to the
monthly electricity cost of the complex. The machine was perceived to be wasting electricity
and thus had been switched off. The librarian mentioned that the library had since begun to
contribute to the electricity costs and that the DD could thus be switched on permanently. The
cleaner also mentioned that the DD would be left on from that time on.
Once switched on, the DD itself was seen to be in working order, except for the external USB
port. This was one of the few DDs with an external USB port, however, the slot had been
damaged and was unusable. Damage to external ports and drives was the reason they were not
included in the original design, and the system in question illustrates one of the inherent
problems with the provision of additional functionality.
While the researcher was interviewing the staff members, two boys aged 8 and 12, arrived to
use the computer. They were pleased to find that it was in operation again. Neither boy could
speak English, so the researcher did not interview them, but observed some of their behaviour
and demonstrated a few activities on the DD. The boys conversed with each other, while
interacting at separate terminals of the DD.
The children who arrived at the DD were observed to be playing games, as well as using the
Tuxpaint program for drawing. The researcher observed the actions of one young male user,
noting how he logged on, after arrival at the DD. The researcher suggested he log on with
guest user ‘DD1’, however, he mentioned the word ‘five’ and proceeded to log in with guest
user ‘DD5’. Apart from a few English words, he could not speak that language, but had
obviously learned how to log in using DD5 from other users, though not with his own user
account (see Sections 5.5.2 and 6.2.2). This indicated that he had acquired enough learning to
log into the DD, without fully grasping the concept of guest user logins.
Interview participant details
The following participants were selected for the semi-structured interviews:
• African male, early twenties, Zulu home language – librarian.
• African female, thirties, Zulu home language – cleaning staff.
Both staff member were competent in English and indicated a preference to learn computer
skills in English rather than Zulu, due to the difficulty of transitioning to an English interface
in the work place, if their learning had occurred on a Zulu interface.
Chapter 7 – Qualitative study – on-site interactions and analyses 167
Usage findings
The interview was conducted in a semi-structrured way, with both participants being
interviewed at the same time, while the researcher took notes. Consent forms were signed by
both participants.
The following point were made:
• Many children in the area were aware of the existence of the DD, and made use of it.
• There were approximately fifteen schools in the area.
• Most of the schools were equipped with computer labs and offered computer classes.
• The librarian requested some basic training, in order to be able to teach children how to use the DD effectively.
• The complex was open between 7:00 and 4:30 on week days. It was closed on weekends.
• Usage at that time of year (11 November) was low, since students were writing exams, and were studying in the library.
• The two participants did not know how to use the DD, and thus were unable to show others.
• Neither respondent had a computer at their home or at a friend's home.
• The respondents were unfamiliar with the content on the DD, and thus could not comment on its appropriateness. However, they commented that users mostly used the DD to play games, with some doing research for school purposes.
• They both had access to a workplace computer in the library that was Internet-enabled, but did not indicate how proficient they were at using it.
• Users had to pay to use the Internet in the library.
• If the USB port had been operational, the printer in the library could have been used
for print outs. The library charged R3 a page.
• Most users were between 14 and 21 years old, and would converge on the site in the afternoon after school.
• Both boys and girls used the DD.
• The gender balance was most even for users in matric. For younger users, the DD was used more by boys than girls.
168 Chapter 7 – Qualitative study – on-site interactions and analyses
• When asked what they thought should be on the DD, in terms of content, the following were suggested: school related content, in particular maths and science material; for older users: email and resources to do with agriculture.
• They both indicated a desire that schools in the area be contacted and made aware of the benefits of the DD. It is interesting to contrast this with the Emjindini library DD, which had held a formal launch and was well known in its community.
• Importantly, a request was made for a poster or chart to be placed on a nearby wall, explaining something of the DD and giving basic usage instructions to help new users. A similar request was made by a user at the Soshanguve site.
Discussion
This case study differed from the previous three, in that no questionnaires were completed,
and data was collected by means of observation and interviews only. The site visit highlighted
the following aspects with regard to ICT in education in general, and the DD in particular:
• Fifteen schools, thousands of school children and tens of thousands of people are located in a community with a desperate need for better infrastructure.
• The limited effectiveness of only one DD, in a community with such great need, became apparent.
• Technical aspects, and infrastructure provision are just one of a number of challenges accompanying efforts to to promote ICT education in impoverished areas.
• Social and local political structures can have a significant impact on the effectiveness of the DD, particularly with regard to electricity costs, awareness, and staff confidence in the device.
• There is a need for basic training and some catalyst interventions, such as a launch, or awareness programmes, or awareness posters, to maximise the potential of the device.
• The DD is vulnerable to damage of external USB ports.
• There is a need to find a compromise between physical position (e.g., safely installed
on a verandah within a municipal complex, or inside a library) and accessibility to
users (e.g., next to a busy road). The former being preferred for reasons of security,
and management, while the latter holds advantages for creating awareness and
offering accessibility.
Chapter 7 – Qualitative study – on-site interactions and analyses 169
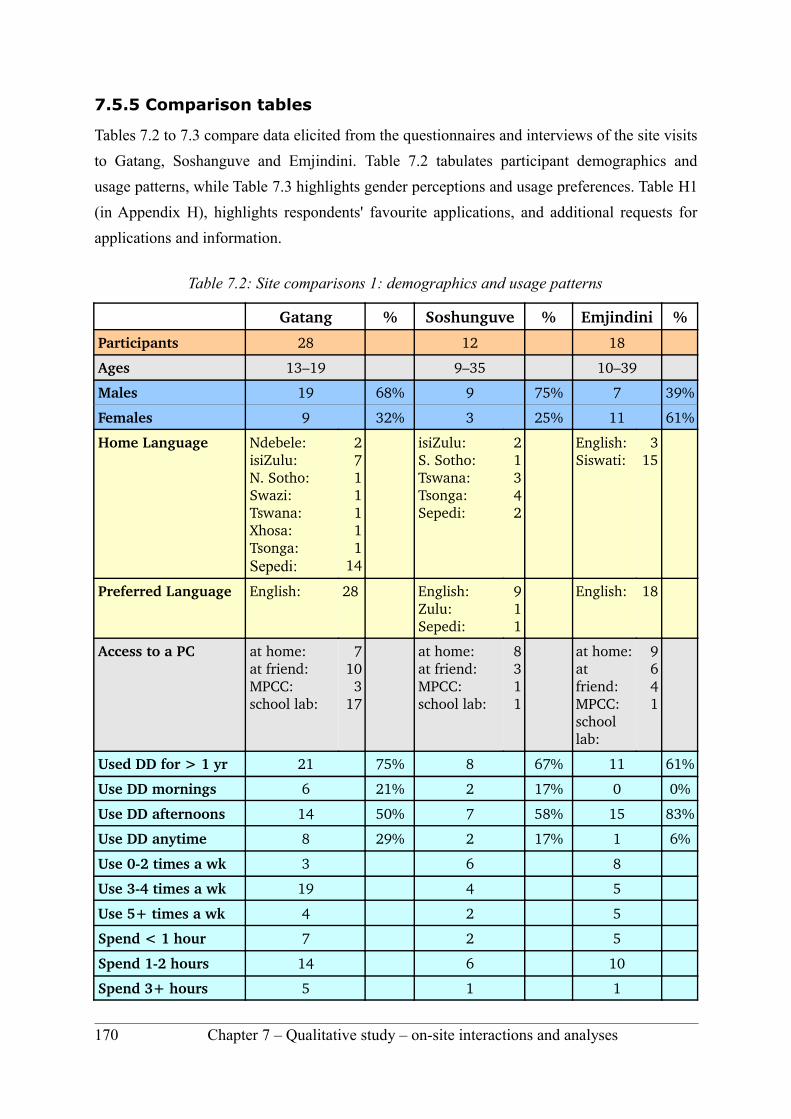
7.5.5 Comparison tables
Tables 7.2 to 7.3 compare data elicited from the questionnaires and interviews of the site visits
to Gatang, Soshanguve and Emjindini. Table 7.2 tabulates participant demographics and
usage patterns, while Table 7.3 highlights gender perceptions and usage preferences. Table H1
(in Appendix H), highlights respondents' favourite applications, and additional requests for
applications and information.
Table 7.2: Site comparisons 1: demographics and usage patterns
Gatang % Soshunguve % Emjindini %
Participants 28 12 18
Ages 13–19 9–35 10–39
Males 19 68% 9 75% 7 39%
Females 9 32% 3 25% 11 61%
Home Language Ndebele:isiZulu:N. Sotho:Swazi:Tswana:Xhosa:Tsonga:Sepedi:
2711111
14
isiZulu:S. Sotho:Tswana:Tsonga:Sepedi:
21342
English: Siswati:
315
Preferred Language English: 28 English:Zulu:Sepedi:
911
English: 18
Access to a PC at home:at friend:MPCC:school lab:
7103
17
at home:at friend:MPCC:school lab:
8311
at home: at friend:MPCC:school lab:
9641
Used DD for > 1 yr 21 75% 8 67% 11 61%
Use DD mornings 6 21% 2 17% 0 0%
Use DD afternoons 14 50% 7 58% 15 83%
Use DD anytime 8 29% 2 17% 1 6%
Use 02 times a wk 3 6 8
Use 34 times a wk 19 4 5
Use 5+ times a wk 4 2 5
Spend < 1 hour 7 2 5
Spend 12 hours 14 6 10
Spend 3+ hours 5 1 1
170 Chapter 7 – Qualitative study – on-site interactions and analyses
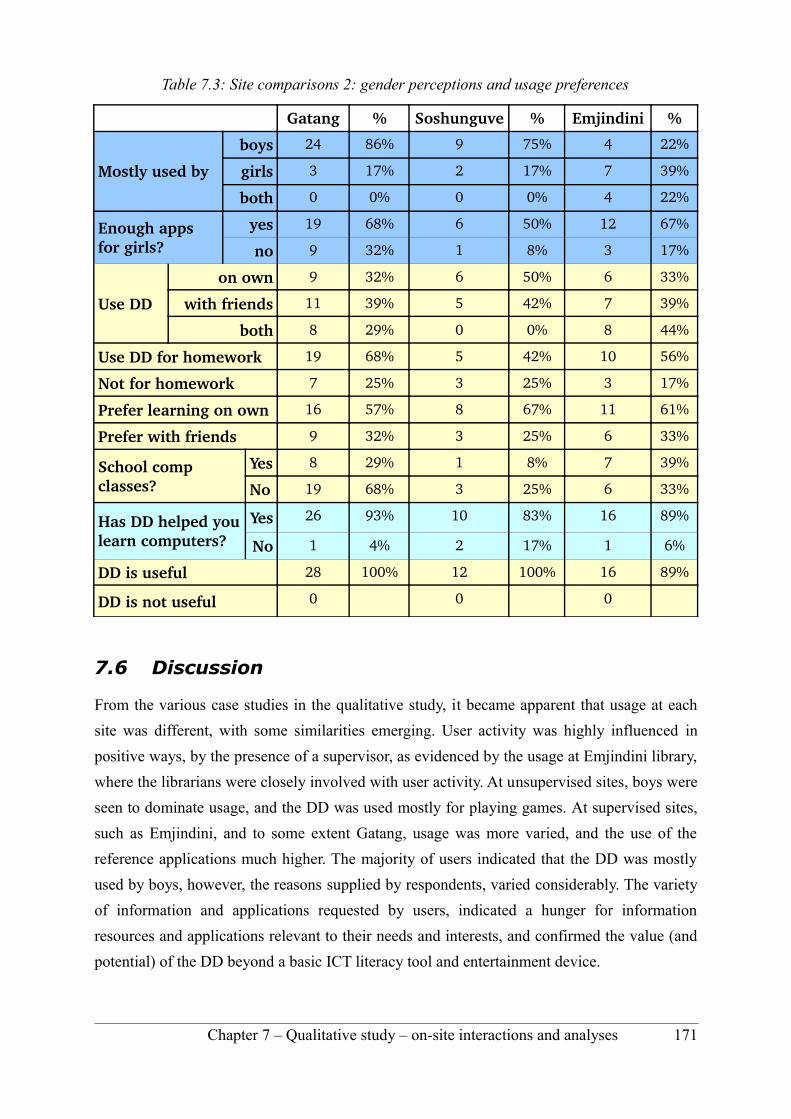
Table 7.3: Site comparisons 2: gender perceptions and usage preferences
Gatang % Soshunguve % Emjindini %
Mostly used by
boys 24 86% 9 75% 4 22%
girls 3 17% 2 17% 7 39%
both 0 0% 0 0% 4 22%
Enough apps for girls?
yes 19 68% 6 50% 12 67%
no 9 32% 1 8% 3 17%
Use DD
on own 9 32% 6 50% 6 33%
with friends 11 39% 5 42% 7 39%
both 8 29% 0 0% 8 44%
Use DD for homework 19 68% 5 42% 10 56%
Not for homework 7 25% 3 25% 3 17%
Prefer learning on own 16 57% 8 67% 11 61%
Prefer with friends 9 32% 3 25% 6 33%
School comp classes?
Yes 8 29% 1 8% 7 39%
No 19 68% 3 25% 6 33%
Has DD helped you learn computers?
Yes 26 93% 10 83% 16 89%
No 1 4% 2 17% 1 6%
DD is useful 28 100% 12 100% 16 89%
DD is not useful 0 0 0
7.6 Discussion
From the various case studies in the qualitative study, it became apparent that usage at each
site was different, with some similarities emerging. User activity was highly influenced in
positive ways, by the presence of a supervisor, as evidenced by the usage at Emjindini library,
where the librarians were closely involved with user activity. At unsupervised sites, boys were
seen to dominate usage, and the DD was used mostly for playing games. At supervised sites,
such as Emjindini, and to some extent Gatang, usage was more varied, and the use of the
reference applications much higher. The majority of users indicated that the DD was mostly
used by boys, however, the reasons supplied by respondents, varied considerably. The variety
of information and applications requested by users, indicated a hunger for information
resources and applications relevant to their needs and interests, and confirmed the value (and
potential) of the DD beyond a basic ICT literacy tool and entertainment device.
Chapter 7 – Qualitative study – on-site interactions and analyses 171
It was observed that both external and internal factors have an effect on application usage.
The following factors were the most obvious:
External factors influencing usage
• Time of day – school and work hours impacted on the time available to use the DD;
• Location – both in terms of physical position (e.g., a busy corridor), and the general site location (school, library etc.);
• Whether DD is switched on – administrative issues, perceived high cost of electricity, or high noise levels, may result in the DD being turned off;
• Whether DD terminals are working – see Figure 4.17 for aspects of an effective installation;
• Glare from the sun – a noticeable problem at the Gatang site;
• Availability of electricity – rural communities often experience regular power failures;
• Restriction of the environment (noise in libraries) – at Emjindini site, games usage was restricted due to high noise levels;
• Extent of crowding at the site – at busy sites, access is limited, and quiet study of DD content is not possible;
• Study demands (exams) – applicable wherever student are present;
• Personal demands (social/domestic commitments) – often affecting older teenagers and adults more than younger users;
• Distance from DD to home – users in certain communities may have to walk a few kilometres to reach the DD;
• Availability of printing facilities – lack of a printer may mean that time taken to complete research activities is increased, as users copy the information from the screen;
• Encouragement/restrictions from authorities – the involvement of a teacher or librarian can influence usage behaviours.
Internal factors influencing usage
• Language barrier – potentially limits the effectiveness of reference material, tutorials and guides, as well as following instructions for basic procedures such as logging in;
• General perception of the content – if material is to be used, it must be perceived to be relevant;
• Motivational factors – e.g., the desire for entertainment versus the desire for learning versus immediate needs (finding a job, health information etc.);
172 Chapter 7 – Qualitative study – on-site interactions and analyses
• Previous experience – new users explore content in a random, erratic way, whereas familiarity with the DD typically results in more focused/directed activity;
• Peer pressure or peer encouragement – especially noticeable when groups of users interact around the DD;
• Risk of embarrassment and lack of confidence – especially noticeable amongst older users (26+);
• Level of education – certain resources will be more appropriate than others, depending on the educational level of the user.
Noticeable themes in user feedback comments
An additional useful source of qualitative data consists of comments from the online
mechanism (See Section 4.10), collected over a period of two years, 2007 and 2008. These
provide further insight into user opinion and perceived needs and desires. Of a random sample
of 73 opinionated comments extracted from those received from DD sites throughout South
Africa, 66 were positive (90%), and just seven were negative (10%). In addition to this,
numerous feedback messages contained suggestions or requests. Examples of each of the
above, are included below:
Positive examples:
• ‘We love it’ – April, 2007;
• ‘Hi i'm enjoying it a lot coz there are many things i've learn. and i using it to find info about how people were living long time ago. & finding out about what happening around us "ya" oh! i nealy fogort your science is absolutly great, there are many things i can say about your computers thnx alot’ – May, 2007;
• ‘it is very wonderful to use the digital doorway. i use it to investigate some of the study that i am learning now even though there is no music to listen and it is so boring when we come to that’ – February, 2007.
Negative examples:
• ‘i dont feel gaining some skills bcos we dont surf the internet’ – April, 2007;
• ‘I'm trying to brows the web but I cant, why is this thing doesn't search the web?’ – April, 2007.
Request examples:
• ‘we do enjoy your digital doorway .I wish you could've added some music, it would be better.’ – March, 2007;
• ‘Nice!! But where is the Internet?’ – August, 2008;
Chapter 7 – Qualitative study – on-site interactions and analyses 173

• ‘It's plessure to have this machine at our college. I have knowing many thngs through this machine. I would like you to add the whole informention about South Africa such as how many airports do we have?’ – February, 2007;
• ‘i would like you to send me a xbox game on my file’ – August, 2008;
• ‘can you help me to get where they talk about the effect of smoking during pregnancy please.’ – March, 2007.
In terms of requests for information and further functionality, the following major themes
emerged from analysis of this feedback:
• Numerous requests for the Internet, email, music, movies and games;
• A number of requests for career information, university courses or finding a job;
• A number of requests for health-related content, including HIV/AIDS information;
• A number of requests for information on South Africa and local geography;
• A few requests for help with school projects;
• Various hardware requests, including printing services, external USB port and a radio;
• Miscellaneous requests, e.g., volcanoes/dictionary/glue;
• System-related requests, e.g., logging in, or setting the internal clock.
Finally the following two requests illustrate the need for applications for older people, and
social services:
• ‘im enjoying using this digital doorway, but you must add things for old persons not for children only e.g games, internet etc’ – January, 2007;
• ‘another favour i wanna ask is that may you please find a conseller for us’ – June, 2007.
While the DD is unable to meet every request, or provide answers to every question, the online feedback mechanism is an important means of gauging users' perceptions, concerns, and desires. In addition, it contributes to the sourcing and developing of relevant content for future software releases.
This study has shown that qualitative data has a key role to play in building up a holistic picture of user activity at a DD site, and should be used during the implementation and evaluation of ICT projects of this nature.
174 Chapter 7 – Qualitative study – on-site interactions and analyses

7.7 Summary of chapter
This chapter detailed empirical data obtained from site visits to Gatang High School,
Soshanguve Fablab, Emjindini Library, and Msunduzi Customer Care Centre. Descriptions
were given of activities during the visits, and results presented from interviews, researcher-
assisted questionnaires, and naturalistic observation. Findings highlighted user interactions at
the sites, age profiles of users, opinions by participants on gender differences, favourite
applications and requested applications. The chapter presented comparison tables between
three of the sites, and discussion relating to software application usage and themes that
emerged from user feedback.
Chapter 7 – Qualitative study – on-site interactions and analyses 175

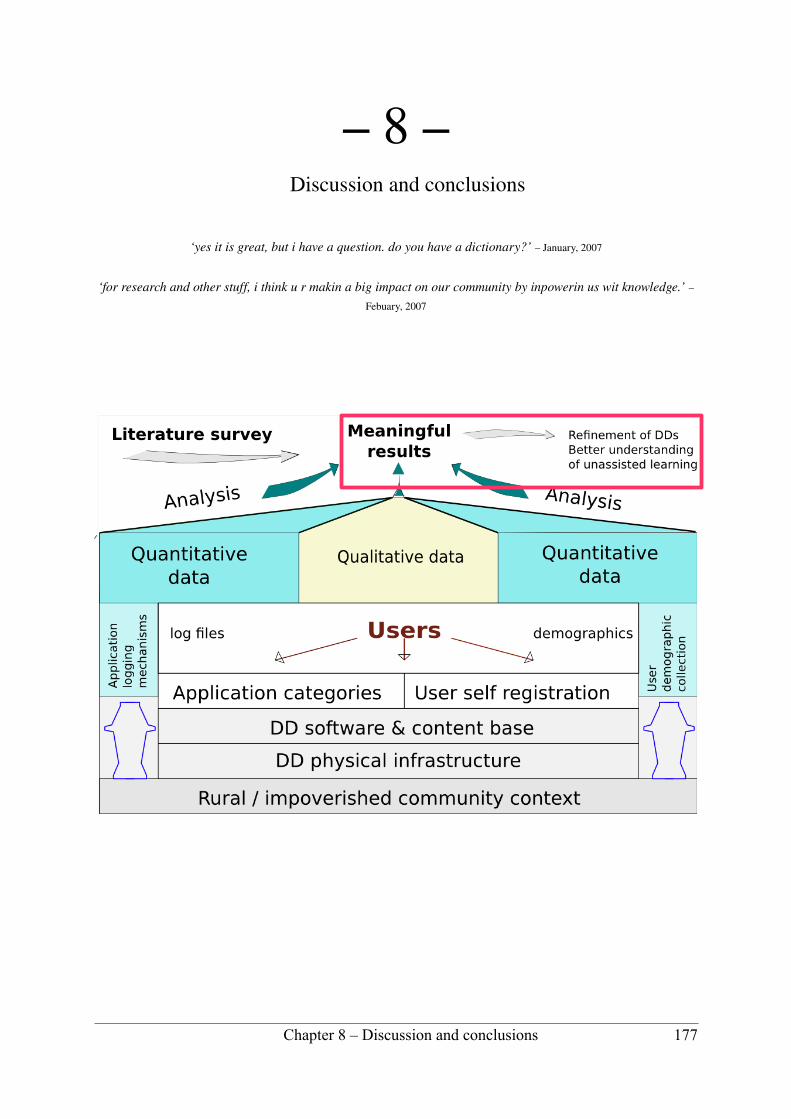
– 8 – Discussion and conclusions
‘yes it is great, but i have a question. do you have a dictionary?’ – January, 2007
‘for research and other stuff, i think u r makin a big impact on our community by inpowerin us wit knowledge.’ –
Febuary, 2007
Chapter 8 – Discussion and conclusions 177
8.1 Introduction
This chapter brings together and summarises findings from the previous chapters, before
presenting a selection of recommendations, ideas for future research, and some concluding
remarks. This study employed a mixed-methods approach to answering the four research
questions posed in Chapter 1, and revisited in Section 5.4 of the research design chapter.
Following a section of general discussion (Section 8.2), we return to the four research
questions, and answer them in Sections 8.3 to 8.6 respectively, by referring to the results and
findings in the quantitative study of Chapter 6, the qualitative study of Chapter 7, and the
literature studies. The recommendations in Section 8.8, address aspects of user registration
and logging in, DD awareness, basic training, and content choice.
8.2 General discussion on DD usage
In Chapter 2, we saw that, with any ICT intervention (such as the DD), the mere provision
and maintenance of technology is not sufficient to bring about change in a community. What
is needed is a holistic understanding of the community and its problems, as well as
behavioural and social aspects that determine use of the technology. This was the motivation
for the socio-technical nature of this study.
In light of the low penetration of computer centres in schools (Section 2.3), the DDs are a
viable alternative means for users to access computer infrastructure and develop basic
computer skills. The record of registered users (over two thousand) in Table 6.4 (Section
6.6.2), is in itself an indication that the DD is accomplishing its goal. The fact that these users
have picked up enough basic computer skills to create their own user name and log in, is an
indication of success. However, certain sites are more successful than others. The varying
numbers of application hit-counts and registrations, over different time periods (from 4
months to 28) is indicative of the degree to which each site is being used. It is apparent that a
number of sites are used much more frequently than others.
Mapping Harris's dimensions of the digital divide (see Section 2.4), to the DD project, reveals
the following:
• Services are being made available to the users through the DDs, and users have the opportunity to learn and acquire computer literacy skills.
• There is insufficient awareness of how the ICT intervention might be used for their benefit, particularly in the older age groups.
178 Chapter 8 – Discussion and conclusions
• As a freely accessible resource, the DD provides all community members with the opportunity to attain computer literacy.
• The basic functions are quickly mastered by users, however, it appears the full potential of the applications is not being exploited.
• Skills to use the DD are acquired and shared between peers.
• Local support of the DD infrastructure is vital, and assisting users, while not necessary for learning to take place, can be beneficial in providing direction, as seen in Emjindini library.
• Attitudes towards the device vary, but are mostly positive.
• The challenge of finding appropriate content is ongoing. The study has helped clarify what users engage with on the DD, and will inform ways of combining their preferences (e.g., for games and multimedia content) with the most appropriate content (e.g., health and education).
• Regarding cultural and linguistic aspects, there is an ongoing need for material in the user's own language. That being said, the majority of users indicated a preference to interact with the computer in English, despite their home language not being English. This needs to be addressed in light of the importance of preserving languages and promoting content that is culturally relevant.
• Regarding disability, while the physical DD does have an accessible version (See Figure 4.5), more could be done with regards to content to increase accessibility. This study did not address usage by disabled users.
• Much can be said with regards to gender issues at the DD. Some aspects of usage and behaviour have been highlighted, and these are revisited in Section 8.4 following.
• To a great extent, the DD empowers civilians to take control of their own learning with respect to ICT, making use of the opportunities afforded by the availability of infrastructure and resources. The inclusion of additional, locally relevant content, would further empower users, provided they were aware of, and used, that content.
Each of the above dimensions has bearing on application usage, and should inform the design
and implementation of content. The wealth of findings from this study highlights the value of
building in mechanisms to monitor and log usage in an ICT intervention. These logging and
monitoring mechanisms could be further enhanced and refined, to determine how successfully
various software interventions are, in influencing these and other dimensions of the digital
divide.
We now revisit each of the research questions and sub-questions in turn, presenting notable
findings from the study.
Chapter 8 – Discussion and conclusions 179
8.3 RQ1: What categories of applications are used by various age groups on Digital Doorways?
What are the general trends amongst all users regarding application usage?
Some of the general trends that are apparent across the selected sites are:
• The high use of games applications, especially by younger users;
• The popularity of audio and video content (including use of the built-in web-cam),
amongst most users;
• The extensive use of the file navigation application to explore the content;
• The popularity of locally relevant edutainment applications.
Sites with locally relevant and engaging edutainment material, displayed significantly higher
usage of applications in the edutainment category, than sites that did not (Table 6.25).
From the qualitative study, it was apparent that participants preferred to interact with a
computer in English, rather than their home language, despite the majority of participants
having a language other than English as their home language. Results from the log files in the
quantitative agreed with this finding.
While the quantitative study found that games, and video and audio content, were very
popular on the DD, the various encounters with users, teachers and librarians, during the site
visits, revealed an underlying need for access to life-skills resources, from information on
university degrees, finding a job, or starting a career; to medical advice, and pregnancy
information.
Are there notable relationships between the age of users and the categories of applications
accessed?
There is a statistically highly significant correlation between age and categories of
applications used (Section 6.7.6). This has implications for future DD content choice and
development, and suggests value in age-dependent presentation of information. The
comparison of registered users versus age group for individual sites (Section 6.7.3) indicated
that, with the exception of the Msunduzi customer care centre, most users were in the 10–13,
14–17 or 18–21 age groups. At Msunduzi, a high percentage of registered users were in the
22–25 and 26+ age group, reflective of older visitors to that DD site, which was located near a
post-office and various municipal offices.
180 Chapter 8 – Discussion and conclusions
With increasing age, we see a significant decrease in the use of games (Section 6.7.6), a fairly
steady use of video and audio applications, a general increase in the use of DDhomepage and
navigation applications, fairly constant but low use of education and edutainment
applications, as well as office applications, and a varying use of reference materials with high
use in the 14–17 and 26+ age groups. These two age groups also showed equivalent usage
levels when education and reference categories were combined (33.7% and 34.3%
respectively). Adults over 26, though few in number, were using it for knowledge-acquisition.
At libraries, usage of reference material was significantly high in the 14–17 age group.
Life-skills and health information showed notably higher usage in the 22–25 and 26+ age
groups, than in the younger age groups (see Table 6.11) The majority of the content in this
category was not in an engaging multimedia format, explaining the low usage figures overall.
8.4 RQ2: Does gender have an impact on extent of use and on application usage?
What are the general trends amongst males and females regarding application usage?
Colley and Comber (2003) report on discrepancies of computer use between girls and boys,
highlighting that boys use computers more than girls. While there is a general tendency for
more boys than girls to use computers in equal access environments, such as a computer lab,
the DD has the added issue of shared physical location to compound the issue, with girls
having to contend with boys for use of the system. The comments obtained by both males and
females on the issue of gender (see Table 7.1) provide further insight into the matter.
While earlier sites such as the Cwili installation displayed a high number of girls using the
system, confirmed by historical video footage from 2003, the data indicates that female users
are very much in the minority at the sites, despite all sites being accessible to users of both
genders, and schools and colleges being co-educational. More males than females are using
the DDs (approx. 3:1 ratio), and on average, each male is launching more applications (i.e.,
making greater use of the resources on the DD) than females (approx 7:5 ratio).
A comparison of Indian HITW sites and South African DD sites, yields some similarities.
Mitra reports that at some sites in India, the girls complained that the boys didn't let them use
the computer and thus were unable to complete their desired objectives (Mitra 2000). At
Kalkaji, children of both genders used the kiosk, but mostly boys aged 6-12. At Shivpuri: girls
did not use the kiosk. Regulars were male teenagers aged 13-19.
Chapter 8 – Discussion and conclusions 181
DDs are being underutilised by females both in terms of users registering their own user
accounts, and in terms of actual hit-counts (Section 6.8.2). Females that did register an
account, used their account less than males used theirs. That is, male respondents used
statistically significantly more applications than female respondents, per registered user.
The quantitative study indicated that more males than females were registering accounts and
accessing applications; correspondingly, the majority of participants in the qualitative study
agreed with this (see Table 7.1). Almost all males, and the majority of females indicated that
the DD was mostly used by males. Suggested reasons for this ranged from the opinion that
males prefer technology or games, to girls being shy, or not interested in technology. Some
users indicated that girls were prevented from using the DD by boys.
Within the games category, females were more likely to play card games, while males were
more likely to play action, maths or science games. The competitive nature of boys, especially
in light of the typically multi-user activity around the DD, was a determining factor in the
choice of games.
Is there a relationship between the gender of users and the categories of applications
accessed?
Colley found that, in terms of gender, the most significant differences between boys and girls
usage was in the categories of home use, music and games.
While the clustering of individual applications into general categories masks immediately
noticeable differences between male and female usage, statistical analysis of gender versus
usage revealed a statistically significant association between gender and application hit-count.
Notable results from analysis of individual cell-Chi-square values indicated proportional
differences between male and female hit-counts in the DDhomepage/navigation category
(males > females), the edutainment category (males > females) and, interestingly, in the
reference category (females > males). The higher percentage of males to females using the
edutainment category of applications, is predominantly due to the high popularity of the
TuxMaths application amongst boys where the competitive nature of boys is an incentive to
play the game often.
A more fine-grained analysis comparing individual application hits per gender, for a selected
applications, would enable more specific differences between the genders to become apparent.
182 Chapter 8 – Discussion and conclusions

8.5 RQ3: How does the physical situation of the computer kiosk affect the types of applications accessed?
Does the physical situation of the device (e.g., in a library, a school, a community centre,
etc.) affect the types of application that are accessed?
Noticeable differences in usage percentages between schools, FET colleges, libraries and
public locations (see Figures 6.40 and 6.41), enable us to conclude that the physical situation
of the device does indeed affect the types of applications that are accessed.
The high use of reference material at libraries (in particular Emjindini) was both a reflection
of the types of users visiting these DDs, as well as a reflection of the supporting infrastructure
(librarians who were willing and able to assist users).
As mentioned in Section 6.9, multimedia content (video and audio) was popular in public
locations such as community centres and informal markets. This could be exploited by
delivering content targeted at these locations, in this format, for instance the delivery of
information on a range of topics beneficial to the general public, for example, SARS income
tax info; health information such as HIV/AIDS information or sanitary information; domestic
safety issues; environmental concerns; and road safety.
The high use of games and low use of educational material at FET colleges was both a
reflection of users attitude towards the DD (a source of entertainment and diversion), as well
as an indication of content that was inadequate or lacking.
Which applications are underutilised by the intended target groups?
Much of the content on the DD is underutilised by the target groups, as evidenced in Sections 6.7.7 and 6.9.4 Reference materials for agriculture, books, science, etc. were little used, as were office suite applications and edutainment of all varieties, excluding local games. See Chapter 6, Section 6.9.5, for more details.
The sub-section content choice and presentation of Section 8.8 provides recommendations to address the underutilisation of certain applications.
Are there noticeable differences in behaviour around, and usage of, DDs at varying
localities?
Some of the findings of Chapters 6 and 7 are addressed below.
Chapter 8 – Discussion and conclusions 183

Varying localities displayed noticeable differences in user demographics, behaviour and usage
at the DD terminals. Table 6.4 highlighted differences in overall usage and account
registrations, for the ten sites in the quantitative study.
The qualitative study showed that social interactions between users varied from one location
to the next, both as a result of different groups of individuals displaying different interactions
with each other, and as a result of the location itself. For instance, school pupils compete for
usage of the DD during break times, or before or after school, and public location users come
to the site for other tasks, and encounter the DD unexpectedly.
Emjindini library stood out with regard to assistance of users by the resident librarians. The
high use of reference applications evident in the quantitative analysis (Section 6.7.7) was
confirmed during the subsequent qualitative study to be as a result of these supportive
interventions (Section 7.5.3).
What is the impact of the site environment on the physical usage?
As in the Indian HITW findings, the caretakers/administrators played different roles,
depending on the site. Facilitation ranged from active participation, encouraging and directing
the use of resources (Emjindini), or enthusiastic but less-involved authority (Gatang), to
uninvolved, or little involved observation (Soshanguve, Msunduzi).
Given the environmental conditions of a typical DD (Section 4.11), aspects to consider in
application choice, include:
• Time taken to learn the application;
• The degree to which the application will be suitable for a crowd of users;
• The applicability of the application in high noise-level settings;
• The applicability of the application in sub-optimal visual settings;
• The appeal of the application to casual passers-by and ability to engage these user in a
more permanent way;
• The amount of noise the application creates;
• The suitability of the application to users of different ages;
• The ability of the application to engage and be meaningful to novice users, and lead
them through to more advanced levels of interaction.
184 Chapter 8 – Discussion and conclusions
With regard to Section 4.12 (effective and ineffective installations), the important aspect is
that content is continually improved, and new and appropriate content added. Online feedback
mechanisms should include more content-specific questions, allowing users an easy way to
provide information to developers on what content is being used, and what users require. This
would require a mechanism to process and follow up on requests where possible. Feedback is
also a good way of ensuring that the community remains an integral part of the project.
Obviously the physical state of the DD has an enormous effect on usage. This includes
whether the DD is switched on every day (preferably remaining on permanently); whether
there is a stable power supply to the DD – constant power outages affect usage, and reliability
of the equipment; whether there is damage to one or more of the terminals – potentially
affecting both usage levels and user confidence in the solution as a whole; and whether the
environment in general is conducive to prolonged use of the device.
8.6 RQ4: What is the relevance and applicability of these results to future unassisted learning terminals?
Do the results of RQ1, RQ2 and RQ3 help in better understanding the desires and needs of
target users?
This sub-question was comprehensively covered in Section 6.10.1. The results of Research
Questions 1, 2 and 3 assisted in understanding the desires and needs of target users, and
clarified issues of:
• User registration;
• The need for greater on-screen guidance;
• Popularity of certain applications such as games and video;
• Gender imbalance and usage differences; and
• The effect that location has on usage.
What lessons are learned for future development, selection and presentation of
applications?
Section 6.10.2 of the quantitative study addressed this sub-question in some detail. The
recommendations to follow (Section 8.8), in particular the ‘content choice and presentation’
section, highlight key areas that should be addressed in the development, selection and
presentation of content.
Chapter 8 – Discussion and conclusions 185
8.7 Effectiveness of a mixed-methods approach
As discussed in Section 5.3, this study employed a mixed-methods research methodology,
involving both quantitative and qualitative methods. This proved to be effective.
The quantitative approach was beneficial in examining the many complex relationships
between the variables in the study (age, gender, application category, location grouping).
Visualisations and statistical procedures enabled trends, patterns and pertinent findings to
emerge from the data. In addition, the objective nature of the log-files provided a view of
what had actually transpired in terms of application usage.
The qualitative approach was beneficial in understanding the various complex social and
environmental aspects affecting usage at a site. The interviews, questionnaires and
observations contributed to the establishment of a far richer picture of site activity, than could
have been achieved through quantitative analysis alone.
The quantitative analysis constituted proportionally more to the overall study than the
qualitative (approximately 70:30). The quantitative study also preceded the qualitative study.
By employing a sequential ‘QUANT → qual’ approach (Creswell, 2009), a number of issues
raised in the quantitative analysis, were explained in the qualitative study, for example, the
high use of the open encyclopaedia at Emjindini library. In addition, difficulties not
observable in the raw data analysis (such as users battling to register an account) could be
discovered during the site visits. The quantitative and qualitative studies thus played both
confirming and complementary roles. They served a confirmatory role when similar findings
emerged, and a complementary role when the particular features of the method elicited data
not possible with the other method.
8.8 Recommendations
As a direct result of the research in this study, a number of recommendations for future DD
installations emerge. They concern aspects of user registration and logging in, DD awareness,
gender issues, basic training, and content choice.
User registration process, and logging in
Suggestions to improve user-registration and facilitate the login process:
• Provide an audio interface with voice-guided instructions;
• Provide multilingual instruction boxes;
186 Chapter 8 – Discussion and conclusions

• Provide pictorial representations for non-literate speakers;
• Simplify the user self-registration process through the use of guides and pictures;
• Provide an option for groups of users to sign in;
• After login, customise the user desktop, based on age, gender, language, location, disability of the user;
• After login, prompt new users with audio instructions and guides, if requested;
• Limit input to predefined formats (e.g., 2-digit numerical format for age);
• Restrict user age input to a predefined format and age range;
• Make it mandatory for users to specify either male or female, in the gender option;
• Clearly distinguish between user name creation, guest login, and user login options;
• Check for duplicate user name creation and inform the user accordingly.
From Table 6.4 we saw that users' use of registered user accounts was approximately a third
of that of guest accounts. This indicates that more should be done in encouraging users to
create and use their own accounts, personalised to their own particular needs, and retaining
the information they save. This could be encouraged through greater desktop customisation,
personalised greeting of the user on login (through the use of a speech synthesiser) and
customised menus and applications suited to the user's age, gender and computing ability. The
option to save documents to their personal accounts, should be stressed.
Regarding large numbers of users registering user accounts but not making use of them
(Section 6.6.3 and 6.6.4), some suggestions to solve this are:
• Not allowing duplicate registrations;
• Explaining the benefits of user name registration at the login screen;
• Allowing users to recover passwords though a mechanism such as a secret question.
Further suggestions:
• In the user registration screen, an option could be for users to specify visual or hearing impairments, and the user desktop customised accordingly.
• On user login, present users with a choice of desktop interfaces, based on their specified current preference for the DD (e.g., reference machine, games machine, learning station).
Chapter 8 – Discussion and conclusions 187
DD awareness
Potential users in a community need to be made aware of the existence of the DD, the
valuable resources it contains, and how they, personally, could use it.
Efforts could be made to explicitly encourage use of the direct educational material. Without
changing the ethos of unassisted non-invasive learning, supportive supplementary signposting
measures could be sought. Users might benefit from clear visual guides explaining the various
types of content available, either in the form of an online document (immediately accessible
on logging in) and/or eye-catching laminated posters attached to the unit itself, recommending
use of particular applications and customised to the type of site.
The study has touched on aspects of menu layout that could affect user awareness of an
application, and usage thereof. Links to content relevant to a certain location or relevant to a
particular user, should be placed in prominent positions in the menu.
How can usage of the DD be maximised with regards to time of day? Adults may be at work
while children are at school. Unemployed or retired adults could use the DD in the mornings,
however, the technology alone is unlikely to draw them (as it does with children), since
observations have shown that adults are more cautious and reserved, and less curious than
children. What can be done to encourage more adults to register accounts and use the DD? A
community-driven DD awareness campaign, supplemented with some basic training, may be
one solution. Greater interaction by the older generation (ages 26+) should be encouraged
through awareness campaigns and more content targeted at them.
Gender issues
The following recommendations concern aspects of gender:
• Initiate a (funded) campaign to stimulate interaction by females: This would be in line with the SA government’s efforts to promote scientific and mathematical expertise, as well as use of technology among girls and women.
• In controlled environments such as libraries and schools, encourage site administrators to provide help and support to girls, and allow users of both genders equal opportunities to use the DD.
• Encourage the development of a DD Code of Conduct by a representative group of stakeholders from the community, including administrators and users.
• Customise user desktop features and the presentation of content, based on the gender of the user.
188 Chapter 8 – Discussion and conclusions

• Combine educational and game-related content, taking cognisance of both male and female preference for both of these elements.
• Conduct further qualitative studies, specifically targeted at gender and usage.
Basic training
As Table 6.5 confirmed, most user registrations are being made by primary and secondary
school learners. High numbers of registrations also appear in the 18-21 age group. The usage
by mostly young people at public locations such as libraries is encouraging, however, the low
usage by adults is discouraging, and raises the concern that adults are not embracing new
technology or making use of resources that could benefit them. Suggestions for addressing
these concerns include making content that targets older users, prominent on login, thus
creating more awareness of the benefits of the DDs amongst that target group. Programmes
could be instigated at certain sites to introduce the DDs to older users and take them through
some of its basic operations. The site visits highlighted that school-going users attend in the
afternoon. Unemployed and retired adults could be encouraged to visit the sites in the
morning, while sessions could be arranged in the evening for employed adults to use the DDs.
A well-utilised DD site might structure usage according to a timetable, such as the following:
• AM, weekdays: Unemployed and retired adult users, some training provided.
• PM, weekdays. School-going learners. Predominantly unassisted learning.
• Evening, weekdays: Employed adult learners: Evening classes with training provided.
• AM, Saturdays: Lessons on computer basics and searching for information. All ages.
• Rest of weekend: Any age group. Unassisted and peer-assisted learning.
The above would depend on funding and resources available to provide the training, and
proper management of the site to allow access after hours (in the case of sites that are locked,
e.g., libraries).
Facilitators should be trained in practical ways of enhancing utilisation of this valuable
resource in their environments. Such training should emphasise the worth of educational
resources and interaction by females. Moreover, educators and trainers should advise learners
to access DDs in projects and in preparing deliverables.
School teachers should be supported and encouraged to become personally proficient in using
the DD, to enable them to provide assistance to pupils who request it, and who are not
comfortable with the unassisted learning environment. In addition, this will enable teachers to
directly refer learners to relevant subject-related material on the DD.
Chapter 8 – Discussion and conclusions 189
Further technology
The qualitative study revealed the need for a number of technologies supplementary to the
basic functions of the DD. These are: an external USB port, printing facilities, and Internet
connectivity, The quantitative study revealed low use of office applications such as the word
processor, attributable to the inability to print the documents. In addition, users expressed a
desire to print out reference information, and save files to their own devices.
The provision of each of these technologies remains a challenge for DD developers. Damage
and vandalism to ports and slots on the DD necessitates expensive maintenance. Printing
facilities require dedicated human resources and funds to manage the consumables of paper
and ink. Monthly Internet costs are expensive.
While the primary goal of the DD remains a basic computer literacy tool, employing
unassisted and peer-assisted learning methods, the value of such supplementary functions
should not be ignored. There is scope for developmental projects that tackle the above
challenges, and enable realistic, manageable and sustainable solutions.
Content choice and presentation
It has been highlighted that much of the software on the DD is underutilised. Modifications
could be made to existing software, and new applications could be incorporated or developed,
with a view to integrating educational aspects into game or audio/video presentation formats,
which are the most popular. Reference material could be made prominent in the user interface,
to stimulate greater usage. Content choice and design has a significant effect on usage, and
users would benefit from efforts to merge educational content into readily accessible formats.
In such processes, the findings of the Meraka group investigating DD usability, should be
noted and applied. As mentioned earlier, the position of items within the menu system
influences the number of launches, therefore sequencing should be carefully designed to cater
for novice users.
Following on the success and popularity of games contextualised to the South African
situation, more local-content software applications should be developed.
Other recommendations are to:
• Encourage the use of more educational games;
• Reduce the amount of pure entertainment games and add more educational games;
• Increase the quantity and accessibility of reference material;
190 Chapter 8 – Discussion and conclusions
• Modify the content and develop new applications to stimulate user-interaction with
educational resources;
• Identify the most popular games and allow the launching of these games as a reward
for completing a learning task;
• Customise the presentation of content for greatest applicability to location and age group; e.g., making links to reference and literature material prominent in libraries; making curriculum-based support material prominent in schools; and health-related applications prominent in community centres and clinics.
8.9 Future research
Following on the findings of the present study, possible future research directions are :
• Studies to determine whether level of usage is translated into academic performance
and workplace skills (Gush and de Villiers, 2010).
• Research targeted at college students and older adults, to determine how DDs could
best help them acquire ICT skills, and provide meaningful content.
• Studies to determine the extent to which on-screen guidance affects user registration
and application usage.
• Comparison of data from a variety of user interface choices, to ascertain to what extent
usage behaviour is influenced by menu layout and user-specific prioritising of
applications.
• A study investigating the impact that printing facilities have, on usage behaviour.
• Differentiation studies on how purely unassisted learning sites differ from those where
supervision or facilitation may influence behaviour (Gush and de Villiers, 2010).
8.10 Conclusion
This study explained the concept of the South African Digital Doorway, and discussed usage
of its embedded software applications with relation to aspects of user demographics and type
of location.
Both user demographics and environmental aspects have an impact on software application
usage on the DD. Each site is a complex social and technical mix. Practitioners need to take a
holistic approach in approaching the challenge of providing ICT training, and address both the
Chapter 8 – Discussion and conclusions 191
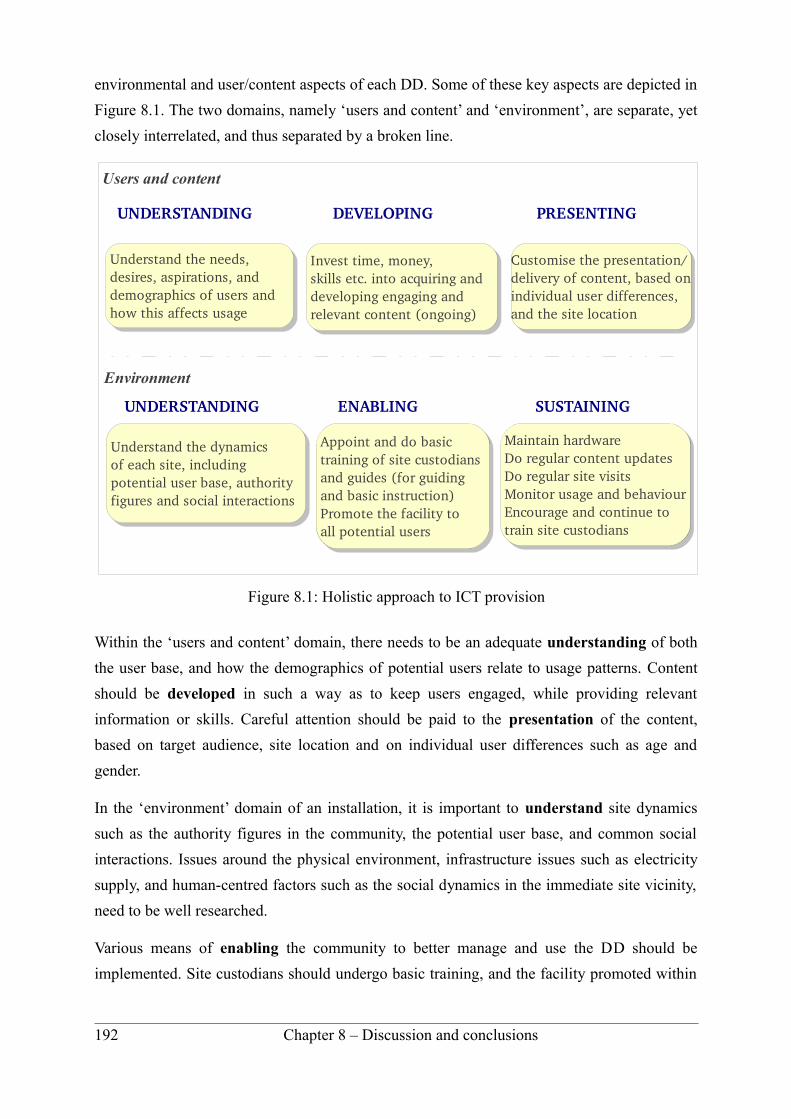
environmental and user/content aspects of each DD. Some of these key aspects are depicted in
Figure 8.1. The two domains, namely ‘users and content’ and ‘environment’, are separate, yet
closely interrelated, and thus separated by a broken line.
Within the ‘users and content’ domain, there needs to be an adequate understanding of both
the user base, and how the demographics of potential users relate to usage patterns. Content
should be developed in such a way as to keep users engaged, while providing relevant
information or skills. Careful attention should be paid to the presentation of the content,
based on target audience, site location and on individual user differences such as age and
gender.
In the ‘environment’ domain of an installation, it is important to understand site dynamics
such as the authority figures in the community, the potential user base, and common social
interactions. Issues around the physical environment, infrastructure issues such as electricity
supply, and human-centred factors such as the social dynamics in the immediate site vicinity,
need to be well researched.
Various means of enabling the community to better manage and use the DD should be
implemented. Site custodians should undergo basic training, and the facility promoted within
192 Chapter 8 – Discussion and conclusions
Figure 8.1: Holistic approach to ICT provision
UNDERSTANDING DEVELOPING PRESENTING
Understand the needs, desires, aspirations, and demographics of users and how this affects usage
Understand the needs, desires, aspirations, and demographics of users and how this affects usage
Invest time, money, skills etc. into acquiring anddeveloping engaging and relevant content (ongoing)
Invest time, money, skills etc. into acquiring anddeveloping engaging and relevant content (ongoing)
Customise the presentation/delivery of content, based onindividual user differences,and the site location
Customise the presentation/delivery of content, based onindividual user differences,and the site location
UNDERSTANDING ENABLING SUSTAINING
Understand the dynamicsof each site, includingpotential user base, authorityfigures and social interactions
Understand the dynamicsof each site, includingpotential user base, authorityfigures and social interactions
Appoint and do basictraining of site custodians and guides (for guiding and basic instruction)Promote the facility to all potential users
Appoint and do basictraining of site custodians and guides (for guiding and basic instruction)Promote the facility to all potential users
Maintain hardwareDo regular content updatesDo regular site visitsMonitor usage and behaviourEncourage and continue totrain site custodians
Maintain hardwareDo regular content updatesDo regular site visitsMonitor usage and behaviourEncourage and continue totrain site custodians
Users and content
Environment
the community, through diverse means, such as posters and school visits. Facilitators such as
librarians and teachers should be made aware of new content releases and software updates,
and encouraged to pass on this information to users.
Finally, emphasis should be placed on sustainability, through regular hardware maintenance,
software and content updates, ongoing training of site custodians, and continuous monitoring
and evaluation of each site.
The Digital Doorway is a collaborative effort between researchers, developers, and
community stakeholders. It is hoped that the understanding gained from the many facets of
this study will be integrated into subsequent DD developments, and in so doing, will
strengthen an already effective ICT intervention. And that, further, the lessons learned from
existing DD installations, will contribute to the successful establishment of similar ICT
initiatives in the future.
Ultimately, whether through analysis or installation, our goal should be to make a measurable
and favourable difference to the lives of impoverished and technologically disadvantaged
members of society.
- - - - - - - - - - -
‘it is my pleasure to write you the report that our community is happy about the digital doorway because it is
helpful for them and their children. Hopeful we can receive a lot more of information from you in the near future.
Thank you for exposing our community to such a great empowerment. May God enrich you to do more than what
you are doing.’ – Digital Doorway user, March 2007
Chapter 8 – Discussion and conclusions 193

References
Adebesin, F., Kotzé, P. & Gelderblom, H. 2010. ‘Impact of Usability on Efforts to Bridge the Digital Divide’. Proceedings of the 4th International Development Informatics Association Conference, Cape Town, South Africa.
Alessi, S. & Trollip, S. 2001. ‘Multimedia for Learning’. 3rd ed. Massachusetts: Allyn & Bacon.
Amiel, T. & Reeves, T.C. 2008. ‘Design-Based Research and Educational Technology: Rethinking Technology and the Research Agenda’. Educational Technology and Society, 11(4), pp. 29-40.
Andrew, T.N. & Petkov, D. 2003. ‘The Need for a Systems Thinking Approach to the Planning of Rural Telecommunications Infrastructure’. Telecommunications Policy, 27(1-2), pp. 75-93.
Arora, P. 2010. ‘Hope in the Wall? A Digital Promise for Free Learning’. ‐ ‐ ‐ British Journal of Educational Technology, 41(5), pp. 689-702.
Ballantyne, P R. Labelle & S. Rudgard. 2000. ‘Information and Knowledge Management: Challenges for Capacity Builders’. Policy Management Brief No. 11. Maastricht: ECDPM. [Online]. Available at: http://www.chs.ubc.ca/lprv/PDF/lprv0075.pdf [Accessed December 2010].
Barab, S. A., & Squire, K. 2004. ‘Design-Based Research: Putting a Stake in the Ground’. The Journal of the Learning Sciences,13(1) pp. 1-14.
Barton, C.E., Amory-Mazaudier, C., Barry, B., Chukwuma, V., Cottrell, R.L., Kalim, U., Mebrahtu, A., Petitdidier, M., Rabiu, B. & Reeves, C. 2009. ‘eGY-Africa: Addressing the Digital Divide for Science in Africa’. Russian Journal of Earth Sciences, 11, ES1003, doi:10.2205/ 2009ES000377
Boud, D., Cohen, R. and Sampson, J. 1999. ‘Peer Learning and Assessment’. Assessment & Evaluation in Higher Education, 24(4), pp. 413-426.
Buchele, S.F. & Owusu-Aning, R. 2007. ‘The One Laptop Per Child (OLPC) Project and Its Applicability to Ghana’. Proceedings of the 2007 International Conference on Adaptive Science and Technology, pp. 113.
Cobb, P., Confrey, J., Disessa, A., Lehrer, R., & Schauble, L. 2003. ‘Design Experiments in Educational Research’. Educational Researcher, 32(1), pp. 9-13.
Colley, A. 2003. ‘Gender Differences In Adolescents' Perceptions of the Best and Worst Aspects of Computing at School’. Computers in Human Behavior, 19(6), pp. 673-682.
Colley, A. & Comber, C. 2003. ‘Age and Gender Differences in Computer Use and Attitudes Among Secondary School Students: What Has Changed?’. Educational Research, 45(2), pp. 155-165.
195

Costanzo, P. R. & Shaw, M. E. 1966. ‘Conformity as a Function of Age Level’. Child Development, 37(4), pp. 967-975.
Creswell, J.W. 2009. ‘Research Design: Qualitative, Quantitative, and Mixed Methods Approaches’. Thousand Oaks, CA: Sage Publications, Inc.
Dangwal, R. 2005. ‘Public Computing, Computer Literacy and Educational Outcome: Children and Computers in Rural India’. International Conference on Computers in Education.
Dangwal, R., Jha, S. & Kapur, P. 2006. ‘Impact of Minimally Invasive Education on Children: An Indian Perspective’, British Journal of Educational Technology, 37(2), pp. 295-298.
de Boer, J. 2009. ‘The Relationship Between Environmental Factors and Usage Behaviors at ‘Hole-in-the-wall’ Computers’. International Journal of Educational Development, 29(1), pp. 91-98.
de Villiers, M.R. 2005. ‘e-Learning Artefacts: Are They Based on Learning Theory?’, Alternation, 12.1b(2005), pp. 345-371.
de Villiers, M.R. 2006. ‘A Learning Theory Approach in Support of Outcomes-Based E-learning’, Proceedings of the Conference on Information Technology in Tertiary Education, Pretoria, South Africa, 18 – 20 September 2006.
de Villiers, M.R. 2007. ‘Interpretive Research Models for Informatics: Action Research, Grounded Theory, and the Family of Design- and Development Research’. Alternation, 12(2), pp. 10-52. (Dated 2005, appeared 2007).
Department of Education. 2009. ‘Computer Centres Summary Grid for Ordinary Schools’, [Online]. Available at: http://www.education.gov.za/emis/emisweb/statistics.htm, [Accessed July 2010]
Design-Based Research Collective. 2003. ‘Design-based Research: An Emerging Paradigm for Educational Inquiry’. Educational Researcher, 32(1), pp. 5 -8.
Digital Doorway Website, 2010. ‘The Digital Doorway’, [Online]. Available at: http://www.digitaldoorway.org.za, [Accessed July 2010]
Downes, T. 2002. ‘Children's and Families' Use of Computers in Australian Homes’. Contemporary Issues in Early Childhood, 3(2), pp. 182-196.
Eisenberg, M., Lowe, C. & Spitzer, K. 2008. ‘Information Literacy: Essential Skills for the Information Age’. DESIDOC Journal of Library and Information Technology, 28(2).
Eisenhardt, K.M. & Graebner, M.E. 2007. ‘Theory building from cases: Opportunities and challenges’. Academy of management journal, 50(1), p. 25.
Fernandes, C., Jagdale, V. & Fernandes, J. 2007. ‘Young People and the Digital Divide.’.Commonwealth Youth and Development, 5(1), p. 69.
Gurstein, M. 2000. ‘Community Informatics: Enabling Communities with Information and Communications Technologies’. Hershey PA, USA: IGI Global..
196
Gurstein, M. 2010. ‘Let's Talk About a Digital Transition’. [Online]. Available at: http://gurstein.wordpress.com/2010/04/02/let’s-talk-about-a-digital-transition-rather-than-a-digital-divide [Accessed May 2010]
Gush, K. 2008. ‘Towards a More Personalised User Experience and Better Demographic Data on the Digital Doorway Public Computer Terminals’. 5th Prato Community Informatics & Development Informatics Conference 2008: ICTs for Social Inclusion: What is the Reality? Conference CD. 27 October – 30 October, Monash Centre, Prato Italy. December 2008. Editors: Larry Stillman, Graeme Johanson.
Gush, K. 2004. ‘Open Source and the Digital Doorway’. Paper presented at the Idlelo Conference, Cape Town, January 2004.
Gush, K., Smith, R., & Cambridge, G. 2004. ‘The Digital Doorway, Minimally Invasive Education in Africa’. Paper presented at the ICT In Education Conference, Cape Town, March 2004.
Gush, K. & de Villiers, R. 2010. ‘Application Usage of Unsupervised Digital Doorway Computer Kiosks in Remote Locations in South Africa’, In: Kotze, P., Gerber, A., van der Merwe, A. & Bidwell, N.(eds). Fountains of Computing Research, Proceedings of SAICSIT 2010 Annual Research Conference of the South African Institute of Computer Scientists and Information Technologists. ACM International Conference Proceedings Series. Bela Bela, October 2010.
Gush, K., de Villiers, R., Smith, R. & Cambridge, G. 2011. ‘Digital Doorways’, In: Steyn, J., van Belle, J. & Mansilla, E.V. (eds). ICTs for Global Development and Sustainability: Practice and Applications: Chapter 5. Hershey, PA: IGI Global, pp. 96-126.
Harris, R. 2002. ‘ICT for Poverty Alleviation Framework’, Prepared for the Workshop for UNDP Country Office ICT Programme Officers. Hong Kong, 2002.
Herselman, M. & Britton, K. 2002. ‘Analysing the Role of ICT in Bridging the Digital Divide Amongst Learners’. South African Journal of Education, 22(4), p. 270.
Hilbert, D.M. & Redmiles, D.F. 2001. ‘Large-scale Collection of Usage Data to Inform Design’, Proceedings of the Human-Computer Interaction conference – INTERACT, pp. 569-576.
Inamdar, P. & Kulkarni, A. 2007. ‘Hole-In-The-Wall Computer Kiosks Foster Mathematics Achievement-A Comparative Study’. Journal of Education, Technology and Society, 10(2), p. 170.
Ito, M. 2006. ‘Interaction, Collusion, and the Human–Machine Interface’. In: Weiss, J., Nolan, J., Hunsinger, J. & Trifonas, P. (eds). (2006) The International Handbook of Virtual Learning Environments, vol. 1. Netherlands: Springer. pp. 221-240.
Jacobs, S. & Herselman, M. 2005. ‘An ICT-Hub Model for Rural Communities’. International Journal of Education and Development using ICT, 1(3). pp. 57-93.
Kelly, A. E. 2003. ‘Research as Design’. Educational Researcher, 32(1). pp. 3-5, 35-37.
197
Kirkpatrick, D.L. 1998. ‘Evaluating Training Programs: The Four Levels’. 2nd ed. San Fransisco, CA: Berrett-Koehler Publishers, Inc.
Kwake, A., Ocholla, D.N. & Adigun, M. 2006. ‘The Feasibility of ICT Diffusion and Use Amongst Rural Women in South Africa ’. South African Journal of Libraries & Information Science, 2006, 72(2)
Miles, M.B. & Huberman, A.M. 1994. ‘Qualitative Data Analysis: An Expanded Sourcebook’ . Thousand Oaks, CA: SAGE publications, Inc.
Mitra, A., Lenzmeier, S., Steffensmeier, T., Avon, R., Qu, N. & Hazen, M. 2000.‘Gender and Computer Use in an Academic Institution: Report from a Longitudinal Study’, Journal of Educational Computing Research, 23. pp. 67–84.
Mitra, S. 2000. ‘Minimally Invasive Education for Mass Computer Literacy’, [Online]. Available at: http://www.hole-in-the-wall.com/docs/Paper01.pdf, [Accessed May 2010].
Mitra, S., Dangwal, R., Chatterjee, S., Jha, S., Bisht, R.S., Kapur, P., Limited, N., Campus, I. & Khas, H. 2005. ‘Acquisition of Computing Literacy on Shared Public Computers: Children and the ‘Hole in the Wall’’. Australasian Journal of Educational Technology, 21(3), p. 407.
Mitra, S. & Rana, V. 2001. ‘Children and the Internet: Experiments with Minimally Invasive Education in India’. British Journal of Educational Technology, 32(2), pp. 221-232.
Mitra, S. 2003. ‘Minimally Invasive Education: A Progress Report on the “Hole-in-the-Wall” Experiments’. British Journal of Educational Technology, 34(3), pp. 367-371.
Mitra, S. 2005. ‘Self organising systems for mass computer literacy: Findings from the “Hole-in-the-Wall” experiments’. International Journal of Development Issues, 4(1), pp. 71–81.
Norris, P. 2001. ‘Digital Divide: Civic Engagement, Information Poverty and the Internet Worldwide’. Cambridge, UK: Cambridge University Press.
Ngcobo, P. & Herselman, M. 2007. ‘Evaluating ICT Provision in Selected Communities in South Africa’. Issues in Informing Science and Information Technology, 4(2007), p. 22.
Oates, B.J. 2006. ‘Researching Information Systems and Computing’. London: Sage Publications Ltd.
Olivier, M.S. 2004. ‘Information Technology Research: A Practical Guide for Computer Science and Informatics’. 2nd ed. Pretoria: Van Schaik.
Prensky, M. 2001 ‘Digital Natives, Digital Immigrants’. On the Horizon, 9(5), pp. 1-6.
Raju, K.A. 2004. ‘A Case for Harnessing Information Technology for Rural Development’. The International Information & Library Review, 36(3), pp. 233-240.
Reason, P. & Bradbury, H. 2008. ‘The SAGE Handbook of Action Research: Participative Inquiry and Practice’. London: Sage Publications Ltd.
198
RWJF, 2008, ‘Qualitative Research Guidelines Project - The Interpretivist Paradigm’, [Online]. Available at: http://www.qualres.org/HomeInte-3516.html [Accessed November 2010].
Roman, R. & Colle, R. D. 2003. ‘Content Creation for ICT Development Projects: Integrating Normative Approaches and Community Demand’. Information Technology for Development, 10(2), pp. 85-94.
Salomon, G. & Almog, T. 1998. ‘Educational Psychology and Technology: A Matter of Reciprocal Relations’. The Teachers College Record, 100(2), pp. 222-241.
Sharp, H., Preece, J. & Rogers, Y. 2007. ‘Interaction Design: Beyond Human-Computer Interaction’. 2nd ed. NJ, USA; John Wiley & Sons.
Slay, H., Wentworth, P. & Locke, J. 2006. ‘BingBee, an Information Kiosk for Social Enablement in Marginalized Communities’. Proceedings of the 2006 Annual Research Conference of the South African Institute of Computer Scientists and Information Technologists (SAICSIT 2006). South African Institute for Computer Scientists and Information Technologists, pp. 107.
Smith, R., Cambridge, G. & Gush, K. 2005. ‘Unassisted Learning – Promoting Computer Literacy in Previously Disadvantaged Areas of South Africa’. Paper Presented at the WSIS Conference, 2005.
Snyman, M. & Snyman, M.M. 2003. ‘Getting Information to Disadvantaged Rural Communities: the Centre Approach’. South African Journal of Library and Information Science, 69(2), pp. 95-107.
Statistics South Africa, 2010. ‘Census at School Results, 2009’, [Online]. Available at: http://www.statssa.gov.za/censusatschool/docs/Census_At_School_2009_Report.pdf [Accessed November 2010].
Stillman, L. & Linger, H. 2009. ‘Community Informatics and Information Systems: Can They Be Better Connected?’. The Information Society: An International Journal, 25(4), pp. 255-264.
Stillman, L. 2009. ‘The Digital Doorways Project (DRAFT, July 2009)’, [Online]. Available at: http://webstylus.net/files/ddsocialtechnicaljuly2009.pdf [Accessed December 2010].
Tellis, W. 1997. ‘Introduction to Case Study’. The Qualitative Report, 3(2), pp. 1-11.
The Design-Based Research Collective. 2003. ‘Design-Based Research: An Emerging Paradigm for Educational Inquiry’. Educational Researcher, 32(1), pp. 5–8.
Thinyane, M., Slay, H., Terzoli, A. & Clayton, P. 2006. ‘A Preliminary Investigation into the Implementation of ICTs in Marginalized Communities’. South African Telecommunications Network Applications Conference (SATNAC 2006), Western Cape, South Africa.
Trucano, M. 2010. ‘Searching for India's Hole in the Wall’. Edutech Blog, [Online]. Insert blog posting date. Available at: http://blogs.worldbank.org/edutech/searching-for-indias-hole-in-the-wall [Accessed December 2010].
199
van Cappelle, F., Evers, V. & Mitra, S. 2004. ‘Investigating the effects of unsupervised computer use on educationally disadvantaged children's knowledge and understanding of computers’. Proceedings of CATaC 2004. Karlstad, Sweden.
Walsham, G. 1995. ‘The Emergence of Interpretivism in IS Research. Information Systems Research, 6(4), pp. 376–394.
Wang, F., & Hannafin, M. J. 2005. ‘Design-Based Research and Technology-Enhanced Learning Environments’. Educational Technology Research and Development, 53(4), pp. 5–23.
Wentworth, P. 2010. ‘BingBee@ RaglanRoad–a Field Trial with Unattended Educational Kiosks’. IST-Africa 2010 Conference Proceedings. Available at: http://www.bingbee.com/sites/ www.bingbee.com/files/Wentworth_ISTAfrica2010.pdf [Accessed April 2010].
Wertlen, R.R. 2007. ‘An Overview of ICT Innovation for Developmental Projects in Marginalised Rural Areas’. 5th Prato Community Informatics & Development Informatics Conference 2008: ICTs for Social Inclusion: What is the Reality? Conference CD. 27 October – 30 October, Monash Centre, Prato Italy. December 2008. Editors: Larry Stillman, Graeme Johanson.
Wilson, B.G. 2004. ‘Designing E-learning Environments for Flexible Activity and Instruction’. Educational Technology Research and Development, 52(4), pp. 77-84.
Yelland, N. & Lloyd, M. 2001. ‘Virtual Kids of the 21st Century: Understanding the Children in Schools Today’. Information Technology in Childhood Education Annual, 2001(1), pp. 175-192.
200

Appendices
Appendix A: Log file extracts ................................................................................................203
Appendix B: Code listings .....................................................................................................204
Appendix C: Data cleaning as applied to original site list ....................................................214
Appendix D: Assignment of applications to general categories ...........................................218
Appendix E: Quantitative data tables ....................................................................................221
Appendix F: Consent forms and ethical clearance ................................................................228
Appendix G: Interview/questionnaire template ...................................................................231
Appendix H: Qualitative study data selection .......................................................................233
Appendix I: Glossary and acronyms ....................................................................................234
Appendix J: Attached CD contents ......................................................................................235
201


Appendix A – Log file extracts
Extract from compressed log file tarball:
Extract from user log file dd2.log:
Example of log file with sitename and username concatenation:
Arranging user details into comma-separated file
Chapter 8 – Discussion and conclusions 203
Text A2: Example contents of .log file
dd2.log:
dd2,/usr/bin/gmplayer,file:///opt/digidoor/DDCONTENT/BOOKS/Fun/Movies/Turing_Test.mpeg,Tue Apr 17 11:55:59 SAST 2007 dd2,/usr/games/ksmiletris,,Tue Apr 17 11:57:59 SAST 2007 dd2,/usr/bin/xfrun4,,Tue Apr 17 12:09:58 SAST 2007 dd2,/usr/bin/firefox,file:///opt/digidoor/DDCONTENT/BOOKS/Fun/Bird_Alphabet/Bird_Alphabet.html,Tue Apr 17 12:16:44 SAST 2007 dd2,/usr/games/gnibbles,,Tue Apr 17 12:17:39 SAST 2007 dd2,/usr/bin/gmplayer,file:///opt/digidoor/DDCONTENT/BOOKS/Fun/Movies/Alien_Song.mpeg,Tue Apr 17 12:27:47 SAST 2007 dd2,/usr/bin/gmplayer,file:///opt/digidoor/DDCONTENT/BOOKS/Fun/Movies/Chameleon.mpeg,Tue Apr 17 12:30:07 SAST 2007 dd2,/usr/bin/gmplayer,file:///opt/digidoor/DDCONTENT/BOOKS/Fun/Movies/Alien_Song.mpeg,Tue Apr 17 12:31:28 SAST 2007 dd2,/usr/games/ktron,,Tue Apr 17 12:33:01 SAST 2007 dd2,/usr/games/ksmiletris,,Tue Apr 17 12:34:53 SAST 2007 dd2,/usr/games/gnect,,Tue Apr 17 12:36:01 SAST 2007 dd2,/usr/games/gnometris,,Tue Apr 17 12:38:00 SAST 2007
Text A1: Example of tar file contents
log_20070418.tar:
mvotiti.logsithole.logdd3.logdd1.logdd2.log
Text A3: Example output of concatenated log file
elandeskraalmpcc_003018B0C936.balofrey,17,male,Southern_Sotho,English,/usr/bin/xawtv,,Thu Feb 22 17:49:52 UTC 2007 elandeskraalmpcc_003018B0C936.balofrey,17,male,Southern_Sotho,English,/usr/bin/firefox,http://home.digitaldoorway.co.za,Thu Feb 22 17:55:32 UTC 2007 elandeskraalmpcc_003018B0C936.balofrey,17,male,Southern_Sotho,English,/usr/bin/kalzium,,Thu Feb 22 17:56:42 UTC 2007 elandeskraalmpcc_003018B0C936.balofrey,17,male,Southern_Sotho,English,/usr/bin/firefox,file:///opt/digidoor/DDCONTENT/BOOKS/Science/Theory_of_Relativity/The_Relativity_of_Simulatneity.htm,Thu Feb 22 17:57:03 UTC 2007
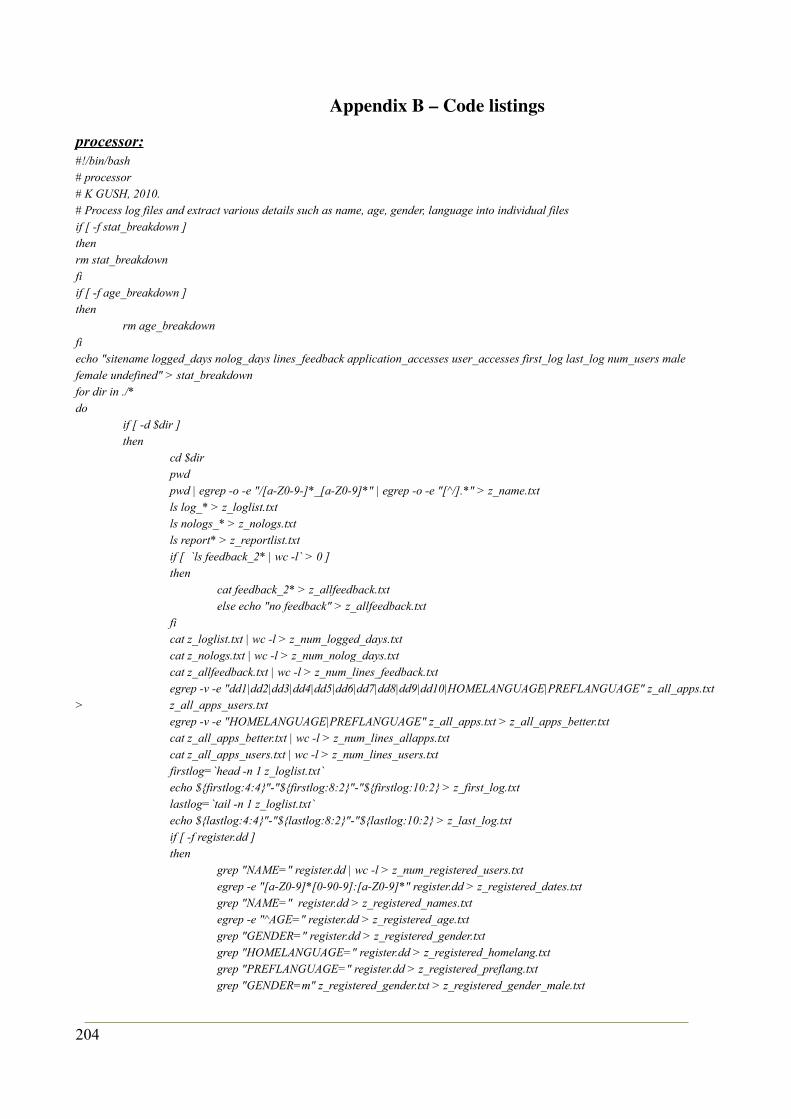
Appendix B – Code listings
processor:#!/bin/bash # processor# K GUSH, 2010.# Process log files and extract various details such as name, age, gender, language into individual filesif [ -f stat_breakdown ] then rm stat_breakdown fi if [ -f age_breakdown ] then
rm age_breakdown fi echo "sitename logged_days nolog_days lines_feedback application_accesses user_accesses first_log last_log num_users male female undefined" > stat_breakdown for dir in ./* do
if [ -d $dir ] then
cd $dir pwd pwd | egrep -o -e "/[a-Z0-9-]*_[a-Z0-9]*" | egrep -o -e "[^/].*" > z_name.txt ls log_* > z_loglist.txt ls nologs_* > z_nologs.txt ls report* > z_reportlist.txt if [ `ls feedback_2* | wc -l` > 0 ] then
cat feedback_2* > z_allfeedback.txt else echo "no feedback" > z_allfeedback.txt
fi cat z_loglist.txt | wc -l > z_num_logged_days.txt cat z_nologs.txt | wc -l > z_num_nolog_days.txt cat z_allfeedback.txt | wc -l > z_num_lines_feedback.txt egrep -v -e "dd1|dd2|dd3|dd4|dd5|dd6|dd7|dd8|dd9|dd10|HOMELANGUAGE|PREFLANGUAGE" z_all_apps.txt
> z_all_apps_users.txt egrep -v -e "HOMELANGUAGE|PREFLANGUAGE" z_all_apps.txt > z_all_apps_better.txt cat z_all_apps_better.txt | wc -l > z_num_lines_allapps.txt cat z_all_apps_users.txt | wc -l > z_num_lines_users.txt firstlog=`head -n 1 z_loglist.txt` echo ${firstlog:4:4}"-"${firstlog:8:2}"-"${firstlog:10:2} > z_first_log.txt lastlog=`tail -n 1 z_loglist.txt` echo ${lastlog:4:4}"-"${lastlog:8:2}"-"${lastlog:10:2} > z_last_log.txt if [ -f register.dd ] then
grep "NAME=" register.dd | wc -l > z_num_registered_users.txt egrep -e "[a-Z0-9]*[0-90-9]:[a-Z0-9]*" register.dd > z_registered_dates.txt grep "NAME=" register.dd > z_registered_names.txt egrep -e "^AGE=" register.dd > z_registered_age.txt grep "GENDER=" register.dd > z_registered_gender.txt grep "HOMELANGUAGE=" register.dd > z_registered_homelang.txt grep "PREFLANGUAGE=" register.dd > z_registered_preflang.txt grep "GENDER=m" z_registered_gender.txt > z_registered_gender_male.txt
204
grep "GENDER=f" z_registered_gender.txt > z_registered_gender_female.txt grep "GENDER=u" z_registered_gender.txt > z_registered_gender_undefined.txt
else echo "0" > z_num_registered_users.txt echo "0" > z_registered_dates.txt echo "0" > z_registered_names.txt echo "0" > z_registered_age.txt echo "0" > z_registered_gender.txt echo "0" > z_registered_homelang.txt echo "0" > z_registered_preflang.txt echo "0" > z_registered_gender_male.txt echo "0" > z_registered_gender_female.txt echo "0" > z_registered_gender_undefined.txt
fi k1=`cat z_name.txt` k2=`cat z_num_logged_days.txt` k3=`cat z_num_nolog_days.txt` k4=`cat z_num_lines_feedback.txt` k4b=`cat z_num_lines_allapps.txt` k4c=`cat z_num_lines_users.txt` k5=`cat z_first_log.txt` k6=`cat z_last_log.txt` k7=`cat z_num_registered_users.txt` k8=`cat z_registered_gender_male.txt | wc -l` k9=`cat z_registered_gender_female.txt | wc -l` k10=`cat z_registered_gender_undefined.txt | wc -l` echo $k1 $k2 $k3 $k4 $k4b $k4c $k5 $k6 $k7 $k8 $k9 $k10 >> ../stat_breakdown cat z_registered_age.txt >> ../age_breakdown cd ..
fi done if [ -f age_breakdown ] then
sort age_breakdown | uniq -c > age_breakdown_grouped fi
getapps_peruser2#!/bin/bash #getapps_peruser2# K GUSH, Oct 2009 # This script scans subdirectories for tarred log files files and # untars them and merges the logs per user into a userxx.siteyy.log file under the appsperuser/users subdirectory as well as combining all guest logs into ddX.siteyy.log file under appsperuser/guests #In addition, all user logs are combined into ../all_user_logs_big.txt and ../all_guest_logs_big.txt # Script should be run from the uploaded directory, containing all the site # directories in it. if [ -f all_user_logs_big.txt ] then rm all_user_logs_big.txt fi if [ -f all_guest_logs_big.txt ] then rm all_guest_logs_big.txt fi
205

for dir in * do
if [ -d $dir ] then ls $dir/log* > /dev/null 2>&1 if [ $? -eq 0 ] then cd $dir if [ -d appsperuser ] then rm -r appsperuser fi mkdir appsperuser mkdir appsperuser/guests mkdir appsperuser/users for file in log* do
tar -xvf $file for file2 in *.log do
if [ $file2 != 'jp.log' ] && [ $file2 != 'tom123.log' ] && [ $file2 != 'kim.log' ] then username=${file2%\.*} sed -i -e s/$username/$dir.$username/g $file2 cat $file2 >> ./appsperuser/$dir.$file2 grep -v "LANGUAGE=" ./appsperuser/$dir.$file2 > ./appsperuser/$dir.$file2.1 mv ./appsperuser/$dir.$file2.1 ./appsperuser/$dir.$file2 fi
done rm *.log
done mv appsperuser/$dir.dd{1,2,3,4,5,6,7,8,9,10}.log appsperuser/guests/ mv appsperuser/*.log appsperuser/users/ cat appsperuser/users/*.log >> ../all_user_logs_big.txt cat appsperuser/guests/*.log >> ../all_guest_logs_big.txt cd .. fi fi
done
get_userdetails_perline
#!/bin/bash # get_userdetails_perline# K GUSH, Oct 2009 # This script adds age, gender, homelang and preflang to each line of all_user_logs_big.txt and all_guest_logs_big.txt # It scans the file name_age_gender_lang.csv for the first occurance of the username and adds the details if found # Script should be run from the uploaded directory, containing all the site # directories in it. if [ ! -f all_user_logs_big.txt ] then echo "couldn't find all_user_logs_big.txt, please run get_apps_peruser2" exit 0 fi if [ ! -f name_age_gender_lang_nodupes.csv ]
206
then echo "couldn't find name_age_gender_lang_nodupes.csv, please create it from spreadsheet" exit 0 fi cat "name_age_gender_lang_nodupes.csv" | while read line do
# add a comma to the line line2=$line, # assign first field of the line (and a comma to avoid substring substitutions) # to the variable username username=`echo ${line} | cut -f 1 -d','`, echo $username # replace each occurance of username with the entire line incl. age, gender etc sed -i -e s/"$username"/"$line2"/g all_user_logs_big.txt
done
getuserdetails
#!/bin/bash # getuserdetails# K Gush, Meraka Institute October 2009 # This script scans subdirectories for register.dd files and # merges all the user details into a comma seperated file, appending the sitename to the username # Script should be run from the uploaded directory, containing all the site # directories in it. if [ -f all_user_details_name.txt ] then rm all_user_details_name.txt fi if [ -f all_user_details_age.txt ] then rm all_user_details_age.txt fi if [ -f all_user_details_gender.txt ] then rm all_user_details_gender.txt fi if [ -f all_user_details_homelang.txt ] then rm all_user_details_homelang.txt fi if [ -f all_user_details_preflang.txt ] then rm all_user_details_preflang.txt fi for dir in ./* do
if [ -f $dir/register.dd ] then cd $dir for file in ./register.dd do
cat $file | grep "NAME=" | while read line
207

do echo $line echo $dir.$line >> ../all_user_details_name.txt
done cat $file | grep "AGE=" | grep -v "HOMELANGUAGE" | grep -v "PREFLANGUAGE" | while read line do
echo $line echo $line >> ../all_user_details_age.txt
done cat $file | grep "GENDER=" | while read line do
echo $line echo $line >> ../all_user_details_gender.txt
done cat $file | grep "HOMELANGUAGE=" | while read line do
echo $line echo $line >> ../all_user_details_homelang.txt
done cat $file | grep "PREFLANGUAGE=" | while read line do
echo $line echo $line >> ../all_user_details_preflang.txt
done done cd .. fi
done
line_categorise
#!/bin/bash # line_categorise # K GUSH, Dec 2009 # This script replaces application name with general and specific category codes for each line in all_user_logs_big_cat.txt and all_guest_logs_big_cat.txt # It scans the file applications_and_categories_2.csv and replace each matching line in all_user_logs_big/guest.txt with the corresponding category # Script should be run from the uploaded directory, containing all the site # directories in it. if [ ! -f all_user_logs_big_cat.txt ] then echo "couldn't find all_user_logs_big_cat.txt, please run get_apps_peruser2 and cp all_user_logs_big.txt to all_user_logs_big_cat.txt" exit 0 fi if [ ! -f applications_and_categories_2.csv ] then echo "couldn't find applications_and_categories_2.csv, please create it from spreadsheet" exit 0 fi
208

counter=0 cat "applications_and_categories_2.csv" | while read line3 do echo $counter counter=$(($counter+1))
gencat=`echo ${line3} | cut -f 1 -d','`, speccat=`echo ${line3} | cut -f 2 -d','` ,rep=$gencat$speccat partA=`echo ${line3} | cut -f 4 -d','`, partB=`echo ${line3} | cut -f 5 -d','` ,partAandB=$partA$partB sed -i -e "s!$partAandB!$rep!g" all_user_logs_big_cat.txt
done
age_categorise
#!/bin/bash # age_categorise # K GUSH, Feb 2010 # This script replaces user age with an age category code for each line in all_user_logs_big_cat_age.txt and all_guest_logs_big_cat.txt # It scans the file ages_and_agecodes.csv and replace each matching age in all_user/guest_logs_big_cat_age.txt with the corresponding age code # Script should be run from the uploaded directory, containing all the site # directories in it. # see ages_and_agecodes.csv for list of ages and corresponding codes # ages : agecode # 6 – 10 : ac0 # 11 – 14 : ac1 # 15 – 17 : ac2 # 18 – 22 : ac3 # 23 – 30 : ac4 # 31 – 60 : ac5 if [ ! -f all_user_logs_big_cat_age.txt ] then
echo "couldn't find all_user_logs_big_cat.txt, please run get_apps_peruser2 and cp all_user_logs_big.txt to all_user_logs_big_cat.txt then run line_categorise and cp all_user_logs_big_cat.txt to all_user_logs_big_cat_age.txt"
exit 0 fi if [ ! -f ages_and_agecodes.csv ] then
echo "couldn't find ages_and_agecodes.csv, please create it" exit 0
fi counter=0 cat "ages_and_agecodes.csv" | while read line3 do
echo $counter counter=$(($counter+1)) agelookup=,`echo ${line3} | cut -f 1 -d','`, echo $agelookup agecode=,ac`echo ${line3} | cut -f 2 -d','`, echo $agecode sed -i -e "s!$agelookup!$agecode!" all_user_logs_big_cat_age.txt
done
209
site_categorise
#!/bin/bash # site_categorise # K Gush, Meraka Institute April 2010 # This script adds the site category code to all_user_logs_big_cat_age.txt # It scans the file sites_and_sitecodes.csv adding the site code as appropriate # see sites_and_sitecodes.csv for list of ages and corresponding codes # sitename : sitecode # Kwam_hlonipha : scc0 # Vezebuhle : scc0 # Elandskraal : scc1 # Emjindini : scc1 # Kanyamazane : scc1 # Letaba FET College2 : scc0 # Letaba FET Giyani : scc0 # Msunduzi : scc1 # Soshunguve : scc1 # Kagung : scc1 if [ ! -f all_user_logs_big_cat_age_sc.txt ] then
echo "couldn't find all_user_logs_big_cat_age_sc.txt, please run get_apps_peruser2 and cp all_user_logs_big.txt to all_user_logs_big_cat.txt then run line_categorise and cp all_user_logs_big_cat.txt to all_user_logs_big_cat_age_sc.txt"
exit 0 fi if [ ! -f sites_and_sitecodes.csv ] then
echo "couldn't find sites_and_sitecodes.csv, please create it" exit 0
fi counter=0 cat "sites_and_sitecodes.csv" | while read line3 do
echo $counter counter=$(($counter+1)) sitelookup=,`echo ${line3} | cut -f 1 -d','`, echo $sitelookup sitecode=,`echo ${line3} | cut -f 2 -d','`, echo $sitecode sed -i -e "s/$sitelookup/$sitecode\,$sitelookup/" all_user_logs_big_cat_age_sc.txt
done
get_userdetails_perline_persite
#!/bin/bash # get_userdetails_perline_persite # K Gush, Meraka Institute Oct 2009 # This script adds age, gender, homelang and preflang to each line of z_all_user _logs_big.txt and z_all_guest_logs_big.txt for each site # It scans the file name_age_gender_lang_persite.csv for the first occurance of the username and adds the details if found # Script should be run from the uploaded directory, containing all the site # directories in it. for dir in * do
210

if [ -d $dir ] then cd $dir echo $dir
if [ ! -f z_all_user_logs_big.txt ] then echo "couldn't find z_all_user_logs_big.txt, please run get_apps_peruser2" fi if [ ! -f name_age_gender_lang_persite.csv ] then echo "couldn't find name_age_gender_lang_persite.csv, please create it from spre adsheet" fi cat "name_age_gender_lang_persite.csv" | while read line do
# add a comma to the line line2=$line, # assign first field of the line (and a comma to avoid substring substit
utions) # to the variable username username=`echo ${line} | cut -f 1 -d','`, echo $username # replace each occurance of username with the entire line incl. age, gen
der etc sed -i -e s/"$username"/"$line2"/g z_all_user_logs_big.txt
done cd .. fi done
counter_per_age
#!/bin/bash # counter_per_age # For each age group count the number of hits per specific category if [ -f countresults_cat_perage ] then
rm countresults_cat_perage fi
if [ ! -f all_user_logs_big_cat_age_sc.txt.2 ] then
echo "Please generate all_user_logs_big_cat_age_sc.txt.2 first, and then run this script again" exit 0; fi echo "results for subset_10 sites, specific category per cat per age group" >> countresults_cat_perage
echo "rows: ac0, ac1, ac2, ac3, ac4, ac5, ac99" >> countresults_cat_perage # all gender groupings for i in 0 1 2 3 4 5 99; do
echo ac$i echo ac$i >> countresults_cat_perage echo games,ktron `cat all_user_logs_big_cat_age_sc.txt.2 | grep \,ac$i\, | grep "games,ktron," | wc -l` >> countresults_cat_perage
211
echo games,gnibbles `cat all_user_logs_big_cat_age_sc.txt.2 | grep \,ac$i\, | grep "games,gnibbles," | wc -l` >> countresults_cat_perage echo games,gnometris `cat all_user_logs_big_cat_age_sc.txt.2 | grep \,ac$i\, | grep "games,gnometris," | wc -l` >> countresults_cat_perage echo games,gamesother `cat all_user_logs_big_cat_age_sc.txt.2 | grep \,ac$i\, | grep "games,games other," | wc -l` >> countresults_cat_perage echo reference,fun `cat all_user_logs_big_cat_age_sc.txt.2 | grep \,ac$i\, | grep "reference,fun," | wc -l` >> countresults_cat_perage echo system,filemanager `cat all_user_logs_big_cat_age_sc.txt.2 | grep \,ac$i\, | grep ",system,system," | wc -l` >> countresults_cat_perage echo education,science `cat all_user_logs_big_cat_age_sc.txt.2 | grep \,ac$i\, | grep "education,science," | wc -l` >> countresults_cat_perage echo edutainment,science `cat all_user_logs_big_cat_age_sc.txt.2 | grep \,ac$i\, | grep "edutainment,science," | wc -l` >> countresults_cat_perage echo edutainment,graphics `cat all_user_logs_big_cat_age_sc.txt.2 | grep \,ac$i\, | grep "edutainment,graphics," | wc -l` >> countresults_cat_perage echo office,graphics `cat all_user_logs_big_cat_age_sc.txt.2 | grep \,ac$i\, | grep "office,graphics," | wc -l` >> countresults_cat_perage echo reference,science `cat all_user_logs_big_cat_age_sc.txt.2 | grep \,ac$i\, | grep "reference,science," | wc -l` >> countresults_cat_perage echo system,ddhomepage `cat all_user_logs_big_cat_age_sc.txt.2 | grep \,ac$i\, | grep "system,dd homepage," | wc -l` >> countresults_cat_perage echo video_audio,webcam `cat all_user_logs_big_cat_age_sc.txt.2 | grep \,ac$i\, | grep "video_audio,webcam," | wc -l` >> countresults_cat_perage echo video_audio,science `cat all_user_logs_big_cat_age_sc.txt.2 | grep \,ac$i\, | grep "video_audio,science," | wc -l` >> countresults_cat_perage echo office,maths `cat all_user_logs_big_cat_age_sc.txt.2 | grep \,ac$i\, | grep "office,maths," | wc -l` >> countresults_cat_perage echo edutainment,whatwhat `cat all_user_logs_big_cat_age_sc.txt.2 | grep \,ac$i\, | grep "edutainment,whatwhat," | wc -l` >> countresults_cat_perage echo edutainment,gcompris `cat all_user_logs_big_cat_age_sc.txt.2 | grep \,ac$i\, | grep "edutainment,gcompris" | wc -l` >> countresults_cat_perage echo reference,wikipedia `cat all_user_logs_big_cat_age_sc.txt.2 | grep \,ac$i\, | grep "reference,wikipedia," | wc -l` >> countresults_cat_perage echo edutainment,themba `cat all_user_logs_big_cat_age_sc.txt.2 | grep \,ac$i\, | grep "edutainment,themba," | wc -l` >> countresults_cat_perage echo education,mindset `cat all_user_logs_big_cat_age_sc.txt.2 | grep \,ac$i\, | grep "education,mindset," | wc -l` >> countresults_cat_perage echo edutainment,computers `cat all_user_logs_big_cat_age_sc.txt.2 | grep \,ac$i\, | grep "edutainment,computers," | wc -l` >> countresults_cat_perage echo video_audio,audiobooks `cat all_user_logs_big_cat_age_sc.txt.2 | grep \,ac$i\, | grep "video_audio,audiobooks," | wc -l` >> countresults_cat_perage echo video_audio,fun `cat all_user_logs_big_cat_age_sc.txt.2 | grep \,ac$i\, | grep "video_audio,fun," | wc -l` >> countresults_cat_perage echo system,comms `cat all_user_logs_big_cat_age_sc.txt.2 | grep \,ac$i\, | grep "system,comms," | wc -l` >> countresults_cat_perage echo reference,computers `cat all_user_logs_big_cat_age_sc.txt.2 | grep \,ac$i\, | grep "reference,computers," | wc -l` >> countresults_cat_perage echo reference,health `cat all_user_logs_big_cat_age_sc.txt.2 | grep \,ac$i\, | grep "reference,health," | wc -l` >> countresults_cat_perage echo edutainment,language `cat all_user_logs_big_cat_age_sc.txt.2 | grep \,ac$i\, | grep "edutainment,language," | wc -l` >> countresults_cat_perage echo reference,agriculture `cat all_user_logs_big_cat_age_sc.txt.2 | grep \,ac$i\, | grep "reference,agriculture," | wc -l` >> countresults_cat_perage echo reference,lifeskills `cat all_user_logs_big_cat_age_sc.txt.2 | grep \,ac$i\, | grep "reference,life skills," | wc -l` >> countresults_cat_perage echo reference,news `cat all_user_logs_big_cat_age_sc.txt.2 | grep \,ac$i\, | grep "reference,news," | wc -l` >> countresults_cat_perage
212
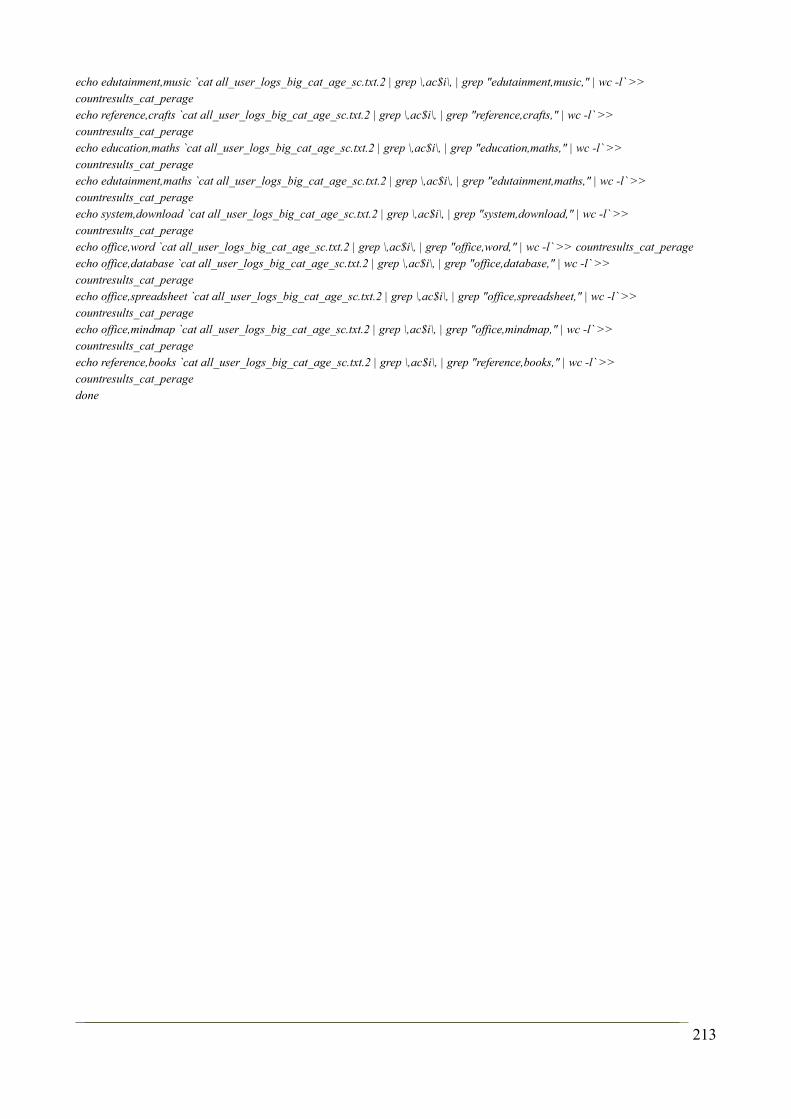
echo edutainment,music `cat all_user_logs_big_cat_age_sc.txt.2 | grep \,ac$i\, | grep "edutainment,music," | wc -l` >> countresults_cat_perage echo reference,crafts `cat all_user_logs_big_cat_age_sc.txt.2 | grep \,ac$i\, | grep "reference,crafts," | wc -l` >> countresults_cat_perage echo education,maths `cat all_user_logs_big_cat_age_sc.txt.2 | grep \,ac$i\, | grep "education,maths," | wc -l` >> countresults_cat_perage echo edutainment,maths `cat all_user_logs_big_cat_age_sc.txt.2 | grep \,ac$i\, | grep "edutainment,maths," | wc -l` >> countresults_cat_perage echo system,download `cat all_user_logs_big_cat_age_sc.txt.2 | grep \,ac$i\, | grep "system,download," | wc -l` >> countresults_cat_perage echo office,word `cat all_user_logs_big_cat_age_sc.txt.2 | grep \,ac$i\, | grep "office,word," | wc -l` >> countresults_cat_perage echo office,database `cat all_user_logs_big_cat_age_sc.txt.2 | grep \,ac$i\, | grep "office,database," | wc -l` >> countresults_cat_perage echo office,spreadsheet `cat all_user_logs_big_cat_age_sc.txt.2 | grep \,ac$i\, | grep "office,spreadsheet," | wc -l` >> countresults_cat_perage echo office,mindmap `cat all_user_logs_big_cat_age_sc.txt.2 | grep \,ac$i\, | grep "office,mindmap," | wc -l` >> countresults_cat_perage echo reference,books `cat all_user_logs_big_cat_age_sc.txt.2 | grep \,ac$i\, | grep "reference,books," | wc -l` >> countresults_cat_perage done
213
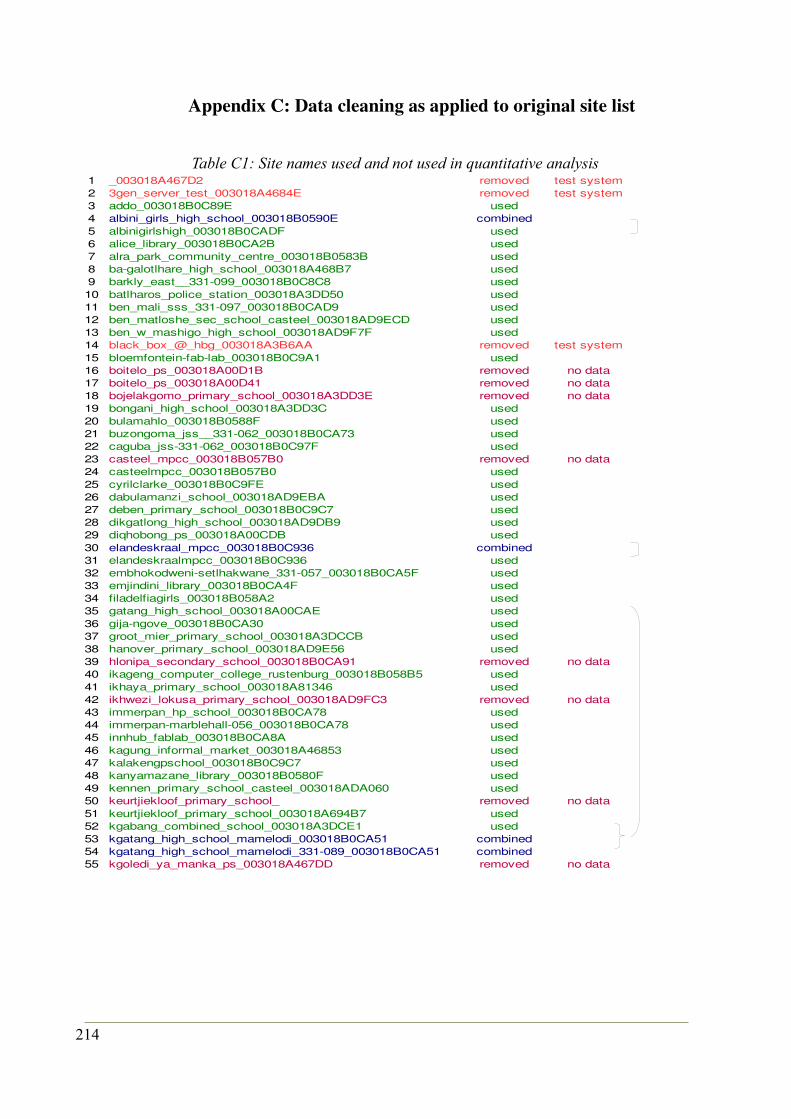
Appendix C: Data cleaning as applied to original site list
Table C1: Site names used and not used in quantitative analysis1 _003018A467D2 removed test system2 3gen_server_test_003018A4684E removed test system3 addo_003018B0C89E used4 albini_girls_high_school_003018B0590E combined5 albinigirlshigh_003018B0CADF used6 alice_library_003018B0CA2B used7 alra_park_community_centre_003018B0583B used8 bagalotlhare_high_school_003018A468B7 used9 barkly_east__331099_003018B0C8C8 used10 batlharos_police_station_003018A3DD50 used11 ben_mali_sss_331097_003018B0CAD9 used12 ben_matloshe_sec_school_casteel_003018AD9ECD used13 ben_w_mashigo_high_school_003018AD9F7F used14 black_box_@_hbg_003018A3B6AA removed test system15 bloemfonteinfablab_003018B0C9A1 used16 boitelo_ps_003018A00D1B removed no data17 boitelo_ps_003018A00D41 removed no data18 bojelakgomo_primary_school_003018A3DD3E removed no data19 bongani_high_school_003018A3DD3C used20 bulamahlo_003018B0588F used21 buzongoma_jss__331062_003018B0CA73 used22 caguba_jss331062_003018B0C97F used23 casteel_mpcc_003018B057B0 removed no data24 casteelmpcc_003018B057B0 used25 cyrilclarke_003018B0C9FE used26 dabulamanzi_school_003018AD9EBA used27 deben_primary_school_003018B0C9C7 used28 dikgatlong_high_school_003018AD9DB9 used29 diqhobong_ps_003018A00CDB used30 elandeskraal_mpcc_003018B0C936 combined31 elandeskraalmpcc_003018B0C936 used32 embhokodwenisetlhakwane_331057_003018B0CA5F used33 emjindini_library_003018B0CA4F used34 filadelfiagirls_003018B058A2 used35 gatang_high_school_003018A00CAE used36 gijangove_003018B0CA30 used37 groot_mier_primary_school_003018A3DCCB used38 hanover_primary_school_003018AD9E56 used39 hlonipa_secondary_school_003018B0CA91 removed no data40 ikageng_computer_college_rustenburg_003018B058B5 used41 ikhaya_primary_school_003018A81346 used42 ikhwezi_lokusa_primary_school_003018AD9FC3 removed no data43 immerpan_hp_school_003018B0CA78 used44 immerpanmarblehall056_003018B0CA78 used45 innhub_fablab_003018B0CA8A used46 kagung_informal_market_003018A46853 used47 kalakengpschool_003018B0C9C7 used48 kanyamazane_library_003018B0580F used49 kennen_primary_school_casteel_003018ADA060 used50 keurtjiekloof_primary_school_ removed no data51 keurtjiekloof_primary_school_003018A694B7 used52 kgabang_combined_school_003018A3DCE1 used53 kgatang_high_school_mamelodi_003018B0CA51 combined54 kgatang_high_school_mamelodi_331089_003018B0CA51 combined55 kgoledi_ya_manka_ps_003018A467DD removed no data
214
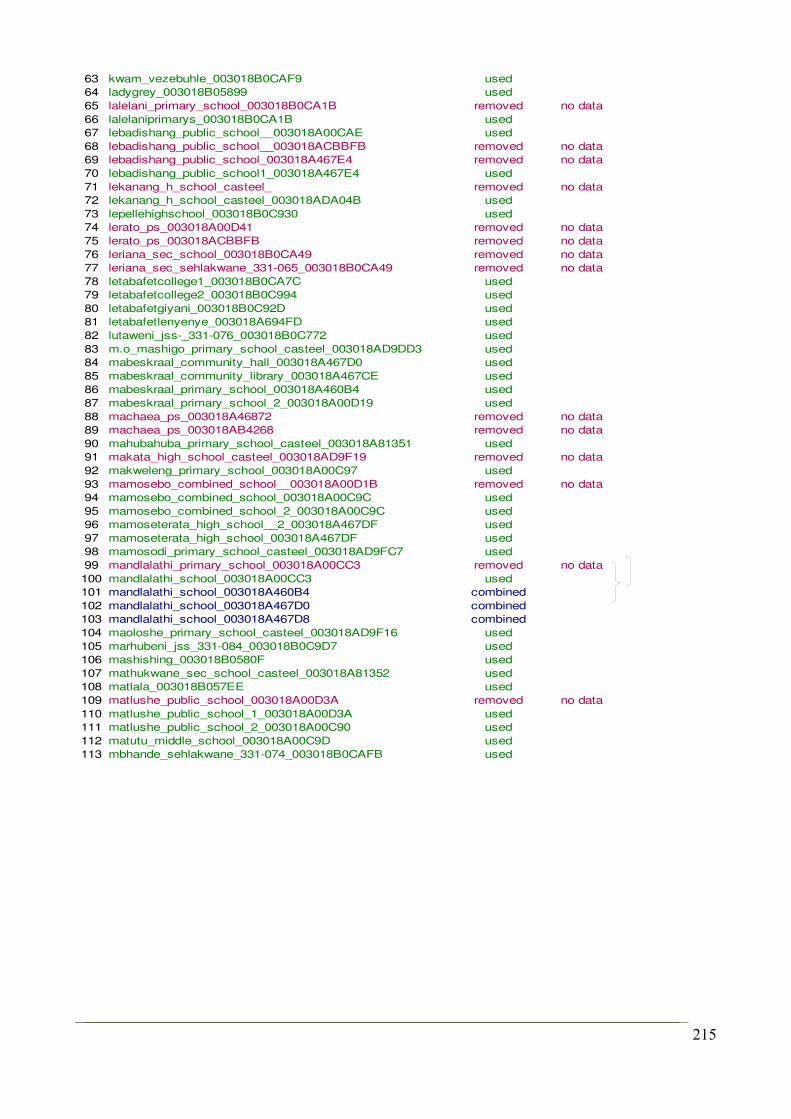
63 kwam_vezebuhle_003018B0CAF9 used64 ladygrey_003018B05899 used65 lalelani_primary_school_003018B0CA1B removed no data66 lalelaniprimarys_003018B0CA1B used67 lebadishang_public_school__003018A00CAE used68 lebadishang_public_school__003018ACBBFB removed no data69 lebadishang_public_school_003018A467E4 removed no data70 lebadishang_public_school1_003018A467E4 used71 lekanang_h_school_casteel_ removed no data72 lekanang_h_school_casteel_003018ADA04B used73 lepellehighschool_003018B0C930 used74 lerato_ps_003018A00D41 removed no data75 lerato_ps_003018ACBBFB removed no data76 leriana_sec_school_003018B0CA49 removed no data77 leriana_sec_sehlakwane_331065_003018B0CA49 removed no data78 letabafetcollege1_003018B0CA7C used79 letabafetcollege2_003018B0C994 used80 letabafetgiyani_003018B0C92D used81 letabafetlenyenye_003018A694FD used82 lutaweni_jss_331076_003018B0C772 used83 m.o_mashigo_primary_school_casteel_003018AD9DD3 used84 mabeskraal_community_hall_003018A467D0 used85 mabeskraal_community_library_003018A467CE used86 mabeskraal_primary_school_003018A460B4 used87 mabeskraal_primary_school_2_003018A00D19 used88 machaea_ps_003018A46872 removed no data89 machaea_ps_003018AB4268 removed no data90 mahubahuba_primary_school_casteel_003018A81351 used91 makata_high_school_casteel_003018AD9F19 removed no data92 makweleng_primary_school_003018A00C97 used93 mamosebo_combined_school__003018A00D1B removed no data94 mamosebo_combined_school_003018A00C9C used95 mamosebo_combined_school_2_003018A00C9C used96 mamoseterata_high_school__2_003018A467DF used97 mamoseterata_high_school_003018A467DF used98 mamosodi_primary_school_casteel_003018AD9FC7 used99 mandlalathi_primary_school_003018A00CC3 removed no data100 mandlalathi_school_003018A00CC3 used101 mandlalathi_school_003018A460B4 combined102 mandlalathi_school_003018A467D0 combined103 mandlalathi_school_003018A467D8 combined104 maoloshe_primary_school_casteel_003018AD9F16 used105 marhubeni_jss_331084_003018B0C9D7 used106 mashishing_003018B0580F used107 mathukwane_sec_school_casteel_003018A81352 used108 matlala_003018B057EE used109 matlushe_public_school_003018A00D3A removed no data110 matlushe_public_school_1_003018A00D3A used111 matlushe_public_school_2_003018A00C90 used112 matutu_middle_school_003018A00C9D used113 mbhande_sehlakwane_331074_003018B0CAFB used
215
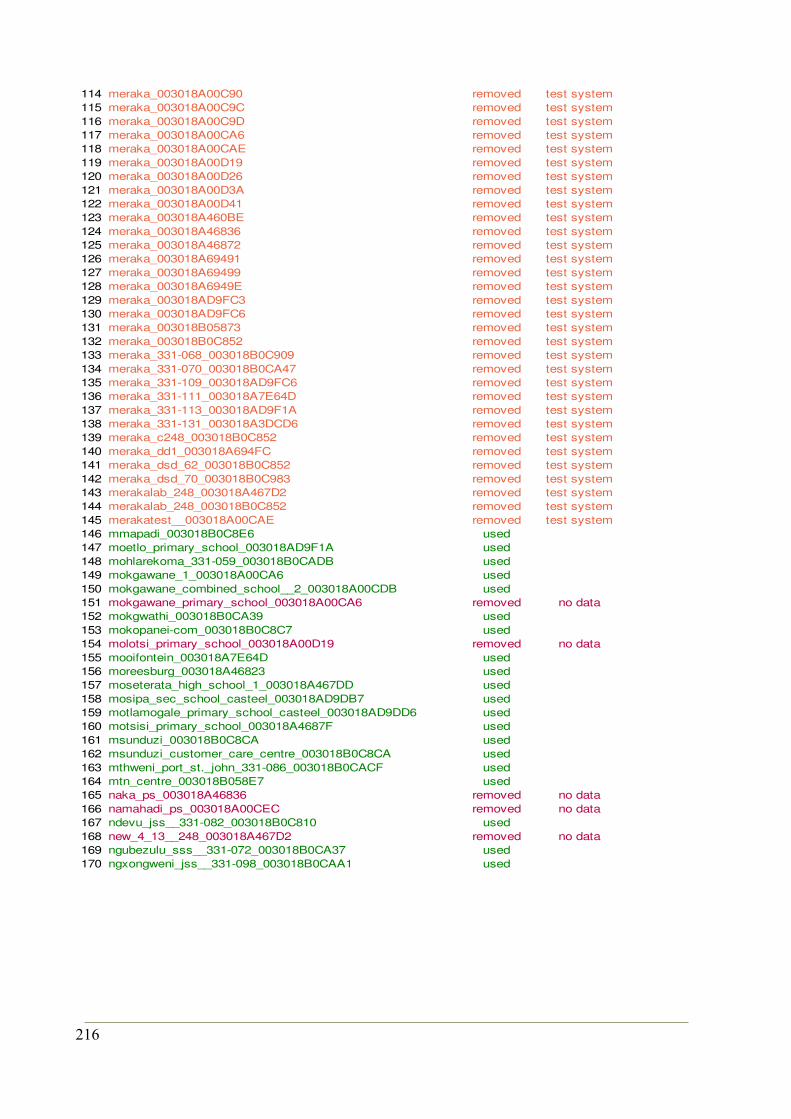
114 meraka_003018A00C90 removed test system115 meraka_003018A00C9C removed test system116 meraka_003018A00C9D removed test system117 meraka_003018A00CA6 removed test system118 meraka_003018A00CAE removed test system119 meraka_003018A00D19 removed test system120 meraka_003018A00D26 removed test system121 meraka_003018A00D3A removed test system122 meraka_003018A00D41 removed test system123 meraka_003018A460BE removed test system124 meraka_003018A46836 removed test system125 meraka_003018A46872 removed test system126 meraka_003018A69491 removed test system127 meraka_003018A69499 removed test system128 meraka_003018A6949E removed test system129 meraka_003018AD9FC3 removed test system130 meraka_003018AD9FC6 removed test system131 meraka_003018B05873 removed test system132 meraka_003018B0C852 removed test system133 meraka_331068_003018B0C909 removed test system134 meraka_331070_003018B0CA47 removed test system135 meraka_331109_003018AD9FC6 removed test system136 meraka_331111_003018A7E64D removed test system137 meraka_331113_003018AD9F1A removed test system138 meraka_331131_003018A3DCD6 removed test system139 meraka_c248_003018B0C852 removed test system140 meraka_dd1_003018A694FC removed test system141 meraka_dsd_62_003018B0C852 removed test system142 meraka_dsd_70_003018B0C983 removed test system143 merakalab_248_003018A467D2 removed test system144 merakalab_248_003018B0C852 removed test system145 merakatest__003018A00CAE removed test system146 mmapadi_003018B0C8E6 used147 moetlo_primary_school_003018AD9F1A used148 mohlarekoma_331059_003018B0CADB used149 mokgawane_1_003018A00CA6 used150 mokgawane_combined_school__2_003018A00CDB used151 mokgawane_primary_school_003018A00CA6 removed no data152 mokgwathi_003018B0CA39 used153 mokopaneicom_003018B0C8C7 used154 molotsi_primary_school_003018A00D19 removed no data155 mooifontein_003018A7E64D used156 moreesburg_003018A46823 used157 moseterata_high_school_1_003018A467DD used158 mosipa_sec_school_casteel_003018AD9DB7 used159 motlamogale_primary_school_casteel_003018AD9DD6 used160 motsisi_primary_school_003018A4687F used161 msunduzi_003018B0C8CA used162 msunduzi_customer_care_centre_003018B0C8CA used163 mthweni_port_st._john_331086_003018B0CACF used164 mtn_centre_003018B058E7 used165 naka_ps_003018A46836 removed no data166 namahadi_ps_003018A00CEC removed no data167 ndevu_jss__331082_003018B0C810 used168 new_4_13__248_003018A467D2 removed no data169 ngubezulu_sss__331072_003018B0CA37 used170 ngxongweni_jss__331098_003018B0CAA1 used
216

171 nkambako_003018B0C8C6 used172 nkandla_1_1_003018A00D14 used173 nkandla_1_3_003018AB4265 used174 nkandla31_003018A467DC used175 nkqilwini_jss__331079_003018B0CA83 used176 ntshongweni_003018B0C932 used177 ntshongweni_customer_centre_003018B0C932 used178 ntshongweni_primary_003018B0CA36 used179 okiep_primary_school_003018A4688A used180 or_tambo_sec_school_003018B0C909 removed no data181 orange_farm_mpcc_003018A451E8 used182 oranjezicht_high_003018AD9FC2 used183 pampier_003018B05838 used184 pe_teachers_centre_003018B0C89B used185 phalane_primary_school_1_003018A00D14 used186 pniellandgoed_primer_003018A3DD3A used187 port_st_john_sss__331083_003018B0C79E used188 Port_St_Johns_331093_003018B0CAFC_ used189 puk_campus_003018B0C905 used190 qoqisizwe_high_school_003018A46892 used191 qoqisizwe_school_003018A46892 used192 reti_sec_school_casteel_003018AD9DF5 used193 rhodes_public_school_003018B0CA42 removed no data194 rietfontein_combined_school_003018A3DD4F used195 roman_catholic_jss_331054_003018B0CAF8 used196 runnymede_003018B0C8BE used197 runnymedenew_003018B0C8BE used198 sango_combined_school_003018B0CB16 removed no data199 shoeshoe_ps_003018A00C90 removed no data200 sicambeni_jss__331073_003018B0CA64 used201 sinthumule_003018B05861 used202 skhosana_sec_school_003018B0CA66 removed no data203 skhosana_sec_setlhakwane_331061_003018B0CA66 used204 soshanguve_fablab_003018AD9FC6 used205 soshanguve_fablab_1_003018AD9FC6 used206 soshanguve_fablab_2_003018A4683A removed no data207 soshanguvefablab_003018B0CA0F used208 soshanguvefablab2_003018A4683A used209 soshanguvefablb2_003018A00D1B removed no data210 sterkspruit_003018B05873 used211 strydenburg_combined_school_003018B058BE used212 suncitycarecernter_003018B0C999 used213 teboho_ps_003018AB4268 used214 thekwini_jss__331087_003018B0CB18 used215 thlakong_5_003018A00C97 removed no data216 tjetje_tech_school_003018B0C882 used217 tjetjesehlakwane331053_003018B0C882 used218 tlhakong_2_003018A4687F used219 tlhwahalang_secondary_school_003018A3DD09 used220 tombo_jss_port_st_john_331063_003018B0C843 used221 trompie__001E5830CFEF removed no data222 tshilambuvheprimarys_003018B0C928 used223 ubuntu_education_fund_003018B0C931 used224 umbumbulu_003018B0CAAD used225 valdezia_003018A00D0F used226 valdezia_003018B0590E used227 vezebuhleovccernter_003018B0CAAC used228 victor_poto_sss_331095_003018B0C8DC used229 vukundlule_jss__331058_003018B0CB14 used230 vulindlela_mthatha_331090_003018B0C923 used231 wozamoya_high_school_003018B0CA36 used232 wozamoyaschool_003018B05866 used233 zaaiplaas_hp_school_003018B0CA1C used234 zakhele_003018B0CA42 used235 zr_mahabane_ps_003018A00D1B removed no data
217
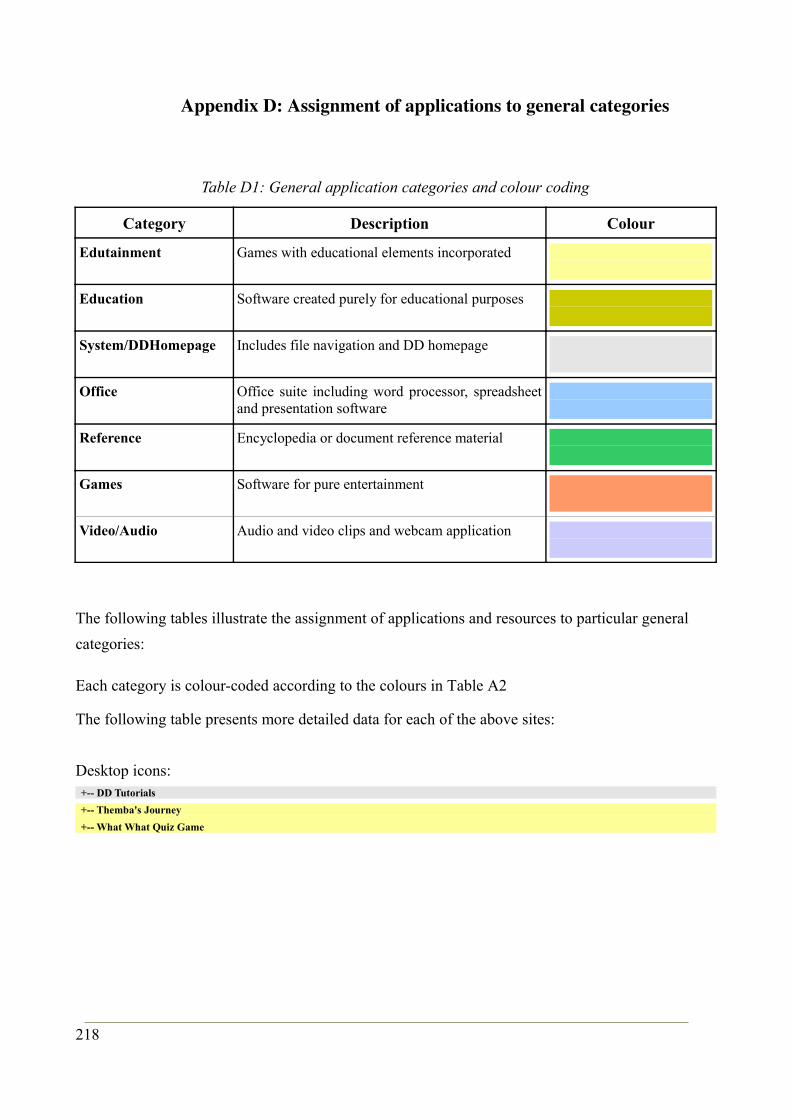
Appendix D: Assignment of applications to general categories
Table D1: General application categories and colour coding
Category Description Colour
Edutainment Games with educational elements incorporated
Education Software created purely for educational purposes
System/DDHomepage Includes file navigation and DD homepage
Office Office suite including word processor, spreadsheet and presentation software
Reference Encyclopedia or document reference material
Games Software for pure entertainment
Video/Audio Audio and video clips and webcam application
The following tables illustrate the assignment of applications and resources to particular general
categories:
Each category is colour-coded according to the colours in Table A2
The following table presents more detailed data for each of the above sites:
Desktop icons: +-- DD Tutorials
+-- Themba's Journey
+-- What What Quiz Game
218
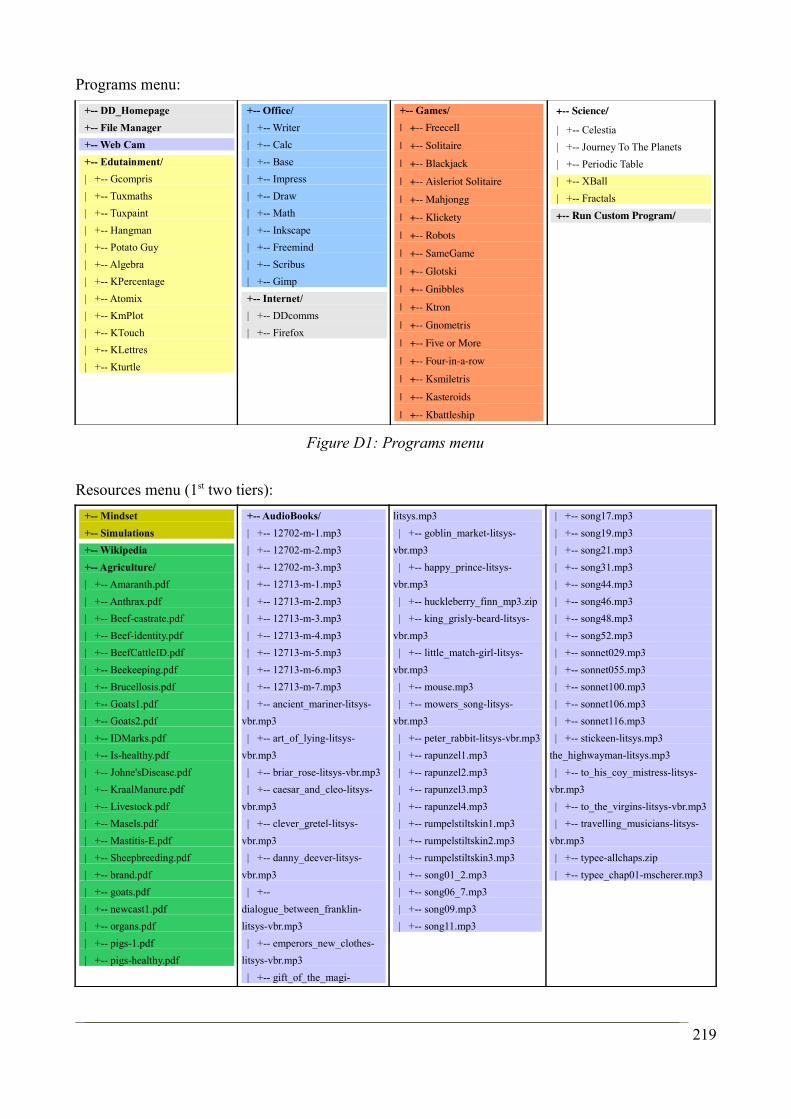
Programs menu:
+-- DD_Homepage
+-- File Manager
+-- Web Cam
+-- Edutainment/
| +-- Gcompris
| +-- Tuxmaths
| +-- Tuxpaint
| +-- Hangman
| +-- Potato Guy
| +-- Algebra
| +-- KPercentage
| +-- Atomix
| +-- KmPlot
| +-- KTouch
| +-- KLettres
| +-- Kturtle
+-- Office/
| +-- Writer
| +-- Calc
| +-- Base
| +-- Impress
| +-- Draw
| +-- Math
| +-- Inkscape
| +-- Freemind
| +-- Scribus
| +-- Gimp
+-- Internet/
| +-- DDcomms
| +-- Firefox
+-- Games/
| + Freecell
| + Solitaire
| + Blackjack
| + Aisleriot Solitaire
| + Mahjongg
| + Klickety
| + Robots
| + SameGame
| + Glotski
| + Gnibbles
| + Ktron
| + Gnometris
| + Five or More
| + Fourinarow
| + Ksmiletris
| + Kasteroids
| + Kbattleship
+ Science/
| +-- Celestia
| +-- Journey To The Planets
| +-- Periodic Table
| +-- XBall
| +-- Fractals
+ Run Custom Program/
Figure D1: Programs menu
Resources menu (1st two tiers):
+-- Mindset
+-- Simulations
+-- Wikipedia
+-- Agriculture/
| +-- Amaranth.pdf
| +-- Anthrax.pdf
| +-- Beef-castrate.pdf
| +-- Beef-identity.pdf
| +-- BeefCattleID.pdf
| +-- Beekeeping.pdf
| +-- Brucellosis.pdf
| +-- Goats1.pdf
| +-- Goats2.pdf
| +-- IDMarks.pdf
| +-- Is-healthy.pdf
| +-- Johne'sDisease.pdf
| +-- KraalManure.pdf
| +-- Livestock.pdf
| +-- Masels.pdf
| +-- Mastitis-E.pdf
| +-- Sheepbreeding.pdf
| +-- brand.pdf
| +-- goats.pdf
| +-- newcast1.pdf
| +-- organs.pdf
| +-- pigs-1.pdf
| +-- pigs-healthy.pdf
+-- AudioBooks/
| +-- 12702-m-1.mp3
| +-- 12702-m-2.mp3
| +-- 12702-m-3.mp3
| +-- 12713-m-1.mp3
| +-- 12713-m-2.mp3
| +-- 12713-m-3.mp3
| +-- 12713-m-4.mp3
| +-- 12713-m-5.mp3
| +-- 12713-m-6.mp3
| +-- 12713-m-7.mp3
| +-- ancient_mariner-litsys-
vbr.mp3
| +-- art_of_lying-litsys-
vbr.mp3
| +-- briar_rose-litsys-vbr.mp3
| +-- caesar_and_cleo-litsys-
vbr.mp3
| +-- clever_gretel-litsys-
vbr.mp3
| +-- danny_deever-litsys-
vbr.mp3
| +--
dialogue_between_franklin-
litsys-vbr.mp3
| +-- emperors_new_clothes-
litsys-vbr.mp3
| +-- gift_of_the_magi-
litsys.mp3
| +-- goblin_market-litsys-
vbr.mp3
| +-- happy_prince-litsys-
vbr.mp3
| +-- huckleberry_finn_mp3.zip
| +-- king_grisly-beard-litsys-
vbr.mp3
| +-- little_match-girl-litsys-
vbr.mp3
| +-- mouse.mp3
| +-- mowers_song-litsys-
vbr.mp3
| +-- peter_rabbit-litsys-vbr.mp3
| +-- rapunzel1.mp3
| +-- rapunzel2.mp3
| +-- rapunzel3.mp3
| +-- rapunzel4.mp3
| +-- rumpelstiltskin1.mp3
| +-- rumpelstiltskin2.mp3
| +-- rumpelstiltskin3.mp3
| +-- song01_2.mp3
| +-- song06_7.mp3
| +-- song09.mp3
| +-- song11.mp3
| +-- song17.mp3
| +-- song19.mp3
| +-- song21.mp3
| +-- song31.mp3
| +-- song44.mp3
| +-- song46.mp3
| +-- song48.mp3
| +-- song52.mp3
| +-- sonnet029.mp3
| +-- sonnet055.mp3
| +-- sonnet100.mp3
| +-- sonnet106.mp3
| +-- sonnet116.mp3
| +-- stickeen-litsys.mp3
the_highwayman-litsys.mp3
| +-- to_his_coy_mistress-litsys-
vbr.mp3
| +-- to_the_virgins-litsys-vbr.mp3
| +-- travelling_musicians-litsys-
vbr.mp3
| +-- typee-allchaps.zip
| +-- typee_chap01-mscherer.mp3
219
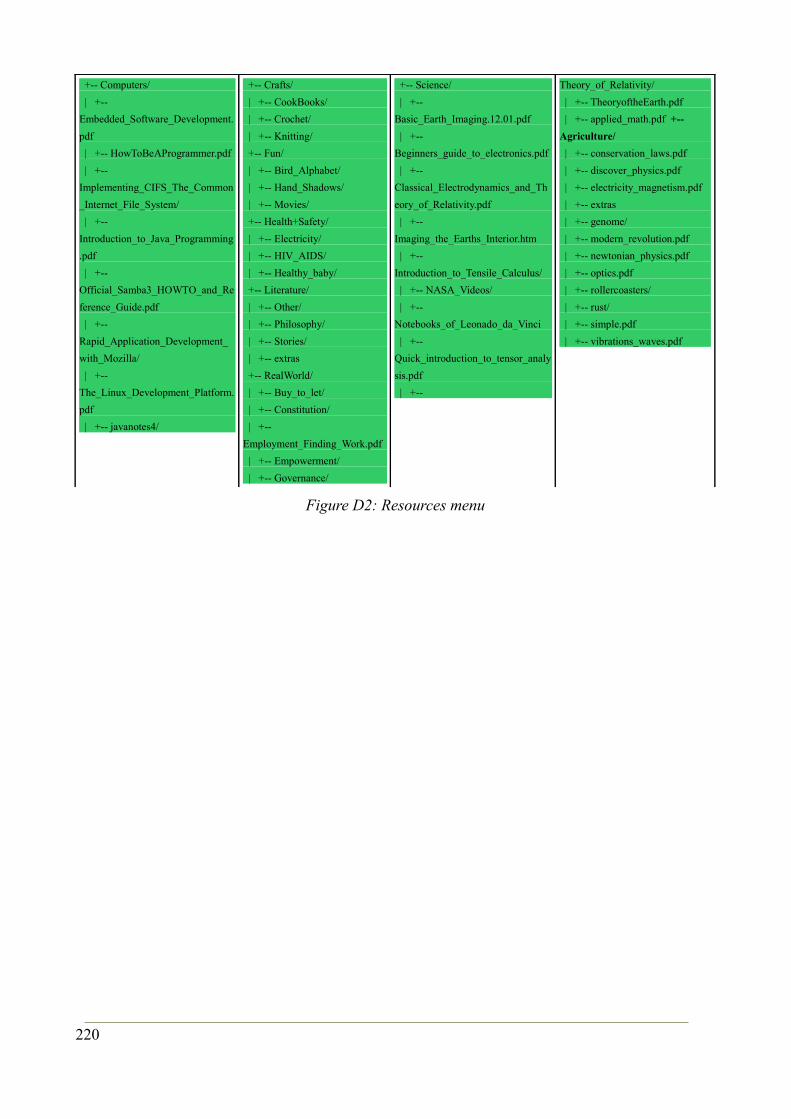
+-- Computers/
| +--
Embedded_Software_Development.
| +-- HowToBeAProgrammer.pdf
| +--
Implementing_CIFS_The_Common
_Internet_File_System/
| +--
Introduction_to_Java_Programming
| +--
Official_Samba3_HOWTO_and_Re
ference_Guide.pdf
| +--
Rapid_Application_Development_
with_Mozilla/
| +--
The_Linux_Development_Platform.
| +-- javanotes4/
+-- Crafts/
| +-- CookBooks/
| +-- Crochet/
| +-- Knitting/
+-- Fun/
| +-- Bird_Alphabet/
| +-- Hand_Shadows/
| +-- Movies/
+-- Health+Safety/
| +-- Electricity/
| +-- HIV_AIDS/
| +-- Healthy_baby/
+-- Literature/
| +-- Other/
| +-- Philosophy/
| +-- Stories/
| +-- extras
+-- RealWorld/
| +-- Buy_to_let/
| +-- Constitution/
| +--
Employment_Finding_Work.pdf
| +-- Empowerment/
| +-- Governance/
+-- Science/
| +--
Basic_Earth_Imaging.12.01.pdf
| +--
Beginners_guide_to_electronics.pdf
| +--
Classical_Electrodynamics_and_Th
eory_of_Relativity.pdf
| +--
Imaging_the_Earths_Interior.htm
| +--
Introduction_to_Tensile_Calculus/
| +-- NASA_Videos/
| +--
Notebooks_of_Leonado_da_Vinci
| +--
Quick_introduction_to_tensor_analy
sis.pdf
| +--
Theory_of_Relativity/
| +-- TheoryoftheEarth.pdf
| +-- applied_math.pdf +--
Agriculture/
| +-- conservation_laws.pdf
| +-- discover_physics.pdf
| +-- electricity_magnetism.pdf
| +-- extras
| +-- genome/
| +-- modern_revolution.pdf
| +-- newtonian_physics.pdf
| +-- optics.pdf
| +-- rollercoasters/
| +-- rust/
| +-- simple.pdf
| +-- vibrations_waves.pdf
Figure D2: Resources menu
220

Appendix E: Quantitative data tables
Table E1: General category hit counts
Age code
Ages GamesVideo & audio
DDhome and nav.
Edutainment
Reference
Education
Office suite
Total
MalesAc 0 6–9 95 77 21 25 27 44 11 300Ac 1 10–13 1697 994 1087 454 734 600 262 5828Ac 2 14–17 1506 1333 1464 595 1893 701 303 7795Ac 3 18–21 1202 1098 1050 741 809 520 277 5697Ac 4 22–25 684 666 652 223 495 280 144 3144Ac 5 26–60 304 309 292 150 303 195 78 1632Ac99 0–5, 61+ 682 335 205 106 192 213 46 1779
6170 4812 4772 2294 4453 2553 1121 26175
FemalesAc 0 6–9 47 25 1 4 5 2 0 84Ac 1 10–13 360 290 132 80 215 117 41 1235Ac 2 14–17 356 223 170 95 475 153 50 1522Ac 3 18–21 191 246 240 39 314 75 40 1145Ac 4 22–25 120 91 79 47 51 36 16 440Ac 5 26–60 100 78 101 22 146 64 19 530Ac99 0–5, 61+ 222 108 54 47 57 78 60 626
1396 1061 777 334 1263 525 226 5582
UnspecifiedAc 0 6–9 71 9 11 11 10 7 9 128Ac 1 10–13 990 369 176 235 93 245 124 2232Ac 2 14–17 744 505 409 219 585 294 143 2899Ac 3 18–21 625 493 464 132 337 186 105 2342Ac 4 22–25 115 95 180 44 60 51 15 560Ac 5 26–60 50 41 77 9 103 50 20 350Ac99 0–5, 61+ 359 327 306 102 451 256 68 1869
2954 1839 1623 752 1639 1089 484 10380
All users (gender independent)Ac 0 6–9 213 111 33 40 42 53 20 512Ac 1 10–13 3047 1653 1395 769 1042 962 427 9295Ac 2 14–17 2606 2061 2043 909 2953 1148 496 12216Ac 3 18–21 2018 1837 1754 912 1458 781 422 9182Ac 4 22–25 919 852 911 314 606 367 175 4144Ac 5 26–60 454 428 471 181 552 309 117 2512Ac99 0–5, 61+ 1255 770 565 255 700 543 174 4262
10512 7712 7172 3380 7353 4163 1831 42123(GRAPHS AND DATA FROM EXCEL SPREADSHEET RESULTS_AgeCat_Totals_LATEST.ods)
221
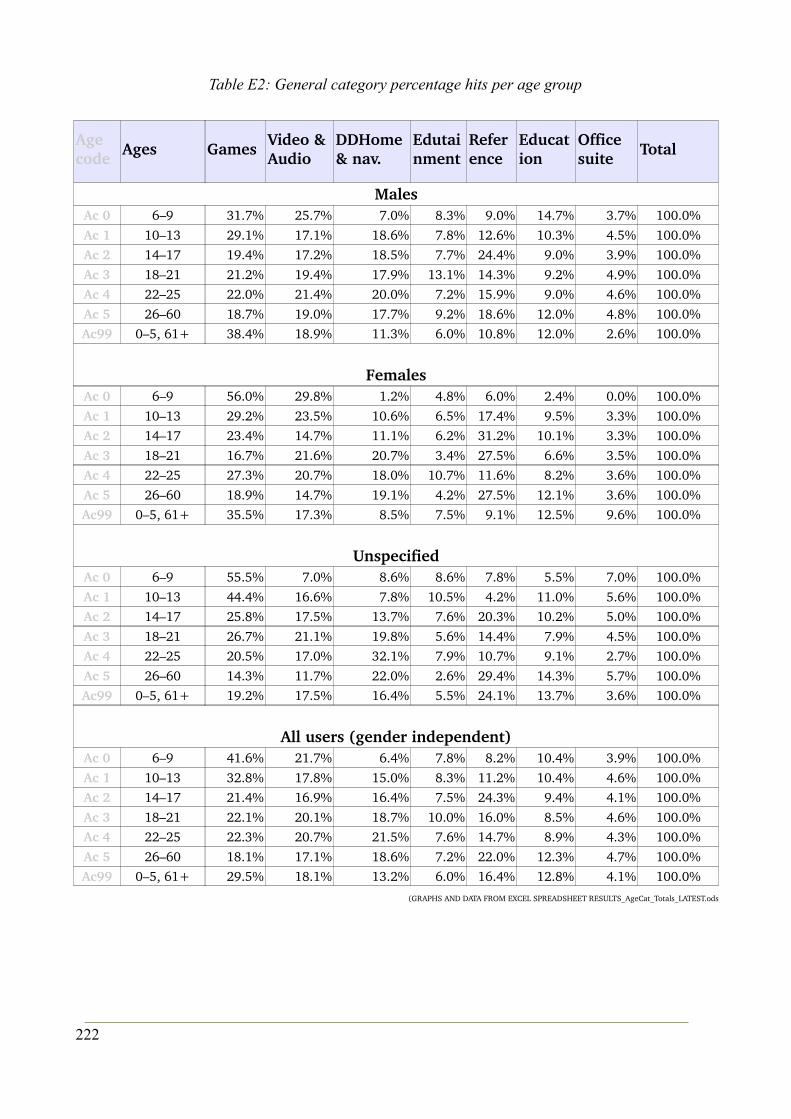
Table E2: General category percentage hits per age group
Age code
Ages GamesVideo & Audio
DDHome & nav.
Edutainment
Reference
Education
Office suite
Total
MalesAc 0 6–9 31.7% 25.7% 7.0% 8.3% 9.0% 14.7% 3.7% 100.0%Ac 1 10–13 29.1% 17.1% 18.6% 7.8% 12.6% 10.3% 4.5% 100.0%Ac 2 14–17 19.4% 17.2% 18.5% 7.7% 24.4% 9.0% 3.9% 100.0%Ac 3 18–21 21.2% 19.4% 17.9% 13.1% 14.3% 9.2% 4.9% 100.0%Ac 4 22–25 22.0% 21.4% 20.0% 7.2% 15.9% 9.0% 4.6% 100.0%Ac 5 26–60 18.7% 19.0% 17.7% 9.2% 18.6% 12.0% 4.8% 100.0%Ac99 0–5, 61+ 38.4% 18.9% 11.3% 6.0% 10.8% 12.0% 2.6% 100.0%
FemalesAc 0 6–9 56.0% 29.8% 1.2% 4.8% 6.0% 2.4% 0.0% 100.0%Ac 1 10–13 29.2% 23.5% 10.6% 6.5% 17.4% 9.5% 3.3% 100.0%Ac 2 14–17 23.4% 14.7% 11.1% 6.2% 31.2% 10.1% 3.3% 100.0%Ac 3 18–21 16.7% 21.6% 20.7% 3.4% 27.5% 6.6% 3.5% 100.0%Ac 4 22–25 27.3% 20.7% 18.0% 10.7% 11.6% 8.2% 3.6% 100.0%Ac 5 26–60 18.9% 14.7% 19.1% 4.2% 27.5% 12.1% 3.6% 100.0%Ac99 0–5, 61+ 35.5% 17.3% 8.5% 7.5% 9.1% 12.5% 9.6% 100.0%
UnspecifiedAc 0 6–9 55.5% 7.0% 8.6% 8.6% 7.8% 5.5% 7.0% 100.0%Ac 1 10–13 44.4% 16.6% 7.8% 10.5% 4.2% 11.0% 5.6% 100.0%Ac 2 14–17 25.8% 17.5% 13.7% 7.6% 20.3% 10.2% 5.0% 100.0%Ac 3 18–21 26.7% 21.1% 19.8% 5.6% 14.4% 7.9% 4.5% 100.0%Ac 4 22–25 20.5% 17.0% 32.1% 7.9% 10.7% 9.1% 2.7% 100.0%Ac 5 26–60 14.3% 11.7% 22.0% 2.6% 29.4% 14.3% 5.7% 100.0%Ac99 0–5, 61+ 19.2% 17.5% 16.4% 5.5% 24.1% 13.7% 3.6% 100.0%
All users (gender independent)Ac 0 6–9 41.6% 21.7% 6.4% 7.8% 8.2% 10.4% 3.9% 100.0%Ac 1 10–13 32.8% 17.8% 15.0% 8.3% 11.2% 10.4% 4.6% 100.0%Ac 2 14–17 21.4% 16.9% 16.4% 7.5% 24.3% 9.4% 4.1% 100.0%Ac 3 18–21 22.1% 20.1% 18.7% 10.0% 16.0% 8.5% 4.6% 100.0%Ac 4 22–25 22.3% 20.7% 21.5% 7.6% 14.7% 8.9% 4.3% 100.0%Ac 5 26–60 18.1% 17.1% 18.6% 7.2% 22.0% 12.3% 4.7% 100.0%Ac99 0–5, 61+ 29.5% 18.1% 13.2% 6.0% 16.4% 12.8% 4.1% 100.0%
(GRAPHS AND DATA FROM EXCEL SPREADSHEET RESULTS_AgeCat_Totals_LATEST.ods
222
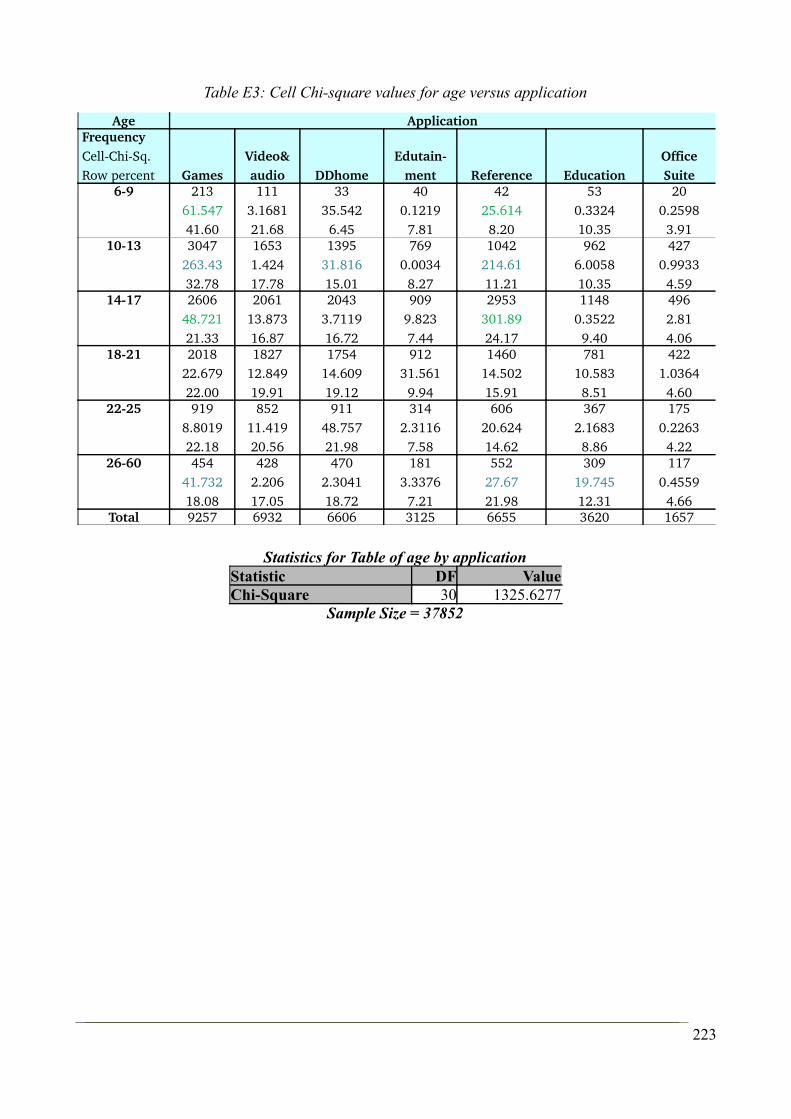
Table E3: Cell Chi-square values for age versus application
Age ApplicationFrequencyCellChiSq.Row percent Games
Video&audio DDhome
Edutainment Reference Education
Office Suite
69 21361.54741.60
1113.168121.68
3335.542
6.45
400.1219
7.81
4225.6148.20
530.332410.35
200.25983.91
1013 3047263.4332.78
16531.42417.78
139531.81615.01
7690.0034
8.27
1042214.6111.21
9626.005810.35
4270.99334.59
1417 260648.72121.33
206113.87316.87
20433.711916.72
9099.8237.44
2953301.8924.17
11480.35229.40
4962.814.06
1821 201822.67922.00
182712.84919.91
175414.60919.12
91231.561
9.94
146014.50215.91
78110.5838.51
4221.03644.60
2225 9198.801922.18
85211.41920.56
91148.75721.98
3142.3116
7.58
60620.62414.62
3672.16838.86
1750.22634.22
2660 45441.73218.08
4282.20617.05
4702.304118.72
1813.3376
7.21
55227.6721.98
30919.74512.31
1170.45594.66
Total 9257 6932 6606 3125 6655 3620 1657
Statistics for Table of age by applicationStatistic DF ValueChi-Square 30 1325.6277
Sample Size = 37852
223
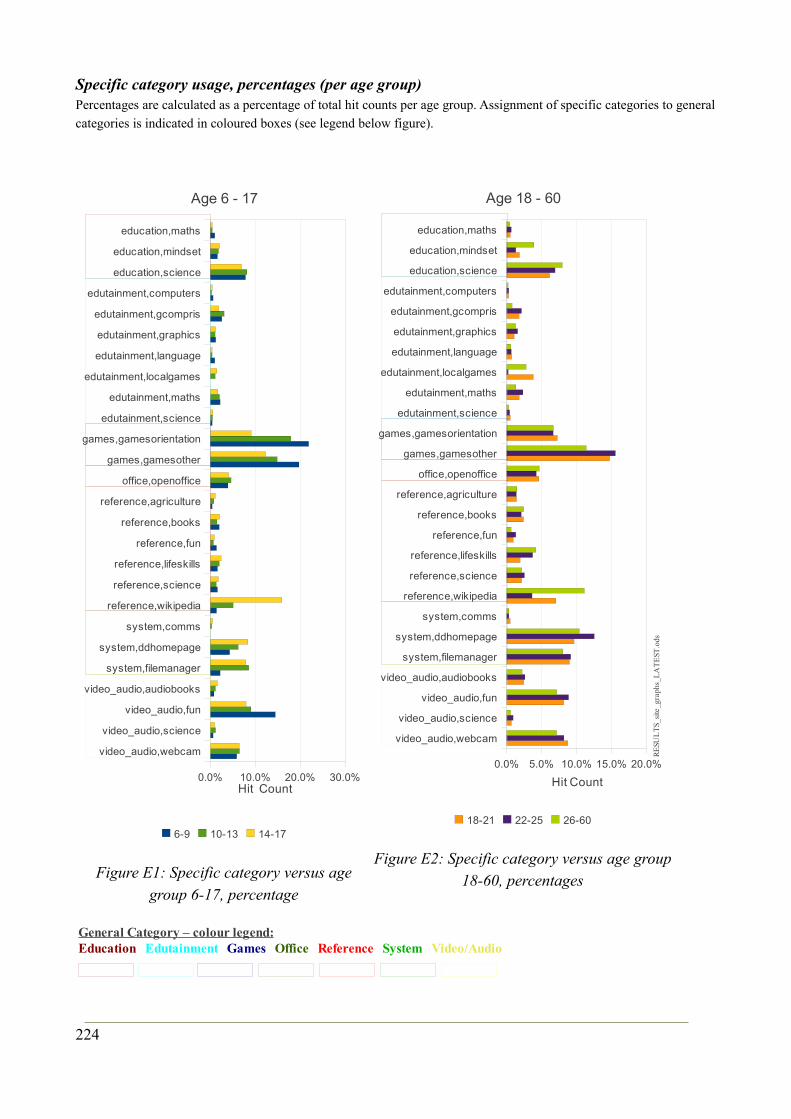
Specific category usage, percentages (per age group)Percentages are calculated as a percentage of total hit counts per age group. Assignment of specific categories to general
categories is indicated in coloured boxes (see legend below figure).
224
Figure E1: Specific category versus age group 6-17, percentage
video_audio,webcam
video_audio,science
video_audio,fun
video_audio,audiobooks
system,filemanager
system,ddhomepage
system,comms
reference,wikipedia
reference,science
reference,lifeskills
reference,fun
reference,books
reference,agriculture
office,openoffice
games,gamesother
games,gamesorientation
edutainment,science
edutainment,maths
edutainment,localgames
edutainment,language
edutainment,graphics
edutainment,gcompris
edutainment,computers
education,science
education,mindset
education,maths
0.0% 10.0% 20.0% 30.0%
Age 6 - 17
6-9 10-13 14-17
Hit Count
Figure E2: Specific category versus age group 18-60, percentages
video_audio,webcam
video_audio,science
video_audio,fun
video_audio,audiobooks
system,filemanager
system,ddhomepage
system,comms
reference,wikipedia
reference,science
reference,lifeskills
reference,fun
reference,books
reference,agriculture
office,openoffice
games,gamesother
games,gamesorientation
edutainment,science
edutainment,maths
edutainment,localgames
edutainment,language
edutainment,graphics
edutainment,gcompris
edutainment,computers
education,science
education,mindset
education,maths
0.0% 5.0% 10.0% 15.0% 20.0%
Age 18 - 60
18-21 22-25 26-60
Hit Count
General Category – colour legend:Education Edutainment Games Office Reference System Video/Audio
RE
SUL
TS_
site
_gra
phs_
LA
TE
ST.o
ds
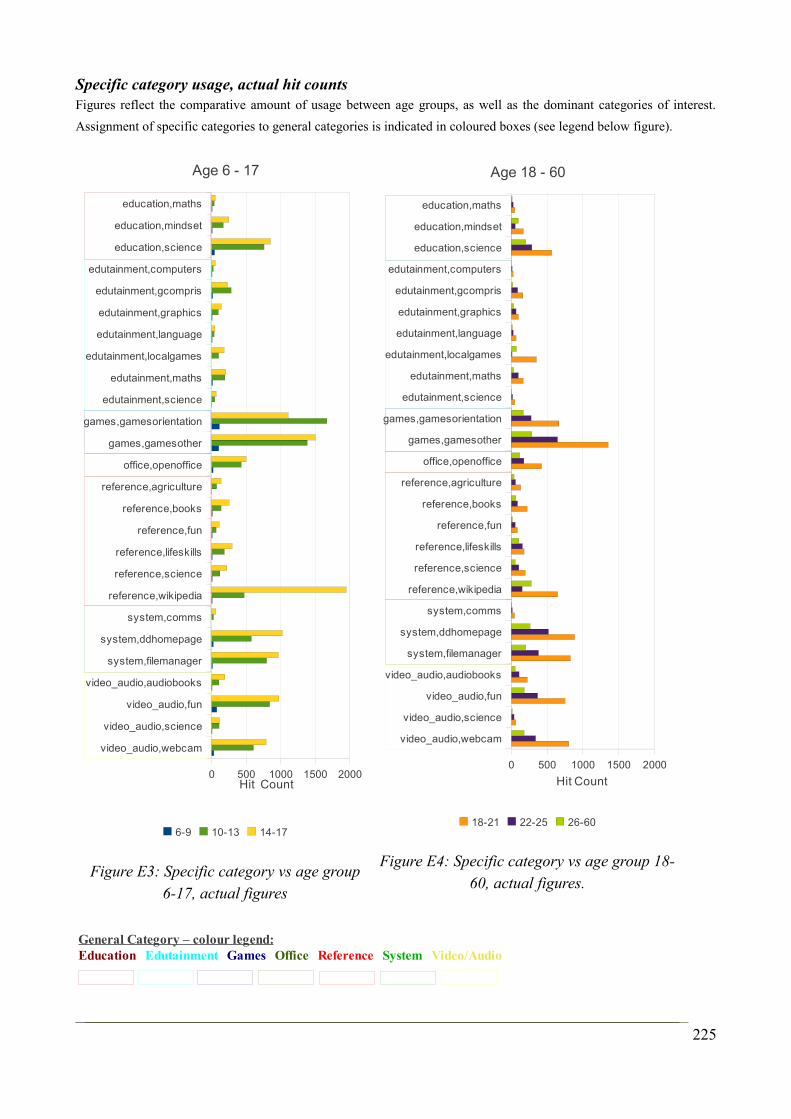
Specific category usage, actual hit countsFigures reflect the comparative amount of usage between age groups, as well as the dominant categories of interest.
Assignment of specific categories to general categories is indicated in coloured boxes (see legend below figure).
225
Figure E3: Specific category vs age group 6-17, actual figures
video_audio,webcam
video_audio,science
video_audio,fun
video_audio,audiobooks
system,filemanager
system,ddhomepage
system,comms
reference,wikipedia
reference,science
reference,lifeskills
reference,fun
reference,books
reference,agriculture
office,openoffice
games,gamesother
games,gamesorientation
edutainment,science
edutainment,maths
edutainment,localgames
edutainment,language
edutainment,graphics
edutainment,gcompris
edutainment,computers
education,science
education,mindset
education,maths
0 500 1000 1500 2000
Age 6 - 17
6-9 10-13 14-17
Hit Count
General Category – colour legend:Education Edutainment Games Office Reference System Video/Audio
Figure E4: Specific category vs age group 18-60, actual figures.
video_audio,webcam
video_audio,science
video_audio,fun
video_audio,audiobooks
system,filemanager
system,ddhomepage
system,comms
reference,wikipedia
reference,science
reference,lifeskills
reference,fun
reference,books
reference,agriculture
office,openoffice
games,gamesother
games,gamesorientation
edutainment,science
edutainment,maths
edutainment,localgames
edutainment,language
edutainment,graphics
edutainment,gcompris
edutainment,computers
education,science
education,mindset
education,maths
0 500 1000 1500 2000
Age 18 - 60
18-21 22-25 26-60
Hit Count

Table E4: Hit-counts and percentages per category, per location
gamesvideo_audi
o system referenceedutainme
nt education office TotalNo No No No No No No
Libraries 7454 3936 5863 6972 1699 3088 826 29838Sec. Schools 4048 4206 2662 1264 1188 1574 539 15481FETs 9611 5701 4061 2345 1340 1996 1348 26402Gen. Public 14787 37166 16391 16184 10175 4757 5155 104615
gamesvideo_audi
o system referenceedutainme
nt education office% % % % % % %
Libraries 24.98% 13.19% 19.65% 23.37% 5.69% 10.35% 2.77% 100%Sec. Schools 26.15% 27.17% 17.20% 8.16% 7.67% 10.17% 3.48% 100%FETs 36.40% 21.59% 15.38% 8.88% 5.08% 7.56% 5.11% 100%Gen. Public 14.13% 35.53% 15.67% 15.47% 9.73% 4.55% 4.93% 100%
results_site_graphs_LATEST2.ods Sheet 5
Table E5: Specific category percentages, per location category
Application Category Libraries Sec. Schools FETs Gen. Publicedutainment,localgames 0.84% 0.09% 0.00% 3.33%edutainment,language 0.27% 0.23% 0.36% 0.26%edutainment,computers 0.37% 0.38% 0.25% 0.21%system,comms 4.37% 0.45% 0.00% 3.07%edutainment,science 0.80% 0.78% 0.36% 0.43%education,maths 0.48% 0.88% 0.54% 0.38%reference,agriculture 1.17% 0.96% 1.16% 1.21%video_audio,science 0.80% 0.99% 1.09% 6.83%reference,books 1.02% 1.05% 1.14% 2.25%reference,fun 0.80% 1.22% 1.07% 2.57%reference,wikipedia 14.72% 1.23% 1.22% 3.26%edutainment,maths 0.51% 1.57% 1.84% 1.63%education,mindset 1.90% 1.66% 1.02% 0.69%edutainment,gcompris 1.83% 1.67% 0.84% 2.64%reference,science 2.47% 1.78% 1.34% 2.65%reference,lifeskills/health 3.18% 1.92% 2.95% 3.52%video_audio,audiobooks 1.14% 2.33% 2.34% 6.93%edutainment,graphics 1.08% 2.95% 1.43% 1.22%office,openoffice 2.77% 3.48% 5.11% 4.93%system,filemanager 4.53% 7.13% 6.55% 6.91%education,science 7.96% 7.62% 6.01% 3.48%games,orientation 9.49% 7.73% 14.53% 6.95%system,ddhomepage 10.75% 9.62% 8.83% 5.69%video_audio,webcam 5.63% 10.70% 8.43% 10.49%video_audio,fun 5.63% 13.15% 9.73% 11.28%games,gamesother 15.49% 18.42% 21.87% 7.19%TOTAL 100% 100% 100% 100%
226
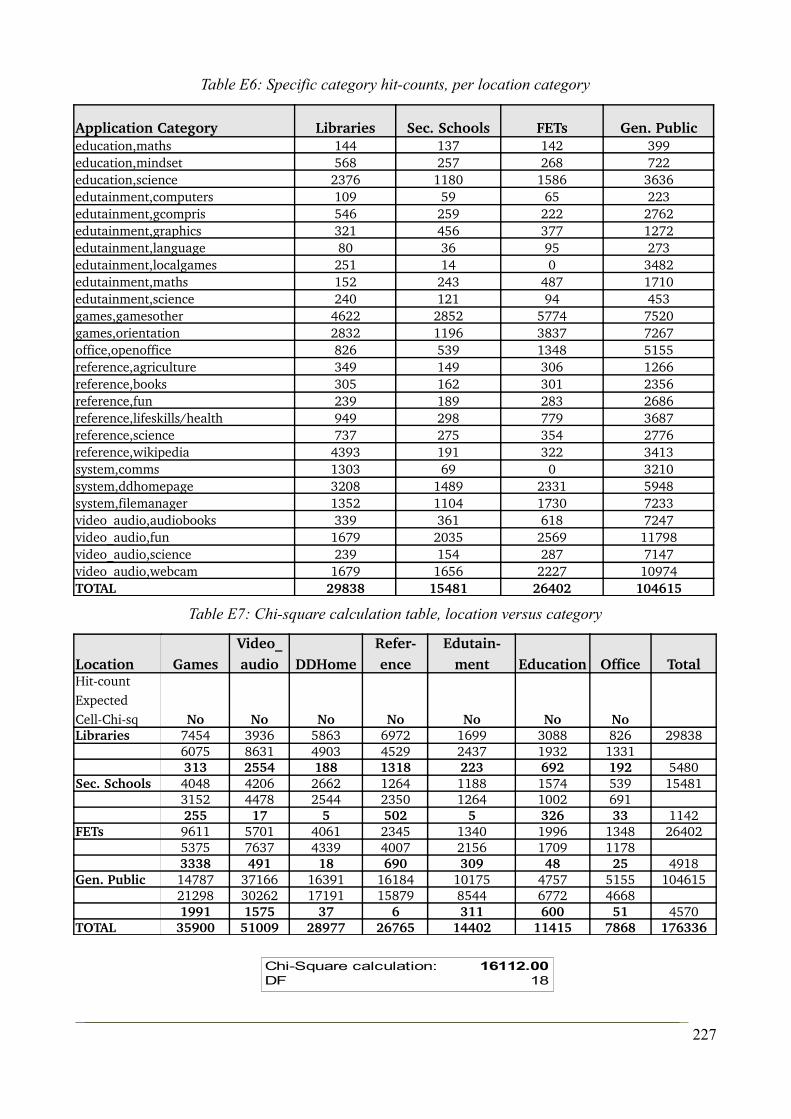
Table E6: Specific category hit-counts, per location category
Application Category Libraries Sec. Schools FETs Gen. Publiceducation,maths 144 137 142 399education,mindset 568 257 268 722education,science 2376 1180 1586 3636edutainment,computers 109 59 65 223edutainment,gcompris 546 259 222 2762edutainment,graphics 321 456 377 1272edutainment,language 80 36 95 273edutainment,localgames 251 14 0 3482edutainment,maths 152 243 487 1710edutainment,science 240 121 94 453games,gamesother 4622 2852 5774 7520games,orientation 2832 1196 3837 7267office,openoffice 826 539 1348 5155reference,agriculture 349 149 306 1266reference,books 305 162 301 2356reference,fun 239 189 283 2686reference,lifeskills/health 949 298 779 3687reference,science 737 275 354 2776reference,wikipedia 4393 191 322 3413system,comms 1303 69 0 3210system,ddhomepage 3208 1489 2331 5948system,filemanager 1352 1104 1730 7233video_audio,audiobooks 339 361 618 7247video_audio,fun 1679 2035 2569 11798video_audio,science 239 154 287 7147video_audio,webcam 1679 1656 2227 10974TOTAL 29838 15481 26402 104615
Table E7: Chi-square calculation table, location versus category
Location GamesVideo_audio DDHome
Reference
Edutainment Education Office Total
HitcountExpectedCellChisq No No No No No No NoLibraries 7454 3936 5863 6972 1699 3088 826 29838
6075 8631 4903 4529 2437 1932 1331313 2554 188 1318 223 692 192 5480
Sec. Schools 4048 4206 2662 1264 1188 1574 539 154813152 4478 2544 2350 1264 1002 691255 17 5 502 5 326 33 1142
FETs 9611 5701 4061 2345 1340 1996 1348 264025375 7637 4339 4007 2156 1709 11783338 491 18 690 309 48 25 4918
Gen. Public 14787 37166 16391 16184 10175 4757 5155 10461521298 30262 17191 15879 8544 6772 46681991 1575 37 6 311 600 51 4570
TOTAL 35900 51009 28977 26765 14402 11415 7868 176336
227
Chi-Square calculation: 16112.00DF 18
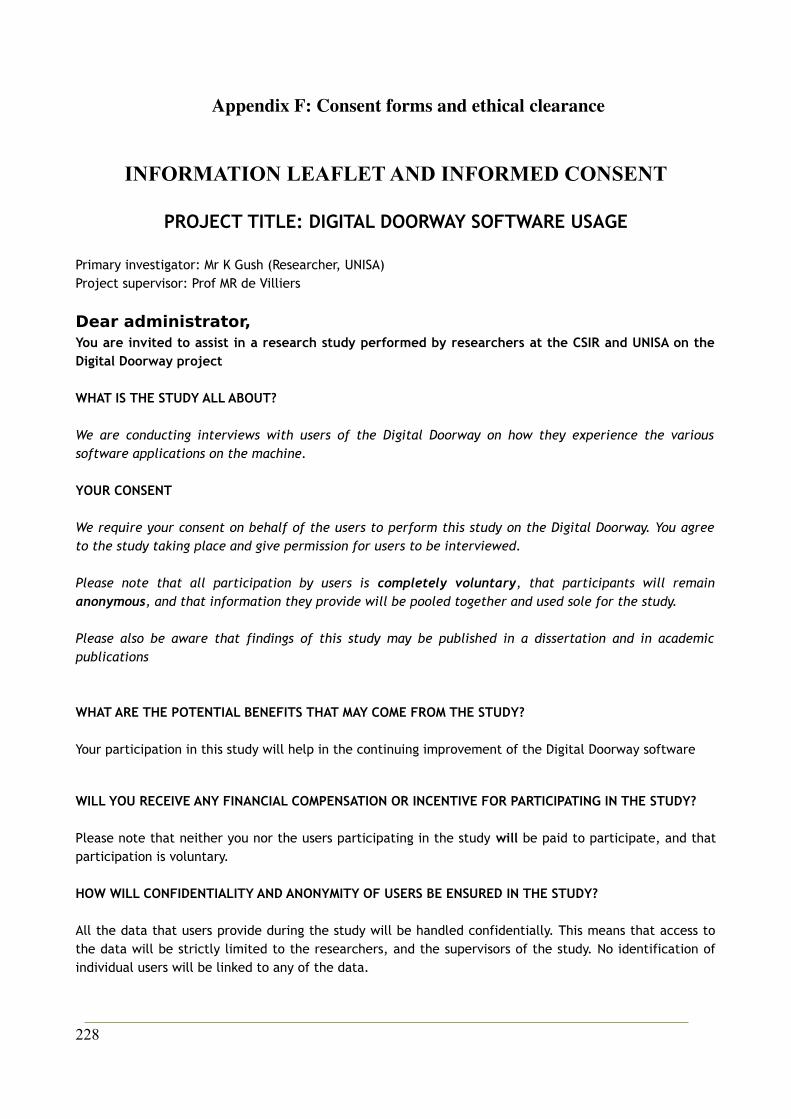
Appendix F: Consent forms and ethical clearance
INFORMATION LEAFLET AND INFORMED CONSENT
PROJECT TITLE: DIGITAL DOORWAY SOFTWARE USAGE
Primary investigator: Mr K Gush (Researcher, UNISA)Project supervisor: Prof MR de Villiers
Dear administrator,You are invited to assist in a research study performed by researchers at the CSIR and UNISA on the Digital Doorway project
WHAT IS THE STUDY ALL ABOUT?
We are conducting interviews with users of the Digital Doorway on how they experience the various software applications on the machine.
YOUR CONSENT
We require your consent on behalf of the users to perform this study on the Digital Doorway. You agree to the study taking place and give permission for users to be interviewed.
Please note that all participation by users is completely voluntary, that participants will remain anonymous, and that information they provide will be pooled together and used sole for the study.
Please also be aware that findings of this study may be published in a dissertation and in academic publications
WHAT ARE THE POTENTIAL BENEFITS THAT MAY COME FROM THE STUDY?
Your participation in this study will help in the continuing improvement of the Digital Doorway software
WILL YOU RECEIVE ANY FINANCIAL COMPENSATION OR INCENTIVE FOR PARTICIPATING IN THE STUDY?
Please note that neither you nor the users participating in the study will be paid to participate, and that participation is voluntary.
HOW WILL CONFIDENTIALITY AND ANONYMITY OF USERS BE ENSURED IN THE STUDY?
All the data that users provide during the study will be handled confidentially. This means that access to the data will be strictly limited to the researchers, and the supervisors of the study. No identification of individual users will be linked to any of the data.
228

WHO CAN YOU CONTACT FOR ADDITIONAL INFORMATION REGARDING THE STUDY?
The primary investigator, Mr K Gush, can be contacted during office hours at Tel (012) 841-**** or on his cellular phone at 084*******.
A FINAL WORD
Your co-operation and participation in the study will be greatly appreciated. Please sign the underneath informed consent if you agree to partake in the study. In such a case, you will receive a copy of the signed informed consent from the researcher.
INFORMED CONSENT
I confirm that I have been adequately informed by the researcher about the nature, conduct, benefits and risks of the study. I have also received, read and understood the above written information. I am aware that the results of the study, will be anonymously processed into a research report. I understand that user participation is voluntary and that they may, at any stage, without prejudice, withdraw their consent and participation in the study.
Administrator's name: (Please print)
Administrator’s signature: Date:
Researcher’s name: (Please print)
Researcher’s signature: Date:
Participant's name:______________________________________________(Please Print)
I ______________________________________________ the parent / caretaker / legal guardian, give consent for the participant above (or for myself, if over 21) to be interviewed about usage of the Digital Doorway computer terminal
Parent's / Caretaker's / Guardian's signature or Participant’s own signature if participants is over 21
________________________________________ Date:____________________
229

230
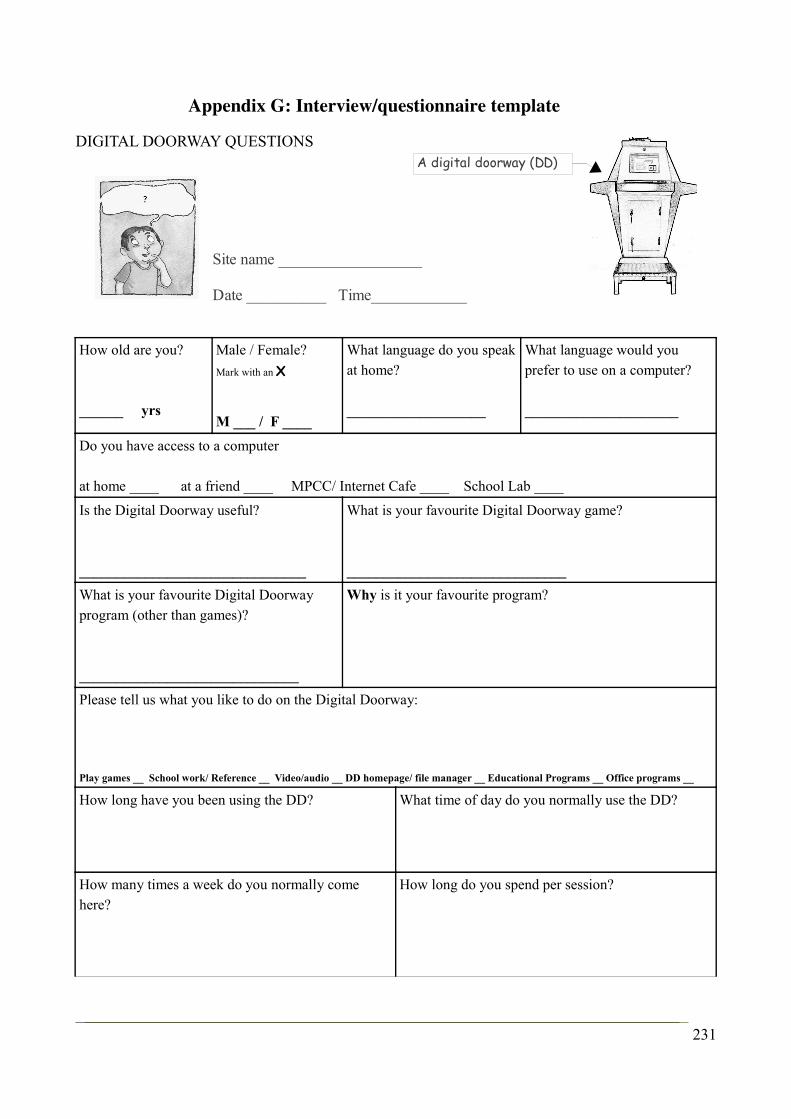
Appendix G: Interview/questionnaire template
DIGITAL DOORWAY QUESTIONS
How old are you?
______ yrs
Male / Female?
Mark with an X
M ___ / F ____
What language do you speak at home?
___________________
What language would you prefer to use on a computer?
_____________________
Do you have access to a computer
at home ____ at a friend ____ MPCC/ Internet Cafe ____ School Lab ____
Is the Digital Doorway useful?
_______________________________
What is your favourite Digital Doorway game?
______________________________
What is your favourite Digital Doorway program (other than games)?
______________________________
Why is it your favourite program?
Please tell us what you like to do on the Digital Doorway:
Play games __ School work/ Reference __ Video/audio __ DD homepage/ file manager __ Educational Programs __ Office programs __
How long have you been using the DD? What time of day do you normally use the DD?
How many times a week do you normally come here?
How long do you spend per session?
231
Site name __________________
Date __________ Time____________
A digital doorway (DD)
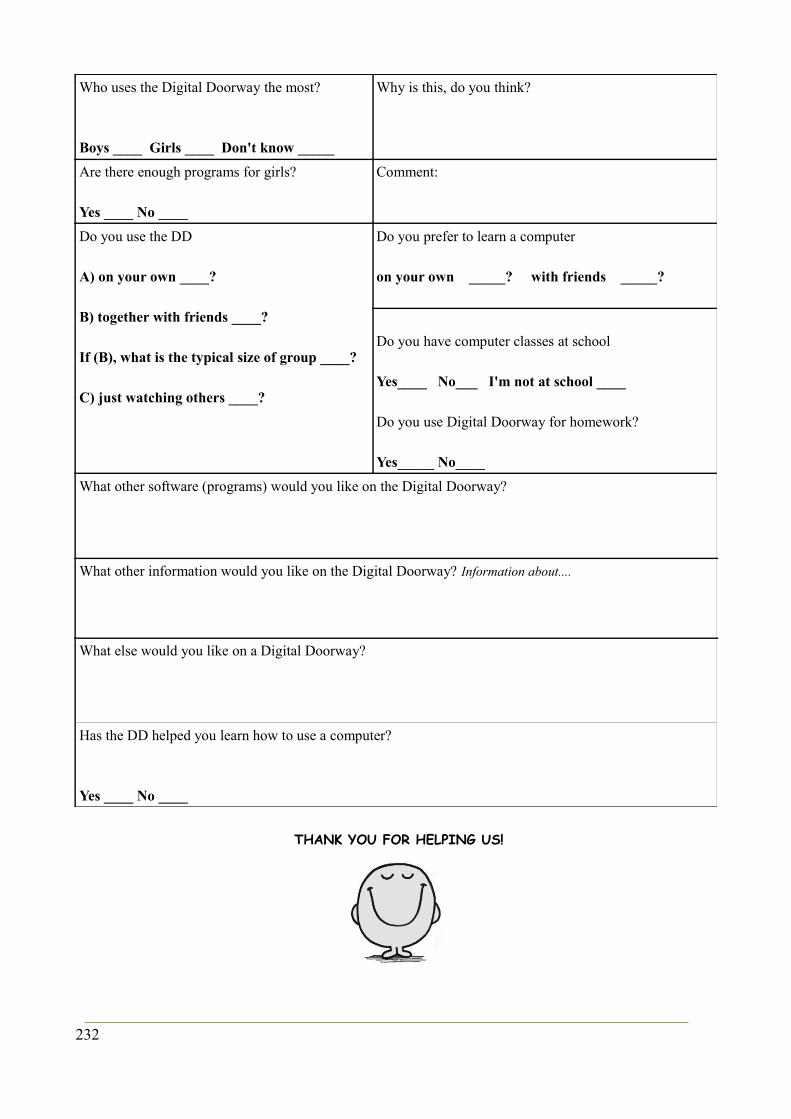
Who uses the Digital Doorway the most?
Boys ____ Girls ____ Don't know _____
Why is this, do you think?
Are there enough programs for girls?
Yes ____ No ____
Comment:
Do you use the DD
A) on your own ____? B) together with friends ____?
If (B), what is the typical size of group ____?
C) just watching others ____?
Do you prefer to learn a computer
on your own _____? with friends _____?
Do you have computer classes at school
Yes____ No___ I'm not at school ____
Do you use Digital Doorway for homework?
Yes_____ No____
What other software (programs) would you like on the Digital Doorway?
What other information would you like on the Digital Doorway? Information about....
What else would you like on a Digital Doorway?
Has the DD helped you learn how to use a computer?
Yes ____ No ____
THANK YOU FOR HELPING US!
232
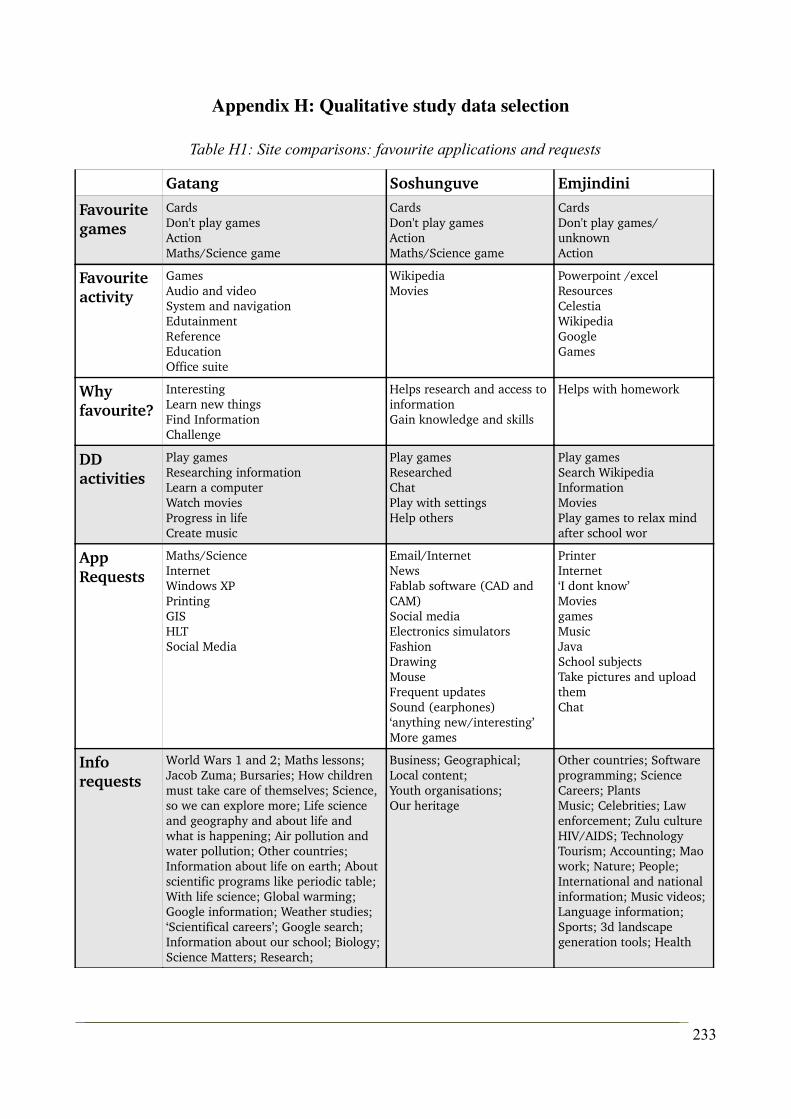
Appendix H: Qualitative study data selection
Table H1: Site comparisons: favourite applications and requests
Gatang Soshunguve Emjindini
Favourite games
CardsDon't play gamesActionMaths/Science game
CardsDon't play gamesActionMaths/Science game
CardsDon't play games/ unknownAction
Favourite activity
GamesAudio and videoSystem and navigationEdutainmentReferenceEducationOffice suite
WikipediaMovies
Powerpoint /excelResourcesCelestiaWikipediaGoogleGames
Why favourite?
InterestingLearn new thingsFind InformationChallenge
Helps research and access to informationGain knowledge and skills
Helps with homework
DD activities
Play gamesResearching informationLearn a computerWatch moviesProgress in lifeCreate music
Play gamesResearchedChatPlay with settingsHelp others
Play gamesSearch WikipediaInformationMoviesPlay games to relax mind after school wor
App Requests
Maths/ScienceInternetWindows XPPrintingGISHLTSocial Media
Email/InternetNewsFablab software (CAD and CAM)Social mediaElectronics simulatorsFashionDrawingMouseFrequent updatesSound (earphones)‘anything new/interesting’More games
PrinterInternet‘I dont know’MoviesgamesMusicJava School subjectsTake pictures and upload themChat
Info requests
World Wars 1 and 2; Maths lessons; Jacob Zuma; Bursaries; How children must take care of themselves; Science, so we can explore more; Life science and geography and about life and what is happening; Air pollution and water pollution; Other countries; Information about life on earth; About scientific programs like periodic table; With life science; Global warming; Google information; Weather studies; ‘Scientifical careers’; Google search; Information about our school; Biology; Science Matters; Research;
Business; Geographical;Local content;Youth organisations;Our heritage
Other countries; Software programming; ScienceCareers; PlantsMusic; Celebrities; Law enforcement; Zulu cultureHIV/AIDS; TechnologyTourism; Accounting; Mao work; Nature; People; International and national information; Music videos;Language information; Sports; 3d landscape generation tools; Health
233

Appendix I: Glossary and acronyms
ANOVA – Analysis of VarianceCSIR – Council for Scientific and Industrial ResearchDD – Digital DoorwayFET – Further Education and TrainingGPRS – General Packet Radio Service, (a cellular data transmission protocol)HITW – Hole in the WallHiWEL – Hole in the Wall Education LimitedICT – Information and Communication TechnologyICT4D – Information and Communication Technology for DevelopmentMIT – Massachusetts Institute of TechnologyMPCC – Multi Purpose Community CentreNIIT – National Indian Institute of TechnologyOLPC – One Laptop per ChildRQ1 to 4 – Research Questions 1 to 4
Shell Script - a text file that contains a sequence of commands for a Unix-based operating system1
Ubuntu Linux – A particular distribution of Linux maintained by the Canonical company
1 Definitions from: http://searchenterpriselinux.techtarget.com/
234
Appendix J: Attached CD contents
SPREADSHEETS:
Site_statistics.ods
RESULTS_AgeCat_Totals_LATEST.ods
RESULTS_Hits_AgeGroups_vs_Sites.ods
RESULTS_Specific_category_Hitcounts.ods
Data collated from site visits: Qual.ods
OTHER FILES
Categorised data for all users in selection of 10 quantitative sites: Final.txt
Full list of applications, all sites: Applications.txt
235
Related Documents