MARINE ECOLOGY PROGRESS SERIES Mar Ecol Prog Ser Vol. 510: 201–213, 2014 doi: 10.3354/meps10790 Published September 9 INTRODUCTION Much of fisheries research has been directed towards predicting annual recruitment of fish into a fishery. The Critical Period and Aberrant Drift hypotheses (Hjort 1914) inspired 20th-century re- cruitment fisheries oceanography research towards factors affecting the early life history of fish. The main factors believed to determine recruitment vari- ability now include the interactions of temperature and other physical processes on prey availability and larval condition, which in turn determine their vul- nerability to predators (Houde 2008). ‘It is now evi- dent that high and variable predation is the principal, [proximate] agent of mortality’ (Bailey & Houde 1989, Houde 2008, p 63). Many species of pelagic cnidarians and cteno- phores eat fish eggs and larvae (ichthyoplankton) (reviewed by Purcell 1985, Purcell & Arai 2001), yet studies on the magnitude of this predation remain rare. During the 1980s and 1990s, several studies quantified removal rates of ichthyoplankton by pe- lagic cnidarians and ctenophores in containers rang- ing in size from 25 to 6300 l (reviewed by Purcell & © Inter-Research 2014 · www.int-res.com *Corresponding author: [email protected] Digestion times and predation potentials of Pelagia noctiluca eating fish larvae and copepods in the NW Mediterranean Sea Jennifer E. Purcell 1, *, Uxue Tilves 2 , Verónica L. Fuentes 2 , Giacomo Milisenda 3 , Alejandro Olariaga 2 , Ana Sabatés 2 1 Western Washington University, Shannon Point Marine Center, 1900 Shannon Point Rd, Anacortes, WA 98221, USA 2 Institut de Ciències del Mar, CSIC, P. Marítim 37–49, 08003 Barcelona, Spain 3 Dipartimento di Scienze e Tecnologie Biologiche ed Ambientali, Università del Salento, 73100 Lecce, Italy ABSTRACT: Predation is the principal direct cause of mortality of fish eggs and larvae (ichthyo- plankton). Pelagic cnidarians and ctenophores are consumers of ichthyoplankton and zooplankton foods of fish, yet few estimates exist of predation effects in situ. Microscopic analyses of the gastric ‘gut’ contents of gelatinous predators reveal the types and amounts of prey eaten and can be used with digestion time (DT) to estimate feeding rates (prey consumed predator -1 time -1 ). We meas- ured the DT and recognition time (RT) of prey for Pelagia noctiluca, an abundant jellyfish with increasing blooms in the Mediterranean Sea. DT of fish larvae averaged 2.5 to 3.0 h for P. noctiluca (4-110 mm diameter) and was significantly related to jellyfish and larval sizes. In contrast, DT of fish eggs ranged from 1.2 to 44.8 h for jellyfish ≤22 mm diameter (‘ephyrae’), but DT was not sig- nificantly related to ephyra or egg diameter. Approximately half of the eggs ingested were not digested. DT of copepods averaged 4 h. We also measured DT and RT of salps, euphausiids, and miscellaneous zooplankton. Temperature (20-25°C) generally did not significantly affect DT of any prey. Estimated potential predation effects of ephyrae on fish larvae in the Catalan Sea in 1995 showed great variability among 9 stations (0-3.7% consumed h -1 ). We discuss how sampling methods contributed to variation in predation estimates and offer recommendations to improve accuracy. Our results enable estimation of predation on ichthyoplankton and competition for zoo- plankton prey, which can have extremely important effects on fish populations globally. KEY WORDS: Anchovy · Jellyfish · Salp · Fish eggs · Ichthyoplankton · Zooplankton · Competition Resale or republication not permitted without written consent of the publisher Contribution to the Theme Section ‘Jellyfish blooms and ecological interactions’ FREE REE ACCESS CCESS

Welcome message from author
This document is posted to help you gain knowledge. Please leave a comment to let me know what you think about it! Share it to your friends and learn new things together.
Transcript
MARINE ECOLOGY PROGRESS SERIESMar Ecol Prog Ser
Vol. 510: 201–213, 2014doi: 10.3354/meps10790
Published September 9
INTRODUCTION
Much of fisheries research has been directedtowards predicting annual recruitment of fish intoa fishery. The Critical Period and Aberrant Drifthypotheses (Hjort 1914) inspired 20th-century re -cruitment fisheries oceanography research towardsfactors affecting the early life history of fish. Themain factors believed to determine recruitment vari-ability now include the interactions of temperatureand other physical processes on prey availability andlarval condition, which in turn determine their vul-
nerability to predators (Houde 2008). ‘It is now evi-dent that high and variable predation is the principal,[proximate] agent of mortality’ (Bailey & Houde 1989,Houde 2008, p 63).
Many species of pelagic cnidarians and cteno -phores eat fish eggs and larvae (ichthyoplankton)(reviewed by Purcell 1985, Purcell & Arai 2001), yetstudies on the magnitude of this predation remainrare. During the 1980s and 1990s, several studiesquantified removal rates of ichthyoplankton by pe -lagic cnidarians and ctenophores in containers rang-ing in size from 25 to 6300 l (reviewed by Purcell &
© Inter-Research 2014 · www.int-res.com*Corresponding author: [email protected]
Digestion times and predation potentials of Pelagia noctiluca eating fish larvae and copepods
in the NW Mediterranean Sea
Jennifer E. Purcell1,*, Uxue Tilves2, Verónica L. Fuentes2, Giacomo Milisenda3, Alejandro Olariaga2, Ana Sabatés2
1Western Washington University, Shannon Point Marine Center, 1900 Shannon Point Rd, Anacortes, WA 98221, USA2Institut de Ciències del Mar, CSIC, P. Marítim 37–49, 08003 Barcelona, Spain
3Dipartimento di Scienze e Tecnologie Biologiche ed Ambientali, Università del Salento, 73100 Lecce, Italy
ABSTRACT: Predation is the principal direct cause of mortality of fish eggs and larvae (ichthyo-plankton). Pelagic cnidarians and ctenophores are consumers of ichthyoplankton and zooplanktonfoods of fish, yet few estimates exist of predation effects in situ. Microscopic analyses of the gastric‘gut’ contents of gelatinous predators reveal the types and amounts of prey eaten and can be usedwith digestion time (DT) to estimate feeding rates (prey consumed predator−1 time−1). We meas-ured the DT and recognition time (RT) of prey for Pelagia noctiluca, an abundant jellyfish withincreasing blooms in the Mediterranean Sea. DT of fish larvae averaged 2.5 to 3.0 h for P. noctiluca(4−110 mm diameter) and was significantly related to jellyfish and larval sizes. In contrast, DT offish eggs ranged from 1.2 to 44.8 h for jellyfish ≤22 mm diameter (‘ephyrae’), but DT was not sig-nificantly related to ephyra or egg diameter. Approximately half of the eggs ingested were notdigested. DT of copepods averaged 4 h. We also measured DT and RT of salps, euphausiids, andmiscellaneous zooplankton. Temperature (20−25°C) generally did not significantly affect DT ofany prey. Estimated potential predation effects of ephyrae on fish larvae in the Catalan Sea in1995 showed great variability among 9 stations (0−3.7% consumed h−1). We discuss how samplingmethods contributed to variation in predation estimates and offer recommendations to improveaccuracy. Our results enable estimation of predation on ichthyoplankton and competition for zoo-plankton prey, which can have extremely important effects on fish populations globally.
KEY WORDS: Anchovy · Jellyfish · Salp · Fish eggs · Ichthyoplankton · Zooplankton · Competition
Resale or republication not permitted without written consent of the publisher
Contribution to the Theme Section ‘Jellyfish blooms and ecological interactions’ FREEREE ACCESSCCESS

Mar Ecol Prog Ser 510: 201–213, 2014202
Arai 2001). The results of those studies were affectedby being conducted in artificial conditions (Purcell &Arai 2001). A second approach to estimate predationon ichthyoplankton by pelagic cnidarians and cteno -phores is to collect the predators in situ, thereby pre-serving their natural prey without experimental in-terference. Calculation of ingestion rates (prey eatenpredator−1 time−1) also requires estimation of the timeprey can still be recognized in gut contents; calcula-tion of predation effects (% prey standing stock con-sumed time−1) further requires information about theabundances of the predators and prey in situ.
Interest in gelatinous species has resurged re -cently, probably because of their increasing interfer-ence with human enterprises in coastal oceans (Pur-cell et al. 2007). One species of particular concern isthe holoplanktonic species Pelagia noctiluca that hascaused economic damage to aquaculture in northernEurope (Doyle et al. 2008, Raffaele 2013) and totourism, fisheries, aquaculture, and energy industriesin the Mediterranean (reviewed by Mariottini et al.2008, Canepa et al. 2014). P. noctiluca has a long his-tory of blooms in the Mediterranean Sea (Goy et al.1989) that appear to be increasing in frequency andduration (Daly Yahia et al. 2010, Kogovšek et al.2010, Licandro et al. 2010, Bernard et al. 2011).
P. noctiluca consumes a variety of prey, includingcopepods and other crustaceans, gelatinous zoo-plankton, pelagic mollusks, appendicularians, andfish eggs and larvae (Malej 1982, Vuctic 1982,Sabatés et al. 2010, Rosa et al. 2013). Copepods werethe most numerous prey consumed by ephyrae inthe NW Mediterranean Sea (Sabatés et al. 2010).Although fish larvae averaged <1% of the availablemesozooplankton, they ranged from 5 to 32% of theprey in ephyrae; anchovy Engraulis encrasicolus larvae were the most frequently consumed (Sabatéset al. 2010). Thus, P. noctiluca is potentially importantas a predator of ichthyoplankton and as a competitorof fish larvae and zooplanktivorous fish. Thoseeffects are pervasive but difficult to evaluate. Be -cause predation effects on prey populations increasewith pelagic cnidarian and ctenophore populationsizes (Purcell & Arai 2001, Purcell & Decker 2005),ichthyoplankton will likely suffer greater mortality aspopulations of these predators increase.
The in situ feeding rates of P. noctiluca were notcalculated from gut contents in previous studies dueto a lack of data on the digestion times of the variousprey types. During cruises of the FishJelly project in2011 and 2012, we measured digestion length oftime and the times prey could be recognized in thegastric pouches (‘guts’) of P. noctiluca medusae and
ephyrae. We emphasized ichthyoplankton, but alsoincluded common zooplankton organisms. Ourobjective was to measure digestion times in order touse this in formation in combination with gut contentdata for P. noctiluca collected at comparable temper-atures to calculate predator feeding rates and preda-tion effects on comparable prey. As an example, weused the gut content data for P. noctiluca ephyraefrom Sabatés et al. (2010) to estimate their potentialpredation on fish larvae and copepods off the Cata-lan coast (NW Mediterranean) in 1995.
MATERIALS AND METHODS
Digestion measurements of fish larvae, fish eggs,and zooplankton by Pelagia noctiluca medusae andephyrae were made in the Catalan Sea duringcruises on board the RV ‘García del Cid’ (17 June to4 July 2011 and 13 to 21 July 2012). Sea near-surfacetemperature and salinity were estimated by theship’s system. Near-ambient seawater temperature(T in °C) was maintained in the ship’s laboratory bymeans of near-surface water pumped into kreiselsand water baths containing the experimental con-tainers. Fish larvae, fish eggs, and zooplankton usedfor digestion measurements were selected undermagnification of a dissecting microscope from plank-ton tows of a 60 cm diameter bongo net with 300 µmmesh. Fish larvae were identified to the lowest taxonpossible. Anchovy eggs were identified to species bytheir oval shape. Fish larva total length (TL), copepodcephalothorax length, and fish egg diameter weremeasured to the nearest 0.1 mm with calipers withthe aid of a dissecting microscope immediately be -fore they were fed to P. noctiluca. Body lengths ofsalps (excluding protrusions) and other large specieswere measured to the nearest 0.5 mm. Fish larvallength was converted to dry mass by regressions forthe most similar taxa in Pepin (1995) and Rossi et al.(2006). Our methods, outlined below, were consid-ered ‘natural feeding’ as defined by FitzGeorge-Bal-four et al. (2013) and differed for medusae (observedvisually while in kreisels) and ephyrae (observedwith a dissecting microscope).
P. noctiluca medusae (>22 mm diameter) were col-lected at night from the surface with a long-handleddip net and placed immediately in a bucket with sea-water. They were kept on board in 300 l kreisels withweakly flowing seawater, as illustrated by Purcell etal. (2013). A prey item held with forceps and touchedto the oral arms was ingested quickly, and the inges-tion time was recorded. After ingestion, the prey item

Purcell et al.: Digestion and predation rates of Pelagia
was observed continuously to track its final location inthe gastric pouch. Thereafter, each rapidly digestingor transparent prey (i.e. fish larva, salp) was checkedvisually at ≤15 min intervals and each slowly digest-ing, conspicuous prey (i.e. euphausiid) at ≤60 minintervals. Only large fish larvae, euphausiids, andsalps were visible once ingested by the medusae;therefore, fish eggs and copepods were not tested onmedusae because they could not been seen afteringestion. The length of time that prey could still beseen in the guts was recorded and designated ‘recog-nition time’ (RT). Prey that could no longer be seenwere considered to be digested, and the time wasrecorded and de signated ‘digestion time’ (DT). Eges-tion of the prey remains was occasionally observed(error = 0 min). Otherwise, the error (% of DT) wascalculated from one-half of the final observation inter-val. After digestion of 1 prey item, each medusa wasfed another prey and the process was repeated. Me -du sae appeared to be healthy for 3 to 4 d in thekreisels and were not used for digestion estimatesafterwards. The swimming bell diameter then wasmeasured to the nearest 1 cm by placing the medusasubumbrella down on a ruler.
Because we could not determine whether fish lar-vae digested by medusae on the cruise would be rec-ognized in gut content analysis, we conducted anexperiment at the Institut de Ciències del Mar inBarcelona, Spain (Table 1). Medusae from laboratoryculture were placed in 300 l kreisels with weaklyflowing ambient seawater and each was given 1 fishlarva, as above. At 15 to 90 min intervals, 3 to 6 of themedusae were preserved in 5% formalin solution.Their gastric pouches were examined later with adissecting microscope to determine whether the preycould be recognized as a fish larva. This experimentwas conducted twice (18 and 25 July 2013) with 3species of larvae: anchovy Engraulis encrasicolus(Engraulidae), round sardinella Sardinella aurita(Clu pidae), and bullet tuna Auxis rochei (Scombri-
dae) that had been collected during the previousnight using a Bongo net (60 cm diameter, 300 and500 µm meshes) from nearby coastal waters. Theseresults were compared to the digestion observationsmade on board ship. Medusae in which the larvaecould no longer be seen were also included in theanalysis of digestion time.
P. noctiluca ephyrae and post-ephyrae with smalloral arms and tentacles (hereafter, all referred to as‘ephyrae,’ with a diameter ≤22 mm) were collected inshort surface hauls with a Neuston net (1.5 m2 mouth,1 mm mesh). Undamaged ephyrae were kept indi-vidually in 25 to 350 ml glass bowls or beakers inwhich they could swim freely, with container sizeincreasing with specimen size. A fish egg, larva, orzooplankter held with forceps and put in contact witheach ephyra was ingested quickly. This time of in -gestion was re corded, and each ephyra was checkedunder magnification of a dissecting microscope at5 to 60 min intervals, with prey requiring prolongeddigestion (fish eggs) being checked at the longerintervals. DT, RT, and % error were determined asdescribed for me dusae. Ephyral diameter was meas-ured to the nearest 1 mm with calipers under a dis-secting microscope. We used multiple linear regres-sions to test whether DT was related to T, P. noctilucadiameter, or prey size (largest dimension). Regres-sions were made only when sufficient data wereavailable. When data did not meet assumptions ofnormality and constant variance, we used log10
transformation before statistical analysis. One-wayANOVA was used to test for differences in digestiontimes among fish larval taxa and among fish eggdiameters. Digested and undigested eggs weretested for differences in ephyral sizes and egg sizeswith t-tests. When those data failed to meet assump-tions after transformation, we used a non-parametrict-test (Mann-Whitney rank sum test). All data werepresented as mean ± SD.
RESULTS
To test when larvae digested bymedusae (35.7 ± 2.1 mm diameter)could not be recognized as fish larvaewith microscopic examination, weexamined the gut contents of me du -sae preserved at intervals, as des cri -bed above (Table 1). All larvae wereeasily recognizable after 15 and30 min. The long, thin anchovy andround sardinella larvae could not be
203
Species Larval Time interval (min)length (mm) 15 30 45 60 90
Anchovy & round sardinella 7−9 6/6 6/6 2/11 0/9 NTBullet tuna 9−11 NT 3/3 3/3 3/3 0/6
Table 1. Numbers of single fish larvae recognizable in Pelagia noctilucamedusae following digestion and preservation at intervals of 15 to 90 min. Re-sults are shown as the number recognizable/number tested. Number of larvaedigested = number tested − number recognizable. ‘0’ indicates that all larvaewere completely digested. Temperature = 21.3°C. Species were anchovy En-graulis encrasicolus, round sardinella Sardinella aurita, bullet tuna Auxis rochei.
NT: not tested

Mar Ecol Prog Ser 510: 201–213, 2014
re cognized as fish larvae after 45 or 60 min. Thelarger bullet tuna larvae could still be recognized inthe gut contents after 45 or 60 min, but not after 90 minof digestion. Based on these results, we removeddigestion data for 5 anchovy larvae >10 mm long thatcould not be seen within swimming medusae on boardship after 30 min.
DTs of Pelagia noctiluca medusae and ephyrae fed1 fish larva averaged 2.5 to 3.0 h (Table 2). DTs of allmedusae and ephyrae combined were significantlyrelated to ephyral diameter (D) and larval length (L),but not to T (R2 = 0.258, F3,205 = 24.23, p < 0.001;log10D t = −8.33; p < 0.001; log10L t = 6.23; p < 0.001;T t = 0.66; p = 0.513; log10DT = 0.334 + 0.562 × log10L− 0.620 × log10D). DT of combined medusae andephyrae increased with larval length and de crea sed
with the diameter of P. noctiluca (Fig. 1). Be cause ourmethods differed for medusae (>22 mm diameter)and ephyrae (≤22 mm), we considered the 2 groupsseparately in further analyses.
DTs of both ephyrae and medusae were signifi-cantly related to diameter and larval length; DTswere shorter for smaller larvae and larger P. nocti -luca. DTs for fish larvae were not significantly relatedto T. Similar results were obtained for a multiple re -gression using larval dry mass (DM) instead oflength; however, the relationship with DM (R2 =0.288, F3,102 = 13.74, p < 0.001, log10 DM t = 3.85; p <0.001) was not as strong as with length (Table 2). TheDTs for ephyrae differed significantly (F5,101 = 346.36,p < 0.001) among different types of larvae (Table 3);pairwise comparisons of the DT of anchovy versus all
204
Jellyfish T (°C) Prey length DT (h) Error Regression statistics RT (h)Diameter (D, mm) n (L, mm) (%)
Medusae Fish larvae48.6 ± 20.6 63 22.7 ± 1.3 14.1 ± 6.5 2.1 ± 2.2 13.3 ± 12.5 R2 = 0.425 0.9 ± 0.8(25−110) (20.2−25.5) (5−30.0) (0.8−8.3) (0−50) F3,59 = 14.55; p < 0.001 (0.3−5.8)
Log10D t = −0.79; p = 0.432 NSLog10L t = 6.41; p < 0.001T t = −1.04; p = 0.300 NSLog10DT = 0.024 + 1.061 × log10L
Ephyrae Fish larvae13.4 ± 5.2 107 23.4 ± 0.9 5.9 ± 2.6 3.0 ± 1.7 20.6 ± 25.2 R2 = 0.319 1.2 ± 0.2(4−22) (20.7−24.4) (1.5−13.0) (0.3−8.3) (0−50) F3,103 = 15.89; p < 0.001 (0.2−5.8)
Log10D t = −2.73; p = 0.007Log10L t = 5.71; p < 0.001T t = −1.37; p = 0.172 NSlog10DT = 1.213 + 0.662 ×
log10L − 0.379 × log10D
Medusae Salps42.2 ± 11.4 30 22.2 ± 1.4 21.3 ± 12.0 2.0 ± 1.8 7.7 ± 9.0 R2 = 0.766 1.8 ± 1.1(15 − 60) (19.6−23.7) (1.5−40.0) (0.4−6.9) (0−35) F3,103 = 27.23; p < 0.001 (0.2−5.0)
D t = 0.66; p = 0.515 NSL t = 4.26; p < 0.001T t = −2.87; p = 0.008DT = 12.217 − 0.519 × T + 0.087 × L
Ephyrae Salps10.4 ± 0.6 5 23.4 ± 1.3 5.6 ± 2.6 3.2 ± 2.1 16.2 ± 8.8 NT 1.8 ± 1.4(10−11) (21.6−25.2) (4.0−10.0) (1.0−5.7) (5−29) (0.4−4.0)
Ephyrae 1 copepod11.8 ± 0.6 51 23.9 ± 0.7 1.3 ± 0.3 4.1 ± 1.3 10.2 ± 5.3 R2 = 0.131 2.2 ± 1.2(7−22) (22.3−25.0) (1.0−2.0) (1.2−7.8) (0−29) F3,44 = 2.20; p = 0.101 NS (0.7−5.0)
D t = −1.66; p = 0.105 NSL t = 1.20; p = 0.235 NST t = −1.10; p = 0. 276 NS
Ephyrae 2−4 copepods17.0 ± 3.6 4 23 1.1 4.1 ± 0.5 11.4 ± 5.2 NT 1.8 ± 0. 4(13−20) (3.4−4.7) (7−20) (1.3−2.1)
Table 2. Digestion time (DT) and recognition time (RT) for Pelagia noctiluca given single fish larvae, salps, and copepods un-less noted otherwise. Errors (% of DT) and multiple regression statistics are also given. Salps given to medusae were Salpafusiformis; those given to ephyrae were Thalia democratica. Data are presented means ± SD, with ranges in parentheses. T:
temperature; NS: not significant; NT: not tested

Purcell et al.: Digestion and predation rates of Pelagia
other types of larvae were significantly different(Holm-Sidak method, t = 18.12 to 29.63, p < 0.001),and DTs of goby larvae also differed significantlyfrom DTs of serranid and flatfish larvae (t = 3.08 and2.80, respectively, p < 0.01). Thus, long, thin larvae(anchovies, sardinellas, gobies) were digested morerapidly than short, thick larvae (scombrids, caran -gids, serranids, flatfish; Fig. 1). The lengths of timethat they were recognizable as fish larvae in the guts
(RTs) were approximately half of the DTs for bothmedusae and ephyrae.
Fish eggs were digested more slowly (1.2−44.8 h)than fish larvae by P. noctiluca ephyrae (Table 4,Fig. 2). About half of all eggs tested (29 of 56) wereegested undigested after many hours, but interest-ingly, all anchovy eggs were digested. The sizes ofephyrae that had not digested eggs did not differfrom those that had (t-test, t51 = 1.445, p = 0.155);
205
Jellyfish T (°C) Fish larvae DT (h) Error (%) RT (h)Diameter (mm) n length (mm)
Ephyrae Anchovy12.9 ± 5.0 64 23.1 ± 0.9 7.3 ± 2.4 3.5 ± 1.7 13.0 ± 10.2 1.3 ± 0.8(4−22) (20.7−24.4) (2.5−13.0) (0.8−8.3) (0−50) (0.2−5.8)
Serranid13.2 ± 0.6 6 24.2 ± 0.2 3.8 ± 0.11 2.7 ± 1.5 17.8 ± 6.9 1.8 ± 0.3(9−13) (23.7−24.4) (3.5−4.0) (1.3−2.6) (0−24) (1.4−2.2)
Round sardinella13.3 ± 4.2 7 23.7 ± 0.2 6.0 ± 1.4 1.7 ± 0.8 10.8 ± 7.9 0.8 ± 0.4(10−22) (23.3−24.4) (4.0−8.0) (1.0−2.8) (9−24) (0.4−1.5)
Goby9.8 ± 2.8 6 24.1 ± 0.5 2.2 ± 0.9 1.2 ± 0.9 35.0 ± 18.2 0.6 ± 0.3 (8−15) (23.5−24.4) (1.5−4.0) (0.5−2.7) (6−50) (0.3−1.1)
Scombrid, sciaenid, carangid13.5 ± 5.5 24 23.9 ± 0.8 3.6 ± 1.5 2.2 ± 1.2 22.0 ± 17.9 1.2 ± 0.6(7−22) (21.1−24.4) (1.5−7.0) (0.3−5.1) (0−50) (0.4−2.5)
Flatfish17.3 ± 5.8 6 23.8 ± 0.7 3.5 ± 0.6 2.8 ± 2.2 14.9 ± 19.0 1.3 ± 1.2(10−22) (23.0−24.4) (3.0−4.0) (0.9−5.6) (0−50) (0.2−3.2)
Table 3. Pelagia noctiluca ephyrae digestion time (DT) and recognition time (RT) of single fish larvae by taxon. Errors (% ofDT) are also given. Prey were anchovy Engraulis encrasicolus, serranid Serranus cabrilla, round sardinella Sardinella aurita,mackerel Trachurus mediterraneus, myctophid Ceratoscopelus maderensis, flatfish Aroglossus laterna, and unidentified
gobies, sciaenids, and carangids. Data are presented as means ± SD, with ranges in parentheses. T: temperature
Fig. 1. Digestion times of Pelagia noctiluca medusae and ephy rae of fish larvae by type: anchovy Engraulis encrasicolus, thinlarvae (sardinellas, gobies), thick larvae (caran gids, sciaenids, serranids, scombrids), and flatfish Aroglossus laterna with re-spect to (a) P. noctiluca diameter, and (b) fish larvae length. Trend lines are best fit linear regressions for all larvae. See Table 2
for multiple regression equations

Mar Ecol Prog Ser 510: 201–213, 2014
thus, small ephyral size did not explain why someeggs were not digested. Similarly, egg sizes did notdiffer between those digested or undigested (Mann- Whitney U = 296.50, p = 0.194) although no 1.0 or1.1 mm eggs were digested. To test whether eggswould be digested without the chorion, it was dis-sected from 4 of the 1 mm eggs, which otherwisewere not digested by ephyrae. These embryos weredigested rapidly by the ephyrae (1.78 ± 0.46 h;Fig. 2), suggesting that the chorion protected theeggs from digestion. DTs of eggs differed signifi-cantly by diameter (F3,29 = 5.68, p = 0.003), with0.8 mm eggs requiring longer to digest than all others. One 3 mm diameter egg was digested in22.4 h by a 22 mm ephyra. Neither DTs nor RTs of
undigested eggs were significantly related to ephyralsize, T, or egg size (F3,28 = 1.071, p = 0.377 and F3,22 =0.622, p = 0.608, respectively). RT of digested fisheggs were 75−85% of the DT for ephyrae, and RT ofundigested eggs were 100% of retention times.
DT and RT of copepods could only be measured forephyrae (Table 2). DTs of single copepods byephyrae averaged 4 h and were not significantlyrelated to prey or ephyral size, or T. We gave 2 to 4copepods only to 4 ephyrae, but average digestiontime remained ~4 h. RTs of copepods were about halfof the DTs for ephyrae.
Salps were very abundant and were eaten by me -dusae in 2011 (J. E. Purcell pers. obs.). DTs of largesalps Salpa fu si formis by medusae averaged 2 h and
206
Fish egg Digested eggs Undigested eggsdiameter Ephyra n DT (h) RT (h) Error (%) Ephyra n Retention (mm) (mm) (mm) (h)
0.6 [75%] 9.9 ± 3.1 9 8.2 ± 2.2 6.1 ± 2.1 15.8 ± 2.2 8.7 ± 1.5 3 12.1 ± 6.3(7−15) (4.3−10.6) (3.2−9.5) (13−20) (7−10) (5.2−17.5)
0.8 [45.2%] 12.1 ± 4.3 14 17.4 ± 12.0 14.8 ± 13.0 19.0 ± 18.8 9.8 ± 3.7 17 12.6 ± 7.9(8−22) (3.8−44.8) (2.3−43.0) (6−50) (5−20) (2.8−29.2)
0.8 anchovy [100%] 9.7 ± 0.5 6 8.5 ± 5.4 6.3 ± 3.1 19.8 ± 6.2 NA 0 NA(9−10) (1.2−17.8) (4.5−12.5) (15−30)
1.0 [0%] 8.0 ± 1.0 0 NA NA NA 8.0 ± 1.4 2 22.7 ± 1.0(7−9) (7−9) (22.0−23.4)
1.1 [0%] 13.3 ± 6.5 0 NA NA NA 15.0 ± 5.1 6 3.0 ± 0.9(7−20) (10−22) (1.8−4.2)
Table 4. Pelagia noctiluca ephyrae digestion time (DT) and recognition time (RT) of single fish eggs by diameter. Eggs 0.8 mmin diameter are presented in 2 groups (anchovy and those other than anchovy). Retention times are for undigested eggs thatwere egested. Errors (% of DT) are also given. Temperatures were 23.4 ± 0.5°C (22.3−25.2°C). Data are presented as means ±SD, with ranges in parentheses. Percentages of each egg size digested are in square brackets. Errors reflect digested and
undigested eggs; NA: not applicable
Fig. 2. (a) Pelagia noctiluca ephyral digestion and retention times of fish eggs with respect to egg diameter. Time (h) that eggswere inside ephyrae. (b) Size of ephyrae compared to size of digested and undigested eggs. In (b), ephyral diameters for di-gested eggs were offset by +0.3 mm and only 1 point is shown for anchovy (of 6 at 9−10 mm) to enable them to be better seen
Purcell et al.: Digestion and predation rates of Pelagia
were sig ni fi cantly related to salp length and tempera-ture (Table 2). The few salps Thalia democraticasmall enough to be ingested by ephyrae weredigested in ~3 h.
P. noctiluca eats a variety of zooplankton, but di -gestion times previously were unavailable. DTs ofeuphausiids (n = 10, 10−20 mm TL) by medusae aver-aged 5.0 ± 2.4 h. Velella velella colonies were eatenby medusae in situ (V. L. Fuentes et al. pers. obs.).DTs of 15 and 26 mm long colonies by 2 medusaewere ~3.7 h, and those of 1 to 3 mm long colonies by4 ephyrae were ~5.3 h. The chitin sail of V. velellawas still recognizable after egestion. The necto -phores of 2 polygastric colonies of the siphonophoreMuggiaea atlantica were egested with their firmmesoglea intact from medusae after 5.0 and 6.5 h.Cladocerans (Penilia sp. and Podon sp.) were diges -ted by ephyrae in 3.0 ± 1.7 h (n = 17). DTs of euphau-siid furcilia larvae (n = 13, 3−11 mm TL) for ephyraeaveraged 5.0 ± 0.9 h. DTs by ephyrae were short for2 appendicularians (<1 h) and 1 chaetognath (1−2 h).Coiled pteropods (n = 3, 0.5 mm), whose shells wererecognizable until egestion, were digested in ~4 h byephyrae. RTs of the crustaceans were 45 to 65% ofDTs. RTs of shelled pteropods and the cnidarianswere 100% of DT.
DISCUSSION
Digestion and recognition times
Gut contents of gelatinous predators in combina-tion with DT can be used to determine in situ preda-tion rates (prey consumed predator−1 time−1), and incombination with population densities of the preda-tors and prey, they can be used to estimate predationeffects (% prey consumed time−1). Even though Pela-gia noctiluca blooms in tropical to temperate oceansaround the world (Kramp 1961), few studies exist onDT. Gordoa et al. (2013) mentioned 18 ± 5 h as the DTof bluefin tuna Thunnus thynnus eggs by ‘burst feed-ing’ P. noctiluca ephyrae. We also only know the DTfor P. noctiluca medusae consuming Mnemiopsis lei-dyi ctenophores (Tilves et al. 2012).
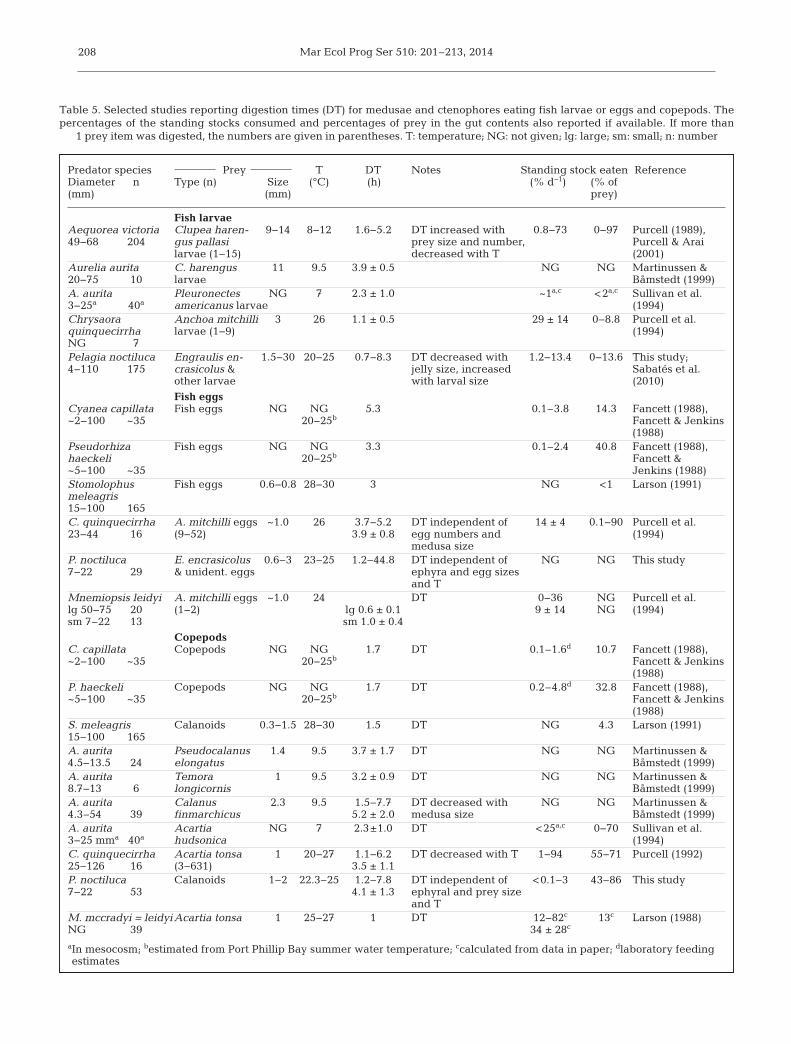
Martinussen & Båmstedt (2001) comprehensivelysummarized earlier studies on DTs of fish larvae, fisheggs, and zooplankton by gelatinous predators. TheDTs of fish larvae in our study were similar to those inother studies that included larvae and medusae ofcomparable sizes, even when the temperatures were10°C lower (Table 5). Few DTs were available for fisheggs, and no other studies used ephyrae and eggs.
DT of anchovy eggs by Chrysaora quinquecirrhamedusae (3.7−5.2 h, mean 4 h) and Stomolophusmeleagris (3 h) were within the range for P. noctilucaephyrae (1.2−17 h, mean 8.5 h), but shorter on aver-age. DTs of ~1 mm copepods by P. noctiluca ephyraewere similar to those of other species of comparablesizes even at temperatures that were 10°C lower(Table 5). Our results are also comparable to otherspecies digesting cladocerans and appendicularians.The cladoceran Evadne sp. was digested by Aureliaaurita ephyrae in 3.4 h at 4−5°C (Sullivan et al. 1997).Digestion of appendicularians was very rapid byhydromedusae (<2 h; Larson 1987b) and by S. melea-gris at 28−30°C (1.5 h; Larson 1991). We are unawareof other DTs for gelatinous predators of salps,pteropods, or stages of euphausiids other than eggsor nauplii (see Martinussen & Båmstedt 2001).
Our estimates of DT and RT in P. noctiluca wereconstrained by the numbers and sizes of medusaeavailable and the relatively narrow range of ambientseawater temperature. Too few medusae were pres-ent to allow repeated microscopic analysis to followdigestion over time, which could have damaged thespecimens, or to preserve them for gut analysis toconfirm complete digestion or recognition. P. nocti -luca inhabits a wide range of temperatures fromdeep waters at <14°C to the surface at >26°C in theMediterranean Sea. Therefore, DT and RT should bemeasured over that range of temperatures, whichlarge medusae traverse on daily vertical migrations.Because we followed prey items in swimming me -dusae, 2 problems resulted. First, the end-point ofdigestion was usually very subjective. Second, wewere unable to measure digestion of small prey(cope pods, most fish larvae, and fish eggs) bymedusae; therefore, additional experiments need tobe conducted in which digestion of prey can be mon-itored more precisely. Our study was also limited bymonitoring digestion of single prey items. Because oftheir small size, ephyrae may not catch several preyitems concurrently (but see Fig. 3); however, me -dusae usually contain numerous prey (J. E. Purcell &U. Tilves pers. obs.), which affected DT measured forsmall A. aurita (Martinussen & Båmstedt 2001, Fitz-George-Balfour et al. 2013).
The lack of digestion of about 50% of the fish eggsby ephyrae raised interesting questions. Althoughsmall ephyral size did not explain that phenomenon(Fig. 2b), we could not measure digestion of fish eggsby medusae because we could not visually followsuch small prey inside them. As ephyrae grew, thenumber and length of the digestive filaments in thegastric pouches increased (J. E. Purcell pers. obs.).
207
Mar Ecol Prog Ser 510: 201–213, 2014208
Predator species Prey T DT Notes Standing stock eaten ReferenceDiameter n Type (n) Size (°C) (h) (% d−1) (% of (mm) (mm) prey)
Fish larvaeAequorea victoria Clupea haren- 9−14 8−12 1.6−5.2 DT increased with 0.8−73 0−97 Purcell (1989), 49−68 204 gus pallasi prey size and number, Purcell & Arai
larvae (1−15) decreased with T (2001)Aurelia aurita C. harengus 11 9.5 3.9 ± 0.5 NG NG Martinussen & 20−75 10 larvae Båmstedt (1999)A. aurita Pleuronectes NG 7 2.3 ± 1.0 ~1a,c <2a,c Sullivan et al. 3−25a 40a americanus larvae (1994)Chrysaora Anchoa mitchilli 3 26 1.1 ± 0.5 29 ± 14 0−8.8 Purcell et al. quinquecirrha larvae (1−9) (1994)NG 7Pelagia noctiluca Engraulis en- 1.5−30 20−25 0.7−8.3 DT decreased with 1.2−13.4 0−13.6 This study; 4−110 175 crasicolus & jelly size, increased Sabatés et al.
other larvae with larval size (2010)
Fish eggsCyanea capillata Fish eggs NG NG 5.3 0.1–3.8 14.3 Fancett (1988), ~2−100 ~35 20−25b Fancett & Jenkins
(1988)Pseudorhiza Fish eggs NG NG 3.3 0.1–2.4 40.8 Fancett (1988), haeckeli 20−25b Fancett & ~5−100 ~35 Jenkins (1988)Stomolophus Fish eggs 0.6−0.8 28−30 3 NG <1 Larson (1991)meleagris15−100 165C. quinquecirrha A. mitchilli eggs ~1.0 26 3.7−5.2 DT independent of 14 ± 4 0.1−90 Purcell et al. 23−44 16 (9−52) 3.9 ± 0.8 egg numbers and (1994)
medusa sizeP. noctiluca E. encrasicolus 0.6−3 23−25 1.2−44.8 DT independent of NG NG This study7−22 29 & unident. eggs ephyra and egg sizes
and TMnemiopsis leidyi A. mitchilli eggs ~1.0 24 DT 0−36 NG Purcell et al. lg 50−75 20 (1−2) lg 0.6 ± 0.1 9 ± 14 NG (1994)sm 7−22 13 sm 1.0 ± 0.4
CopepodsC. capillata Copepods NG NG 1.7 DT 0.1–1.6d 10.7 Fancett (1988), ~2−100 ~35 20−25b Fancett & Jenkins
(1988)P. haeckeli Copepods NG NG 1.7 DT 0.2–4.8d 32.8 Fancett (1988), ~5−100 ~35 20−25b Fancett & Jenkins
(1988)S. meleagris Calanoids 0.3−1.5 28−30 1.5 DT NG 4.3 Larson (1991)15−100 165A. aurita Pseudocalanus 1.4 9.5 3.7 ± 1.7 DT NG NG Martinussen & 4.5−13.5 24 elongatus Båmstedt (1999)A. aurita Temora 1 9.5 3.2 ± 0.9 DT NG NG Martinussen & 8.7−13 6 longicornis Båmstedt (1999)A. aurita Calanus 2.3 9.5 1.5−7.7 DT decreased with NG NG Martinussen & 4.3−54 39 finmarchicus 5.2 ± 2.0 medusa size Båmstedt (1999)A. aurita Acartia NG 7 2.3±1.0 DT <25a,c 0−70 Sullivan et al. 3−25 mma 40a hudsonica (1994)C. quinquecirrha Acartia tonsa 1 20−27 1.1−6.2 DT decreased with T 1−94 55−71 Purcell (1992)25−126 16 (3−631) 3.5 ± 1.1P. noctiluca Calanoids 1−2 22.3−25 1.2−7.8 DT independent of <0.1−3 43−86 This study7−22 53 4.1 ± 1.3 ephyral and prey size
and TM. mccradyi = leidyi Acartia tonsa 1 25−27 1 DT 12−82c 13c Larson (1988)NG 39 34 ± 28c
aIn mesocosm; bestimated from Port Phillip Bay summer water temperature; ccalculated from data in paper; dlaboratory feedingestimates
Table 5. Selected studies reporting digestion times (DT) for medusae and ctenophores eating fish larvae or eggs and copepods. Thepercentages of the standing stocks consumed and percentages of prey in the gut contents also reported if available. If more than
1 prey item was digested, the numbers are given in parentheses. T: temperature; NG: not given; lg: large; sm: small; n: number

Purcell et al.: Digestion and predation rates of Pelagia
The ephyrae collected by Sabatés et al. (2010) didnot contain any fish eggs, although they were avail-able for consumption (A. Sabatés pers. obs.). There-fore, we do not know whether P. noctiluca medusae>22 mm would digest all fish eggs.
On the other hand, the fish eggs may be resistant todigestion. Baltic cod Gadus morhua callariasaduseggs were rejected by M. leidyi ctenophores; cteno -phores that had ingested eggs subsequently ejected12 of 14 eggs undigested after 2 h at 22°C and 3 d at7°C (Jaspers et al. 2011). Plaice Pleuronectes platessaeggs similarly were ingested, but were egested undi-gested ‘after some hours’ by Bolinopsis infundibulumctenophores (Gamble 1977). Most (98−99%) bivalveveligers were not digested or killed by C. quinquecir-rha medusae (Purcell et al. 1991). ‘Passing alive’ ofpelagic larvae of benthic invertebrates through theirpredators has been described previously (Milei -kovsky 1974), but we could find no further informa-tion about fish eggs. Unfortunately, we were unableto determine whether the eggs had been killed bythe ephyrae or remained viable.
Potential predation effects by Pelagia noctilucaon fish larvae and copepods
The DT and RT of P. noctiluca are valuable instru-ments for estimating predation on prey populations insitu. We, therefore, chose a study conducted in theCatalan Sea (Sabatés et al. 2010) to illustrate thismethod and problems we encountered. In the Sabatéset al. (2010) study, sampling was conducted on a tran-
sect perpendicular to the coast at 3 stations (Shelf:over the shelf; Front: over the slope at a shelf-breakfront; Open Sea: in the open sea) during 18 to 23 June1995. Sampling was repeated 3 times at each station,and temperature was measured at each station with aCTD. Zooplankton, jellyfish, and fish larvae weresampled by oblique tows of a 60 cm diameter bongonet with a flowmeter and 500 m mesh from near- bottom (70− 80 m) to the surface over the shelf or from200 m to the surface at the front and in the open sea(≥1000 m depth). The duration of the tows rangedfrom 6 min at shallow shelf stations to 23 min at thefront and open sea stations. Net samples were fixed ina 5% form aldehyde–seawater solution. P. nocti lucaephyrae (≤12 mm diameter), and fish larvae werecounted and identified to the lowest possible taxo-nomic level from whole preserved samples aided by adissecting micro scope. All copepods were coun tedfrom 1/256 to 1/32 aliquots obtained with a plank tonsplitter. The gut contents of all ephyrae in the sampleswere identified, counted, and measured; only partlydigested prey were included to ensure that the preyitems had not been captured while in the net.
Although Sabatés et al. (2010) presented averagepredation by location (Shelf, Front, Open Sea), wecalculated feeding at each of the 3 stations per loca-tion. Individual feeding rates of P. noctiluca ephyraeon fish larvae and copepods were calculated from thenumbers of each prey type in the gut contents at eachstation divided by the DT of 107 fish larvae or 53copepods at the mean surface water temperature in1995 (20.4°C), as calculated from mean prey sizesand regression equations in Table 2. Individual feed-ing rates were multiplied by ephyral densities anddivided by prey densities at each station to estimatethe effects of the ephyrae on the prey populations(% prey standing stock consumed h−1). To estimatethe potential daily predation at each location, weassumed that feeding and digestion were continuousover the 8 h periods represented by the samples ateach location (day, dawn/dusk, night) and multipliedthe hourly rates by 8 and then summed the 3 stations.
Estimates of potential predation by ephyrae on fishlarvae were highly variable among the 9 stations(Fig. 4). Ephyrae were much more abundant (13.4 m−3)at the Front at night (01:00 h) than at other stations(<1 m−3). The incidences of feeding (ephyrae withprey) at the Front were only 6 to 13%, probablyreflecting damage to the ephyrae and loss of prey inthe 200 m depth tows. Fish larvae were of averageabundance at that station, and the highest levels ofpredation (3.7% of the larvae h−1) occurred there atnight (Fig. 4). Although ephyrae were found at low
209
Fig. 3. Pelagia noctiluca ephyra collected from the surface atnight and immediately preserved on 4 July 2011. Theephyra contained 2 anchovy larvae (~10 mm long) and 1unidentified fish egg (0.9 mm diameter; indicated by arrow).
Ephyra preserved diameter is 7 mm

Mar Ecol Prog Ser 510: 201–213, 2014
densities on the Shelf (0−0.03 m−3), fish larval densi-ties were highest there (0.8−1.2 m−3), and feedingincidences were high (14−33%) where tows werefrom only 70 to 80 m depth. Fish larvae were found in
the ephyrae only at night (22:00 h) on the Shelf, whenwe estimated that 1.2% h−1 could have been con-sumed. In the Open Sea, ephyral densities, feedingincidences (9−10% in 200 m tows), and predationeffects were low (0−0.7% h−1; Fig. 4). Daily potentialpredation effects on fish larvae at each locationranged from 1.2 to 13.4% d−1; Table 6).
Estimated potential predation effects by P. nocti lucaephyrae on copepods were much lower than on fishlarvae (Fig. 4). Although copepods were very abun-dant at the Front station at night, the estimatedpotential predation effect was low (0.05% h−1) becauseof the low feeding incidence. The highest predationeffect (0.11% h−1) was at night on the shelf, againprobably because of the high feeding incidence(25%). The daily potential predation effects on cope-pods at each station ranged from 0.30 to 0.42% d−1;Table 6). The predation effects of ephyrae on cope-pods were much lower (≤0.42% d−1) than on fish lar-vae (≤13.4% d−1) due to the 50- to 500-fold greaterdensities of copepods.
Even though the sampling methods of Sabatés etal. (2010) were standard for fisheries oceanography,they illustrated some problems for estimating preda-tion effects on fish larvae by P. noctiluca. First, webelieve that the net sampling damaged the ephyraeand reduced their apparent feeding. That was indi-cated by the higher feeding incidence on the shallowshelf where tows were half as deep as at the otherstations. This likelihood also was clearly illustratedby the gut contents of ephyrae dipped from the sur-face in 2011 to 2012 (Fig. 3), which contained fisheggs and more fish larvae than in 1995. Additionally,the 60 cm diameter net was too small to adequatelysample the larger medusae. Thus, feeding by P. noc-tiluca was underestimated with these net samples.
Other biases in the predation estimates resulted be-cause the oblique tows of Sabatés et al. (2010) ob-scured the diel vertical migration patterns of P. noc-
210
Fig. 4. Abundances and predation effects of Pelagia nocti -luca ephyrae on fish larvae and copepods according to sta-tion (stn) and time of day in the northwestern MediterraneanSea during 18 to 23 June 1995. Three stations each wereover the shelf, at a shelf-break front, or in the open sea alonga transect perpendicular to the coast. (a) Ephyrae densities,(b) fish larvae densities, (c) predation effects on fish larvae,(d) copepod densities, and (d) predation effects on copepods
Prey type Location Prey in Ephyrae Prey guts examined consumed (n) (n) (% d−1)
Fish larvae Shelf 2 145 3.6Front 26 4400 13.4
Open sea 5 1135 1.2
Copepods Shelf 18 145 0.42Front 110 4400 0.31
Open sea 48 1135 0.31
Table 6. Estimated potential predation effects (% prey con-sumed d−1) of Pelagia noctiluca ephyrae on fish larvae andcopepods in the northwest Mediterranean Sea in June 1995

Purcell et al.: Digestion and predation rates of Pelagia 211
tiluca and their prey. The medusae are known to mi-grate near to the surface at night (Ferraris et al. 2012),and the ephyrae move near the surface during thenight (Gordoa et al. 2013; V. L. Fuentes et al. pers. obs.).Anchovy larvae also migrate towards the surface atnight (Sabatés et al. 2008). Thus, the oblique net towsin 1995 did not reflect the fine-scale patterns of over-lap of ephyrae and larvae over 24 h, which were notknown, but may have extended the duration of over-lap. The variable sampling times at the different sta-tions in 1995 also made predation estimates difficult tocompare. If we had used RT instead of DT to calculatepredation effects, the effects would have been ap-proximately doubled. We consider the predation esti-mates presented here to be rough approximations.
Thus, our recommendations for use of the gut- content method to estimate gelatinous predator con-sumption of ichthyoplankton and mesozooplanktonare as follows:
• Collect specimens for gut contents individually,not in plankton nets, and preserve them immediately.
• Collect gut-content specimens from all appropri-ate depths, not only at the surface.
• Appropriate sampling methods should be chosenwith consideration of the depth distribution patternsof predator and prey species during day and night.
• Use ambient temperature to measure digestionand recognition times.
• Different digestion methods may be best depend-ing on predator and prey characteristics (e.g. Purcellet al. 1991, FitzGeorge-Balfour et al. 2013).
• The duration between ingestion and when preycan still be recognized in microscopic gut-contentanalysis (RT) is the most appropriate measure for usein feeding estimates using gut contents.
• Use data for ephyral size and ichthyoplanktonspecies and size consumed for greatest accuracy.
• Determine densities, depths, and size distribu-tions of the gelatinous species and their prey to esti-mate predation effects (% prey standing stock con-sumed d−1).
Effects of gelatinous zooplankton as predators and competitors of fish
Surprisingly few studies have addressed consump-tion of fish eggs and larvae by gelatinous predators insitu. Whenever such studies were conducted, the pre-dation effects were substantial (reviewed by Purcell1985, Purcell & Arai 2001). Ichthyoplankton often con-stitutes large proportions of prey found in the gut con-tents (Table 5). P. noctiluca ephyrae and medusae
could be important predators of fish eggs and larvae.Larson (1987a) stated that fish eggs were the most nu-merous prey items in 50 medusae, with as many as 10eggs medusa−1. Sabatés et al. (2010) found that fish lar-vae represented ~12% of the prey items in ephyral gutcontents in the spring. Fish larvae and eggs re -presented 0.2 and 1.1%, respectively, of the prey inmedusae collected throughout a year (Rosa et al. 2013).Gelatinous predators have been demonstrated to re-duce populations of fish larvae (Purcell & Grover 1990).
Gelatinous predators consume a variety of fish species in the plankton, including commercially va lu -able species. The siphonophore Rhizophysa eysen -hardti consumed fish larvae in 5 families (Purcell1981). The scyphomedusae Cyanea capillata andPseu do rhiza haeckeli consumed 4 kinds of larvae andeggs (Fancett 1988). S. meleagris con sumed 4 kindsof eggs (Larson 1991). Similarly, the large hydrome-dusan Aequorea victoria consumed larvae of at least10 species of fishes and eggs of at least 3 species (Pur-cell 1989). Eight species of larvae were eaten byP. noctiluca ephyrae (Sabatés et al. 2010). Additionalstudies conducted since the reviews by Purcell (1985)and Purcell & Arai (2001) have shown that the cubo -medusae Chironex fleckeri, Tamoya hap lo nema, andChiropsalmus quadruma nus eat fish (Carrette et al.2002, Nogueira Júnior & Haddad 2008). Young fishand fish eggs represented 5.2 and 1.2%, respectively,of the prey items in the pleustonic hydrozoan Velellavelella (Purcell et al. 2012). Thus, the potential effectsof gelatinous pre dators on fish are great.
Mesozooplankters are the main components of thediets of many fish and pelagic cnidarians and cteno -phores, and dietary overlaps have been shown (Pur-cell & Grover 1990, Purcell & Sturdevant 2001, Bro -deur et al. 2008). The small percentages of thecope pod standing stocks consumed by P. noctilucaephyrae may seem unimportant, but the combinedpredation of the suite of gelatinous predators (Fu en -tes et al. 2010, Sabatés et al. 2010, Canepa et al. 2014)removes food that otherwise could be consumed byfish. Studies of in situ predation by gelatinous specieseating mesozooplankton are more numerous thanstudies on ichthyoplankton (e.g. Larson 1987b, 1988,Purcell 1997, 2009). Predation effects on mesozoo-plankton, primarily copepods, vary greatly depend-ing on the abundance of the predators (summarizedby Purcell & Arai 2001). Competition for prey re -quires that prey are limiting, and when abundant,pelagic cnidarians and cteno phores can reduce cope-pod populations (e.g. Purcell & Decker 2005).
We believe that existing evidence of gelatinousspecies as important predators of ichthyoplankton

Mar Ecol Prog Ser 510: 201–213, 2014
and mesozooplankton covers only a small fraction ofthe extent of their predation. Past studies have con-sidered only a few of the >1400 species of gelatinouspredators that inhabit all depths of estuaries andoceans (Purcell et al. 2007). The studies were con-ducted only in near-surface waters, whereas concen-trations of ichthyoplankton, mesozooplankton, andpredators often occur at sub-surface hydrographicdiscontinuities (clines) (Graham et al. 2001, Purcell etal. 2014). The studies have also been limited spatiallyand temporally. Although P. noctiluca has been stud-ied in only a few locations, primarily in Irish waters(Doyle et al. 2008, Bastian et al. 2011) and the Medi-terranean Sea, this species is found in tropical to tem-perate oceans around the world (Kramp 1961). Stud-ies suggest that blooms of P. noctiluca and otherspecies have increased in frequency and duration inthe Mediterranean Sea (Daly Yahia et al. 2010,Kogovšek et al. 2010, Licandro et al. 2010, Bernard etal. 2011). If cnidarian and ctenophore populationsincrease around the world, as evidence from somelocations suggests (Brotz et al. 2012, Condon et al.2013), there could be increasing predation on ichthyo -plankton and mesozooplankton and increasing detri-mental effects on fish populations.
Acknowledgements. We greatly appreciate the assistance ofthe crew of the RV ‘García del Cid’ and all the participantsduring the cruises. This study was supported by the projectMAR-CTM2010-18874. V.L.F. was funded by a JAE-DOCcontract of CSIC co-financed by the FSE (European SocialFund).
LITERATURE CITED
Bailey KM, Houde ED (1989) Predation on eggs and larvaeof marine fishes and the recruitment problem. Adv MarBiol 25: 1−83
Bastian T, Stokes D, Kelleher JE, Hays GC, Davenport J,Doyle TK (2011) Fisheries bycatch data provide insightsinto the distribution of the mauve stinger (Pelagia noc-tiluca) around Ireland. ICES J Mar Sci 68: 436−443
Bernard P, Berline L, Gorsky G (2011) Long term (1981–2008)monitoring of the jellyfish Pelagia noctiluca (Cni daria,Scyphozoa) on Mediterranean Coasts (Principality ofMonaco and French Riviera). J Oceanogr Res Data 4: 1−10
Brodeur RD, Suchman CL, Reese DC, Miller TW, Daly EA(2008) Spatial overlap and trophic interactions betweenpelagic fish and large jellyfish in the northern CaliforniaCurrent. Mar Biol 154: 649−659
Brotz L, Cheung WWL, Kleisner K, Pakhomov E, Pauly D(2012) Increasing jellyfish populations: trends in LargeMarine Ecosystems. Hydrobiologia 690: 3−20
Canepa A, Fuentes V, Sabatés A, Piraino S, Boero F, Gili JM(2014) Pelagia noctiluca in the Mediterranean Sea. In: Pitt KA, Lucas CH (eds) Jellyfish blooms. Springer Sci-ence+Business Media, Dordrecht, p 237−266
Carrette T, Alderslade P, Seymour J (2002) Nematocyst andprey in two Australian cubomedusans, Chironex fleckeriand Chiropsalmus sp. Toxicon 40: 1547−1551
Condon RH, Duarte CM, Pitt KA, Robinson KL and others(2013) Recurrent jellyfish blooms are a consequence ofglobal oscillations. Proc Natl Acad Sci USA 110: 1000–1005
Daly Yahia MN, Batistic M, Lu i D, Fernández de PuellesML and others (2010) Are outbreaks of Pelagia noctiluca(Forskål, 1771) more frequent in the Mediterraneanbasin? ICES Coop Rep 300: 8−14
Doyle TK, De Haas H, Cotton D, Dorschel B and others(2008) Widespread occurrence of the jellyfish Pelagianoctiluca in Irish coastal and shelf waters. J Plankton Res30: 963−968
Fancett MS (1988) Diet and prey selectivity of scyphomedu -sae from Port Phillip Bay, Australia. Mar Biol 98: 503−509
Fancett MS, Jenkins GP (1988) Predatory impact of scypho -medusae on ichthyoplankton and other zooplankton inPort Phillip Bay. J Exp Mar Biol Ecol 116: 63−77
Ferraris M, Berline L, Lombardi F, Guidi L and others (2012)Distribution of Pelagia noctiluca (Cnidaria, Scyphozoa)in the Ligurian Sea (NW Mediterranean Sea). J PlanktonRes 34: 874−885
FitzGeorge-Balfour T, Hirst AG, Lucas CH, Craggs J, WhelanEJ, Mombrikotb S (2013) Estimating digestion time ingelatinous predators: a methodological comparison withthe scyphomedusae Aurelia aurita. Mar Biol 160: 793−804
Fuentes VL, Angel DL, Bayha KM, Atienza D and others(2010) Blooms of the invasive ctenophore, Mnemiopsisleidyi, span the Mediterranean Sea in 2009. Hydrobio -logia 645: 23−37
Gamble JC (1977) Population structure, feeding, behavior,and fecundity of the lobate ctenophore Bolinopsis in fun -di bulum. International Council for the Exploration of theSea, Copenhagen
Gordoa A, Acuña JL, Farrés R, Bacher K (2013) Burst feed-ing of Pelagia noctiluca ephyrae on Atlantic bluefin tuna(Thunnus thynnus) eggs. PLoS ONE 8: e74721
Goy J, Morand P, Etienne M (1989) Long-term fluctuationsof Pelagia noctiluca (Cnidaria, Scyphomedusae) in thewestern Mediterranean Sea. Prediction by climatic vari-ables. Deep-Sea Res 36: 269−279
Graham WM, Pagès F, Hamner WM (2001) A physical con-text for gelatinous zooplankton aggregations: a review.Hydrobiologia 451: 199−212
Hjort J (1914) Fluctuations in the great fisheries of northernEurope viewed in the light of biological research. Rapp PV Reùn Cons Int Explor Mer 20: 1−228
Houde ED (2008) Emerging from Hjort’s shadow. J North-west Atl Fish Sci 41: 53−70
Jaspers C, Titelman J, Hansson LJ, Haraldsson M, DitlefsenCR (2011) The invasive ctenophore Mnemiopsis leidyiposes no direct threat to Baltic cod eggs and larvae. Lim-nol Oceanogr 56: 431−439
Kogovšek T, Bogunovi B, Malej A (2010) Recurrence ofbloom-forming scyphomedusae: wavelet analysis of a200-year time-series. Hydrobiologia 645: 81−96
Kramp PL (1961) Synopsis of the medusae of the world.J Mar Biol Assoc UK 40: 1−469
Larson RJ (1987a) A note on the feeding, growth, and repro-duction of the epipelagic scyphomedusa Pelagia nocti -luca (Forsskål). Biol Oceanogr 4: 447−454
Larson RJ (1987b) Daily ration and predation by medusaeand ctenophores in Saanich Inlet, B.C., Canada. Neth JSea Res 21: 35−44
212

Purcell et al.: Digestion and predation rates of Pelagia 213
Larson RJ (1988) Feeding and functional morphology of thelobate ctenophore Mnemiopsis mccradyi. Estuar CoastShelf Sci 27: 495−502
Larson RJ (1991) Diet, prey selection and daily ration of Stomolophus meleagris, a filter-feeding scyphomedusafrom the NE Gulf of Mexico. Estuar Coast Shelf Sci 32: 511−525
Licandro P, Conway DVP, Daly Yahia MN, Fernandez dePuelles ML and others (2010) A blooming jellyfish inthe northeast Atlantic and Mediterranean. Biol Lett 6: 688−691
Malej A (1982) Unusual occurrence of Pelagia noctiluca inthe Adriatic Sea. Acta Adriat 23: 97−102 (in Slovenian)
Mariottini GL, Giacco E, Pane L (2008) The mauve stingerPelagia noctiluca (Forsskål, 1775). Distribution, ecology,toxicity and epidemiology of stings. A review. Mar Drugs6: 496−513
Martinussen MB, Båmstedt U (1999) Nutritional ecology ofgelatinous planktonic predators. Digestion rate in rela-tion to type and amount of prey. J Exp Mar Biol Ecol 232: 61−84
Martinussen MB, Båmstedt U (2001) Digestion rate in rela-tion to temperature of two gelatinous planktonic preda-tors. Sarsia 86: 21−35
Mileikovsky SA (1974) On predation of pelagic larvae andearly juveniles of marine bottom invertebrates by adultbenthic invertebrates and their passing alive throughtheir predators. Mar Biol 26: 303−311
Nogueira Júnior M, Haddad MA (2008) The diet of cubo -medusae (Cnidaria, Cubozoa) in southern Brazil. Brazil JOceanogr 56: 157−164
Pepin P (1995) An analysis of the length-weight relationshipof larval fish: limitations of the general allometric model.Fish Bull 93: 419−426
Purcell JE (1981) Feeding ecology of Rhizophysa eysen-hardti, a siphonophore predator of fish larvae. LimnolOceanogr 26: 424−432
Purcell JE (1985) Predation on fish eggs and larvae bypelagic cnidarians and ctenophores. Bull Mar Sci 37: 739−755
Purcell JE (1989) Predation by the hydromedusa Aequoreavictoria on fish larvae and eggs at a herring spawningground in British Columbia. Can J Fish Aquat Sci 46: 1415−1427
Purcell JE (1992) Effects of predation by the scyphomedusanChrysaora quinquecirrha on zooplankton populations inChesapeake Bay, USA. Mar Ecol Prog Ser 87: 65−76
Purcell E (1997) Pelagic cnidarians and ctenophores as pred-ators: selective predation, feeding rates and effects onprey populations. Ann Inst Oceanogr Paris (Nouv Ser) 73: 125−137
Purcell JE (2009) Extension of methods for jellyfish andctenophore trophic ecology to large-scale research.Hydrobiologia 616: 23−50
Purcell JE, Arai MN (2001) Interactions of pelagic cnidariansand ctenophores with fishes: a review. Hydrobiologia451: 27−44
Purcell JE, Decker MB (2005) Effects of climate on relativepredation by scyphomedusae and ctenophores on cope-pods in Chesapeake Bay. Limnol Oceanogr 50: 376−387
Purcell JE, Grover JJ (1990) Predation and food limitation ascauses of mortality in larval herring at a spawningground in British Columbia. Mar Ecol Prog Ser 59: 55−61
Purcell JE, Sturdevant MV (2001) Prey selection and dietaryoverlap among zooplanktivorous jellyfish and juvenile
fishes in Prince William Sound, Alaska. Mar Ecol ProgSer 210: 67−83
Purcell JE, Cresswell FP, Cargo DG, Kennedy VS (1991) Differential ingestion and digestion of bivalve larvae bythe scyphozoan Chrysaora quinquecirrha and by thectenophore Mnemiopsis leidyi. Biol Bull (Woods Hole)180: 103−111
Purcell JE, Nemazie DA, Dorsey SE, Houde ED, Gamble JC(1994) Predation mortality of bay anchovy Anchoamitchilli eggs and larvae due to scyphomedusae andctenophores in Chesapeake Bay. Mar Ecol Prog Ser 114: 47−58
Purcell JE, Uye S, Lo WT (2007) Anthropogenic causes of jellyfish blooms and direct consequences for humans: areview. Mar Ecol Prog Ser 350: 153−174
Purcell JE, Clarkin E, Doyle TK (2012) Foods of Velellavelella (Cnidaria: Hydrozoa) in algal rafts and its distri-bution in Irish seas. Hydrobiologia 690: 47−55
Purcell JE, Baxter EJ, Fuentes VL (2013) Jellyfish as prod-ucts and problems of aquaculture. In: Allan G, Burnell G(eds) Advances in aquaculture hatchery technology.Woodhead Publishing Series in Food Science, Technol-ogy and Nutrition No. 242. Woodhead Publishing, Cam-bridge, p 404−430
Purcell JE, Decker MB, Breitburg DL, Broughton KJ (2014)Fine-scale vertical distributions of Mnemiopsis leidyictenophores: predation on copepods relative to stratifica-tion and hypoxia. Mar Ecol Prog Ser 500:103–120
Raffaele G (2013) Jellyfish destroys thousands farmedsalmon. Available at www.fis.com/fis/worldnews/ worldnews. asp ? monthyear =&day=22& id= 64287&l =e&special = & ndb=1%20target= (accessed 22 Oct 2013)
Rosa S, Pansera M, Granata A, Guglielmo L (2013) Inter -annual variability, growth, reproduction and feedingof Pelagia noctiluca (Cnidaria: Scyphozoa) in theStraits of Messina (Central Mediterranean Sea): link-ages with temperature and diet. J Mar Syst 111−112: 97−107
Rossi S, Sabatés A, Latasa M, Reyes E (2006) Lipid biomark-ers and trophic linkages between phytoplankton, zoo-plankton and anchovy (Engraulis encrasicolus) larvae inthe NW Mediterranean. J Plankton Res 28: 551−562
Sabatés A, Zaragoza N, Grau C, Salat J (2008) Vertical dis-tribution of early developmental stages in two coexistingclupeoid species, Sardinella aurita and Engraulis encra-sicolus. Mar Ecol Prog Ser 364: 169−180
Sabatés A, Pagès F, Atienza D, Fuentes VL, Purcell JE, GiliJM (2010) Planktonic cnidarian distribution and feedingof Pelagia noctiluca from near shore to open sea in theNW Mediterranean. Hydrobiologia 645: 153−165
Sullivan BK, Garcia JR, Klein-MacPhee G (1994) Prey selec-tion by the scyphomedusan predator Aurelia aurita. MarBiol 121: 335−341
Sullivan BK, Suchman CL, Costello JH (1997) Mechanics ofprey selection by ephyrae of the scyphomedusa Aureliaaurita. Mar Biol 130: 213−222
Tilves U, Fuentes V, Marambio M, Canepa A, Olariaga A,Gili JM, Purcell JE (2012) Predation by the scyphozoanPelagia noctiluca on Mnemiopsis leidyi ctenophoresin the NW Mediterranean Sea. J Plankton Res 35: 218−224
Vuctic T (1982) Unusual occurrence of jellyfish Pelagia noc-tiluca in the Adriatic. Influence of the water massesdynamic on the distribution of the jellyfish Pelagia in theAdriatic. Acta Adriat 23: 1−2
Submitted: November 18, 2013; Accepted: March 17, 2014 Proofs received from author(s): May 9, 2014
Related Documents