This article appeared in a journal published by Elsevier. The attached copy is furnished to the author for internal non-commercial research and education use, including for instruction at the authors institution and sharing with colleagues. Other uses, including reproduction and distribution, or selling or licensing copies, or posting to personal, institutional or third party websites are prohibited. In most cases authors are permitted to post their version of the article (e.g. in Word or Tex form) to their personal website or institutional repository. Authors requiring further information regarding Elsevier’s archiving and manuscript policies are encouraged to visit: http://www.elsevier.com/copyright

Welcome message from author
This document is posted to help you gain knowledge. Please leave a comment to let me know what you think about it! Share it to your friends and learn new things together.
Transcript

This article appeared in a journal published by Elsevier. The attachedcopy is furnished to the author for internal non-commercial researchand education use, including for instruction at the authors institution
and sharing with colleagues.
Other uses, including reproduction and distribution, or selling orlicensing copies, or posting to personal, institutional or third party
websites are prohibited.
In most cases authors are permitted to post their version of thearticle (e.g. in Word or Tex form) to their personal website orinstitutional repository. Authors requiring further information
regarding Elsevier’s archiving and manuscript policies areencouraged to visit:
http://www.elsevier.com/copyright
Author's personal copy
Research paper
Diffuse CO2 emission rate from Pululahua and the lake-filled Cuicocha calderas,Ecuador
Eleazar Padrón a,⁎, Pedro A. Hernández a, Theofilos Toulkeridis b, Nemesio M. Pérez a, Rayco Marrero a,Gladys Melián a, Giorgio Virgili c, Kenji Notsu d
a Environmental Research Division, ITER, 38611 Granadilla de Abona, S.C. de Tenerife, Spainb Center of Geology, Volcanology and Geodynamics, Universidad San Francisco de Quito (USFQ), Campus Cumbayá, Via Interoceanica y Jardines del Este, A.P. 17-12-841, Quito, Ecuadorc WEST Systems, Via Molise 3 Z.Ind. Gello, IT 56025 Pontedera (PI) Italyd Laboratory for Earthquake Chemistry, Graduate School of Science, The University of Tokyo, Hongo, Bunkyo-Ku 113-0033, Tokyo, Japan
a b s t r a c ta r t i c l e i n f o
Article history:Received 28 February 2007Accepted 2 November 2007Available online 4 January 2008
Keywords:diffuse CO2 degassingcaldera lakeEcuadorCuicochaPululahua
We report herein the first results of two soil CO2 efflux surveys carried out at Cuicocha lake-filled andPululahua caldera volcanic systems, Ecuador. A total of 172 and 217 soil CO2 efflux measurements were takenat the surface environment of Pululahua and Cuicocha calderas respectively, by means of the “accumulationchamber” method during the summer of 2006 to constrain the total CO2 output from the studied area. SoilCO2 efflux values ranged from non-detectable up to 48.5 and 141.7 g m− 2 d− 1 for Cuicocha and Pululahuacalderas respectively. In addition, probability graphs were used to distinguish the existence of differentgeochemical populations. Sequential Gaussian Simulation was used to construct an average map for 100simulations and to compute the total CO2 emission at each studied area: 106 and 270 t d− 1 (metric tons perday) for Cuicocha (13.3 km2) and Pululahua (27.6 km2) volcanoes respectively.
© 2007 Elsevier B.V. All rights reserved.
1. Introduction
During the last two decades, the study of the spatial distribution ofsoil CO2 efflux has became an ideal geochemical tool for monitoringvolcanic activity (Hernández et al., 2001a,b; Rogie et al., 2001;Brombach et al., 2001; Hernández et al., 2006a,b; Granieri et al.,2006; Melián et al., 2006). Several authors have demonstrated thatcontinuous monitoring of CO2 efflux provides important informationfor volcanic surveillance and seismotectonic monitoring (Rogie et al.,2001; Salazar et al., 2002; Carapezza et al., 2004; Pérez et al., 2006).Other studies have shown that diffuse CO2 emissions from activevolcanoes are of the same order of magnitude as the CO2 released byvisible emanations, pointing out the importance of estimating thetotal diffuse CO2 output from volcanic areas (Baubron et al., 1990;Allard et al., 1991; Allard, 1992; Chiodini et al., 1996; Giammanco et al.,1998; Hernández et al., 1998 and 2001a,b; Salazar et al., 2001). Sincethe emission rate of diffuse CO2 emission can increase greatly beforethe occurrence of a volcanic eruption (Hernández et al., 2001a,b;Carapezza et al., 2004), it is very important to estimate the total outputof this gas regularly in order to have a better understanding of which
volcanic processes are occurring and to map surface CO2 effluxanomalies (Toutain et al., 1992; Salazar et al., 2001).
Due to the low solubility of CO2 in silicate melts at low andmoderate pressure (Gerlach and Graeber, 1985), CO2 has become agood tracer of subsurface magma degassing. As CO2 travels upward byadvective–diffusive transport mechanisms and escapes at groundsurface, changes over time in its spatial efflux pattern provideimportant information about subsurface magma movement.
This work presents the first results of two CO2 diffuse degassingsurveys carried out in July 2006 at two Ecuadorian calderas: Cuicochawith a volcanic lake and Pululahua. Themain goals of this work are: 1)to study the spatial distribution of diffuse CO2 degassing at these twocalderas and 2) to estimate the total output of CO2 emitted into theatmosphere from both calderas and its relation to the level of volcanicactivity.
2. Tectonics and geological setting
The northern Andes in Ecuador are part of the 7000 km long classicexample of an active continental margin along the South Americancontinent with several volcanic sequences of Mesozoic and Cenozoicages. Generally, this North Andean volcanic zone demonstrates acommon increase in the abundance of calcalkaline rocks within thevolcanic belt with increasing crustal thickness (Barberi et al., 1988).These variations are also displayed within the observed geotectonic
Journal of Volcanology and Geothermal Research 176 (2008) 163–169
⁎ Corresponding author. Present address: Environmental Research Division, ITER.38611 Granadilla, S/C de Tenerife, Spain. Tel.: +34 922 391000; fax: +34 922 391001.
E-mail address: [email protected] (E. Padrón).
0377-0273/$ – see front matter © 2007 Elsevier B.V. All rights reserved.doi:10.1016/j.jvolgeores.2007.11.023
Contents lists available at ScienceDirect
Journal of Volcanology and Geothermal Research
j ourna l homepage: www.e lsev ie r.com/ locate / jvo lgeores
Author's personal copy
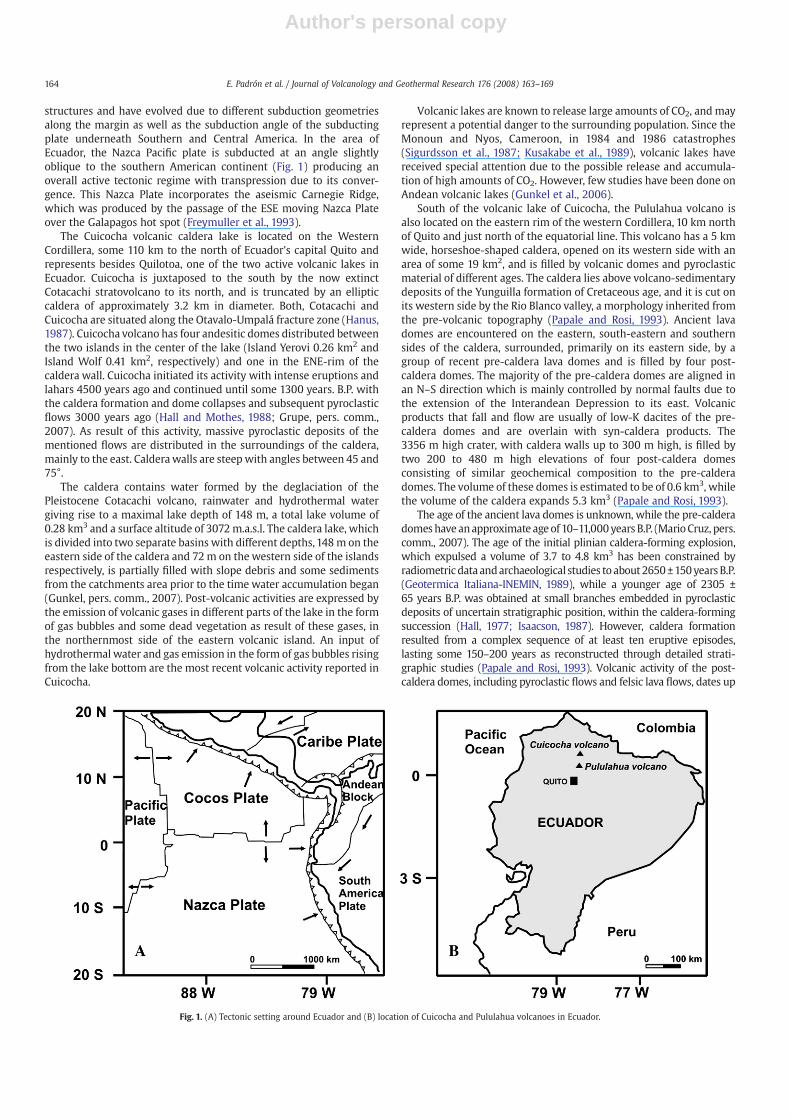
structures and have evolved due to different subduction geometriesalong the margin as well as the subduction angle of the subductingplate underneath Southern and Central America. In the area ofEcuador, the Nazca Pacific plate is subducted at an angle slightlyoblique to the southern American continent (Fig. 1) producing anoverall active tectonic regime with transpression due to its conver-gence. This Nazca Plate incorporates the aseismic Carnegie Ridge,which was produced by the passage of the ESE moving Nazca Plateover the Galapagos hot spot (Freymuller et al., 1993).
The Cuicocha volcanic caldera lake is located on the WesternCordillera, some 110 km to the north of Ecuador's capital Quito andrepresents besides Quilotoa, one of the two active volcanic lakes inEcuador. Cuicocha is juxtaposed to the south by the now extinctCotacachi stratovolcano to its north, and is truncated by an ellipticcaldera of approximately 3.2 km in diameter. Both, Cotacachi andCuicocha are situated along the Otavalo-Umpalá fracture zone (Hanus,1987). Cuicocha volcano has four andesitic domes distributed betweenthe two islands in the center of the lake (Island Yerovi 0.26 km2 andIsland Wolf 0.41 km2, respectively) and one in the ENE-rim of thecaldera wall. Cuicocha initiated its activity with intense eruptions andlahars 4500 years ago and continued until some 1300 years. B.P. withthe caldera formation and dome collapses and subsequent pyroclasticflows 3000 years ago (Hall and Mothes, 1988; Grupe, pers. comm.,2007). As result of this activity, massive pyroclastic deposits of thementioned flows are distributed in the surroundings of the caldera,mainly to the east. Calderawalls are steep with angles between 45 and75°.
The caldera contains water formed by the deglaciation of thePleistocene Cotacachi volcano, rainwater and hydrothermal watergiving rise to a maximal lake depth of 148 m, a total lake volume of0.28 km3 and a surface altitude of 3072m.a.s.l. The caldera lake, whichis divided into two separate basins with different depths, 148m on theeastern side of the caldera and 72 m on the western side of the islandsrespectively, is partially filled with slope debris and some sedimentsfrom the catchments area prior to the time water accumulation began(Gunkel, pers. comm., 2007). Post-volcanic activities are expressed bythe emission of volcanic gases in different parts of the lake in the formof gas bubbles and some dead vegetation as result of these gases, inthe northernmost side of the eastern volcanic island. An input ofhydrothermal water and gas emission in the form of gas bubbles risingfrom the lake bottom are the most recent volcanic activity reported inCuicocha.
Volcanic lakes are known to release large amounts of CO2, andmayrepresent a potential danger to the surrounding population. Since theMonoun and Nyos, Cameroon, in 1984 and 1986 catastrophes(Sigurdsson et al., 1987; Kusakabe et al., 1989), volcanic lakes havereceived special attention due to the possible release and accumula-tion of high amounts of CO2. However, few studies have been done onAndean volcanic lakes (Gunkel et al., 2006).
South of the volcanic lake of Cuicocha, the Pululahua volcano isalso located on the eastern rim of the western Cordillera, 10 km northof Quito and just north of the equatorial line. This volcano has a 5 kmwide, horseshoe-shaped caldera, opened on its western side with anarea of some 19 km2, and is filled by volcanic domes and pyroclasticmaterial of different ages. The caldera lies above volcano-sedimentarydeposits of the Yunguilla formation of Cretaceous age, and it is cut onits western side by the Rio Blanco valley, a morphology inherited fromthe pre-volcanic topography (Papale and Rosi, 1993). Ancient lavadomes are encountered on the eastern, south-eastern and southernsides of the caldera, surrounded, primarily on its eastern side, by agroup of recent pre-caldera lava domes and is filled by four post-caldera domes. The majority of the pre-caldera domes are aligned inan N–S direction which is mainly controlled by normal faults due tothe extension of the Interandean Depression to its east. Volcanicproducts that fall and flow are usually of low-K dacites of the pre-caldera domes and are overlain with syn-caldera products. The3356 m high crater, with caldera walls up to 300 m high, is filled bytwo 200 to 480 m high elevations of four post-caldera domesconsisting of similar geochemical composition to the pre-calderadomes. The volume of these domes is estimated to be of 0.6 km3, whilethe volume of the caldera expands 5.3 km3 (Papale and Rosi, 1993).
The age of the ancient lava domes is unknown, while the pre-calderadomeshaveanapproximate ageof 10–11,000years B.P. (MarioCruz, pers.comm., 2007). The age of the initial plinian caldera-forming explosion,which expulsed a volume of 3.7 to 4.8 km3 has been constrained byradiometric data andarchaeological studies to about2650±150yearsB.P.(Geotermica Italiana-INEMIN, 1989), while a younger age of 2305 ±65 years B.P. was obtained at small branches embedded in pyroclasticdeposits of uncertain stratigraphic position, within the caldera-formingsuccession (Hall, 1977; Isaacson, 1987). However, caldera formationresulted from a complex sequence of at least ten eruptive episodes,lasting some 150–200 years as reconstructed through detailed strati-graphic studies (Papale and Rosi, 1993). Volcanic activity of the post-caldera domes, including pyroclastic flows and felsic lava flows, dates up
Fig. 1. (A) Tectonic setting around Ecuador and (B) location of Cuicocha and Pululahua volcanoes in Ecuador.
164 E. Padrón et al. / Journal of Volcanology and Geothermal Research 176 (2008) 163–169
Author's personal copy
to 1665 years B.P. as determined by the C14 dating of paleosoil situated atthe base of a late pyroclastic flow (Mario Cruz, unpubl.).
3. Procedures and methods
Two CO2 efflux surveys were performed during the summer of 2006under ideal weather conditions (no wind and sunny). These conditionsprovided minimal soil gas variations, eliminating disturbances such assoilmoisture during themeasurements.172 and217 sampling siteswereselected at Pululahua and Cuicocha calderas, respectively, to obtain ahomogeneous pattern distribution and taking into consideration thelocal geology, structure and accessibility. At Cuicocha, 105 of the totalsampling pointsweremeasured at thewater surface of the lake. Soil CO2
effluxmeasurements sites were selected to cover both caldera areas andtheirmarginswith a site spacing about 100m.Measurements of soil CO2
efflux were performed in-situ by means of two different devices basedon the accumulation chamber method (Parkinson, 1981; Chiodini et al.,1998): a portablenondispersive infrared (NDIR)CO2 analyzer LICOR-800system and an improved version of the classical West Systems portable
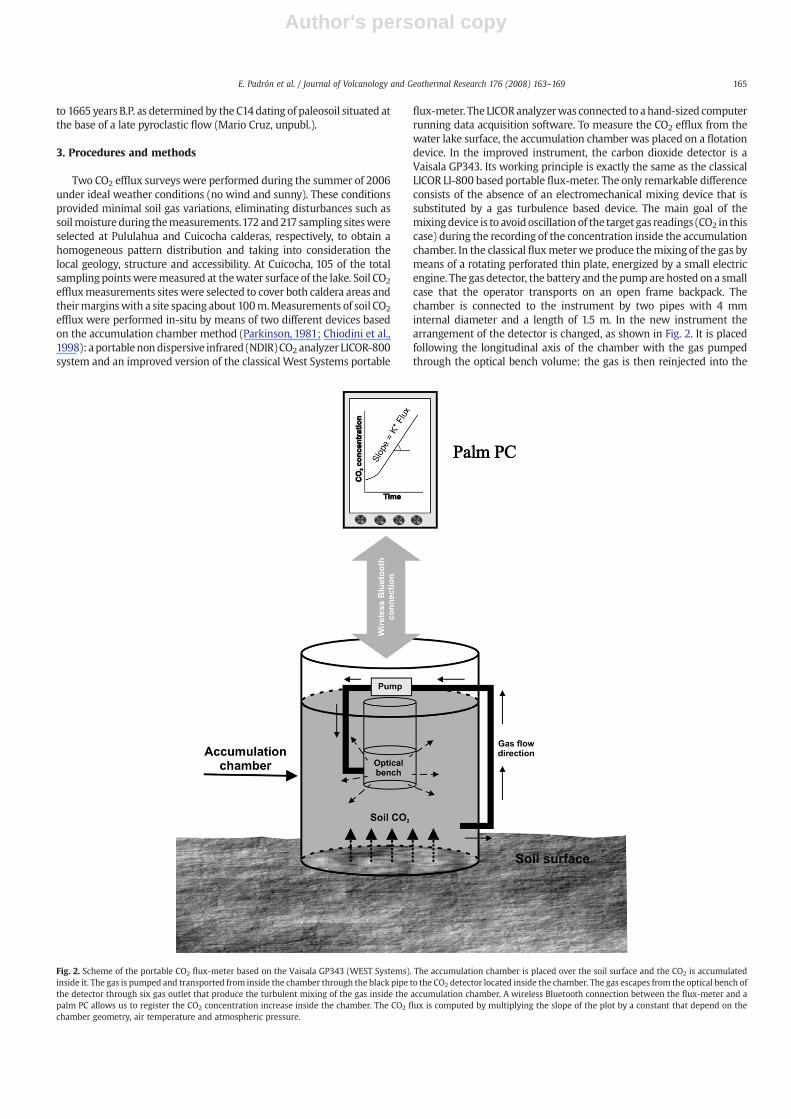
flux-meter. The LICORanalyzerwas connected to ahand-sized computerrunning data acquisition software. To measure the CO2 efflux from thewater lake surface, the accumulation chamber was placed on a flotationdevice. In the improved instrument, the carbon dioxide detector is aVaisala GP343. Its working principle is exactly the same as the classicalLICOR LI-800 based portable flux-meter. The only remarkable differenceconsists of the absence of an electromechanical mixing device that issubstituted by a gas turbulence based device. The main goal of themixingdevice is to avoid oscillation of the target gas readings (CO2 in thiscase) during the recording of the concentration inside the accumulationchamber. In the classical fluxmeterwe produce themixing of the gas bymeans of a rotating perforated thin plate, energized by a small electricengine. The gas detector, the battery and the pump are hosted on a smallcase that the operator transports on an open frame backpack. Thechamber is connected to the instrument by two pipes with 4 mminternal diameter and a length of 1.5 m. In the new instrument thearrangement of the detector is changed, as shown in Fig. 2. It is placedfollowing the longitudinal axis of the chamber with the gas pumpedthrough the optical bench volume: the gas is then reinjected into the
Fig. 2. Scheme of the portable CO2 flux-meter based on the Vaisala GP343 (WEST Systems). The accumulation chamber is placed over the soil surface and the CO2 is accumulatedinside it. The gas is pumped and transported from inside the chamber through the black pipe to the CO2 detector located inside the chamber. The gas escapes from the optical bench ofthe detector through six gas outlet that produce the turbulent mixing of the gas inside the accumulation chamber. A wireless Bluetooth connection between the flux-meter and apalm PC allows us to register the CO2 concentration increase inside the chamber. The CO2 flux is computed by multiplying the slope of the plot by a constant that depend on thechamber geometry, air temperature and atmospheric pressure.
165E. Padrón et al. / Journal of Volcanology and Geothermal Research 176 (2008) 163–169

Author's personal copy
chamber through six nozzles oriented to generate a turbulent flowinside the chamber that produces a mixing. This new arrangementallows a substantial reduction of “dead volumes” that can cause “slow”
response time of the instrument and also reduces the device's weight.Themicrocontroller thatmanages the system, the battery and the pumpare hosted in a round box on the top of chamber. The instrument ismanaged by a palmtop computer with a wireless Bluetooth connection.
The efficiency of the new mixing device was demonstrated by thelinearity of the measured concentration versus time curves and by thecorrect instrument response during the lab test: before the actualimplementation of the instrument in the field, several laboratory andon-field tests were performed, firstly by WEST Systems and later bythe ITER group, imposing a flux with a mass flow controller in the lab,comparing the reading of the new instrument with the ones of theLI820 based flux-meter.
With the aim of obtaining a better experimental variogram and toallow the estimation of the total diffuse CO2 output, the samplingdistribution of Pululahua volcano was improved through the intro-duction of 34 synthetic points. The assigned values for the points weredivided in three groups: 1) sixteen points located on the south outsidethe caldera, with an assigned value of 4 g m− 2 d− 1 (mean valuemeasured outside of the caldera), 2) ten points located on the southside of the inner caldera domes, with an assigned value of 8 g m− 2 d− 1
(mean value measured at this area), and 3) eight points located on thenorthwest side of the caldera, with an assigned value of 4 g m−2 d−1
(mean value measured at this area).
4. Results and discussion
Diffuse CO2 efflux values ranged from non detectable to 48.5 and141.7 g m− 2 d− 1 for Cuicocha and Pululahua, respectively. Probability-plot technique (Tennant and White, 1959; Sinclair, 1974) was appliedto the entire CO2 efflux data sets to check whether the Log of the datacame from unimodal or polymodal distributions. The probability plottechnique consists of plotting the data (or the logarithm of the data)against the cumulative frequency percent on a probability scale,arranged so that a normal (Gaussian) cumulative distribution plots asa straight line. A bimodal distribution consisting of two Log-normalpopulations plots as a curve. The inflection point of the curve allows usto distinguish the threshold value between both populations.
Two distinct modes were found at both volcanic systems: normal Iand normal II. These two distinct populations are known as backgroundand peak, respectively. The graphical analysis (Fig. 3A) showed twodifferent populations for Cuicochavolcano,with amean of 4.1 gm− 2 d− 1
for the background population (normal I), which represented 71% of thetotal data and a peak population (normal II), 29% of the total data,showing a mean of 17.3 g m− 2 d− 1. The Pululahua volcano probability-plot (Fig. 3B) showed two different populations, background (normal I)and peak (normal II) populationwith ameans of 8.4 and 84.3 gm− 2 d− 1,respectively, representing 98.3% and 1.7% of the total data. The higherbackgroundandpeak populationsmeasured for Pululahuamight be dueto the trapping of CO2 by the Cuicocha lake water. This would produce alower total emission at Cuicocha relative to Pululahua volcano.
The existence of two different geochemical populations of theefflux data suggests a deep perturbation of the volcanic system for
Fig. 3. Probability-plot of the CO2 efflux data measured at Cuicocha (A) and Pululahua(B). Numerals I and II indicate the different Log-normal modes found at each studiedarea. At each study, solid black circles indicate the original data, open circles indicate thebackground population and open triangles indicate the peak population.
Fig. 4. Experimental variogram and variogram model applied to the normal scoretransformed CO2 efflux data for Cuicocha (A) and Pululahua (B) volcanoes.
166 E. Padrón et al. / Journal of Volcanology and Geothermal Research 176 (2008) 163–169
Author's personal copy
both the Cuicocha and Pululahua volcanoes. Advection might be theresponsible transport mechanism to explain the observed, relativelyhigh, CO2 efflux values. The background CO2 efflux values could bemainly characterized by a biogenic CO2which is mainly transported bydiffusion (Chiodini et al., 2001).
Soil CO2 efflux datawere used to construct spatial distributionmapsfor both volcanic systems using Sequential Gaussian Simulation (SGS)provided by the sgsim program (Deutsch and Journel, 1998; Cardelliniet al., 2003). The SGS procedure allows one to both interpolate the soilCO2 efflux at not-sampled sites and assess the uncertainty of the totaldiffuse emission of carbon dioxide estimated for the entire studied area.
The procedure of the SGS program is composed of the followingsteps: 1) normal score transformation of the original data to transformthe data in a normal population, 2) experimental variogram computa-tion of the normal score transformed data, 3) variogram modelassignation to the experimental variogram, 4) sequential Gaussiansimulation of N equiprobable realizations and 5) back-transforming thenormal score data into simulated values of the original variable.
The experimental variograms were fitted with a spherical modelusing the following parameters: nugget 0.30 and 0.35 for Cuicochaand Pululahua respectively, and a range of 800 m for both volcanoes(Fig. 4 A and B). Following the variogrammodel, 100 simulations wereperformed over a grid of 21326 and 44113 squared cells (25 m × 25 m)for Cuicocha and Pululahua respectively. An average map wasconstructed for each studied area using the average of the differentvalues simulated at each cell (Figs. 5 and 6).
4.1. Spatial distribution of CO2 efflux
To estimate the total diffuse CO2 output released from both volcanicsystems, we considered the contribution of each cell obtained after SGSfor each volcanic system and the average of the 100 simulations to
estimate the total output and one standard deviation as the uncertainty.The average results and the standarddeviationwere 106±5 and270 ±19metric tons per day of diffuse CO2 released by Cuicocha and Pululahuacalderas, respectively. The total amount per area unit is very similar forboth volcanic systems: 8.0 and 9.8 t km− 2 d− 1 for Cuicocha andPululahua respectively.
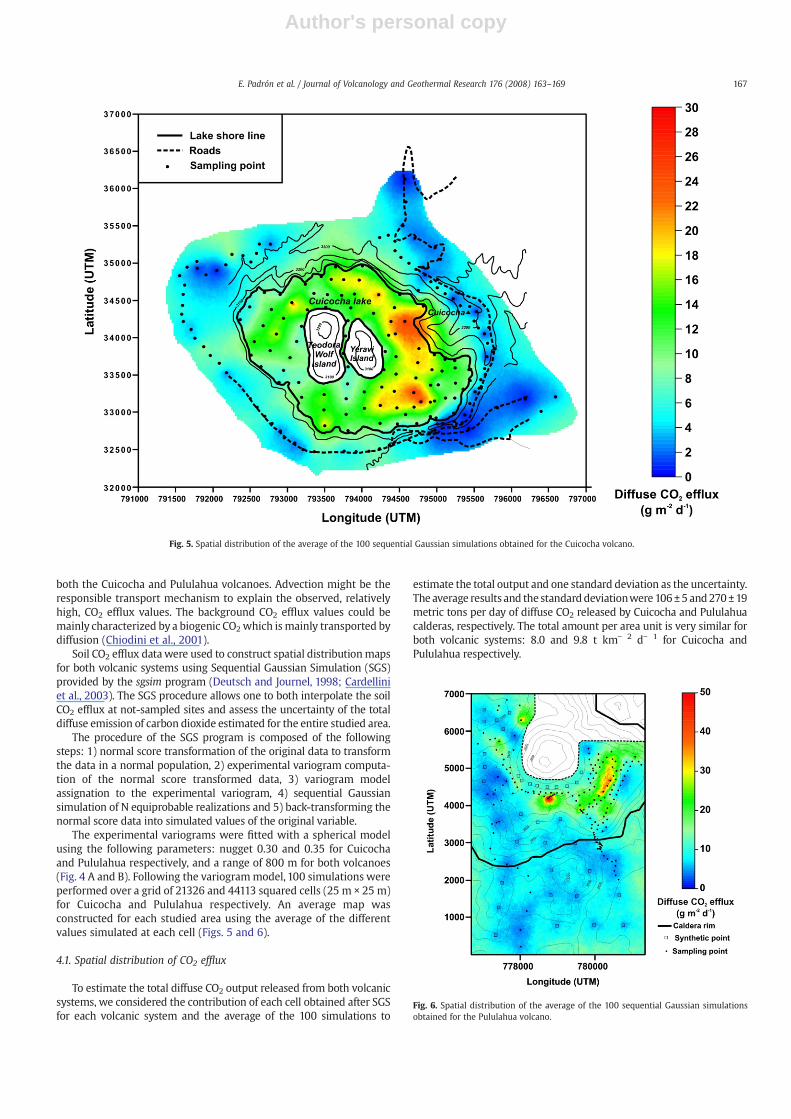
Fig. 5. Spatial distribution of the average of the 100 sequential Gaussian simulations obtained for the Cuicocha volcano.
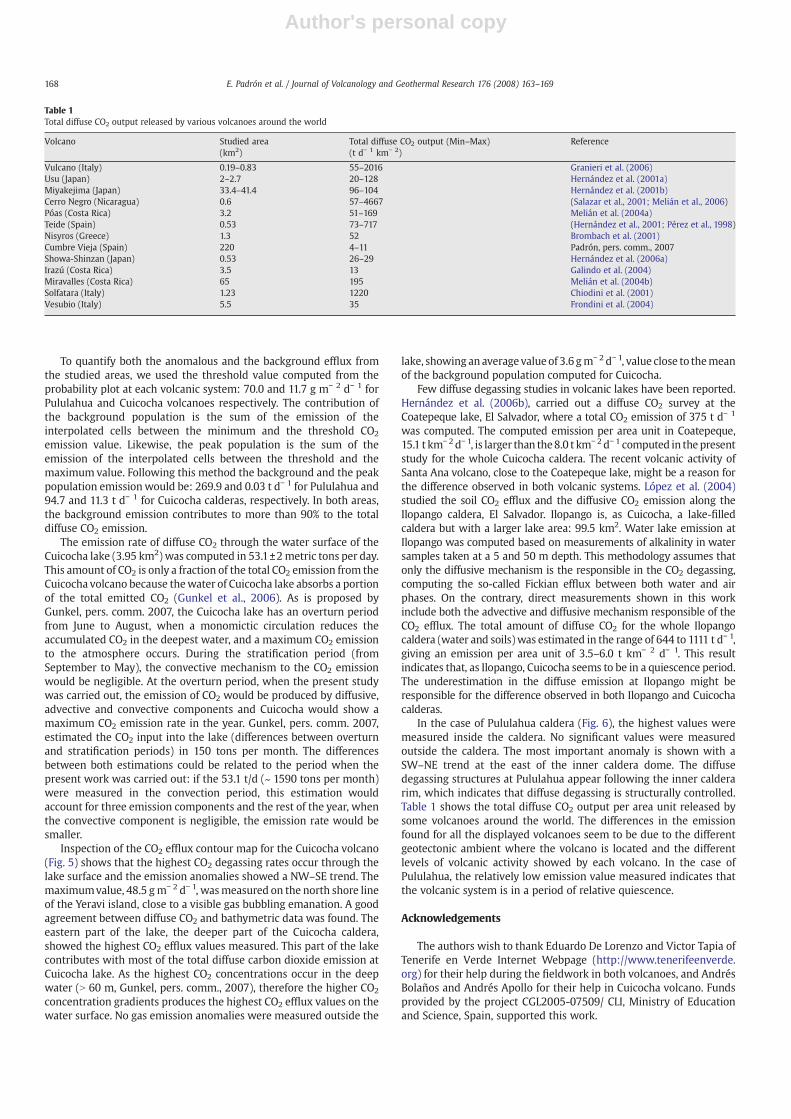
Fig. 6. Spatial distribution of the average of the 100 sequential Gaussian simulationsobtained for the Pululahua volcano.
167E. Padrón et al. / Journal of Volcanology and Geothermal Research 176 (2008) 163–169
Author's personal copy
To quantify both the anomalous and the background efflux fromthe studied areas, we used the threshold value computed from theprobability plot at each volcanic system: 70.0 and 11.7 g m− 2 d− 1 forPululahua and Cuicocha volcanoes respectively. The contribution ofthe background population is the sum of the emission of theinterpolated cells between the minimum and the threshold CO2
emission value. Likewise, the peak population is the sum of theemission of the interpolated cells between the threshold and themaximum value. Following this method the background and the peakpopulation emissionwould be: 269.9 and 0.03 t d− 1 for Pululahua and94.7 and 11.3 t d− 1 for Cuicocha calderas, respectively. In both areas,the background emission contributes to more than 90% to the totaldiffuse CO2 emission.
The emission rate of diffuse CO2 through the water surface of theCuicocha lake (3.95 km2) was computed in 53.1±2metric tons per day.This amount of CO2 is only a fraction of the total CO2 emission from theCuicocha volcano because thewater of Cuicocha lake absorbs a portionof the total emitted CO2 (Gunkel et al., 2006). As is proposed byGunkel, pers. comm. 2007, the Cuicocha lake has an overturn periodfrom June to August, when a monomictic circulation reduces theaccumulated CO2 in the deepest water, and a maximum CO2 emissionto the atmosphere occurs. During the stratification period (fromSeptember to May), the convective mechanism to the CO2 emissionwould be negligible. At the overturn period, when the present studywas carried out, the emission of CO2 would be produced by diffusive,advective and convective components and Cuicocha would show amaximum CO2 emission rate in the year. Gunkel, pers. comm. 2007,estimated the CO2 input into the lake (differences between overturnand stratification periods) in 150 tons per month. The differencesbetween both estimations could be related to the period when thepresent work was carried out: if the 53.1 t/d (~ 1590 tons per month)were measured in the convection period, this estimation wouldaccount for three emission components and the rest of the year, whenthe convective component is negligible, the emission rate would besmaller.
Inspection of the CO2 efflux contour map for the Cuicocha volcano(Fig. 5) shows that the highest CO2 degassing rates occur through thelake surface and the emission anomalies showed a NW–SE trend. Themaximumvalue, 48.5 gm− 2 d− 1, wasmeasured on the north shore lineof the Yeravi island, close to a visible gas bubbling emanation. A goodagreement between diffuse CO2 and bathymetric data was found. Theeastern part of the lake, the deeper part of the Cuicocha caldera,showed the highest CO2 efflux values measured. This part of the lakecontributes with most of the total diffuse carbon dioxide emission atCuicocha lake. As the highest CO2 concentrations occur in the deepwater (N 60 m, Gunkel, pers. comm., 2007), therefore the higher CO2
concentration gradients produces the highest CO2 efflux values on thewater surface. No gas emission anomalies were measured outside the
lake, showing an average value of 3.6 gm− 2 d− 1, value close to themeanof the background population computed for Cuicocha.
Few diffuse degassing studies in volcanic lakes have been reported.Hernández et al. (2006b), carried out a diffuse CO2 survey at theCoatepeque lake, El Salvador, where a total CO2 emission of 375 t d− 1
was computed. The computed emission per area unit in Coatepeque,15.1 t km− 2 d− 1, is larger than the8.0 t km− 2 d− 1 computed in thepresentstudy for the whole Cuicocha caldera. The recent volcanic activity ofSanta Ana volcano, close to the Coatepeque lake, might be a reason forthe difference observed in both volcanic systems. López et al. (2004)studied the soil CO2 efflux and the diffusive CO2 emission along theIlopango caldera, El Salvador. Ilopango is, as Cuicocha, a lake-filledcaldera but with a larger lake area: 99.5 km2. Water lake emission atIlopango was computed based on measurements of alkalinity in watersamples taken at a 5 and 50 m depth. This methodology assumes thatonly the diffusive mechanism is the responsible in the CO2 degassing,computing the so-called Fickian efflux between both water and airphases. On the contrary, direct measurements shown in this workinclude both the advective and diffusive mechanism responsible of theCO2 efflux. The total amount of diffuse CO2 for the whole Ilopangocaldera (water and soils) was estimated in the range of 644 to 1111 t d− 1,giving an emission per area unit of 3.5–6.0 t km− 2 d− 1. This resultindicates that, as Ilopango, Cuicocha seems to be in a quiescence period.The underestimation in the diffuse emission at Ilopango might beresponsible for the difference observed in both Ilopango and Cuicochacalderas.
In the case of Pululahua caldera (Fig. 6), the highest values weremeasured inside the caldera. No significant values were measuredoutside the caldera. The most important anomaly is shown with aSW–NE trend at the east of the inner caldera dome. The diffusedegassing structures at Pululahua appear following the inner calderarim, which indicates that diffuse degassing is structurally controlled.Table 1 shows the total diffuse CO2 output per area unit released bysome volcanoes around the world. The differences in the emissionfound for all the displayed volcanoes seem to be due to the differentgeotectonic ambient where the volcano is located and the differentlevels of volcanic activity showed by each volcano. In the case ofPululahua, the relatively low emission value measured indicates thatthe volcanic system is in a period of relative quiescence.
Acknowledgements
The authors wish to thank Eduardo De Lorenzo and Victor Tapia ofTenerife en Verde Internet Webpage (http://www.tenerifeenverde.org) for their help during the fieldwork in both volcanoes, and AndrésBolaños and Andrés Apollo for their help in Cuicocha volcano. Fundsprovided by the project CGL2005-07509/ CLI, Ministry of Educationand Science, Spain, supported this work.
Table 1Total diffuse CO2 output released by various volcanoes around the world
Volcano Studied area(km2)
Total diffuse CO2 output (Min–Max)(t d− 1 km− 2)
Reference
Vulcano (Italy) 0.19–0.83 55–2016 Granieri et al. (2006)Usu (Japan) 2–2.7 20–128 Hernández et al. (2001a)Miyakejima (Japan) 33.4–41.4 96–104 Hernández et al. (2001b)Cerro Negro (Nicaragua) 0.6 57–4667 (Salazar et al., 2001; Melián et al., 2006)Póas (Costa Rica) 3.2 51–169 Melián et al. (2004a)Teide (Spain) 0.53 73–717 (Hernández et al., 2001; Pérez et al., 1998)Nisyros (Greece) 1.3 52 Brombach et al. (2001)Cumbre Vieja (Spain) 220 4–11 Padrón, pers. comm., 2007Showa-Shinzan (Japan) 0.53 26–29 Hernández et al. (2006a)Irazú (Costa Rica) 3.5 13 Galindo et al. (2004)Miravalles (Costa Rica) 65 195 Melián et al. (2004b)Solfatara (Italy) 1.23 1220 Chiodini et al. (2001)Vesubio (Italy) 5.5 35 Frondini et al. (2004)
168 E. Padrón et al. / Journal of Volcanology and Geothermal Research 176 (2008) 163–169

Author's personal copy
References
Allard, P., 1992. Diffuse degassing of carbon dioxide through volcanic systems: observedfacts and implications. Rep. Geol. Surv. Japan 279, 7–11.
Allard, P., Carbonelle, J., Dajlevic, D., Le Bronec, J., Morel, P., Robe, M.C., Maurenas, J.M.,Faivre-Pierret, R., Martins, D., Sabroux, J.C., Zettwoog, P., 1991. Eruptive and diffuseemissions of CO2 from Mount Edna. Nature 351, 387–391.
Barberi, F., Coltelli, M., Ferrara, G., Innocenti, F., Navarro, J.M., Santacroce, R., 1988. Plio-Quaternary volcanism in Ecuador. Geol. Mag. 125, 1–14.
Baubron, J.C., Allard, P., Toutain, J.P., 1990. Diffuse volcanic emissions of carbon dioxidefrom Vulcano Island, (Italy). Nature 344, 51–53.
Brombach, T., Hunziker, C., Chiodini, G., Cardellini, C., Marini, L., 2001. Soil diffusedegassing and thermal energy fluxes from the southern Lakki plain, Nysiros(Greece), 2001. Geophys. Res. Lett. 28, 69–72.
Carapezza, M.L., Inguaggiato, S., Brusca, L., Longo, M., 2004. Geochemical precursors ofthe activity of an open-conduit volcano: the Stromboli 2002–2003 eruptive events.Geophys. Res. Lett. 31, L07620. doi:10.1029/2004GL019614.
Cardellini, C., Chiodini, G., Frondini, F., 2003. Application of stochastic simulation to CO2
flux from soil: mapping and quantification of gas release. J. Geophys. Res. 108 (B9),2425. doi:10.1029/2002JB002165.
Chiodini, G., Frondini, F., Raco, B., 1996. Diffuse emission of CO2 from the Fossa crater,Vulcano Island, (Italy). Bull. Volcanol. 58, 41–50.
Chiodini, G., Cioni, R., Guidi, M., Raco, B., Marini, L., 1998. Soil CO2 flux measurements involcanic and geothermal areas. Appl. Geochem. 13, 543–552.
Chiodini, G., Frondini, F., Cardellini, C., Granieri, D., Marini, L., Ventura, G., 2001. CO2
degassing and energy release at Solfatara volcano, Campi Flegrei, Italy. J. Geophys.Res. 106 (B8), 16213–16221.
Deutsch, C.V., Journel, A.G., 1998. GSLIB: Geostatistical Software Library and UsersGuide, 2nd ed. Oxford University Press, New York. 369 pp.
Freymuller, J.T., Kellogg, J.N., Vega, V., 1993. Plate motions in the north Andean region. J.Geophys. Res. 98, 21853–21863.
Frondini, F., Chiodini, G., Caliro, S., Cardellini, C., Granieri, D., Ventura, G., 2004. DiffuseCO2 degassing at Vesuvio, Italy. Bull. Volcanol. 66, 642–651.
Galindo, I., Melián, G., Salazar, J.M.L., Hernández, P.A., Pérez, N.M., Ramírez, C.,Fernández, M., Alvarado, G.E., Sumino, H., Notsu, K., 2004. Emisión difusa dedióxido de carbono en el volcán Irazú, Costa Rica. Rev. Geol. Am. Cent. 30, 157–165.
Geotermica Italiana-INEMIN, 1989. Mitigacion del Riesgo Volcanico en el AreaMetropolitana de Quito. Ministero degli Affari Esteri-DGCS, Pisa and Quito. . 101 pp.
Gerlach, T.M., Graeber, E.J., 1985. Volatile budget of Kilauea volcano. Nature 313,273–277.
Giammanco, S., Inguaggiato, S., Valenza, M., 1998. Soil and fumarole gases of MountEdna: geochemistry and relations with volcanic activity. J. Volcanol. Geotherm. Res.81, 297–310.
Granieri, D., Carapezza, M.L., Chiodini, G., Avino, R., Caliro, S., Ranaldi, M., Ricci, T.,Tarchini, L., 2006. Correlated increase in CO2 fumarolic content and diffuse emissionfrom La Fossa crater (Vulcano, Italy): evidence of volcanic unrest or increasing gasrelease from a stationary deep magma body? Geophys. Res. Lett. 33, L13316.doi:10.1029/2006GL026460.
Gunkel, G., Viteri, F., Beulker, C., Grupe, B., 2006. Accumulation of carbon dioxide in deepcaldera lakes of Ecuador: evaluation and monitoring of possible gas eruptions.International Meeting “Cities on Volcanoes 4”, 23–27 January, Quito. Poster SIVA-25-P.
Hall, M.L., 1977. E1 volcanismo en el Ecuador. IPGM Seccion Nacional del Ecuador, Quito.. 38 pp.
Hall, M.L., Mothes, P.A., 1988. La actividad volcánica del Holoceno en el Ecuador yColombia Austral: impedimento al desarrollo de las civilizaciones pasadas. In:Mothes, P.A. (Ed.), Actividad Volcanica y pueblos Precolombinos en el Ecuador.Abya-Yala, Quito, pp. 11–40.
Hanus, V., 1987. Deep seismically active fracture zones in Ecuador and Northern Peru.Stud. Geophys. Geod. 31, 8–25.
Hernández, P.A., Pérez, N.M., Salazar, J.M., Nakai, S., Notsu, K., Wakita, H., 1998. Diffuseemissions of carbon dioxide, methane, and hellium-3 from Teide volcano, Tenerife,Canary Islands. Geophys. Res. Lett. 25, 3311–3314.
Hernández, P.A., Notsu, K., Salazar, J.M., Mori, T., Natale, G., Okada, H., Virgili, G.,Shimoike, Y., Sato, M., Pérez, N.M., 2001a. Carbon dioxide degassing by advectiveflow from Usu volcano, Japan. Science 292, 83–86.
Hernández, P.A., Salazar, J.M., Shimoike, Y., Mori, T., Notsu, K., Perez, N.M., 2001b. Diffuseemission of CO2 from Miyakejima volcano, Japan. Chem. Geol. 177, 175–185.
Hernández, P.A., Notsu, K., Okada, H., Mori, T., Sato, M., Barahona, F., Pérez, N.M., 2006a.Diffuse emission of CO2 from Showa-Shinzan, Hokkaido, Japan: a sign of volcanicdome degassing. Pure Appl. Geophys. 163, 869–881.
Hernández, P.A., Padrón, E., Barrancos, J., Pérez, N.M., 2006b. Diffuse CO2 emission atCaoatepeque volcanic lake, El Salvador. 300th Anniversary Volcano InternationalConference Commemorating the 1706 Arenas Negras Eruption, 22–26 May,Garachico, Canary Islands.
Isaacson, J.S., 1987. Volcanic activity and human occupation of the Northern Andes: theapplication of tephrostratigraphic techniques to the problem of human settlementin the Western Montaña during the Ecuadorian Formative. Ph.D. Thesis, Universityof Illinois at Urbana-Champaign. University Microfilms International, Ann Arbor.
Kusakabe, M., Ohsumi, T., Aramaki, S., 1989. The Lake Nyos gas disaster: chemical andisotopic evidence in waters and dissolved gases from three Cameroonian craterlakes, Nyos, Monoun, and Wum. J. Volcanol. Geotherm. Res. 39, 167–185.
López, D.L., Ransom, L., Pérez, N.M., Hernández, P.A., Monterrosa, J., 2004. Dynamics ofdiffuse degassing at Ilopango caldera, El Salvador. In: Rose, W.I., Bommer, J.J., López,D.L., Carr, M.J., Major, J.J. (Eds.), Natural Hazards in El Salvador. The GeologicalSociety of America, Special Paper, 375, pp. 191–202.
Melián, G., Galindo, I., Nolasco, D., Marrero, R., Salazar, J.M.L., Hernández, P.A., Pérez, N.M., Ramírez, C., Fernández, M., Alvarado, G.E., Notsu, K., 2004a. Dynamics of diffuseCO2 emission at Póas volcano, Costa Rica. 4a Asamblea Hispano-Lusa de Geodesia yGeofísica, 3–4 February, Figueira da Foz, Portugal.
Melián, G., Pérez, N.M., Hernández, P.A., Salazar, J.M.L., Yock, A., Sánchez, E., Alvarado, G.E., Sumino, H., Notsu, K., 2004b. Emisión difusa de dióxido de carbono y vapor demercurio en el volcán Miravalles, Costa Rica. Rev. Geol. Am. Cent. 30, 179–188.
Melián, G., Marrero, R., Nolasco, D., Barancos, J., Calvo, D., Pérez, N.M., Galindo, I.,Hernández, P.A., Strauch, W., 2006. Diffuse CO2 emission dynamics and relation tothe eruptive cycle at Cerro Negro volcano, Nicaragua, Central. 300th AnniversaryVolcano International Conference Commemorating the 1706 Arenas NegrasEruption, 22–26 May, Garachico, Canary Islands.
Papale, P., Rosi, M., 1993. A case of no-wind plinian fallout at Pululahua caldera(Ecuador): implications for models of clast dispersal. Bull. Volcanol. 55, 523–535.
Parkinson, K.J., 1981. An improved method for measuring soil respiration in the field. J.Appl. Ecol. 18, 221–228.
Pérez, N.M., Hernández, P.A., Lima, N., Melián, G., Galindo, I., Padrón, E., Marrero, R.,Salazar, P., Gómez, L., González, P., Coello, C., Pérez, V., 2004. Diffuse CO2 emissionand volcanic activity at oceanic volcanic islands. International Symposium“Reducing Volcanic Risk in Islands”, June 2–6, Granadilla de Abona, Spain.
Pérez, N.M., Hernández, P.A., Padrón, E., Cartagena, R., Olmos, R., Barahona, F., Melián, G.,Salazar, P., López, D.L., 2006. Anomalous diffuse CO2 emission prior to the January2002 short-term unrest at San Miguel volcano, El Salvador, Central America. PureAppl. Geophys. 163, 883–896.
Rogie, J.D., Kerrick, D.M., Sorey, M.L., Chiodini, G., Galloway, D.L., 2001. Dynamics ofcarbon dioxide emission at Mammoth Mountain, California. Earth Planet. Sci. Lett.188, 535–541.
Salazar, J.M., Hernández, P.A., Pérez, N.M., Melián, G., Álvarez, J., Segura, F., Notsu, K.,2001. Diffuse emissions of carbon dioxide from Cerro Negro volcano, Nicaragua,Central America. Geophys. Res. Lett. 28, 4275–4278.
Salazar, J.M.L., Pérez, N.M., Hernández, P.A., Soriano, T., Barahona, F., Olmos, R.,Cartagena, R., López, D.L., Lima, N., Melián, G., Padrón, E., Galindo, I., Notsu, K., 2002.Precursory diffuse carbon dioxide degassing signatures of recent earthquakes in ElSalvador, Central America. Earth Planet. Sci. Lett. 205, 81–89.
Sigurdsson, H., Devine, J.D., Tchoua, F.M., Presser, T.S., Pringle, M.K.W., Evans, W.C., 1987.Origin of the lethal gas burst from Lake Monoun, Cameroon. J. Volcanol. Geotherm.Res. 31, 1–16.
Sinclair, A.J., 1974. Selection of thresholds in geochemical data using probability graphs.J. Geochem. Explor. 3, 129–149.
Tennant, C.B., White, M.L., 1959. Study of the distribution of some geochemical data.Econ. Geol. 54, 1281–1290.
Toutain, J.P., Baubron, J.C., Le Broned, J., Allard, P., Briole, P., Marty, B., Miele, G., Tedesco,D., Luongo, G., 1992. Continuous monitoring of distal gas emanations at Vulcano,southern Italy. Bull. Volcanol. 54, 147–155.
169E. Padrón et al. / Journal of Volcanology and Geothermal Research 176 (2008) 163–169
Related Documents