research papers 426 doi:10.1107/S0907444909040177 Acta Cryst. (2010). D66, 426–436 Acta Crystallographica Section D Biological Crystallography ISSN 0907-4449 Diffraction data analysis in the presence of radiation damage Dominika Borek, a Marcin Cymborowski, b Mischa Machius, a ‡ Wladek Minor b and Zbyszek Otwinowski a * a University of Texas Southwestern Medical Center at Dallas, 5323 Harry Hines Boulevard, Dallas, TX 75390, USA, and b University of Virginia, Charlottesville, VA 22908, USA ‡ Current address: University of North Carolina, School of Medicine, Chapel Hill, NC 27599, USA. Correspondence e-mail: [email protected] In macromolecular crystallography, the acquisition of a complete set of diffraction intensities typically involves a high cumulative dose of X-ray radiation. In the process of data acquisition, the irradiated crystal lattice undergoes a broad range of chemical and physical changes. These result in the gradual decay of diffraction intensities, accompanied by changes in the macroscopic organization of crystal lattice order and by localized changes in electron density that, owing to complex radiation chemistry, are specific for a particular macromolecule. The decay of diffraction intensities is a well defined physical process that is fully correctable during scaling and merging analysis and therefore, while limiting the amount of diffraction, it has no other impact on phasing procedures. Specific chemical changes, which are variable even between different crystal forms of the same macromolecule, are more difficult to predict, describe and correct in data. Appearing during the process of data collection, they result in gradual changes in structure factors and therefore have profound consequences in phasing procedures. Examples of various combinations of radiation-induced changes are presented and various considerations pertinent to the determination of the best strategies for handling diffraction data analysis in representative situations are discussed. Received 8 April 2009 Accepted 2 October 2009 1. Introduction With modern X-ray sources, even for cryocooled crystals, the limit of crystal life is reached in times ranging from seconds at the strongest third-generation undulator synchrotron beam- lines (http://biosync.rcsb.org/allbeamlines/allbeam.html) to hours at the most intense home sources (Yang et al., 1999). For this reason, the dose from crystal exposure is now mostly determined by the experimental strategy rather than by X-ray source intensity limitations. Macromolecular crystals inher- ently scatter weakly, so reaching the highest possible scat- tering intensity is always desirable in order to minimize random effects (Borek et al., 2003; Popov & Bourenkov, 2003; Bourenkov & Popov, 2006). The decay of half the total diffraction intensity defines the upper limit for X-ray dose (Henderson, 1995; Owen et al., 2006; Kmetko et al. , 2006). However, chemical and physical changes induced by X-ray photons during data collection may result in the deterioration of merging statistics, sometimes long before reaching half the intensity decay (Borek et al., 2007; Zwart et al., 2004), prompting experimenters to limit the exposure. Even if

Welcome message from author
This document is posted to help you gain knowledge. Please leave a comment to let me know what you think about it! Share it to your friends and learn new things together.
Transcript

research papers
426 doi:10.1107/S0907444909040177 Acta Cryst. (2010). D66, 426–436
Acta Crystallographica Section D
BiologicalCrystallography
ISSN 0907-4449
Diffraction data analysis in the presence of radiationdamage
Dominika Borek,a Marcin
Cymborowski,b Mischa
Machius,a‡ Wladek Minorb and
Zbyszek Otwinowskia*
aUniversity of Texas Southwestern Medical
Center at Dallas, 5323 Harry Hines Boulevard,
Dallas, TX 75390, USA, and bUniversity of
Virginia, Charlottesville, VA 22908, USA
‡ Current address: University of North Carolina,
School of Medicine, Chapel Hill, NC 27599,
USA.
Correspondence e-mail:
In macromolecular crystallography, the acquisition of a
complete set of diffraction intensities typically involves a high
cumulative dose of X-ray radiation. In the process of data
acquisition, the irradiated crystal lattice undergoes a broad
range of chemical and physical changes. These result in the
gradual decay of diffraction intensities, accompanied by
changes in the macroscopic organization of crystal lattice
order and by localized changes in electron density that, owing
to complex radiation chemistry, are specific for a particular
macromolecule. The decay of diffraction intensities is a well
defined physical process that is fully correctable during scaling
and merging analysis and therefore, while limiting the amount
of diffraction, it has no other impact on phasing procedures.
Specific chemical changes, which are variable even between
different crystal forms of the same macromolecule, are more
difficult to predict, describe and correct in data. Appearing
during the process of data collection, they result in gradual
changes in structure factors and therefore have profound
consequences in phasing procedures. Examples of various
combinations of radiation-induced changes are presented and
various considerations pertinent to the determination of the
best strategies for handling diffraction data analysis in
representative situations are discussed.
Received 8 April 2009
Accepted 2 October 2009
1. Introduction
With modern X-ray sources, even for cryocooled crystals, the
limit of crystal life is reached in times ranging from seconds at
the strongest third-generation undulator synchrotron beam-
lines (http://biosync.rcsb.org/allbeamlines/allbeam.html) to
hours at the most intense home sources (Yang et al., 1999). For
this reason, the dose from crystal exposure is now mostly
determined by the experimental strategy rather than by X-ray
source intensity limitations. Macromolecular crystals inher-
ently scatter weakly, so reaching the highest possible scat-
tering intensity is always desirable in order to minimize
random effects (Borek et al., 2003; Popov & Bourenkov, 2003;
Bourenkov & Popov, 2006). The decay of half the total
diffraction intensity defines the upper limit for X-ray dose
(Henderson, 1995; Owen et al., 2006; Kmetko et al., 2006).
However, chemical and physical changes induced by X-ray
photons during data collection may result in the deterioration
of merging statistics, sometimes long before reaching half
the intensity decay (Borek et al., 2007; Zwart et al., 2004),
prompting experimenters to limit the exposure. Even if
limiting the exposure preserves less damaged states of the
crystal, it often hinders solution of a structure owing to the
collected data being either too weak or having insufficient
multiplicity of observations to perform experimental phasing
(Zwart et al., 2004). Understanding how radiation-induced
specific effects manifest themselves in data is essential to
making informed choices about exposure strategy.
These effects can be analyzed from two perspectives,
starting with the physics of interactions between X-rays and
matter. A good example of such analysis is the program
RADDOSE, which calculates the X-ray absorption depending
on the crystallization conditions, the particular composition
of the protein and the X-ray wavelength (Murray et al., 2005;
Paithankar et al., 2009). The results of this and similar analyses
are used as one of the intermediate steps in the process of
planning the experiment. We will focus on the other
perspective, which starts with analyzing the patterns in X-ray
diffraction data. Characteristic data patterns may exist in both
real and reciprocal space. The identified patterns may be used
at various points of different crystallographic procedures: (i)
to plan the next experiment (sometimes even a continuation of
the current one; Bourenkov & Popov, 2006); (ii) to correct
data in reciprocal space, e.g. to apply a decay correction
(Borek et al., 2007; Otwinowski et al., 2003) and zero-dose
extrapolation (Borek et al., 2007; Diederichs et al., 2003;
Blake & Phillips, 1962); and (iii) to combine real-space and
reciprocal-space patterns for phasing (Ravelli et al., 2003;
Schiltz & Bricogne, 2007; Schiltz et al., 2004) and to infer
chemical characteristics of macromolecules forming a parti-
cular crystal lattice (Futterer et al., 2008; Yano et al., 2005).
In this article, we describe the main data patterns, how to
recognize these, when to expect them and how they have
impacted on data collection and phasing in a range of specific
cases.
2. Sources of the analyzed diffraction data
A data set from a crystal of APC5871, a Midwest Center for
Structural Genomics project, was provided by Marianne Cuff,
who collected it on beamline 19-ID of the Structural Biology
Center (SBC) at the Advanced Photon Source (APS). An
APC35880 data set (PDB code 1t0t; M. Gilski, D. Borek,
Y. Chen, F. Collart, A. Joachimiak & Z. Otwinowski, unpub-
lished work) was collected from an SeMet-containing crystal
on the same beamline. A data set from a crystal of bovine
pancreatic trypsin inhibitor (BPTI) corresponding to PDB
code 1g6x was provided by Mariusz Jaskolski and was
collected on EMBL beamline X11 at DESY as described
previously (Addlagatta et al., 2001). A data set from a crystal
of NaI-841 (Borek et al., 2007), isomorphous with PDB
deposition 1r61, was provided by Jana Maderova, who
collected it on beamline 19-BM of the SBC at the APS. A data
set from a crystal of thiamine-binding lipoprotein p37 from
Mycoplasma hyorhinis, referred to here as p37n33 (C. Dann,
unpublished work), was provided by Charles Dann III, who
collected it at Cu K� wavelength with an FR-E Super Bright
X-ray generator (Rigaku). Data from a crystal of Tp0655
lipoprotein from Treponema pallidum, corresponding to PDB
code 2v84, were acquired using the same source, as described
previously (Machius et al., 2007). Data from a crystal of proto-
research papers
Acta Cryst. (2010). D66, 426–436 Borek et al. � Radiation damage 427
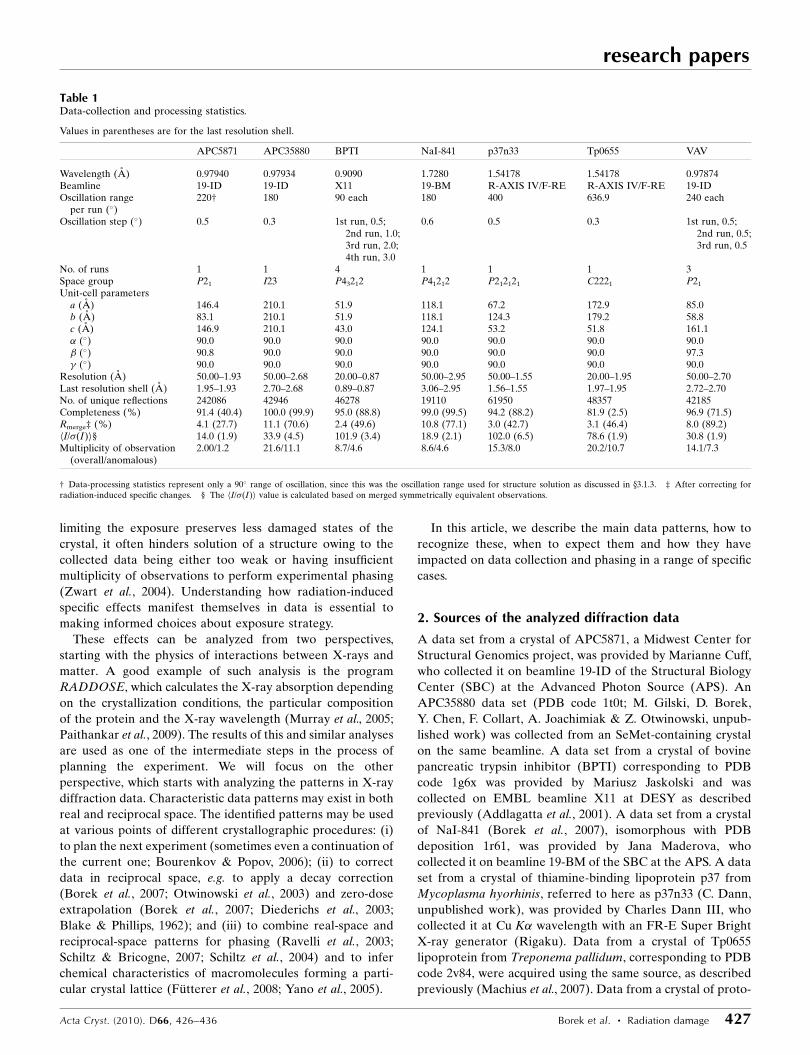
Table 1Data-collection and processing statistics.
Values in parentheses are for the last resolution shell.
APC5871 APC35880 BPTI NaI-841 p37n33 Tp0655 VAV
Wavelength (A) 0.97940 0.97934 0.9090 1.7280 1.54178 1.54178 0.97874Beamline 19-ID 19-ID X11 19-BM R-AXIS IV/F-RE R-AXIS IV/F-RE 19-IDOscillation range
per run (�)220† 180 90 each 180 400 636.9 240 each
Oscillation step (�) 0.5 0.3 1st run, 0.5;2nd run, 1.0;3rd run, 2.0;4th run, 3.0
0.6 0.5 0.3 1st run, 0.5;2nd run, 0.5;3rd run, 0.5
No. of runs 1 1 4 1 1 1 3Space group P21 I23 P43212 P41212 P212121 C2221 P21
Unit-cell parametersa (A) 146.4 210.1 51.9 118.1 67.2 172.9 85.0b (A) 83.1 210.1 51.9 118.1 124.3 179.2 58.8c (A) 146.9 210.1 43.0 124.1 53.2 51.8 161.1� (�) 90.0 90.0 90.0 90.0 90.0 90.0 90.0� (�) 90.8 90.0 90.0 90.0 90.0 90.0 97.3� (�) 90.0 90.0 90.0 90.0 90.0 90.0 90.0
Resolution (A) 50.00–1.93 50.00–2.68 20.00–0.87 50.00–2.95 50.00–1.55 20.00–1.95 50.00–2.70Last resolution shell (A) 1.95–1.93 2.70–2.68 0.89–0.87 3.06–2.95 1.56–1.55 1.97–1.95 2.72–2.70No. of unique reflections 242086 42946 46278 19110 61950 48357 42185Completeness (%) 91.4 (40.4) 100.0 (99.9) 95.0 (88.8) 99.0 (99.5) 94.2 (88.2) 81.9 (2.5) 96.9 (71.5)Rmerge‡ (%) 4.1 (27.7) 11.1 (70.6) 2.4 (49.6) 10.8 (77.1) 3.0 (42.7) 3.1 (46.4) 8.0 (89.2)hI/�(I)i§ 14.0 (1.9) 33.9 (4.5) 101.9 (3.4) 18.9 (2.1) 102.0 (6.5) 78.6 (1.9) 30.8 (1.9)Multiplicity of observation
(overall/anomalous)2.00/1.2 21.6/11.1 8.7/4.6 8.6/4.6 15.3/8.0 20.2/10.7 14.1/7.3
† Data-processing statistics represent only a 90� range of oscillation, since this was the oscillation range used for structure solution as discussed in x3.1.3. ‡ After correcting forradiation-induced specific changes. § The hI/�(I)i value is calculated based on merged symmetrically equivalent observations.
oncogene vav, referred to here as VAV, were provided by the
Structural Biology Laboratory at University of Texas South-
western Medical Center at Dallas. Three VAV data sets were
collected on beamline 19-ID of the SBC at the APS. The first
and second sets were from the same position of the crystal in
the beam and the third was obtained by translating the crystal
along the rotation axis to expose fresh potentially undamaged
parts.
All diffraction data sets used were reprocessed with HKL-
3000 (Minor et al., 2006; Otwinowski & Minor, 1997, 2000),
optimizing scaling and error model parameters (Otwinowski et
al., 2003; Borek et al., 2003; Table 1).
3. Results and discussion
3.1. The impact of X-ray radiation on diffraction intensities
In the discussion, we differentiate between ‘radiation
damage’, referring to all X-ray-induced changes in the
diffraction data, and the ‘decay of diffraction pattern’, which
refers specifically to the resolution-dependent weakening of
the diffraction pattern.
During X-ray exposure, owing to the cascade of electronic
events resulting from the absorption of X-ray photons, atoms
are randomly displaced from their initial positions in the
crystal lattice. When the mobility of atoms is restricted by
cryocooling, the typical displacements are expected to be on
the scale of 1 A or less. Some of the atoms in the crystal
asymmetric unit may be displaced sooner than others. When
considering how these effects impact on the diffraction data,
the consequences, owing to Fourier transform properties, are
very different for the average displacement rate and for
departures from it.
The average Gaussian-like local displacement in real space
will result, from the Fourier transform property of convolu-
tion, in the decay of diffraction intensities, which is resolution-
dependent but otherwise globally uniform in reciprocal space.
This effect is a consequence, through the Fourier transform, of
an averaged value of highly localized properties in real space,
so one would expect it to be isotropic, irrespective of whether
or not the overall diffraction is isotropic. Additionally, relative
rearrangements of the unit cells may also contribute to
changes in the diffraction pattern. For uncooled crystals, it is
the dominant source of resolution-dependent intensity decay.
However, for cryocooled crystals unit-cell changes are typi-
cally so minuscule (Borek et al., 2007; Ravelli et al., 2002;
Murray & Garman, 2002) that the contribution of lattice
disorder to the overall diffraction decay is not significant. In
some special cases, discussed in x3.1.3, nonlinear effects may
cause lattice disorder, but this will have more consequences
than solely the overall decay of the diffraction pattern.
The departures from the average displacement rate are
represented by localized changes in electron density, which is
calculated using Fourier coefficients already corrected for the
radiation decay. From the Fourier theorem, these localized
changes in electron density will affect all reflections. As these
localized changes accumulate, the decay-corrected intensity
of a particular reflection will drift from its initial value, either
decreasing or increasing (Blake & Phillips, 1962). Even if these
changes have different directions, they will have a common
linearity or a lack of linearity, mirroring the linearity of
changes in real space.
3.1.1. Description of diffraction-pattern decay and its roleas the proxy of dose. The resolution-dependent decay of
diffraction intensities was first noticed a long time ago (Blake
& Phillips, 1962). Ever since, it has been commonly corrected
by applying a scaling (relative) B-factor correction, which is
a specific case of exponential modeling in the scaling of
diffraction data (Arnott & Wonacott, 1966; Otwinowski et al.,
2003; Otwinowski & Minor, 1997; Smith & Arnott, 1978). In
this approach, scaling factors Brel are applied separately to
batches of data, e.g. consecutive diffraction images, by using
the following multiplicative scale factor,
exp Birel
jS � Sj
2
� �; ð1Þ
where Birel is the scaling (relative) B factor for data batch i and
S is the diffraction vector. All the Brel are determined together
by comparing the intensities of symmetrically equivalent
observations measured at different times, i.e. at different
images and at different doses.
Equation (1) follows from the diffraction intensities Ihkl
being reduced by thermal vibrations described by the Debye–
Waller factor exp(�2Bsin2/�2), resulting in modification of the
measured intensities I mhkl,
Imhkl ¼ Ihkl expð�2B sin2 �=�2
Þ: ð2Þ
The diffraction-vector magnitude is given by S = (2sin�)/�,
which is equivalent to sin�/� = S/2, where S is a diffraction
vector, � is the wavelength and � is the Bragg angle. Thus, we
can express the measured intensity I mhkl as
Imhkl ¼ Ihkl expð�2B sin2 �=�2Þ
¼ Ihkl exp �2BS � S
4
� �¼ Ihkl exp �B
S � S
2
� �: ð3Þ
The goal of scaling is to generate a model of the data which is
the best description of the measured intensities. Thus, we are
interested in calculating how the values of Ihkl change during
data collection owing to increasing thermal vibrations or any
other diffusive process described by the B factor,
Iihkl ¼ Im;i
hkl exp Birel
S � S
2
� �: ð4Þ
One of the advantages of using the scaling B factor compared
with other scaling approaches is its ability to estimate the
decay of the diffraction pattern even without returning to the
starting orientation of the crystal for additional measurements.
In the case of anisotropic diffraction, there is no other prac-
tical alternative to monitoring a continuously rotating crystal,
as the average intensity of diffraction in the image may
increase and decrease with rotation owing to anisotropy and
not necessarily owing to crystal decay.
research papers
428 Borek et al. � Radiation damage Acta Cryst. (2010). D66, 426–436

As noticed by Kmetko et al. (2006) and also by others
(Borek et al., 2007), accumulating X-ray dose at a particular
temperature produces the same scaling B-factor increase
irrespectively of how the same dose was generated by different
combinations of mass-absorption coefficients, exposure time
and beam intensity. This relationship between the dose and
the Brel increase can be explained by the statistical properties
of atom displacements generated by X-ray radiation. In
cryocooled crystals, we do not expect atoms to move by large
distances as a consequence of ionizing radiation; however,
small shifts are possible. During the diffraction experiment,
each atom in the structure is randomly displaced by many
cumulative independent events and if these displacements are
individually small the central limit theorem applies. In con-
research papers
Acta Cryst. (2010). D66, 426–436 Borek et al. � Radiation damage 429
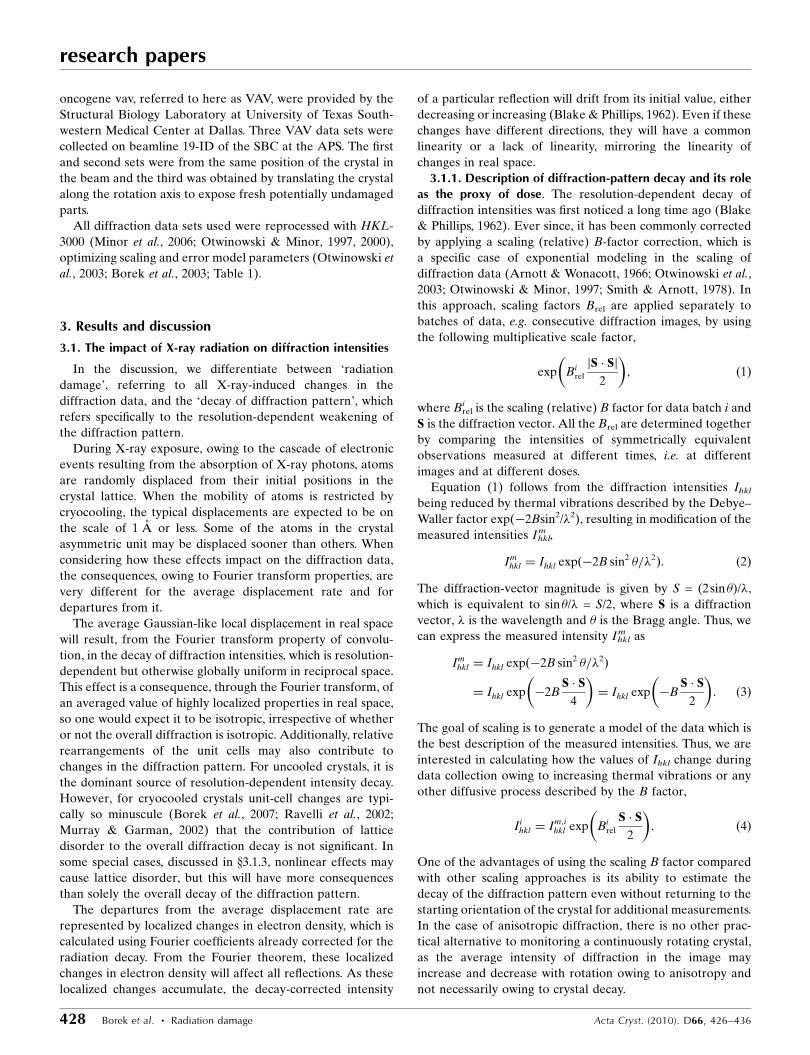
Figure 1Linear increase of the scaling (relative) B factor for various diffraction data sets: (a) APC35880, (b) BPTI, (c) NaI-841, (d) p37n33, (e) Tp0655, (f) VAV.In cases where the crystal was smaller than the beam size (APC35880, BPTI, NaI-841 and p37n33, Tp0655) there is little fluctuation in B-factor behavior.VAV represents a case where the crystal was larger than the beam and in which three data sets were collected, with the third data set being acquired aftermoving the crystal to a new position.
sequence, cumulative displacement is described by a Gaussian
distribution, the squared width of which increases linearly with
dose, as increasing the dose generates proportionally more
individual small displacements. The global scale is not
expected to change, since the number of atoms in the X-ray
beam remains the same, and so the decay Brel is fully described
by a resolution-dependent Gaussian term with a width defined
through the factor. Frequently, for many practical reasons,
calculation of the dose absorbed by the crystal may be inac-
curate or impossible. Even if Brel is an indirect measure of
dose, it describes a physical property that is directly related to
interactions of photons with the crystal, making it a good
proxy of the dose.
The above reasoning agrees well with experimental obser-
vations. For all crystals considered here that were fully and
uniformly exposed in the beam (APC35880, BPTI, NAI-841,
p37n33 and Tp0655) the scaling B factor increases linearly
with time (Fig. 1). If the crystal, for example owing to its shape,
as in the case of the VAV crystal, is not fully bathed in
the X-ray beam, then the overall decay will be the weighted
average of the decay of different parts of the crystal that are
exposed to different doses (Fig. 1). Imperfect centering may
introduce a more complex geometrical dependence of the
scaling B factor on data-collection time. The VAV data set also
shows that Brel can be used to make decisions on when to
translate the crystal to a new position. The strategy of trans-
lating the crystal to expose fresh parts is often employed in the
case of crystals with an elongated shape. Of the three VAV
data sets, the first two were collected at the same position but
with ’ = 0� for the first data set and ’ = 180� for the second
data set, whereas the third data set was collected at a different
crystal position. The scaling B-factor increase shows not only
that the crystal was larger than the X-ray beam but also that in
the case of the first and second data sets the same parts of the
crystal were exposed. The scaling B-factor behavior for the
third data set is almost identical to that of the first data set,
showing that fresh sections of the crystal were indeed exposed.
It is important to notice that even for diffraction data sets
collected at a home source (p37n33 and Tp0655) a significant
scaling B-factor increase is observed over the 2–3 d of data
collection, which is consistent with the known intensity of one
of the strongest rotating-anode sources.
3.1.2. Specific radiation-induced changes. Localized in real
space, the specific changes induced by X-ray radiation are
a complex function of radiation chemistry. Each absorbed
photon generates hundreds of secondary ionization events at
distances much larger than the unit-cell repeat in the crystal,
so effectively the changes arising from these secondary events
(O’Neill et al., 2002) as well as those arising from the recom-
bination of their products are not localized at the absorption
site. Localized changes can be identified by calculating the
corresponding electron-density map, which represents the
difference between the initial and radiation-exposed states.
Our calculation of a radiation-damage difference electron-
density map (RDDEM) starts with fitting a linear function
of diffraction intensity with dose to observations already
corrected for decay (x3.1.1), using an independent fit for every
unique diffraction index. The slope coefficients of the fitted
line, by definition, represent the rate of change in structure
factor squared with respect to dose. In the case of there being
a limited number of observations per unique hkl the problem
of extracting components of the signal simultaneously can be
ill-posed, i.e. it may lead to a highly inaccurate solution. The
inherent lack of knowledge in this situation has a detrimental
effect on further stages of analysis, possibly preventing solu-
tion of the phase problem. The chosen method to address this
issue is to calculate the maximum a posteriori estimate (MAP)
based on the observation that the expected magnitude of a
normalized signal is unity. In the case of a one-component
signal, e.g. only Bijvoet differences, this is equivalent to a
Wiener filter. In crystallography, the Wiener filter-equivalent
approach has been previously discussed by Giacovazzo et
al. (2001). In the case of multiple signals, e.g. Bijvoet differ-
ences considered together with non-isomorphisms, the MAP
approach is equivalent to Tikhonov regularization (Tikhonov
& Arsenin, 1977) with unity as the regularization constant.
The Tikhonov regularization is applied during a determination
of the components of the signal to the least-squares matrix
A = URVT, with singular values ai to generate the solution
xx = UDVTb, where D has diagonal values Dii = ai(ai2 + �2), with
� representing the regularization constant. In our case � is
unity, since all signal components are normalized. This signal
normalization means that the expected value (r.m.s.) for a
particular source of signal, e.g. anomalous differences,
radiation damage etc., is also unity. Such use of Tikhonov
regularization has a clear Bayesian meaning derived from a
generalization of the Wiener filter idea to the case of multiple
signals.
The results of this procedure, once we have determined the
phases, can be displayed in real space as the radiation-damage
rate map, which is the Fourier transform of the slope coeffi-
cients in the linear fit. This electron-density map is a difference
map between the zero radiation dose and any accumulated
dose at which the assumption of linearity is still valid. Any
non-uniformity of exposure or even a lack of absolute dose
calibration does not affect the result. The magnitude (r.m.s.) of
radiation-induced specific changes in real space is equivalent
by Parseval’s theorem to the sum of the squared difference
research papers
430 Borek et al. � Radiation damage Acta Cryst. (2010). D66, 426–436
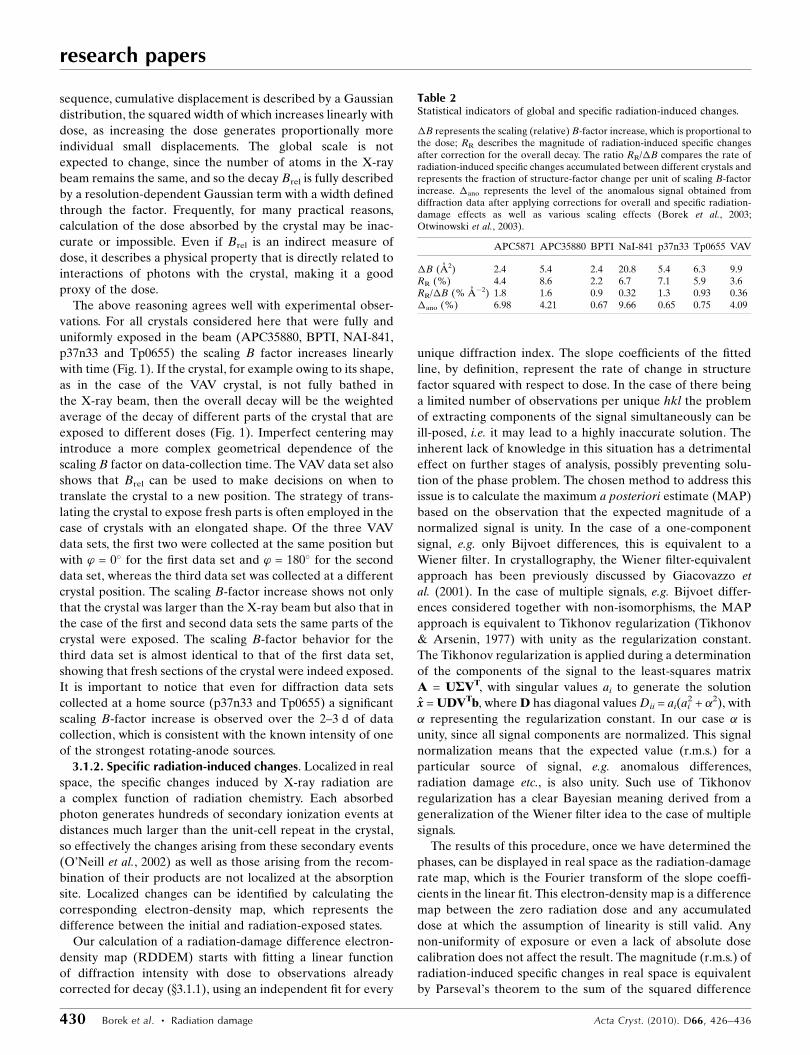
Table 2Statistical indicators of global and specific radiation-induced changes.
�B represents the scaling (relative) B-factor increase, which is proportional tothe dose; RR describes the magnitude of radiation-induced specific changesafter correction for the overall decay. The ratio RR/�B compares the rate ofradiation-induced specific changes accumulated between different crystals andrepresents the fraction of structure-factor change per unit of scaling B-factorincrease. �ano represents the level of the anomalous signal obtained fromdiffraction data after applying corrections for overall and specific radiation-damage effects as well as various scaling effects (Borek et al., 2003;Otwinowski et al., 2003).
APC5871 APC35880 BPTI NaI-841 p37n33 Tp0655 VAV
�B (A2) 2.4 5.4 2.4 20.8 5.4 6.3 9.9RR (%) 4.4 8.6 2.2 6.7 7.1 5.9 3.6RR/�B (% A�2) 1.8 1.6 0.9 0.32 1.3 0.93 0.36�ano (%) 6.98 4.21 0.67 9.66 0.65 0.75 4.09

map coefficients. Therefore, it is convenient to use the index
RR = h�F 2i1/2/hF 2
i1/2 (Borek et al., 2007), which expresses the
magnitude of specific radiation changes as a fraction of the
native signal.
The RR index is an approximately linear function of the
X-ray dose in a particular experiment. Thus, to compare
the rates of radiation-induced specific changes in different
experiments it has to be normalized, which we accomplish by
calculating RR/�Brel using the scaling B factor as a proxy of
the dose. There is clearly large variability in the RR/�Brel ratio
between different proteins (Table 2). The NaI-841 crystal
shows a relatively slow rate of radiation-induced specific
changes, RR/�Brel = 0.32% A�2, possibly owing to the pre-
sence of 0.5 M sodium iodide in the cryoconditions (Borek et
al., 2007), which is a known scavenger of electron holes
(Kulmala et al., 1997). In comparison, crystals of APC5871
show a six times faster rate of radiation-induced specific
changes, RR/�Brel = 1.8% A�2. Such fast changes in structure
factors could in this case result from lattice-destruction
phenomena (x3.1.3); however, APC35880 crystals that do not
show signs of lattice destruction have a comparable ratio of
RR/�Brel = 1.6% A�2.
In real space, we expect mainly negative RDDEM peaks, as
atoms are being smeared out, but in the case of atoms being
shifted positive peaks may also appear at the new positions of
the atoms. The typical features of these maps are negative
peaks around solvent-exposed carboxyl groups (Borek et al.,
2007; Burmeister, 2000; Weik et al., 2001), slowly disappearing
Se atoms that, owing to higher atomic number, produce higher
peaks, and disappearing S atoms in cysteine residues (Banu-
mathi et al., 2004; Borek et al., 2007; Burmeister, 2000) and in
disulfide bridges (Borek et al., 2007; Banumathi et al., 2004;
Burmeister, 2000; Weik et al., 2000; Ravelli & McSweeney,
2000). Changes around solvent molecules (Borek et al., 2007)
also occur, but they depend strongly on their macromolecular
environment. The dominant localized specific changes are
sometimes not even at the site of the heavy-atom absorber, as
for example in the case of crystals containing nitrates, where,
owing to well established radiation chemistry (Saran et al.,
1994), the nitrate anion is a preferred localization site of
specific radiation-induced changes compared with heavier
atoms such as sulfur (Borek et al., 2007).
The structures analyzed here show different patterns of
radiation-induced specific changes (Table 3). In the NaI-841
structure the RDDEM shows only nine peaks that are either
higher than 5� or lower than�5�. Six of these peaks represent
negative signal at the site of iodide anions and three of them
are signs of decarboxylation of either aspartic or glutamic acid
research papers
Acta Cryst. (2010). D66, 426–436 Borek et al. � Radiation damage 431
Table 3Summary of the 15 highest peaks observed in a radiation-damage difference map.
The APC5871 crystal was not used in this analysis because the very low multiplicity of observations did not allow zero-dose extrapolation, which is necessary forRDDEM coefficient determination of the map. The VAV protein was excluded, as the final model has not yet been deposited. For the p37n33 structure, determinedby sulfur SAD phasing (Dann, unpublished work), PDB entry 3e79 (Sippel et al., 2008) was used as a reference point. For each protein, all peaks with � valuesoutside the �5� (r.m.s.) range were analyzed. Numbering of solvent molecules follows that of the PDB depositions; however, in the case of the iodide soak, forwhich only the native structure has been deposited, the water-molecule number is specified to provide the location of the I-atom positions. Superscripts indicate theprotein chain, whereas subscripts indicate the type of atom when the RDDEM peak could be assigned to a single atom.
Protein APC35880 NaI-841 p37n33 Tp0655
PDB code 1t0t 1r61 3e79 2v84
1 MSE73V (�10.86) H2O2015A and H2O2016A (�8.02) iodide ThiamineS1 (�13.34) E150A (�11.24) decarboxylation2 MSE73W (�10.74) H2O2023B and H2O2024B (�6.16) iodide E146A (�8.89) decarboxylation MESS 1326 (�9.23)3 MSE239X (�10.65) H2O2025A (�6.09) iodide E146A (�8.86) decarboxylation E211A (�7.16) decarboxylation4 MSE239V (�10.19) H2O2061A (�5.58) iodide E79A (�8.31) decarboxylation MSD152A (+6.79) position change5 MSE73X (�10.13) H2O2012A (�5.54) iodide K403A (�8.15) decarboxylation D147A (�6.41) decarboxylation6 MSE73Y (�9.90) E124A (�5.51) decarboxylation E393A (�7.94) decarboxylation D64A (�6.24) decarboxylation7 MSE239Z (�9.22) H2O2014A (�5.25) iodide E157A (�7.83) decarboxylation Solvent area (�6.16)8 MSE73Z (�9.05) D141B (�5.20) decarboxylation NO213A (�7.76) MSD145A (+6.16) position change9 MSE239W (�8.61) D70A (�5.18) decarboxylation H2O1035A (�7.72) MSD145A (�6.10) position change10 MSE239Y (�8.22) Solvent area (4.99) possible iodide H2O1092A (�7.68) E263A (�5.94) decarboxylation11 D16V (�7.86) decarboxylation Solvent area (�4.91) possible iodide ThiamineN4 (�7.67) GO115A (+5.93)12 MSE216V (�7.53) D70A (�4.91) decarboxylation E393A (�7.65) decarboxylation H2O2128A (�5.93)13 MSE146V (�7.31) DN141B (+4.83) E393A (�7.49) decarboxylation K305A (�5.86) position change14 MSE146W (�7.26) PCG195A (+4.8) D388A (�7.48) decarboxylation E104A (�5.80) decarboxylation15 D147Z (�7.18) decarboxylation MSD181B (�4.74) D159A (�7.44) decarboxylation K305A (�5.68) position changeNo. of peaks† 57 9 104 29
† No. of peaks that are either lower than �5� or higher than 5�.
Figure 2Distribution of height of RDDEM peaks at Se-atom positions forAPC35880. The height of the peaks was scaled by dividing the height ofeach peak by the height of the highest RDDEM peak at a Se atom.

residues (Table 3). It is interesting to notice that in this
structure methionine or cysteine residues do not show signs of
specific changes induced by radiation, in contrast to the
structure of the same protein not soaked with sodium iodide
(data not shown). The small number of specific changes for
this structure is consistent with iodide being a known electron
scavenger (Kulmala et al., 1997).
In the case of the crystal structure of SeMet-derivativized
APC35880, the largest RDDEM peaks are localized at
selenomethionine residues, at carboxyl moieties and in the
solvent area (Table 3). The APC35880 protein forms an icosa-
hedral assembly with an asymmetric unit of space group I23
containing a pentamer. Because of the high symmetry of
the atomic environments, the patterns of radiation-induced
specific changes are very similar in all subunits of the
pentamer (Fig. 2). The most significant radiation-induced
changes are localized at the Se atoms in the SeMet73 and
SeMet239 residues. These peaks are three times higher than
the peaks localized at SeMet168 and about two times higher
than the peaks localized at SeMet158.
Both the Tp0655 and p37n33 crystal structures show a
consistent decarboxylation pattern of glutamic and aspartic
acid residues (Table 3). The most interesting features in both
structures are the radiation-induced specific changes localized
at bound ligands: on thiamine diphosphate for p37n33 and
2-(N-morpholino)ethanesulfonic acid (MES) for Tp0655
(Fig. 3). Both ligands contain S atoms, with the peak heights
indicating that these S atoms are more sensitive to ionizing
radiation than the sulfurs in methionine and cysteine residues.
RDDEM features around the thiamine bound in the p37n33
structure show very pronounced effects not only at the atoms
of the ligand but also at the binding site (Fig. 3). This is one of
the examples that shows the most pronounced, but not easily
chemically interpretable, radiation-induced changes at the
active site of the protein.
The BPTI crystal structure clearly shows a differential rate
of radiation-induced specific damage, as observed previously
for lysozyme crystals (Weik et al., 2000; Banumathi et al., 2004;
Ravelli & McSweeney, 2000). In the RDDEM map, the most
altered disulfide bridge, Cys30–Cys51, has a negative peak of
research papers
432 Borek et al. � Radiation damage Acta Cryst. (2010). D66, 426–436
Figure 3Radiation-induced specific changes around ligand-binding sites in p37n33 (a) and TP0655 (b). RDDEM contour levels are expressed in root-mean-square units (�). The green color corresponds to the +5� level and red to the�5� level. For clarity, water molecules were relabeled with respect to PDBentries 3e79 and 2v84. For 3e79, W1 = W1035, W2 = W1002, W3 = W1046, W4 = W1028 and W5 = W1090; for 2v84, W1 = W116.
Figure 4Differences in radiation-induced specific changes at disulfide bridges of BPTI. Red surfaces represent the�5� level and gray surfaces represent the +5�level. Cys51 is damaged at a much faster rate than other cysteine residues.

�51.4�, whereas the other two disulfide bridges show negative
peaks of �16.4� and �7.7�, indicating that the Cys30–Cys51
disulfide bridge is damaged four to eight times faster than the
other two disulfide bridges (Fig. 4).
All these examples illustrate the incompletely understood
complexity of radiation chemistry. What is clearly involved is
the migration of excited electronic states (Patten & Gordy,
1960; Wenger et al., 2005) and the possibility that atoms dis-
placed by one radiation event may return to the starting
position owing to another radiation event.
3.1.3. Lattice destruction. Unlike the overall decay and
specific changes discussed above, lattice destruction is a
sporadic phenomenon; when it occurs, it is highly nonlinear
with respect to dose. This behavior indicates the involvement
of higher order processes, for example the accumulation of
nanoscale gas bubbles (Garrido et al., 2008; Massover, 2007;
Leapman & Sun, 1995). Similar to the case of radiation-
induced specific changes, the chemistry and physics of lattice
destruction are poorly understood.
Lattice destruction manifests itself as a dramatic increase of
crystal mosaicity, changes in diffraction spot profiles, a sudden
appearance of patterned diffused scattering and changes in
diffraction intensities. If such effects appear, the subsequent
diffraction data are worthless for structure determination.
The crystal of the Midwest Center for Structural Genomics
target APC5871 is a good example of the lattice-destruction
phenomenon. Diffraction data for a continuous 220� of
oscillation range, with an oscillation step of 0.5�, were
acquired for this target and all the diffraction images had a
diffraction pattern that extended to high resolution. However,
data processing revealed a sudden and fast increase in both
mosaicity and relative B factor starting at around image 180
(Fig. 5). Efforts to use all the integrated data did not lead to
structure solution. In space group P21 the first 180 images were
not sufficient to obtain a complete data set. However, using
this data set derived only from the well scaling part of
diffraction data, which was about 90% complete in terms of
unique reflections, resulted in structure solution (data not
shown). Considering the nonlinearity of the changes for the
total oscillation range and the very low multiplicity of obser-
vations for Bijvoet pairs in the data set trimmed to 180 images,
the approach of describing the radiation damage by adding
parameters for each unique index could not improve the
situation in this case. Therefore, where lattice destruction is
present, a nonparametric approach in which only part of the
data are used seems to be the optimal strategy.
3.2. Radiation damage and phasing strategies
In a macromolecular crystallographic experiment, crystal
destruction, arising either from lattice disorder or radiation-
induced overall decay, cannot be overcome. For an average
experiment, this effective limit is reached when the scaling B
factor (Brel) reaches the range 10–40 A2. Traditional diffrac-
tion data-processing analysis ignores radiation-induced
specific changes, generating negative quality-assessment
statistics when such changes are comparable to or larger than
other measurement errors. In consequence, frequently the
strategy is to minimize the exposure and, as a byproduct, to
also limit the overall decay by collecting a much smaller
number of diffracted photons than physics allows. However,
even when complete coverage of reciprocal space is achieved,
i.e. a complete data set is acquired, it is still worthwhile con-
tinuing data collection to improve the overall multiplicity of
observations and counting statistics (Dauter et al., 1999).
Owing to the overall decay of diffraction intensities, the gain
from additional data decreases over the time of data collec-
tion. However, as the overall decay is fully corrected in the
data analysis and the data are properly weighted (x3.1.1;
Otwinowski et al., 2003), these weaker observations improve
the overall data quality even if statistics such as Rmerge, Rsym,
Rp.i.m. and Rr.i.m. (reviewed in Weiss, 2001) unweighted for
radiation decay may be pointing the other way. The impact of
both corrected and uncorrected specific radiation-induced
changes is more complex than that of the overall decay and
how we should approach these changes depends on the choice
of phasing strategy.
3.2.1. Experimental phasing versus direct methods. Mole-
cular and isomorphous replacement as well as phase-extension
methods are phasing techniques that rely on native intensities
only. Even uncorrected specific radiation-induced changes
that are large in comparison to the measurement error still
represent a relatively small fraction of native intensities, so
they essentially have no influence on our ability to solve
structures using direct methods. To a good approximation, a
data set uncorrected for radiation-induced specific changes
represents a structure in the middle of data collection
(Ramagopal et al., 2005; Zwart et al., 2004; Borek et al., 2007),
which is somewhat altered in terms of the occupancy of
particular atoms but not significantly rearranged. In terms of
the difficulty of solving the structure using native intensities,
there is no difference between a pristine structure and the
structure in the middle of data collection. If the radiation-
induced specific changes are ignored in the data analysis, the
refined model represents the structure that has already been
research papers
Acta Cryst. (2010). D66, 426–436 Borek et al. � Radiation damage 433
Figure 5Lattice destruction in an APC5871 crystal. The figure shows a dramaticincrease in mosaicity at image 180, suggesting progressive latticedestruction.

irradiated. In many cases, even with high radiation doses,
modeling of such a dose-averaged state will not distort
biological interpretations. However, if the structural model is
used to answer questions involving, for example, changes of
redox state, light (radiation) sensitive centers or heavy-atom
clusters, then caution should be exercised when interpreting
such structural models, regardless of the approach used for
phasing. In such cases a parametric approach involving
extrapolating intensities to zero dose may be highly beneficial
for biological and chemical interpretations and data-collection
strategies should be adjusted accordingly to optimize the use
of a parametric approach.
In the case of the SAD and MAD types of experimental
phasing, the phasing signal is defined by relatively small
differences that could easily be smaller than radiation-induced
specific changes over the lifetime of the crystal (Table 2;
Borek et al., 2003; Bourenkov & Popov, 2006). Additionally, in
specific cases the heavy-atom scatterers used for phasing may
undergo fast specific changes (Ramagopal et al., 2005; Ennifar
et al., 2002; Holton, 2007). These situations create both
problems and opportunities. When using a parametric
approach to obtain zero-dose intensities, the main problem
arises from the need to simultaneously determine a number of
parameters for each unique hkl index: the zero-dose extra-
polated intensity Id0, the Bijvoet difference, the native inten-
sity linear rate of change with respect to dose and potentially
other parameters, e.g. the Bijvoet difference rate of change or
the native intensity quadratic and higher order dependence on
dose. For typical experiments, the level of measurement error
is comparable to the magnitude of all the parameters other
than Id0, so multiparameter determination of their values with
a limited number of observations is potentially unstable unless
special care is taken, for example by using Tikhonov regu-
larization (Tikhonov & Arsenin, 1977). After these para-
meters have been determined, the opportunity arises to use
them as an additional phasing source if a model of specific
changes can be generated. One of the possible examples is the
case of a heavy-atom scatterer that diffuses far enough to be
considered as an atom that disappears during exposure and
with an occupancy modeled in a dose-dependent (or time-
dependent) fashion (Schiltz & Bricogne, 2007; Schiltz et al.,
2004). In practice, this situation is likely to happen for mercury
covalently bound to sulfur in cysteine (Ramagopal et al., 2005)
and for halogen atoms in derivatives of nucleotides (Ennifar et
al., 2002). In typical cases the situation is more complicated, as
the majority of changes may be scattered over a large number
of places (Borek et al., 2007). Also, since other heavy atoms
diffuse by short distances, they would have to be modeled as
changing shape during the experiment rather than as disap-
pearing. However, even a very rough approximation of atoms
disappearing rather than changing shape may sometimes work
if high-resolution data are available; so, for instance, the BPTI
case (Fig. 3) can be solved from radiation-induced changes at S
atoms (data not shown).
Specific changes can be considered as non-isomorphism
induced by X-rays during data collection. However, there are
potentially other sources of non-isomorphism that may inter-
fere with phasing and with estimation of the magnitude of
specific radiation-induced changes.
3.2.2. Sources of non-isomorphism in data. There are four
main sources of usually undesired non-isomorphism in data:
(i) rotational pseudosymmetries which are too weak to be
considered a lower symmetry case; (ii) variability of the crystal
lattice periodicity (unit-cell parameters) within the crystal, for
example induced by a variable rate of cooling during cryo-
preservation; (iii) variability between crystals, either sponta-
neous or induced by soaking; and (iv) effects within crystals
induced by X-ray radiation during data collection.
When analyzing specific changes induced by radiation, it is
important to consider all other possible sources of non-
isomorphism because they may be a more significant source
of the problem than radiation damage itself. Additionally,
when analyzing the differences between symmetry-equivalent
measurements, we need to consider whether they arise from
dose-dependent effects or potentially from the other above-
mentioned sources.
3.2.3. The best crystal versus many crystals versus the onlycrystal. Nowadays, data from one crystal are typically used for
phasing. This strategy relies on choosing the best sample, for
which the most critical characteristics are (i) the size of the
sample, as it affects the diffraction power; (ii) microscopic
order, which should be the same for various samples of the
same type, but often, owing to variability in cryoprotection, is
not; (iii) macroscopic order, with the sample preferably being
a single crystal with a mosaicity small enough to avoid spot
overlaps; (iv) the types of non-isomorphism discussed in x3.2.2
and (v) a special case of macroscopic disorder, i.e. merohedral
twinning.
For particular projects, these characteristics may often be
correlated; for example, weak macroscopic order very often
correlates with non-isomorphism within the sample. The first
three characteristics are immediately visible in the data, but
the last two are only consequential during data merging or
phasing, with non-isomorphism often not being identified as
such. Non-isomorphism within the sample is often visible even
in the benchmark crystals, e.g. thaumatin or tetragonal lyso-
zyme. The choice of the best crystal should be made based
on minimizing all five types of problems mentioned above.
However, owing to merohedral twinning and non-
isomorphism usually becoming apparent after data collection,
the crystals are often selected based only on the first three
characteristics, even if sometimes it is better to sacrifice these
three to compensate for the impact of the last two.
The crystal size and the quality of its microscopic and
macroscopic orders correlate well with the values of various
types of Rmerge and Rsym indicators; for this reason, they have
frequently been used to select the best data set. However,
when applied to data with radiation damage these indicators
are quite misleading with respect to the optimal data-collec-
tion strategy, prompting experimenters to use less-than-
optimal levels of exposure. In most cases, even without
correcting for radiation-induced specific changes, more data or
data with higher exposure would be advantageous. When
using corrective procedures, the total exposure limit is deter-
research papers
434 Borek et al. � Radiation damage Acta Cryst. (2010). D66, 426–436
mined by the lifetime of the sample, which is typically in the
range 10–40 MGy, and one should take advantage of it
whenever possible. In terms of aquiring more information, the
point of diminishing returns depends on the initial diffraction
resolution limit. The rule of thumb is to limit the data to the
range where the Brel factor increases by two to four times the
inital resolution limit squared, e.g. for 3.0 A data it would be a
Brel increase of 18–36 A2, whereas for 1.0 A data it would be a
Brel increase of 2–4 A2.
An alternative to the best crystal strategy is to average the
data collected from many crystals. This was the original
strategy for macromolecules and works well when crystals are
isomorphous. For crystals that cannot be cryocooled, e.g. some
viruses, or for crystals that have too little diffracting power to
survive the collection of a complete data set, it may be the only
viable strategy. Multi-crystal data averaging works much
better with molecular-replacement and phase-extension
techniques, which use only native intensities. As the main
limitation in using many crystals is the non-isomorphism
between them, experimental phasing with many crystals is
particularly challenging. As the phasing differences in SAD
and MAD are typically small, constituting 2–5% of the native
signal, if multiple crystals have to be used for de novo struc-
ture determination, SIR and MIR methods have the advan-
tage of generating larger phasing differences, typically 10–
30% of the native signal. To efficiently use multiple crystals
for phasing it is beneficial to identify the sources of non-
isomorphism, e.g. do they result from variability in cryocooling
stabilization conditions? Are they induced by soaking with
particular concentrations of heavy-atom compound? Are the
crystals inherently polymorphic?
Sometimes only one promising crystal that is of sufficient
quality for complete data collection is available. In such a
situation, the best strategy is to collect a complete data set
with minimal exposure, followed by collecting data with higher
exposure. In the first data-collection round, the strongest
reflections are measured and represent the state of the rela-
tively undamaged structure. As these reflections have already
been precisely measured, we do not have to worry about
them being saturated at higher exposure levels. Additionally,
merging statistics from this first data set can predict the decay
rate, phasing signal magnitude and potential non-isomorph-
isms, allowing adjustment of the data-collection strategy.
3.2.4. Minimizing or maximizing the multiplicity ofobservations as a planning goal. There are two main deci-
sions to be made when planning an X-ray experiment. Firstly,
adjusting the total dose versus the extent of acceptable
radiation damage and, secondly, splitting the total dose
between individual exposures. Addressing these two questions
separately is the best way to arrive at the dose-per-exposure
decision. Increasing the multiplicity of observations, i.e.
extending the total oscillation range, averages out many
systematic errors that are differently affected in symmetrically
equivalent reflections. On the other hand, adding more read-
outs from energy-integrating detectors, e.g. charge-coupled
devices (CCDs) or image plates, slightly increases the random-
error component of merged intensity. The decision about how
many oscillations to collect is often affected by other factors,
e.g. detector read-out time, problems with handling large
volumes of data etc. These types of limitations are diminishing
very dynamically and their impact needs to be re-evaluated.
Historically, in many diffraction experiments the strategy of
data collection was adjusted to collect a complete data set with
minimal total oscillation range, which is equivalent to mini-
mizing the multiplicity of observations. Now it is clear that
the gain from increasing the multiplicity of observations while
keeping the total dose constant is significant (Dauter et al.,
1999) and modern data-collection strategies should accom-
modate this observation.
When determining specific radiation changes and poten-
tially other high-order terms, a high multiplicity of observa-
tions (at least eightfold) is particularly valuable. As the
technology evolves, the historical approach of minimizing the
multiplicity of observations should be re-evaluated and con-
sideration should be given to replacing it with lower levels of
controlled exposure, generating higher multiplicity of obser-
vations.
4. Summary
The last few years have brought strong X-ray sources, fast
detectors, vast computational speed and storage to macro-
molecular crystallography, removing previous limitations on
data collection and facilitating the determination of more
challenging crystallographic structures. This has brought into
focus new limitations, in particular those resulting from
radiation damage; consequently, the need to address them or
even to exploit them has arisen. Our article discusses this new
environment in which the analysis of specific radiation damage
begins to be considered; it is bound to become a major com-
ponent of future data analysis. The experimental approach will
evolve accordingly; in particular, a high multiplicity of obser-
vations will be acquired, observed structure factors will be
extrapolated to zero dose, heavy-atom-based phasing signals
will be corrected for specific radiation-induced changes and
possibly specific radiation damage will become more widely
used as a phasing component. Instead of radiation damage
being considered as diffraction-pattern decay and accordingly
corrected, it will be fully analyzed in all its complexity,
enabling the determination of large macromolecular struc-
tures with improved accuracy.
We would like to thank Halszka Czarnocka PhD for revi-
sion of the manuscript, all the researchers who provided the
test data sets used to develop the methods applied in this
manuscript and the 19-ID and 19-BM beamline staff (Randy
Alkire PhD, Marianne Cuff PhD, Norma Duke PhD, Young-
chang Kim PhD, Jerzy Osipiuk PhD and Frank Rotella PhD)
for their help in data-collection and analysis. This work was
supported by NIH grant GM053163. The results shown in this
report are derived from work performed at Argonne National
Laboratory, Structural Biology Center at the Advanced
Photon Source. Argonne is operated by UChicago Argonne
research papers
Acta Cryst. (2010). D66, 426–436 Borek et al. � Radiation damage 435

LLC for the US Department of Energy, Office of Biological
and Environmental Research under contract DE-AC02-
06CH11357.
References
Addlagatta, A., Krzywda, S., Czapinska, H., Otlewski, J. & Jaskolski,M. (2001). Acta Cryst. D57, 649–663.
Arnott, S. & Wonacott, A. J. (1966). Polymer, 7, 157–166.Banumathi, S., Zwart, P. H., Ramagopal, U. A., Dauter, M. & Dauter,
Z. (2004). Acta Cryst. D60, 1085–1093.Blake, C. C. F. & Phillips, D. C. (1962). Symposium on the Biological
Effects of Ionizing Radiation at the Molecular Level, pp. 183–191.Vienna: International Atomic Energy Agency.
Borek, D., Ginell, S. L., Cymborowski, M., Minor, W. & Otwinowski,Z. (2007). J. Synchrotron Rad. 14, 24–33.
Borek, D., Minor, W. & Otwinowski, Z. (2003). Acta Cryst. D59,2031–2038.
Bourenkov, G. P. & Popov, A. N. (2006). Acta Cryst. D62, 58–64.Burmeister, W. P. (2000). Acta Cryst. D56, 328–341.Dauter, Z., Dauter, M., de La Fortelle, E., Bricogne, G. & Sheldrick,
G. M. (1999). J. Mol. Biol. 289, 83–92.Diederichs, K., McSweeney, S. & Ravelli, R. B. G. (2003). Acta Cryst.
D59, 903–909.Ennifar, E., Carpentier, P., Ferrer, J.-L., Walter, P. & Dumas, P. (2002).
Acta Cryst. D58, 1262–1268.Futterer, K., Ravelli, R. B. G., White, S. A., Nicoll, A. J. & Allemann,
R. K. (2008). Acta Cryst. D64, 264–272.Garrido, F., Vincent, L., Nowicki, L., Sattonnay, G. & Thome, L.
(2008). Nucl. Instrum. Methods Phys. Res. B, 266, 2842–2847.Giacovazzo, C., Siliqi, D. & Garcıa-Rodrıguez, L. (2001). Acta Cryst.
A57, 571–575.Henderson, R. (1995). Q. Rev. Biophys. 28, 171–193.Holton, J. M. (2007). J. Synchrotron Rad. 14, 51–72.Kmetko, J., Husseini, N. S., Naides, M., Kalinin, Y. & Thorne, R. E.
(2006). Acta Cryst. D62, 1030–1038.Kulmala, S., Kulmala, A., Ala-Kleme, T., Hakanen, A. & Haapakka,
K. (1997). Anal. Chim. Acta, 340, 245–256.Leapman, R. D. & Sun, S. Q. (1995). Ultramicroscopy, 59, 71–79.Machius, M., Brautigam, C. A., Tomchick, D. R., Ward, P.,
Otwinowski, Z., Blevins, J. S., Deka, R. K. & Norgard, M. V.(2007). J. Mol. Biol. 373, 681–694.
Massover, W. H. (2007). J. Synchrotron Rad. 14, 116–127.Minor, W., Cymborowski, M., Otwinowski, Z. & Chruszcz, M. (2006).
Acta Cryst. D62, 859–866.Murray, J. & Garman, E. (2002). J. Synchrotron Rad. 9, 347–354.Murray, J. W., Rudino-Pinera, E., Owen, R. L., Grininger, M., Ravelli,
R. B. G. & Garman, E. F. (2005). J. Synchrotron Rad. 12, 268–275.
O’Neill, P., Stevens, D. L. & Garman, E. (2002). J. Synchrotron Rad. 9,329–332.
Otwinowski, Z., Borek, D., Majewski, W. & Minor, W. (2003). ActaCryst. A59, 228–234.
Otwinowski, Z. & Minor, W. (1997). Methods Enzymol. 276, 307–326.Otwinowski, Z. & Minor, W. (2000). International Tables for
Crystallography, Vol. F, edited by M. G. Rossmann & E. Arnold,pp. 226–235. Dordrecht: Kluwer Academic Publishers.
Owen, R. L., Rudino-Pinera, E. & Garman, E. F. (2006). Proc. NatlAcad. Sci. USA, 103, 4912–4917.
Paithankar, K. S., Owen, R. L. & Garman, E. F. (2009). J. SynchrotronRad. 16, 152–162.
Patten, F. & Gordy, W. (1960). Proc. Natl Acad. Sci. USA, 46, 1137–1144.
Popov, A. N. & Bourenkov, G. P. (2003). Acta Cryst. D59, 1145–1153.Ramagopal, U. A., Dauter, Z., Thirumuruhan, R., Fedorov, E. &
Almo, S. C. (2005). Acta Cryst. D61, 1289–1298.Ravelli, R. B. G., Leiros, H.-K. S., Pan, B. C., Caffrey, M. &
McSweeney, S. (2003). Structure, 11, 217–224.Ravelli, R. B. G. & McSweeney, S. M. (2000). Structure, 8, 315–328.Ravelli, R. B. G., Theveneau, P., McSweeney, S. & Caffrey, M. (2002).
J. Synchrotron Rad. 9, 355–360.Saran, M., Bors, W. & Lester, P. (1994). Methods Enzymol. 233, 20–34.Schiltz, M. & Bricogne, G. (2007). J. Synchrotron Rad. 14, 34–42.Schiltz, M., Dumas, P., Ennifar, E., Flensburg, C., Paciorek, W.,
Vonrhein, C. & Bricogne, G. (2004). Acta Cryst. D60, 1024–1031.Sippel, K. H., Robbins, A. H., Reutzel, R., Domsic, J., Boehlein, S. K.,
Govindasamy, L., Agbandje-McKenna, M., Rosser, C. J. &McKenna, R. (2008). Acta Cryst. D64, 1172–1178.
Smith, P. J. C. & Arnott, S. (1978). Acta Cryst. A34, 3–11.Tikhonov, A. N. & Arsenin, V. Y. (1977). Solutions of Ill-posed
Problems. Washington: Winston & Sons.Weik, M., Ravelli, R. B. G., Kryger, G., McSweeney, S., Raves, M. L.,
Harel, M., Gros, P., Silman, I., Kroon, J. & Sussman, J. L. (2000).Proc. Natl Acad. Sci. USA, 97, 623–628.
Weik, M., Ravelli, R. B. G., Silman, I., Sussman, J. L., Gros, P. &Kroon, J. (2001). Protein Sci. 10, 1953–1961.
Weiss, M. S. (2001). J. Appl. Cryst. 34, 130–135.Wenger, O. S., Leigh, B. S., Villahermosa, R. M., Gray, H. B. &
Winkler, J. R. (2005). Science, 307, 99–102.Yang, C., Courville, A. & Ferrara, J. D. (1999). Acta Cryst. D55, 1681–
1689.Yano, J., Kern, J., Irrgang, K. D., Latimer, M. J., Bergmann, U.,
Glatzel, P., Pushkar, Y., Biesiadka, J., Loll, B., Sauer, K., Messinger,J., Zouni, A. & Yachandra, V. K. (2005). Proc. Natl Acad. Sci. USA,102, 12047–12052.
Zwart, P. H., Banumathi, S., Dauter, M. & Dauter, Z. (2004). ActaCryst. D60, 1958–1963.
research papers
436 Borek et al. � Radiation damage Acta Cryst. (2010). D66, 426–436
Related Documents