Differential Synaptic Input to External Globus Pallidus Neuronal Subpopulations In Vivo. Maya Ketzef & Gilad Silberberg Department of Neuroscience, Karolinska Institutet, Stockholm 17177, Sweden. Lead contact: Gilad Silberberg Corresponding authors: [email protected] & [email protected] Summary The rodent external Globus Pallidus (GPe) contains two main neuronal subpopulations, prototypic and arkypallidal cells, which differ in their cellular properties. Their functional synaptic connectivity is, however, largely unknown. Here, we studied the membrane properties and synaptic inputs to these subpopulations in the mouse GPe. We obtained in vivo whole-cell recordings from identified GPe neurons and used optogenetic stimulation to dissect their afferent inputs from the striatum and subthalamic nucleus (STN). All GPe neurons received barrages of excitatory and inhibitory input during slow wave activity. The modulation of their activity was cell-type specific and shaped by their respective membrane properties and afferent inputs. Both GPe subpopulations received synaptic input from STN and striatal projection neurons (MSNs). STN and indirect pathway MSNs strongly targeted prototypic cells while direct pathway MSNs selectively inhibited arkypallidal cells. We show that GPe subtypes are differently embedded in the basal ganglia network, supporting distinct functional roles. Keywords: external globus pallidus, in vivo, whole-cell recordings, optogenetics, arkypallidal, prototypic, striatum, subthalamic nucleus, excitation inhibition balance, . CC-BY-NC-ND 4.0 International license author/funder. It is made available under a The copyright holder for this preprint (which was not peer-reviewed) is the . https://doi.org/10.1101/2020.02.27.967869 doi: bioRxiv preprint

Welcome message from author
This document is posted to help you gain knowledge. Please leave a comment to let me know what you think about it! Share it to your friends and learn new things together.
Transcript
1
Differential Synaptic Input to External Globus Pallidus Neuronal Subpopulations In Vivo.
Maya Ketzef & Gilad Silberberg
Department of Neuroscience, Karolinska Institutet, Stockholm 17177, Sweden.
Lead contact: Gilad Silberberg
Corresponding authors: [email protected] & [email protected]
Summary
The rodent external Globus Pallidus (GPe) contains two main neuronal subpopulations,
prototypic and arkypallidal cells, which differ in their cellular properties. Their functional
synaptic connectivity is, however, largely unknown. Here, we studied the membrane
properties and synaptic inputs to these subpopulations in the mouse GPe. We obtained in vivo
whole-cell recordings from identified GPe neurons and used optogenetic stimulation to
dissect their afferent inputs from the striatum and subthalamic nucleus (STN). All GPe
neurons received barrages of excitatory and inhibitory input during slow wave activity. The
modulation of their activity was cell-type specific and shaped by their respective membrane
properties and afferent inputs. Both GPe subpopulations received synaptic input from STN
and striatal projection neurons (MSNs). STN and indirect pathway MSNs strongly targeted
prototypic cells while direct pathway MSNs selectively inhibited arkypallidal cells. We show
that GPe subtypes are differently embedded in the basal ganglia network, supporting distinct
functional roles.
Keywords: external globus pallidus, in vivo, whole-cell recordings, optogenetics,
arkypallidal, prototypic, striatum, subthalamic nucleus, excitation inhibition balance,
.CC-BY-NC-ND 4.0 International licenseauthor/funder. It is made available under aThe copyright holder for this preprint (which was not peer-reviewed) is the. https://doi.org/10.1101/2020.02.27.967869doi: bioRxiv preprint
2
Introduction
The Globus pallidus pars externa (GPe, also called the GP in rodents) is a central part of the
basal ganglia (BG). The GPe is composed of continuously active GABAergic neurons and is
traditionally considered part of the indirect pathway of the BG (Albin et al., 1989; DeLong,
1990). Within this framework, the GPe mainly projects to the output structures of the BG, the
substantia nigra pars reticulata (SNr) and the internal segment of the globus pallidus (GPi,
also referred to as entopeduncular nucleus in rodents), as well as the subthalamic nucleus
(STN). The cardinal input to the GPe is GABAergic inhibition from striatopallidal medium
spiny neurons (MSNs) of the indirect pathway, however, it is also reciprocally connected to
the STN (Kita et al., 1983; Kita and Kitai, 1991; Robledo and Feger, 1990) and receives input
from axon collaterals of striatonigral MSNs (Cazorla et al., 2014; Kawaguchi et al., 1990; Wu
et al., 2000). Thus, the GPe is positioned as a hub, which connects the main BG pathways:
the direct-, indirect-, and hyper-direct pathways (Mathai and Smith, 2011; Nambu et al.,
2002). Additionally, the GPe was shown to project to the cortex and thalamus (Mastro et al.,
2014; Saunders et al., 2015). This suggests that rather than acting as a relay station, the GPe
plays a far more central role in BG function than previously appreciated.
The GPe was traditionally regarded as a homogenous nucleus, yet already in early studies
(DeLong, 1971), different firing patterns of GPe neurons were described. It is now clear that
GPe neurons are divided into at least two subpopulations, with distinct electrophysiological
properties, developmental origins, molecular markers and projection targets (Abdi et al.,
2015; Dodson et al., 2015; Hernandez et al., 2015; Mallet et al., 2012; Mastro et al., 2014).
The majority of GPe neurons, namely prototypic cells, conform to the classic mode; they are
high frequency spiking neurons that project to downstream nuclei, with a small portion of
them also projecting to the striatum (Bevan et al., 1998; Dodson et al., 2015; Mallet et al.,
2012; Mastro et al., 2014; Saunders et al., 2016). Prototypic cells express the transcription
factor NK2 homeobox 1 (NKX2.1) (Abdi et al., 2015; Dodson et al., 2015) and to a lesser
degree also parvalbumin (PV) and LIM homeobox 6 (LHX6) (Abdi et al., 2015; Dodson et
al., 2015; Mallet et al., 2012; Mastro et al., 2014; Mastro et al., 2017). The other subtype of
GPe neurons consists of the arkypallidal cells, which are a smaller group of relatively less
active neurons that project exclusively to the striatum (Mallet et al., 2012). These neurons
express the transcription factor forkhead box protein P2 (FoxP2) (Abdi et al., 2015; Dodson
et al., 2015), the neuropeptide precursor preproenkephalin (PPE) (Hoover and Marshall,
.CC-BY-NC-ND 4.0 International licenseauthor/funder. It is made available under aThe copyright holder for this preprint (which was not peer-reviewed) is the. https://doi.org/10.1101/2020.02.27.967869doi: bioRxiv preprint
3
2002; Mallet et al., 2012) and the neuronal PAS domain protein 1 (NPas1) (Hernandez et al.,
2015).
The marked differences between the two main subtypes of GPe neurons suggest that they
have different functional roles, which would be further supported by distinct sets of afferent
synaptic inputs on top of differences in membrane properties that were mostly described ex
vivo thus far. The functional organization of synaptic inputs to the two different GPe
subtypes is, however, largely unknown. In order to accurately position the GPe within the BG
functional scheme, it is imperative to characterize the afferent synaptic inputs to the different
subtypes of GPe neurons. Here, we studied the GPe using in vivo whole-cell recordings,
enabling us to characterize the membrane properties, synaptic input, and activity of identified
prototypic and arkypallidal cells in the intact brain. We quantified the afferent inputs to the
respective cell types from STN and striatum, and also showed intra-pallidal connectivity
between the two cell types.
Results
Whole-cell recordings were obtained from neurons in the GPe of anesthetized mice (figure
1A-B), and indicated the existence of at least two main GPe neuronal subtypes. Most
recorded neurons were spontaneously active with high firing rates (Figure 1 C and F), had
depolarized membrane potential values (Figure 1 C and E), and paused or reduced their firing
rate during cortical slow wave “up-states” (Figure 1 C). These neurons were further classified
as prototypic GPe cells using two independent measures. Classification was done either post
hoc by immunostaining for FoxP2 (Figure 1 C, left), or during recordings using the
“optopatcher” (Katz et al., 2013; Ketzef et al., 2017) in Channelrhodopsin (ChR2) expressing
cells of NKX2.1-ChR2 (17 cells from 15 mice) or PV-ChR2 mice (3 cells in 3 mice) (Figure
S1). A smaller fraction of recorded neurons were silent (see example in S3) or fired at lower
average frequencies (Figure 1 D and F), had more hyperpolarized membrane potential
(Figure 1 D and E), and depolarized during cortical up-states (Figure 1 D). These neurons
were identified post hoc as arkypallidal cells as they expressed FoxP2 (Figure 1 D, left).
These activity profiles are in agreement with previous descriptions using extracellular
recording methods (Abdi et al., 2015; Dodson et al., 2015; Mallet et al., 2012) and suggest
that during cortical up-states, arkypallidal cells are largely excited while prototypic cells are
.CC-BY-NC-ND 4.0 International licenseauthor/funder. It is made available under aThe copyright holder for this preprint (which was not peer-reviewed) is the. https://doi.org/10.1101/2020.02.27.967869doi: bioRxiv preprint

4
inhibited. These results point towards a clear distinction between the two main GPe
subpopulations recorded in vivo, which could reflect differences in their synaptic inputs and
membrane properties.
Electrophysiological properties of GPe cells in vivo
We used whole-cell recordings in vivo to extract and compare the membrane properties of
molecularly identified prototypic and arkypallidal cells. Prototypic cells (P) were
significantly more depolarized than arkypallidal cells (A) (P: -46.09 ± 0.55, A: -60.60 ± 0.95
mV, p < 0.001), fired spontaneously at higher average rates (P: 14.20 ± 1.14, A: 0.58 ± 0.26
Hz, p < 0.001), and had larger sag ratios (P: 1.10 ± 0.01, A: 1.06 ± 0.01, p < 0.001) (n = 44
prototypic, 32 arkypallidal cells, Figure 2A-B). Other membrane properties such as input
resistance (P: 0.22 ± 0.01, A: 0.23 ± 0.01 GΩ, p = 0.55) were not different between the
groups. In order to identify cell types in an unbiased manner based on their
electrophysiological properties, we performed unsupervised clustering of 259 recorded GPe
neurons, as previously described for slice recordings (Abrahao and Lovinger, 2018) (Figure
2C). The clustered data showed an initial division into two main groups that corresponded to
the molecularly defined subgroups of prototypic and arkypallidal cells (Figure 2C). The two
groups differed in various electrical properties, including both subthreshold properties and
features of their action potential (AP) firing (Figure 2D). Prototypic cells fired more regularly
(lower CVisi) than arkypallidal cells (P: 0.99 ± 0.04, A: 1.31 ± 0.06, p < 0.001) and had
smaller AP amplitudes (P: 47.30 ± 0.96, A: 56.29 ± 1.59 mV, p < 0.001). These properties
accompanied the significant differences observed in their membrane potential (P: -46.14 ±
0.25, A: -58.34 ± 0.55 mV, p < 0.001), average spontaneous firing frequency (P: 14.22 ±
0.58, A: 1.08 ± 0.18 Hz, p < 0.001) and sag ratio (P: 1.12 ± 0.01, A: 1.05 ± 0.01, p < 0.001),
already described for identified cells (n = 175 prototypic cells, n = 84 arkypallidal cells,
Figure 2D). Input resistance (P: 0.23 ± 0.01, A: 0.22 ± 0.01 GΩ), AP half width (P: 0.60 ±
0.02, A: 0.66 ± 0.04 ms) and AP afterhyperpolarization (P: -5.59 ± 0.17, A: -6.22 ± 0.35 mV)
did not differ between the classified groups (p > 0.153).
The hierarchical cluster analysis showed that while the classified prototypic and arkypallidal
cells diverge very early on, prototypic cells can be further divided into two groups. Although
no molecular markers were used to distinguish between the subgroups of prototypic cells, we
compared the membrane properties of the three groups created by the classifier (Figure S2).
.CC-BY-NC-ND 4.0 International licenseauthor/funder. It is made available under aThe copyright holder for this preprint (which was not peer-reviewed) is the. https://doi.org/10.1101/2020.02.27.967869doi: bioRxiv preprint

5
The same electrophysiological properties used to separate prototypic and arkypallidal cells
were used to further classify the two types of prototypic cells (P1 and P2). Both membrane
potential (P1: -47.56 ± 0.28, P2: -44.45 ± 0.36, A: -58.34 ± 0.55 mV) and spontaneous firing
frequency (P1: 8.73 ± 0.33, P2: 20.75 ± 0.69, A: 1.08 ± 0.18 Hz) were different between all
three groups (p < 0.001). The sag ratio, however (P1: 1.12 ± 0.01, P2: 1.11 ± 0.01, A: 1.05 ±
0.01), was not different between the two prototypic groups (p = 0.93) but did differ between
either of the prototypic groups and arkypallidal cells (p < 0.001). We thus named the two
subgroups of the prototypic cells: ‘slow’ (SP, previously P1) and ‘fast’ (FP, previously P2)
reflecting the differences in firing rate and membrane potential (n = 80 FP cells, and n = 95
SP cells). A three group comparison revealed differences in the regularity of spontaneous
firing, with the fast prototypic cells having lower CVisi than the other types (FP: 0.86 ± 0.05,
SP: 1.09 ± 0.06, A: 1.30 ± 0.06, p < 0.001), as well as smaller AP amplitudes (FP: 42.73 ±
1.20, SP: 50.69 ± 1.30, A: 56.29 ± 1.59 mV, p < 0.01). No differences were found in input
resistance (FP: 0.23 ± 0.01, SP: 0.23 ± 0.01, A: 0.22 ± 0.01 GΩ, p = 0.58), AP half width
(FP: 0.59 ± 0.02, SP: 0.61 ± 0.03, A: 0.67 ± 0.04 ms, p = 0.24), and AP
afterhyperpolarization (FP: -5.33 ± 0.27, SP: -6.05 ± 0.26, A: -6.26 ± 0.36 mV, p = 0.11).
These data show that by extracting membrane properties recorded in vivo, GPe neurons can
be classified into the previously defined prototypic and arkypallidal cells. The same
classification algorithm also indicates the existence of subgroups within the prototypic cell
population with distinct electrophysiological properties.
Both GPe cell types receive excitatory and inhibitory inputs during slow wave activity
The opposite modulation of GPe cell types during up-states (recorded in cortical LFP, Figure
1) could be due to differences in their membrane properties (Figure 2) as well as differences
in the synaptic inputs they receive during up-states. In order to explore these two possibilities,
we manipulated the membrane potentials of recorded neurons by injecting negative and
positive holding currents via the patch-pipette (Figure S3). When hyperpolarizing prototypic
cells, the activity coinciding with the up-states reversed polarity and was now depolarizing,
occasionally enabling firing during cortical up-states. This indicates that during up-states
prototypic cells do not only receive inhibitory input, but also an excitatory component.
Conversely, depolarization of arkypallidal cells reversed their modulation during cortical up-
states, which now resulted in hyperpolarization and reduction in firing rate, as observed in
.CC-BY-NC-ND 4.0 International licenseauthor/funder. It is made available under aThe copyright holder for this preprint (which was not peer-reviewed) is the. https://doi.org/10.1101/2020.02.27.967869doi: bioRxiv preprint
6
prototypic cells (Figures 3 and S3). These data suggest that during slow wave activity, both
prototypic and arkypallidal cells receive a barrage of mixed excitatory and inhibitory inputs,
and that the modulation of their spiking during up-states depends on their respective
membrane potentials and baseline activity levels.
Although both cell types receive inhibitory and excitatory inputs during up-states, the
respective magnitudes of these components could differ and shape the responses in a cell-
type specific manner. In order to quantify such differences we calculated the correlation
coefficient between the cortical LFP and the membrane potential of GPe cells (Figure 3, See
Methods). This analysis enabled us to determine the polarity and degree of up-state
modulation of whole-cell recorded neurons. The correlation coefficient of classified
prototypic and arkypallidal cells differed in both magnitude and polarity (Figure 3A-C, P: -
0.07 ± 0.03, A: 0.35 ± 0.03, p < 0.001). While almost all arkypallidal cells (96.7%) had
positive correlation coefficients indicating depolarization during up-states, prototypic cells
were, on average, only weakly and negatively modulated by cortical activity (the average
correlation coefficient was slightly negative). Correlation coefficient values also differed
when recorded neurons were further divided into three subpopulations (arkypallidal, slow
prototypic, and fast prototypic cells). Most fast prototypic cells (89.6%) had negative
correlation coefficient values with the cortical LFP, while slow prototypic cells had both
positive (61%) and negative (39%) correlation coefficient values, which averaged around
zero (SP: 0.07 ± 0.04, FP: -0.26 ± 0.04, A: 0.35 ± 0.03, p < 0.001, Figure 3B-C). This
analysis further shows that the three GPe subpopulations responded differently to the
barrages of synaptic input during slow wave oscillations.
In a subset of neurons, we recorded the ongoing activity of the same cells at different
membrane potential values by injecting different holding currents via the patch-pipette
(Figure 3D-E, S3), enabling us to calculate the correlation coefficient for each condition. We
could then approximate the membrane potential at which correlation coefficient values
changed from positive to negative, thereby indicating a “functional reversal potential” for the
compound inputs during up-states. This value was more depolarized for arkypallidal cells
compared to prototypic cells (P: -52.24 ± 0.93, A: -46.17 ± 1.21 mV, p < 0.001 for two group
comparison, n = 55 prototypic, n = 23 arkypallidal cells). Arkypallidal cells differed from
both prototypic subgroups (SP: -50.92 ± 1.19, FP: -53.95 ± 1.42, A: -46.17 ± 1.21 mV, p <
0.02) and no difference was found between the two prototypic subtypes (p = 0.21, n = 31 FP,
n = 24 SP, Figure 3F). Most recorded neurons, regardless of their type, were found to be
.CC-BY-NC-ND 4.0 International licenseauthor/funder. It is made available under aThe copyright holder for this preprint (which was not peer-reviewed) is the. https://doi.org/10.1101/2020.02.27.967869doi: bioRxiv preprint

7
positively correlated with the cortical LFP during negative current injections, and vice versa,
negatively correlated with the cortical LFP during positive current injections (Figure 3G).
Put together, these results suggest that prototypic and arkypallidal cells receive different
compositions of excitatory and inhibitory synaptic inputs during slow wave activity. The
modulation of their respective activities is, therefore, determined both by cell-type specific
membrane properties and synaptic inputs. We next aimed to dissect the synaptic inputs to the
respective GPe cell types from the local GPe circuitry, the STN, and the two types of striatal
MSNs.
Prototypic cells inhibit arkypallidal cells
Intra-pallidal connectivity may play an important role in GPe function, especially due to the
perisomatic location of the local inhibitory synapses (Gross et al., 2011). Anatomical data
(Sadek et al., 2007) and ex vivo recordings in slices (Bugaysen et al., 2013) have revealed
only sparse connectivity amongst GPe cells, but it has been predicted that a primary intra-
pallidal synaptic pathway exists from prototypic to arkypallidal cells (Nevado-Holgado et al.,
2014). To study the synaptic interactions between GPe cells, we virally expressed ChR2 in
the GPe of NKX2.1-Cre mice (Figure 4A-B). During in vivo recordings, we activated neurons
with an optic fiber placed dorsally to the GPe (Figure 4A-B). ChR2-expressing prototypic
cells responded to photostimulation with strong, reliable and sustained depolarization,
superimposed by APs, even with very low light intensities (less than 0.2 mW, Figure 4D, G).
The onset of light responses indicated a direct optogenetic excitation of recorded prototypic
cells (0.43 ± 0.08 ms, n = 10, Figure 4 H). In contrast, arkypallidal cells were strongly
inhibited by photostimulation (Figure 4 F, G and I) with onset delays suggesting
monosynaptic inhibition (4.71 ± 0.37 ms, n = 5, Figure 4 H). The reversal potential of
inhibitory responses was ~-75 mV, corresponding to the expected value for GABAergic
inhibition (Figure S4). In two cases we recorded from a prototypic cells (FoxP2 negative) that
did not virally express ChR2 (Figure 4E, G and J). Photostimulation of neighboring
prototypic cells induced inhibitory synaptic responses in these cells (Figure 4 E, G and J,
onset latency similar to arkypallidal cells, Figure 4 H), showing the existence of inhibition
among prototypical cells. These results show that prototypic cells provide strong and reliable
inhibition to arkypallidal cells and are also interconnected among themselves. It also suggests
.CC-BY-NC-ND 4.0 International licenseauthor/funder. It is made available under aThe copyright holder for this preprint (which was not peer-reviewed) is the. https://doi.org/10.1101/2020.02.27.967869doi: bioRxiv preprint
8
that in addition to afferent excitation, arkypallidal cells are also disinhibited during up-states
due to the reduction in spiking of prototypic cells.
STN provides afferent excitatory input to both GPe cell types
The STN is reciprocally connected to the GPe and has been considered to be the main source
of excitatory input to the GPe (Kita et al., 1983; Kita and Kitai, 1991; Pamukcu et al., 2020).
To study the STN inputs to GPe, we expressed ChR2 in STN neurons using retrograde viral
transduction in vglut2-Cre mice (Figure 5 A, see methods). We then recorded the responses
of GPe cells to photostimulation of STN cells through a fiber placed above the STN (Figure
5A-B). All recorded GPe cells responded to STN photostimulation (Figure 5 C), however,
there were differences in responses properties. The amplitude of the initial response phase
was not significantly different between prototypic and arkypallidal cells (P: 13.62 ± 1.43, A:
9.12 ± 1.59 mV, n = 19 prototypic and 6 arkypallidal cells, p = 0.055, Figure 5 D-F), nor was
there a difference in onset delays (P: 4.75 ± 0.14, A: 4.35 ± 0.1 ms, p = 0.14, Figure 5 G). In
contrast, photostimulation with a 500 ms light pulse induced a sustained depolarization in
prototypic cells (Figure 5 D) but only a transient response in arkypallidal cells (Figure 5 E).
The response amplitudes measured at the end of the light pulse were strongly reduced in
arkypallidal cells compared with their initial response amplitudes (start: 9.12 ± 1.59, end:
3.49 ±1.02 mV, p < 0.001), but not in prototypic cells (start: 13.62 ± 1.43, end: 14.32 ± 1.59
mV, p = 0.61, Figure 5 F). Photostimulation of the STN while holding GPe cells at -45 mV
resulted in continuous depolarization of prototypic cells (Figure 5 H), in contrast to a brief
depolarization followed by sustained hyperpolarization of arkypallidal cells (Figure 5 I),
likely to originate from activated prototypic cells (Figure 4). Nevertheless, photostimulation
of STN with a high frequency train (20 pulses at 20 Hz, Figure S5) induced depolarizing
responses that enabled firing of action potentials in both cell types. These results show that
while STN provides excitatory synaptic input to both GPe populations, the impact of this
input is cell-type specific and shaped by intra-pallidal connectivity.
Target selectivity in striato-pallidal inhibition
The major source of inhibition to the GPe is attributed to the striatum and particularly to
indirect pathway MSNs (iMSNs), however, axon collaterals of direct pathway MSNs
.CC-BY-NC-ND 4.0 International licenseauthor/funder. It is made available under aThe copyright holder for this preprint (which was not peer-reviewed) is the. https://doi.org/10.1101/2020.02.27.967869doi: bioRxiv preprint

9
(dMSNs) were also shown to project to the GPe (Cazorla et al., 2014; Kawaguchi et al., 1990;
Wu et al., 2000). In order to understand how the two types of MSN inhibit GPe
subpopulations, we expressed ChR2 in either direct or indirect pathway MSNs and recorded
the synaptic responses in GPe neurons to striatal photostimulation. To study the inputs of
iMSNs to the GPe, we expressed ChR2 in iMSNs either virally using D2-Cre or A2A-Cre
mice (Figure 6 A-B), or in D2-Cre mice crossed with a ChR2 reporter mouse (Ai32, Figure
S6). As expected, in all experimental groups, prototypic cells were strongly inhibited by
photostimulation of iMSNs (Figure 6 C-E). It was thus expected that inhibition of prototypic
cells may cause depolarization of arkypallidal cells via disinhibition (Figure 4), however, in
all cases (Figure 6 C), arkypallidal cells responded to photostimulation by an initial
hyperpolarization (Figure 6 F-I), indicating direct inhibition by iMSNs. The initial
hyperpolarization was often followed by a delayed depolarization (Figure 6 H), likely to
originate from the reduced firing of neighboring prototypic cells (Figure 6 D). The amplitude
of inhibitory responses (Figure 6 J) was larger in prototypic cells compared to arkypallidal
cells held at similar membrane potential using current injections (P: -19.12 ± 0.54, A: -8.90 ±
1.37 mV, p < 0.001), and the onset delay (Figure 6 K) was not different (P: 7.34 ± 0.35, A:
8.60 ± 0.43 ms, p = 0.051, cells recorded in A2a-Cre or D2-Cre, n = 27 prototypic, n = 11
arkypallidal). Similar results were obtained in D2-ChR2 mice using the same experimental
configuration (Figure S6). These data suggest that while both prototypic and arkypallidal
cells receive inhibition from iMSNs, this inhibition is biased towards prototypic cells and can
induce a delayed disinhibition of arkypallidal cells.
To study the inputs from dMSNs to GPe cells, we virally expressed ChR2 in the striatum of
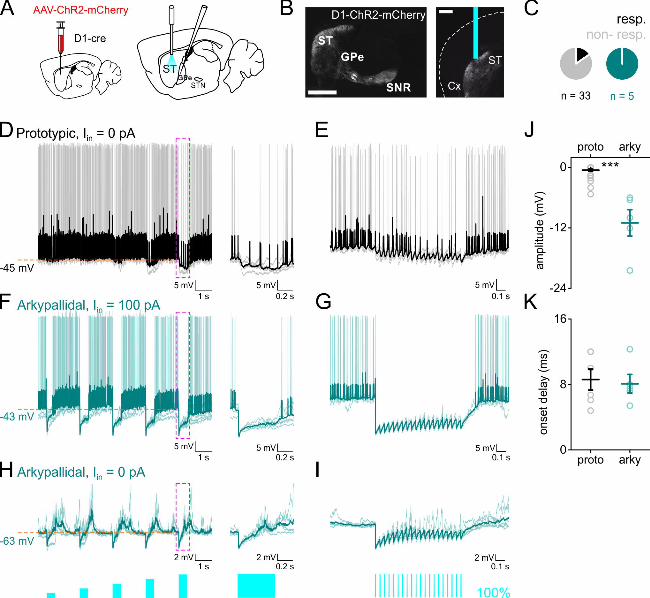
D1-Cre mice and positioned an optic fiber in the dorsolateral striatum (Figure 7 A-B). Out of
33 prototypic cells recorded, only 6 (18.18 %, 3 SP and 3 FP cells) showed measurable
responses to photostimulation (Figure 7 C-E). In contrast, all arkypallidal cells were inhibited
by dMSN photostimulation, as seen by short-latency hyperpolarization of membrane
potential and suppression of action potentials (n = 5, Figure 7 C, F-I). The amplitude of
inhibitory responses was larger in arkypallidal than in prototypic cells (P: -0.58 ± 0.24, A: -
10.99 ± 2.62 mV, p < 0.001, n = 33 prototypic and 5 arkypallidal cells, Figure 7 J), but no
difference was found in onset delay (P: 8.6 ± 1.28, A: 8.08 ± 1.14 ms, p = 0.99, n = 6
prototypic and 5 arkypallidal cells, Figure 7 K). These results indicate a strong bias in
dMSNs input to the GPe, with strong and prevalent inhibition of arkypallidal cells and only
sparse and weak inhibition of prototypic cells.
.CC-BY-NC-ND 4.0 International licenseauthor/funder. It is made available under aThe copyright holder for this preprint (which was not peer-reviewed) is the. https://doi.org/10.1101/2020.02.27.967869doi: bioRxiv preprint
10
Our results show that the different GPe cell types receive input from both STN and striatum,
however, there was pronounced target preference manifested in the response amplitudes,
kinetics, and connection probabilities. Interestingly, arkypallidal cells receive reliable
synaptic inputs from STN, dMSNs, and iMSNs, therefore linking them to the three main
basal ganglia pathways (Figure 8).
Discussion
In this study, we used in vivo whole-cell patch clamp recordings in mice to study the
membrane properties and network connectivity of GPe cells. To our knowledge this is the
first report of such recordings in the GPe, enabling the study of both sub- and suprathreshold
activity in the intact brain. Combining whole-cell recordings with optogenetics, we
characterized the membrane properties and afferent inputs to the different GPe
subpopulations. We show that during slow wave activity both prototypic and arkypallidal
cells receive barrages of excitatory and inhibitory inputs that, together with their
electrophysiological properties, pattern their spontaneous activity. Both GPe subpopulations
receive input from STN and striatum, but there is a clear target preference that biases these
afferent inputs, in particular the very weak input to prototypic cells from dMSNs. Notably,
arkypallidal cells receive direct pathway information from dMSNs, indirect pathway
information from iMSNs and prototypic cells, and hyper-direct input from the STN, thus
placing them as integrators of the three main BG pathways (Figure 8).
We identified cells as prototypic or arkypallidal cells primarily according to their expression
of the molecular markers FoxP2 and NKX2.1 thus dividing our recorded cells to prototypic
and arkypallidal cells, without further subdivision. FoxP2 is an accepted molecular marker
for the arkypallidal cells and it is rarely co-expressed with NKX2.1 or PV (Abdi et al., 2015;
Dodson et al., 2015; Hernandez et al., 2015). The activity of molecularly identified GPe cells
acquired using whole-cell in vivo recordings was in accordance with the activity described
thus far using extracellular recordings (Abdi et al., 2015; Dodson et al., 2015; Mallet et al.,
2012). Noteworthy, in some cases arkypallidal cells were completely silent under control
conditions, as previously reported (Mallet et al., 2012). Using data obtained from molecularly
identified cells we further classified cells based on their electrophysiological properties.
Employing unsupervised clustering we could then compare the membrane properties for a
total of 259 GPe cells and confirm the identity of the resulting groups according to the
.CC-BY-NC-ND 4.0 International licenseauthor/funder. It is made available under aThe copyright holder for this preprint (which was not peer-reviewed) is the. https://doi.org/10.1101/2020.02.27.967869doi: bioRxiv preprint
11
presence of the molecularly identified cells within them. Using this method, we explored the
membrane properties of a larger number of GPe cells recorded in vivo. As expected, we
found differences in spontaneous firing frequency and regularity of firing between our
putative prototypic and arkypallidal cells, previously described with extracellular recordings
(Abdi et al., 2015; Dodson et al., 2015; Mallet et al., 2012). In addition we found significant
differences in membrane potential, sag ratio and action potential amplitude values, some of
which were described using ex vivo recordings (Abdi et al., 2015; Abrahao and Lovinger,
2018; Hernandez et al., 2015; Mastro et al., 2014). The prototypic population could be further
subdivided into two main groups which we named “slow” and “fast” prototypic cells based
on their average spontaneous spiking frequency. Such division of the prototypic population
was suggested in previous studies based on their differential expression of molecular markers
and axonal projections (Abdi et al., 2015; Abecassis et al., 2020; Dodson et al., 2015;
Hernandez et al., 2015; Mastro et al., 2014). In this study, however, we did not find a clear
match between the prototypic subgroups to specific molecular markers, but this is an
important topic for future studies.
By performing whole-cell recordings from GPe cells we could use current injections to study
their afferent inputs during slow wave oscillations. Specifically, we evaluated the respective
contribution of excitatory and inhibitory inputs to the GPe subpopulations during cortical up-
states. We used the correlation coefficient between cortical slow wave activity and GPe cells
membrane potential as an approximation of the compound excitatory-inhibitory ratio of the
synaptic barrages. Although a more accurate estimation of this ratio could be obtained using
voltage-clamp with QX314 and cesium in the pipette solution, such conditions would prevent
extraction of the electrophysiological properties of recorded cells. Using the correlation
coefficient analysis, we could show that both cell populations received mixed excitatory and
inhibitory inputs during slow wave activity and that the excitation-inhibition balance was
cell-type specific.
Our data show that prototypic cells provide strong and reliable inhibition of arkypallidal cells
(Figure 4), implying that they are under tonic inhibition which is relieved transiently when
prototypic cells are inhibited. We also showed that prototypic cells are interconnected by
inhibitory synapses (Figure 4), however, the organization of this recurrent inhibition is yet
unclear and will be subject to future studies. The afferent pathways to the GPe have been
described previously (Albin et al., 1989; Cazorla et al., 2014; DeLong, 1990; Kawaguchi et
al., 1990; Kita et al., 1983; Robledo and Feger, 1990; Wu et al., 2000), however, their impact
.CC-BY-NC-ND 4.0 International licenseauthor/funder. It is made available under aThe copyright holder for this preprint (which was not peer-reviewed) is the. https://doi.org/10.1101/2020.02.27.967869doi: bioRxiv preprint

12
on the different GPe subpopulations was unknown. We showed that STN provides excitatory
input to both prototypic and arkypallidal cells, however, its impact on the activity of the
respective subpopulations was cell-type specific. Excitation of arkypallidal cells was
curtailed by strong inhibition from prototypic cells, resulting in only a brief response at the
onset of STN activation. The differential responses to STN photostimulation may also reflect
differences in other synaptic properties of STN input to the GPe subpopulations.
Striatal input was also biased with respect to the postsynaptic GPe cell types. As expected,
iMSNs strongly inhibited prototypic cells, however, they also provided reliable, although
weaker, inhibition to arkypallidal cells. Surprisingly, we found that dMSNs target only a
small fraction of prototypic cells and with much weaker inhibition compared with
arkypallidal cells (figure 7). This target selectivity in the GABAergic inhibition from dMSNs
to arkypallidal cells is intriguing, in face of the selective excitation of prototypic cells by
Substance P (Mizutani et al., 2017). Other inputs to the GPe such as from cortical regions
(Abecassis et al., 2019; Karube et al., 2019) were not explored in this paper, but are also
likely to shape GPe activity.
Prototypic cells project downstream and inhibit the BG output structures but also other
structures such as the STN (Bevan et al., 2002; DeLong, 1990; Smith et al., 1998), striatum
(Bevan et al., 1998; Mallet et al., 2012; Mastro et al., 2014; Saunders et al., 2016), thalamic
nuclei (Hazrati and Parent, 1991; Mastro et al., 2014) and the substantia nigra pars compacta
(Mastro et al., 2014; Paladini et al., 1999). Within the GPe they exert local inhibition onto
arkypallidal cells as well as themselves (Figure 4). Our findings show that prototypic cells are
indeed targeted by iMSNs (Albin et al., 1989; Loopuijt and van der Kooy, 1985) and the STN
(Kita et al., 1983; Robledo and Feger, 1990) as shown previously. STN activation results in
reliable excitation of prototypic cells that, in turn, would inhibit downstream BG targets.
iMSNs activation strongly inhibits the prototypic cells, thus disinhibiting the STN as well as
neighboring arkypallidal cells. Our observations are, therefore, in line with the canonical role
of prototypic GPe cells in the indirect pathway (Chiken et al., 2008; Nambu et al., 2000;
Ozaki et al., 2017; Sano et al., 2013). The contribution of prototypic cell activation on
structures outside the basal ganglia was not further explored in this paper.
The projection from GPe to striatum differs between prototypic and arkypallidal cells.
Arkypallidal cells have been shown to target both striatal interneurons and MSNs (Mallet et
al., 2012) while prototypic cells mainly target interneurons (Bevan et al., 1998; Saunders et
.CC-BY-NC-ND 4.0 International licenseauthor/funder. It is made available under aThe copyright holder for this preprint (which was not peer-reviewed) is the. https://doi.org/10.1101/2020.02.27.967869doi: bioRxiv preprint

13
al., 2016). Fractions of both GPe subtypes have been shown to express Npas1 (Abrahao and
Lovinger, 2018; Hernandez et al., 2015), which labels GPe neurons that target both
interneurons and MSNs (Glajch et al., 2016). Activation of STN provided strong and
sustained excitation of prototypic cells, which would then inhibit striatal fast spiking
interneurons (Bevan et al., 1998; Saunders et al., 2016), thus disinhibiting MSNs. In contrast,
arkypallidal cells were briefly excited by STN activation, which would imply only a short
window of inhibition onto MSNs. While prototypic cells constitute the majority of GPe
neurons (Dodson et al., 2015; Mallet et al., 2012), the area covered by arkypallidal axons in
the striatum is considerably larger than that of prototypic cells (Mallet et al., 2012). This
suggests that arkypallidal cells have a strong and immediate impact on MSN activity, thus
they may act as “stop cells” (Mallet et al., 2016). The impact of STN on the activity of MSNs
via GPe pallidostriatal projections is, therefore, complex both spatially and temporally,
requiring further investigation of the detailed functional organization. It was recently shown
that arkypallidal cells receive direct input from motor cortex (Karube et al., 2019), suggesting
that cortical activation may exert a dual impact on MSNs, by monosynaptic excitation
followed by polysynaptic inhibition via GPe arkypallidal cells. Striatal inputs to the
respective GPe populations showed a high degree of target preference, with iMSNs strongly
inhibiting prototypic, but also arkypallidal cells. Interestingly, dMSN collaterals in GPe
selectively inhibited arkypallidal cells, thereby suppressing the “stop signal” provided by this
population. These data show that both direct and indirect striatal pathways shape GPe activity
but they do so via different pathways in distinct manner.
In this paper we describe the electrical properties and synaptic organization of two main GPe
neuronal populations, revealing cell-type specific afferent inputs. We show input bias to the
GPe subpopulations which supports distinct functional roles. In future studies it will be
important to elucidate the functional contribution of these pathways in sensorimotor function
and their alteration leading to dysfunction.
Acknowledgments
We thank Elin Dahlberg and Kristoffer Tenebro Berglund for technical help, Ole Kiehn,
Gilberto Fisone, Konstantinos Meletis and Jens Hjerling-Leffler for mice. We also thank Sten
Grillner, Abdel El Manira, and members of the Silberberg lab for comments and discussions.
This work was supported by the Knut and Alice Wallenberg Foundation (KAW 2014.0051),
.CC-BY-NC-ND 4.0 International licenseauthor/funder. It is made available under aThe copyright holder for this preprint (which was not peer-reviewed) is the. https://doi.org/10.1101/2020.02.27.967869doi: bioRxiv preprint
14
the European Research Council (ERC 282012), the Swedish Brain Foundation (Hjärnfonden
FO2018-0107), the Swedish Medical Research Council (VR-M 2015-02403), Karolinska
Institutet Strategic Program for Neuroscience (StratNeuro), and grants from Karolinska
Institutet.
Author contribution
M.K. and G.S. conceived and planned the experiments. M.K. performed the experiments and
analyzed the data. M.K. and G.S. wrote the manuscript.
Figure legends:
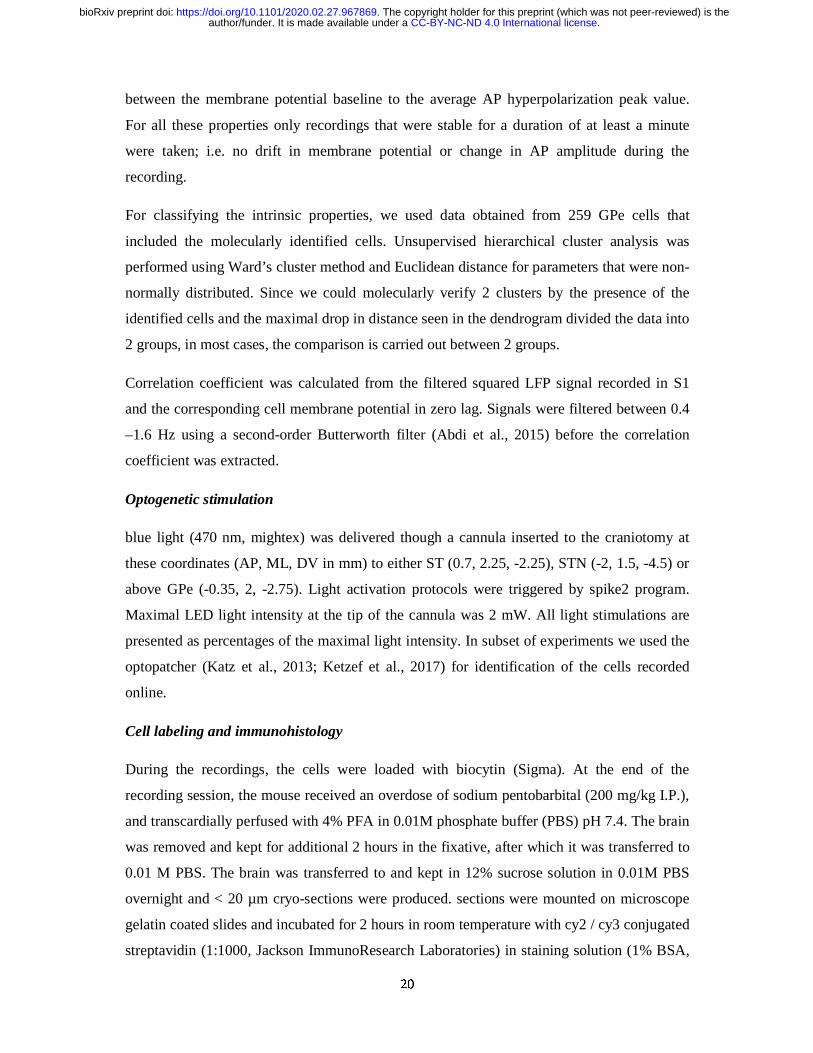
Figure 1: In vivo whole-cell recordings from prototypic and arkypallidal GPe cells. A. a
scheme describing the experimental set up, including LFP cortical recordings (S1 LFP) and
GPe whole-cell recordings. B. example of a GPe neuron labeled with biocytin following
whole-cell recording (scale bar 500 µm). The right panel shows the recovered cell in higher
magnification (scale bar 25 µm). C, left panel: identification of prototypic cells according to
their expression of FoxP2: prototypic cells are negative to FoxP2. Scale bar images 25 µm (as
indicated in D). C, right panel: Prototypic cells (black, top) fire at high frequencies and slow
or pause their firing when the cortex (S1 LFP, top trace) is engaged in an up-state. D, left
panel: identification of arkypallidal cells according to their expression of FoxP2: arkypallidal
cells are positive to FoxP2. Scale bar images 25 µm. D, right panel: arkypallidal cells
(turquoise) typically depolarize during cortical up-states. E. membrane potential histogram of
a prototypic and an arkypallidal cell (same as in C and D). F. inter-spike interval (ISI)
histogram for the cells presented in C-D. Prototypic cells in black, arkypallidal cells in
turquoise, Cx cortex, ST striatum, GPe external globus pallidus, LV lateral ventricle, Vm
membrane potential, LFP local field potential, S1 primary somatosensory cortex.
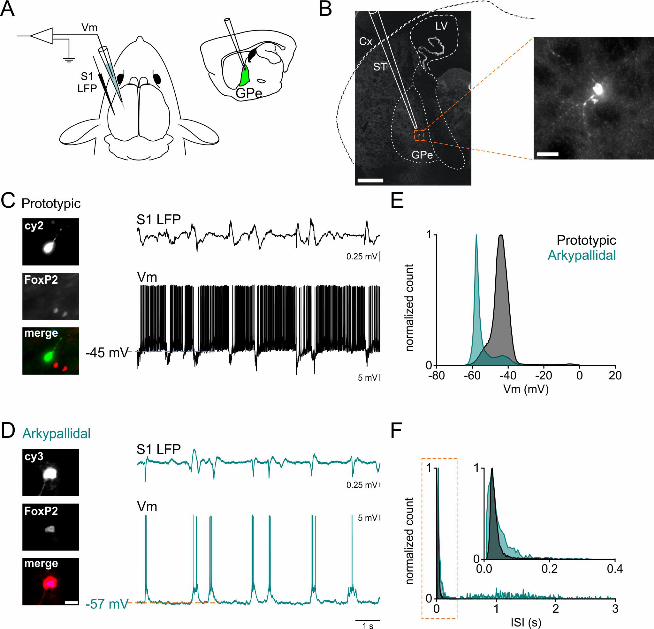
Figure 2: Membrane properties of identified and classified GPe neurons. A. examples of
traces from prototypic (black, left) and arkypallidal (turquoise, right) cells showing the
baseline activity for each cell, and responses to negative step current injection, exposing the
sag in both populations. B. intrinsic properties of GPe cells identified either by
immunostaining or by the “optopatcher” (n = 44 prototypic, n = 32 arkypallidal). C.
dendrogram showing the classification of 259 recorded GPe cells. Inset: pie chart
representing the distribution of recorded neurons. Note the marking of the identified cells at
.CC-BY-NC-ND 4.0 International licenseauthor/funder. It is made available under aThe copyright holder for this preprint (which was not peer-reviewed) is the. https://doi.org/10.1101/2020.02.27.967869doi: bioRxiv preprint

15
the bottom of the dendrogram. D. intrinsic properties of the GPe cells according to their
classification by membrane potential, spontaneous firing frequency, and sag ratio. Prototypic
cells in black, arkypallidal cells in turquoise, *** p<0.001. Data are presented as mean ±
SEM. Statistical test: Mann whitney / two tailed T-test.
Figure 3: Modulation of membrane potential dynamics in GPe cells during slow wave
activity. A. examples of traces recorded in prototypic (black) and arkypallidal cells
(turquoise) without modulation of membrane potential by current injection (Iin = 0) and their
correlation to the LFP recorded in S1. Note shaded area showing the cortical up-state and the
corresponding activity in the whole-cell recorded GPe neuron. B. correlation coefficient of
the cortical LFP and the cell activity filtered between 0.4-1.6 Hz, organized according to the
classifier into 2 (left) or 3 (right) types of GPe neurons. Darker circles in the left panel
corresponding to the examples in A. C. distribution of the correlation coefficient values
according to membrane potential (left) and spontaneous firing frequency (right) of the cells
organized by 3 groups. Lines in each graph indicate the mean value per group. D. examples
of traces recorded in GPe cells injected with holding currents: hyperpolarized prototypic cell
(left) and depolarized arkypallidal cell (right). Note the change in polarity of the correlation
coefficient values for each cell type compared with A. The pink shaded areas show an
example of the cortical up-state and the corresponding activity in the recorded neuron. E.
correlation coefficients of all cells that were recorded in at least 3 different holding currents,
organized into 3 cell-types. F. estimation of the membrane potential value in which the
correlation coefficient shifts from positive to negative values, organized according to the
classifier to 2 (left) or 3 (right) groups. G. distribution of all correlation coefficient values
recorded in all protocols (with and without membrane potential modulation by current
injections). The plot is superimposed by sigmoidal fitting between the maximum and
minimum values of the correlation coefficient 1 and -1. CC: correlation coefficient, Iin:
current injected, Prototypic cells represented in black, arkypallidal cells in turquoise, slow
prototypic (SP) in light grey, fast prototypic (FP) in dark grey. *** p<0.001, * p<0.05. Data
are presented as mean ± SEM. Statistical test: Mann-Whitney / Kruskal-Wallis.
Figure 4: Lateral inhibition within the GP. A. a scheme of the experimental set up: viral
injections in GPe (left), photostimulation and whole-cell recording (right). B. sagittal (left,
scale bar 1 mm) and coronal (right, scale bar 1 mm) sections showing the virus expression
and fiber location. C. pie charts representing the distribution of prototypic (black) and
arkypallidal (turquoise) cells responding directly or indirectly (synaptically) to
.CC-BY-NC-ND 4.0 International licenseauthor/funder. It is made available under aThe copyright holder for this preprint (which was not peer-reviewed) is the. https://doi.org/10.1101/2020.02.27.967869doi: bioRxiv preprint

16
photostimulation. D. example of traces recorded in prototypic cells (black) expressing ChR2,
held at -70 mV responding directly to photostimulation. E. example of traces recorded in a
prototypic cell (black) which did not express ChR2, synaptically inhibited following
photostimulation. For D-E, light stimulation is as indicated in F. F. example of traces
recorded in arkypallidal cells (turquoise) at rest (left) or depolarized (right) during
photostimulation. For both D-F traces are presented as raw traces in faint color overlaid with
the average trace in darker color. G. light response amplitude in prototypic and arkypallidal
cells. H. onset delay in prototypic and arkypallidal cells. I-J. examples of traces recorded in
arkypallidal cell at rest (I, left), depolarized with current injection (I, right) and prototypic
cell (J) to photostimulation with a train (20 pulses of 10 ms at 20 Hz). Prototypic cells
represented in black, arkypallidal cells in turquoise.
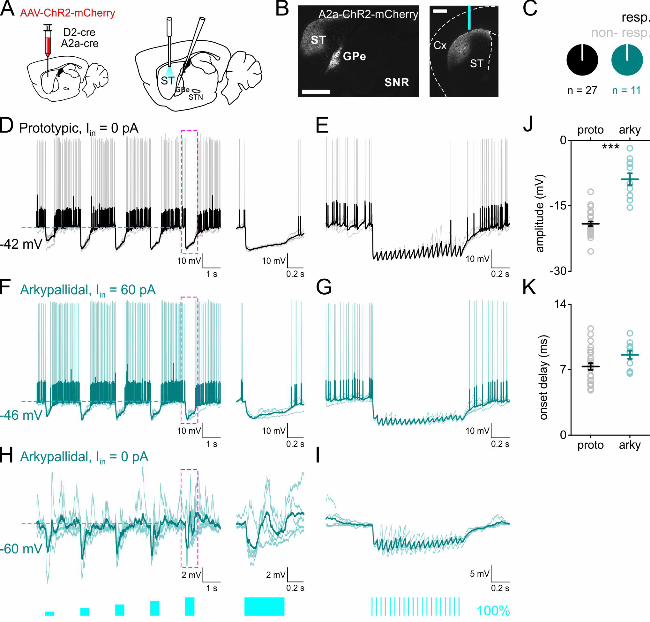
Figure 5: STN input to both GPe cell types. A. a scheme of the experimental set up,
retrograde viral injections in GPe (left), photostimulation in STN and whole-cell recording in
GPe (right). B. sagittal (left, scale bar 1 mm) and coronal (right, scale bar 1 mm) sections
showing the specific viral expression in STN. C. pie charts showing that all recorded GPe
cells responded to STN photostimulation. D-E. Responses of prototypic (D) and arkypallidal
(E) cells to STN photostimulation with 500 ms light pulses of increasing light intensity (4, 8,
20, 60 and 100%). Recorded neurons were held at -70 mV by injection of negative holding
currents (Iin). F. quantification of the amplitude, at the beginning and end of the light step, at
maximal light intensity. Inset showing an example of the measured parameter (orange). G.
quantification of the onset delay to light stimulation. Inset showing an example of the
measured parameter (orange). H-I. responses to 500 ms light activation when prototypic cells
(H) and arkypallidal cells (I) are held at -45 mV. Note the initial spiking with light onset in
arkypallidal cells. Prototypic cells in black, arkypallidal cells in turquoise. ** p<0.01, ***
p<0.001. ST striatum, GPe external globus pallidus, SNr substantia nigra pars reticulata, STN
subthalamic nucleus. Data are presented as mean ± SEM. Statistical tests: Paired sample T
test / Two sample T test.
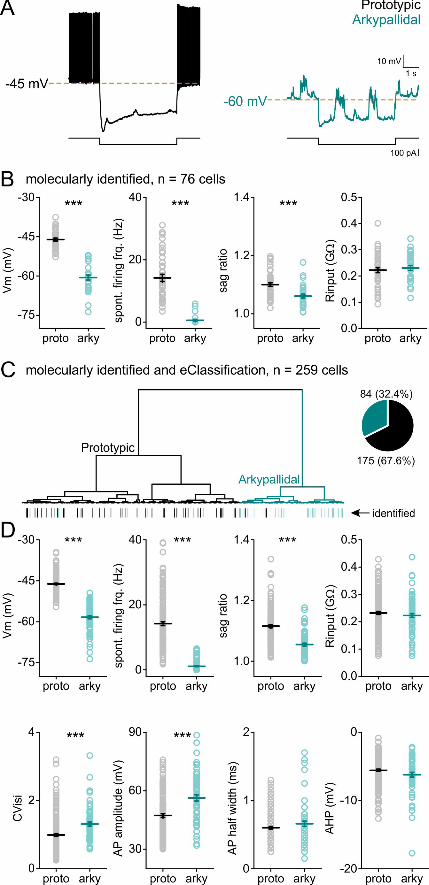
Figure 6: Indirect-pathway MSNs input to the GPe is biased towards prototypic cells. A. a
scheme of the experimental set up: viral injections in striatum (left), photostimulation in
striatum and whole-cell recording in GPe (right). B. sagittal (left, scale bar 1 mm) and
coronal (right, scale bar 0.5 mm) sections showing the virus spread in the dorsal striatum and
fiber location, and the typical projection of iMSNs to GPe. C. pie charts showing that all
recorded GPe cells responded to iMSN photostimulation. D. responses of prototypic cells to
.CC-BY-NC-ND 4.0 International licenseauthor/funder. It is made available under aThe copyright holder for this preprint (which was not peer-reviewed) is the. https://doi.org/10.1101/2020.02.27.967869doi: bioRxiv preprint

17
500 ms light stimulation of striatal iMSNs. Magenta dashed area expanded to the right of the
trace. E. responses of prototypic cells to 20 Hz light stimulation of iMSNs. Baseline
membrane potential is as indicated in D. F. same as in D but for depolarized arkypallidal
cells. G. same as in E but for depolarized arkypallidal cells. H. same as in D but for
arkypallidal cells at rest. I. same as in E but for arkypallidal cells at rest. J. light response
amplitude in prototypic and arkypallidal cells held at similar membrane potentials. K.
response onset delay to photostimulation in prototypic and arkypallidal cells held at similar
membrane potentials. Prototypic cells in black, arkypallidal cells in turquoise. ST striatum,
GPe external globus pallidus, SNr substantia nigra pars reticulata. Data are presented as
mean ± SEM. Statistical tests: Two sample T test / Mann Whitney.
Figure 7: Direct-pathway MSNs target arkypallidal cells and almost avoid prototypic cells.
A. a scheme of the experimental set up, viral injections in striatum (left), photostimulation in
striatum and whole-cell recording in GPe (right). B. sagittal (left, scale bar 1 mm) and
coronal (right, scale bar 0.5 mm) sections showing the viral transduction in dorsal striatum,
the optic fiber location, and the typical projection of direct pathway MSNs to GPi and SNr.
C. pie chart representation of the proportion of the cells responding to dMSN light activation.
D. responses of prototypic cells to 500 ms light stimulation of striatal dMSNs. Magenta
dashed area expanded to the right of the trace. E. responses of prototypic cells to 20 Hz light
stimulation of dMSNs. Baseline membrane potential is as indicated in D. F. same as in D but
for depolarized arkypallidal cells. G. same as in E but for depolarized arkypallidal cells. H.
same as in D but for arkypallidal cells at rest. I. same as in E but for arkypallidal cells at rest.
J. light response amplitude in prototypic and arkypallidal cells held at similar membrane
potentials. K. response onset delay to photostimulation in prototypic and arkypallidal cells
held at similar membrane potentials. Prototypic cells in black, arkypallidal cells in turquoise.
ST striatum, GPe external globus pallidus, SNr substantia nigra pars reticulata. Data are
presented as mean ± SEM. Statistical tests: Two sample T test / Mann-Whitney.
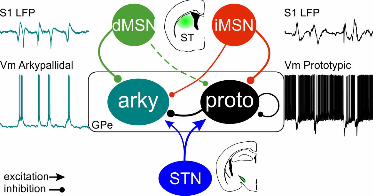
Figure 8: Summary scheme of synaptic inputs to GPe subpopulations. Prototypic cells
(black) receive stronger input from iMSNs (red) and the STN (blue) and only sparse
inhibition from dMSNs (green). Arkypallidal cells (turquoise) receive input from all basal
ganglia pathways through direct and indirect pathway MSNs and the STN, as well as intra-
pallidal inhibition from prototypic cells. S1 LFP: local field potential recorded in primary
somatosensory cortex. Vm: membrane potential.
.CC-BY-NC-ND 4.0 International licenseauthor/funder. It is made available under aThe copyright holder for this preprint (which was not peer-reviewed) is the. https://doi.org/10.1101/2020.02.27.967869doi: bioRxiv preprint

18
Materials and Methods
All experiments were performed according to the guidelines of the Stockholm municipal
committee for animal experiments under an ethical permit to G.S. (N12/15). D1-Cre (EY217
line), D2-Cre (ER44 line), Adora2a-Cre (KG139 line, GENSAT), vglut2-Cre
(Slc17a6tm2(cre)Lowl/J), PV-Cre (B6;129P2-Pvalbtm1(cre)Arbr/J) and NKX2.1-Cre mice
(C57BL/6J-Tg(Nkx2-1-cre)2Sand/J, the Jackson laboratory) were used for virus injections. In
some cases, Cre lines were crossed with the Channelrhodopsin (ChR2)-YFP reporter mouse
line (Ai32, the Jackson laboratory) to induce expression of ChR2 in a specific cell population.
Mice of both sexes were housed under a 12-hour light-dark cycle with food and water ad
libitum. All experiments were carried out during the light phase.
Virus injections
Mice, 6-8 weeks old, were anesthetized with isoflurane and placed in a stereotaxic frame
(Stoelting). Craniotomy coordinates and injections volumes: ST (AP: 0.7, ML: 2.25, DV -
3.1) 0.5 - 1 µl of virus. GPe (AP: -0.35, ML: 2.15, DV: -3.65) 0.25 µl of virus. Viruses:
AAV5.EF1.dflox.hChR2(H134R)-mCherry.WPRE.hGH or
AAV5.EF1.dflox.hChR2(H134R)-eYFP.WPRE.hGH, rgAAV-EF1a-double floxed-
hChR2(H134R)-EYFP-WPRE-HGHpA, addgene. Injections were done using a micropipette
at 0.1 μl min−1 (Quintessential Stereotaxic Injector, Stoelting). The pipette was held in place
for 5 min before being slowly retracted from the brain. Temgesic was applied after surgery
(0.1 mg/Kg).
In vivo recordings
Experiments were conducted as described previously (Ketzef et al., 2017; Reig and
Silberberg, 2014), briefly, 2-3 months old mice, usually 3 weeks following virus injections,
were anaesthetized by intraperitoneal (IP) injection of ketamine (75mg/kg) and medetomidine
(1 mg/kg) diluted in 0.9% NaCl. To maintain mice under anesthesia, a third of the dose of
Ketamine was injected intraperitonaelly approximately every 2 hours or in case the mouse
showed response to pinching or changes in EcoG patterns. Mice were tracheotomized, placed
in a stereotactic frame and received oxygen enriched air throughout the recording session.
Core temperature was monitored with feedback-controlled heating pad (FHC) and was kept
on 36.5±0.5 oC. The skull was exposed and 3 craniotomies were drilled (Osada success 40):
.CC-BY-NC-ND 4.0 International licenseauthor/funder. It is made available under aThe copyright holder for this preprint (which was not peer-reviewed) is the. https://doi.org/10.1101/2020.02.27.967869doi: bioRxiv preprint
19
for cortical LFP recordings, GPe intracellular recordings and for optic fiber placement.
Sensory cortex craniotomy coordinates: 1.5 mm posterior to bregma, 3.25 mm lateral to
midsagittal suture. A bipolar tungsten electrode with impedances of 1-2 MΩ was inserted 1
mm deep from the surface. Signals were amplified using a Differential AC Amplifier model
1700 (A-M Systems) and digitized at 20 KHz with CED and Spike 2 parallel to whole-cell
recording. An optic fiber was inserted for activation of input population. A craniotomy was
drilled and the fiber was inserted (AP, ML, DV in mm) to either ST (0.7, 2.25, -2), STN (-2,
1.5, -4.5) or above GPe (-0.35, 2.2, -2.75). For patch clamp recordings, the craniotomy was
performed 0.3-0.5 posterior to, and 4.25 mm lateral to bregma, and the dura was removed.
Patch pipettes were pulled with a Flaming/Brown micropipette puller P-1000 (Sutter
Instruments). Pipettes (6-9 MOhm, borosilicate, Hilgenberg), back-filled with intracellular
solution, were inserted with a ~1200 mbar positive pressure to a depth of about 2.8 mm from
the surface, after which the pressure was reduced to 25-35 mbar. From that point the pipette
was advanced in 1 µm steps in depth (32 degrees angle), in voltage clamp mode. When a cell
was encountered, the pressure was removed to form a Gigaseal, followed by application of a
ramp of increasing negative pressure till cell opening was evident. Recordings were
performed in current clamp mode. Intracellular solution contained (in mM): 130 K-gluconate,
5 KCl, 10 HEPES, 4 Mg-ATP, 0.3 GTP, 10 Na2-phosphocreatine, and 0.2-0.3 % biocytin
(pH=7.25, osmolarity~285 mOsm). The exposed brain was continuously covered by 0.9%
NaCl to prevent drying. Signals were amplified using MultiClamp 700B amplifier (Molecular
Devices) and digitized at 20 KHz with a CED acquisition board and Spike 2 software
(Cambridge Electronic Design). The membrane potential of a cell was the peak value of the
all point membrane potential histogram collected for over a minute. The spontaneous firing
frequency was calculated for a similar period of time. Inter-spike interval coefficient of
variance (CVisi) was calculated as the variance of the Inter-spike interval normalized to the
average Inter-spike interval. Input resistance was calculated as the slope of the steady-state
voltage responses to current injection (-100 pA to 0 pA in steps of 20 pA for 5 sec each). For
each current injection, values during cortical up and down states were extracted separately.
Sag was extracted from hyperpolarization protocol in which the cell was first not injected
with any current, establishing baseline, followed by injection of -100 pA for 5 seconds. The
sag was taken as the maximal drop in voltage at the beginning of the hyperpolarizing step.
Sag ratio was the result of diving the sag by the steady-state voltage responses of the
hyperpolarizing step. AP half width was calculated at half distance between membrane
potential baseline and average AP peak value. Afterhyperpolarization (AHP) was measured
.CC-BY-NC-ND 4.0 International licenseauthor/funder. It is made available under aThe copyright holder for this preprint (which was not peer-reviewed) is the. https://doi.org/10.1101/2020.02.27.967869doi: bioRxiv preprint
20
between the membrane potential baseline to the average AP hyperpolarization peak value.
For all these properties only recordings that were stable for a duration of at least a minute
were taken; i.e. no drift in membrane potential or change in AP amplitude during the
recording.
For classifying the intrinsic properties, we used data obtained from 259 GPe cells that
included the molecularly identified cells. Unsupervised hierarchical cluster analysis was
performed using Ward’s cluster method and Euclidean distance for parameters that were non-
normally distributed. Since we could molecularly verify 2 clusters by the presence of the
identified cells and the maximal drop in distance seen in the dendrogram divided the data into
2 groups, in most cases, the comparison is carried out between 2 groups.
Correlation coefficient was calculated from the filtered squared LFP signal recorded in S1
and the corresponding cell membrane potential in zero lag. Signals were filtered between 0.4
–1.6 Hz using a second-order Butterworth filter (Abdi et al., 2015) before the correlation
coefficient was extracted.
Optogenetic stimulation
blue light (470 nm, mightex) was delivered though a cannula inserted to the craniotomy at
these coordinates (AP, ML, DV in mm) to either ST (0.7, 2.25, -2.25), STN (-2, 1.5, -4.5) or
above GPe (-0.35, 2, -2.75). Light activation protocols were triggered by spike2 program.
Maximal LED light intensity at the tip of the cannula was 2 mW. All light stimulations are
presented as percentages of the maximal light intensity. In subset of experiments we used the
optopatcher (Katz et al., 2013; Ketzef et al., 2017) for identification of the cells recorded
online.
Cell labeling and immunohistology
During the recordings, the cells were loaded with biocytin (Sigma). At the end of the
recording session, the mouse received an overdose of sodium pentobarbital (200 mg/kg I.P.),
and transcardially perfused with 4% PFA in 0.01M phosphate buffer (PBS) pH 7.4. The brain
was removed and kept for additional 2 hours in the fixative, after which it was transferred to
0.01 M PBS. The brain was transferred to and kept in 12% sucrose solution in 0.01M PBS
overnight and < 20 µm cryo-sections were produced. sections were mounted on microscope
gelatin coated slides and incubated for 2 hours in room temperature with cy2 / cy3 conjugated
streptavidin (1:1000, Jackson ImmunoResearch Laboratories) in staining solution (1% BSA,
.CC-BY-NC-ND 4.0 International licenseauthor/funder. It is made available under aThe copyright holder for this preprint (which was not peer-reviewed) is the. https://doi.org/10.1101/2020.02.27.967869doi: bioRxiv preprint

21
0.1% NaDeoxycholate and 0.3% triton in 0.01 PBS). After washes in PBS, slides were
mounted on fluorescence microscope in order to locate the recorded cells. If a cell has been
found, following the biocytin staining, we stained for FoxP2 (Rabbit anti mouse, abcam)
expression (1:1000 in staining solution, overnight at 4 oC), followed by 2 hours incubation
with secondary antibody (cy5 conjugated donkey anti rabbit, Jackson ImmunoResearch
Laboratories, 1:500 in staining solution). Photomicrographs of the results were taken with
Olympus XM10 (Olympus Sverige AB, Stockholm, Sweden) digital camera.
Statistical analysis
Data are represented as mean ± SEM. The ns represent cells. Data distributions were first
checked for normality (Shapiro-Wilk test) and analyzed accordingly. Normally distributed
data were tested by one way ANOVA followed by post-hoc Tukey’s test analysis for multiple
comparisons, and the unpaired and paired two-sample student’s T-test was used for two
group comparisons. Non-normally distributed data were analyzed by Kruskal-Wallis test for
multi-group comparisons followed by Mann-Whitney for two group comparison. Confidence
level was set to 0.05. All statistical analyses were done in SPSS (IBM). Statistical test are
reported in the figure legends. Experiments were not included if there was no virus
expression, placement of fiber was not correct, or recordings were not stable, as described in
the ‘in vivo recording’ section.
.CC-BY-NC-ND 4.0 International licenseauthor/funder. It is made available under aThe copyright holder for this preprint (which was not peer-reviewed) is the. https://doi.org/10.1101/2020.02.27.967869doi: bioRxiv preprint

22
References Abdi, A., Mallet, N., Mohamed, F.Y., Sharott, A., Dodson, P.D., Nakamura, K.C., Suri, S., Avery, S.V.,
Larvin, J.T., Garas, F.N., et al. (2015). Prototypic and arkypallidal neurons in the dopamine-intact
external globus pallidus. The Journal of neuroscience : the official journal of the Society for
Neuroscience 35, 6667-6688.
Abecassis, Z.A., Berceau, B.L., Win, P.H., Garcia, D., Xenias, H.S., Cui, Q., Pamukcu, A., Cherian, S.,
Hernandez, V.M., Chon, U., et al. (2019). Npas1(+)-Nkx2.1(+) Neurons Are an Integral Part of the
Cortico-pallido-cortical Loop. The Journal of neuroscience : the official journal of the Society for
Neuroscience.
Abecassis, Z.A., Berceau, B.L., Win, P.H., Garcia, D., Xenias, H.S., Cui, Q., Pamukcu, A., Cherian, S.,
Hernandez, V.M., Chon, U., et al. (2020). Npas1(+)-Nkx2.1(+) Neurons Are an Integral Part of the
Cortico-pallido-cortical Loop. The Journal of neuroscience : the official journal of the Society for
Neuroscience 40, 743-768.
Abrahao, K.P., and Lovinger, D.M. (2018). Classification of GABAergic neuron subtypes from the
globus pallidus using wild-type and transgenic mice. The Journal of physiology 596, 4219-4235.
Albin, R.L., Young, A.B., and Penney, J.B. (1989). The functional anatomy of basal ganglia disorders.
Trends in neurosciences 12, 366-375.
Bevan, M.D., Booth, P.A., Eaton, S.A., and Bolam, J.P. (1998). Selective innervation of neostriatal
interneurons by a subclass of neuron in the globus pallidus of the rat. The Journal of neuroscience :
the official journal of the Society for Neuroscience 18, 9438-9452.
Bevan, M.D., Magill, P.J., Terman, D., Bolam, J.P., and Wilson, C.J. (2002). Move to the rhythm:
oscillations in the subthalamic nucleus-external globus pallidus network. Trends in neurosciences 25,
525-531.
Bugaysen, J., Bar-Gad, I., and Korngreen, A. (2013). Continuous modulation of action potential firing
by a unitary GABAergic connection in the globus pallidus in vitro. The Journal of neuroscience : the
official journal of the Society for Neuroscience 33, 12805-12809.
Cazorla, M., de Carvalho, F.D., Chohan, M.O., Shegda, M., Chuhma, N., Rayport, S., Ahmari, S.E.,
Moore, H., and Kellendonk, C. (2014). Dopamine D2 receptors regulate the anatomical and
functional balance of basal ganglia circuitry. Neuron 81, 153-164.
Chiken, S., Shashidharan, P., and Nambu, A. (2008). Cortically evoked long-lasting inhibition of
pallidal neurons in a transgenic mouse model of dystonia. The Journal of neuroscience : the official
journal of the Society for Neuroscience 28, 13967-13977.
DeLong, M.R. (1971). Activity of pallidal neurons during movement. Journal of neurophysiology 34,
414-427.
DeLong, M.R. (1990). Primate models of movement disorders of basal ganglia origin. Trends in
neurosciences 13, 281-285.
Dodson, P.D., Larvin, J.T., Duffell, J.M., Garas, F.N., Doig, N.M., Kessaris, N., Duguid, I.C., Bogacz, R.,
Butt, S.J., and Magill, P.J. (2015). Distinct developmental origins manifest in the specialized encoding
of movement by adult neurons of the external globus pallidus. Neuron 86, 501-513.
Glajch, K.E., Kelver, D.A., Hegeman, D.J., Cui, Q., Xenias, H.S., Augustine, E.C., Hernandez, V.M.,
Verma, N., Huang, T.Y., Luo, M., et al. (2016). Npas1+ Pallidal Neurons Target Striatal Projection
Neurons. The Journal of neuroscience : the official journal of the Society for Neuroscience 36, 5472-
5488.
Gross, A., Sims, R.E., Swinny, J.D., Sieghart, W., Bolam, J.P., and Stanford, I.M. (2011). Differential
localization of GABA(A) receptor subunits in relation to rat striatopallidal and pallidopallidal
synapses. The European journal of neuroscience 33, 868-878.
Hazrati, L.N., and Parent, A. (1991). Projection from the external pallidum to the reticular thalamic
nucleus in the squirrel monkey. Brain research 550, 142-146.
Hernandez, V.M., Hegeman, D.J., Cui, Q., Kelver, D.A., Fiske, M.P., Glajch, K.E., Pitt, J.E., Huang, T.Y.,
Justice, N.J., and Chan, C.S. (2015). Parvalbumin+ Neurons and Npas1+ Neurons Are Distinct Neuron
.CC-BY-NC-ND 4.0 International licenseauthor/funder. It is made available under aThe copyright holder for this preprint (which was not peer-reviewed) is the. https://doi.org/10.1101/2020.02.27.967869doi: bioRxiv preprint

23
Classes in the Mouse External Globus Pallidus. The Journal of neuroscience : the official journal of
the Society for Neuroscience 35, 11830-11847.
Hoover, B.R., and Marshall, J.F. (2002). Further characterization of preproenkephalin mRNA-
containing cells in the rodent globus pallidus. Neuroscience 111, 111-125.
Karube, F., Takahashi, S., Kobayashi, K., and Fujiyama, F. (2019). Motor cortex can directly drive the
globus pallidus neurons in a projection neuron type-dependent manner in the rat. eLife 8.
Katz, Y., Yizhar, O., Staiger, J., and Lampl, I. (2013). Optopatcher--an electrode holder for
simultaneous intracellular patch-clamp recording and optical manipulation. Journal of neuroscience
methods 214, 113-117.
Kawaguchi, Y., Wilson, C.J., and Emson, P.C. (1990). Projection subtypes of rat neostriatal matrix cells
revealed by intracellular injection of biocytin. The Journal of neuroscience : the official journal of the
Society for Neuroscience 10, 3421-3438.
Ketzef, M., Spigolon, G., Johansson, Y., Bonito-Oliva, A., Fisone, G., and Silberberg, G. (2017).
Dopamine Depletion Impairs Bilateral Sensory Processing in the Striatum in a Pathway-Dependent
Manner. Neuron 94, 855-865 e855.
Kita, H., Chang, H.T., and Kitai, S.T. (1983). Pallidal inputs to subthalamus: intracellular analysis. Brain
research 264, 255-265.
Kita, H., and Kitai, S.T. (1991). Intracellular study of rat globus pallidus neurons: membrane
properties and responses to neostriatal, subthalamic and nigral stimulation. Brain research 564, 296-
305.
Loopuijt, L.D., and van der Kooy, D. (1985). Organization of the striatum: collateralization of its
efferent axons. Brain research 348, 86-99.
Mallet, N., Micklem, B.R., Henny, P., Brown, M.T., Williams, C., Bolam, J.P., Nakamura, K.C., and
Magill, P.J. (2012). Dichotomous organization of the external globus pallidus. Neuron 74, 1075-1086.
Mallet, N., Schmidt, R., Leventhal, D., Chen, F., Amer, N., Boraud, T., and Berke, J.D. (2016).
Arkypallidal Cells Send a Stop Signal to Striatum. Neuron 89, 308-316.
Mastro, K.J., Bouchard, R.S., Holt, H.A., and Gittis, A.H. (2014). Transgenic mouse lines subdivide
external segment of the globus pallidus (GPe) neurons and reveal distinct GPe output pathways. The
Journal of neuroscience : the official journal of the Society for Neuroscience 34, 2087-2099.
Mastro, K.J., Zitelli, K.T., Willard, A.M., Leblanc, K.H., Kravitz, A.V., and Gittis, A.H. (2017). Cell-
specific pallidal intervention induces long-lasting motor recovery in dopamine-depleted mice. Nature
neuroscience 20, 815-823.
Mathai, A., and Smith, Y. (2011). The corticostriatal and corticosubthalamic pathways: two entries,
one target. So what? Frontiers in systems neuroscience 5, 64.
Mizutani, K., Takahashi, S., Okamoto, S., Karube, F., and Fujiyama, F. (2017). Substance P effects
exclusively on prototypic neurons in mouse globus pallidus. Brain structure & function 222, 4089-
4110.
Nambu, A., Tokuno, H., Hamada, I., Kita, H., Imanishi, M., Akazawa, T., Ikeuchi, Y., and Hasegawa, N.
(2000). Excitatory cortical inputs to pallidal neurons via the subthalamic nucleus in the monkey.
Journal of neurophysiology 84, 289-300.
Nambu, A., Tokuno, H., and Takada, M. (2002). Functional significance of the cortico-subthalamo-
pallidal 'hyperdirect' pathway. Neuroscience research 43, 111-117.
Nevado-Holgado, A.J., Mallet, N., Magill, P.J., and Bogacz, R. (2014). Effective connectivity of the
subthalamic nucleus-globus pallidus network during Parkinsonian oscillations. The Journal of
physiology 592, 1429-1455.
Ozaki, M., Sano, H., Sato, S., Ogura, M., Mushiake, H., Chiken, S., Nakao, N., and Nambu, A. (2017).
Optogenetic Activation of the Sensorimotor Cortex Reveals "Local Inhibitory and Global Excitatory"
Inputs to the Basal Ganglia. Cereb Cortex 27, 5716-5726.
Paladini, C.A., Celada, P., and Tepper, J.M. (1999). Striatal, pallidal, and pars reticulata evoked
inhibition of nigrostriatal dopaminergic neurons is mediated by GABA(A) receptors in vivo.
Neuroscience 89, 799-812.
.CC-BY-NC-ND 4.0 International licenseauthor/funder. It is made available under aThe copyright holder for this preprint (which was not peer-reviewed) is the. https://doi.org/10.1101/2020.02.27.967869doi: bioRxiv preprint

24
Pamukcu, A., Cui, Q., Xenias, H.S., Berceau, B.L., Augustine, E.C., Fan, I., Hantman, A.W., Lerner, T.N.,
Boca, S.M., and Chan, C.S. (2020). Parvalbumin+
and Npas1+
Pallidal Neurons Have Distinct Circuit
Topology and Function. bioRxiv, 2020.2002.2014.950006.
Reig, R., and Silberberg, G. (2014). Multisensory integration in the mouse striatum. Neuron 83, 1200-
1212.
Robledo, P., and Feger, J. (1990). Excitatory influence of rat subthalamic nucleus to substantia nigra
pars reticulata and the pallidal complex: electrophysiological data. Brain research 518, 47-54.
Sadek, A.R., Magill, P.J., and Bolam, J.P. (2007). A single-cell analysis of intrinsic connectivity in the
rat globus pallidus. The Journal of neuroscience : the official journal of the Society for Neuroscience
27, 6352-6362.
Sano, H., Chiken, S., Hikida, T., Kobayashi, K., and Nambu, A. (2013). Signals through the
striatopallidal indirect pathway stop movements by phasic excitation in the substantia nigra. The
Journal of neuroscience : the official journal of the Society for Neuroscience 33, 7583-7594.
Saunders, A., Huang, K.W., and Sabatini, B.L. (2016). Globus Pallidus Externus Neurons Expressing
parvalbumin Interconnect the Subthalamic Nucleus and Striatal Interneurons. PloS one 11,
e0149798.
Saunders, A., Oldenburg, I.A., Berezovskii, V.K., Johnson, C.A., Kingery, N.D., Elliott, H.L., Xie, T.,
Gerfen, C.R., and Sabatini, B.L. (2015). A direct GABAergic output from the basal ganglia to frontal
cortex. Nature 521, 85-89.
Smith, Y., Bevan, M.D., Shink, E., and Bolam, J.P. (1998). Microcircuitry of the direct and indirect
pathways of the basal ganglia. Neuroscience 86, 353-387.
Wu, Y., Richard, S., and Parent, A. (2000). The organization of the striatal output system: a single-cell
juxtacellular labeling study in the rat. Neuroscience research 38, 49-62.
.CC-BY-NC-ND 4.0 International licenseauthor/funder. It is made available under aThe copyright holder for this preprint (which was not peer-reviewed) is the. https://doi.org/10.1101/2020.02.27.967869doi: bioRxiv preprint
.CC-BY-NC-ND 4.0 International licenseauthor/funder. It is made available under aThe copyright holder for this preprint (which was not peer-reviewed) is the. https://doi.org/10.1101/2020.02.27.967869doi: bioRxiv preprint
.CC-BY-NC-ND 4.0 International licenseauthor/funder. It is made available under aThe copyright holder for this preprint (which was not peer-reviewed) is the. https://doi.org/10.1101/2020.02.27.967869doi: bioRxiv preprint

.CC-BY-NC-ND 4.0 International licenseauthor/funder. It is made available under aThe copyright holder for this preprint (which was not peer-reviewed) is the. https://doi.org/10.1101/2020.02.27.967869doi: bioRxiv preprint

.CC-BY-NC-ND 4.0 International licenseauthor/funder. It is made available under aThe copyright holder for this preprint (which was not peer-reviewed) is the. https://doi.org/10.1101/2020.02.27.967869doi: bioRxiv preprint

.CC-BY-NC-ND 4.0 International licenseauthor/funder. It is made available under aThe copyright holder for this preprint (which was not peer-reviewed) is the. https://doi.org/10.1101/2020.02.27.967869doi: bioRxiv preprint
.CC-BY-NC-ND 4.0 International licenseauthor/funder. It is made available under aThe copyright holder for this preprint (which was not peer-reviewed) is the. https://doi.org/10.1101/2020.02.27.967869doi: bioRxiv preprint
.CC-BY-NC-ND 4.0 International licenseauthor/funder. It is made available under aThe copyright holder for this preprint (which was not peer-reviewed) is the. https://doi.org/10.1101/2020.02.27.967869doi: bioRxiv preprint
.CC-BY-NC-ND 4.0 International licenseauthor/funder. It is made available under aThe copyright holder for this preprint (which was not peer-reviewed) is the. https://doi.org/10.1101/2020.02.27.967869doi: bioRxiv preprint
Related Documents