Differential scanning Differential scanning calorimetry calorimetry as a tool for as a tool for analysis of defects in materials analysis of defects in materials Daria Setman 1st BioTiNet Workshop: Advanced Methods for Materials Characterization 23-27 October 2011, Ljubljana-Slovenia, Hotel Slon

Welcome message from author
This document is posted to help you gain knowledge. Please leave a comment to let me know what you think about it! Share it to your friends and learn new things together.
Transcript
Differential scanning Differential scanning calorimetrycalorimetry
as a tool for as a tool for analysis of defects in materialsanalysis of defects in materials
Daria Setman
1st BioTiNet
Workshop:Advanced
Methods
for
Materials Characterization
23-27 October
2011, Ljubljana-Slovenia, Hotel Slon
2
OutlineOutline
•
Differential Scanning
Calorimetry
•
Defect
analysis
•
Activation
Enthalpy
Q by
DSC
•
More
applications
for
DSC
3
Differential Differential ScanningScanning
CalorimeterCalorimeter
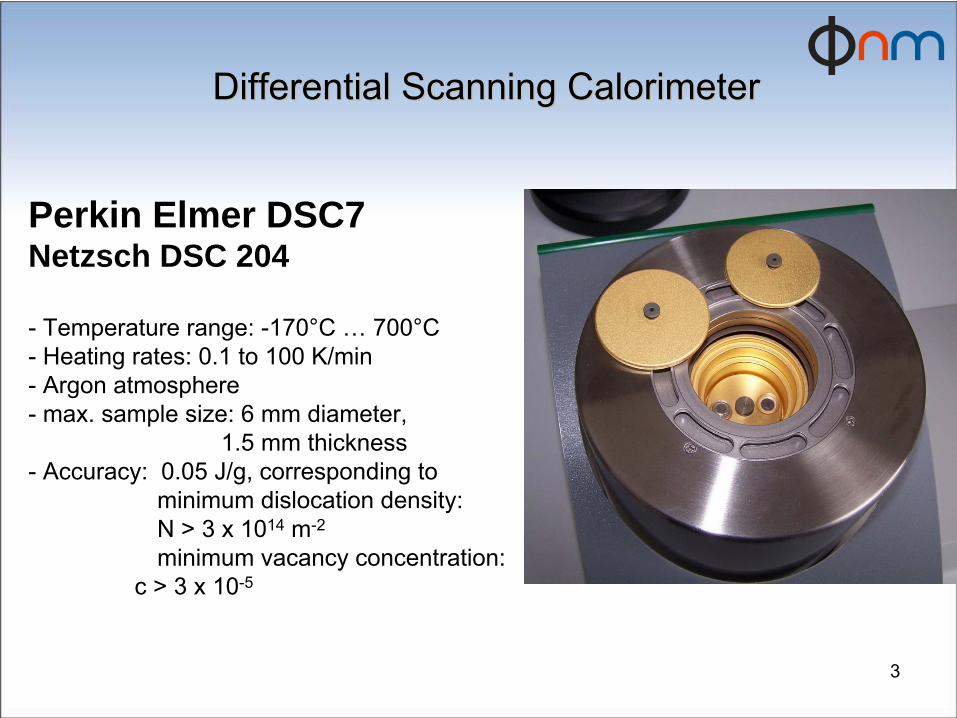
Perkin Elmer DSC7 Netzsch DSC 204
-
Temperature range: -170°C …
700°C -
Heating rates: 0.1 to 100 K/min
-
Argon atmosphere -
max. sample size: 6 mm diameter,
1.5 mm thickness -
Accuracy: 0.05 J/g, corresponding to
minimum dislocation density: N >
3 x 10¹⁴
m-2
minimum vacancy concentration: c > 3 x 10⁻⁵
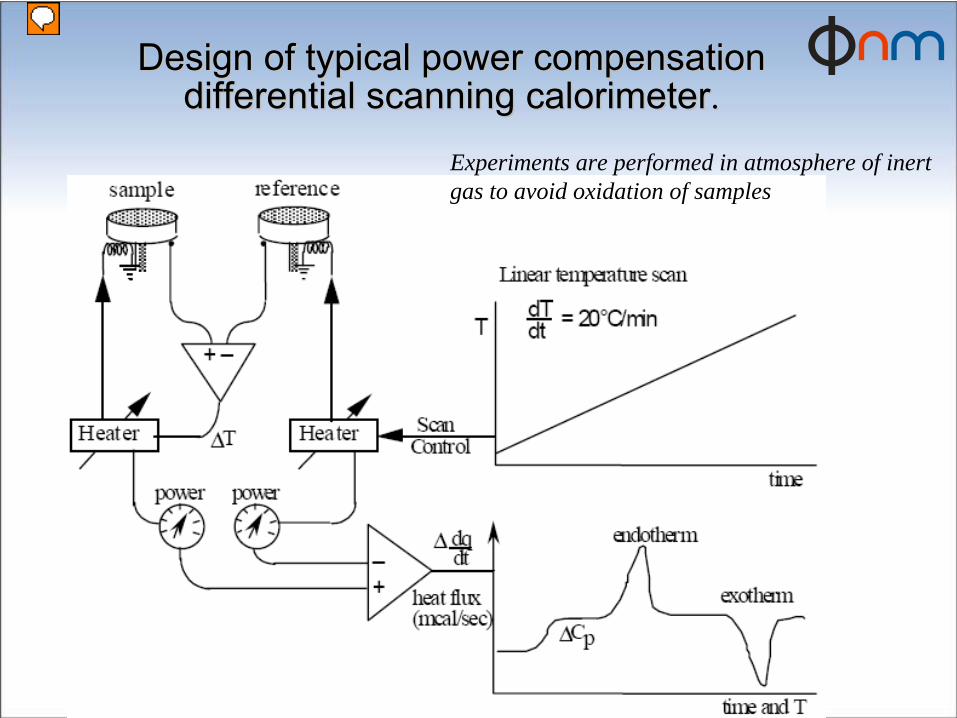
Design of Design of typicaltypical
powerpower
compensationcompensation differential scanning calorimeterdifferential scanning calorimeter..
Experiments are performed in atmosphere of inert gas to avoid oxidation of samples
Presenter
Presentation Notes
Design of typical power compensation differential scanning calorimeter
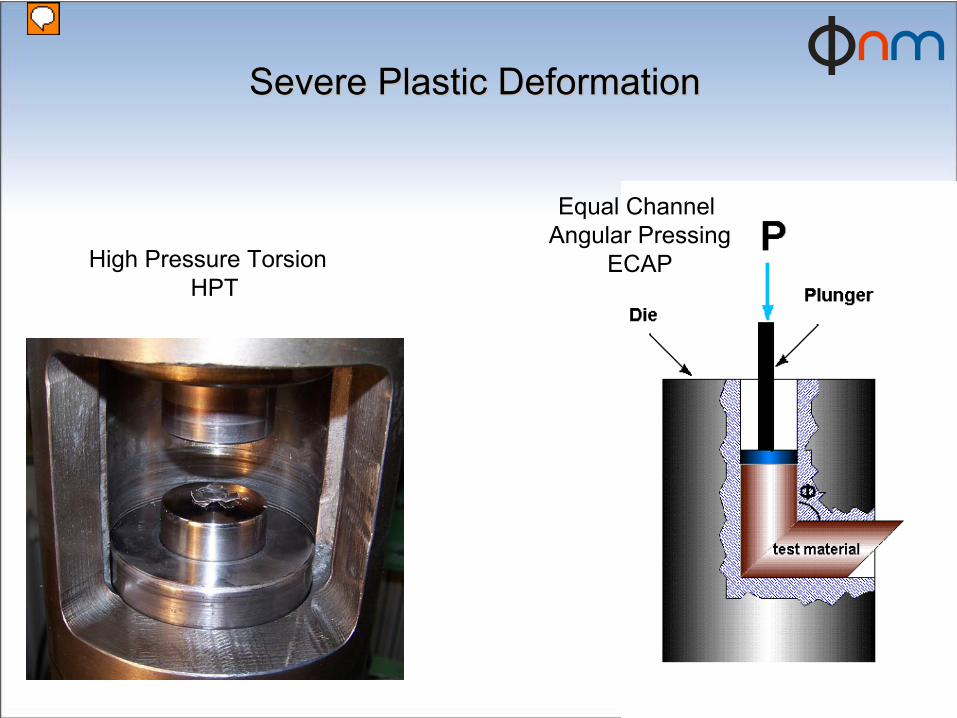
SevereSevere
PlasticPlastic
DeformationDeformation
High Pressure
Torsion HPT
Equal
ChannelAngular
Pressing
ECAP
Presenter
Presentation Notes
Piston – hydrostatic medium – sample pressured thru a die – cooling at entrance In my departmen we are also producing nanomaterials but using hydrostatic extrusion which is also SPD method. In HE method a sample in the container is surrounded with the pressure medium. During extrusion the penetrating seal compresses the pressure medium until the sample starts to extrude- the priston don´t touching a extruded materials. The extrusion started after overflow a volues of critical pressure which is a characteristic value of diffrent materials and depended also of the factor (coefficient) of reduction transver field befor and after extrusion. p=Kc lnR. Material is extruded throu a hole in a die. The fraction is very small becouse of pressure medium and lubricant on the material. The negligible friction provide a minimum of losses(waste) of energy. Temperature in material in die depend of pressure, density and specific heat of extruded material. It is a big problem because of high temperature it is possible of recovery and recrystalization. Because of this dynamic structural process materials could have lower mechanical properties. To avoid this The extrusion products were cooled at the die exit. Due to negligibly small friction, high deformation homogenity and very high strain rate are assured. (strain rate during HE has achieved 2x10²s-1 At the beginning HE was primarily successfully applied to the consolidation of nanostructured powders but research show that can be also used to obtain nanostruced metals starting from bulk materials.
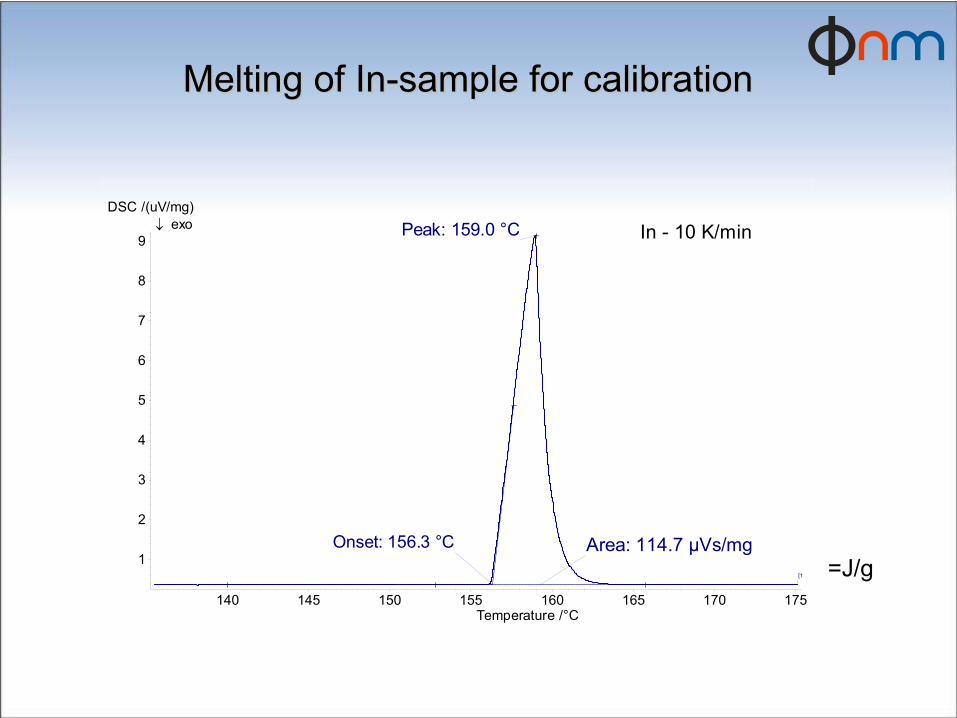
MeltingMelting
of of InIn--samplesample
forfor
calibrationcalibration
140 145 150 155 160 165 170 175Temperature /°C
1
2
3
4
5
6
7
8
9
DSC /(uV/mg)
In - 10 K/min
Onset: 156.3 °C
Peak: 159.0 °C
Area: 114.7 µVs/mg[1
↓ exo
=J/g
7
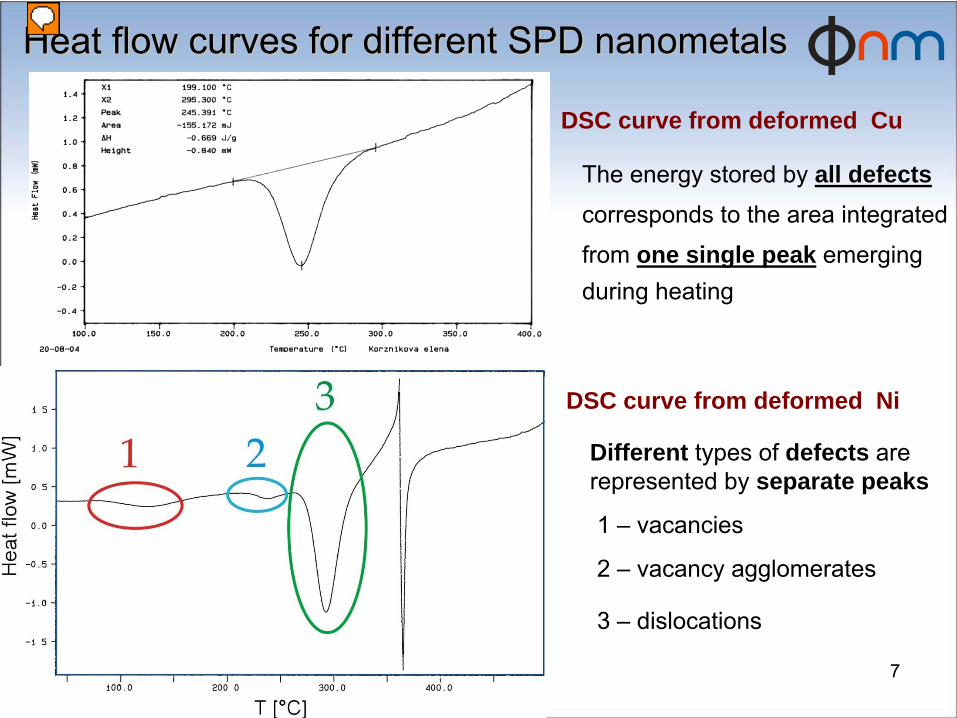
DSC curve from deformed Cu
DSC curve from deformed Ni
1 –
vacancies
2 –
vacancy
agglomerates
3 –
dislocations
The energy stored by all defects corresponds to the area integrated
from one single peak emerging during heating
Different types
of defects are represented by separate peaks
HeatHeat
flowflow
curvescurves
forfor
different SPD different SPD nanometalsnanometals
Presenter
Presentation Notes
Heat flow curves for different metals
8
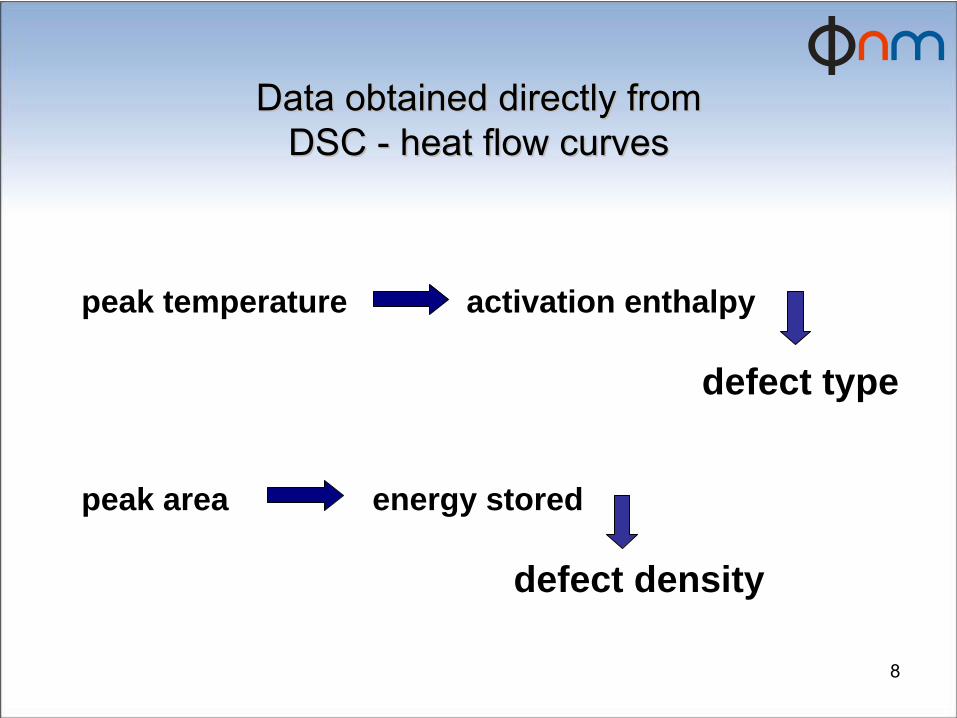
Data obtained directly from Data obtained directly from DSC DSC --
heat flow curvesheat flow curves
peak temperature activation enthalpy
defect type
peak area energy stored
defect density
9
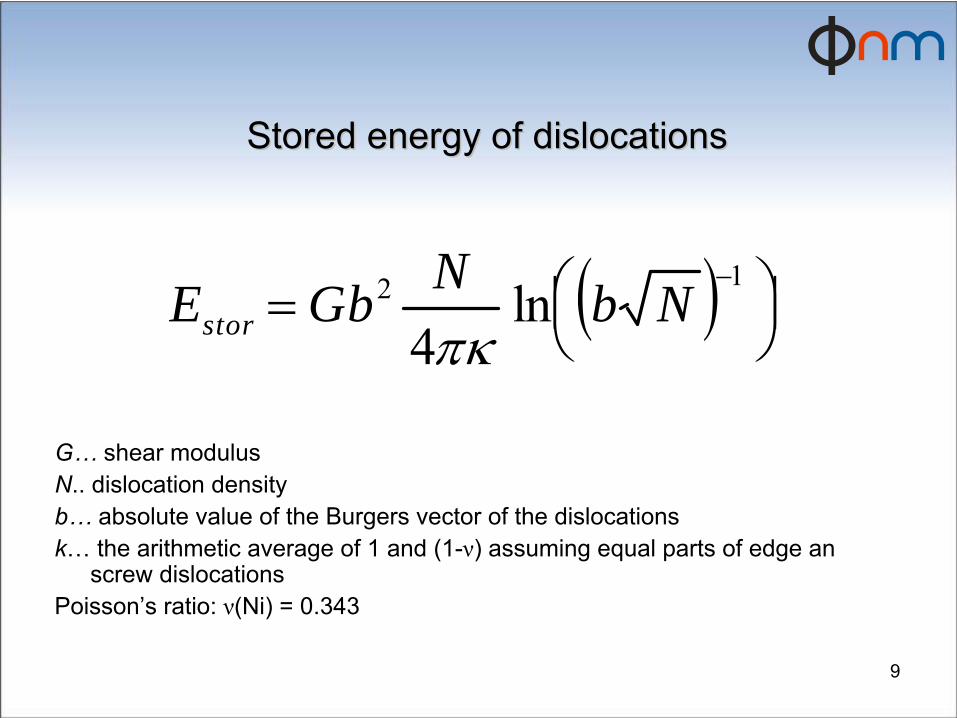
Stored energy of dislocationsStored energy of dislocations
( ) ⎟⎠⎞⎜
⎝⎛=
−12 ln4
NbNGbEstor πκ
G…
shear modulusN.. dislocation densityb…
absolute value of the Burgers vector of the dislocations
k… the arithmetic average of 1 and (1-ν) assuming equal parts of edge an screw dislocations
Poisson’s ratio: ν(Ni) = 0.343
10
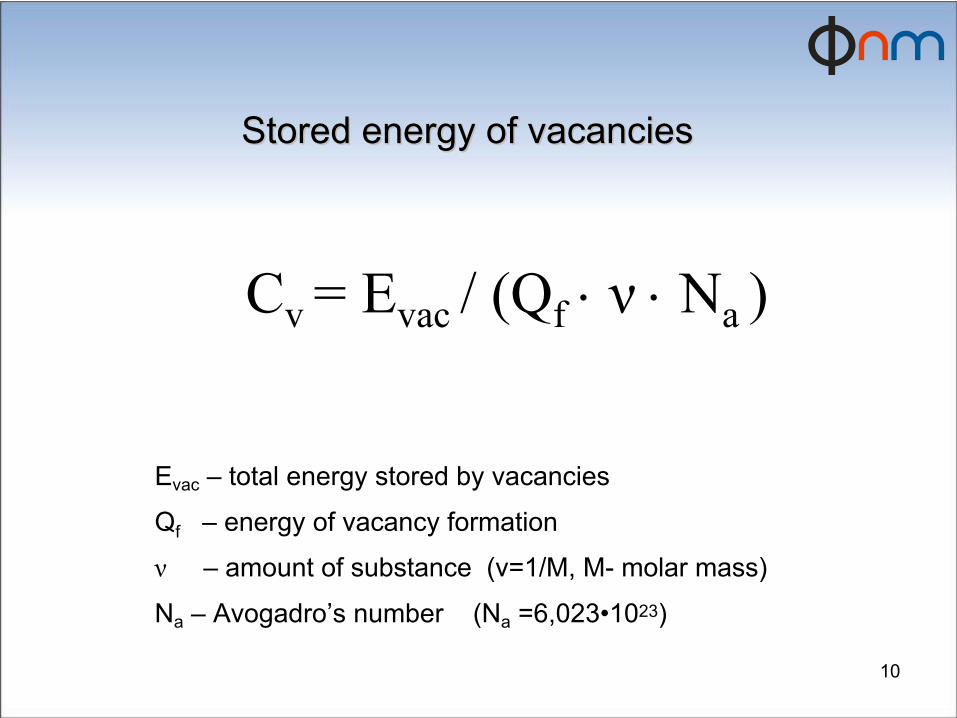
Cv = Evac
/ (Qf
⋅ ν ⋅ Na
)
Evac
–
total energy stored by vacancies
Qf
–
energy of vacancy formation
ν
–
amount of substance
(ν=1/M, M-
molar mass)
Na
–
Avogadro’s number
(Na
=6,023•1023)
Stored energy of vacanciesStored energy of vacancies
11
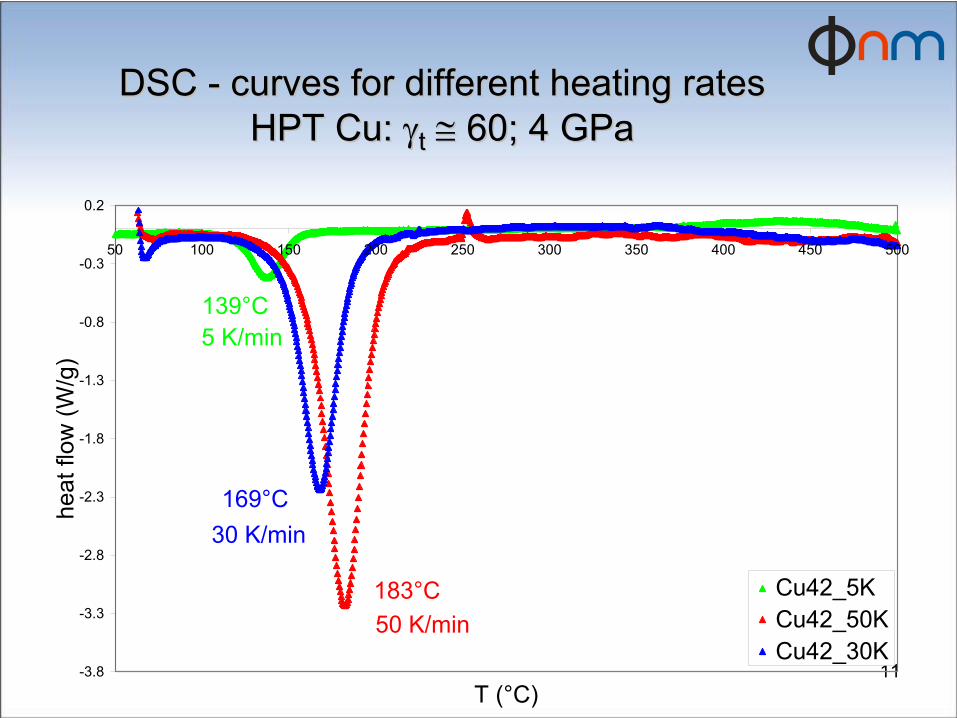
DSC DSC --
curves for different heating ratescurves for different heating rates HPT Cu: HPT Cu: γγtt
≅≅
60; 4 60; 4 GPaGPa
139°C
50 K/min183°C
5 K/min
30 K/min169°C
-3.8
-3.3
-2.8
-2.3
-1.8
-1.3
-0.8
-0.3
0.2
50 100 150 200 250 300 350 400 450 500
T (°C)
heat
flow
(W/g
)
Cu42_5KCu42_50KCu42_30K
12
.1lnmax
2max
constTR
QT
+−=⎟⎟⎠
⎞⎜⎜⎝
⎛ Φ
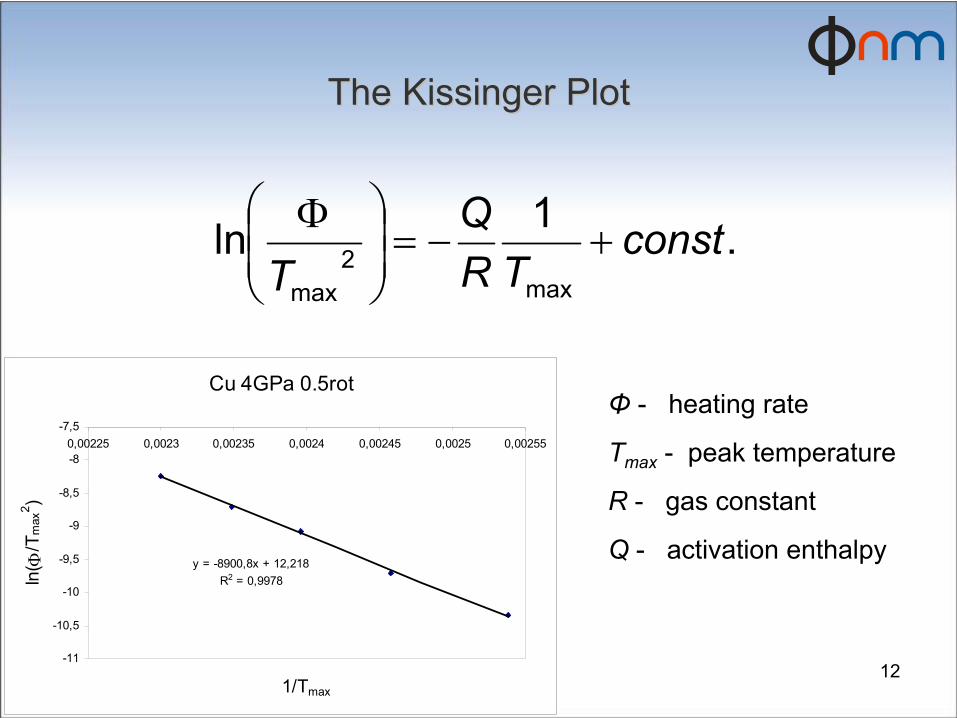
Φ
-
heating rate
Tmax
-
peak
temperature
R -
gas constant
Q
-
activation enthalpy
TheThe
Kissinger PlotKissinger Plot
[1/K]Cu 4GPa 0.5rot
y = -8900,8x + 12,218R2 = 0,9978
-11
-10,5
-10
-9,5
-9
-8,5
-8
-7,50,00225 0,0023 0,00235 0,0024 0,00245 0,0025 0,00255
1/Tmax
ln( Φ
/Tm
ax2 )

ResultsResults
forfor
NiNi
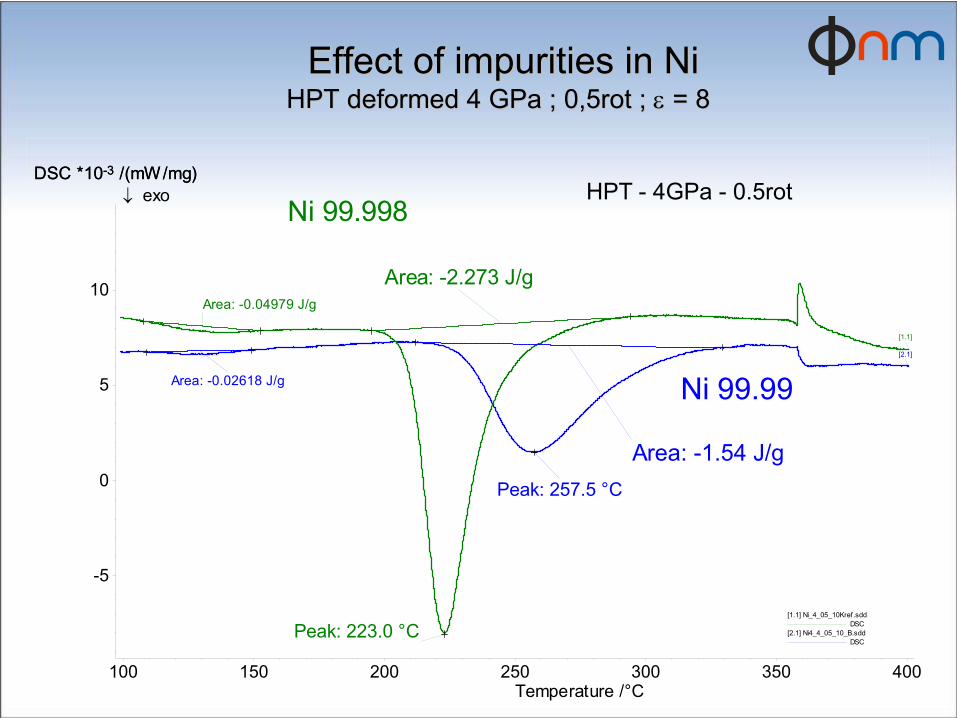
EffectEffect
of of impuritiesimpurities
in Niin Ni HPT HPT deformeddeformed
4 GPa ; 0,5rot ; 4 GPa ; 0,5rot ; εε
= 8= 8
100 150 200 250 300 350 400Temperature /°C
-5
0
5
10
DSC *10-3 /(mW/mg)DSC *10-3 /(mW/mg)
Ni 99.99
Ni 99.998
[1.1] Ni_4_05_10Kref.sdd DSC
[2.1] Ni4_4_05_10_B.sdd DSC
HPT - 4GPa - 0.5rot
Area: -0.04979 J/g
Area: -2.273 J/g
Peak: 223.0 °C
Area: -0.02618 J/g
Area: -1.54 J/gPeak: 257.5 °C
[1.1]
[2.1]
↓ exo
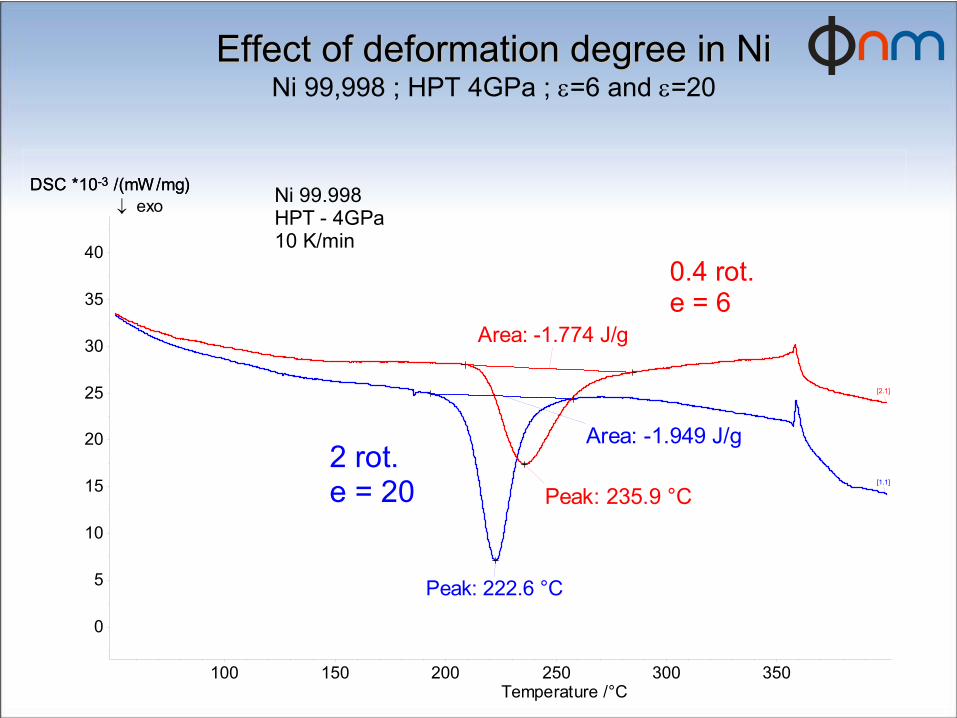
EffectEffect
of of deformationdeformation
degreedegree
in Niin NiNi 99,998 ; HPT 4GPa ; ε=6 and ε=20
100 150 200 250 300 350Temperature /°C
0
5
10
15
20
25
30
35
40
DSC *10-3 /(mW/mg)DSC *10-3 /(mW/mg)
2 rot.e = 20
0.4 rot.e = 6
Ni 99.998HPT - 4GPa10 K/min
Peak: 222.6 °C
Area: -1.949 J/g
Peak: 235.9 °C
Area: -1.774 J/g
[1.1]
[2.1]
↓ exo
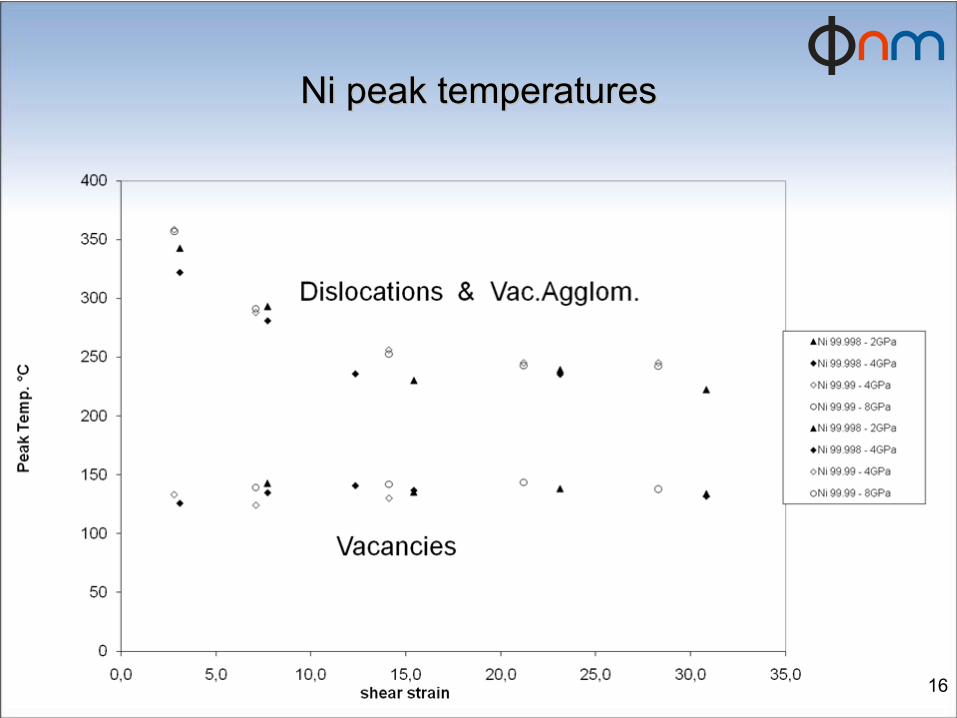
16
Ni Ni peakpeak
temperaturestemperatures

Results for CuResults for Cu
18
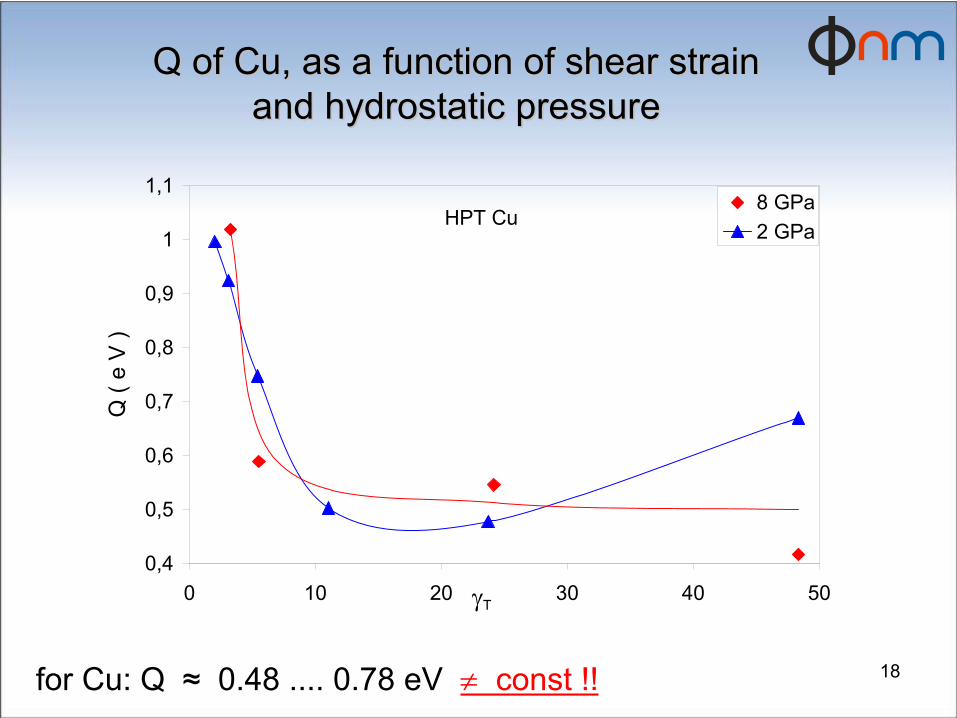
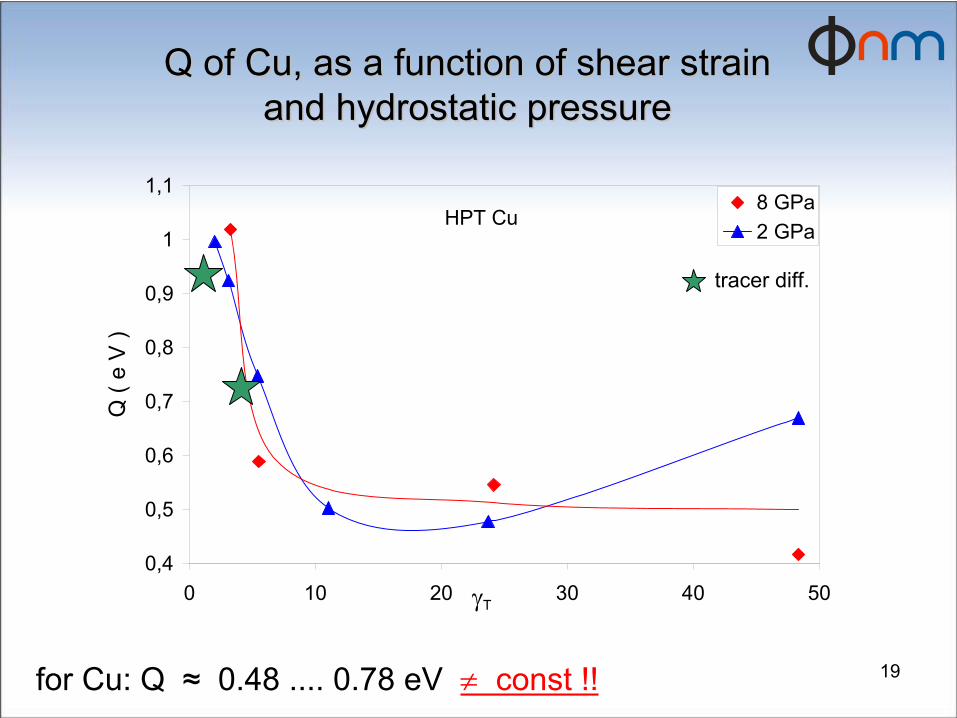
Q of Cu, as a function of shear strain Q of Cu, as a function of shear strain and hydrostatic pressureand hydrostatic pressure
for
Cu: Q ≈
0.48 .... 0.78 eV
≠
const
!!
HPT Cu
0,4
0,5
0,6
0,7
0,8
0,9
1
1,1
0 10 20 30 40 50γT
Q (
e V
)
8 GPa2 GPa
19
Q of Cu, as a function of shear strain Q of Cu, as a function of shear strain and hydrostatic pressureand hydrostatic pressure
for
Cu: Q ≈
0.48 .... 0.78 eV
≠
const
!!
HPT Cu
0,4
0,5
0,6
0,7
0,8
0,9
1
1,1
0 10 20 30 40 50γT
Q (
e V
)
8 GPa2 GPa
tracer
diff.
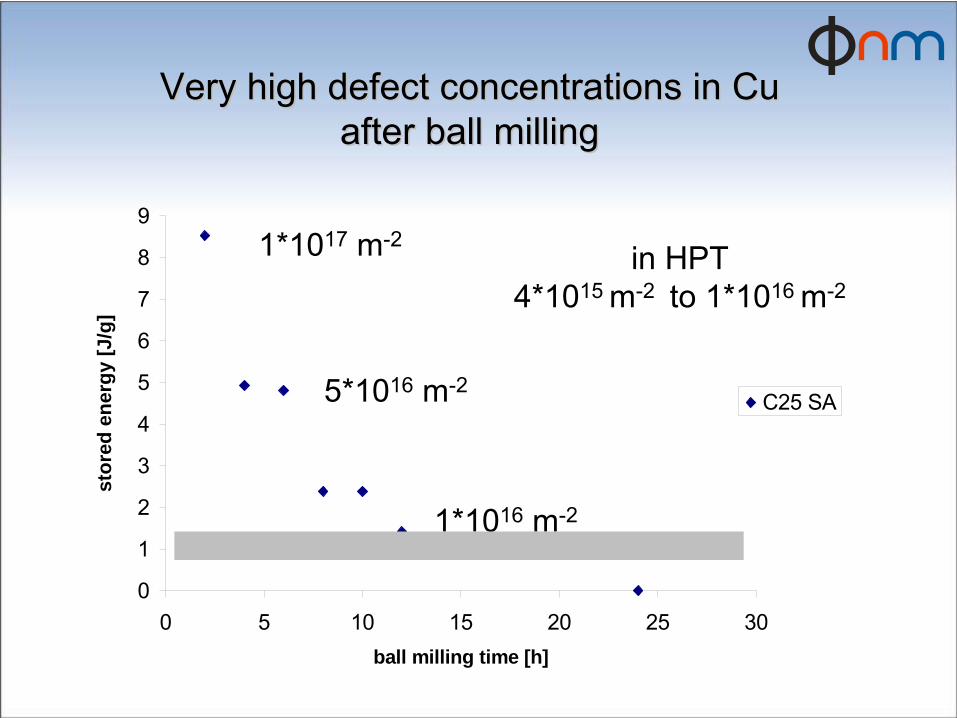
Very high defect concentrations in Cu Very high defect concentrations in Cu after ball millingafter ball milling
0
1
2
3
4
5
6
7
8
9
0 5 10 15 20 25 30ball milling time [h]
stor
ed e
nerg
y [J
/g]
C25 SA
1*1017
m-2
5*1016
m-2
1*1016
m-2
in HPT 4*1015 m-2 to 1*1016 m-2
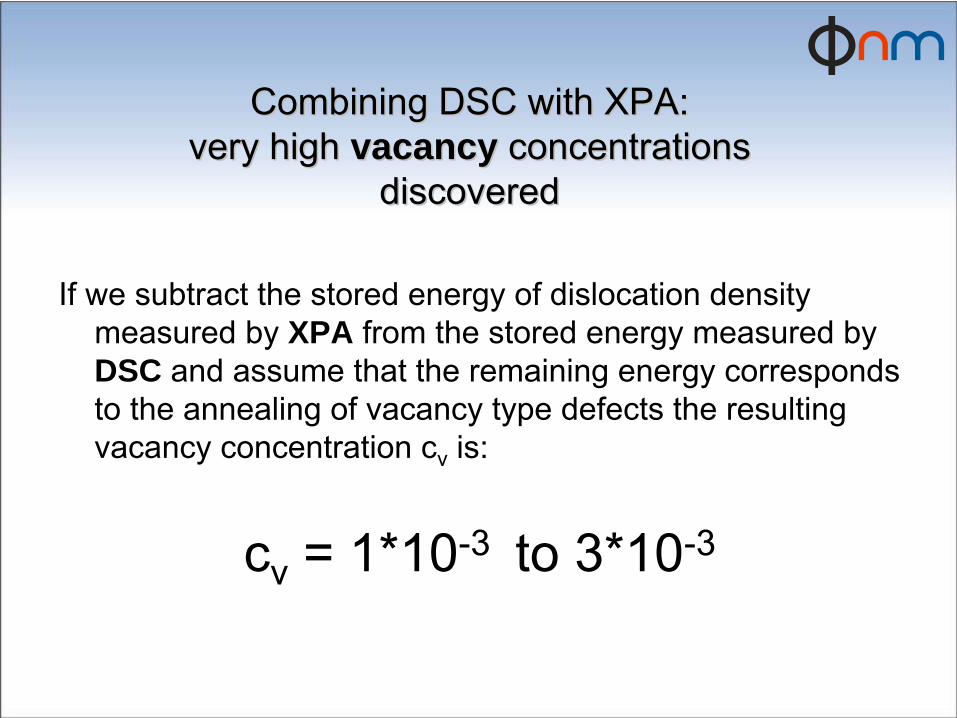
If we subtract the stored energy of dislocation density measured by XPA from the stored energy measured by DSC and assume that the remaining energy corresponds to the annealing of vacancy type defects the resulting vacancy concentration cv
is:
cv
= 1*10-3 to 3*10-3
Combining DSC with XPA:Combining DSC with XPA:very high very high vacancyvacancy concentrations concentrations
discovereddiscovered
Thermal Thermal stabilizationstabilization
of of deformationdeformation
inducedinduced
latticelattice
defectsdefects
byby
HydrogenHydrogen
in Pdin Pd
100 200 300 400 500Tem p eratu re /°C
-4
-3
-2
-1
0
1
2
3
4
5
DS C * 10 -3 /(m W /m g)DS C * 10 -3 /(m W /m g)
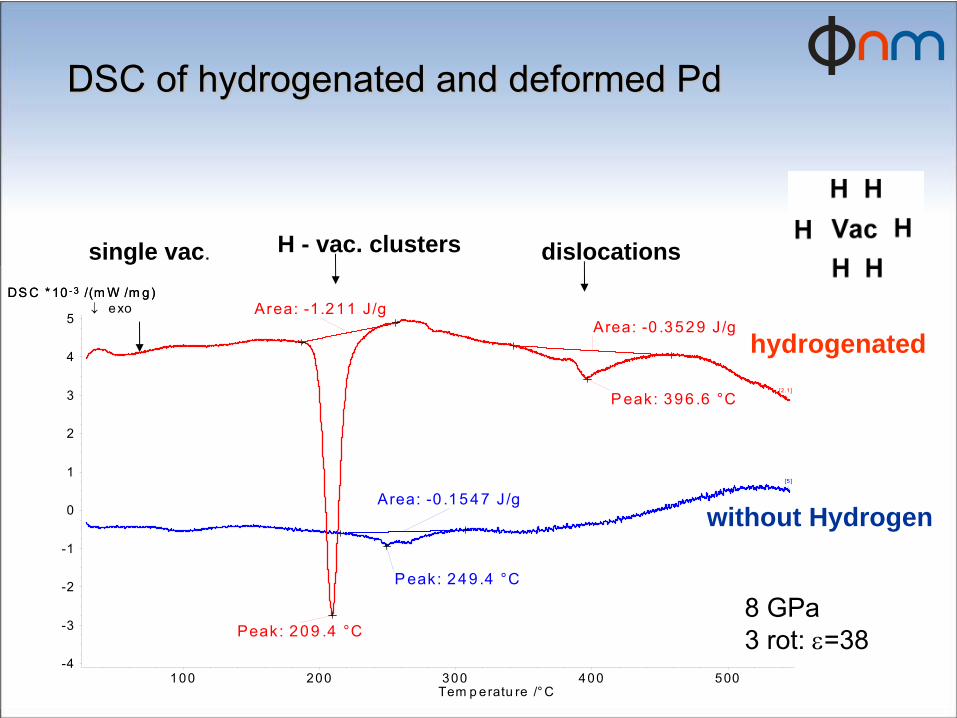
Peak: 209 .4 °C
P eak: 396 .6 °C
Area: -1.211 J/gArea: -0 .3529 J /g
Area: -0 .1547 J /g
P eak: 249 .4 °C
[2.1]
[5 ]
↓ exo
DSC of hydrogenated and deformed PdDSC of hydrogenated and deformed Pd
8 GPa 3 rot: ε=38
hydrogenated
without Hydrogen
single vac. H - vac. clusters dislocations
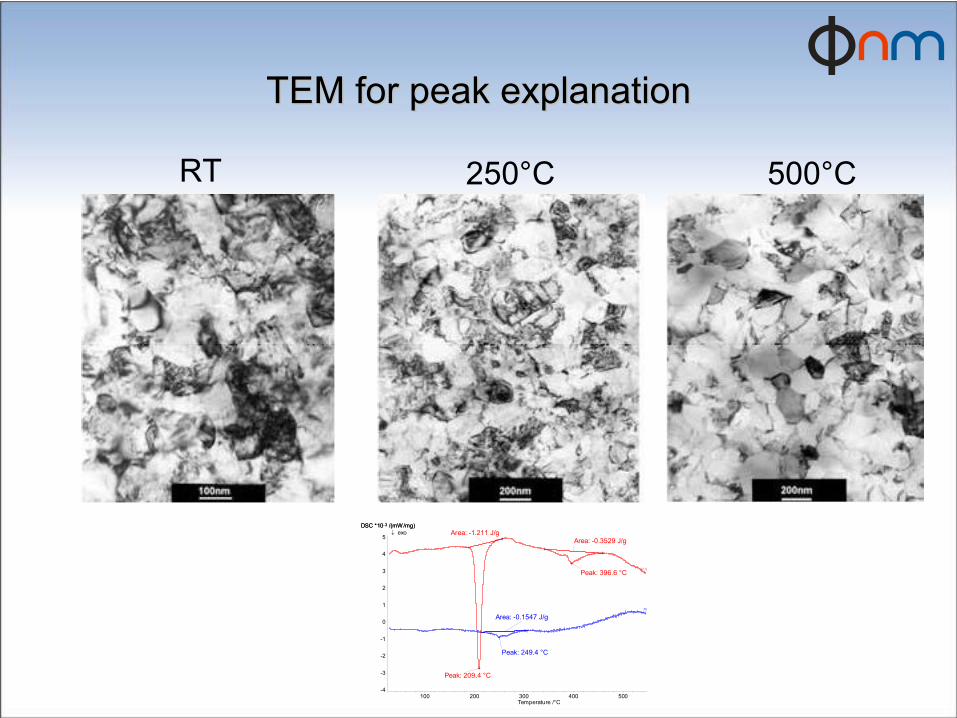
TEM for peak explanationTEM for peak explanation
100 200 300 400 500Temperature /°C
-4
-3
-2
-1
0
1
2
3
4
5
DSC *10-3 /(mW/mg)DSC *10-3 /(mW/mg)
Peak: 209.4 °C
Peak: 396.6 °C
Area: -1.211 J/gArea: -0.3529 J/g
Area: -0.1547 J/g
Peak: 249.4 °C
[2.1]
[5]
↓ exo
RT 500°C250°C
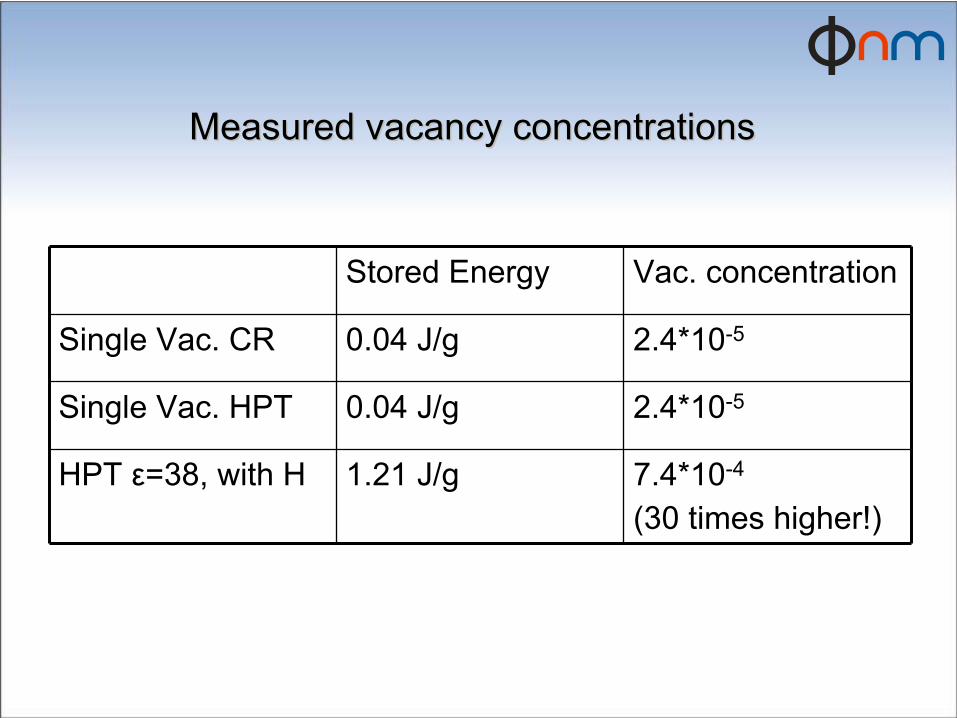
Measured vacancy concentrationsMeasured vacancy concentrations
Stored Energy Vac. concentration
Single Vac. CR 0.04 J/g 2.4*10-5
Single Vac. HPT 0.04 J/g 2.4*10-5
HPT ε=38,
with H 1.21 J/g 7.4*10-4
(30 times higher!)
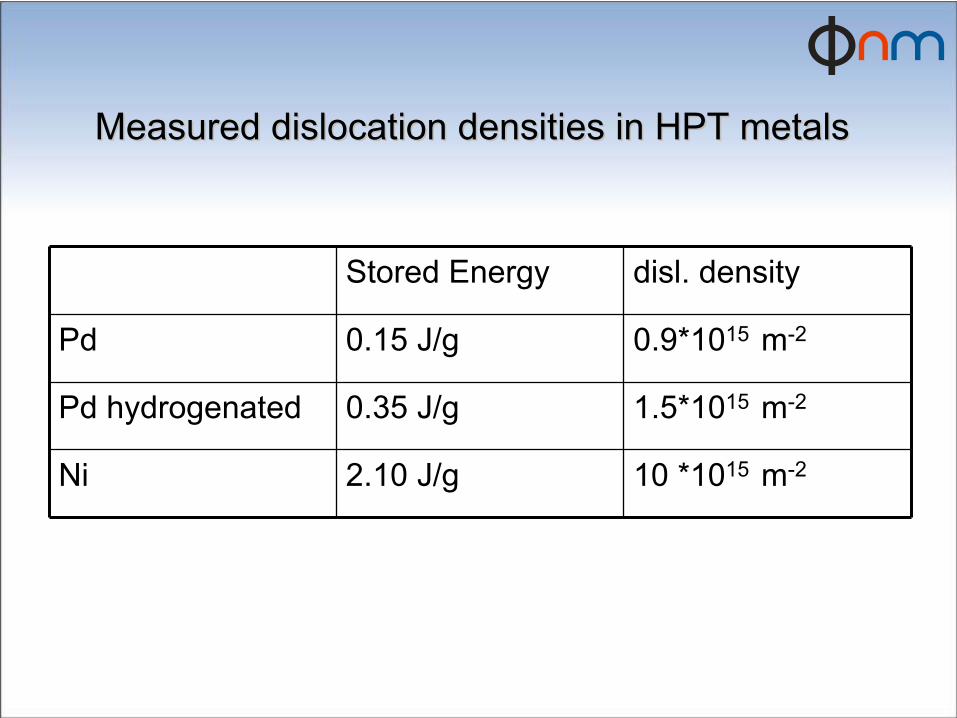
Measured dislocation densities in HPT metalsMeasured dislocation densities in HPT metals
Stored Energy disl. density
Pd 0.15 J/g 0.9*1015 m-2
Pd hydrogenated 0.35 J/g 1.5*1015 m-2
Ni 2.10 J/g 10 *1015 m-2
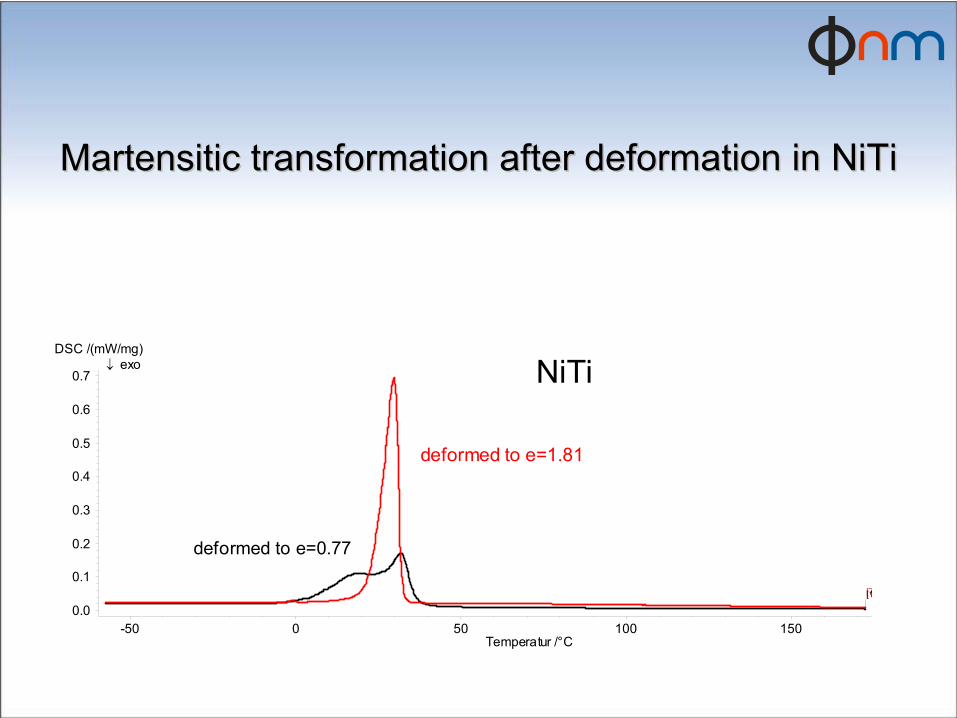
MartensiticMartensitic
transformationtransformation
afterafter
deformationdeformation
in in NiTiNiTi
-50 0 50 100 150Temperatur /°C
0.0
0.1
0.2
0.3
0.4
0.5
0.6
0.7
DSC /(mW/mg)
NiTi
deformed to e=0.77
deformed to e=1.81
[7[1
↓ exo
Phase shift after ECAP deformation of AM60
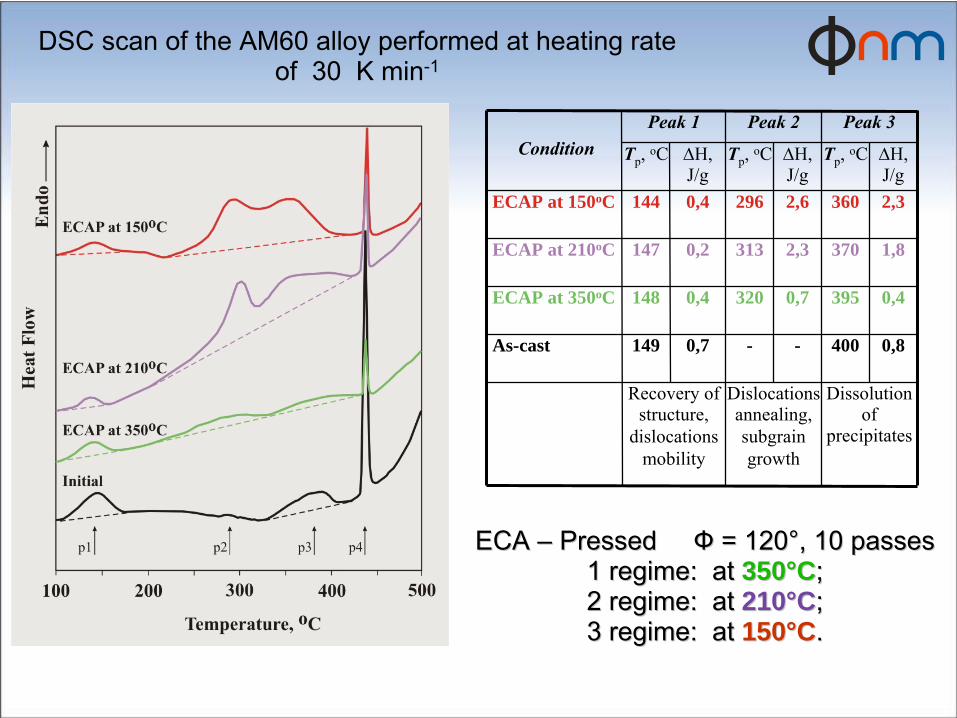
ECA ECA ––
Pressed Pressed ФФ
= 120= 120°°, 10 passes, 10 passes 1 regime: at 1 regime: at 350350°°CC;;
2 regime: at 2 regime: at 210210°°CC;; 3 regime: at 3 regime: at 150150°°CC..
2,33602,62960,4144ECAP at 150oC
0,43950,73200,4148ECAP at 350oC
0,8400--0,7149As-cast
Dissolution of
precipitates
Dislocations annealing, subgrain
growth
Recovery of structure,
dislocations mobility
1,83702,33130,2147ECAP at 210oC
∆H, J/g
Тp
, оС∆H, J/g
Тp
, оС∆H, J/g
Тp
, оС
Peak 3Peak 2Peak 1Condition
DSC scan of the AM60 alloy performed at heating rate of 30 K min-1
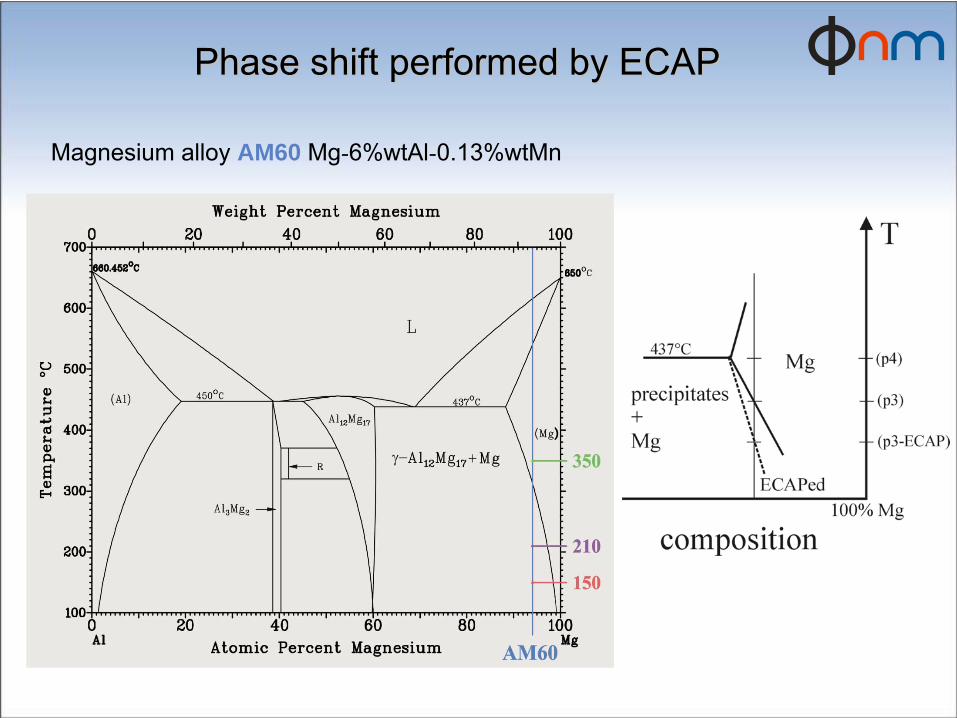
Phase shift performed by ECAP Phase shift performed by ECAP
Magnesium alloy AM60 Mg-6%wtAl-0.13%wtMn
CristallineCristalline
lamellaelamellae
in in iPPiPP
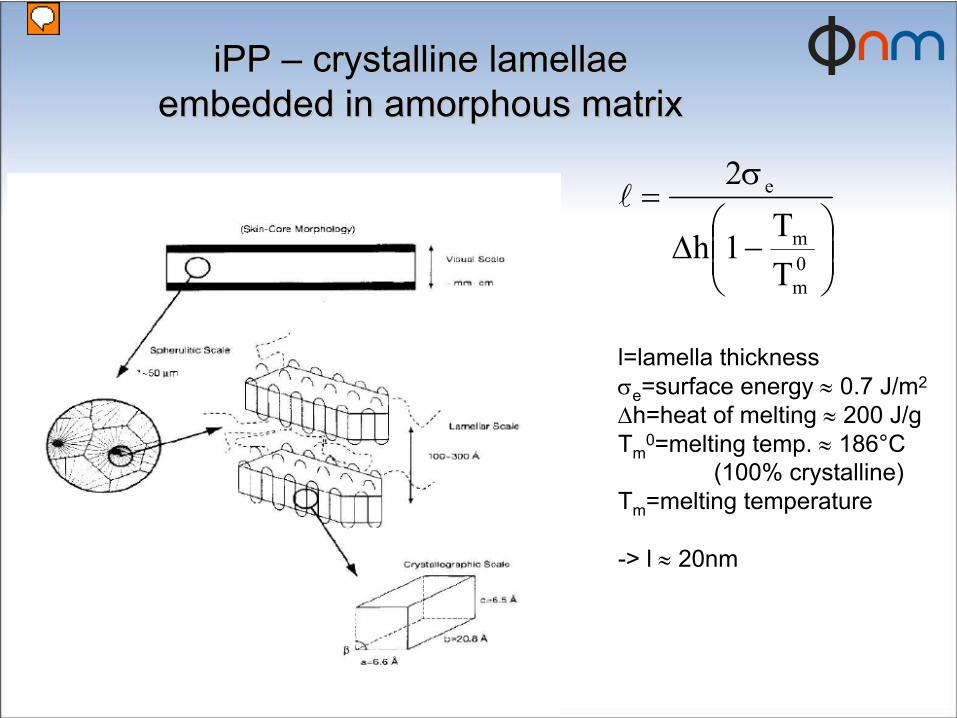
⎟⎟⎠
⎞⎜⎜⎝
⎛−Δ
σ=
0m
m
e
TT1h
2l
l=lamella thicknessσe
=surface energy ≈
0.7 J/m2
Δh=heat of melting ≈
200 J/gTm
0=melting temp. ≈
186°C (100% crystalline)
Tm
=melting temperature
-> l ≈
20nm
iPPiPP
––
crystalline lamellae crystalline lamellae embedded in amorphous matrixembedded in amorphous matrix
Presenter
Presentation Notes
l = independent from deformation degree
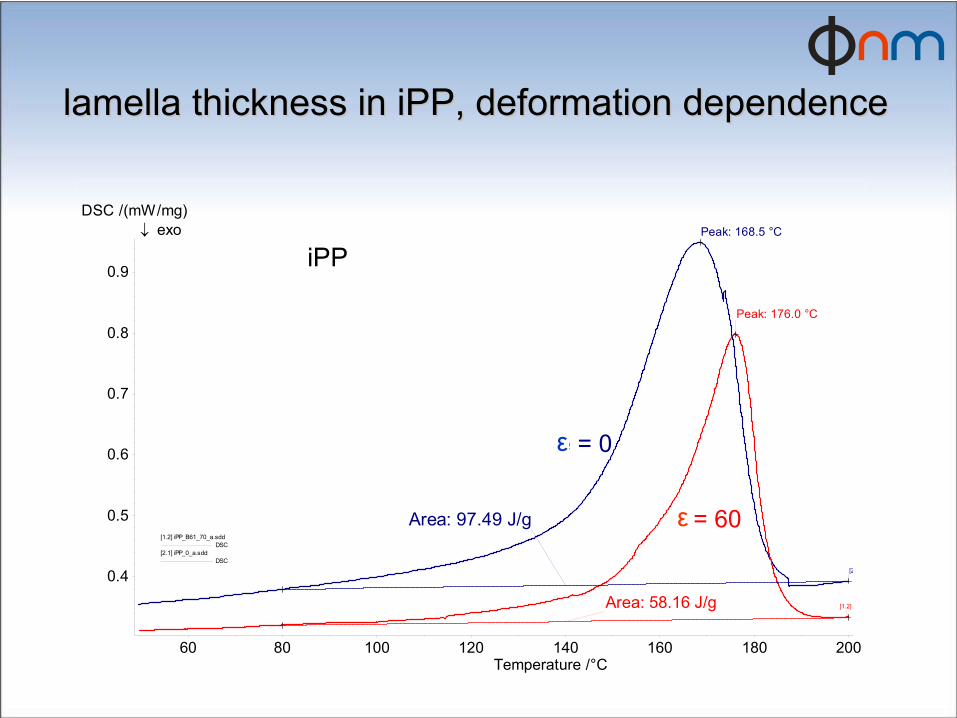
lamellalamella
thicknessthickness
in in iPPiPP, , deformationdeformation
dependencedependence
60 80 100 120 140 160 180 200Temperature /°C
0.4
0.5
0.6
0.7
0.8
0.9
DSC /(mW/mg)
[1.2] iPP_B61_70_a.sdd DSC
[2.1] iPP_0_a.sdd DSC
iPP
e = 60
e = 0
Peak: 176.0 °C
Peak: 168.5 °C
Area: 97.49 J/g
Area: 58.16 J/g [1.2]
[2
↓ exo
ε ε
ε
LimitationsLimitations
of DSC in Mgof DSC in Mg
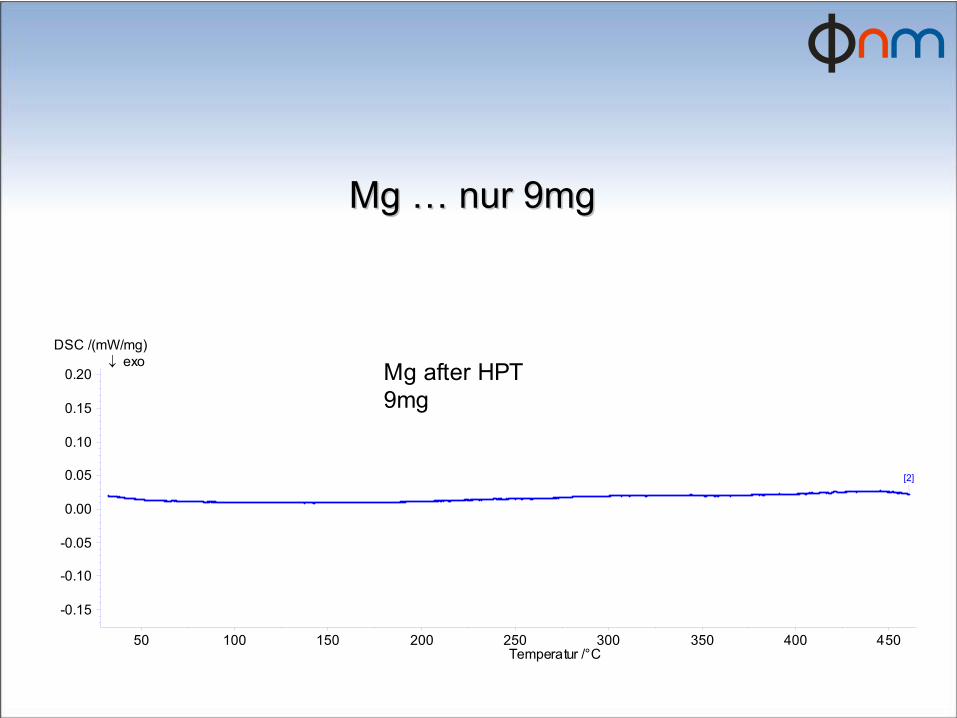
Mg Mg ……
nur 9mgnur 9mg
50 100 150 200 250 300 350 400 450Temperatur /°C
-0.15
-0.10
-0.05
0.00
0.05
0.10
0.15
0.20
DSC /(mW/mg)
Mg after HPT9mg
[2]
↓ exo
50 100 150 200 250 300 350 400 450Temperature /°C
-0.08
-0.06
-0.04
-0.02
0.00
0.02
0.04
DSC /(mW/mg)
[2] subtrHPT_2017P_41s_12.sdd70_HPT_2017P_41s_12.sdd72.mdd DSC
[5] subtr2017P10_1.sdd70_2017P10_2.sdd70.mdd~.mdd DSC
HPT
HE
2017 after HPTshear strain = 1,4
2017 after HEshear strain = 1,4
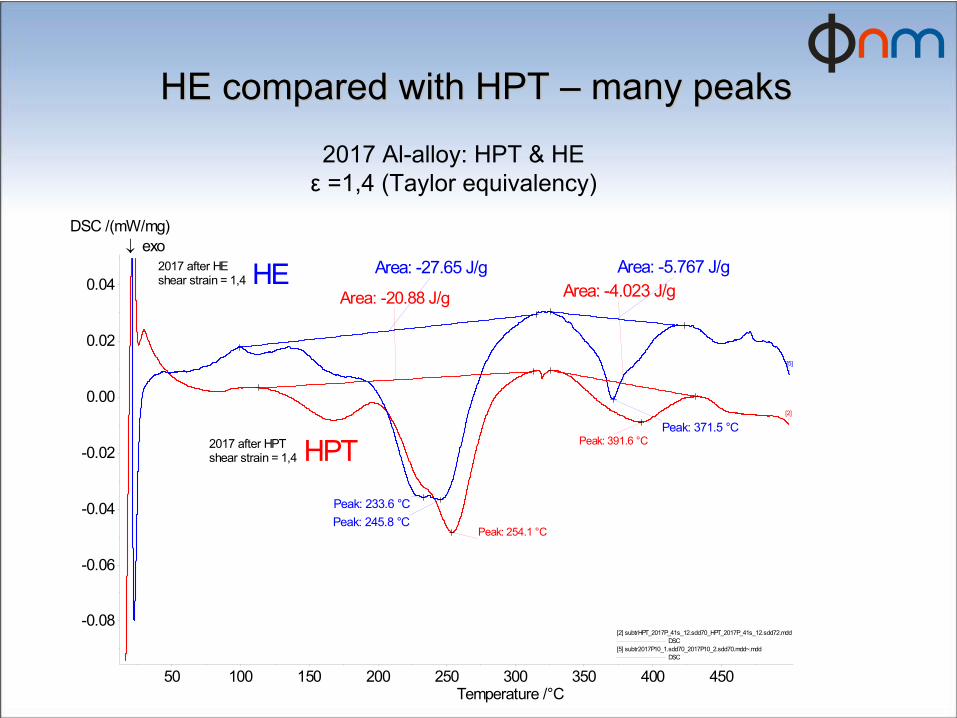
Area: -4.023 J/g
Peak: 254.1 °C
Peak: 391.6 °C
Area: -20.88 J/g
Peak: 245.8 °C
Peak: 371.5 °C
Peak: 233.6 °C
Area: -5.767 J/gArea: -27.65 J/g
[2]
[5]
↓ exo
HE HE comparedcompared
withwith
HPTHPT
––
manymany
peakspeaks
2017 Al-alloy: HPT & HE ε
=1,4 (Taylor equivalency)
37
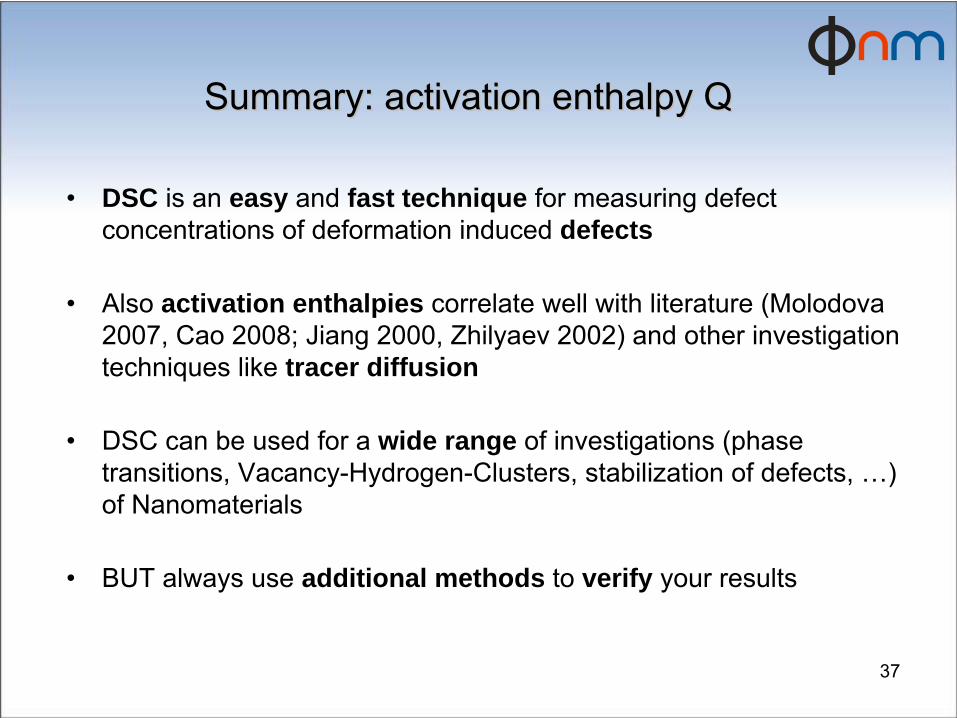
SummarySummary: : activationactivation
enthalpyenthalpy
•
DSC is an
easy and
fast technique for measuring defect concentrations
of deformation induced
defects
•
Also
activation enthalpies correlate well with literature (Molodova 2007, Cao
2008; Jiang
2000, Zhilyaev
2002) and other investigation
techniques like tracer diffusion
•
DSC can be used for a wide range of investigations (phase transitions, Vacancy-Hydrogen-Clusters, stabilization of defects, …) of Nanomaterials
•
BUT always use additional methods to verify your results

38
Thank
You… for
the
invitation
and the
possibility
to talk
about
my
passion!
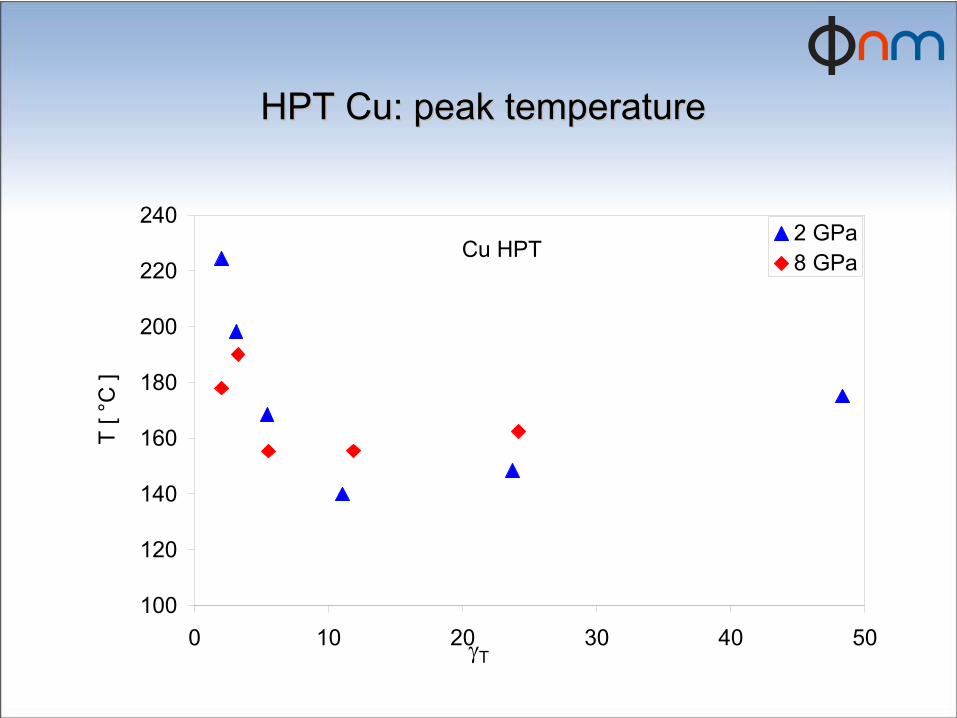
HPT Cu: HPT Cu: peakpeak
temperaturetemperature
Cu HPT
100
120
140
160
180
200
220
240
0 10 20 30 40 50γT
T [ °
C ]
2 GPa8 GPa
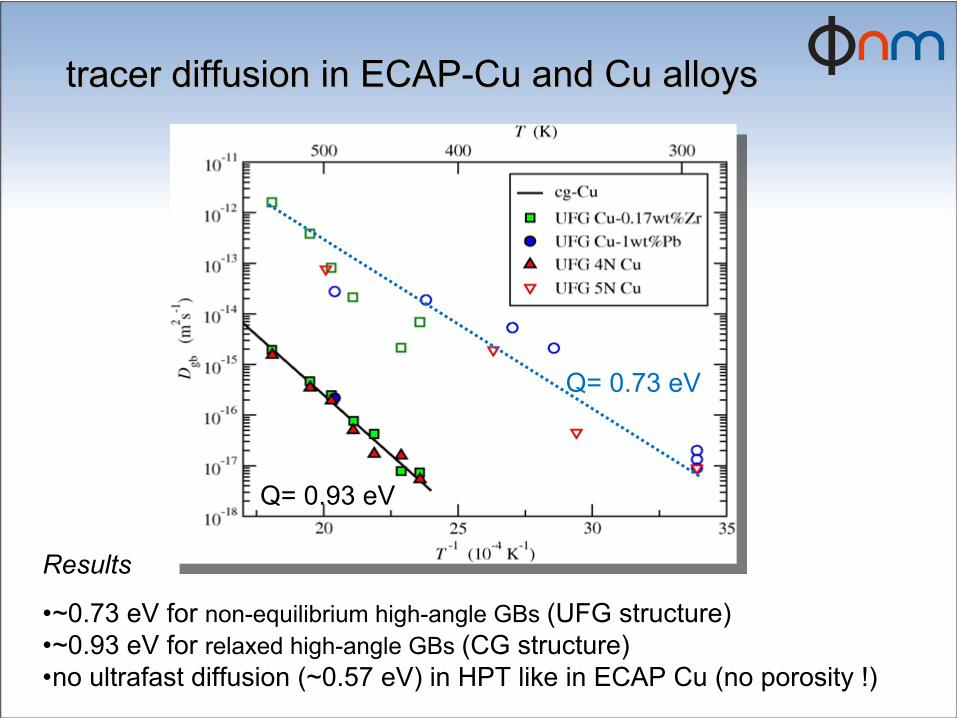
tracertracer
diffusiondiffusion
in in ECAPECAP--CuCu
and Cu and Cu alloysalloys
Q= 0.93 eV
Q= 0.73 eV
Results
•~0.73 eV
for non-equilibrium high-angle GBs
(UFG structure)•~0.93 eV
for relaxed high-angle GBs
(CG structure)
•no ultrafast
diffusion (~0.57 eV) in HPT like in ECAP Cu (no porosity !)
Comparison
of different SPD techniques
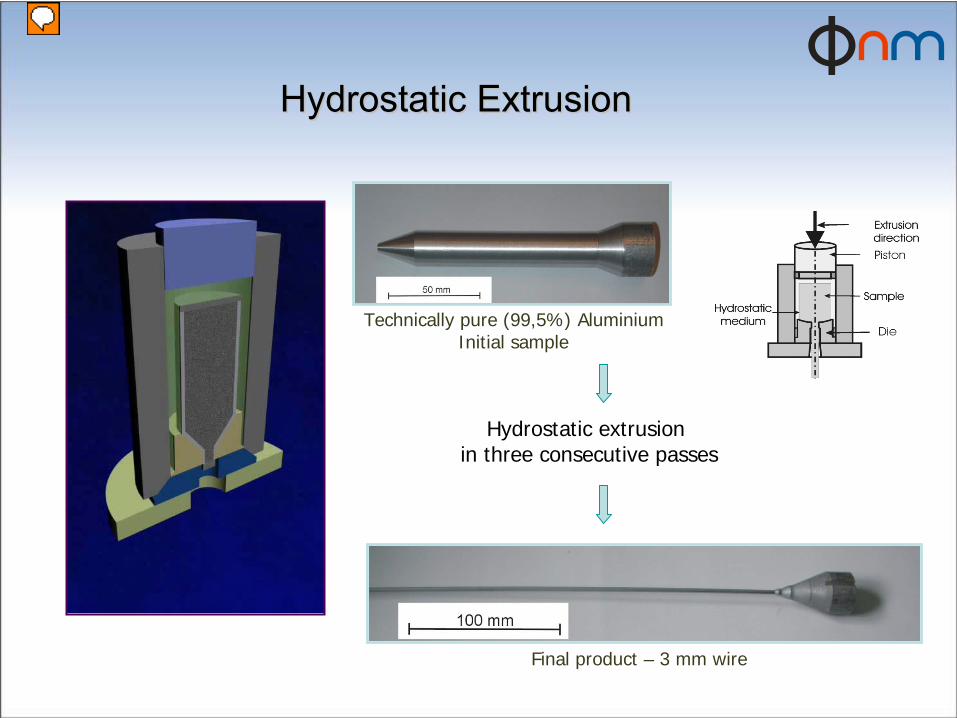
Hydrostatic ExtrusionHydrostatic Extrusion
Technically pure (99,5%) AluminiumInitial sample
Final product – 3 mm wire
Hydrostatic extrusion in three consecutive passes
Presenter
Presentation Notes
In my departmen we are also producing nanomaterials but using hydrostatic extrusion which is also SPD method. In HE method a sample in the container is surrounded with the pressure medium. During extrusion the penetrating seal compresses the pressure medium until the sample starts to extrude- the priston don´t touching a extruded materials. The extrusion started after overflow a volues of critical pressure which is a characteristic value of diffrent materials and depended also of the factor (coefficient) of reduction transver field befor and after extrusion. p=Kc lnR. Material is extruded throu a hole in a die. The fraction is very small becouse of pressure medium and lubricant on the material. The negligible friction provide a minimum of losses(waste) of energy. Temperature in material in die depend of pressure, density and specific heat of extruded material. It is a big problem because of high temperature it is possible of recovery and recrystalization. Because of this dynamic structural process materials could have lower mechanical properties. To avoid this The extrusion products were cooled at the die exit. Due to negligibly small friction, high deformation homogenity and very high strain rate are assured. (strain rate during HE has achieved 2x10²s-1 At the beginning HE was primarily successfully applied to the consolidation of nanostructured powders but research show that can be also used to obtain nanostruced metals starting from bulk materials.
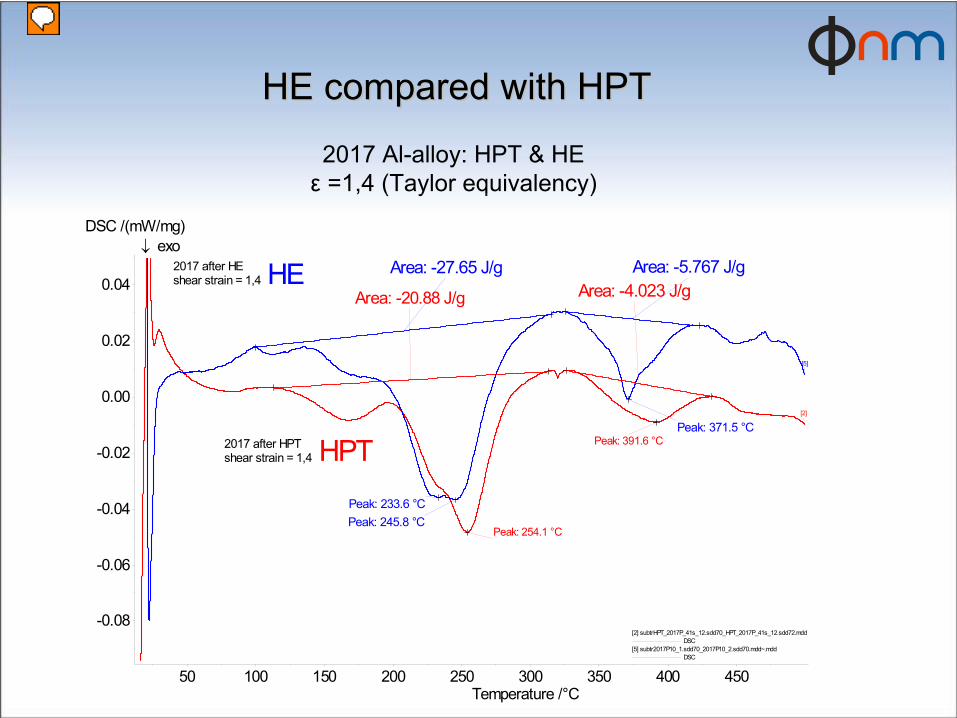
HE HE comparedcompared
withwith
HPTHPT
2017 Al-alloy: HPT & HE ε
=1,4 (Taylor equivalency)
50 100 150 200 250 300 350 400 450Temperature /°C
-0.08
-0.06
-0.04
-0.02
0.00
0.02
0.04
DSC /(mW/mg)
[2] subtrHPT_2017P_41s_12.sdd70_HPT_2017P_41s_12.sdd72.mdd DSC
[5] subtr2017P10_1.sdd70_2017P10_2.sdd70.mdd~.mdd DSC
HPT
HE
2017 after HPTshear strain = 1,4
2017 after HEshear strain = 1,4
Area: -4.023 J/g
Peak: 254.1 °C
Peak: 391.6 °C
Area: -20.88 J/g
Peak: 245.8 °C
Peak: 371.5 °C
Peak: 233.6 °C
Area: -5.767 J/gArea: -27.65 J/g
[2]
[5]
↓ exo
Presenter
Presentation Notes
stored energy in HE higher than HPT
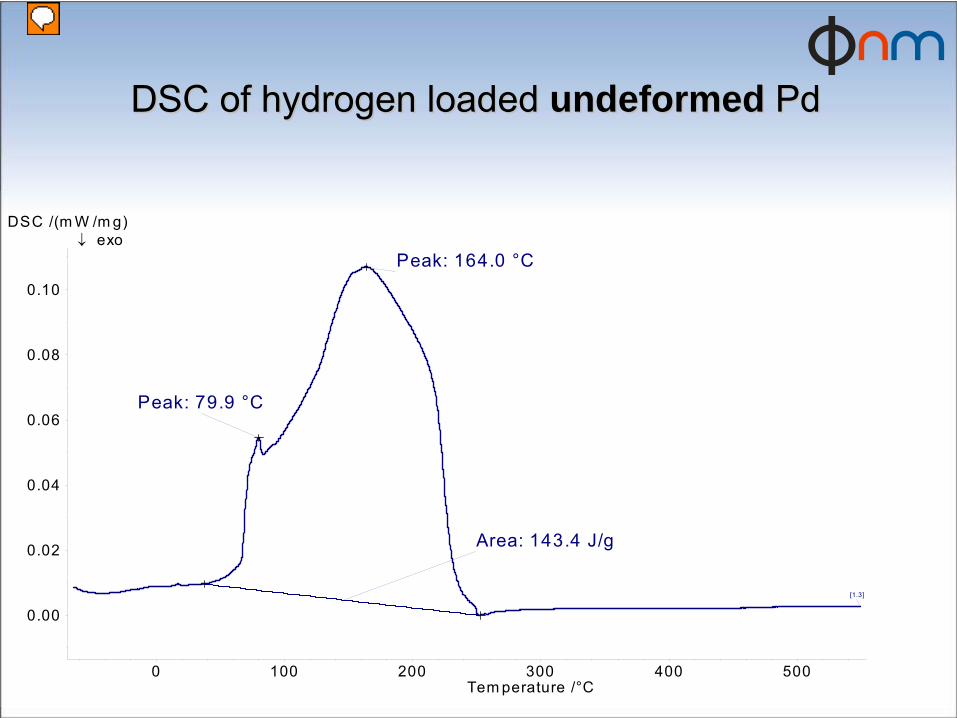
0 100 200 300 400 500Tem perature /°C
0.00
0.02
0.04
0.06
0.08
0.10
DSC /(m W /m g)
Peak: 164.0 °C
Peak: 79.9 °C
Area: 143.4 J/g
[1.3]
↓ exo
DSC of DSC of hydrogenhydrogen
loadedloaded
undeformedundeformed Pd Pd
Presenter
Presentation Notes
deformed sample is thinner, kinetic higher because of more grain boundaries after HPT
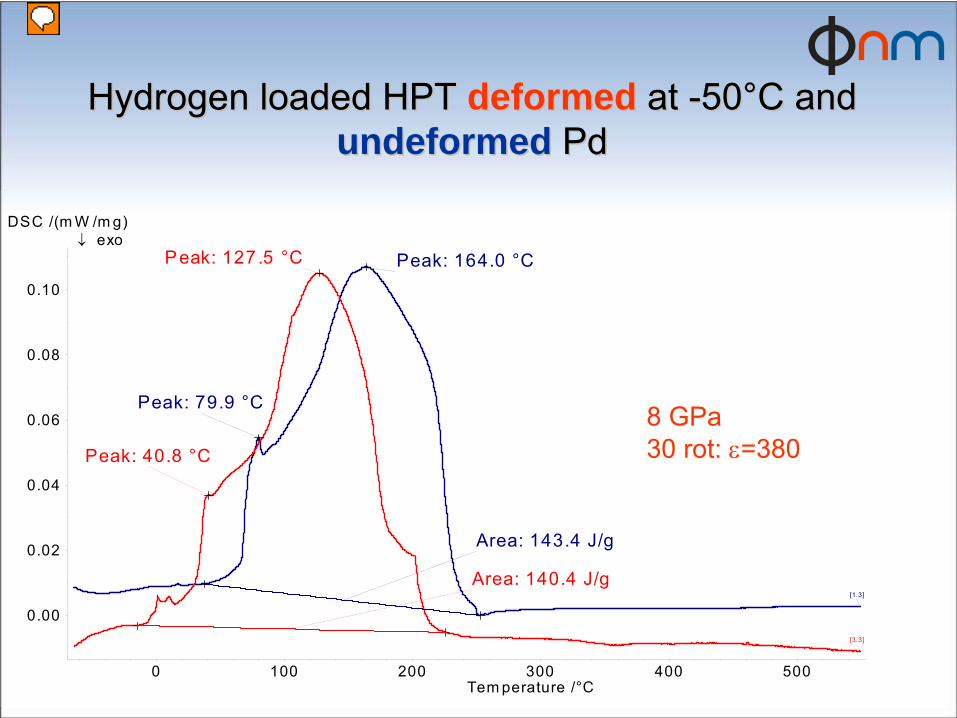
HydrogenHydrogen
loadedloaded
HPTHPT
deformeddeformed at at --5050°°CC
andand undeformedundeformed PdPd
0 100 200 300 400 500Tem perature /°C
0.00
0.02
0.04
0.06
0.08
0.10
DSC /(m W /m g)
Peak: 164.0 °C
Peak: 79.9 °C
Area: 143.4 J/g
Peak: 127 .5 °C
Peak: 40.8 °C
Area: 140.4 J/g[1.3]
[3.3]
↓ exo
8 GPa 30 rot: ε=380
Presenter
Presentation Notes
deformed sample is thinner, kinetic higher because of more grain boundaries after HPT
4 4 weeksweeks
annealingannealing
at at roomroom
temperaturetemperature
forfor
HydrogenHydrogen desorptiondesorption
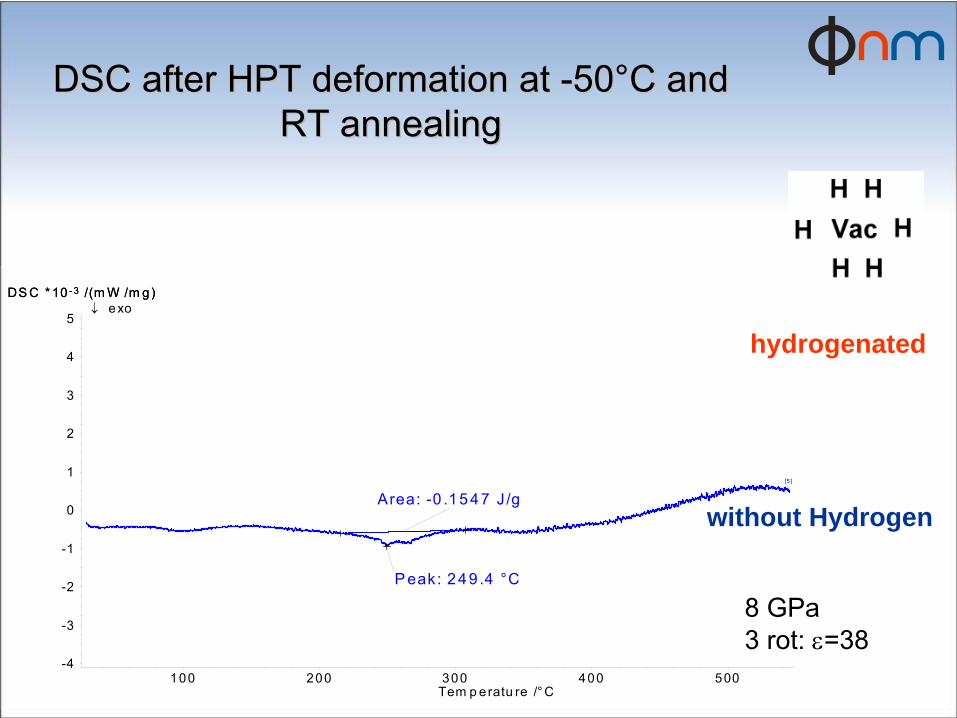
DSC after HPT deformation at DSC after HPT deformation at --5050°°C and C and RT annealingRT annealing
8 GPa 3 rot: ε=38
hydrogenated
without Hydrogen
100 200 300 400 500Tem p eratu re /°C
-4
-3
-2
-1
0
1
2
3
4
5
DS C * 10 -3 /(m W /m g)DS C * 10 -3 /(m W /m g)
Area: -0 .1547 J /g
P eak: 249 .4 °C
[5]
↓ exo
motivationmotivation
Fukai: high vacancy concentration up to several % in quenched metals using Hydrogen
trying now to use Hydrogen for formation of deformation induced vacancies
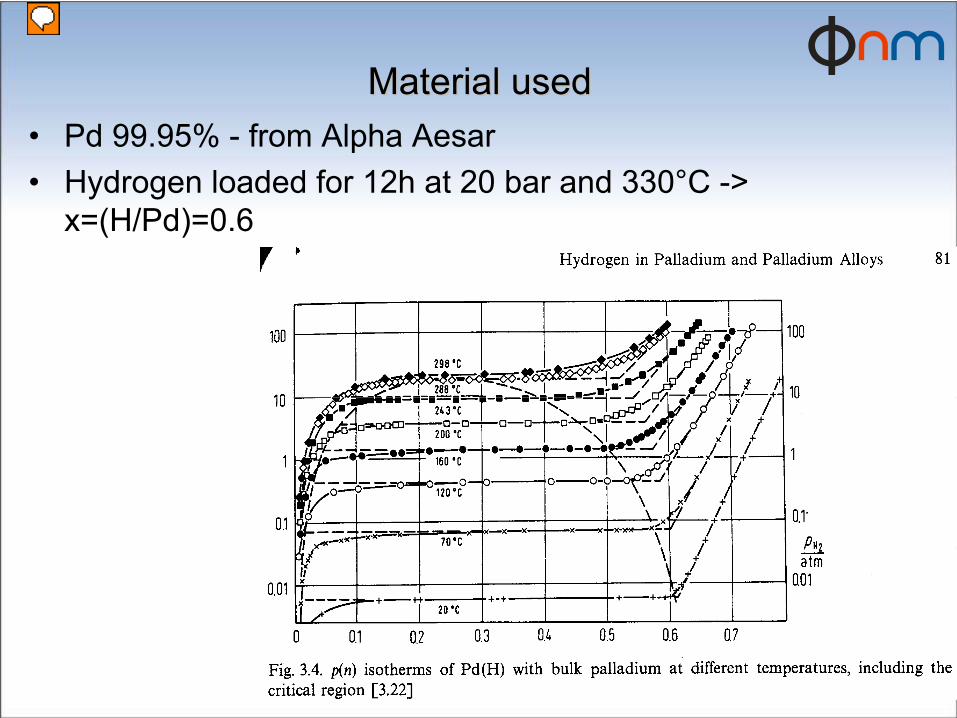
Material Material usedused•
Pd 99.95% -
from
Alpha Aesar
•
Hydrogen
loaded
for
12h at 20 bar and 330°C -> x=(H/Pd)=0.6
Presenter
Presentation Notes
stay in the one- phase region, to avoid stresses inside the sample. slow loading. otherwise loading only at the surface, lattice parameter changes on surfaces because of hydrogen -> stress inside sample
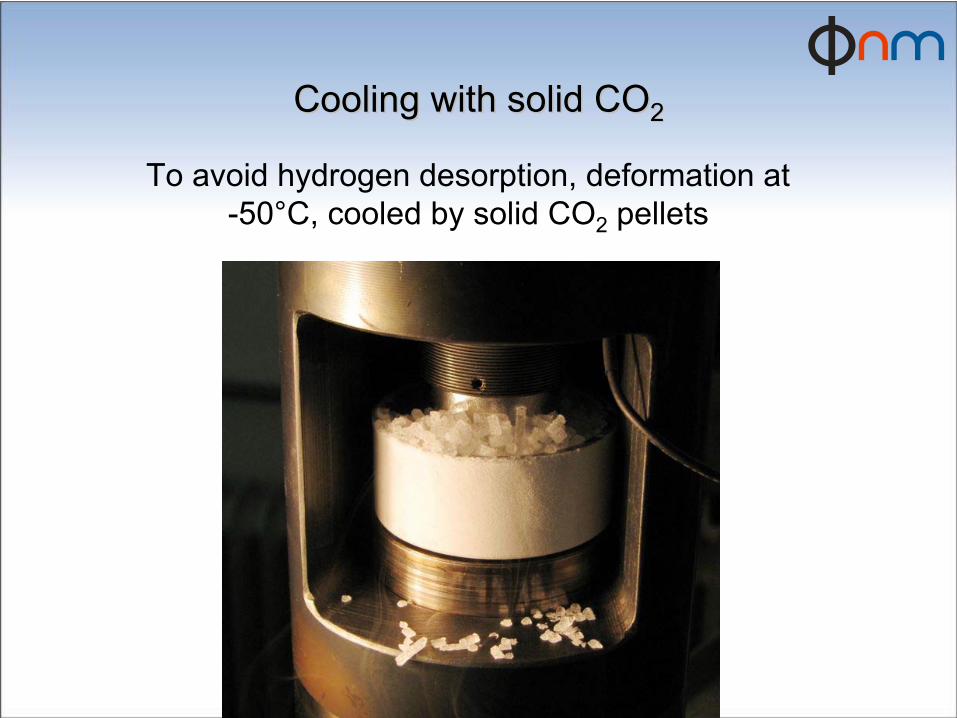
To avoid hydrogen desorption, deformation at -50°C, cooled by solid CO2
pellets
CoolingCooling
withwith
solid COsolid CO22
51
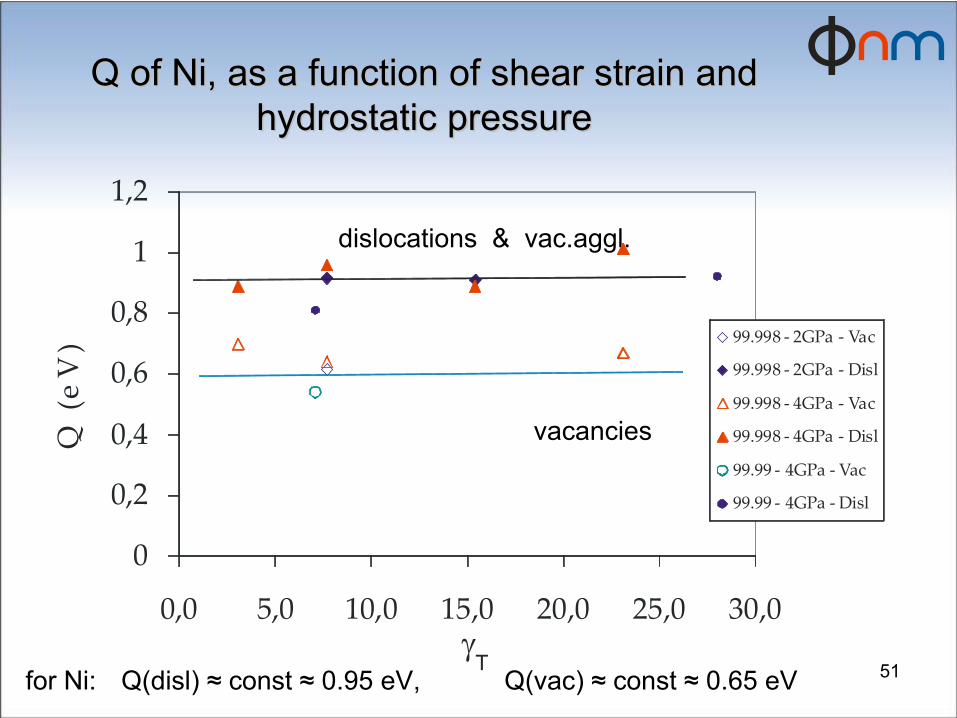
Q of Ni, as a function of shear strain and Q of Ni, as a function of shear strain and hydrostatic pressurehydrostatic pressure
for
Ni: Q(disl) ≈
const
≈
0.95 eV, Q(vac) ≈
const
≈
0.65 eV
dislocations
& vac.aggl.
vacancies
0
0,2
0,4
0,6
0,8
1
1,2
0,0 5,0 10,0 15,0 20,0 25,0 30,0
99.998 ‐ 2GPa ‐ Vac
99.998 ‐ 2GPa ‐ Disl
99.998 ‐ 4GPa ‐ Vac
99.998 ‐ 4GPa ‐ Disl
99.99 ‐ 4GPa ‐Vac
99.99 ‐ 4GPa ‐Disl
Q(e
V)
γT
52
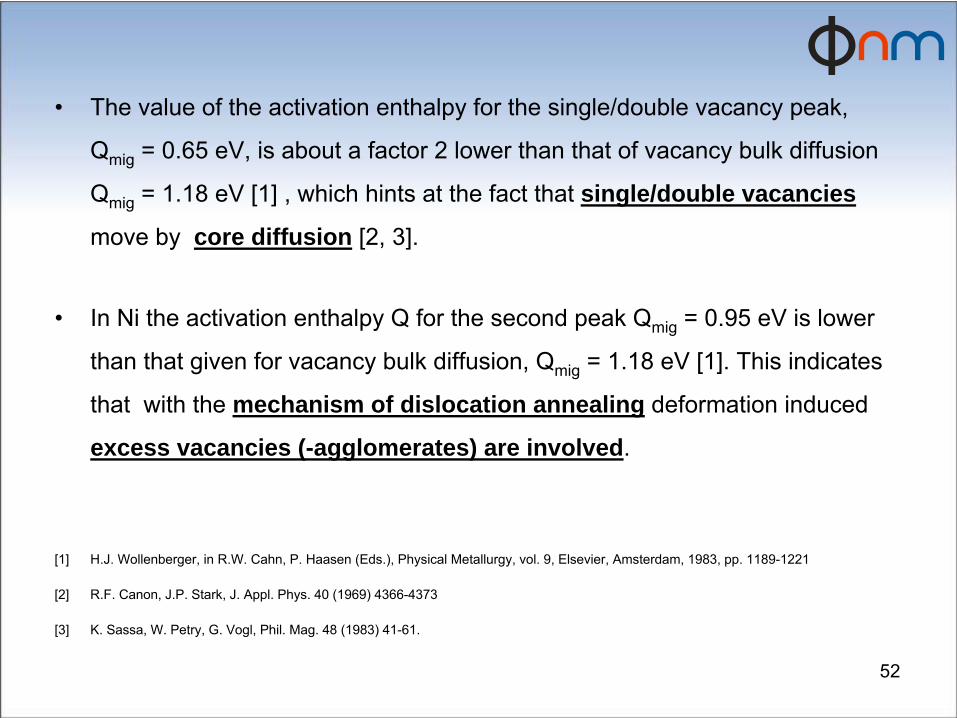
•
The value of the activation enthalpy for the single/double vacancy peak,
Qmig
= 0.65 eV, is about a factor 2 lower than that of vacancy bulk diffusion
Qmig
= 1.18 eV
[1] , which hints at the fact that single/double vacancies
move by core diffusion [2, 3].
•
In Ni the activation enthalpy Q for the second peak Qmig
= 0.95 eV
is lower
than that given for vacancy bulk diffusion, Qmig
= 1.18 eV
[1]. This indicates
that with the mechanism of dislocation annealing deformation induced
excess vacancies (-agglomerates) are involved.
[1]
H.J. Wollenberger, in R.W. Cahn, P. Haasen
(Eds.), Physical Metallurgy, vol. 9, Elsevier, Amsterdam, 1983,
pp. 1189-1221
[2]
R.F. Canon, J.P. Stark, J. Appl. Phys. 40 (1969) 4366-4373
[3]
K. Sassa, W. Petry, G. Vogl, Phil. Mag. 48 (1983) 41-61.
53
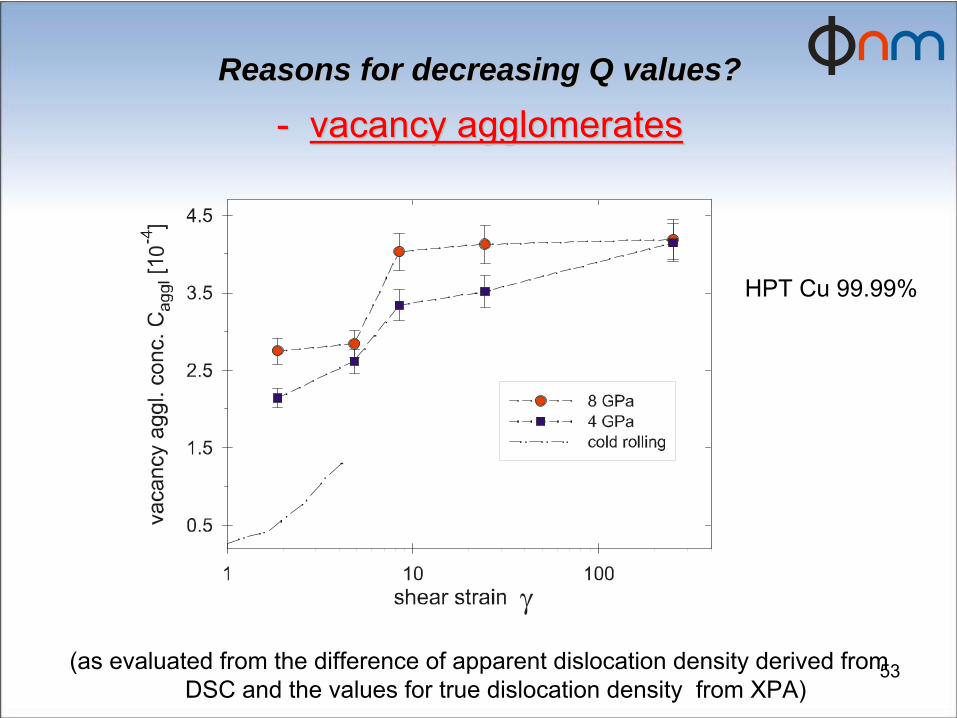
Reasons for decreasing Q values?Reasons for decreasing Q values?
--
vacancy agglomeratesvacancy agglomerates0
γ
(as evaluated from the difference of apparent dislocation density derived from DSC and the values for true dislocation density from XPA)
HPT Cu 99.99%
54re s o lv e d s h e a r s tra in γ re s
1 1 0 1 0 0
1 0
2 0
3 0
4 0
5 0
re s o lv e d s h e a r s tra in γ re s1 1 0 1 0 0
1 0
2 0
3 0
4 0
5 0
1 0
2 0
3 0
4 0
5 0
long
rang
e in
tern
al s
tress
es |Δ
τ w -
Δτc| [
MPa
]
1 0
2 0
3 0
4 0
5 0
0 .8 G P a
4 G P a
8 G P a
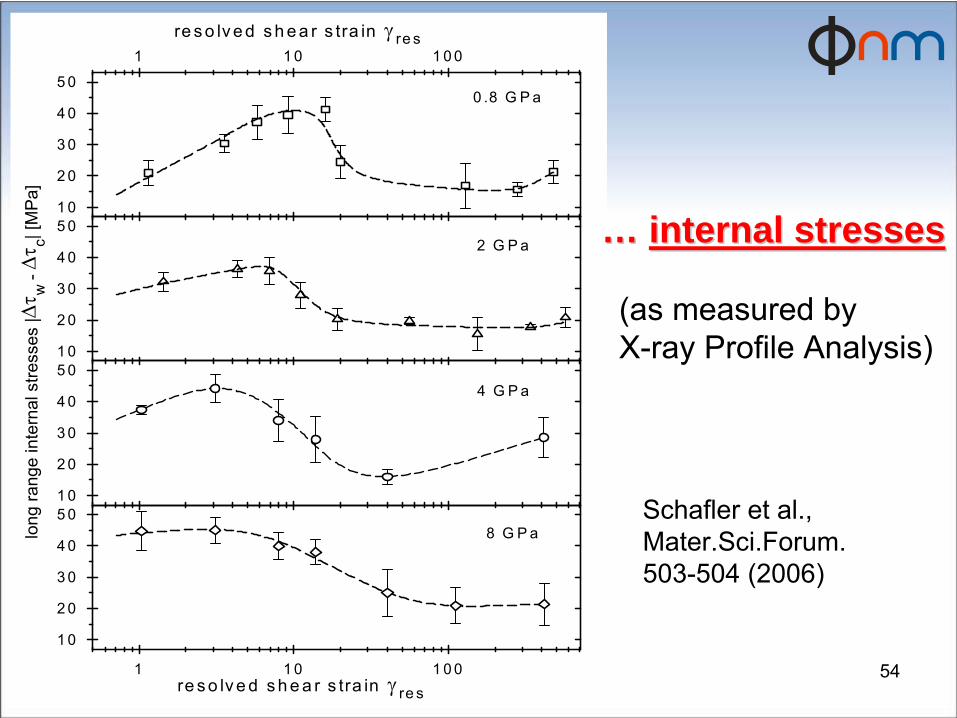
2 G P a …… internal stressesinternal stresses
(as measured by X-ray Profile Analysis)
Schafler
et al., Mater.Sci.Forum. 503-504 (2006)
DSC measurements on 2017 AlDSC measurements on 2017 Al--alloyalloy
•
Defect concentrations in Al-Alloys are higher after HE than after HPT
•
strain rate during HE has achieved 2x10²/s•
interpretation of peaks more complex because of vacancy-trapping by several alloy atoms
56
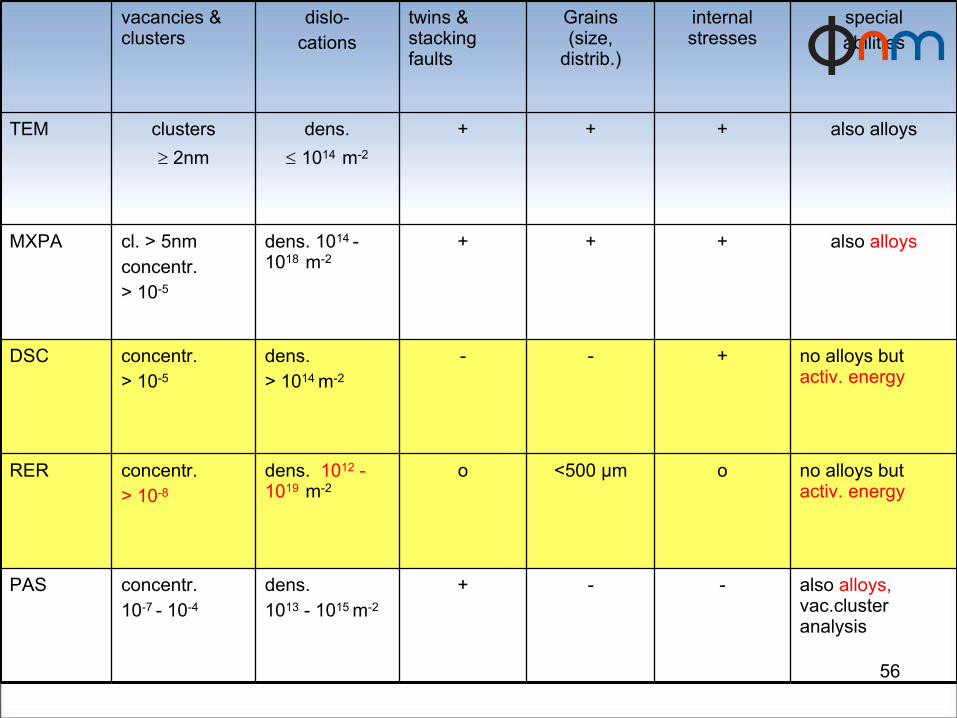
vacancies
& clusters
dislo-cations
twins
& stacking
faults
Grains
(size,
distrib.)
internal
stresses
specialabilities
TEM clusters≥
2nmdens.
≤
1014 m-2
+ + + also alloys
MXPA cl. > 5nmconcentr.> 10-5
dens. 1014 -
1018 m-2
+ + + also alloys
DSC concentr.> 10-5
dens. > 1014 m-2
- - + no alloys
but
activ. energy
RER concentr.> 10-8
dens. 1012
-
1019
m-2o <500 µm o no alloys
but
activ. energy
PAS concentr.10-7 - 10-4
dens. 1013
- 1015 m-2
+ - - also alloys,
vac.cluster
analysis
57
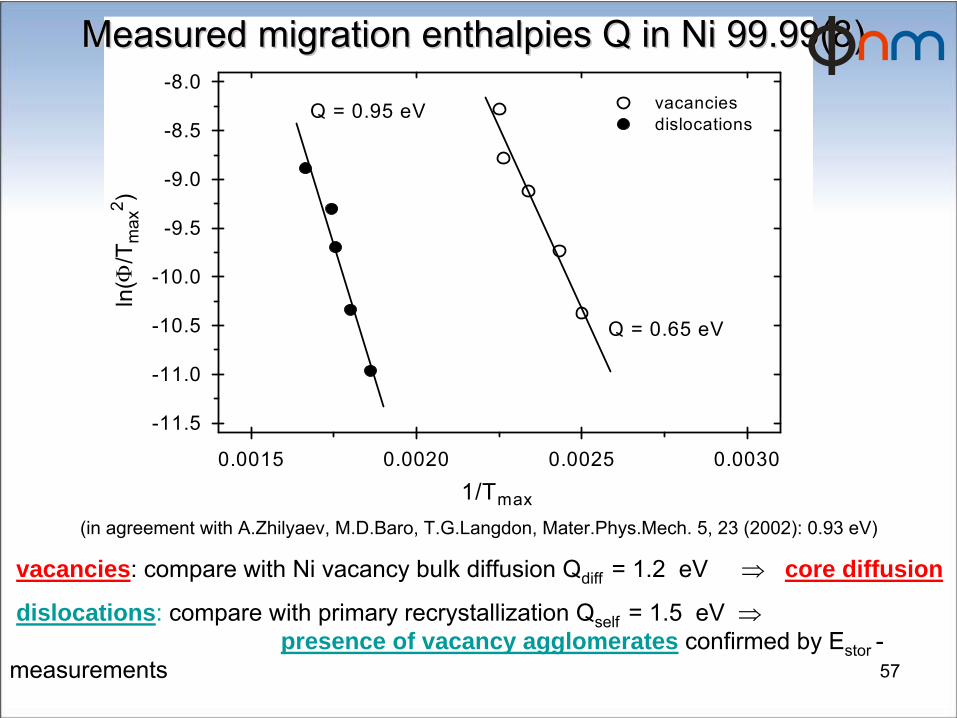
1/Tmax
0.0015 0.0020 0.0025 0.0030
ln(Φ
/Tm
ax2 )
-11.5
-11.0
-10.5
-10.0
-9.5
-9.0
-8.5
-8.0vacanciesdislocations
Q = 0.65 eV
Q = 0.95 eV
(in agreement
with
A.Zhilyaev, M.D.Baro, T.G.Langdon, Mater.Phys.Mech. 5, 23 (2002): 0.93 eV)
vacancies: compare
with
Ni vacancy
bulk
diffusion
Qdiff
= 1.2 eV
⇒
core diffusion
dislocations:
compare
with
primary
recrystallization
Qself
= 1.5 eV
⇒
presence of vacancy agglomerates confirmed
by
Estor
- measurements
MeasuredMeasured
migrationmigration
enthalpiesenthalpies
Q in Ni 99.99(8)Q in Ni 99.99(8)
58
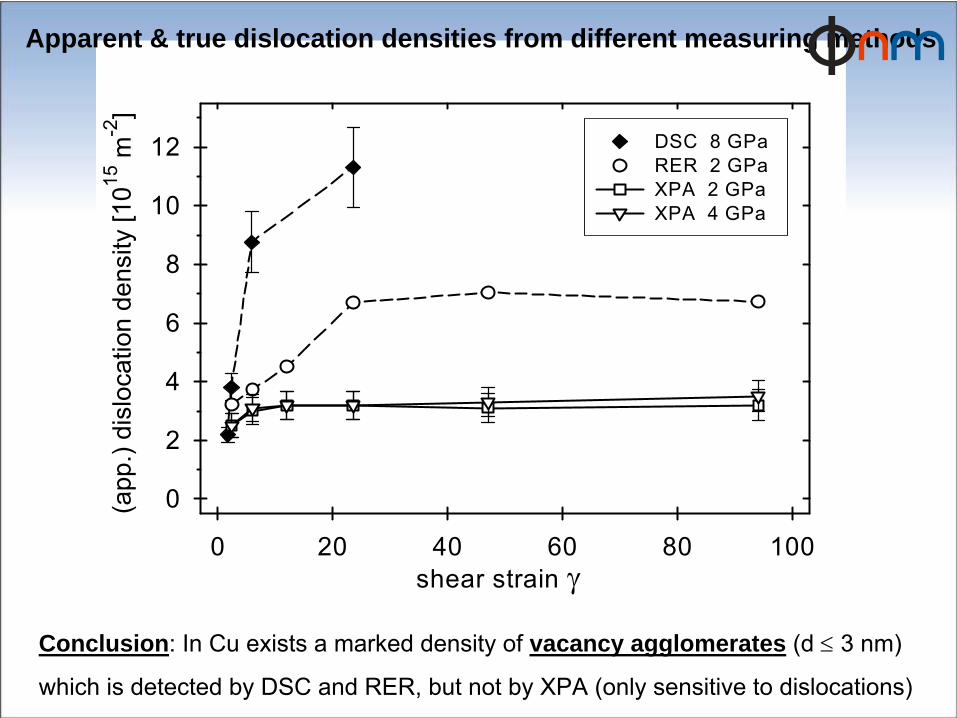
shear strain γ0 20 40 60 80 100
(app
.) di
sloc
atio
n de
nsity
[1015
m-2
]
0
2
4
6
8
10
12 DSC 8 GPaRER 2 GPa XPA 2 GPa XPA 4 GPa
Apparent & true dislocation densities from different measuring methods
Conclusion: In Cu exists
a marked
density
of vacancy agglomerates (d ≤
3 nm)
which
is
detected
by
DSC and RER, but
not
by
XPA (only
sensitive to dislocations)
59
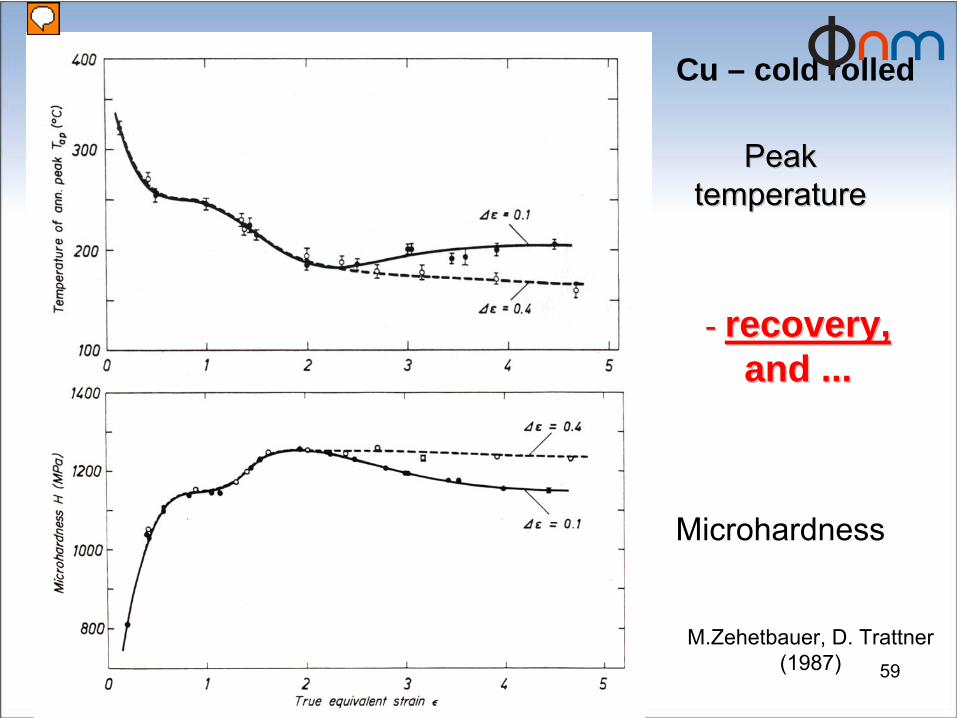
PeakPeak temperaturetemperature
Microhardness
-- recoveryrecovery, , and ...and ...
M.Zehetbauer, D. Trattner
(1987)
Cu – cold rolled
Presenter
Presentation Notes
Recovered structures better for properties, prssure dependent ... Enhanced by pressure
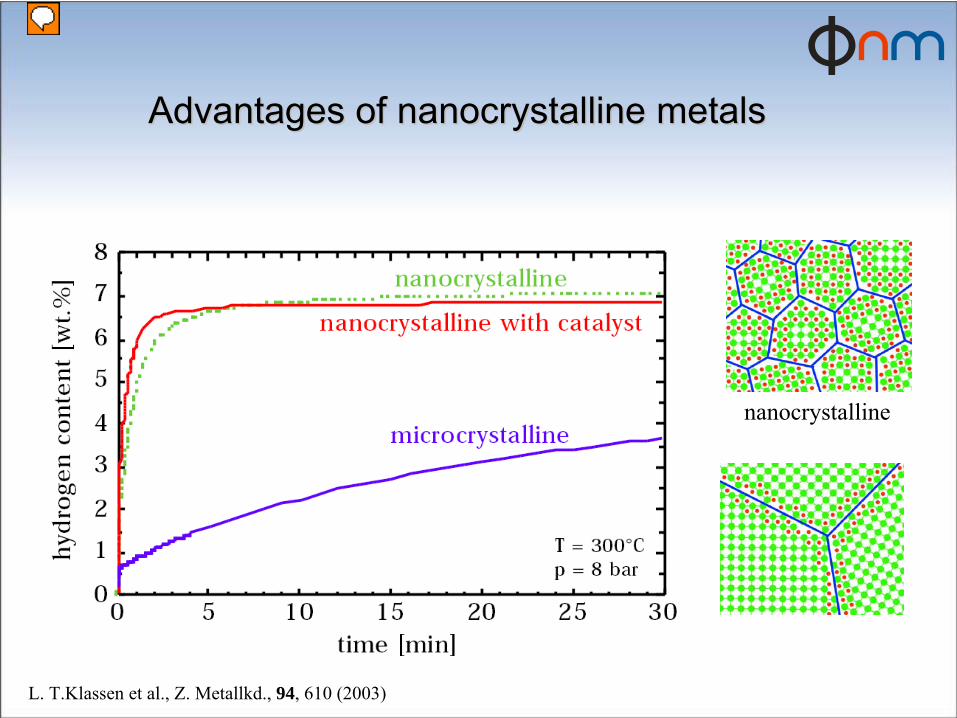
Advantages of Advantages of nanocrystallinenanocrystalline
metalsmetals
L. T.Klassen
et al., Z. Metallkd., 94, 610 (2003)
nanocrystalline
Presenter
Presentation Notes
high diffusion at grain boundaries
•
the
main
peak
temperature
for
Ni and Cu is
T/Tm = 0.30
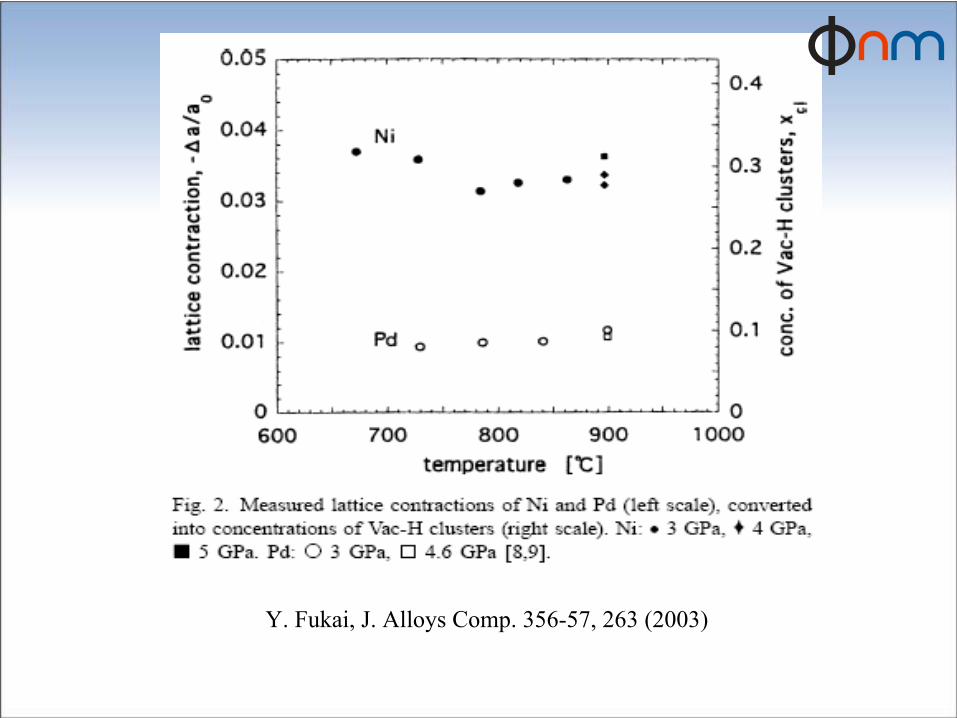
Y. Fukai, J. Alloys
Comp. 356-57, 263 (2003)
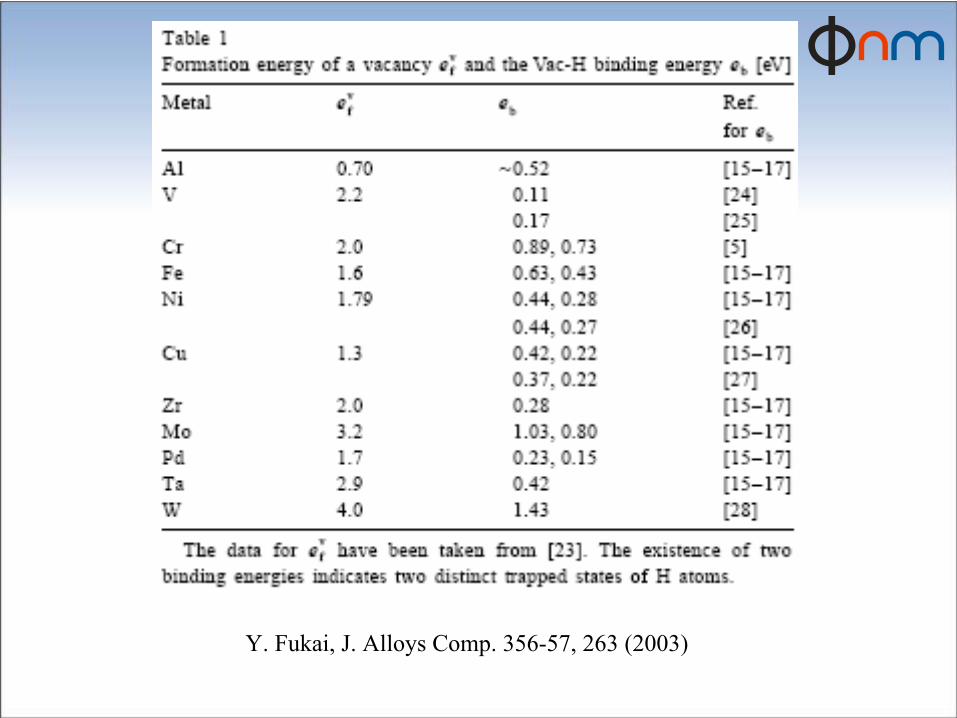
Y. Fukai, J. Alloys
Comp. 356-57, 263 (2003)
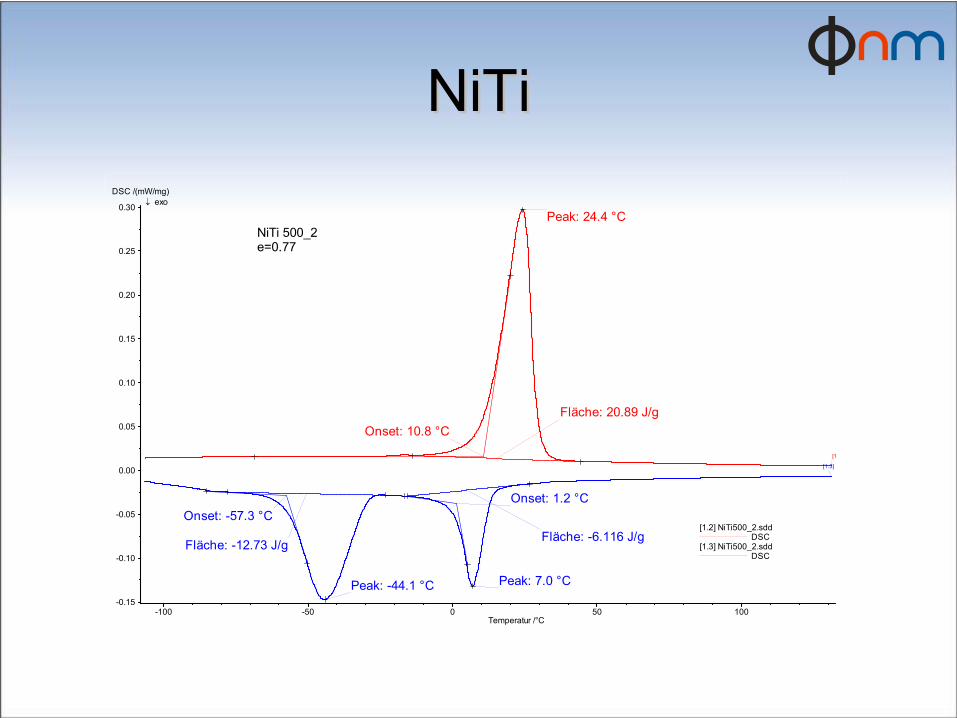
NiTiNiTi
-100 -50 0 50 100Temperatur /°C
-0.15
-0.10
-0.05
0.00
0.05
0.10
0.15
0.20
0.25
0.30
DSC /(mW/mg)
[1.2] NiTi500_2.sdd DSC
[1.3] NiTi500_2.sdd DSC
NiTi 500_2e=0.77
Fläche: 20.89 J/gOnset: 10.8 °C
Peak: 24.4 °C
Onset: -57.3 °COnset: 1.2 °C
Peak: -44.1 °C Peak: 7.0 °C
Fläche: -12.73 J/g Fläche: -6.116 J/g
[1
[1.3]
↓ exo
•
Prof. R. Würschum, TU Graz (Austria): Preparation of small samples from large HPT
Cu samples for investigations of dilatation and positron annihilation. In parallel, DSC measurements were carried out for comparison. Common FWF project!
•
Dr. S. Divinsky
und G. Wilde , Univ. Münster
(Germany): Tracer diffusion experiments in HPT-
deformed Cu. First results were presented in September 2009 on the BNM conference in Ufa (Russia) and published in Advanced Engineering Materials
•
Georgi
Stefanov
from Institute of Metal Science „Akad. Angel Balevski“-
Bulgarian academy of sciences in Sofia (Bulgaria): Activation enthalpies of precipitation growth in Al-alloys deformed by rolling and folding were studied by DSC. The investigations are published in Journal of Alloys and Compounds
•
R. Pippan
at ESI-ÖAW Leoben: DSC measurements of several steels (A220, P800, Fe3Si, ...) for investigations of the influence of HPT deformation temperature on the density and stability of deformation induced defects.
•
B. Verkin
Institute of UAS, Kharkov (Aleksey Podolskiy, E. Tabachnikova): interesting results concerning defect concentrations in wire-drawn and HPT deformed ultrafine grained Zr
•
Anastasia Sergeeva
and Vladimir Stolyarov
(Mechanical Engineering Research Institute of RAS, Moscow, Russia): DSC measurements in electro-plastically deformed NiTi.
These results were published in Mater. Sci. Forum.
•
Kinga
Wawer
from Poland: HE•
Olga Kulyasova
& Elena Korznikova
from Russia
national & international national & international cooperationscooperations
Thesis Thesis workwork
--
publishingpublishing
conferences
(TMS Orlando: Feb. 2007, nanoSPD4: Aug. 2008, TMS San Francisco: Feb. 2009, BNM Ufa: Aug. 2009)
and publications
(4 publ., 2 acc., 1 subm., 1 in prep.)“The Presence and Nature of Vacancy type Defects in SPD Nanometals”
-
Daria
Setman, Erhard Schafler, Elena Korznikova, and Michael J. Zehetbauer, Mater.Sci.Eng.A, 493 (2008) 116–122“Lattice Defects in Hydrogenated and HPT Processed Pd“
Daria
Setman, Maciej
Krystian
and Michael J. Zehetbauer, Mater. Sci. Forum, 584-586 (2008) 355-360“Effect of Electroplastic
Deformation on Martensitic
Transformation in Coarse Grained and Ultrafine Grained Ni-Ti Shape Memory Alloy”
A.E. Sergeeva, D. Setman, M.J. Zehetbauer, V.V. Stolyarov, S.D. Prokoshkin, Mater. Sci. Forum, 584-586 (2008)127-132"Activation Enthalpies of deformation induced lattice defects in SPD nanometals
measured by Differential Scanning Calorimetry" Daria
Setman, Michael B. Kerber, Erhard Schafler, and Michael J. Zehetbauer, Metall. Mater. Trans. A, accepted in press"Formation of superabundant vacancies in nano-Pd–H generated by high-pressure torsion”
M. Krystian, D. Setman, B. Mingler, G. Krexner, M.J. Zehetbauer, Scripta
Mater., 62 (2010) 49-52" Phase evolution in rapidly solidified Al-Fе-V-Si alloys at changes of main components ratio" Georgi
Stefanov, Daria
Setman, Georgi
Avdeev, Petur
Kovachev, Roumen
Petrov, Journal of Alloys and Compounds, submitted"Plasticity and grain boundary diffusion at small grain sizes" G. Wilde, J. Ribbe, G. Reglitz, M. Wegner, H. Rösner, Y. Estrin, M.J. Zehetbauer, D. Setman, S. Divinski, Advanced Engineering Materials, submitted"High pressure torsion induced impacts on the microstructure and physical properties of Pr0.67Fe3CoSb12,
Pr0.71Fe3.5Ni0.5Sb12, and Ba0.06Co4Sb12" L. Zhang, A. Grytsiv, B. Bonarski, M. Kerber, D. Setman, E. Schafler, P. Rogl, E. Bauer, G. Hilscher, M. Zehetbauer, in prep.
Collaborations with IC members and other groups Collaborations with IC members and other groups of Vienna Universityof Vienna University
•
iPP
–
Florian
Spieckermann
(IC): lamella thickness •
HPT Mg -
Bartlomiej
Bonarski
(IC): Mg too light for DSC
•
FeCu
and NiCo
-
Lidija
Rafailovics
(IC): nano
effects with phase transitions
•
HPT Co3Sb nano
thermoelectrics
-
Long Zhang (IC): phase transitions, incl. crystallization from amorphous state
•
Li/NaVycor
-
Abdul
Ghaffar: melting point dep. on nanopore
size•
7CB in porous Si -
Madalina
Puica:
•
…
Related Documents


