Differential Principal Component Analysis (dPCA) for ChIP-seq Hongkai Ji ([email protected] ) Department of Biostatistics The Bloomberg School of Public Health Johns Hopkins University

Differential Principal Component Analysis (dPCA) for ChIP-seq Hongkai Ji ([email protected])[email protected] Department of Biostatistics The Bloomberg School.
Dec 13, 2015
Welcome message from author
This document is posted to help you gain knowledge. Please leave a comment to let me know what you think about it! Share it to your friends and learn new things together.
Transcript
Differential Principal Component Analysis (dPCA) for ChIP-seq
Hongkai Ji ([email protected]) Department of Biostatistics
The Bloomberg School of Public HealthJohns Hopkins University

Functional Genomics
Locations and Functions
Maston, Evans & Green, Annu Rev Genomics Hum Genet, 2006, 7: 29-59
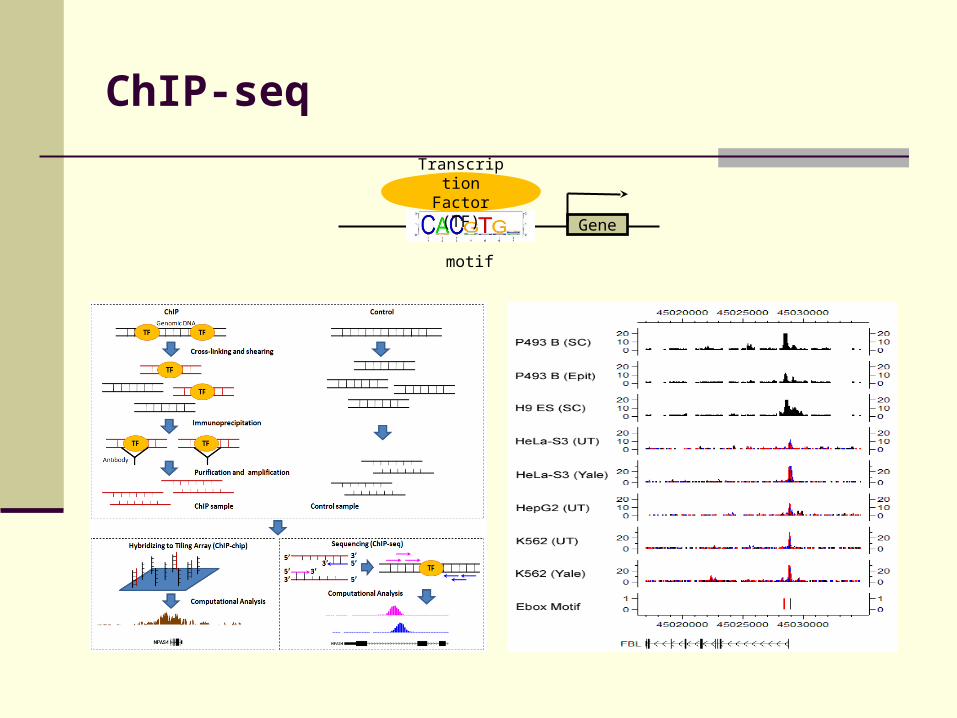
ChIP-seq
Transcription Factor
(TF)Gene
motif

Motivation: how to compare multiple ChIP profiles between two biological conditions?
Cell Type 1
Cell Type 2

Data Structure
Ma
rke
r 1
(H3
K4
me
3)
Ma
rke
r 2
(H3
K2
7m
e3
) …
Ma
rke
r M
(Myc
)
Re
p
1 Re
p
K1
… Re
p
1 Re
p
K1
…
Re
p
1
Re
p K
1
…
Cell Type 1
Ma
rke
r 1
(H3
K4
me
3)
Ma
rke
r 2
(H3
K2
7m
e3
) …
Ma
rke
r M
(Myc
)
Re
p
1 Re
p
K2
… Re
p
1 Re
p
K2
…
Re
p
1
Re
p K
2
…
Cell Type 2
Locus 1
Locus 2
Locus G
…
Intensities for locus g, marker m, replicate k :
xgmk ~ G(x; μ1gm, σ2)
Intensities for locus g, marker m, replicate k :
ygmk ~ G(x; μ2gm, σ2)
MGX MGY
EΔD Noise DifferenceTrue MG

0 * 00 0 0* 0 00 0 . 0* * . 0* 0 . *0 0 0* 0 00 * 0
Modeling True Difference
EΔYXD
TUVΔ TM
T
T
v
v
v
2
1
IVV T
MG
MM

0 5 10 15 20 25-0.2
0
0.2
0.4
0.6
0 5 10 15 20 25-0.2
0
0.2
0.4
0.6
TM
T
gMgTg uu
v
v
δ 1
1
M
giiii
λλλ
uτπλ
21
2 )(Var)3(
Bayesian Perspective
22 gg wb
11 gg wb
)(,1)1(
..
2ji
ts
jii vvv
),0;(~
)(~
)2(
2iigi
igi
gigigi
τuFw
πBerb
wbu
0

Goals of Analysis
0 * 00 0 0* 0 00 0 . 0* * . 0* 0 . *0 0 0* 0 00 * 0
V
D E
0 5 10 15 20 25-0.2
0
0.2
0.4
0.6
0 5 10 15 20 25-0.2
0
0.2
0.4
0.6
…
1. Estimate
2. Infer 0 * 00 0 0* 0 00 0 . 0* * . 0* 0 . *0 0 0* 0 00 * 0
U
(2.a) Rank loci according to each component (based on ugi);(2.b) Test ugi = 0?

Example: K562 vs. Huvec ENCODE Data
G = 138,328 MYC motif sites in human genome; M = 18 data sets.
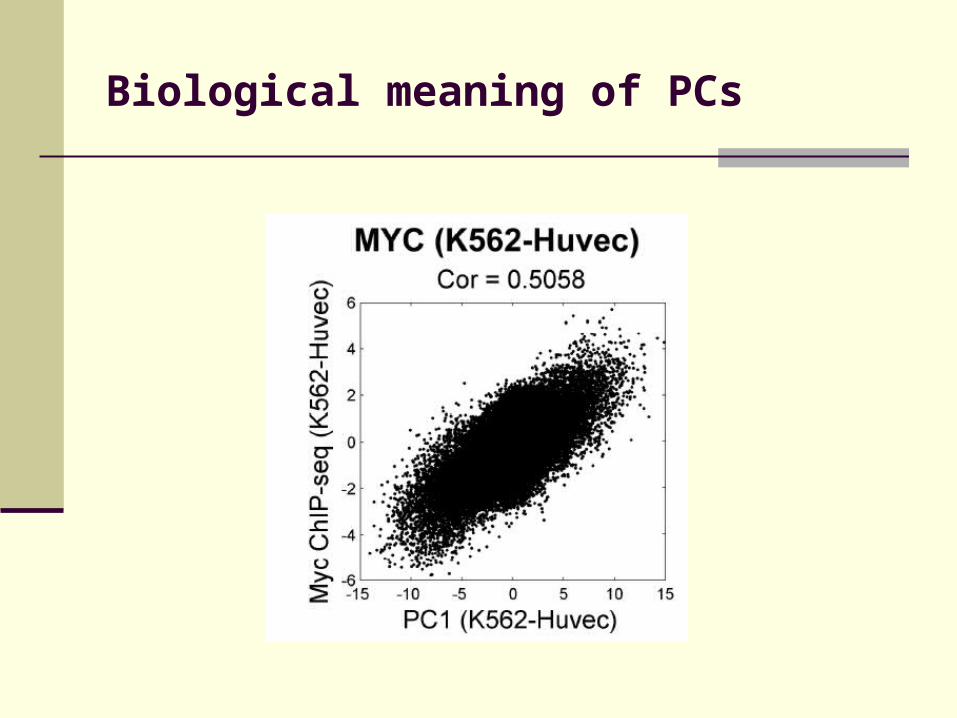
Biological meaning of PCs

PC1 predicts MYC differential binding better than using each marker individually

Example: K562 vs. Huvec ENCODE Data
PC1: 50%FDR<5%: 65252
PC2: 14%FDR<5%: 47960
H3
K4
me
3
H3
K2
7m
e3 H3
K3
6m
e3H3
K4
me
1 H3
K4
me
2 H3
K9
ac
H4
K2
0m
e1 I
np
ut
DN
as
e FA
IRE C
TC
F Po
l2 Inp
ut
CT
CF
H3
K9
me
1 H3
K2
7a
c CT
CF
H3
K4
me
3H
3K
27
me
3 H3
K3
6m
e3 I
np
ut Ju
nM
ax
Inp
utPo
l2
G = 138,328 MYC motif sites in human genome; M = 25 data sets.
0 5 10 15 20 250
0.1
0.2
0.3
0.4
0 5 10 15 20 25-0.2
0
0.2
0.4
0.6
0.8

Other Examples

Implications
TF
TF
Cell type 1
Cell type 2

Example: K562 vs. Huvec ENCODE Data
H3
K4
me
3
H3
K2
7m
e3 H3
K3
6m
e3H3
K4
me
1 H3
K4
me
2 H3
K9
ac
H4
K2
0m
e1 I
np
utC
TC
F
H3
K9
me
1 H3
K2
7a
c CT
CF
H3
K4
me
3H
3K
27
me
3 H3
K3
6m
e3 In
pu
t
G = 24376 human promoters; M = 16 markers.

PC1 predicts RNA-seq differential expression
-20 -10 0 10 20-15
-10
-5
0
5
10
PC 1
RN
A-s
eq lo
g2F
C
Cor = 0.6615

0 * 00 0 0* 0 00 0 . 0* * . 0* 0 . *0 0 0* 0 00 * 0
False Discovery Rate (FDR)
EΔYXD
TUVΔ TM
T
T
v
v
v
2
1
IVV T
MG
MM

0 5 10 15 20 25-0.2
0
0.2
0.4
0.6
0 5 10 15 20 25-0.2
0
0.2
0.4
0.6
0 5 10 15 20 25-0.2
0
0.2
0.4
0.6
Simulation
22 gg wb
gMgM wb
11 gg wb
ge

Simulation
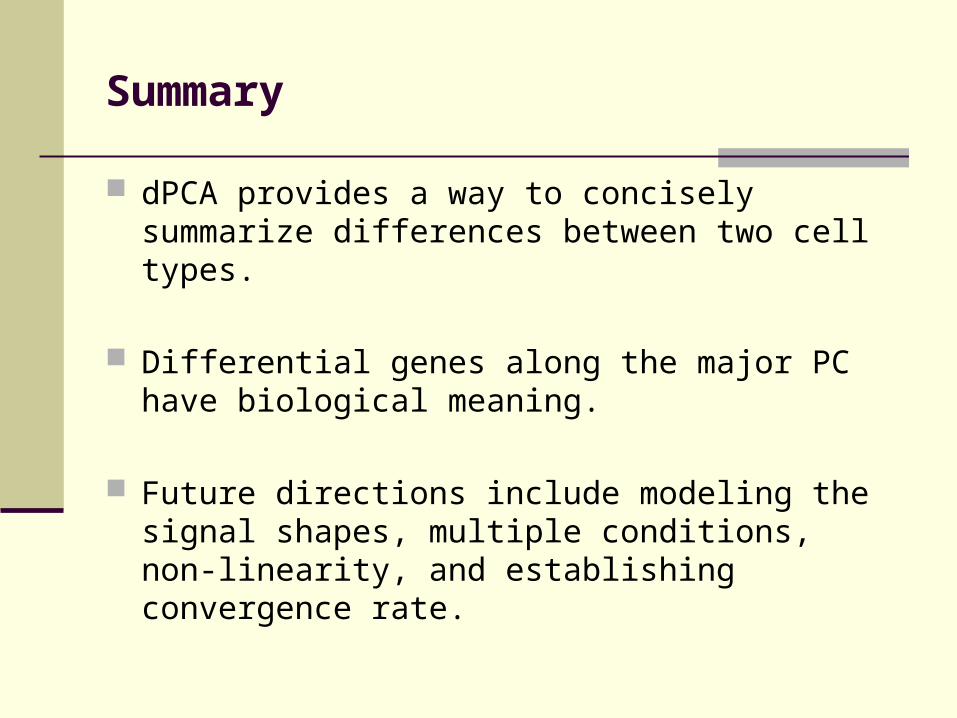
Summary
dPCA provides a way to concisely summarize differences between two cell types.
Differential genes along the major PC have biological meaning.
Future directions include modeling the signal shapes, multiple conditions, non-linearity, and establishing convergence rate.
Related Documents


