DIFFERENTIAL PATTERNS OF NERVE GROWTH FACTOR, BRAIN-DERIVED NEUROTROPHIC FACTOR AND NEUROTROPHIN-3 mRNA AND PROTEIN LEVELS IN DEVELOPING REGIONS OF RAT BRAIN K. P. DAS, a S. L. CHAO, a,b L. D. WHITE, a W. T. HAINES, a,b G. J. HARRY, c H. A. TILSON a and S. BARONE JR. a * a Neurotoxicology Division, Cellular and Molecular Toxicology Branch, National Health and Environmental Effects Research Laboratory, US Environmental Protection Agency, RTP, NC 27711, USA b Curriculum in Toxicology, UNC, Chapel Hill, NC, USA c Laboratory of Toxicology, NIEHS, NIH, RTP, NC 27709, USA Abstract —The present studies were undertaken to characterize the regional and temporal patterns of neurotrophin mes- senger RNA and protein levels for b-nerve growth factor, brain-derived neurotrophic factor and neurotrophin-3 in the developing CNS. We have examined the levels of these neurotrophin messenger RNAs with ribonuclease protection assays and corresponding protein levels with enzyme-linked immunosorbent assays in the developing Long–Evans rat hippocam- pus, neocortex and cerebellum on postnatal days 1, 7, 14, 21, and 92. In addition, immunohistochemistry was used to localize the neurotrophins in these developing brain regions. Results indicated that in neocortex and hippocampus, messenger RNA for both nerve growth factor and brain-derived neurotrophic factor increased in an age-dependent manner, reaching a plateau by postnatal day 14. In the neocortex, nerve growth factor and brain-derived neurotrophic factor protein levels both peaked at postnatal day 14. In hippocampus, nerve growth factor protein peaked at postnatal day 7 while brain-derived neurotrophic factor peaked at postnatal day 14. In cerebellum, nerve growth factor messenger RNA levels were flat, while nerve growth factor protein peaked at postnatal day 7. Brain-derived neurotrophic factor messenger RNA increased in an age-dependent manner while the pattern for its protein levels was mixed. Neurotrophin-3 messeger RNA levels increased in an age- dependent manner in hippocampus, peaked at postnatal day14 in cerebellum, and no changes occurred in neocortex. Neurotrophin-3 protein was at its peak at postnatal day 1 and thereafter decreased at other postnatal days in all three brain regions. Results of neurotrophin immunohistochemistry often paralleled and complemented enzyme-linked immuno- sorbent assay data, demonstrating specific cell groups containing neurotrophin proteins in these regions. Within each region, patterns with regard to messenger RNA and respective protein levels for each neurotrophin were unique. No consistent relationship between patterns of neurotrophin messenger RNAs and their cognate proteins was observed between regions. The different regional patterns for neurotrophin messengerRNA and protein levels in each brain region indicate that messenger RNA studies of neurotrophin messenger RNA must be augmented by protein determination to fully characterize spatial and temporal neurotrophin distribution. Published by Elsevier Science Ltd on behalf of IBRO. Key words: neocortex, hippocampus, cerebellum, RNase protection assay, enzyme-linked immunosorbent assay, immuno- histochemistry. Information processing in the nervous system requires proper function of neuronal circuitry. Various molecules regulate both the formation of specific connections among neurons during development, as well as the func- tional activity of the neurons within these circuits. Neurotrophic factors play key roles in both the organi- zational and activational processes by virtue of their capacity to regulate developmental processes, neuronal survival, morphology, and neural plasticity. 78,79,92 Neuro- trophins, the prototypic gene family of neurotrophic factors, are comprised of b-nerve growth factor (NGF), brain-derived neurotrophic factor (BDNF), neurotrophin- 3 (NT-3) and neurotrophin-4/5. In the CNS NGF, BDNF and NT-3 mRNAs display different spatiotemporal patterns of expression during development, although all three are highly expressed in the adult hippocampus compared to other regions such as neocortex and cere- bellum. 28,62 Functional and morphological data 17,18,64–66 strongly suggest that neurotrophins may play both para- crine and autocrine roles during neural develop- ment. 54,60,67,82 Therefore, it appears that NT-3, NGF and 739 Neuroscience Vol. 103, No. 3, pp. 739–761, 2001 Published by Elsevier Science Ltd on behalf of IBRO Printed in Great Britain PII: S0306-4522(01)00011-2 Pergamon www.elsevier.com/locate/neuroscience *Corresponding author. Tel.: 11-919-541-3916; fax: 11-919-541- 4849. E-mail address: [email protected] (S. Barone Jr.). Abbreviations: ABC, avidin–biotin–peroxidase complex; ANOVA, analysis of variance; BDNF, brain-derived neurotrophic factor; BSA, bovine serum albumin; CNTF, ciliary neurotrophic factor; DAB, 3,3’-diaminobenzidine tetrahydrochloride; EDTA, ethyl- enediaminetetra-acetate; EGL, external granule cell layer; ELISA, enzyme-linked immunosorbent assay; GD, gestational day; GDNF, glial-derived neurotrophic factor; IGL, internal granule cell layer; IR, immunoreactivity; NGF, nerve growth factor; NGS, normal goat serum; NT-3, neurotrophin-3; PBS, phosphate-buffered saline; PBS-T, PBS-Tween-20; PMSF, phenylmethyl sulforyl fluoride; PND, postnatal day; rh, recombinant human; RPA, ribonuclease protection assay; TBS, Tris-buffered saline; TBST, TBS-Tween 20; trk, tyrosine kinase receptor.

Welcome message from author
This document is posted to help you gain knowledge. Please leave a comment to let me know what you think about it! Share it to your friends and learn new things together.
Transcript
DIFFERENTIAL PATTERNS OF NERVE GROWTH FACTOR, BRAIN-DERIVED
NEUROTROPHIC FACTOR AND NEUROTROPHIN-3 mRNA AND PROTEIN
LEVELS IN DEVELOPING REGIONS OF RAT BRAIN
K. P. DAS,a S. L. CHAO,a,b L. D. WHITE,a W. T. HAINES,a,b G. J. HARRY,c H. A. TILSONa andS. BARONE JR.a*
aNeurotoxicology Division, Cellular and Molecular Toxicology Branch, National Health and Environmental Effects ResearchLaboratory, US Environmental Protection Agency, RTP, NC 27711, USA
bCurriculum in Toxicology, UNC, Chapel Hill, NC, USAcLaboratory of Toxicology, NIEHS, NIH, RTP, NC 27709, USA
AbstractÐThe present studies were undertaken to characterize the regional and temporal patterns of neurotrophin mes-senger RNA and protein levels for b-nerve growth factor, brain-derived neurotrophic factor and neurotrophin-3 in thedeveloping CNS. We have examined the levels of these neurotrophin messenger RNAs with ribonuclease protection assaysand corresponding protein levels with enzyme-linked immunosorbent assays in the developing Long±Evans rat hippocam-pus, neocortex and cerebellum on postnatal days 1, 7, 14, 21, and 92. In addition, immunohistochemistry was used to localizethe neurotrophins in these developing brain regions. Results indicated that in neocortex and hippocampus, messenger RNAfor both nerve growth factor and brain-derived neurotrophic factor increased in an age-dependent manner, reaching a plateauby postnatal day 14. In the neocortex, nerve growth factor and brain-derived neurotrophic factor protein levels both peakedat postnatal day 14. In hippocampus, nerve growth factor protein peaked at postnatal day 7 while brain-derived neurotrophicfactor peaked at postnatal day 14. In cerebellum, nerve growth factor messenger RNA levels were ¯at, while nerve growthfactor protein peaked at postnatal day 7. Brain-derived neurotrophic factor messenger RNA increased in an age-dependentmanner while the pattern for its protein levels was mixed. Neurotrophin-3 messeger RNA levels increased in an age-dependent manner in hippocampus, peaked at postnatal day14 in cerebellum, and no changes occurred in neocortex.Neurotrophin-3 protein was at its peak at postnatal day 1 and thereafter decreased at other postnatal days in all threebrain regions. Results of neurotrophin immunohistochemistry often paralleled and complemented enzyme-linked immuno-sorbent assay data, demonstrating speci®c cell groups containing neurotrophin proteins in these regions. Within each region,patterns with regard to messenger RNA and respective protein levels for each neurotrophin were unique. No consistentrelationship between patterns of neurotrophin messenger RNAs and their cognate proteins was observed between regions.The different regional patterns for neurotrophin messengerRNA and protein levels in each brain region indicate thatmessenger RNA studies of neurotrophin messenger RNA must be augmented by protein determination to fully characterizespatial and temporal neurotrophin distribution. Published by Elsevier Science Ltd on behalf of IBRO.
Key words: neocortex, hippocampus, cerebellum, RNase protection assay, enzyme-linked immunosorbent assay, immuno-histochemistry.
Information processing in the nervous system requiresproper function of neuronal circuitry. Various moleculesregulate both the formation of speci®c connections
among neurons during development, as well as the func-tional activity of the neurons within these circuits.Neurotrophic factors play key roles in both the organi-zational and activational processes by virtue of theircapacity to regulate developmental processes, neuronalsurvival, morphology, and neural plasticity.78,79,92 Neuro-trophins, the prototypic gene family of neurotrophicfactors, are comprised of b-nerve growth factor (NGF),brain-derived neurotrophic factor (BDNF), neurotrophin-3 (NT-3) and neurotrophin-4/5. In the CNS NGF, BDNFand NT-3 mRNAs display different spatiotemporalpatterns of expression during development, although allthree are highly expressed in the adult hippocampuscompared to other regions such as neocortex and cere-bellum.28,62 Functional and morphological data17,18,64±66
strongly suggest that neurotrophins may play both para-crine and autocrine roles during neural develop-ment.54,60,67,82 Therefore, it appears that NT-3, NGF and
Ontogeny of neurotrophic factors in rat brain 739
739
Neuroscience Vol. 103, No. 3, pp. 739±761, 2001Published by Elsevier Science Ltd on behalf of IBRO
Printed in Great BritainPII: S0306-4522(01)00011-2
Pergamon
www.elsevier.com/locate/neuroscience
*Corresponding author. Tel.: 11-919-541-3916; fax: 11-919-541-4849.
E-mail address: [email protected] (S. Barone Jr.).Abbreviations: ABC, avidin±biotin±peroxidase complex; ANOVA,
analysis of variance; BDNF, brain-derived neurotrophic factor;BSA, bovine serum albumin; CNTF, ciliary neurotrophic factor;DAB, 3,3'-diaminobenzidine tetrahydrochloride; EDTA, ethyl-enediaminetetra-acetate; EGL, external granule cell layer; ELISA,enzyme-linked immunosorbent assay; GD, gestational day; GDNF,glial-derived neurotrophic factor; IGL, internal granule cell layer;IR, immunoreactivity; NGF, nerve growth factor; NGS, normal goatserum; NT-3, neurotrophin-3; PBS, phosphate-buffered saline;PBS-T, PBS-Tween-20; PMSF, phenylmethyl sulforyl ¯uoride;PND, postnatal day; rh, recombinant human; RPA, ribonucleaseprotection assay; TBS, Tris-buffered saline; TBST, TBS-Tween20; trk, tyrosine kinase receptor.
BDNF may play a signi®cant role in regulating prolifera-tion, differentiation and survival of widely distributedand diverse neuronal populations during early develop-ment. In contrast, neurotrophins play a more restrictedfunctional role in adulthood, when they regulate themaintenance and the survival of more selected neuronalpopulations.10,71 In addition, increasing evidence indi-cates that neurotrophins and their receptors are co-localized at the cellular level in many regions51,67 andmediate their trophic signals through high af®nity tyro-sine kinase receptors, trkA, trkB, and trkC.9,20,46,74±77
Both in vivo60 and in vitro61 studies of neuronal popu-lations indicate that neurotrophins play pleiotropic rolesin many developmental processes. In order to understandbetter the varied roles played by neurotrophins duringneural development, a more detailed characterization ofthe temporal and spatial distribution of these factors andtheir receptors is necessary. Such analyses have thus farbeen limited to quanti®cation and localization of mRNAof NT-3, BDNF and NGF in the developing rat brain witheither northern blotting62 or in situ hybridization.25,55
This study was designed to describe and compare thedistribution pattern of NGF, BDNF and NT-3 mRNA andprotein levels during the postnatal development ofselected regions of the rat brain, and to test the hypothesisthat there is spatiotemporal correlation between a givenneurotrophin mRNA and its cognate protein. Recentwork has demonstrated that mRNA levels for neuro-trophins may not predict the abundance of the corre-sponding neurotrophin protein in adult70 and aging69
rats. This was the premise on which we based our hypoth-esis since much of the past literature describing theexpression of neurotrophins in epilepsy30,32±34,52,90,95 andexcitatory amino acids stimulation15,29,81 models hassuggested that mRNA levels were good surrogate indi-cators for the protein levels. Currently, some data existfor neurotrophin mRNA levels in a few developingregions of the brain and patchy data exist on neurotrophinprotein levels. Very few studies, however, have madesystematic comparisons of the neurotrophin mRNA andprotein levels during development. Therefore, to improveour understanding of the role of neurotrophins in devel-opmental processes, a comprehensive study detailing andcomparing the regional and temporal patterns of neuro-trophin mRNA and protein levels was undertaken.
EXPERIMENTAL PROCEDURES
Animals and tissue collection
Timed-pregnant Long±Evans rats (Charles River; Portage,ME) were received on gestational day 4 (GD4; GD0 sperm posi-tive) and housed in an Association for Assessment of LaboratoryAnimal Care approved animal facility. Experiments wereconducted under an approved animal protocol by the NationalHealth and Environmental Effects Research Laboratory animalcare committee of the US EPA and all efforts were made tominimize both the suffering and number of animals used. Damswere housed individually until giving birth in plastic solid bottomcages with kiln dried soft wood chip bedding. Animal rooms weremaintained on a 12:12 h photoperiod, light:dark (06:00:18:00),and food (Purina rat Lab Chow) and water provided ad libitum.
Beginning on GD20, animals were checked twice daily (a.m.and p.m.) for births. The date that birth was ®rst discovered was
assigned as postnatal day (PND) 0, and the time of birth (a.m. orp.m.) was recorded. Two female offspring per litter were removedon PND1 for sampling brains. On PND1 the hippocampi fromtwo female pups (per litter) were pooled, due to the limited tissuemass, for either ribonuclease protection assay (RPA) or enzymelinked immunosorbent assay (ELISA); similarly cerebella ofthese animals were pooled on PND1. Remaining female pupsin each litter were further randomly culled on PND7 to 10pups/litter, with subsequent sampling reducing litter size toeight after sampling on PND14. For all experiments, offspringwere decapitated during the morning (08:00±10:00) on PND1, 7,14, 21 or 92. Neocortex, hippocampus and cerebellum wererapidly dissected free hand on an aluminum foil covered coldplate, rapidly frozen in isopentane on dry ice, then weighed andstored at 2708C until assayed for neurotrophin mRNA or proteinlevels. This free hand dissection of hippocampus included bothdorsal and ventral aspects of the hippocampal formation. Dissec-tion of the neocortex included the whole cortical mantle, includ-ing part of cingulate cortex, but not the olfactory tubercle orpiriform cortex. Dissection of the cerebellum included the¯occulo-nodular lobes.
NGF, BDNF, and NT-3 mRNA ribonuclease protection assays indeveloping cortical regions of the rat brain
The synthesis of radiolabeled antisense probes and RPAs wereperformed based on the previously described method.88,89 Acommercially available rat neurotrophin RNA probe templateset was used (Pharmingen; San Diego, CA) that included probesfor NGF, BDNF, NT-3, NT-4, ciliary neurotrophic factor (CNTF)and glial-derived neurotrophic factor (GDNF). Hybridizationinvolved adding 2 ml of the probe (approximately 3±4 £ 105 cpm) to 10 mg total RNA. The samples were overlaidwith one drop of mineral oil (Sigma, St. Louis, MO), heated to958C for 2 min, and then incubated at 568C for 12±16 h. Allunhybridized single-stranded RNA was digested with RNase(1:100 dilution, Promega) in 10 mM Tris, 300 mM NaCl, 5 mMEDTA, pH 7.5. The protected fragments of RNA were electro-phoresed in a standard 5% acrylamide/8 M urea sequencing gel.Dried gels were visualized by autoradiography (Hyper®lm-MP®lm). The response of each labeled neurotrophin fragment withina lane was captured by video densitometry on an Eagle-Eye(EagleSight Software version 3.2, Stratagene; La Jolla, CA) andthe relative optical density of each band was determined usingNIH Image. The level of each mRNA was calculated relative tocorresponding L32 RNA level for each sample (means^S.E.M.values are derived from 3±5 litters per time point).
NGF, BDNF, and NT-3 enzyme-linked immunosorbent assays
Preliminary experiments were performed in order to determinethe tissue fraction (i.e., crude homogenate, supernatant, or pellet)and the proper dilution that was optimal to assay tissue neuro-trophin levels. This determination was made from two indepen-dent experiments, each with 3±4 samples per tissue per timepoint. Heart neurotrophin levels were assayed in parallel tobrain regions in order to compare results of these assays withpreviously published work (e.g. BDNF50). Tissue from neocortexand heart at PND 14 and 130 were collected and frozen at 2708Cuntil the time of assay when they were thawed in chilled homo-genization buffer (1:10 diluted, 0.4 M NaCl, 5 mM EDTA, 0.5%bovine serum albumin (BSA), 1 mM phenylmethyl sulforyl ¯uor-ide (PMSF), 1 mg/ml aprotinin and 0.1% Triton X-100) and soni-cated for 15 s in an ice bath following previously describedprotocols.42,43,97 An aliquot of crude homogenate was removedfor neurotrophin assay. After the supernatant was collected in anew tube, the pellet was carefully washed twice with phosphate-buffered saline (PBS) and resuspended in an appropriate volumeof cold homogenization buffer, thereby making all three fractionsequivalent (1:10 dilution), and resonicated for 5 s on wet ice.Each fraction (i.e., homogenate, supernatant, pellet) was assayedin parallel at predetermined age and region appropriate dilutionsfor NGF, BDNF and NT-3 by ELISA (Promega ELISA kits forNGF, BDNF and NT-3 Emax
TM, Promega, see below). NGF levels
K. P. Das et al.740
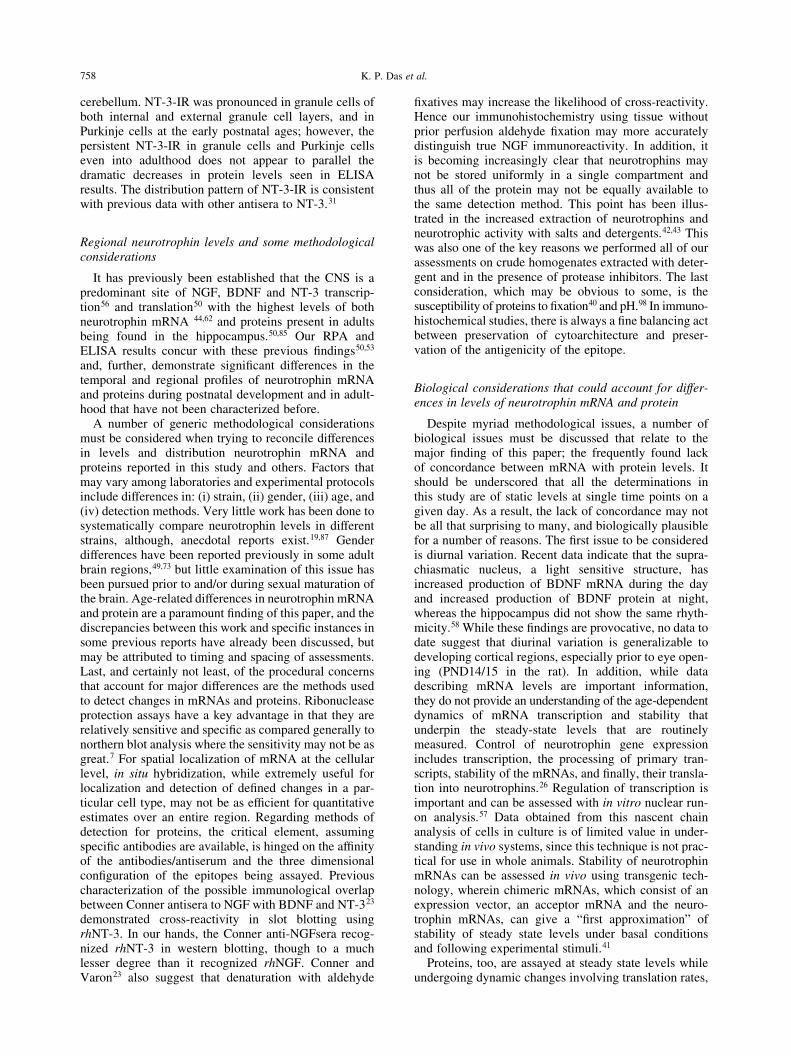
were higher in the homogenate fraction of neocortex and heart atboth ages compared to supernatant and pellet fractions, whereasBDNF levels were similar in all three fractions in neocortex andheart (Fig. 1). NT-3 levels were higher in homogenates of thecortex compared to other fractions and similar levels of NT-3were observed in all fractions of heart at younger ages (Fig. 1).Therefore we chose to assay all neurotrophins using total homo-genate fractions from each developing region.
Tissues were thawed in chilled homogenization buffer andsonicated for 15 s. BDNF levels were determined by using astandard two-antibody sandwich technique39 with some modi®-cations. Brie¯y, high protein binding corning ELISA plates(Corning Glass Works; Corning, NY) were coated with rabbitanti-human BDNF (150 ng/ml; Gift from Dr Qiao Yan, Amgen;Thousand Oaks, CA) at 48C overnight. Non-speci®c binding ofantibody-coated wells was blocked with 3% BSA in Tris-bufferedsaline (TBS) for 1 h at room temperature. Standards (recombinanthuman-rhBDNF, Chemicon; Temecula, CA) and appropriatelydiluted homogenates of samples were then added into each welland incubated at 378C for 2 h. Chicken-anti-human BDNF(2.5 mg/ml; Promega; Madison, WI) was added into each welland incubated for 1 h at 378C followed by addition of biotinylatedanti-chicken detecting antibody (0.6 mg/ml; Chemicon) into eachwell. Avidin-peroxidase complex (Vector ABC kit, VectorLaboratory, Inc., Burlingame, CA) was added (according tomanufacturer's recommended dilution) into each well and incu-bated at room temperature for 75 min. A 100 ml volume per wellwas used for every solution and the plates were thoroughlywashed with TBS after each step. Freshly prepared substratesolution (0.4% o-Phenylene-diamine dihydrochloride in 50 mMcitrate phosphate buffer plus 0.03% H2O2) was added immedi-ately into each well and incubated in the dark for 30 min. Thereaction was stopped by 1 N H2SO4 and the optical density wasread within 30 min at 490 nm by using a Thermomax microplate
reader (Molecular Devices; Sunnyvale, CA). The detection limitsof these assays were 1.5±2.5 pg/mg protein and did not show anydetectable cross-reactivity with other recombinant human (rh)neurotrophins at concentrations as high as 500 pg/ml (the highestconcentration used in each ELISA standard curve). The levels ofNGF and NT-3 were determined in parallel to BDNF, usingaliquots of the same homogenates and following similar protocolsas described for BDNF above, except using Promega ELISA kitsfor NGF and NT-3 (Emax
TM, Promega). Each kit contained highlyspeci®c antisera for NGF and NT-3, respectively, and antibodiesdid not show cross reactivity with other neurotrophins. Proteinconcentrations from all sample homogenates were determinedin polystyrene microplates (Falcon 3910) using a Bio-Rad(Hercules, CA) DC kit with BSA as a standard. Absorbancewas measured at 650 nm on a Thermomax microplate reader.
NGF, BDNF, and NT-3 immunohistochemistry
Brains (3 brains/time point) were harvested from PND1, 7, 14,21, and 92 day old rats, frozen on dry ice, and stored at 2808C forup to three weeks. Fresh-frozen brains were cut on a cryostat(Leica; Nusslock, Germany) at 12 mm at 2168C. Serial sectionswere mounted on gelatin-coated slides and stored at 2808C untilassayed. Slide-mounted sections were ®xed in phosphate-buffered 4% paraformaldehyde/15% picric acid (pH adjusted to6.0 with HCl) for 10 min just prior to immunohistochemistry.Sections were then further ®xed in ethanol:acetic acid (2:1) for5 min at 2208C. Samples from all ages were processed for neuro-trophin immunohistochemistry simultaneously. Sections forimmunohistochemistry were incubated for 5 min with 2.0%H2O2 in PBS to inhibit endogenous peroxidase activity. Afterrinsing with PBS, the slide-mounted sections were incubatedfor 1.5 h with 20% normal goat serum (NGS) in PBS to blockthe non-speci®c binding sites of proteins. Sections were then
Ontogeny of neurotrophic factors in rat brain 741
Fig. 1. Comparisons of neurotrophin protein levels in homogenate, supernatant, and pellet fractions. Comparisons of neurotrophinprotein levels in homogenate, supernatant, and pellet fractions of PND14 and PND130 from neocortex and heart revealed that ingeneral neurotrophin levels were higher in total homogenate than in supernatant or pellet alone. An `n' size of 3 to 4 samples per
tissue per time point were used. Data are expressed mean^S.E.M.
incubated with one of the polyclonal neurotrophin antisera forNGF, BDNF, or NT-3 (Chemicon, Temecula, CA; AB1526P,AB1779, or AB1780, respectively) diluted 1:1000 with 2%NGS in PBS-Tween-20 (PBS-T) for 72 h at 48C in a humidi®edchamber. After several washes with PBS-T, the sections wereincubated for 2 h at room temperature with anti-rabbit IgG(Vector, Burlingame, CA). Further washing with PBS-T wasfollowed by labeling the bound immunocomplexes using anavidin±biotin peroxidase complex (ABC, Elite Vectastain,Vector). The peroxidase label was visualized with 0.05% 3,3 0-diaminobenzidine tetrahydrochloride (DAB; Polysciences,Warrington, PA) with 0.03% H2O2 and intensi®ed with 0.02%nickel ammonium sulfate and 0.0125% cobalt chloride. Slideswere rinsed, dried overnight, dehydrated through ascendinggrades of alcohol, cleared in xylene and coverslipped. Speci®cityof the immunohistochemical reaction was con®rmed by theabsence of labeled pro®les in tissue sections incubated withNGS rather than primary antisera or secondary antisera (datanot shown). Immunoabsorptions with immunizing protein forneurotrophins antisera eliminated immunolabeling at a dilutionof 1 mM or more (Fig. 3m). Another control consisted of combin-ing each antisera with 1 mM of the other two rh neurotrophinpeptides to demonstrate if any cross-reactivity was creating
non-speci®c labeling. No appreciable changes in the regionalpattern of neurotrophin immunostaining was observed with thiscontrol procedure. A set of adjacent serial sections were Nissl-stained with Cresyl Violet to detail neuroanatomical landmarks.
Since this immunostaining protocol was novel and included®xation conditions not reported previously, we wanted to useanother antisera and ®xation condition that had been reportedon previously 22 for the sake of comparison. We obtained anti-NGF from Dr J. Conner 22 to compare NGF-immunohisto-chemistry with the Chemicon antibody used in the above proto-col. Immunohistochemistry was performed as described byConner22 with minor modi®cation. Rats at ages PND 7, 14, andadults (3±4 per age) were anesthetized with Nembutal andperfused transcardially with PBS followed by freshly prepared2% paraformaldehyde/0.2% parabenzoquinone in phosphatebuffer (pH 7.4). Brains were post®xed for 2 h in the same ®xa-tive and then cryoprotected in 30% sucrose in 0.1 M phosphatebuffer at 48C until sectioning. A freezing stage microtomewas used to cut 40 mm sagittal sections, which were then storedin Millonings buffer prior to immunohistochemistry. Free-¯oat-ing sections were washed in TBS, followed by treatment with0.25% Triton X-100 in TBS for 20 min. Sections were thenblocked in 2% BSA/5% NGS in TBS for 1 h followed by
K. P. Das et al.742
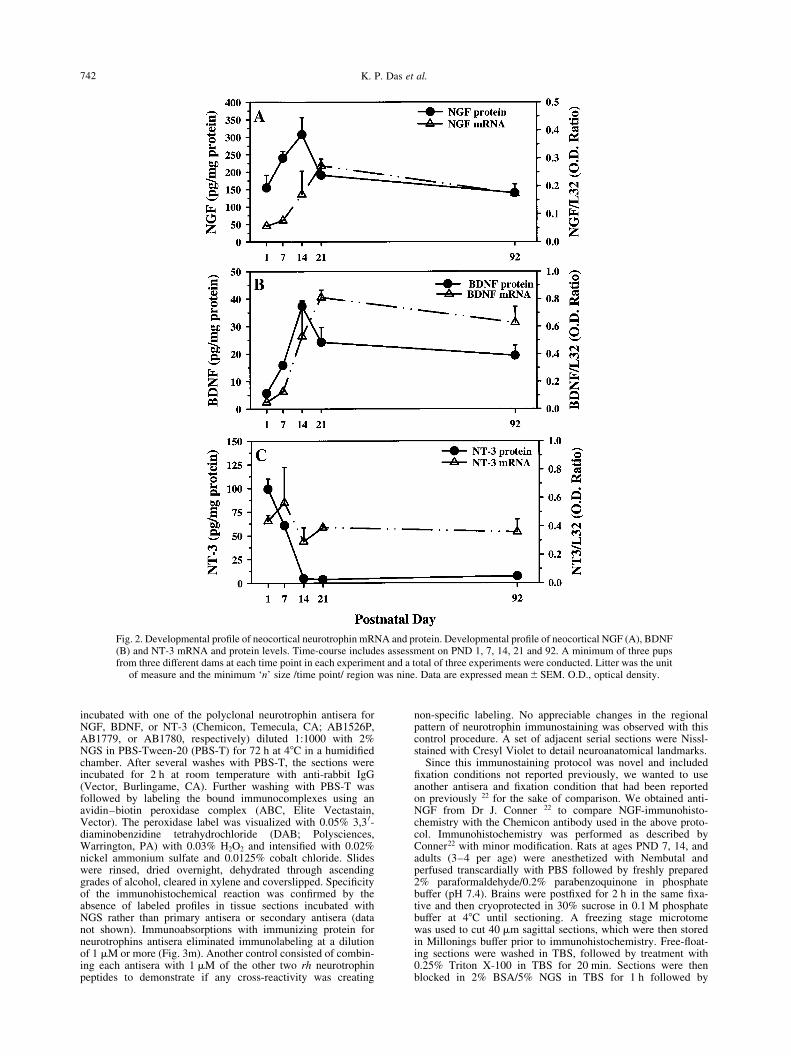
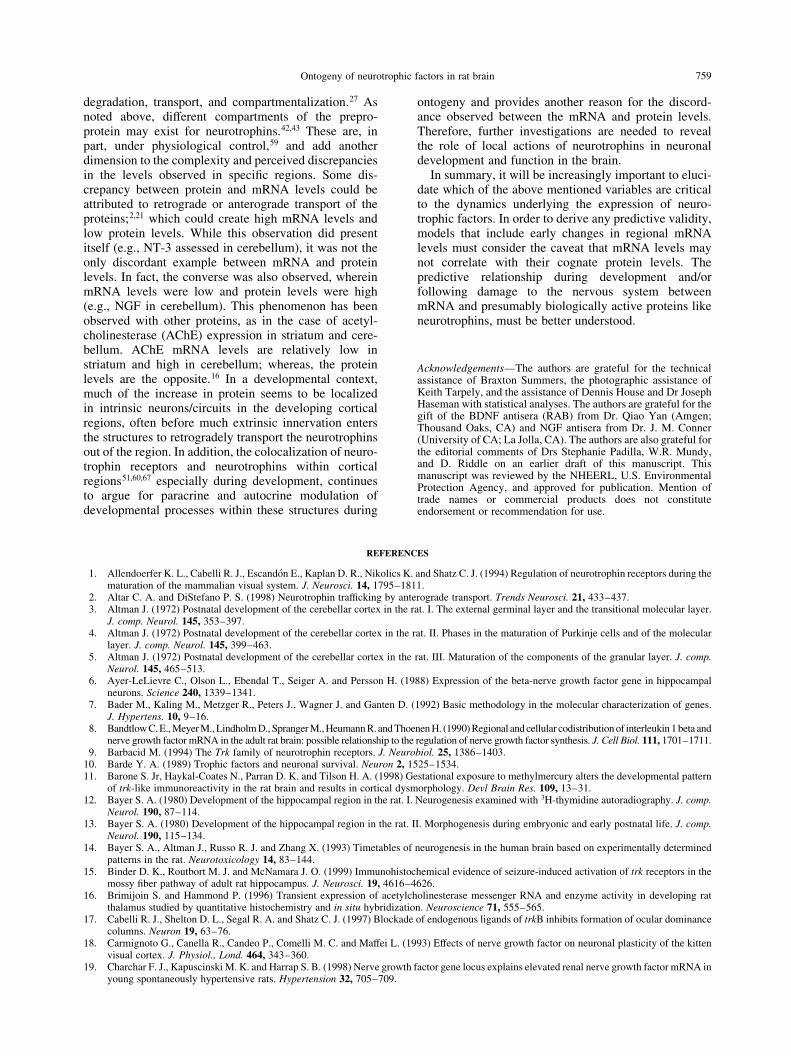
Fig. 2. Developmental pro®le of neocortical neurotrophin mRNA and protein. Developmental pro®le of neocortical NGF (A), BDNF(B) and NT-3 mRNA and protein levels. Time-course includes assessment on PND 1, 7, 14, 21 and 92. A minimum of three pupsfrom three different dams at each time point in each experiment and a total of three experiments were conducted. Litter was the unit
of measure and the minimum `n' size /time point/ region was nine. Data are expressed mean^SEM. O.D., optical density.
incubation in anti-NGF antisera from Connor or Chemicon. TheConner antisera was used at 0.75 mg/ml and the Chemicon anti-body was used at 1 mg/ml and incubated with the tissue for threedays with continuous agitation at 48C. Following primary incuba-tion, the sections were washed in TBS and incubated in 1.5 mg/mlbiotinylated goat anti-rabbit IgG (Vector) for 3 h at roomtemperature. Sections were then washed in TBS and incubatedin ABC at 1:250 dilution for 90 min at room temperature. Afterfurther washes with TBS, sections were reacted with 0.04% DAB/0.06% nickel chloride/0.06% H2O2 in 0.1 M Tris±HCl buffer (pH7.4) for 6 min. Sections were then rinsed in TBS and mounted ongelatin-coated slides. Additional fresh frozen sections werestained with the Chemicon or the Conner antisera each diluted
at 1:1000 dilution, and processed concurrently to the perfusion®xed tissue. The parallel NGF immunohistochemistry on cryostatsections with these two antisera was performed according to themethods for immunohistochemistry for fresh frozen cryostatsections described above.
Western blotting
To ascertain the speci®city of the NGF antiserum used,immunoblotting was done with both the Chemicon and Connerantibodies. Western blots were performed on PND 7 and 14 tissuefrom neocortex, hippocampus and cerebellum and on rhNGF,BDNF and NT-3 (Sigma, St. Louis, MO.; N1408, B3795, and,
Ontogeny of neurotrophic factors in rat brain 743
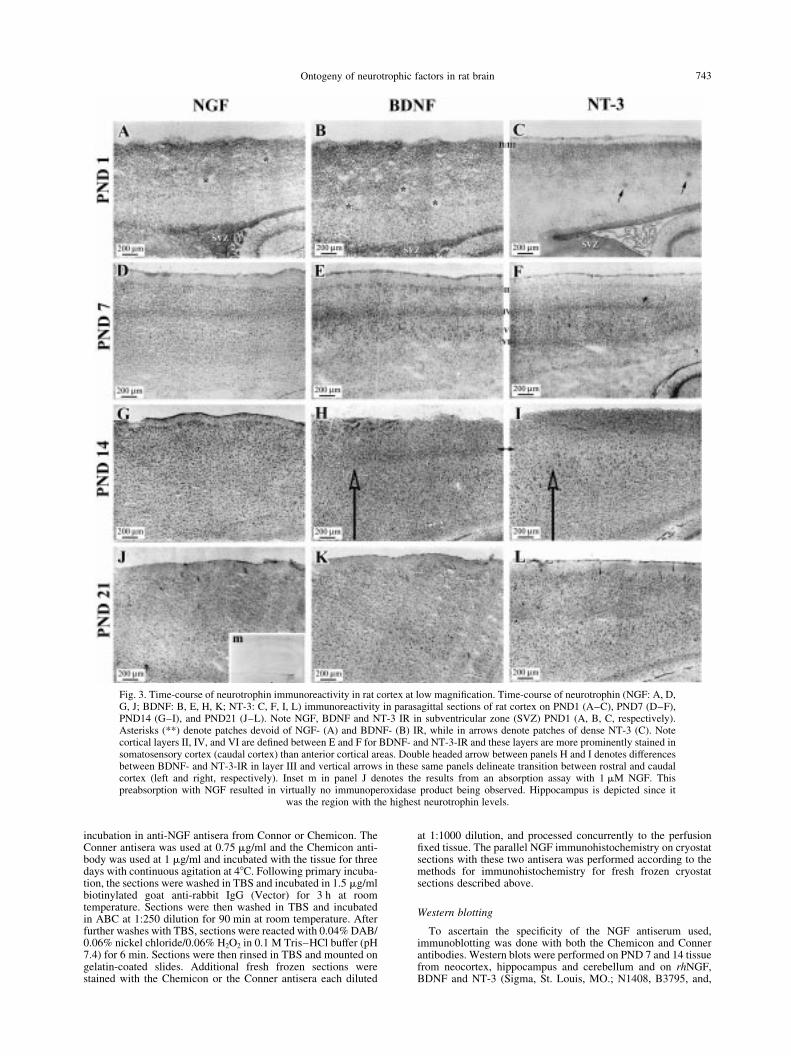
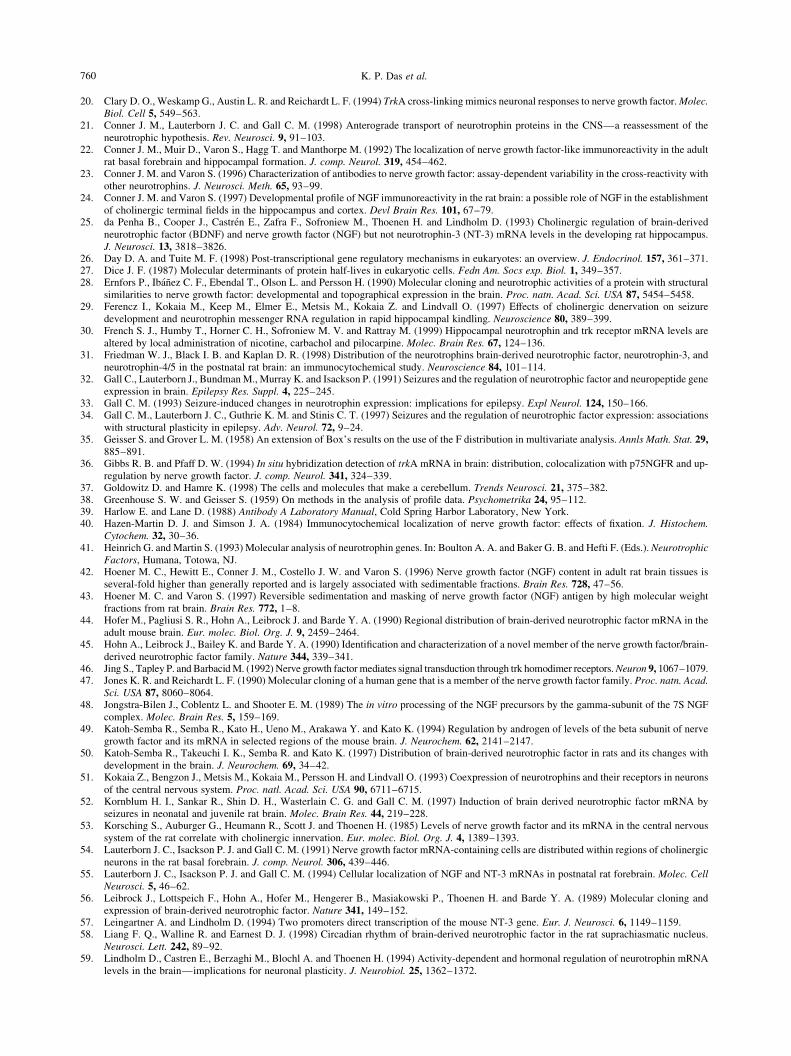
Fig. 3. Time-course of neurotrophin immunoreactivity in rat cortex at low magni®cation. Time-course of neurotrophin (NGF: A, D,G, J; BDNF: B, E, H, K; NT-3: C, F, I, L) immunoreactivity in parasagittal sections of rat cortex on PND1 (A±C), PND7 (D±F),PND14 (G±I), and PND21 (J±L). Note NGF, BDNF and NT-3 IR in subventricular zone (SVZ) PND1 (A, B, C, respectively).Asterisks (**) denote patches devoid of NGF- (A) and BDNF- (B) IR, while in arrows denote patches of dense NT-3 (C). Notecortical layers II, IV, and VI are de®ned between E and F for BDNF- and NT-3-IR and these layers are more prominently stained insomatosensory cortex (caudal cortex) than anterior cortical areas. Double headed arrow between panels H and I denotes differencesbetween BDNF- and NT-3-IR in layer III and vertical arrows in these same panels delineate transition between rostral and caudalcortex (left and right, respectively). Inset m in panel J denotes the results from an absorption assay with 1 mM NGF. Thispreabsorption with NGF resulted in virtually no immunoperoxidase product being observed. Hippocampus is depicted since it
was the region with the highest neurotrophin levels.
N1905, respectively) Brains were removed and tissue wasdissected, frozen and weighed as described above. Tissue wassonicated in homogenization buffer containing 20 mM Tris,2 mM EDTA, 2 mM EGTA, 50 mM b-mercaptoethanol,0.32 M sucrose, 0.5 mM PMSF, 1 mM NaF, and 0.2% TritonX-100. For each sample, half of the homogenate was useddirectly for western blotting and the other half was centrifugedat 14,000 rpm to obtain a sample of soluble protein. Proteinconcentrations from each sample (both homogenate and super-natant) were determined as described above. The rhNGF, BDNFand NT-3 were reconstituted with 0.2 mm-®ltered PBS/0.1%BSA to a concentration of 50 mg/ml. Thirty mg of protein forhomogenate and supernatant of each region and 800 ng of eachrh neurotrophin were electrophoresed on a 10% Tris±HCl ReadyGel (Bio-Rad) at 100V. Proteins were then transferred electro-phoretically to 0.2 mm nitrocellulose (Bio-Rad). The nitrocellu-lose membranes were washed with 0.5 M TBS/0.05% Tween-20(TBST) and blocked with TBST with 5% non-fat dry milk.Membranes were incubated overnight at 48C at 50 rpm in eitherChemicon anti-NGF (1 mg/ml) or Conner anti-NGF (1 mg/ml).Three washes in TBST were followed by a 1-h incubation insecondary goatanti-rabbit antisera (KirkgardandPerry Laboratories,
Gaithersburg, MD) at 1/20,000 in TBST/1% non-fat dry milk.The membranes were then washed thoroughly in TBST and incu-bated for 1 min in enhanced chemiluminescence detectionreagents (Luminol/Enhancer and Stable Peroxidase Solution;Pierce, Rockford, IL). Chemiluminescence was imaged with aFluor-S Multi-imager (Bio-Rad) for 450 s at high sensitivitysetting using Quantity One software (Bio-Rad).
Statistical analysis
Data for developmental pro®les of regional neurotrophin levelswere collected from a minimum of three pups from three differentdams at each time point in each experiment and a total of threeexperiments were conducted. Litter was the unit of measure andthe minimum `n' size/time point/region was nine. The experi-mental design for the regional ontogeny of neurotrophin proteinsand mRNAs was a randomized block design, with dams asblocks, and age (®ve levels) and brain regions (three levels) asmain factors in the design. All data were analyzed by analysis ofvariance (ANOVA). For neurotrophin protein determinations,degrees of freedom for within-subject factors and their interactionswere adjusted using a Greenhouse±Geisser correction factor.35,38
K. P. Das et al.744
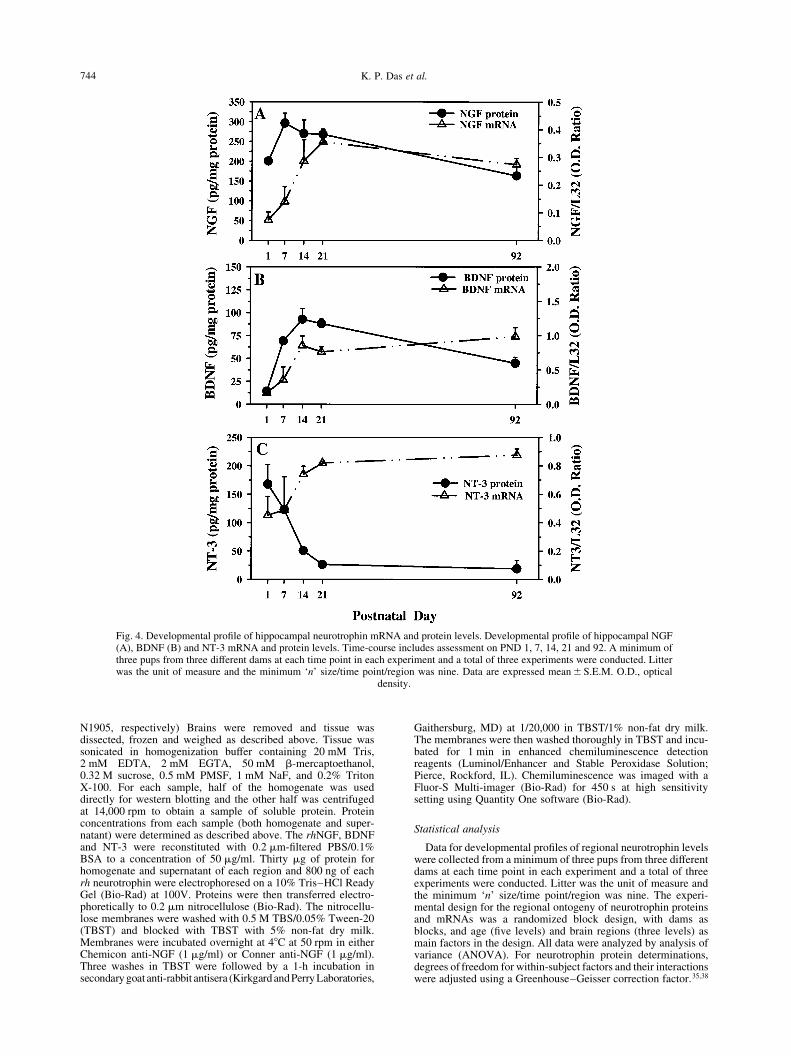
Fig. 4. Developmental pro®le of hippocampal neurotrophin mRNA and protein levels. Developmental pro®le of hippocampal NGF(A), BDNF (B) and NT-3 mRNA and protein levels. Time-course includes assessment on PND 1, 7, 14, 21 and 92. A minimum ofthree pups from three different dams at each time point in each experiment and a total of three experiments were conducted. Litterwas the unit of measure and the minimum `n' size/time point/region was nine. Data are expressed mean^S.E.M. O.D., optical
density.
RNase protection assay data for each speci®c mRNA transcriptwere logarithmically transformed and analyzed by ANOVA toassess main effect of age, brain region, speci®c mRNA levels, andinteractions among these factors.86 Following determinations ofsigni®cant main effects for each region (a# 0.05), step-downANOVAs for each region were performed and Tukey's multiplecomparison procedure with correction for unequal sample sizeswas performed to determine at which age signi®cant effect(s) foreach neurotrophin was observed in a given region. All data arereported as mean ^ S.E.M.
RESULTS
The results of preliminary experiments with differenttissue fractions revealed consistently more neurotrophin
protein recovery in our ELISAs of heart and neocortexand at both PND14 and PND130 (Fig. 1) in the crudehomogenate. The developmental pattern of each neuro-trophin mRNA and protein for neocortex, hippocampus,and cerebellum of the postnatal rat brain are describedcategorically based upon results of statistical analysesof regional neurotrophin levels. The patterns are de®nedas: (i) ¯at, no statistical difference between levels atany time points; (ii) peaked, a statistical differencein levels in at least one intervening time point of thetime-course; (iii) plateau-like, a statistical differenceat some time points but reaching some higher asymptote;(iv) mixed, a statistical difference in levels between
Ontogeny of neurotrophic factors in rat brain 745
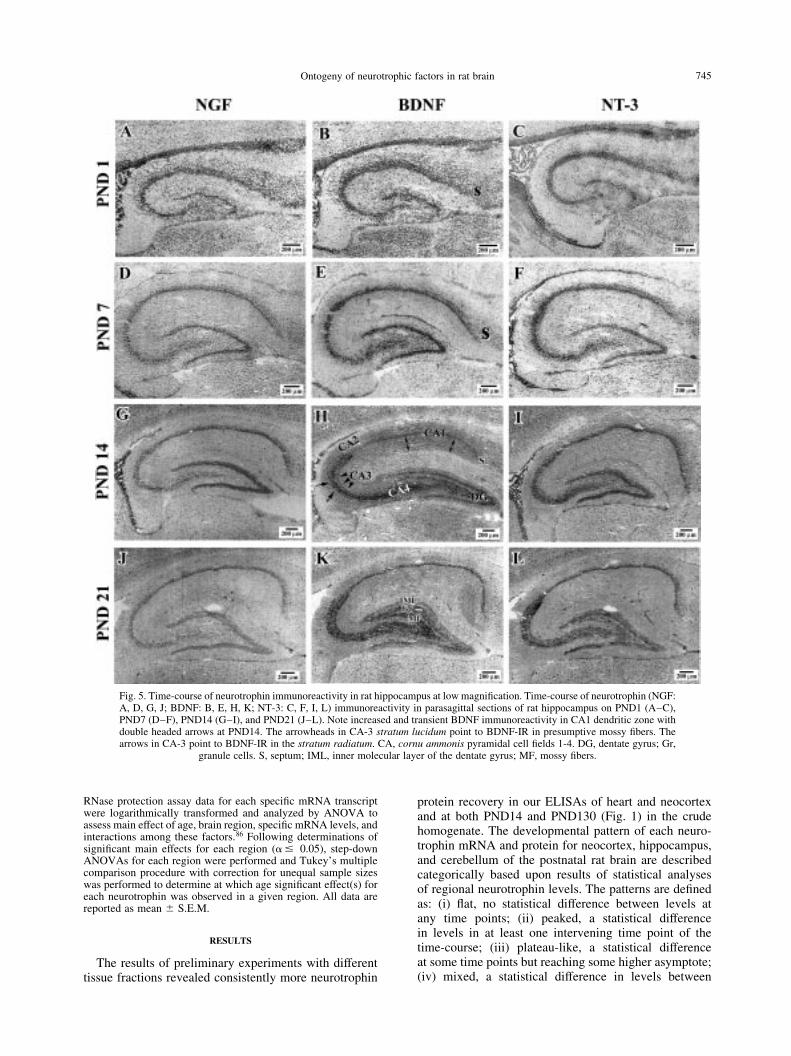
Fig. 5. Time-course of neurotrophin immunoreactivity in rat hippocampus at low magni®cation. Time-course of neurotrophin (NGF:A, D, G, J; BDNF: B, E, H, K; NT-3: C, F, I, L) immunoreactivity in parasagittal sections of rat hippocampus on PND1 (A±C),PND7 (D±F), PND14 (G±I), and PND21 (J±L). Note increased and transient BDNF immunoreactivity in CA1 dendritic zone withdouble headed arrows at PND14. The arrowheads in CA-3 stratum lucidum point to BDNF-IR in presumptive mossy ®bers. Thearrows in CA-3 point to BDNF-IR in the stratum radiatum. CA, cornu ammonis pyramidal cell ®elds 1-4. DG, dentate gyrus; Gr,
granule cells. S, septum; IML, inner molecular layer of the dentate gyrus; MF, mossy ®bers.
K.
P.
Das
etal.
74
6
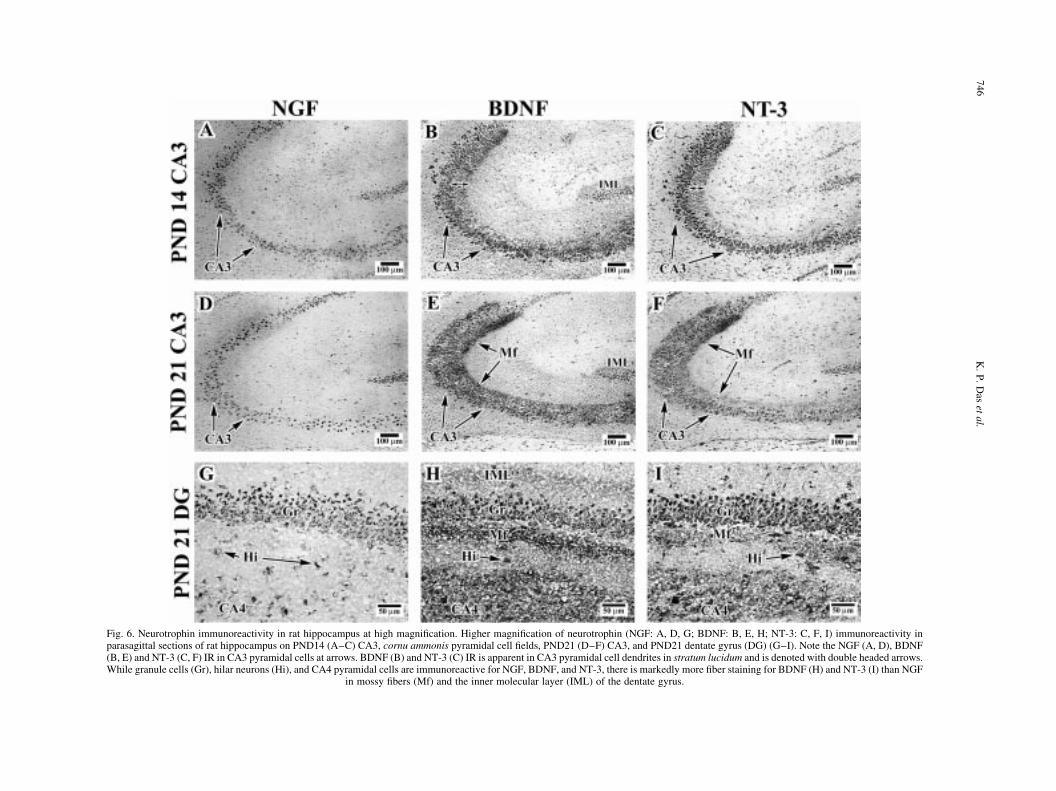
Fig. 6. Neurotrophin immunoreactivity in rat hippocampus at high magni®cation. Higher magni®cation of neurotrophin (NGF: A, D, G; BDNF: B, E, H; NT-3: C, F, I) immunoreactivity inparasagittal sections of rat hippocampus on PND14 (A±C) CA3, cornu ammonis pyramidal cell ®elds, PND21 (D±F) CA3, and PND21 dentate gyrus (DG) (G±I). Note the NGF (A, D), BDNF(B, E) and NT-3 (C, F) IR in CA3 pyramidal cells at arrows. BDNF (B) and NT-3 (C) IR is apparent in CA3 pyramidal cell dendrites in stratum lucidum and is denoted with double headed arrows.While granule cells (Gr), hilar neurons (Hi), and CA4 pyramidal cells are immunoreactive for NGF, BDNF, and NT-3, there is markedly more ®ber staining for BDNF (H) and NT-3 (I) than NGF
in mossy ®bers (Mf) and the inner molecular layer (IML) of the dentate gyrus.
multiple intervening time points; or (v) decreasing, astatistical difference between levels at the earliesttime point (PND1) and all other time points of assess-ment. The quantitative nature of the methods used inthese studies allowed us to address two separate butrelated issues: ®rst how levels of mRNA and proteinfor each neurotrophic factor changes over time andsecond how the levels of the three factors compare ineach region at each age. The regional comparisons ofneurotrophin protein levels were expressed in twoways: pg neurotrophin/mg total protein/region andng neurotrophin/g total wet weight of region. The®rst is considered a better predictor of maturation ofa brain region than total wet weight, which variesmarkedly among regions and over time during the®rst postnatal week. The second presentation of thedata is depicted for the sake of comparison to previousliterature.
Patterns of neurotrophin mRNA and protein levels in theneocortex
Our results demonstrate that both NGF and BDNFmRNA increased in a similar age-dependent manner(Fig. 2A, B) and displayed plateau-like patterns. NGFand BDNF protein levels both peaked at PND14 (Fig.2A, B). Neurotrophin-3 mRNA however, showed a ¯atpattern, while NT-3 protein levels decreased in an age-dependent manner (Fig. 2C) with the highest levels onPND1 and reaching lower adult levels by PND14.
All three neurotrophins, NGF, BDNF, and NT-3, werelocalized throughout large expanses of the neocorticalmantle. Immunoreactivity (IR) of all three neurotrophinson PND1 appeared densest in presumptive layer II±III(Fig. 3A±C). The distribution in other cortical layers wasnot uniform. There were marked patches (*) devoid ofNGF and BDNF staining (Fig. 3A, B) which did not
Ontogeny of neurotrophic factors in rat brain 747
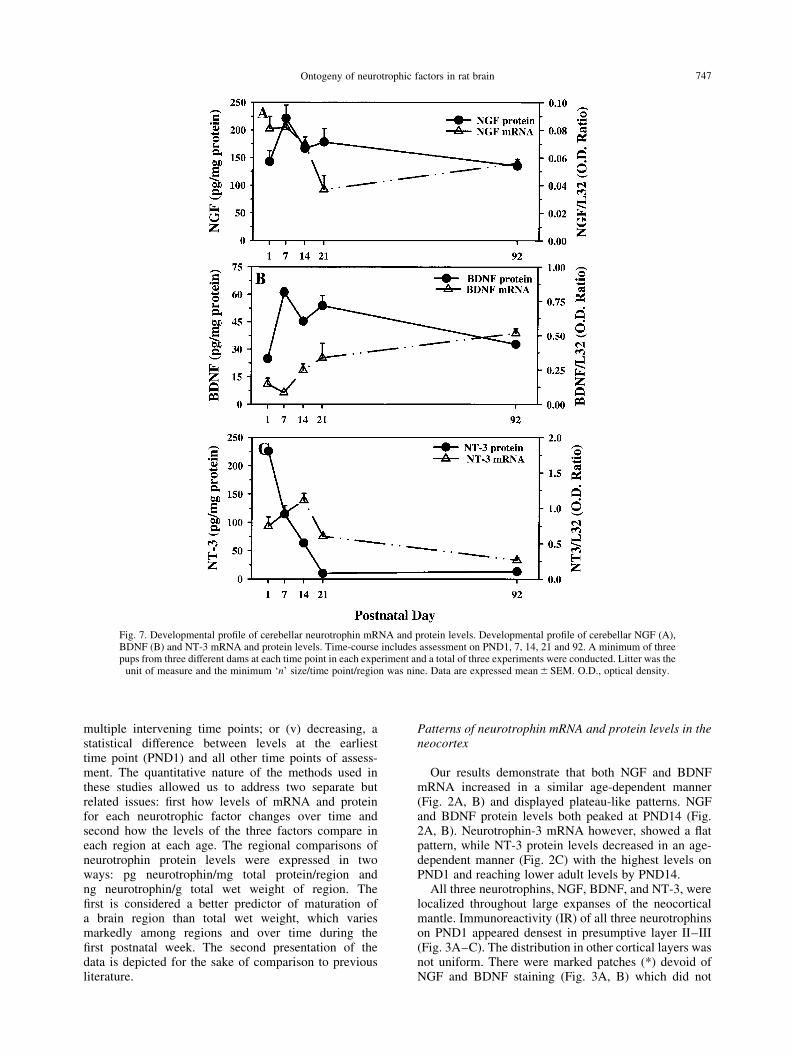
Fig. 7. Developmental pro®le of cerebellar neurotrophin mRNA and protein levels. Developmental pro®le of cerebellar NGF (A),BDNF (B) and NT-3 mRNA and protein levels. Time-course includes assessment on PND1, 7, 14, 21 and 92. A minimum of threepups from three different dams at each time point in each experiment and a total of three experiments were conducted. Litter was the
unit of measure and the minimum `n' size/time point/region was nine. Data are expressed mean^SEM. O.D., optical density.
appear to be overlapping in adjacent sections. Curiously,NT-3-IR demonstrated sparser staining in deeper corticallayers at PND1 and some patches of concentrated NT-3-IR (Fig. 3C). Later in neocortical development (PND7;Fig. 3D±F), a marked shift in the laminar pattern wasapparent for BDNF and NT-3 as compared to PND1.NGF-IR appeared to have no speci®c laminar patternon PND7 or at any of the later ages (Fig. 3D, G, J), butappeared to be widely distributed throughout theneocortex and localized primarily in cell bodies of
presumptive neurons. BDNF and NT-3, however,appeared to be distributed in more laminar patternswith BDNF being denser in Layers II, IV, and V (Fig.3E) and NT-3 being denser in Layers II, IV, and VI (Fig.3F). By PND14, BDNF- and NT-3-IR appeared to bedistributed in a more diffuse pattern with one exception.This exception was apparent with the more punctatedistribution of BDNF-IR in layer IV (Fig. 3H) thanNT-3 in the corresponding layer IV (Fig. 3I). FromPND21 (Fig. 3J±L) through adulthood (data not
K. P. Das et al.748
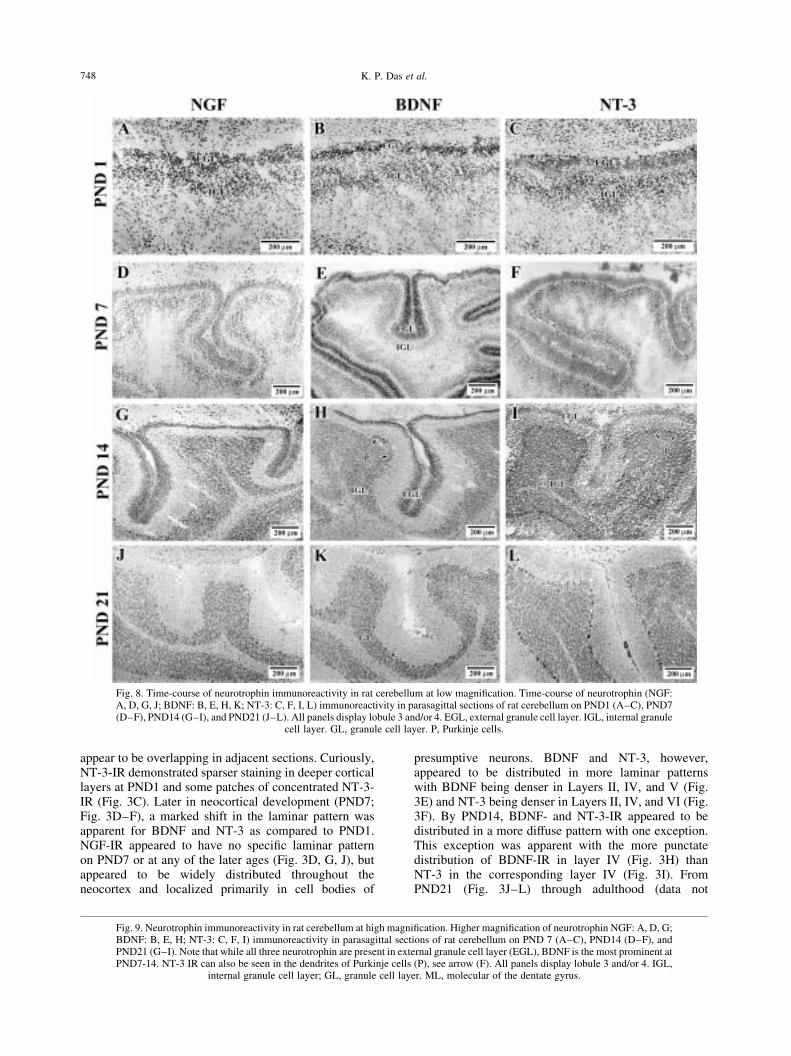
Fig. 8. Time-course of neurotrophin immunoreactivity in rat cerebellum at low magni®cation. Time-course of neurotrophin (NGF:A, D, G, J; BDNF: B, E, H, K; NT-3: C, F, I, L) immunoreactivity in parasagittal sections of rat cerebellum on PND1 (A±C), PND7(D±F), PND14 (G±I), and PND21 (J±L). All panels display lobule 3 and/or 4. EGL, external granule cell layer. IGL, internal granule
cell layer. GL, granule cell layer. P, Purkinje cells.
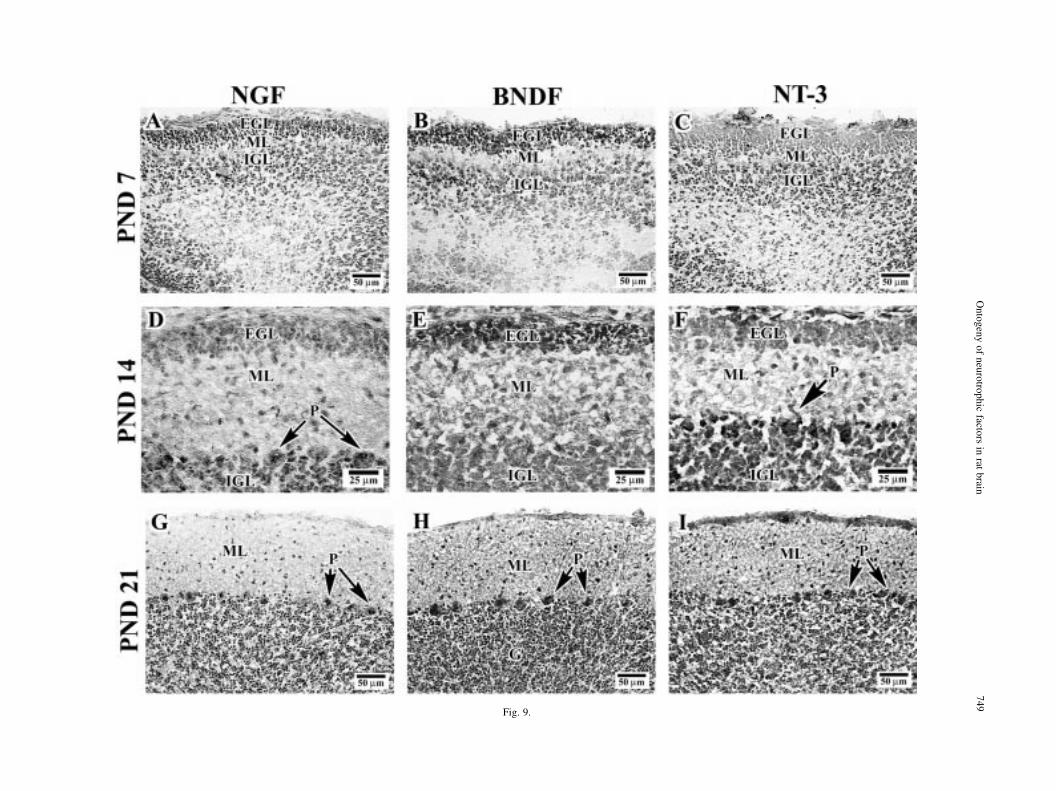
Fig. 9. Neurotrophin immunoreactivity in rat cerebellum at high magni®cation. Higher magni®cation of neurotrophin NGF: A, D, G;BDNF: B, E, H; NT-3: C, F, I) immunoreactivity in parasagittal sections of rat cerebellum on PND 7 (A±C), PND14 (D±F), andPND21 (G±I). Note that while all three neurotrophin are present in external granule cell layer (EGL), BDNF is the most prominent atPND7-14. NT-3 IR can also be seen in the dendrites of Purkinje cells (P), see arrow (F). All panels display lobule 3 and/or 4. IGL,
internal granule cell layer; GL, granule cell layer. ML, molecular of the dentate gyrus.
On
tog
eny
of
neu
rotro
phic
factors
inrat
brain
749
Fig. 9.
shown), the pattern of neurotrophin immunoreactivitywas similar for all three neurotrophins, with diffuseimmunoreactivity in cell bodies widely distributedthroughout all neocortical layers.
Patterns of neurotrophin mRNA and protein levels in thehippocampal formation
Nerve growth factor mRNA levels increased in an age-dependent manner, reaching a plateau at PND21 (Fig.4A). NGF protein levels peaked at PND7 (Fig. 4A).BDNF mRNA increased in an age-dependent mannerreaching a plateau at PND14, while the pattern forBDNF protein levels appeared to reach its highest levelbetween PND14 and 21 (Fig. 4B). NT-3 mRNA levelsincreased in an age-dependent manner reaching aplateau at PND14, whereas NT-3 protein levelsdecreased in an age-dependent manner not reaching thelower more adult-like levels until PND21 (Fig. 4C). Thedistribution of NGF-, BDNF-, and NT-3-IR was rela-tively similar throughout the hippocampal formation onPND1 (Fig. 5A±C). Cell bodies, presumably neurons in
the subiculum, CA1-4 pyramidal cells, hilar cells, anddentate granule cells of the superior blade of the dentategyrus were immunoreactive for all three neurotrophins.By PND7, the neurotrophin IR remained widely distrib-uted and the inferior blade of the dentate gyrus was alsoimmunoreactive for all three neurotrophins (Fig. 5 D±F).In addition, at higher magni®cation there was appreci-able punctate BDNF-IR and NT-3-IR in the CA3±4 stra-tum lucidum, the synaptic zone of the granule cell mossy®bers. This ®ber staining for BDNF and NT-3 appearedto intensify at the later ages (PND14 and 21; Fig. 6B, C,E, F), and in adults (data not shown). Immunoreactivityfor all the neurotrophins in the subicular complexappeared to diminish with age (PND14 and 21; Fig.5G±L). On PND 14 a transient increase in BDNF-IRwas apparent in the dendritic zone of the CA1 pyramidalcells (Fig. 5H), which was not apparent with either NGFor NT-3 (Fig. 5G or I). On PND21 at higher magni®ca-tion, NGF-IR appeared to be widely distributed in hippo-campus (Fig. 6D, G), while both BDNF and NT-3-IRappeared to be more dense in CA3±4 pyramidal cells(Fig. 6E, F) and dentate gyrus (Fig. 6H, I) than NGF.
K. P. Das et al.750
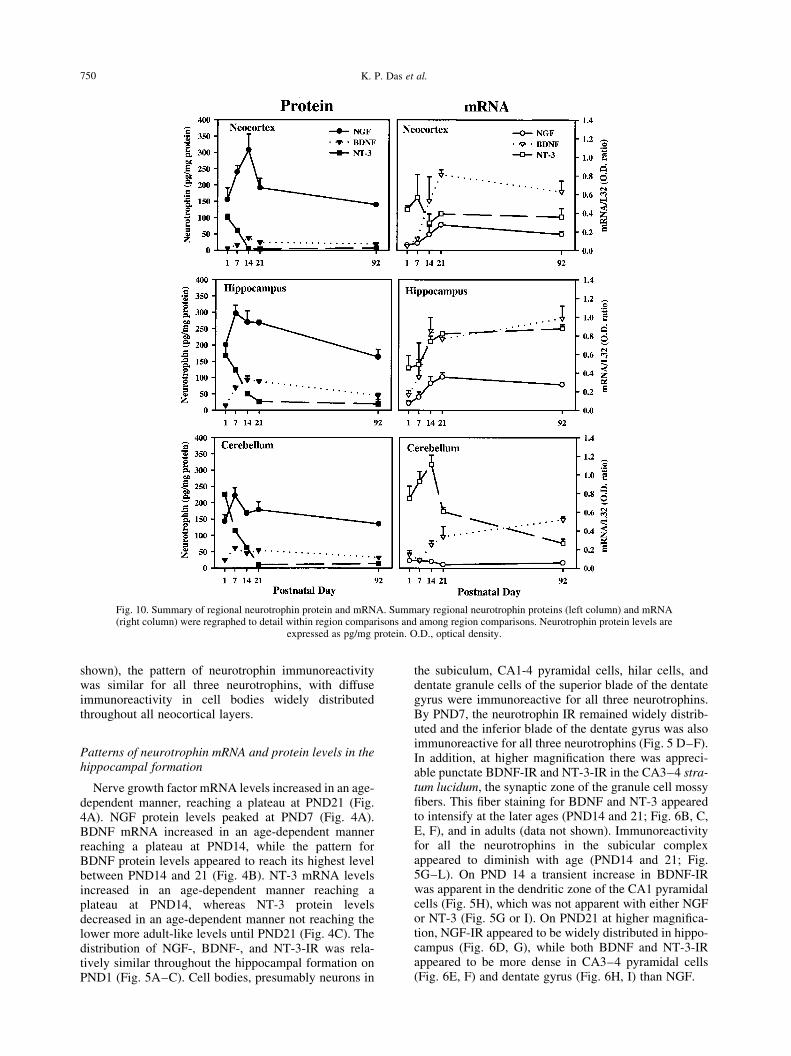
Fig. 10. Summary of regional neurotrophin protein and mRNA. Summary regional neurotrophin proteins (left column) and mRNA(right column) were regraphed to detail within region comparisons and among region comparisons. Neurotrophin protein levels are
expressed as pg/mg protein. O.D., optical density.
Patterns of neurotrophin mRNA and protein levels in thecerebellum
NGF mRNA levels were high on PND1±7 anddecreased to much lower levels at older ages, whereasNGF protein levels appeared to peak at PND7 followedby an age-dependent decrease to lower adult levels (Fig.7A). Brain-derived neurotrophic factor mRNA levelsincreased in an age-dependent manner and reached aplateau at PND21 (Fig. 7B), while a mixed pattern wasexhibited for BDNF protein levels with a peak at PND7,a dip at PND14, and peak again at PND21 (Fig. 7B).Neurotrophin-3 mRNA levels increased in an age-dependent manner reaching a peak at PND14, but NT-3protein levels decreased from the highest levels on PND1through PND21 (Fig. 7C).
Similar to the overlap of neurotrophin immuno-reactivity in other regions, the cerebellum on PND1demonstrated that NGF, BDNF, and NT-3 were apparentin the external granule cell layer (EGL) and the internalgranule cell layer (IGL) of the primordial cerebellarcortex (Fig. 8A±C). On PND7, the neurotrophin IR inthe EGL and IGL remained remarkable with especiallydense BDNF-IR in both of these layers (Figs 8E and 9B).NGF- and NT-3-IR was also observed in the EGL andIGL (Figs 8 D, F and 9 A, C, respectively). By PND14,the density of immunoreactivity for all three neuro-trophins increased in all the lobules of the cerebellumcoincident with the migration of granule cells to theinternal granule cell layer (Fig. 9D±F). Interestingly,the pial surface of the brain was very NT-3 immuno-reactive (Fig. 9C, F, I) and dense NT-3-IR was alsoobserved in nascent Purkinje cells (Fig. 9F). FromPND21 to adulthood, the pattern of neurotrophin IRwas relatively similar; less neurotrophin immuno-reactivity could be observed in the super®cial aspectsof the cerebellar lobules coincident with the disappear-ance of the external granule cell layer (Figs 8J±L and9G±I). By PND21, neurotrophin immunoreactivity couldbe observed in the granule cell layer and Purkinje celllayers. The apparent density of neurotrophin immuno-reactivity in the cerebellar cortex could be observedwith NT-3 .BDNF . NGF (Fig. 9G±I).
Qualitative comparisons among regions for neuro-trophin mRNA and protein
The regional patterns for NGF, BDNF, and NT-3mRNA and protein levels showed some similarities,but also signi®cant differences among regions. Com-parison of regional pro®les for NGF mRNA werequalitatively similar in neocortex and hippocampus,displaying a plateau-like pattern, but unique with respectto cerebellum, which displayed a decreasing pattern (Figs10 and 11). Comparison of the regional pro®les of NGFprotein were unique, with neocortex displaying a peakedpattern at PND14, while the later-developing hippo-campus and cerebellum peaked at PND7 (Fig. 10).Comparison of regional pro®les for BDNF mRNA werequalitatively similar among all regions, neocortex,hippocampus, and cerebellum, all of which displayed aplateau-like pattern (Fig. 10). Comparison of the regional
pro®les of BDNF protein levels demonstrated thatneocortex and hippocampus displayed a peak atPND14, while cerebellum displayed a mixed pattern(Fig. 10). Comparison of regional pro®les of NT-3mRNA were qualitatively unique, with neocortexdisplaying a ¯at pattern, hippocampus revealing aplateau-like pattern, and cerebellum displaying a peakedpattern (Fig. 10). Regional comparison of the pro®les ofNT-3 protein were qualitatively similar among neo-cortex, hippocampus, and cerebellum. All three regionsshowed a decreasing pattern with the highest levels onPND1, although neocortex reached adult-like levelsearlier at PND14 (Fig. 10).
Quantitative comparisons among regions for neuro-trophin mRNA and protein
Quantitative comparisons of regional NGF mRNAlevels revealed relatively low levels in all three regionswhen compared to BDNF and NT-3 mRNA levels (Fig.10, right column). The hippocampus and neocortex hadhigher NGF mRNA levels than cerebellum (Fig. 10, rightcolumn). In general, BDNF and NT-3 mRNA were themost abundant in the hippocampus across all ages.However, one exception was a peak in NT-3 mRNAlevels apparent in cerebellum on PND7±14. Quantitativecomparisons of regional NGF protein levels demon-strated that levels were higher in neocortex and hippo-campus across all ages examined and lower incerebellum (P , 0.05). Quantitative comparisons of theregional BDNF protein levels demonstrated that levelswere higher in hippocampus and cerebellum collapsedacross all ages examined, when compared to the lowerlevels in neocortex (P , 0.05; Fig. 10). Quantitativecomparisons between the regional NT-3 protein levelsrevealed no statistically signi®cant regional differencesacross all ages examined, although a trend is evident inthe peak levels of NT-3 at PND1 in hippocampus andcerebellum, which were more than two-fold greater thanneocortex at the same ages.
Speci®city of neurotrophin immunoreactivity and neuro-trophin immunoreactivity in other brain regions
The issue of speci®city of the NGF-IR was of someconcern to us, since some regional differences wereapparent for the neocortex and hippocampus from a pre-vious report.22 To ascertain the level of cross-reactivityof the antisera used, western blotting of proteins wereperformed on both homogenates and supernatant of thesame samples from PND 7 and 14 neocortex, hippo-campus, and cerebellum (Fig. 12A and B). Densestbands were seen at 52 kDa and much lighter bands at13 kDa in homogenate samples using the ChemiconNGF antibody (Fig. 12A). Blots of the supernatantfrom PND 7 and 14 neocortex, hippocampus, and cere-bellum protein samples demonstrated the densest bandsat 52 kDa and much lighter bands at 13 kDa with thesame antibody (Fig. 12B). Marcinkiewicz et al.63
reported NGF-IR bands of 50, 35, and 28 kDa in proteinsamples from rat sciatic nerve. They characterized the
Ontogeny of neurotrophic factors in rat brain 751
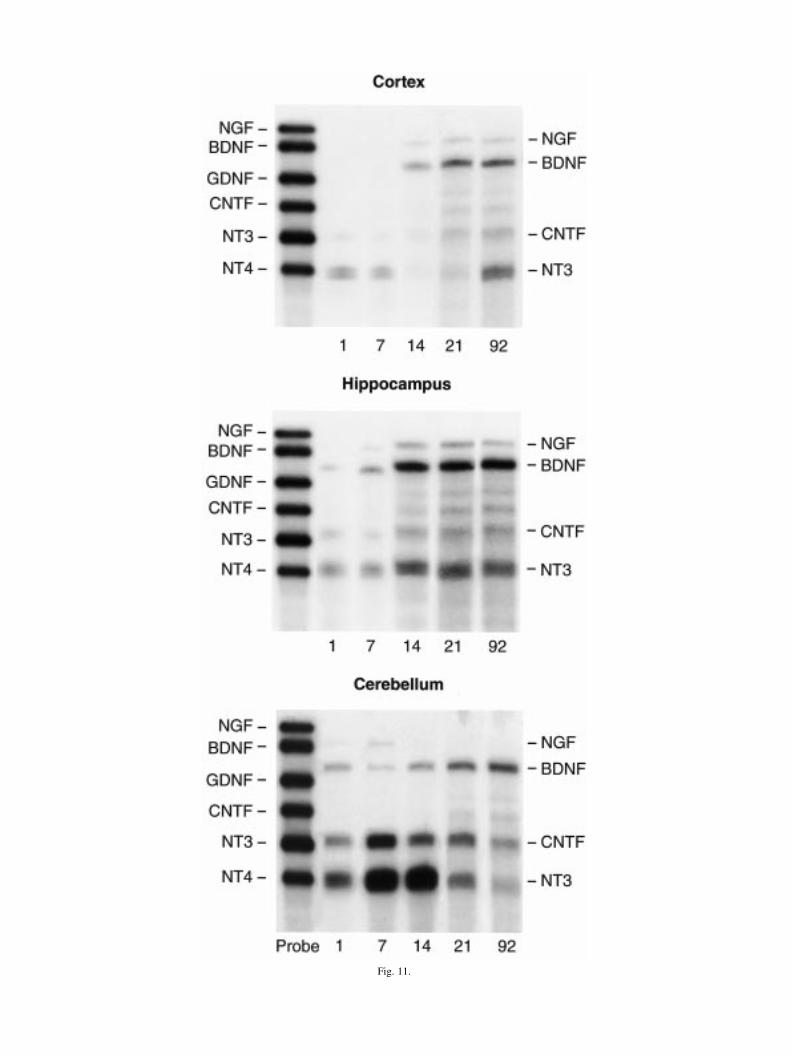
Fig. 11.
bands as proNGF intermediates and likely not aggregatesof the 13 kDa monomer as the electrophoresis wasperformed in the presence of b-mercaptoethanol.Immunoblot data from studies of NGF processing havereported bands of higher molecular weight preproNGF orproNGF in hippocampal neurons,68 lymphocytes,80 and
submaxillary gland.48 Western blots utilizing Chemiconanti-NGF and rhNGF, rhBDNF, and rhNT-3 showeddensest bands of NGF at 13 kDa with lighter bands at26 kDa and no cross-reactivity with BDNF or NT-3 (Fig.12 D). Interestingly, the Conner antisera recognizedmultiple bands as well (13, 26 and 52 kDa; Fig. 12 C)
Ontogeny of neurotrophic factors in rat brain 753
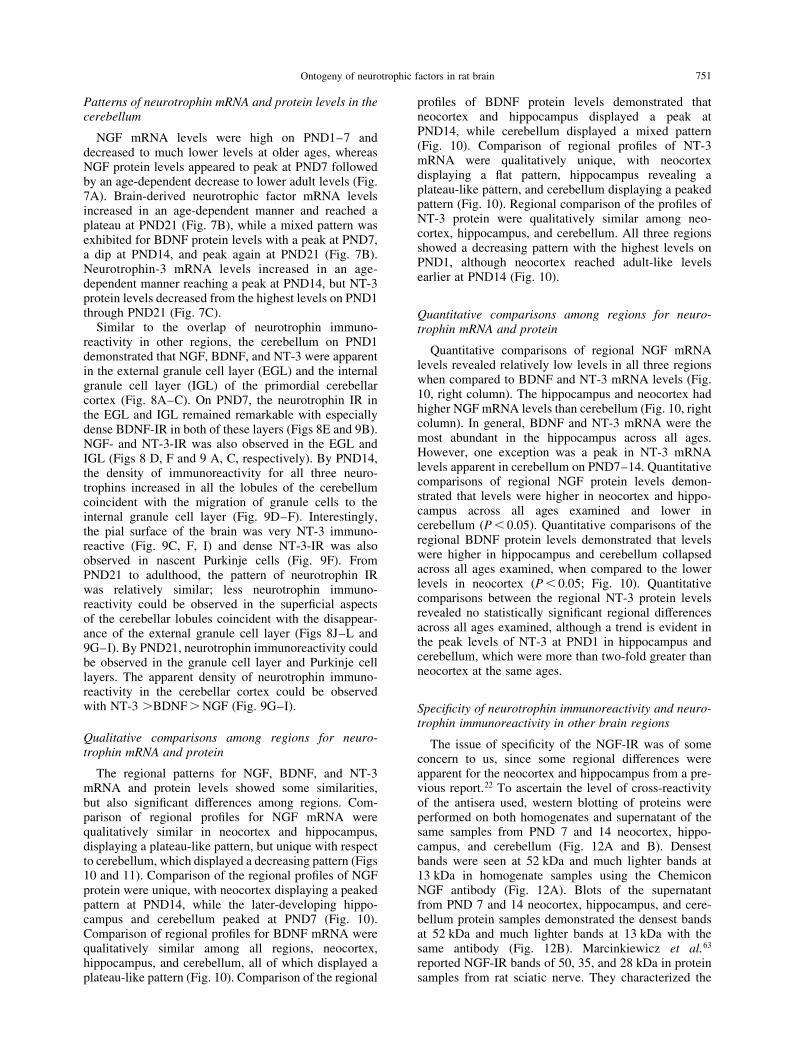
Fig. 11. Representative neurotrophin ribonuclease protection assays of neocortex, hippocampus, and cerebellum. Representative®gure of neurotrophin ribonuclease protection assay obtained from developmental time-course of neocortex, hippocampus, andcerebellum is composite of several gels. Note left side has markers of neurotrophin and cytokines of probe set (GDNF and CNTF).Hybridized fragments are shorter and migrate more rapidly than probe standards and thus are shifted down in each lane accordingly.
An `n' of three to ®ve litters per time point was used.
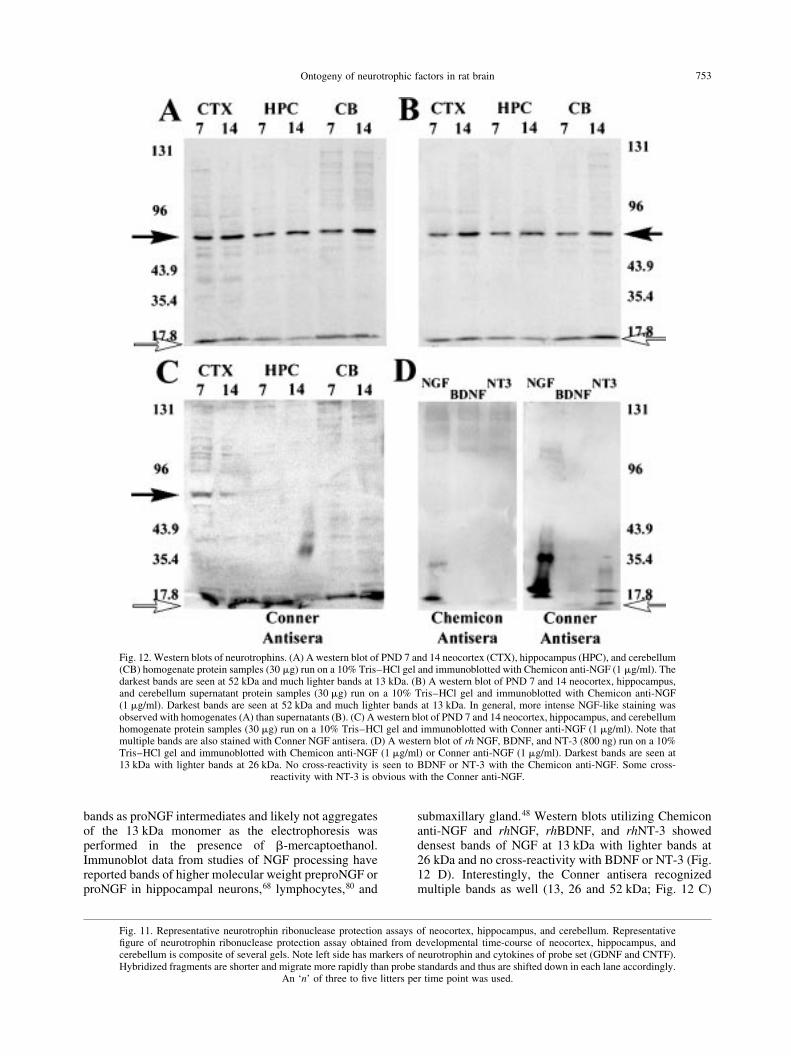
Fig. 12. Western blots of neurotrophins. (A) A western blot of PND 7 and 14 neocortex (CTX), hippocampus (HPC), and cerebellum(CB) homogenate protein samples (30 mg) run on a 10% Tris±HCl gel and immunoblotted with Chemicon anti-NGF (1 mg/ml). Thedarkest bands are seen at 52 kDa and much lighter bands at 13 kDa. (B) A western blot of PND 7 and 14 neocortex, hippocampus,and cerebellum supernatant protein samples (30 mg) run on a 10% Tris±HCl gel and immunoblotted with Chemicon anti-NGF(1 mg/ml). Darkest bands are seen at 52 kDa and much lighter bands at 13 kDa. In general, more intense NGF-like staining wasobserved with homogenates (A) than supernatants (B). (C) A western blot of PND 7 and 14 neocortex, hippocampus, and cerebellumhomogenate protein samples (30 mg) run on a 10% Tris±HCl gel and immunoblotted with Conner anti-NGF (1 mg/ml). Note thatmultiple bands are also stained with Conner NGF antisera. (D) A western blot of rh NGF, BDNF, and NT-3 (800 ng) run on a 10%Tris±HCl gel and immunoblotted with Chemicon anti-NGF (1 mg/ml) or Conner anti-NGF (1 mg/ml). Darkest bands are seen at13 kDa with lighter bands at 26 kDa. No cross-reactivity is seen to BDNF or NT-3 with the Chemicon anti-NGF. Some cross-
reactivity with NT-3 is obvious with the Conner anti-NGF.
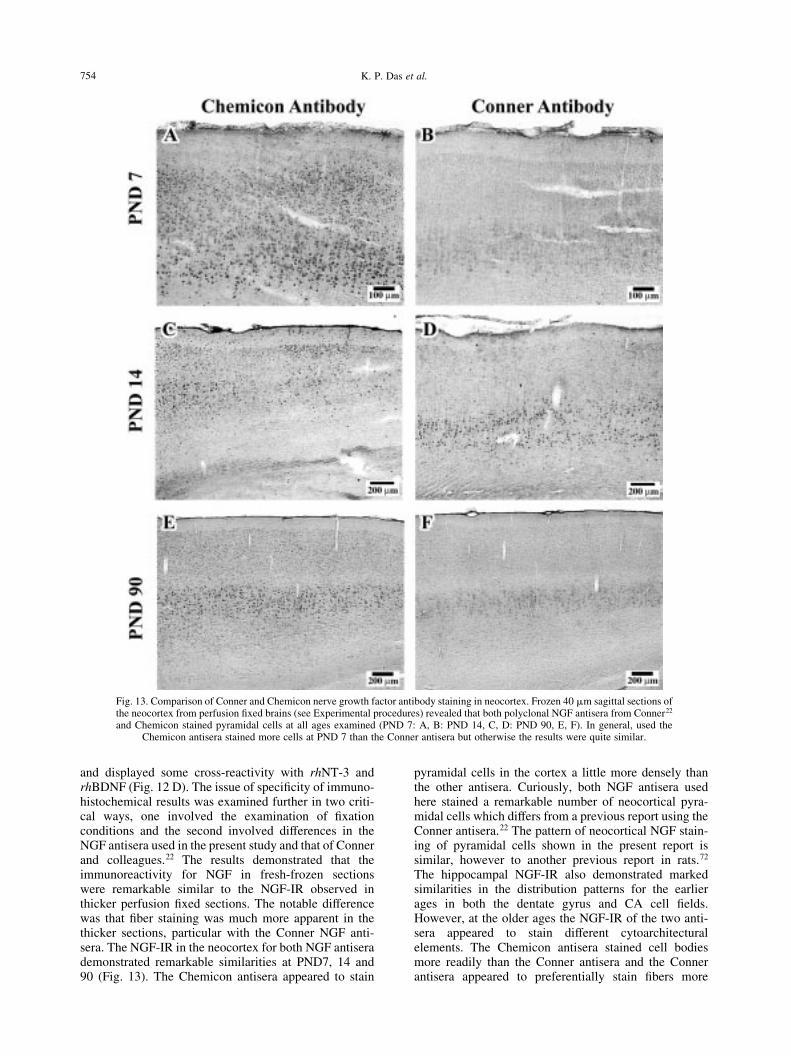
and displayed some cross-reactivity with rhNT-3 andrhBDNF (Fig. 12 D). The issue of speci®city of immuno-histochemical results was examined further in two criti-cal ways, one involved the examination of ®xationconditions and the second involved differences in theNGF antisera used in the present study and that of Connerand colleagues.22 The results demonstrated that theimmunoreactivity for NGF in fresh-frozen sectionswere remarkable similar to the NGF-IR observed inthicker perfusion ®xed sections. The notable differencewas that ®ber staining was much more apparent in thethicker sections, particular with the Conner NGF anti-sera. The NGF-IR in the neocortex for both NGF antiserademonstrated remarkable similarities at PND7, 14 and90 (Fig. 13). The Chemicon antisera appeared to stain
pyramidal cells in the cortex a little more densely thanthe other antisera. Curiously, both NGF antisera usedhere stained a remarkable number of neocortical pyra-midal cells which differs from a previous report using theConner antisera.22 The pattern of neocortical NGF stain-ing of pyramidal cells shown in the present report issimilar, however to another previous report in rats.72
The hippocampal NGF-IR also demonstrated markedsimilarities in the distribution patterns for the earlierages in both the dentate gyrus and CA cell ®elds.However, at the older ages the NGF-IR of the two anti-sera appeared to stain different cytoarchitecturalelements. The Chemicon antisera stained cell bodiesmore readily than the Conner antisera and the Connerantisera appeared to preferentially stain ®bers more
K. P. Das et al.754
Fig. 13. Comparison of Conner and Chemicon nerve growth factor antibody staining in neocortex. Frozen 40 mm sagittal sections ofthe neocortex from perfusion ®xed brains (see Experimental procedures) revealed that both polyclonal NGF antisera from Conner22
and Chemicon stained pyramidal cells at all ages examined (PND 7: A, B: PND 14, C, D: PND 90, E, F). In general, used theChemicon antisera stained more cells at PND 7 than the Conner antisera but otherwise the results were quite similar.
Ontogeny of neurotrophic factors in rat brain 755
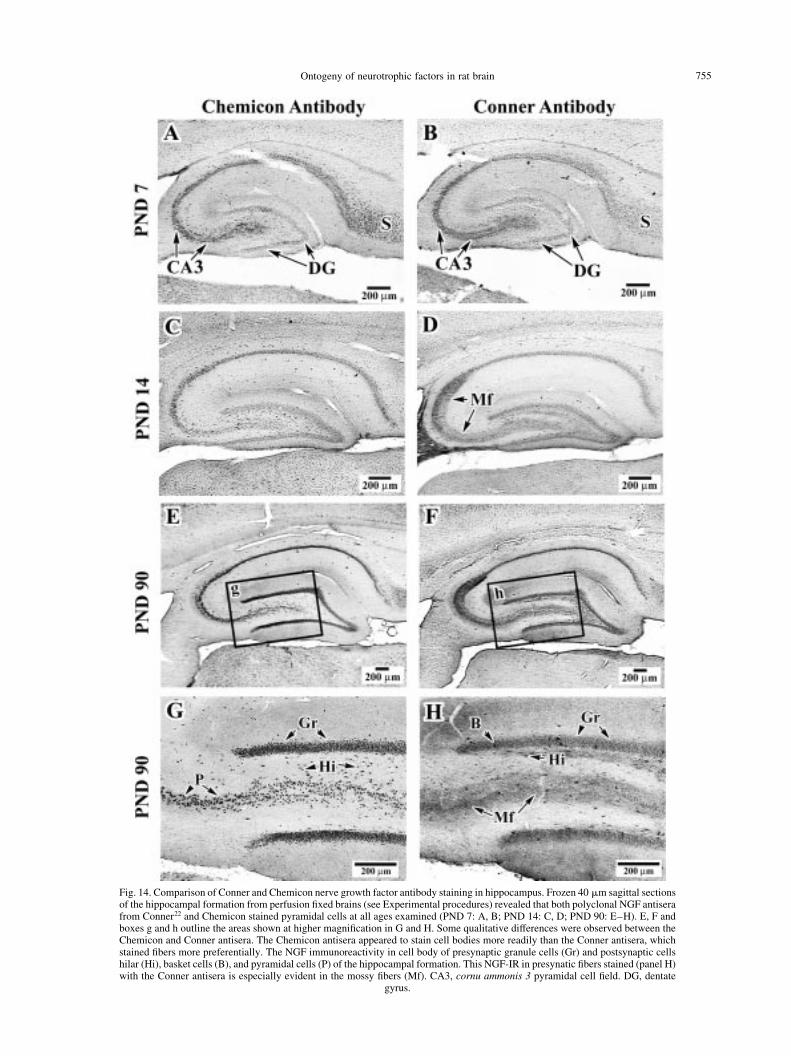
Fig. 14. Comparison of Conner and Chemicon nerve growth factor antibody staining in hippocampus. Frozen 40 mm sagittal sectionsof the hippocampal formation from perfusion ®xed brains (see Experimental procedures) revealed that both polyclonal NGF antiserafrom Conner22 and Chemicon stained pyramidal cells at all ages examined (PND 7: A, B; PND 14: C, D; PND 90: E±H). E, F andboxes g and h outline the areas shown at higher magni®cation in G and H. Some qualitative differences were observed between theChemicon and Conner antisera. The Chemicon antisera appeared to stain cell bodies more readily than the Conner antisera, whichstained ®bers more preferentially. The NGF immunoreactivity in cell body of presynaptic granule cells (Gr) and postsynaptic cellshilar (Hi), basket cells (B), and pyramidal cells (P) of the hippocampal formation. This NGF-IR in presynatic ®bers stained (panel H)with the Conner antisera is especially evident in the mossy ®bers (Mf). CA3, cornu ammonis 3 pyramidal cell ®eld. DG, dentate
gyrus.
readily than cell bodies. The differences in recognition bythe two antibodies could be due, in part, to them detect-ing different processed states of the protein. In much ofour immunohistochemistry, the Chemicon anti-NGFpreferentially stains cells bodies, whereas the Conneranti-NGF stains ®bers. This could mean that the Chemi-con antibody recognizes larger, less processed, forms ofthe protein that are still in the cell body and have not yetbeen cleaved by pro-protein convertases, whereas theConner anti-NGF preferentially recognizes smaller,more processed, forms of NGF that may be transportedthrough neuronal processes. Another explanation for theincreased ®ber staining with the Conner antisera could beexplained by cross-reactivity with NT-3, which is alsothought to be contained in hippocampal mossy ®bers.The cell body staining in hippocampal pyramidal andgranule cells of adults was very similar to previousresults.72 This apparent preference for ®ber stainingwith the Conner NGF antisera was apparent in both thehippocampus (Fig. 14) and brainstem (data not shown).The NGF staining in the granule cells of the hippo-campus and mossy ®ber axons in the hippocampus illus-trate this point readily (Fig. 14 G, H).
Neurotrophin immunoreactivity was observed inregions other than those quanti®ed by ELISA. IntenseNGF immunostaining was observed in the choroid plexusin both fresh frozen sections and perfusion ®xed tissue.This NGF-IR in choroid plexus is in accord with resultsobtained by Vega and colleagues93 in which NGFreceptor was localized to these structures in all ratbrain ventricles. The thalamus was also immunoreactivefor all neurotrophins, results which are in accordancewith several other reports.36,84,91,94 In addition there wassigni®cant NGF-IR in brainstem nuclei (data not shown).
DISCUSSION
NGF, BDNF, and NT-3 have been suggested to play animportant role in the modi®cation of neural networks inthe developing nervous system.28,45,47,56,62,83 The presentstudy demonstrates that all three of these neurotrophinmRNAs and proteins are highly enriched during post-natal cortical development and may parallel the differen-tiation of each region. The key aim we addressed withthis study was whether the pattern of mRNA expressionof these three neurotrophic factors in developing rat brainregions covary with their corresponding protein levels.Our results demonstrate that the development of eachregion is unique with regard to mRNA and protein levels.In each region examined (i.e., neocortex, hippocampus,and cerebellum), examples of discordance between thepattern for neurotrophin mRNA levels and the pattern oftheir respective protein levels exist. For example, in theneocortex, the pro®les for only NGF and BDNF mRNAand protein levels can be superimposed, whereas in thehippocampus and cerebellum, only the BDNF mRNAlevels parallel its corresponding protein levels. Thedevelopmental pro®le for NT-3 mRNA levels was dis-sonant from that seen for the corresponding protein in allthree regions of the brain examined. Thus, it appears thedevelopmental expression of NGF, BDNF and NT-3 in
the neocortex, hippocampus, and cerebellum is mediatedat least, in part, independently of each other in theseregions.
Neocortex
During development in the rat brain, neurogenesisof neocortex begins prenatally followed by continuedontogeny via migration, differentiation and synapto-genesis occurring through weaning.14 Our results indi-cated that adult-like levels for neurotrophins are notobserved until between the second and third week post-natally in the rat. This is also supported, qualitatively, bythe immunohistochemical distribution of the three neuro-trophins, in which an adult-like pattern is not observedfor NGF until PND14 and for BDNF and NT-3 untilPND21.
The plateau-like pattern observed for NGF mRNA inthe neocortex is in agreement with previous reports fromnorthern blot analysis.62,96 A peak in neocortical NGFprotein levels, is not in agreement with a previousreport,96 in which an apparent plateau was reported atthree weeks postnatally for whole brain. The postnatalimmunohistochemical pattern in neocortex reported hereis not in agreement with a previous report, in whichvirtually no NGF-IR was observed in the neocortex,24
while they report remarkable NGF-IR being observedin cingulate cortex. Many methodological dissimilaritiesbetween these studies could explain these disparate®ndings, not the least of which is the differences in theantisera/antibodies used; other differences are discussedin generic terms below. We used the same antisera andsimilar ®xation conditions as previously reported24 andstill observed signi®cant NGF-IR in the neocortex,especially in pyramidal cells. It should also be notedthat this NGF-IR in the neocortex is consistent withprevious reports of the distribution of trkA-IR.11 Theplateau in BDNF mRNA levels we report is in agreementwith the gross relative differences between newborn andadult neocortex derived from previous northern blotdata.62 The peak in BDNF protein levels in neocortexat PND14 are not in direct agreement with the peakedpattern at three weeks postnatally which was reportedin ng/mg wet weight.50 The ¯at and decreasing patternof NT-3 mRNA and protein in neocortex are novelinformation. However, this regional analysis includedcingulate cortex in the dissection and results from aprevious report using in situ hybridization demonstratedan age-related decline in NT-3 mRNA levels in thissubregion during the early postnatal period.55 This ¯atpattern of mRNA expression may represent the sum-mation of increasing and decreasing patterns of mRNAexpression in different cell populations of the neo-cortex and cingulate cortex. The distribution of BDNFand NT-3 IR in super®cial and deeper layers (II, IV andVI) of the neocortex is similar to the laminar distributiondiscussed by Friedman et al.31 This distribution andlocalization of all three neurotrophin proteins in theneocortex is consistent with the paracrine and autocrinefunction ascribed to the neurotrophins during neocorticaldifferentiation.1,18,64,66
K. P. Das et al.756
Hippocampal formation
The neurogenesis of hippocampus starts prenatally andnears completion by birth, with differentiation pro-gressing from a CA1 to CA4 gradient and a dorsal toventral gradient.12 The dentate gyrus and granule cellsof the hippocampal formation; however, develop pri-marily during the ®rst three weeks after birth in therat.13 Hippocampal NGF, BDNF, and NT-3 protein levelswere not concordant with the patterns produced by theirrespective mRNA levels. Despite these differences, whenviewing neurotrophin mRNA and proteins collectively,adult-like patterns were not apparent in the hippocampusuntil PND14-21.
The plateau-like pattern at PND21 for NGF mRNAreported here, is consistent with previous ®ndings usingRPA,60 but not consistent with a peaked pattern at birthdemonstrated by northern blot.62 Unlike the NGF mRNAlevels, the hippocampal NGF protein levels peaked atPND7. The immunohistochemical pattern of hippo-campal NGF was qualitatively consistent with theELISA data presented in this study with NGF levels atPND7±21 being relatively similar but decreasing somein adulthood. These immunohistochemical data indicatethat the protein is more widely distributed throughout thehippocampal formation in cells that both presumablyproduce NGF, like dentate granule cells 6,8,25 and intheir postsynaptic targets, hilar neurons and pyramidalneurons, although a previous report has noted NGFmRNA in pyramidal cells of the hippocampus.8 Thepatterns of BDNF mRNA and protein levels are themost detailed time-course data available to date.The plateau in BDNF mRNA levels we report is in agree-ment with the relative differences between newborn andadult hippocampal mRNA levels as ascertained fromprevious northern blot data.62 The peaked pattern inBDNF protein levels at PND14±21, that we report hereis not in agreement with a plateau-like pattern reported at120 days of age in the hippocampus of male Sprague±Dawley rats50 which may be attributed to differences inthe ages of assessment, gender, and strains used in thetwo studies. Regarding the relative abundance of BDNFand NGF mRNA, Hofer et al.44 reported that the levels ofBDNF mRNA in the adult hippocampus was ,50 timeshigher than those for NGF mRNA in mice. However,Maisonpierre et al.62 reported that levels of mRNA forthe three neurotrophins were approximately equal in rats.Our results regarding relative abundance of neurotrophinmRNA in adult rats appears to be consistent with theearlier observations in adult mice.44 The plateau-likepattern observed for NT-3 mRNA is consistent with therelative differences between the newborn and adulthippocampus as determined by northern blots.62 Neitherprevious, nor current, NT-3 mRNA data is consistentwith the pattern of protein levels derived from theELISA presented in this paper. The current ELISA andimmunohistochemistry for NT-3 are not easily recon-ciled either; since the immunohistochemical patternshows a relatively wide distribution of NT-3 IR incells of the hippocampal formation which appears toincrease slightly with age. The distribution of NT-3 IR
in hippocampus appears to be relatively consistent withthe limited time-course data described in previouswork.31 It should be noted that these differences betweenELISA and immunohistochemistry data could be dueto a number variables including, differences in anti-bodies used, differences in levels of detection, andfurther, the possible labile nature of NT-3 followinghomogenization.
Cerebellum
The developmental ontogeny of cerebellum ismarkedly different from most other regions of thebrain, including neocortex and hippocampus. ThePurkinje cells arise around birth in the rat; whereas,this region's microneurons develop mainly postnatallyand continue developing through puberty, with a plateauaround weaning.3±5 The dramatic postnatal growth spurt,with its increase in neuron number and cerebellar mass,has been the focus of many studies of migration anddifferentiation (for review see Ref. 37). As expected,the temporal patterns of neurotrophin mRNA and proteinlevels demonstrated remarkable differences from theother two cortical regions examined. It should also benoted that in the cerebellum, the patterns of neurotrophinmRNAs and corresponding proteins appear to be the leastwell behaved in relation to our hypothesized correlationbetween mRNA levels and protein levels. These differ-ences between patterns of mRNA and protein levels weremost remarkable on PND7 and PND 14, with NGFprotein and NT-3 mRNA levels, respectively (Fig. 11E, F).
In cerebellum, we report an age-dependent decrease inNGF mRNA, which differs markedly from previousnorthern62 and RPA data54 reporting peaked patterns onPND10. This discrepancy may be explained by differ-ences in time of assessments between these studies. Wemay have missed the sharp increase and sharp decrease,as PND10 was not a time point assayed in this study.Interestingly, NGF protein levels demonstrate a remark-able peak at PND7, which has not been reportedpreviously, and is in contrast to the decreasing patternof the mRNA levels. The pattern of NGF-IR does notdemonstrate a clear-cut peak in labeling in any celllayer that corresponds with the peak in NGF proteinlevels. The plateau-like pattern observed in this reportfor BDNF mRNA at PND14 does not correspond directlywith the almost linear increase from PND11, 20 andadults, reported previously.62 The mixed pattern ofBDNF protein levels does not match the previous reportof a peaked pattern at PND 3050 which may also beexplained by differences in time points sampled. Thepattern of BDNF-IR and protein levels appeared to berelatively consistent. The adult distribution of BDNF-IRin Purkinje cells and granule cells is also consistent withprevious data.31 No reports, to our knowledge, detail theearly postnatal pattern of BDNF-IR in the rat cerebellum.The peaked pattern of NT-3 mRNA in this report is simi-lar to the pro®le described by Maisonpierre et al.62 Thedecreasing levels of NT-3 protein is novel informationabout the developmental pattern of this neurotrophin in
Ontogeny of neurotrophic factors in rat brain 757
cerebellum. NT-3-IR was pronounced in granule cells ofboth internal and external granule cell layers, and inPurkinje cells at the early postnatal ages; however, thepersistent NT-3-IR in granule cells and Purkinje cellseven into adulthood does not appear to parallel thedramatic decreases in protein levels seen in ELISAresults. The distribution pattern of NT-3-IR is consistentwith previous data with other antisera to NT-3.31
Regional neurotrophin levels and some methodologicalconsiderations
It has previously been established that the CNS is apredominant site of NGF, BDNF and NT-3 transcrip-tion56 and translation50 with the highest levels of bothneurotrophin mRNA 44,62 and proteins present in adultsbeing found in the hippocampus.50,85 Our RPA andELISA results concur with these previous ®ndings50,53
and, further, demonstrate signi®cant differences in thetemporal and regional pro®les of neurotrophin mRNAand proteins during postnatal development and in adult-hood that have not been characterized before.
A number of generic methodological considerationsmust be considered when trying to reconcile differencesin levels and distribution neurotrophin mRNA andproteins reported in this study and others. Factors thatmay vary among laboratories and experimental protocolsinclude differences in: (i) strain, (ii) gender, (iii) age, and(iv) detection methods. Very little work has been done tosystematically compare neurotrophin levels in differentstrains, although, anecdotal reports exist.19,87 Genderdifferences have been reported previously in some adultbrain regions,49,73 but little examination of this issue hasbeen pursued prior to and/or during sexual maturation ofthe brain. Age-related differences in neurotrophin mRNAand protein are a paramount ®nding of this paper, and thediscrepancies between this work and speci®c instances insome previous reports have already been discussed, butmay be attributed to timing and spacing of assessments.Last, and certainly not least, of the procedural concernsthat account for major differences are the methods usedto detect changes in mRNAs and proteins. Ribonucleaseprotection assays have a key advantage in that they arerelatively sensitive and speci®c as compared generally tonorthern blot analysis where the sensitivity may not be asgreat.7 For spatial localization of mRNA at the cellularlevel, in situ hybridization, while extremely useful forlocalization and detection of de®ned changes in a par-ticular cell type, may not be as ef®cient for quantitativeestimates over an entire region. Regarding methods ofdetection for proteins, the critical element, assumingspeci®c antibodies are available, is hinged on the af®nityof the antibodies/antiserum and the three dimensionalcon®guration of the epitopes being assayed. Previouscharacterization of the possible immunological overlapbetween Conner antisera to NGF with BDNF and NT-323
demonstrated cross-reactivity in slot blotting usingrhNT-3. In our hands, the Conner anti-NGFsera recog-nized rhNT-3 in western blotting, though to a muchlesser degree than it recognized rhNGF. Conner andVaron23 also suggest that denaturation with aldehyde
®xatives may increase the likelihood of cross-reactivity.Hence our immunohistochemistry using tissue withoutprior perfusion aldehyde ®xation may more accuratelydistinguish true NGF immunoreactivity. In addition, itis becoming increasingly clear that neurotrophins maynot be stored uniformly in a single compartment andthus all of the protein may not be equally available tothe same detection method. This point has been illus-trated in the increased extraction of neurotrophins andneurotrophic activity with salts and detergents.42,43 Thiswas also one of the key reasons we performed all of ourassessments on crude homogenates extracted with deter-gent and in the presence of protease inhibitors. The lastconsideration, which may be obvious to some, is thesusceptibility of proteins to ®xation40 and pH.98 In immuno-histochemical studies, there is always a ®ne balancing actbetween preservation of cytoarchitecture and preser-vation of the antigenicity of the epitope.
Biological considerations that could account for differ-ences in levels of neurotrophin mRNA and protein
Despite myriad methodological issues, a number ofbiological issues must be discussed that relate to themajor ®nding of this paper; the frequently found lackof concordance between mRNA with protein levels. Itshould be underscored that all the determinations inthis study are of static levels at single time points on agiven day. As a result, the lack of concordance may notbe all that surprising to many, and biologically plausiblefor a number of reasons. The ®rst issue to be consideredis diurnal variation. Recent data indicate that the supra-chiasmatic nucleus, a light sensitive structure, hasincreased production of BDNF mRNA during the dayand increased production of BDNF protein at night,whereas the hippocampus did not show the same rhyth-micity.58 While these ®ndings are provocative, no data todate suggest that diurinal variation is generalizable todeveloping cortical regions, especially prior to eye open-ing (PND14/15 in the rat). In addition, while datadescribing mRNA levels are important information,they do not provide an understanding of the age-dependentdynamics of mRNA transcription and stability thatunderpin the steady-state levels that are routinelymeasured. Control of neurotrophin gene expressionincludes transcription, the processing of primary tran-scripts, stability of the mRNAs, and ®nally, their transla-tion into neurotrophins.26 Regulation of transcription isimportant and can be assessed with in vitro nuclear run-on analysis.57 Data obtained from this nascent chainanalysis of cells in culture is of limited value in under-standing in vivo systems, since this technique is not prac-tical for use in whole animals. Stability of neurotrophinmRNAs can be assessed in vivo using transgenic tech-nology, wherein chimeric mRNAs, which consist of anexpression vector, an acceptor mRNA and the neuro-trophin mRNAs, can give a ª®rst approximationº ofstability of steady state levels under basal conditionsand following experimental stimuli.41
Proteins, too, are assayed at steady state levels whileundergoing dynamic changes involving translation rates,
K. P. Das et al.758
degradation, transport, and compartmentalization.27 Asnoted above, different compartments of the prepro-protein may exist for neurotrophins.42,43 These are, inpart, under physiological control,59 and add anotherdimension to the complexity and perceived discrepanciesin the levels observed in speci®c regions. Some dis-crepancy between protein and mRNA levels could beattributed to retrograde or anterograde transport of theproteins;2,21 which could create high mRNA levels andlow protein levels. While this observation did presentitself (e.g., NT-3 assessed in cerebellum), it was not theonly discordant example between mRNA and proteinlevels. In fact, the converse was also observed, whereinmRNA levels were low and protein levels were high(e.g., NGF in cerebellum). This phenomenon has beenobserved with other proteins, as in the case of acetyl-cholinesterase (AChE) expression in striatum and cere-bellum. AChE mRNA levels are relatively low instriatum and high in cerebellum; whereas, the proteinlevels are the opposite.16 In a developmental context,much of the increase in protein seems to be localizedin intrinsic neurons/circuits in the developing corticalregions, often before much extrinsic innervation entersthe structures to retrogradely transport the neurotrophinsout of the region. In addition, the colocalization of neuro-trophin receptors and neurotrophins within corticalregions51,60,67 especially during development, continuesto argue for paracrine and autocrine modulation ofdevelopmental processes within these structures during
ontogeny and provides another reason for the discord-ance observed between the mRNA and protein levels.Therefore, further investigations are needed to revealthe role of local actions of neurotrophins in neuronaldevelopment and function in the brain.
In summary, it will be increasingly important to eluci-date which of the above mentioned variables are criticalto the dynamics underlying the expression of neuro-trophic factors. In order to derive any predictive validity,models that include early changes in regional mRNAlevels must consider the caveat that mRNA levels maynot correlate with their cognate protein levels. Thepredictive relationship during development and/orfollowing damage to the nervous system betweenmRNA and presumably biologically active proteins likeneurotrophins, must be better understood.
AcknowledgementsÐThe authors are grateful for the technicalassistance of Braxton Summers, the photographic assistance ofKeith Tarpely, and the assistance of Dennis House and Dr JosephHaseman with statistical analyses. The authors are grateful for thegift of the BDNF antisera (RAB) from Dr. Qiao Yan (Amgen;Thousand Oaks, CA) and NGF antisera from Dr. J. M. Conner(University of CA; La Jolla, CA). The authors are also grateful forthe editorial comments of Drs Stephanie Padilla, W.R. Mundy,and D. Riddle on an earlier draft of this manuscript. Thismanuscript was reviewed by the NHEERL, U.S. EnvironmentalProtection Agency, and approved for publication. Mention oftrade names or commercial products does not constituteendorsement or recommendation for use.
REFERENCES
1. Allendoerfer K. L., Cabelli R. J., EscandoÂn E., Kaplan D. R., Nikolics K. and Shatz C. J. (1994) Regulation of neurotrophin receptors during thematuration of the mammalian visual system. J. Neurosci. 14, 1795±1811.
2. Altar C. A. and DiStefano P. S. (1998) Neurotrophin traf®cking by anterograde transport. Trends Neurosci. 21, 433±437.3. Altman J. (1972) Postnatal development of the cerebellar cortex in the rat. I. The external germinal layer and the transitional molecular layer.
J. comp. Neurol. 145, 353±397.4. Altman J. (1972) Postnatal development of the cerebellar cortex in the rat. II. Phases in the maturation of Purkinje cells and of the molecular
layer. J. comp. Neurol. 145, 399±463.5. Altman J. (1972) Postnatal development of the cerebellar cortex in the rat. III. Maturation of the components of the granular layer. J. comp.
Neurol. 145, 465±513.6. Ayer-LeLievre C., Olson L., Ebendal T., Seiger A. and Persson H. (1988) Expression of the beta-nerve growth factor gene in hippocampal
neurons. Science 240, 1339±1341.7. Bader M., Kaling M., Metzger R., Peters J., Wagner J. and Ganten D. (1992) Basic methodology in the molecular characterization of genes.
J. Hypertens. 10, 9±16.8. Bandtlow C. E., Meyer M., Lindholm D., Spranger M., Heumann R. and Thoenen H. (1990) Regional and cellular codistribution of interleukin 1 beta and
nerve growth factor mRNA in the adult rat brain: possible relationship to the regulation of nerve growth factor synthesis. J. Cell Biol. 111, 1701±1711.9. Barbacid M. (1994) The Trk family of neurotrophin receptors. J. Neurobiol. 25, 1386±1403.
10. Barde Y. A. (1989) Trophic factors and neuronal survival. Neuron 2, 1525±1534.11. Barone S. Jr, Haykal-Coates N., Parran D. K. and Tilson H. A. (1998) Gestational exposure to methylmercury alters the developmental pattern
of trk-like immunoreactivity in the rat brain and results in cortical dysmorphology. Devl Brain Res. 109, 13±31.12. Bayer S. A. (1980) Development of the hippocampal region in the rat. I. Neurogenesis examined with 3H-thymidine autoradiography. J. comp.
Neurol. 190, 87±114.13. Bayer S. A. (1980) Development of the hippocampal region in the rat. II. Morphogenesis during embryonic and early postnatal life. J. comp.
Neurol. 190, 115±134.14. Bayer S. A., Altman J., Russo R. J. and Zhang X. (1993) Timetables of neurogenesis in the human brain based on experimentally determined
patterns in the rat. Neurotoxicology 14, 83±144.15. Binder D. K., Routbort M. J. and McNamara J. O. (1999) Immunohistochemical evidence of seizure-induced activation of trk receptors in the
mossy ®ber pathway of adult rat hippocampus. J. Neurosci. 19, 4616±4626.16. Brimijoin S. and Hammond P. (1996) Transient expression of acetylcholinesterase messenger RNA and enzyme activity in developing rat
thalamus studied by quantitative histochemistry and in situ hybridization. Neuroscience 71, 555±565.17. Cabelli R. J., Shelton D. L., Segal R. A. and Shatz C. J. (1997) Blockade of endogenous ligands of trkB inhibits formation of ocular dominance
columns. Neuron 19, 63±76.18. Carmignoto G., Canella R., Candeo P., Comelli M. C. and Maffei L. (1993) Effects of nerve growth factor on neuronal plasticity of the kitten
visual cortex. J. Physiol., Lond. 464, 343±360.19. Charchar F. J., Kapuscinski M. K. and Harrap S. B. (1998) Nerve growth factor gene locus explains elevated renal nerve growth factor mRNA in
young spontaneously hypertensive rats. Hypertension 32, 705±709.
Ontogeny of neurotrophic factors in rat brain 759
20. Clary D. O., Weskamp G., Austin L. R. and Reichardt L. F. (1994) TrkA cross-linking mimics neuronal responses to nerve growth factor. Molec.Biol. Cell 5, 549±563.
21. Conner J. M., Lauterborn J. C. and Gall C. M. (1998) Anterograde transport of neurotrophin proteins in the CNSÐa reassessment of theneurotrophic hypothesis. Rev. Neurosci. 9, 91±103.
22. Conner J. M., Muir D., Varon S., Hagg T. and Manthorpe M. (1992) The localization of nerve growth factor-like immunoreactivity in the adultrat basal forebrain and hippocampal formation. J. comp. Neurol. 319, 454±462.
23. Conner J. M. and Varon S. (1996) Characterization of antibodies to nerve growth factor: assay-dependent variability in the cross-reactivity withother neurotrophins. J. Neurosci. Meth. 65, 93±99.
24. Conner J. M. and Varon S. (1997) Developmental pro®le of NGF immunoreactivity in the rat brain: a possible role of NGF in the establishmentof cholinergic terminal ®elds in the hippocampus and cortex. Devl Brain Res. 101, 67±79.
25. da Penha B., Cooper J., CastreÂn E., Zafra F., Sofroniew M., Thoenen H. and Lindholm D. (1993) Cholinergic regulation of brain-derivedneurotrophic factor (BDNF) and nerve growth factor (NGF) but not neurotrophin-3 (NT-3) mRNA levels in the developing rat hippocampus.J. Neurosci. 13, 3818±3826.
26. Day D. A. and Tuite M. F. (1998) Post-transcriptional gene regulatory mechanisms in eukaryotes: an overview. J. Endocrinol. 157, 361±371.27. Dice J. F. (1987) Molecular determinants of protein half-lives in eukaryotic cells. Fedn Am. Socs exp. Biol. 1, 349±357.28. Ernfors P., IbaÂnÄez C. F., Ebendal T., Olson L. and Persson H. (1990) Molecular cloning and neurotrophic activities of a protein with structural
similarities to nerve growth factor: developmental and topographical expression in the brain. Proc. natn. Acad. Sci. USA 87, 5454±5458.29. Ferencz I., Kokaia M., Keep M., Elmer E., Metsis M., Kokaia Z. and Lindvall O. (1997) Effects of cholinergic denervation on seizure
development and neurotrophin messenger RNA regulation in rapid hippocampal kindling. Neuroscience 80, 389±399.30. French S. J., Humby T., Horner C. H., Sofroniew M. V. and Rattray M. (1999) Hippocampal neurotrophin and trk receptor mRNA levels are
altered by local administration of nicotine, carbachol and pilocarpine. Molec. Brain Res. 67, 124±136.31. Friedman W. J., Black I. B. and Kaplan D. R. (1998) Distribution of the neurotrophins brain-derived neurotrophic factor, neurotrophin-3, and
neurotrophin-4/5 in the postnatal rat brain: an immunocytochemical study. Neuroscience 84, 101±114.32. Gall C., Lauterborn J., Bundman M., Murray K. and Isackson P. (1991) Seizures and the regulation of neurotrophic factor and neuropeptide gene
expression in brain. Epilepsy Res. Suppl. 4, 225±245.33. Gall C. M. (1993) Seizure-induced changes in neurotrophin expression: implications for epilepsy. Expl Neurol. 124, 150±166.34. Gall C. M., Lauterborn J. C., Guthrie K. M. and Stinis C. T. (1997) Seizures and the regulation of neurotrophic factor expression: associations
with structural plasticity in epilepsy. Adv. Neurol. 72, 9±24.35. Geisser S. and Grover L. M. (1958) An extension of Box's results on the use of the F distribution in multivariate analysis. Annls Math. Stat. 29,
885±891.36. Gibbs R. B. and Pfaff D. W. (1994) In situ hybridization detection of trkA mRNA in brain: distribution, colocalization with p75NGFR and up-
regulation by nerve growth factor. J. comp. Neurol. 341, 324±339.37. Goldowitz D. and Hamre K. (1998) The cells and molecules that make a cerebellum. Trends Neurosci. 21, 375±382.38. Greenhouse S. W. and Geisser S. (1959) On methods in the analysis of pro®le data. Psychometrika 24, 95±112.39. Harlow E. and Lane D. (1988) Antibody A Laboratory Manual, Cold Spring Harbor Laboratory, New York.40. Hazen-Martin D. J. and Simson J. A. (1984) Immunocytochemical localization of nerve growth factor: effects of ®xation. J. Histochem.
Cytochem. 32, 30±36.41. Heinrich G. and Martin S. (1993) Molecular analysis of neurotrophin genes. In: Boulton A. A. and Baker G. B. and Hefti F. (Eds.). Neurotrophic
Factors, Humana, Totowa, NJ.42. Hoener M. C., Hewitt E., Conner J. M., Costello J. W. and Varon S. (1996) Nerve growth factor (NGF) content in adult rat brain tissues is
several-fold higher than generally reported and is largely associated with sedimentable fractions. Brain Res. 728, 47±56.43. Hoener M. C. and Varon S. (1997) Reversible sedimentation and masking of nerve growth factor (NGF) antigen by high molecular weight
fractions from rat brain. Brain Res. 772, 1±8.44. Hofer M., Pagliusi S. R., Hohn A., Leibrock J. and Barde Y. A. (1990) Regional distribution of brain-derived neurotrophic factor mRNA in the
adult mouse brain. Eur. molec. Biol. Org. J. 9, 2459±2464.45. Hohn A., Leibrock J., Bailey K. and Barde Y. A. (1990) Identi®cation and characterization of a novel member of the nerve growth factor/brain-
derived neurotrophic factor family. Nature 344, 339±341.46. Jing S., Tapley P. and Barbacid M. (1992) Nerve growth factor mediates signal transduction through trk homodimer receptors. Neuron 9, 1067±1079.47. Jones K. R. and Reichardt L. F. (1990) Molecular cloning of a human gene that is a member of the nerve growth factor family. Proc. natn. Acad.
Sci. USA 87, 8060±8064.48. Jongstra-Bilen J., Coblentz L. and Shooter E. M. (1989) The in vitro processing of the NGF precursors by the gamma-subunit of the 7S NGF
complex. Molec. Brain Res. 5, 159±169.49. Katoh-Semba R., Semba R., Kato H., Ueno M., Arakawa Y. and Kato K. (1994) Regulation by androgen of levels of the beta subunit of nerve
growth factor and its mRNA in selected regions of the mouse brain. J. Neurochem. 62, 2141±2147.50. Katoh-Semba R., Takeuchi I. K., Semba R. and Kato K. (1997) Distribution of brain-derived neurotrophic factor in rats and its changes with
development in the brain. J. Neurochem. 69, 34±42.51. Kokaia Z., Bengzon J., Metsis M., Kokaia M., Persson H. and Lindvall O. (1993) Coexpression of neurotrophins and their receptors in neurons
of the central nervous system. Proc. natl. Acad. Sci. USA 90, 6711±6715.52. Kornblum H. I., Sankar R., Shin D. H., Wasterlain C. G. and Gall C. M. (1997) Induction of brain derived neurotrophic factor mRNA by
seizures in neonatal and juvenile rat brain. Molec. Brain Res. 44, 219±228.53. Korsching S., Auburger G., Heumann R., Scott J. and Thoenen H. (1985) Levels of nerve growth factor and its mRNA in the central nervous
system of the rat correlate with cholinergic innervation. Eur. molec. Biol. Org. J. 4, 1389±1393.54. Lauterborn J. C., Isackson P. J. and Gall C. M. (1991) Nerve growth factor mRNA-containing cells are distributed within regions of cholinergic
neurons in the rat basal forebrain. J. comp. Neurol. 306, 439±446.55. Lauterborn J. C., Isackson P. J. and Gall C. M. (1994) Cellular localization of NGF and NT-3 mRNAs in postnatal rat forebrain. Molec. Cell
Neurosci. 5, 46±62.56. Leibrock J., Lottspeich F., Hohn A., Hofer M., Hengerer B., Masiakowski P., Thoenen H. and Barde Y. A. (1989) Molecular cloning and
expression of brain-derived neurotrophic factor. Nature 341, 149±152.57. Leingartner A. and Lindholm D. (1994) Two promoters direct transcription of the mouse NT-3 gene. Eur. J. Neurosci. 6, 1149±1159.58. Liang F. Q., Walline R. and Earnest D. J. (1998) Circadian rhythm of brain-derived neurotrophic factor in the rat suprachiasmatic nucleus.
Neurosci. Lett. 242, 89±92.59. Lindholm D., Castren E., Berzaghi M., Blochl A. and Thoenen H. (1994) Activity-dependent and hormonal regulation of neurotrophin mRNA
levels in the brainÐimplications for neuronal plasticity. J. Neurobiol. 25, 1362±1372.
K. P. Das et al.760
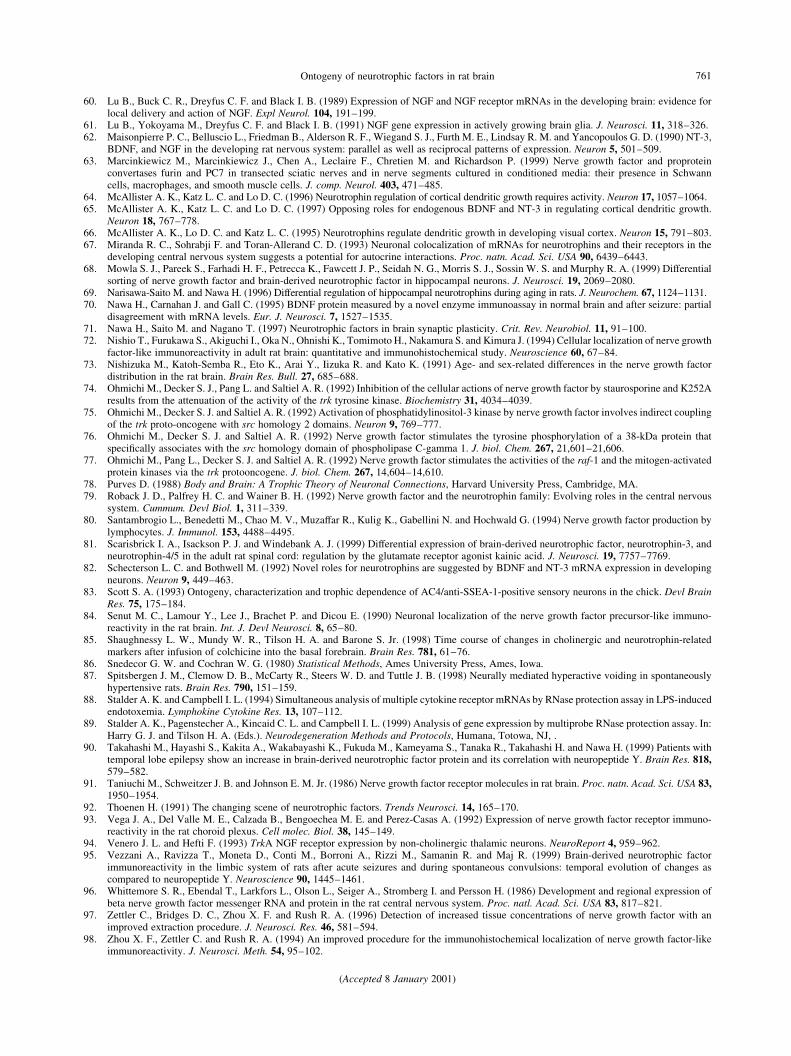
60. Lu B., Buck C. R., Dreyfus C. F. and Black I. B. (1989) Expression of NGF and NGF receptor mRNAs in the developing brain: evidence forlocal delivery and action of NGF. Expl Neurol. 104, 191±199.
61. Lu B., Yokoyama M., Dreyfus C. F. and Black I. B. (1991) NGF gene expression in actively growing brain glia. J. Neurosci. 11, 318±326.62. Maisonpierre P. C., Belluscio L., Friedman B., Alderson R. F., Wiegand S. J., Furth M. E., Lindsay R. M. and Yancopoulos G. D. (1990) NT-3,
BDNF, and NGF in the developing rat nervous system: parallel as well as reciprocal patterns of expression. Neuron 5, 501±509.63. Marcinkiewicz M., Marcinkiewicz J., Chen A., Leclaire F., Chretien M. and Richardson P. (1999) Nerve growth factor and proprotein
convertases furin and PC7 in transected sciatic nerves and in nerve segments cultured in conditioned media: their presence in Schwanncells, macrophages, and smooth muscle cells. J. comp. Neurol. 403, 471±485.
64. McAllister A. K., Katz L. C. and Lo D. C. (1996) Neurotrophin regulation of cortical dendritic growth requires activity. Neuron 17, 1057±1064.65. McAllister A. K., Katz L. C. and Lo D. C. (1997) Opposing roles for endogenous BDNF and NT-3 in regulating cortical dendritic growth.
Neuron 18, 767±778.66. McAllister A. K., Lo D. C. and Katz L. C. (1995) Neurotrophins regulate dendritic growth in developing visual cortex. Neuron 15, 791±803.67. Miranda R. C., Sohrabji F. and Toran-Allerand C. D. (1993) Neuronal colocalization of mRNAs for neurotrophins and their receptors in the
developing central nervous system suggests a potential for autocrine interactions. Proc. natn. Acad. Sci. USA 90, 6439±6443.68. Mowla S. J., Pareek S., Farhadi H. F., Petrecca K., Fawcett J. P., Seidah N. G., Morris S. J., Sossin W. S. and Murphy R. A. (1999) Differential
sorting of nerve growth factor and brain-derived neurotrophic factor in hippocampal neurons. J. Neurosci. 19, 2069±2080.69. Narisawa-Saito M. and Nawa H. (1996) Differential regulation of hippocampal neurotrophins during aging in rats. J. Neurochem. 67, 1124±1131.70. Nawa H., Carnahan J. and Gall C. (1995) BDNF protein measured by a novel enzyme immunoassay in normal brain and after seizure: partial
disagreement with mRNA levels. Eur. J. Neurosci. 7, 1527±1535.71. Nawa H., Saito M. and Nagano T. (1997) Neurotrophic factors in brain synaptic plasticity. Crit. Rev. Neurobiol. 11, 91±100.72. Nishio T., Furukawa S., Akiguchi I., Oka N., Ohnishi K., Tomimoto H., Nakamura S. and Kimura J. (1994) Cellular localization of nerve growth
factor-like immunoreactivity in adult rat brain: quantitative and immunohistochemical study. Neuroscience 60, 67±84.73. Nishizuka M., Katoh-Semba R., Eto K., Arai Y., Iizuka R. and Kato K. (1991) Age- and sex-related differences in the nerve growth factor
distribution in the rat brain. Brain Res. Bull. 27, 685±688.74. Ohmichi M., Decker S. J., Pang L. and Saltiel A. R. (1992) Inhibition of the cellular actions of nerve growth factor by staurosporine and K252A
results from the attenuation of the activity of the trk tyrosine kinase. Biochemistry 31, 4034±4039.75. Ohmichi M., Decker S. J. and Saltiel A. R. (1992) Activation of phosphatidylinositol-3 kinase by nerve growth factor involves indirect coupling
of the trk proto-oncogene with src homology 2 domains. Neuron 9, 769±777.76. Ohmichi M., Decker S. J. and Saltiel A. R. (1992) Nerve growth factor stimulates the tyrosine phosphorylation of a 38-kDa protein that
speci®cally associates with the src homology domain of phospholipase C-gamma 1. J. biol. Chem. 267, 21,601±21,606.77. Ohmichi M., Pang L., Decker S. J. and Saltiel A. R. (1992) Nerve growth factor stimulates the activities of the raf-1 and the mitogen-activated
protein kinases via the trk protooncogene. J. biol. Chem. 267, 14,604±14,610.78. Purves D. (1988) Body and Brain: A Trophic Theory of Neuronal Connections, Harvard University Press, Cambridge, MA.79. Roback J. D., Palfrey H. C. and Wainer B. H. (1992) Nerve growth factor and the neurotrophin family: Evolving roles in the central nervous
system. Cummum. Devl Biol. 1, 311±339.80. Santambrogio L., Benedetti M., Chao M. V., Muzaffar R., Kulig K., Gabellini N. and Hochwald G. (1994) Nerve growth factor production by
lymphocytes. J. Immunol. 153, 4488±4495.81. Scarisbrick I. A., Isackson P. J. and Windebank A. J. (1999) Differential expression of brain-derived neurotrophic factor, neurotrophin-3, and
neurotrophin-4/5 in the adult rat spinal cord: regulation by the glutamate receptor agonist kainic acid. J. Neurosci. 19, 7757±7769.82. Schecterson L. C. and Bothwell M. (1992) Novel roles for neurotrophins are suggested by BDNF and NT-3 mRNA expression in developing
neurons. Neuron 9, 449±463.83. Scott S. A. (1993) Ontogeny, characterization and trophic dependence of AC4/anti-SSEA-1-positive sensory neurons in the chick. Devl Brain
Res. 75, 175±184.84. Senut M. C., Lamour Y., Lee J., Brachet P. and Dicou E. (1990) Neuronal localization of the nerve growth factor precursor-like immuno-
reactivity in the rat brain. Int. J. Devl Neurosci. 8, 65±80.85. Shaughnessy L. W., Mundy W. R., Tilson H. A. and Barone S. Jr. (1998) Time course of changes in cholinergic and neurotrophin-related
markers after infusion of colchicine into the basal forebrain. Brain Res. 781, 61±76.86. Snedecor G. W. and Cochran W. G. (1980) Statistical Methods, Ames University Press, Ames, Iowa.87. Spitsbergen J. M., Clemow D. B., McCarty R., Steers W. D. and Tuttle J. B. (1998) Neurally mediated hyperactive voiding in spontaneously
hypertensive rats. Brain Res. 790, 151±159.88. Stalder A. K. and Campbell I. L. (1994) Simultaneous analysis of multiple cytokine receptor mRNAs by RNase protection assay in LPS-induced
endotoxemia. Lymphokine Cytokine Res. 13, 107±112.89. Stalder A. K., Pagenstecher A., Kincaid C. L. and Campbell I. L. (1999) Analysis of gene expression by multiprobe RNase protection assay. In:
Harry G. J. and Tilson H. A. (Eds.). Neurodegeneration Methods and Protocols, Humana, Totowa, NJ, .90. Takahashi M., Hayashi S., Kakita A., Wakabayashi K., Fukuda M., Kameyama S., Tanaka R., Takahashi H. and Nawa H. (1999) Patients with
temporal lobe epilepsy show an increase in brain-derived neurotrophic factor protein and its correlation with neuropeptide Y. Brain Res. 818,579±582.
91. Taniuchi M., Schweitzer J. B. and Johnson E. M. Jr. (1986) Nerve growth factor receptor molecules in rat brain. Proc. natn. Acad. Sci. USA 83,1950±1954.
92. Thoenen H. (1991) The changing scene of neurotrophic factors. Trends Neurosci. 14, 165±170.93. Vega J. A., Del Valle M. E., Calzada B., Bengoechea M. E. and Perez-Casas A. (1992) Expression of nerve growth factor receptor immuno-
reactivity in the rat choroid plexus. Cell molec. Biol. 38, 145±149.94. Venero J. L. and Hefti F. (1993) TrkA NGF receptor expression by non-cholinergic thalamic neurons. NeuroReport 4, 959±962.95. Vezzani A., Ravizza T., Moneta D., Conti M., Borroni A., Rizzi M., Samanin R. and Maj R. (1999) Brain-derived neurotrophic factor
immunoreactivity in the limbic system of rats after acute seizures and during spontaneous convulsions: temporal evolution of changes ascompared to neuropeptide Y. Neuroscience 90, 1445±1461.
96. Whittemore S. R., Ebendal T., Larkfors L., Olson L., Seiger A., Stromberg I. and Persson H. (1986) Development and regional expression ofbeta nerve growth factor messenger RNA and protein in the rat central nervous system. Proc. natl. Acad. Sci. USA 83, 817±821.
97. Zettler C., Bridges D. C., Zhou X. F. and Rush R. A. (1996) Detection of increased tissue concentrations of nerve growth factor with animproved extraction procedure. J. Neurosci. Res. 46, 581±594.
98. Zhou X. F., Zettler C. and Rush R. A. (1994) An improved procedure for the immunohistochemical localization of nerve growth factor-likeimmunoreactivity. J. Neurosci. Meth. 54, 95±102.
(Accepted 8 January 2001)
Ontogeny of neurotrophic factors in rat brain 761
Related Documents