Vol. 21, No. 7, 2008 / 891 MPMI Vol. 21, No. 7, 2008, pp. 891–908. doi:10.1094/ MPMI -21-7-0891. © 2008 The American Phytopathological Society Differential Gene Expression Between the Biotrophic-Like and Saprotrophic Mycelia of the Witches’ Broom Pathogen Moniliophthora perniciosa Johana Rincones, 1 Leandra M. Scarpari, 1 Marcelo F. Carazzolle, 1 Jorge M. C. Mondego, 1 Eduardo F. Formighieri, 1 Joan G. Barau, 1 Gustavo G. L. Costa, 1 Dirce M. Carraro, 2 Helena P. Brentani, 2 Laurival A. Vilas-Boas, 3 Bruno V. de Oliveira, 1 Maricene Sabha, 1 Robson Dias, 4 Júlio M. Cascardo, 4 Ricardo A. Azevedo, 5 Lyndel W. Meinhardt, 6 and Gonçalo A. G. Pereira 1 1 Laboratório de Genômica e Expressão, Departamento de Genética e Evolução, Instituto de Biologia, Universidade Estadual de Campinas, CP 6109, Campinas 13083-970, São Paulo, Brazil; 2 Laboratório de Genômica e Biologia Molecular, Centro de Pesquisa Hospital A. C. Camargo, Rua Prof. Antonio Prudente 109, 1° andar, São Paulo city 01509-010, São Paulo, Brazil; 3 Laboratório de Virologia e Bacteriologia de Plantas, Instituto Agronômico do Parana—IAPAR, Londrina 86047-902, Paraná, Brazil; 4 Laboratório de Genômica e Expressão Gênica, Departamento de Genética e Biologia Molecular, Universidade Estadual de Santa Cruz, Ilhéus 45650-000, Bahia, Brazil; 5 Laboratório de Bioquímica de Plantas, Departamento de Genética, Escola Superior de Agricultura Luiz de Queiroz, Universidade de São Paulo, Piracicaba 13400- 970, São Paulo, Brazil; 6 Sustainable Perennial Crops Laboratory, United States Department of Agriculture–Agricultural Research Service, 10300 Baltimore Ave., Bldg. 001, Beltsville, MD 20705-2350, U.S.A. Submitted 11 December 2007. Accepted 3 March 2008. Moniliophthora perniciosa is a hemibiotrophic fungus that causes witches’ broom disease (WBD) in cacao. Marked dimorphism characterizes this fungus, showing a mono- karyotic or biotrophic phase that causes disease symptoms and a later dikaryotic or saprotrophic phase. A combined strategy of DNA microarray, expressed sequence tag, and real-time reverse-transcriptase polymerase chain reaction analyses was employed to analyze differences between these two fungal stages in vitro. In all, 1,131 putative genes were hybridized with cDNA from different phases, result- ing in 189 differentially expressed genes, and 4,595 reads were clusterized, producing 1,534 unigenes. The analysis of these genes, which represent approximately 21% of the total genes, indicates that the biotrophic-like phase undergoes carbon and nitrogen catabolite repression that correlates to the expression of phytopathogenicity genes. Moreover, downregulation of mitochondrial oxidative phosphoryla- tion and the presence of a putative ngr1 of Saccharomyces cerevisiae could help explain its lower growth rate. In con- trast, the saprotrophic mycelium expresses genes related to the metabolism of hexoses, ammonia, and oxidative phos- phorylation, which could explain its faster growth. Anti- fungal toxins were upregulated and could prevent the colonization by competing fungi. This work significantly contributes to our understanding of the molecular mecha- nisms of WBD and, to our knowledge, is the first to analyze differential gene expression of the different phases of a hemibiotrophic fungus. Additional keywords: DNA microarrays. Moniliophthora perniciosa (Aime and Phillips-Mora 2005) (Agaricales, Marasmiaceae) is the causal agent of witches’ broom disease (WBD) of cacao (Theobroma cacao). This basidiomycete fungus is a sister taxon of M. roreri, the causal agent of frosty pod rot. Together, these fungal pathogens cause the two more devastating diseases of cacao in the Americas. In Brazil, WBD was introduced to the cacao-producing region of southeastern Bahia in the 1980s (Pereira et al. 1989). Since then, production of this commodity has dropped by more than half (Brazilian Ministry of Agriculture 2005) and resulted in major socioeconomic and environmental problems for the region (Griffith et al. 2003; Pereira et al. 1996; Purdy and Schmidt 1996). The biology of the M. perniciosa–cacao interaction is com- plex and molecular studies have only recently begun. A draft of the genome has been established by our group based on a twofold coverage derived from shotgun libraries of total DNA. This databank is currently used for gene discovery and to sup- port gene expression experiments, such as expressed sequence tag (EST) analysis and DNA microarrays. M. perniciosa exhibits a hemibiotrophic life cycle that paral- lels the symptoms in the plant: a monokaryotic biotrophic my- celium, without clamp connections, is formed after basidio- spore germination and infects flower cushions, developing fruit, and vegetative flushes. In this case, the infection causes hypertrophy, hyperplasy, and loss of apical dominance, pro- ducing a characteristic green broom (Evans 1978, 1980). In spite of these symptoms, the biotrophic hyphae are found in low density inside the infected plant tissues (Penman et al. 2000) and grow slowly in the intercellular space (Silva and Matsuoka 1999). During the biotrophic phase, the infected Corresponding author: G. A. P. Pereira; Telephone: +55 19 35216650; Fax: +55 19 35216235. E-mail: [email protected] GenBank accession numbers. dbEST: EY219053 through EY223257; dbGSS: ET065114 through ET065303; GEO: GSM243318 through GSM243333 (samples); GPL6148 and GPL6149 (platforms), GSE9626, GSE9627, and GSE9701 (series). * The e -Xtra logo stands for “electronic extra” and indicates four supple- mentary documents listing GenBank accession numbers and describing annotation and nomenclature are published online. e - Xt ra *

Welcome message from author
This document is posted to help you gain knowledge. Please leave a comment to let me know what you think about it! Share it to your friends and learn new things together.
Transcript
Vol. 21, No. 7, 2008 / 891
MPMI Vol. 21, No. 7, 2008, pp. 891–908. doi:10.1094 / MPMI -21-7-0891. © 2008 The American Phytopathological Society
Differential Gene Expression Between the Biotrophic-Like and Saprotrophic Mycelia of the Witches’ Broom Pathogen Moniliophthora perniciosa
Johana Rincones,1 Leandra M. Scarpari,1 Marcelo F. Carazzolle,1 Jorge M. C. Mondego,1 Eduardo F. Formighieri,1 Joan G. Barau,1 Gustavo G. L. Costa,1 Dirce M. Carraro,2 Helena P. Brentani,2 Laurival A. Vilas-Boas,3 Bruno V. de Oliveira,1 Maricene Sabha,1 Robson Dias,4 Júlio M. Cascardo,4 Ricardo A. Azevedo,5 Lyndel W. Meinhardt,6 and Gonçalo A. G. Pereira1 1Laboratório de Genômica e Expressão, Departamento de Genética e Evolução, Instituto de Biologia, Universidade Estadual de Campinas, CP 6109, Campinas 13083-970, São Paulo, Brazil; 2Laboratório de Genômica e Biologia Molecular, Centro de Pesquisa Hospital A. C. Camargo, Rua Prof. Antonio Prudente 109, 1° andar, São Paulo city 01509-010, São Paulo, Brazil; 3Laboratório de Virologia e Bacteriologia de Plantas, Instituto Agronômico do Parana—IAPAR, Londrina 86047-902, Paraná, Brazil; 4Laboratório de Genômica e Expressão Gênica, Departamento de Genética e Biologia Molecular, Universidade Estadual de Santa Cruz, Ilhéus 45650-000, Bahia, Brazil; 5Laboratório de Bioquímica de Plantas, Departamento de Genética, Escola Superior de Agricultura Luiz de Queiroz, Universidade de São Paulo, Piracicaba 13400-970, São Paulo, Brazil; 6Sustainable Perennial Crops Laboratory, United States Department of Agriculture–Agricultural Research Service, 10300 Baltimore Ave., Bldg. 001, Beltsville, MD 20705-2350, U.S.A.
Submitted 11 December 2007. Accepted 3 March 2008.
Moniliophthora perniciosa is a hemibiotrophic fungus that causes witches’ broom disease (WBD) in cacao. Marked dimorphism characterizes this fungus, showing a mono-karyotic or biotrophic phase that causes disease symptoms and a later dikaryotic or saprotrophic phase. A combined strategy of DNA microarray, expressed sequence tag, and real-time reverse-transcriptase polymerase chain reaction analyses was employed to analyze differences between these two fungal stages in vitro. In all, 1,131 putative genes were hybridized with cDNA from different phases, result-ing in 189 differentially expressed genes, and 4,595 reads were clusterized, producing 1,534 unigenes. The analysis of these genes, which represent approximately 21% of the total genes, indicates that the biotrophic-like phase undergoes carbon and nitrogen catabolite repression that correlates to the expression of phytopathogenicity genes. Moreover, downregulation of mitochondrial oxidative phosphoryla-tion and the presence of a putative ngr1 of Saccharomyces cerevisiae could help explain its lower growth rate. In con-trast, the saprotrophic mycelium expresses genes related to the metabolism of hexoses, ammonia, and oxidative phos-phorylation, which could explain its faster growth. Anti-fungal toxins were upregulated and could prevent the colonization by competing fungi. This work significantly contributes to our understanding of the molecular mecha-nisms of WBD and, to our knowledge, is the first to analyze
differential gene expression of the different phases of a hemibiotrophic fungus.
Additional keywords: DNA microarrays.
Moniliophthora perniciosa (Aime and Phillips-Mora 2005) (Agaricales, Marasmiaceae) is the causal agent of witches’ broom disease (WBD) of cacao (Theobroma cacao). This basidiomycete fungus is a sister taxon of M. roreri, the causal agent of frosty pod rot. Together, these fungal pathogens cause the two more devastating diseases of cacao in the Americas. In Brazil, WBD was introduced to the cacao-producing region of southeastern Bahia in the 1980s (Pereira et al. 1989). Since then, production of this commodity has dropped by more than half (Brazilian Ministry of Agriculture 2005) and resulted in major socioeconomic and environmental problems for the region (Griffith et al. 2003; Pereira et al. 1996; Purdy and Schmidt 1996).
The biology of the M. perniciosa–cacao interaction is com-plex and molecular studies have only recently begun. A draft of the genome has been established by our group based on a twofold coverage derived from shotgun libraries of total DNA. This databank is currently used for gene discovery and to sup-port gene expression experiments, such as expressed sequence tag (EST) analysis and DNA microarrays.
M. perniciosa exhibits a hemibiotrophic life cycle that paral-lels the symptoms in the plant: a monokaryotic biotrophic my-celium, without clamp connections, is formed after basidio-spore germination and infects flower cushions, developing fruit, and vegetative flushes. In this case, the infection causes hypertrophy, hyperplasy, and loss of apical dominance, pro-ducing a characteristic green broom (Evans 1978, 1980).
In spite of these symptoms, the biotrophic hyphae are found in low density inside the infected plant tissues (Penman et al. 2000) and grow slowly in the intercellular space (Silva and Matsuoka 1999). During the biotrophic phase, the infected
Corresponding author: G. A. P. Pereira; Telephone: +55 19 35216650;Fax: +55 19 35216235. E-mail: [email protected]
GenBank accession numbers. dbEST: EY219053 through EY223257;dbGSS: ET065114 through ET065303; GEO: GSM243318 throughGSM243333 (samples); GPL6148 and GPL6149 (platforms), GSE9626,GSE9627, and GSE9701 (series).
*The e-Xtra logo stands for “electronic extra” and indicates four supple-mentary documents listing GenBank accession numbers and describingannotation and nomenclature are published online.
e-Xtra*
892 / Molecular Plant-Microbe Interactions
tissue seems to be under intense oxidative stress, indicated by the increase in lipid peroxidation (Scarpari et al. 2005) and eventual production of reactive oxygen species (ROS) (Gratao et al. 2005), such as hydrogen peroxide produced by the enzy-matic degradation of calcium oxalate crystals found in infected susceptible cacao plants (Ceita et al. 2007).
During the second stage, the infected plant tissue turns ne-crotic (dry brooms) and the fungus displays a dikaryotic sapro-trophic or necrotrophic mycelium, with clamp connections. Contrary to the biotrophic hyphae, the saprotrophic mycelia grow vigorously, quickly colonizing the broom and completely destroying the vegetal tissues (Evans 1980). Elucidating the mechanisms responsible for the change from the biotrophic to the saprotrophic or necrotrophic phase of the fungus and understanding whether the death of the infected cacao tissue is a consequence or precedes this change in fungal physiology is a central question that remains to be answered. Finally, the ne-crotrophic mycelia eventually develop into basidiomes, which produce spores and complete the fungal life cycle (Evans 1980; Lawrence et al. 1991).
A detailed biochemical study of the cacao–M. perniciosa interaction was published by our group (Scarpari et al. 2005). A systematic analysis of the changes in the contents of soluble sugars, amino acids, alkaloids, ethylene, phenolics, tannins, flavonoids, pigments, malondialdehyde (MDA), glycerol, and fatty acids in cacao shoots during the development of WBD was performed and revealed a concerted number of biochemi-cal alterations in the infected plant. These responses appear to be modulated by the production of ethylene, which may play an important role in broom development. Additionally, green brooms exhibited significantly higher amounts of glycerol than dry brooms or uninfected tissues, suggesting that this compound could play a key role in the maintenance of the biotrophic phase of the fungus in the plant. Subsequently, it was established that monokaryotic cultures could be maintained when glycerol was used as the sole carbon source in axenic cultures and that the fungus rapidly changed into the saprotrophic or necrotro-phic phase when several other carbon sources (sorbitol, manitol, fructose, sucrose, glucose, and ethanol) were used in the growth medium, independently of their concentration (0.1 to 2%) (Meinhardt et al. 2006). This monokaryotic mycelium of M. perniciosa grown in vitro was termed “biotrophic-like phase” because it had all of the characteristics of the biotrophic phase in planta (Meinhardt et al. 2006). These studies have shed light on the complexity of the biochemical interactions that occur between the plant and the pathogen during the development of WBD, but the question remains: How does the fungus cause or modulate the responses in the plant?
In the present work, we used DNA microarray analysis, EST sequencing, and real-time polymerase chain reaction (PCR) in order to study differential gene expression between the biotro-phic-like and saprotrophic stages of the fungus, grown in vitro in the presence of cacao extracts. This work is the first to ana-lyze differential gene expression between the infective (biotro-phic) and the saprotrophic stages of a hemibiotrophic fungal pathogen. The results indicate different carbon and nitrogen metabolisms between the two mycelial stages and sheds light on the metabolic pathways that could be essential for the pathogenicity of this hemibiotrophic basidiomycete.
RESULTS
DNA microarray hybridization. DNA microarrays were prepared using 2,304 putative genes
of M. perniciosa identified from the draft genome. We selected genes with similarity to proteins annotated in GenBank (BLASTx, e value ≤ 1E-05). All these genomic survey sequence
data have been submitted to the dbGSS of GenBank database under accession numbers ET065114 to ET065303, ET163645 to ET165559, and ET165560 to ET165565 (Supplementary Data A). With this first approach, our goal was to understand the differential gene expression of known genes during the biotrophic-like and saprotrophic phases of M. perniciosa. Both mycelial phases were obtained from isolate BP10 grown in glycerol supplemented with cacao-meristem extract (A-Sap-CM and A-Bio-CM, respectively), a mixture of components that has been shown to maintain the biotrophic-like mycelia (Meinhardt et al. 2006). As the normalizing condition, BP10 saprotrophic mycelia were grown in glycerol (A-Sap-Gly). These array data have been submitted to the Gene Expression Omnibus (GEO) database of GenBank under accession num-bers GSM243318 through GSM243333 (samples); GPL6148 and GPL6149 (platforms); and GSE9626, GSE9627, and GSE9701 (series).
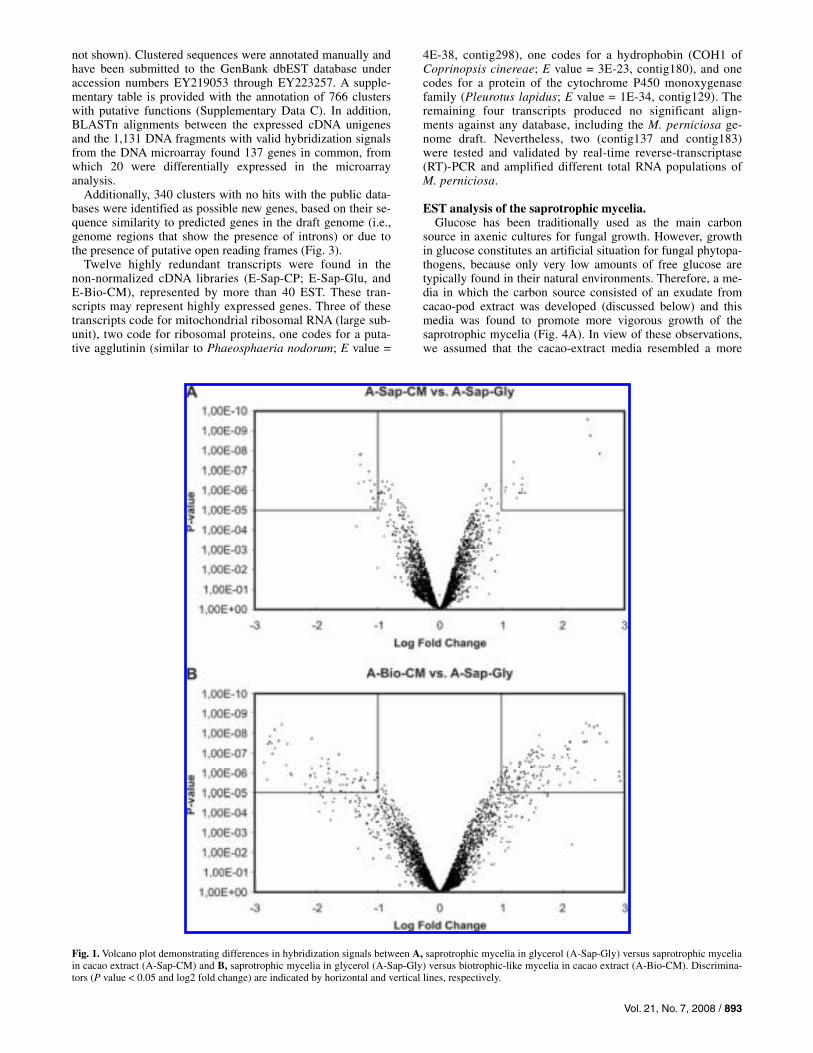
Figure 1 shows a volcano plot analysis for the comparisons between the treatments (A-Bio-CM versus A-Sap-Gly and A-Sap-CM versus A-Sap-Gly). There is a greater dispersion in the comparison A-Bio-CM versus A-Sap-Gly (Fig. 1A) than A-Sap-CM versus A-Sap-Gly (Fig. 1B), which reflects a higher number of differentially expressed genes between two different life phases grown in different media than in the same mycelial type grown in two different media.
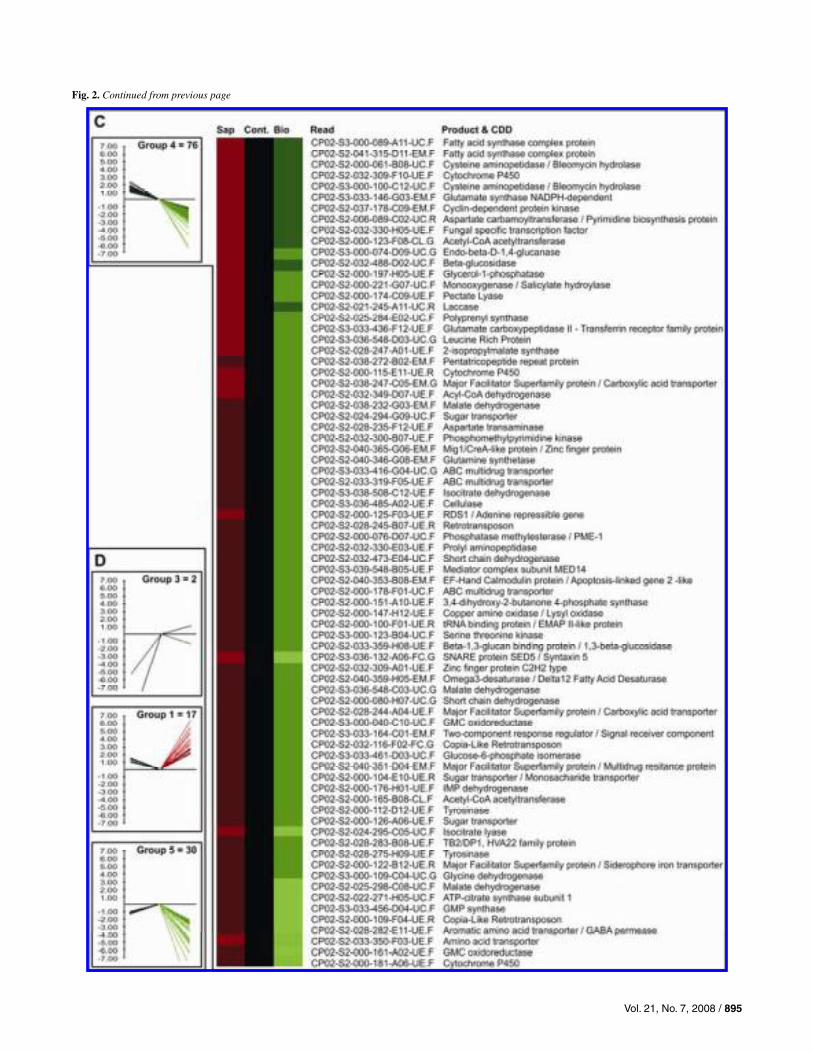
Of the 2,304 spots, 1,131 gave consistent hybridization re-sults (i.e., triplicates showing equivalent hybridization signals for each sample). From these 1,131 putative genes, a total of 189 (16.7%) showed significantly different expression between the A-Sap-CM and A-Bio-CM samples (net fold changes >2.0). These differentially expressed genes were separated into five groups by hierarchical clusterization analysis according to their expression patterns (Fig. 2): 17 genes were induced in both conditions (group 1), 63 genes were repressed in A-Sap-CM and induced in A-Bio-CM (group 2), 76 were induced in A-Sap-CM and repressed in A-Bio-CM (group 4), and 30 were repressed in both (group 5). The hierarchical clusterization algorithm created an outgroup with two genes that showed pat-terns similar to groups 2 and 5, but which failed to cluster into these groups due to a strong repression in A-Sap-CM. One of the genes that failed to clusterize (CP02-S2-041-313-F05-EM.F-RICIN) is probably due to strong repression in A-Sap-CM (–21.7) and induction in A-Bio-CM (2.94). Genes in groups 2 and 4, which show divergent expression patterns in A-Bio-CM and A-Sap-CM, are shown in Figure 2B and C, re-spectively. GenBank accession numbers for these 189 differen-tially expressed spots are provided in Supplementary Data B.
EST general analysis. In parallel with the DNA microarrays, we constructed cDNA
libraries to complement the DNA microarray analysis, specially aimed at identifying new genes and finding the elements nec-essary for gene prediction in the genome draft (e.g., exon-intron boundaries, codon usage, and so on). Four cDNA libraries were constructed: E-Sap-CP (CP02 saprotrophic mycelium grown in cacao-pod extract), E-Sap-Glu (CP02 saprotrophic mycelium grown in glucose), E-Sap(C-G) (subtracted library of the saprotrophic mycelium grown in cacao-pod extract mi-nus saprotrophic mycelium grown in glucose), and E-Bio-CM (biotrophic mycelium grown in cacao meristem extract).
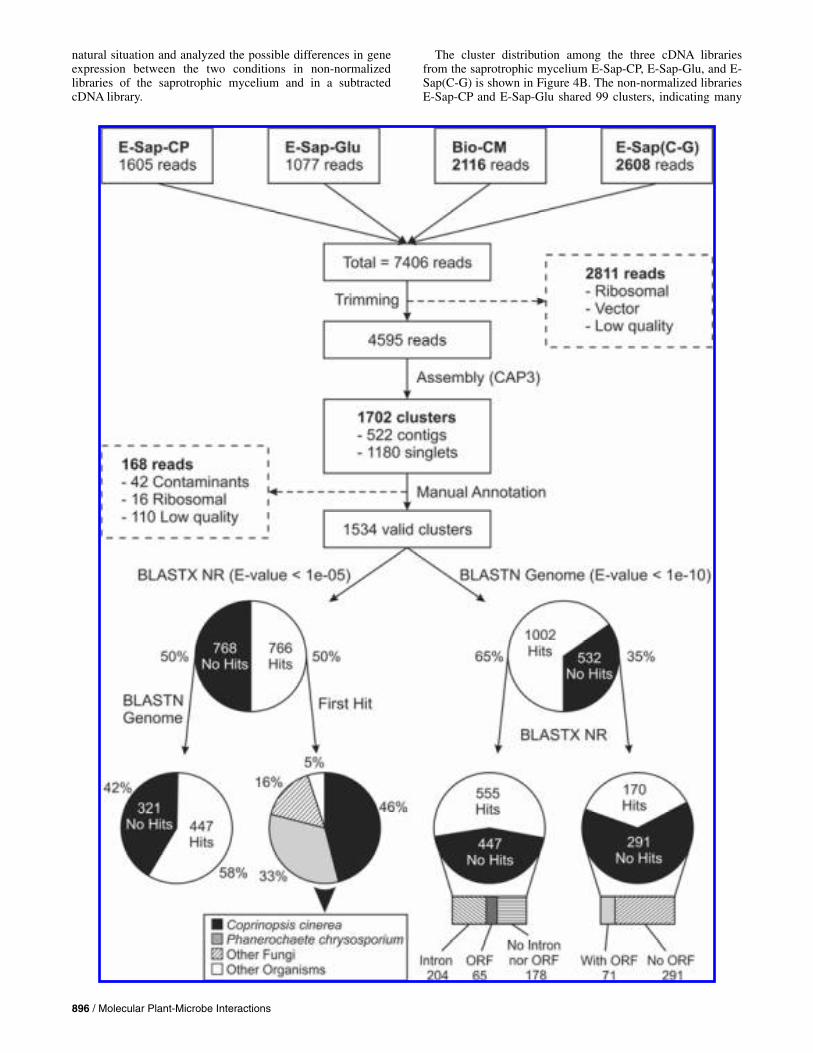
In total, 7,450 reads were generated from the four cDNA libraries, and the analysis of these sequences is summarized in Figure 3. These EST clustered into 1,534 unigenes. Although a few contigs may represent nonoverlapping portions of the same gene, the number of clusters analyzed here could repre-sent up to 13% of the total genes of this fungus, estimated to be 12,000 genes by gene density analysis of the genome (data
Vol. 21, No. 7, 2008 / 893
not shown). Clustered sequences were annotated manually and have been submitted to the GenBank dbEST database under accession numbers EY219053 through EY223257. A supple-mentary table is provided with the annotation of 766 clusters with putative functions (Supplementary Data C). In addition, BLASTn alignments between the expressed cDNA unigenes and the 1,131 DNA fragments with valid hybridization signals from the DNA microarray found 137 genes in common, from which 20 were differentially expressed in the microarray analysis.
Additionally, 340 clusters with no hits with the public data-bases were identified as possible new genes, based on their se-quence similarity to predicted genes in the draft genome (i.e., genome regions that show the presence of introns) or due to the presence of putative open reading frames (Fig. 3).
Twelve highly redundant transcripts were found in the non-normalized cDNA libraries (E-Sap-CP; E-Sap-Glu, and E-Bio-CM), represented by more than 40 EST. These tran-scripts may represent highly expressed genes. Three of these transcripts code for mitochondrial ribosomal RNA (large sub-unit), two code for ribosomal proteins, one codes for a puta-tive agglutinin (similar to Phaeosphaeria nodorum; E value =
4E-38, contig298), one codes for a hydrophobin (COH1 of Coprinopsis cinereae; E value = 3E-23, contig180), and one codes for a protein of the cytochrome P450 monoxygenase family (Pleurotus lapidus; E value = 1E-34, contig129). The remaining four transcripts produced no significant align-ments against any database, including the M. perniciosa ge-nome draft. Nevertheless, two (contig137 and contig183) were tested and validated by real-time reverse-transcriptase (RT)-PCR and amplified different total RNA populations of M. perniciosa.
EST analysis of the saprotrophic mycelia. Glucose has been traditionally used as the main carbon
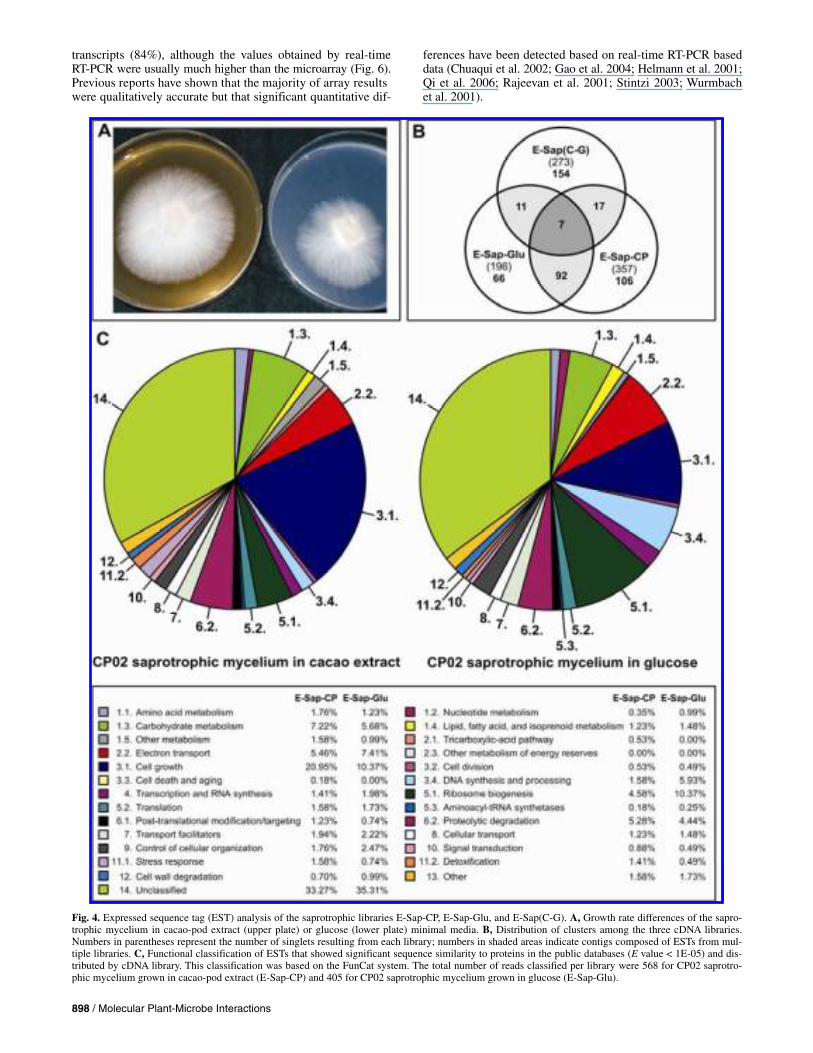
source in axenic cultures for fungal growth. However, growth in glucose constitutes an artificial situation for fungal phytopa-thogens, because only very low amounts of free glucose are typically found in their natural environments. Therefore, a me-dia in which the carbon source consisted of an exudate from cacao-pod extract was developed (discussed below) and this media was found to promote more vigorous growth of the saprotrophic mycelia (Fig. 4A). In view of these observations, we assumed that the cacao-extract media resembled a more
Fig. 1. Volcano plot demonstrating differences in hybridization signals between A, saprotrophic mycelia in glycerol (A-Sap-Gly) versus saprotrophic mycelia in cacao extract (A-Sap-CM) and B, saprotrophic mycelia in glycerol (A-Sap-Gly) versus biotrophic-like mycelia in cacao extract (A-Bio-CM). Discrimina-tors (P value < 0.05 and log2 fold change) are indicated by horizontal and vertical lines, respectively.

894 / Molecular Plant-Microbe Interactions
Continued on following page
Fig. 2. Gene expression profile for the differential gene expression between the biotrophic-like and the saprotrophic mycelia of Moniliophthora perniciosa, established by DNA microarray hybridization. Sap: sample A-Sap-CM; Cont: sample A-Sap-Gly; Bio: sample A-Bio-CM. A, All genes with differential gene expression (fold change >2.0) are shown and clustered into five expression groups. B, A total of 63 genes in group 2, showing repression in the saprotrophic mycelium and induction in the biotrophic-like mycelium. C, Group 4 clustered 76 genes showing induction in the saprotrophic mycelium and repression inthe biotrophic-like mycelium. D, Expression pattern of the other three groups (group 1: induced in both, group 3: strongly repressed in Sap, and group 5:repressed in both), clustering the remaining 51 genes.
Vol. 21, No. 7, 2008 / 895
Fig. 2. Continued from previous page
896 / Molecular Plant-Microbe Interactions
natural situation and analyzed the possible differences in gene expression between the two conditions in non-normalized libraries of the saprotrophic mycelium and in a subtracted cDNA library.
The cluster distribution among the three cDNA libraries from the saprotrophic mycelium E-Sap-CP, E-Sap-Glu, and E-Sap(C-G) is shown in Figure 4B. The non-normalized libraries E-Sap-CP and E-Sap-Glu shared 99 clusters, indicating many

Vol. 21, No. 7, 2008 / 897
similarities between these two growth conditions that may be specific to the dikaryotic physiological stage. In contrast, the subtractive library shared only 24 of its clusters with the E-Sap-CP library and 18 with the E-Sap-Glu library. This indi-cates an enrichment of transcripts that are not abundant in the other two libraries.
The functional classification of the EST in the non-normal-ized cDNA libraries (E-Sap-CP and E-Sap-Glu) based on their sequence similarity to genes of known function (proteins) is shown in Figure 4C, according to the Functional Catalogue (FunCat) classification system for biological processes. Notable differences were observed in the category “3.1. Cell Growth” (21% in cacao-pod extract versus 10% in glucose), suggesting a molecular basis for the growth rate differences observed in culture media (Fig. 4A).
The functional classification of the transcripts enriched in the E-Sap(C-G) library is shown in Table 1. The most redun-dant transcripts were classified in the category “2.2. Electron transport and membrane-associated energy conservation,” which accounted for 35% of the reads identified for this library. The majority of these reads encoded genes such as 5-aminole-vulinate synthase, involved in heme biosynthesis; NAD-de-pendent formate dehydrogenase (FDH), involved in NADH regeneration; and several cytochromes. A significant segment of these reads (22%) were classified into the “5.1. Ribosome biogenesis” category, which includes the large subunit of the rRNA encoded by the mitochondrial genome. Also, several reads (6%) were annotated in category “11.2. Detoxification,” represented by several O-methylsterigmatocystin oxidoreduc-tase, and a cytochrome P450 putatively associated with afla-toxin biosynthesis in pathogenic fungi (Prieto and Woloshuk 1997). Ten reads were found in category “2.1. Tricarboxylic acid cycle” and were putatively identified as enzymes in the malate shunt (malate dehydrogenase and isocitrate dehydroge-nase), which are involved in NADH regeneration.
EST analysis of the biotrophic-like mycelium. After the construction and analysis of the cDNA libraries
from the saprotrophic phase, we succeeded in growing biotro-phic-like mycelia in axenic cultures (Meinhardt et al. 2006). We then prepared an additional non-normalized library from cDNA of the biotrophic-like mycelium grown in vitro. Ideally, to compare it with the other libraries from the saprotrophic mycelia, the growth conditions used for the biotrophic-like cultures should be the same (i.e., growth in glucose or cacao-pod extract). However, the biotrophic-like mycelium cannot be maintained under these growth conditions, which would trigger the immediate conversion to the saprotrophic phase (Meinhardt et al. 2006). Therefore, the biotrophic-like phase used for cDNA library construction was grown in the presence of cacao-meris-tem extract and glycerol, which was similar to that used for microarray analysis. Furthermore, we had to take into consid-eration the fact that this library was prepared from isolate BP10, different from the isolate used to prepare the saprotro-phic libraries.
Although we are aware of the differences in isolates and growth conditions mentioned above, we compared the EST
data as a basis to look for differences between the two myce-lial types. The most relevant differences were then independ-ently confirmed or denied by real-time RT-PCR comparing the A-Sap-CM and E-Bio-CM samples, both prepared from the same isolate and grown in the same media.
The functional categorization of the annotated clusters from the E-Bio-CM library is shown in Figure 5. In comparison with the saprotrophic stage libraries (Fig. 4C), we observed some interesting patterns concerning the frequency of EST in the different categories. For instance, similarly to the saprotro-phic mycelium grown in glucose, there was a lower percentage of transcripts involved in “3.1. Cell growth” and a higher per-centage of transcripts putatively involved in “5.1. Ribosome biogenesis.” In contrast to the saprotrophic stage libraries, there is a lower percentage of “1.3. Carbohydrate metabolism” and a higher proportion of “10. Signal transduction,” “6.2. Pro-teolytic degradation,” “1.4. Lipid metabolism,” and “5.3. ami-noacyl-tRNA synthetases.”
Differences in metabolic pathways among the two types of mycelia and different growth conditions were analyzed based on the functional annotation of the individual clusters. We ob-served that the saprotrophic libraries were more abundant in transcripts associated with glycolysis, the malate shunt, and oxidative phosphorylation. In contrast, the biotrophic-like my-celium had more transcripts involved in the pentose-phosphate shunt, tRNA synthesis, amino acid permeases, and the gamma-amino butyric acid (GABA) shunt.
Real-time RT-PCR analysis of differential gene expression of selected genes.
To independently validate the results, real-time RT-PCR analysis was performed for 35 transcripts that showed differ-ential gene expression in either the EST or the microarray analyses, and their relative expression level was measured in each RNA sample. The sample A-Sap-Gly (BP10 saprotrophic mycelium grown in glycerol) was used as the reference sample for the calculations, with the objective of maintaining consis-tency with the microarray analysis (Fig. 6).
Three additional transcripts were selected and evaluated with regards to the stability of their gene expression among the different RNA samples, in an attempt to select at least one ap-propriate internal control. After analysis by the geNorm applet (Vandesompele et al. 2002), we observed a low variation for β-actin and the 60S rRNA among the different samples (between 1 and 1.3), and the relative expression of these transcripts varied accordingly with regards to the sample (data not shown). Thus, β-actin and 60S rRNA were selected as appropriate internal standards. A normalization factor for each sample was calcu-lated from the geometric average of their expression level in each sample, as suggested by the authors.
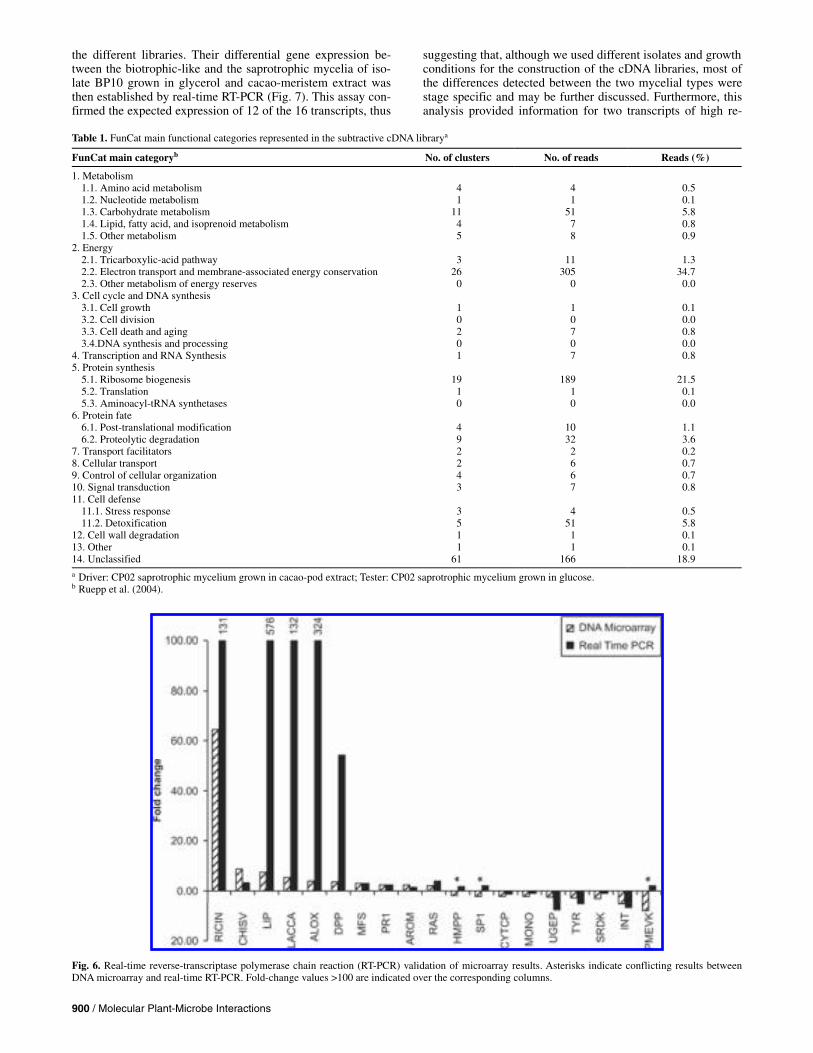
The results of the real-time RT-PCR analysis were separated based on whether they were selected from the DNA microarray or the EST analyses. The fold change results (A-Bio-CM/A-Sap-CM) of the microarray analysis for 19 transcripts were directly compared with the real-time RT-PCR fold-change (A-Bio-CM/A-Sap-CM) to validate the microarray hybridization (Fig. 6). The real-time RT-PCR results validated 16 of these
Fig. 3. Flow diagram of the expressed sequence tag (EST) analysis of Moniliophthora perniciosa. In all, 7,406 ESTs were trimmed, clusterized, and manually annotated, resulting in 1,534 valid clusters or unigenes. BLASTx alignments with public databases allowed the identification of 766 of these clusters, 95% of which had a first hit with a fungal species, mostly corresponding to the basidiomycetes Coprinopsis cinerea (46%) and Phanerochaete chrysosporium (33%). In all, 1,002 of the clusters (65%) showed hits with the draft genome, from which 269 were considered potential new genes due to the lack of homologous sequences in the public databases and to the presence of introns or putative open reading frames (ORFs). An additional 71 clusters thatfailed to show sequence similarity with the draft genome or the public databases were also considered putative new genes based on the presence of putativeORFs. Thus, in total, 340 clusters were identified as potential new genes based on this analysis.
898 / Molecular Plant-Microbe Interactions
transcripts (84%), although the values obtained by real-time RT-PCR were usually much higher than the microarray (Fig. 6). Previous reports have shown that the majority of array results were qualitatively accurate but that significant quantitative dif-
ferences have been detected based on real-time RT-PCR based data (Chuaqui et al. 2002; Gao et al. 2004; Helmann et al. 2001; Qi et al. 2006; Rajeevan et al. 2001; Stintzi 2003; Wurmbach et al. 2001).
Fig. 4. Expressed sequence tag (EST) analysis of the saprotrophic libraries E-Sap-CP, E-Sap-Glu, and E-Sap(C-G). A, Growth rate differences of the sapro-trophic mycelium in cacao-pod extract (upper plate) or glucose (lower plate) minimal media. B, Distribution of clusters among the three cDNA libraries. Numbers in parentheses represent the number of singlets resulting from each library; numbers in shaded areas indicate contigs composed of ESTs from mul-tiple libraries. C, Functional classification of ESTs that showed significant sequence similarity to proteins in the public databases (E value < 1E-05) and dis-tributed by cDNA library. This classification was based on the FunCat system. The total number of reads classified per library were 568 for CP02 saprotro-phic mycelium grown in cacao-pod extract (E-Sap-CP) and 405 for CP02 saprotrophic mycelium grown in glucose (E-Sap-Glu).

Vol. 21, No. 7, 2008 / 899
EST analysis does not provide relative expression data for the transcripts sequenced. Therefore, transcripts of interest for the disease process were selected based on their putative anno-tation and their expression patterns in the different cDNA sam-ples were established by real-time RT-PCR for comparison purposes (Fig. 7).
Based on their presence in the different cDNA libraries, we expected increased expression in the biotrophic-like mycelium of the GABA transporter (GABA T), copper transporter (CUT), stomatin (STOM), tRNA ligase (TRNAL), prohibitin (PROH), ceratoplatanin (CERAT), pathogenicity protein 1 (PP1), glyoxal oxidase (GOX1), and a transcript with no hits in the public database that clustered 515 reads of the E-Bio-CM library (NHBIO). From these, most were validated, with the exception of PP1, TRNAL, and NHBIO.
On the other hand, selected genes expected to be more ex-pressed in the saprotrophic mycelium were a transcript with no hits in the public database that clustered 248 reads of the E-Sap-Glu and E-Sap-CP libraries (NHSAP), a cytochrome C oxidase (COX), manganese sodium dismutase, NAD+-depend-ent FDH, glycerol aquaporin (GLYP), and the KP4 and thau-matin (THAU) antifungal toxins. Most were confirmed, except THAU, which showed equivalent expression in both condi-tions (Fig. 7).
DISCUSSION
In the present study, we employed complementary method-ologies to identify genes and analyze gene expression of M. perniciosa at different physiological stages and in response to extracts of its host, T. cacao, the plant species with which the fungus interacts to cause WBD.
Differential gene expression between the biotrophic-like and saprotrophic stages of M. perniciosa was first identified by DNA microarray employing 2,304 putative genes obtained from the analysis of the draft genome, from which 1,131 gave consistent hybridization signals and resulted in 189 differen-tially expressed genes between the two mycelial types (A-Bio-CM/A-Sap-CM). In addition to the DNA microarray analysis, EST analysis was performed in order to acquire new data from the different physiological stages, to evaluate the saprotrophic mycelial response to host extracts, and to identify new genes that could be included in future DNA microarray analyses. In all, 1,534 unigenes were obtained from this experiment. BLASTn alignments between the EST and the DNA fragments used in the microarray revealed that only 137 of the total num-ber of unigenes sequenced (9%) were represented in the mi-croarrays analysis (from 1,131 spots with consistent hybridiza-tion signals). Given that the DNA fragments used in the micro-arrays were selected based on their sequence similarity to known genes, this result could reflect the percentage of EST with no homology to sequences in the public databases (768 clusters, 50%). In total, we estimate that the DNA microarray and EST analyses presented here were based on 2,528 uni-genes, which represent approximately 21% of the estimated 12,000 total genes for this phytopathogen.
Given the fact that the EST analyses between the biotrophic-like and saprotrophic stages were performed with different iso-lates and growth conditions, we selected 16 transcripts of interest based on their putative function or high redundancy in
Fig. 5. Expressed sequence tag analysis of the biotrophic-like mycelium library (E-Bio-CM). Functional classification of 411 clusters that showed significant sequence similarity to proteins in the public databases (E value < 1E-05). The classification was based on the FunCat system.
900 / Molecular Plant-Microbe Interactions
the different libraries. Their differential gene expression be-tween the biotrophic-like and the saprotrophic mycelia of iso-late BP10 grown in glycerol and cacao-meristem extract was then established by real-time RT-PCR (Fig. 7). This assay con-firmed the expected expression of 12 of the 16 transcripts, thus
suggesting that, although we used different isolates and growth conditions for the construction of the cDNA libraries, most of the differences detected between the two mycelial types were stage specific and may be further discussed. Furthermore, this analysis provided information for two transcripts of high re-
Table 1. FunCat main functional categories represented in the subtractive cDNA librarya
FunCat main categoryb No. of clusters No. of reads Reads (%)
1. Metabolism 1.1. Amino acid metabolism 4 4 0.5 1.2. Nucleotide metabolism 1 1 0.1 1.3. Carbohydrate metabolism 11 51 5.8 1.4. Lipid, fatty acid, and isoprenoid metabolism 4 7 0.8 1.5. Other metabolism 5 8 0.9
2. Energy 2.1. Tricarboxylic-acid pathway 3 11 1.3 2.2. Electron transport and membrane-associated energy conservation 26 305 34.7 2.3. Other metabolism of energy reserves 0 0 0.0
3. Cell cycle and DNA synthesis 3.1. Cell growth 1 1 0.1 3.2. Cell division 0 0 0.0 3.3. Cell death and aging 2 7 0.8 3.4.DNA synthesis and processing 0 0 0.0
4. Transcription and RNA Synthesis 1 7 0.8 5. Protein synthesis
5.1. Ribosome biogenesis 19 189 21.5 5.2. Translation 1 1 0.1 5.3. Aminoacyl-tRNA synthetases 0 0 0.0
6. Protein fate 6.1. Post-translational modification 4 10 1.1 6.2. Proteolytic degradation 9 32 3.6
7. Transport facilitators 2 2 0.2 8. Cellular transport 2 6 0.7 9. Control of cellular organization 4 6 0.7 10. Signal transduction 3 7 0.8 11. Cell defense
11.1. Stress response 3 4 0.5 11.2. Detoxification 5 51 5.8
12. Cell wall degradation 1 1 0.1 13. Other 1 1 0.1 14. Unclassified 61 166 18.9 a Driver: CP02 saprotrophic mycelium grown in cacao-pod extract; Tester: CP02 saprotrophic mycelium grown in glucose. b Ruepp et al. (2004).
Fig. 6. Real-time reverse-transcriptase polymerase chain reaction (RT-PCR) validation of microarray results. Asterisks indicate conflicting results betweenDNA microarray and real-time RT-PCR. Fold-change values >100 are indicated over the corresponding columns.
Vol. 21, No. 7, 2008 / 901
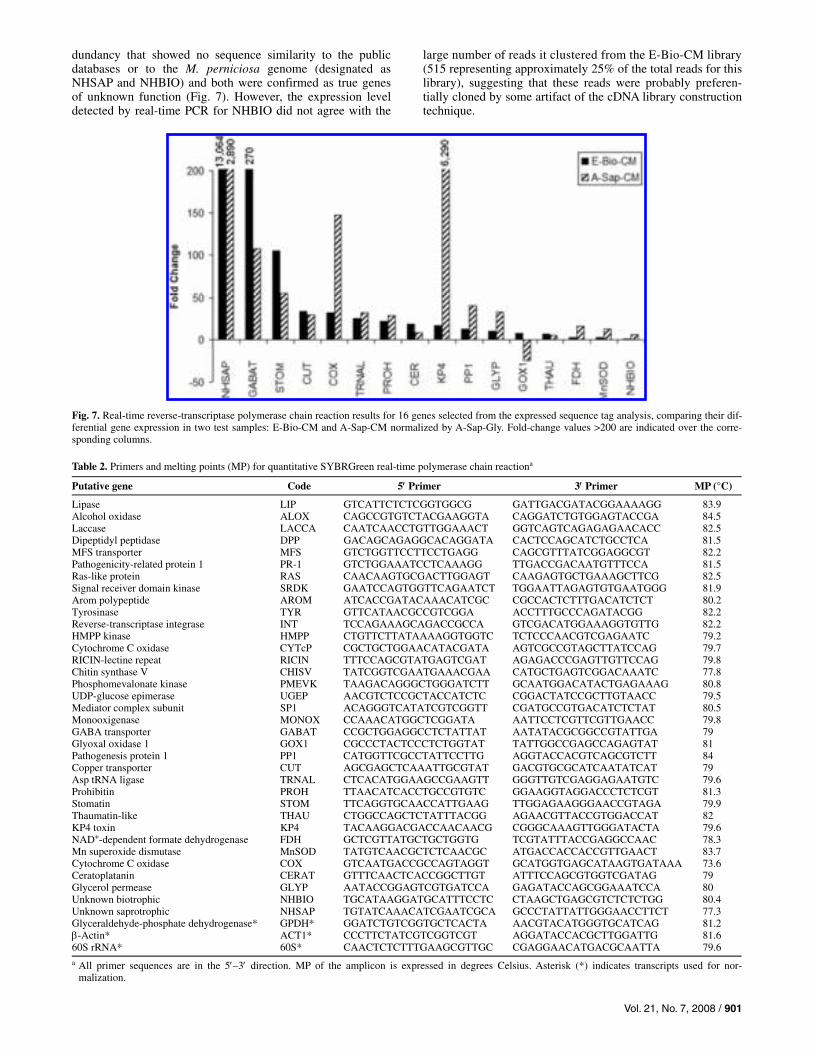
dundancy that showed no sequence similarity to the public databases or to the M. perniciosa genome (designated as NHSAP and NHBIO) and both were confirmed as true genes of unknown function (Fig. 7). However, the expression level detected by real-time PCR for NHBIO did not agree with the
large number of reads it clustered from the E-Bio-CM library (515 representing approximately 25% of the total reads for this library), suggesting that these reads were probably preferen-tially cloned by some artifact of the cDNA library construction technique.
Fig. 7. Real-time reverse-transcriptase polymerase chain reaction results for 16 genes selected from the expressed sequence tag analysis, comparing their dif-ferential gene expression in two test samples: E-Bio-CM and A-Sap-CM normalized by A-Sap-Gly. Fold-change values >200 are indicated over the corre-sponding columns.
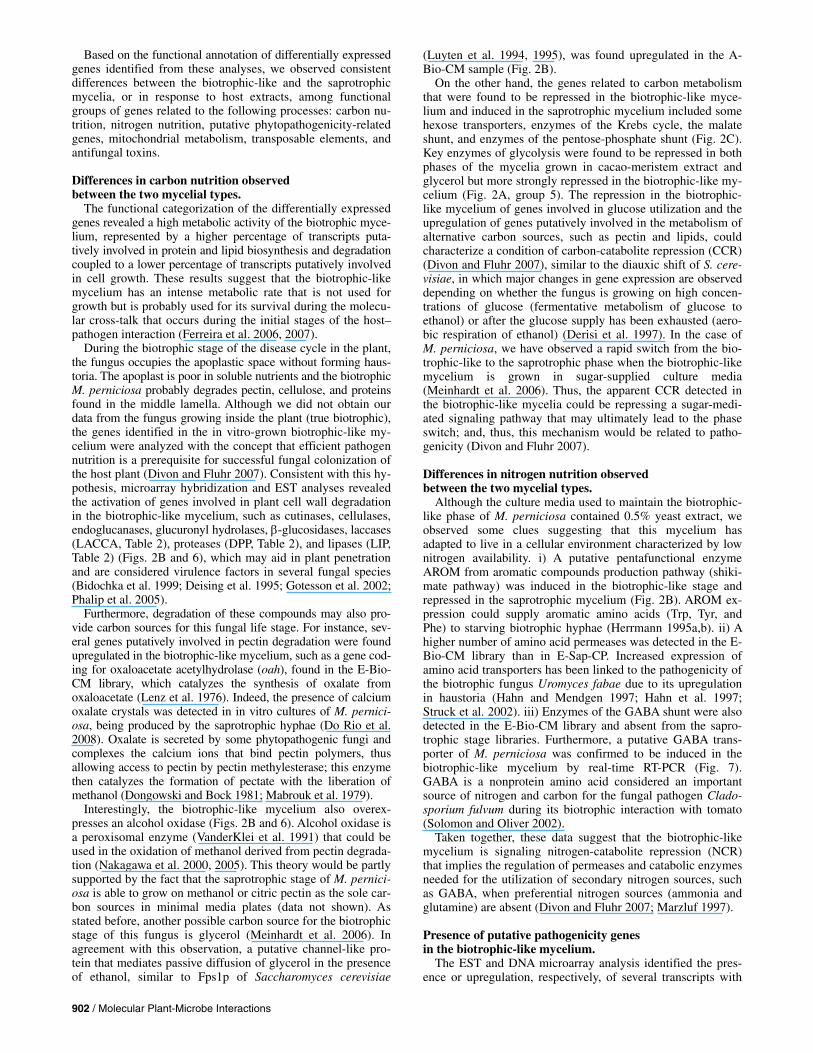
Table 2. Primers and melting points (MP) for quantitative SYBRGreen real-time polymerase chain reactiona
Putative gene Code 5′ Primer 3′ Primer MP (°C)
Lipase LIP GTCATTCTCTCGGTGGCG GATTGACGATACGGAAAAGG 83.9 Alcohol oxidase ALOX CAGCCGTGTCTACGAAGGTA CAGGATCTGTGGAGTACCGA 84.5 Laccase LACCA CAATCAACCTGTTGGAAACT GGTCAGTCAGAGAGAACACC 82.5 Dipeptidyl peptidase DPP GACAGCAGAGGCACAGGATA CACTCCAGCATCTGCCTCA 81.5 MFS transporter MFS GTCTGGTTCCTTCCTGAGG CAGCGTTTATCGGAGGCGT 82.2 Pathogenicity-related protein 1 PR-1 GTCTGGAAATCCTCAAAGG TTGACCGACAATGTTTCCA 81.5 Ras-like protein RAS CAACAAGTGCGACTTGGAGT CAAGAGTGCTGAAAGCTTCG 82.5 Signal receiver domain kinase SRDK GAATCCAGTGGTTCAGAATCT TGGAATTAGAGTGTGAATGGG 81.9 Arom polypeptide AROM ATCACCGATACAAACATCGC CGCCACTCTTTGACATCTCT 80.2 Tyrosinase TYR GTTCATAACGCCGTCGGA ACCTTTGCCCAGATACGG 82.2 Reverse-transcriptase integrase INT TCCAGAAAGCAGACCGCCA GTCGACATGGAAAGGTGTTG 82.2 HMPP kinase HMPP CTGTTCTTATAAAAGGTGGTC TCTCCCAACGTCGAGAATC 79.2 Cytochrome C oxidase CYTcP CGCTGCTGGAACATACGATA AGTCGCCGTAGCTTATCCAG 79.7 RICIN-lectine repeat RICIN TTTCCAGCGTATGAGTCGAT AGAGACCCGAGTTGTTCCAG 79.8 Chitin synthase V CHISV TATCGGTCGAATGAAACGAA CATGCTGAGTCGGACAAATC 77.8 Phosphomevalonate kinase PMEVK TAAGACAGGGCTGGGATCTT GCAATGGACATACTGAGAAAG 80.8 UDP-glucose epimerase UGEP AACGTCTCCGCTACCATCTC CGGACTATCCGCTTGTAACC 79.5 Mediator complex subunit SP1 ACAGGGTCATATCGTCGGTT CGATGCCGTGACATCTCTAT 80.5 Monooxigenase MONOX CCAAACATGGCTCGGATA AATTCCTCGTTCGTTGAACC 79.8 GABA transporter GABAT CCGCTGGAGGCCTCTATTAT AATATACGCGGCCGTATTGA 79 Glyoxal oxidase 1 GOX1 CGCCCTACTCCCTCTGGTAT TATTGGCCGAGCCAGAGTAT 81 Pathogenesis protein 1 PP1 CATGGTTCGCCTATTCCTTG AGGTACCACGTCAGCGTCTT 84 Copper transporter CUT AGCGAGCTCAAATTGCGTAT GACGTGCGCATCAATATCAT 79 Asp tRNA ligase TRNAL CTCACATGGAAGCCGAAGTT GGGTTGTCGAGGAGAATGTC 79.6 Prohibitin PROH TTAACATCACCTGCCGTGTC GGAAGGTAGGACCCTCTCGT 81.3 Stomatin STOM TTCAGGTGCAACCATTGAAG TTGGAGAAGGGAACCGTAGA 79.9 Thaumatin-like THAU CTGGCCAGCTCTATTTACGG AGAACGTTACCGTGGACCAT 82 KP4 toxin KP4 TACAAGGACGACCAACAACG CGGGCAAAGTTGGGATACTA 79.6 NAD+-dependent formate dehydrogenase FDH GCTCGTTATGCTGCTGGTG TCGTATTTACCGAGGCCAAC 78.3 Mn superoxide dismutase MnSOD TATGTCAACGCTCTCAACGC ATGACCACCACCGTTGAACT 83.7 Cytochrome C oxidase COX GTCAATGACCGCCAGTAGGT GCATGGTGAGCATAAGTGATAAA 73.6 Ceratoplatanin CERAT GTTTCAACTCACCGGCTTGT ATTTCCAGCGTGGTCGATAG 79 Glycerol permease GLYP AATACCGGAGTCGTGATCCA GAGATACCAGCGGAAATCCA 80 Unknown biotrophic NHBIO TGCATAAGGATGCATTTCCTC CTAAGCTGAGCGTCTCTCTGG 80.4 Unknown saprotrophic NHSAP TGTATCAAACATCGAATCGCA GCCCTATTATTGGGAACCTTCT 77.3 Glyceraldehyde-phosphate dehydrogenase* GPDH* GGATCTGTCGGTGCTCACTA AACGTACATGGGTGCATCAG 81.2 β-Actin* ACT1* CCCTTCTATCGTCGGTCGT AGGATACCACGCTTGGATTG 81.6 60S rRNA* 60S* CAACTCTCTTTGAAGCGTTGC CGAGGAACATGACGCAATTA 79.6 a All primer sequences are in the 5′–3′ direction. MP of the amplicon is expressed in degrees Celsius. Asterisk (*) indicates transcripts used for nor-
malization.
902 / Molecular Plant-Microbe Interactions
Based on the functional annotation of differentially expressed genes identified from these analyses, we observed consistent differences between the biotrophic-like and the saprotrophic mycelia, or in response to host extracts, among functional groups of genes related to the following processes: carbon nu-trition, nitrogen nutrition, putative phytopathogenicity-related genes, mitochondrial metabolism, transposable elements, and antifungal toxins.
Differences in carbon nutrition observed between the two mycelial types.
The functional categorization of the differentially expressed genes revealed a high metabolic activity of the biotrophic myce-lium, represented by a higher percentage of transcripts puta-tively involved in protein and lipid biosynthesis and degradation coupled to a lower percentage of transcripts putatively involved in cell growth. These results suggest that the biotrophic-like mycelium has an intense metabolic rate that is not used for growth but is probably used for its survival during the molecu-lar cross-talk that occurs during the initial stages of the host–pathogen interaction (Ferreira et al. 2006, 2007).
During the biotrophic stage of the disease cycle in the plant, the fungus occupies the apoplastic space without forming haus-toria. The apoplast is poor in soluble nutrients and the biotrophic M. perniciosa probably degrades pectin, cellulose, and proteins found in the middle lamella. Although we did not obtain our data from the fungus growing inside the plant (true biotrophic), the genes identified in the in vitro-grown biotrophic-like my-celium were analyzed with the concept that efficient pathogen nutrition is a prerequisite for successful fungal colonization of the host plant (Divon and Fluhr 2007). Consistent with this hy-pothesis, microarray hybridization and EST analyses revealed the activation of genes involved in plant cell wall degradation in the biotrophic-like mycelium, such as cutinases, cellulases, endoglucanases, glucuronyl hydrolases, β-glucosidases, laccases (LACCA, Table 2), proteases (DPP, Table 2), and lipases (LIP, Table 2) (Figs. 2B and 6), which may aid in plant penetration and are considered virulence factors in several fungal species (Bidochka et al. 1999; Deising et al. 1995; Gotesson et al. 2002; Phalip et al. 2005).
Furthermore, degradation of these compounds may also pro-vide carbon sources for this fungal life stage. For instance, sev-eral genes putatively involved in pectin degradation were found upregulated in the biotrophic-like mycelium, such as a gene cod-ing for oxaloacetate acetylhydrolase (oah), found in the E-Bio-CM library, which catalyzes the synthesis of oxalate from oxaloacetate (Lenz et al. 1976). Indeed, the presence of calcium oxalate crystals was detected in in vitro cultures of M. pernici-osa, being produced by the saprotrophic hyphae (Do Rio et al. 2008). Oxalate is secreted by some phytopathogenic fungi and complexes the calcium ions that bind pectin polymers, thus allowing access to pectin by pectin methylesterase; this enzyme then catalyzes the formation of pectate with the liberation of methanol (Dongowski and Bock 1981; Mabrouk et al. 1979).
Interestingly, the biotrophic-like mycelium also overex-presses an alcohol oxidase (Figs. 2B and 6). Alcohol oxidase is a peroxisomal enzyme (VanderKlei et al. 1991) that could be used in the oxidation of methanol derived from pectin degrada-tion (Nakagawa et al. 2000, 2005). This theory would be partly supported by the fact that the saprotrophic stage of M. pernici-osa is able to grow on methanol or citric pectin as the sole car-bon sources in minimal media plates (data not shown). As stated before, another possible carbon source for the biotrophic stage of this fungus is glycerol (Meinhardt et al. 2006). In agreement with this observation, a putative channel-like pro-tein that mediates passive diffusion of glycerol in the presence of ethanol, similar to Fps1p of Saccharomyces cerevisiae
(Luyten et al. 1994, 1995), was found upregulated in the A-Bio-CM sample (Fig. 2B).
On the other hand, the genes related to carbon metabolism that were found to be repressed in the biotrophic-like myce-lium and induced in the saprotrophic mycelium included some hexose transporters, enzymes of the Krebs cycle, the malate shunt, and enzymes of the pentose-phosphate shunt (Fig. 2C). Key enzymes of glycolysis were found to be repressed in both phases of the mycelia grown in cacao-meristem extract and glycerol but more strongly repressed in the biotrophic-like my-celium (Fig. 2A, group 5). The repression in the biotrophic-like mycelium of genes involved in glucose utilization and the upregulation of genes putatively involved in the metabolism of alternative carbon sources, such as pectin and lipids, could characterize a condition of carbon-catabolite repression (CCR) (Divon and Fluhr 2007), similar to the diauxic shift of S. cere-visiae, in which major changes in gene expression are observed depending on whether the fungus is growing on high concen-trations of glucose (fermentative metabolism of glucose to ethanol) or after the glucose supply has been exhausted (aero-bic respiration of ethanol) (Derisi et al. 1997). In the case of M. perniciosa, we have observed a rapid switch from the bio-trophic-like to the saprotrophic phase when the biotrophic-like mycelium is grown in sugar-supplied culture media (Meinhardt et al. 2006). Thus, the apparent CCR detected in the biotrophic-like mycelia could be repressing a sugar-medi-ated signaling pathway that may ultimately lead to the phase switch; and, thus, this mechanism would be related to patho-genicity (Divon and Fluhr 2007).
Differences in nitrogen nutrition observed between the two mycelial types.
Although the culture media used to maintain the biotrophic-like phase of M. perniciosa contained 0.5% yeast extract, we observed some clues suggesting that this mycelium has adapted to live in a cellular environment characterized by low nitrogen availability. i) A putative pentafunctional enzyme AROM from aromatic compounds production pathway (shiki-mate pathway) was induced in the biotrophic-like stage and repressed in the saprotrophic mycelium (Fig. 2B). AROM ex-pression could supply aromatic amino acids (Trp, Tyr, and Phe) to starving biotrophic hyphae (Herrmann 1995a,b). ii) A higher number of amino acid permeases was detected in the E-Bio-CM library than in E-Sap-CP. Increased expression of amino acid transporters has been linked to the pathogenicity of the biotrophic fungus Uromyces fabae due to its upregulation in haustoria (Hahn and Mendgen 1997; Hahn et al. 1997; Struck et al. 2002). iii) Enzymes of the GABA shunt were also detected in the E-Bio-CM library and absent from the sapro-trophic stage libraries. Furthermore, a putative GABA trans-porter of M. perniciosa was confirmed to be induced in the biotrophic-like mycelium by real-time RT-PCR (Fig. 7). GABA is a nonprotein amino acid considered an important source of nitrogen and carbon for the fungal pathogen Clado-sporium fulvum during its biotrophic interaction with tomato (Solomon and Oliver 2002).
Taken together, these data suggest that the biotrophic-like mycelium is signaling nitrogen-catabolite repression (NCR) that implies the regulation of permeases and catabolic enzymes needed for the utilization of secondary nitrogen sources, such as GABA, when preferential nitrogen sources (ammonia and glutamine) are absent (Divon and Fluhr 2007; Marzluf 1997).
Presence of putative pathogenicity genes in the biotrophic-like mycelium.
The EST and DNA microarray analysis identified the pres-ence or upregulation, respectively, of several transcripts with
Vol. 21, No. 7, 2008 / 903
sequence similarity to pathogenicity or virulence genes of other phytopathogens in the biotrophic-like phase: i) a putative glucuronyl hydrolase, involved in the complete degradation of glucoaminoglycans of the plant cell wall (Eastwood et al. 2001); ii) a putative glyoxal oxidase 1 (GOX), involved in the oxidation of short-chain aldehydes (<C4) and proven to be essential for the filamentous growth and pathogenicity of Usti-lago maydis (Leuthner et al. 2005); iii) a putative class V chi-tin synthase (CHISV) (Fig. 2B) that, when deleted in U. may-dis, impaired early fungal plant infection (Weber et al. 2006); iv) a gene similar to Marasmius edodes agglutinin (RICIN) (Fig. 2B), which is a lectin containing a ricin B chain (QXW)3 (Grahn et al. 2007) that could bind to the plant’s carbohydrate moieties, thus aiding the Moniliophthora perniciosa parasitic mycelium to colonize the apoplast; and v) a putative CERAT, which is a small phytotoxic protein secreted by the ascomycete Ceratocystis fimbriata f. sp. platani, the causal agent of canker stain disease (Pazzagli et al. 1999).
Further evidence for the induction of these putative patho-genicity genes in the biotrophic-like mycelium comes from the real-time RT-PCR analysis of the GOX (Fig. 7), CERAT (Fig. 7), class V chitin synthase (CHISV in Fig. 6), and the aggluti-nin homolog (RICIN in Fig. 6).
The induction of these putative pathogenicity genes could be related to the apparent NCR in the biotrophic-like mycelium of M. perniciosa, which would be consistent with a series of re-ports correlating nitrogen starvation to the expression of patho-genicity factors in several fungal species studied by global gene expression, single gene expression, or knockout mutant analyses (Coleman et al. 1997; Csank and Haynes 2000; Donofrio et al. 2006; Lau and Hamer 1996; Marzluf 1997; Pieterse et al. 1994; Solomon and Oliver 2001; Solomon et al. 2005; Soundararajan et al. 2004).
Moreover, the signaling pathways involved in nitrogen star-vation have been shown to regulate the disease cycle in some fungal species, specially in the hemibiotrophic fungi Colleto-trichum lindemuthianum, in which the switch from biotrophy to necrotrophy is controlled by the AREA-like regulator Clnr1 (Divon and Fluhr 2007; Dufresne et al. 2000). Therefore, the apparent NCR observed in the biotrophic-like mycelium could also be important in controlling the M. perniciosa life cycle. In addition, AROM expression could also contribute to fungal pathogenicity. For instance, Trp and Phe are precursors of the plant growth-promoting hormones indole 3-acetic acid (IAA) and salicylic acid (SA), respectively, and both of these com-pounds could be important for WBD progression (Kilaru et al. 2007). Tyr could also be important because it is a precursor of the free-radical scavenger and pathogenicity-related compound melanin (Jacobson 2000).
In view of these results, we propose that, during the biotro-phic phase, the fungus causes the disease symptoms, probably by expressing pathogenicity genes controlled by a condition of nutrient starvation. After a variable period, the affected plant tissues turn necrotic and the cells break open, thus releasing soluble nutrients into the apoplastic space. Taken together, the apparent CCR and NCR suggest that availability of appropri-ate nitrogen and carbon nutrient sources in the apoplastic space of the cacao plant could determine the length of the biotrophic, symptom-causing stage of the fungus. If so, ma-nipulation of nitrogen and fermentable sugar availability inside the apoplast could possibly be used in the field to induce an early switch to saprotrophic M. perniciosa, and thus modify the disease interaction.
Mitochondrial metabolism and growth rate. We looked for clues to understand why the biotrophic myce-
lium showed such poor growth when compared with the sapro-
trophic mycelia. We found that a gene with sequence similarity to ngr1 of S. cerevisiae was induced in the biotrophic-like my-celium by DNA microarray analysis (Fig. 2B). The protein encoded by this gene is known to negatively regulate growth of yeast by binding to the 3′ untranslated region of the mitochon-drial porin mRNA and thus accelerates mitochondrial degrada-tion (Akada et al. 1997; Gardner et al. 2005). Because mito-chondrial impairment would result in less production of ATP, the presence of this transcript could help explain the slow growth shown by the biotrophic mycelium.
Furthermore, the EST analysis revealed the presence of more transcripts putatively involved in NADH regeneration (indicated by the presence of the NAD+-dependent FDH and the enzymes of the malate shunt in the subtracted library) and higher synthe-sis of cytochromes (substantiated by the presence of the 5-ami-nolevulinate synthase and several cytochrome genes) in the saprotrophic mycelium induced with host extracts (E-Sap-CP and E-Sub[C-G]). Real-time RT-PCR analysis confirmed the induction of the putative NAD+-dependent FDH and COX in the saprotrophic mycelium in the presence of cacao extract (Fig. 7).
These results indicate a possible induction of the cytochrome-mediated electron transport chain in the saprotrophic myce-lium when grown in the presence of cacao-pod extract, which coincides with the presence of ribosomal proteins encoded by the mitochondrial genome. Because greater amounts of ATP may be produced in the saprotrophic mycelium grown in cacao-pod extract by means of mitochondrial oxidative phos-phorylation, the resulting higher energy availability would be reflected in the higher growth rate of the mycelium observed in the cacao-extract media and confirmed by the analysis of the non-normalized libraries.
Moreover, the identification of these processes in the cDNA libraries suggests a possible link with the saprotrophic devel-opment of the fungus in the plant. For instance, electron leak-age from the cytochrome-mediated electron transport chain could supply ROS (Liu et al. 2002) needed for the enzymatic degradation of the plant cell wall (Fernandes et al. 2005; Kapich et al. 1999). The induction in the saprotrophic myce-lium of genes that encode for the mitochondrial antioxidant enzymes manganese superoxide dismutase and cytochrome C peroxidase (CYTcP) (Giles et al. 2005) (Fig. 7), suggests that M. perniciosa is able to cope with ROS derived from the cyto-chrome-mediated respiratory pathway in this developmental stage. In addition, we observed the induction of a tyrosinase (Fig. 6, TYR), which is an enzyme that catalyzes the produc-tion of anti-oxidative melanin (Halaouli et al. 2006), and could also participate in this mechanism.
Differential expression of transposable elements. Genes involved in transposition and retrotransposition were
also induced in the biotrophic-like mycelium, but other inte-grases were found upregulated in the saprotrophic mycelium. These results suggest that the activation of different types of transposable elements may be regulated during the fungus’s life cycle. This observation is interesting, given that we have proposed previously that one of the mechanisms used by this homothallic fungus to generate its chromosome-length poly-morphisms is through the activation of transposable elements, and this high genetic variability could be correlated to the adaptive success this species has shown in overcoming cacao resistance in several South American cacao-producing regions (Bartley 1986; Rincones et al. 2003, 2006).
Identification of transcripts with putative antifungal properties.
Further analysis of the annotated sequences revealed two putative transcripts with antifungal properties: a thaumatin-like

904 / Molecular Plant-Microbe Interactions
protein (Frendo et al. 1992) and a KP4 toxin (Gage et al. 2002). The thaumatin-like protein was annotated only for the E-Sap-CP library, but real-time RT-PCR analysis of this tran-script indicates that it is induced in both the biotrophic-like and saprotrophic mycelia grown in cacao-meristem extract and glycerol (Fig. 7).
On the other hand, the KP4 toxin appeared only in both saprotrophic libraries, and the real-time analysis confirmed that it is more induced in this stage than in the biotrophic-like mycelium (Fig. 7). The annotation of a putative KP4 toxin in the cDNA libraries of the saprotrophic mycelium of M. perni-ciosa is of interest for the biology of this fungus. Killer pro-teins are produced by fungal viruses that do not exist outside their host or cause a lytic infection. These virally encoded tox-ins allow their host to kill competing fungal strains, even from the same species (Palfree and Bussey 1979; Schmitt and Breinig 2002, 2006; Weiler et al. 2002). Therefore, expression of these toxins during the saprotrophic stage of the fungus could aid in preventing the colonization of the infected tissue by competing saprotrophic fungi and, if expressed during the biotrophic phase, could also help maintain homozygocity in this homothallic fungal pathogen by preventing the colonization of multiple strains of M. perniciosa.
Concluding remarks. In conclusion, our DNA microarrays and EST analyses suc-
cessfully identified numerous genes and metabolic pathways that show differential gene expression between the biotrophic-like and saprotrophic mycelia of M. perniciosa. This is the first global transcriptome analysis between the two life stages of a hemibiotrophic plant pathogen and has aided in improving our understanding of the molecular mechanisms that appear to be involved in its parasitic development and colonization of cacao tissues. However, in light of the fact that the experimental sys-tem used here did not include plant–pathogen interactions, the genes and metabolic pathways identified here as upregulated in the biotrophic-like mycelium must be further confirmed with regard to their involvement in the pathogenicity process using techniques to study gene expression in planta and for the study of gene function, such as the development of knockout mutants and phenotype analysis. Our current efforts are directed at establishing these systems in order to further unravel the molecular mechanisms underlying WBD.
MATERIALS AND METHODS
Fungal strain and growth conditions. Two fungal isolates of M. perniciosa were used: BP10 and
CP02. These isolates are monosporic cultures obtained from two different basidiomes found on infected cacao tissue in the cacao-growing region of the Bahia State, Brazil. Isolate CP02 is the same used for the Witches’ Broom Genome Project and belongs to karyotype group 1, one of the two genotypes found in the cocoa-producing region of Bahia (Rincones et al. 2006). Isolate BP10 belongs to karyotype group 2, the other genotype found in this region, and was characterized by faster growth and greater ease of basidiome production under laboratory conditions. Cultures of these isolates were maintained on plates of malt yeast extract agar (BD Biosciences-Difco, Detroit) at 27°C and can be obtained from our laboratory.
Isolate CP02 was used to construct the subtracted cDNA library (E-Sap[C-G]; enriched with transcripts upregulated in the saprotrophic mycelia grown in cacao extract) and two of the three non-normalized cDNA libraries, E-Sap-Glu and E-Sap-CP. In order to obtain RNA from the saprotrophic phase of isolate CP02, 10 culture bottles containing glucose-defined media (0.6% potassium nitrate, 0.05% potassium chloride,
0.05% magnesium sulfate, 0.15% monobasic potassium phos-phate, traces of iron sulfate and zinc sulfate, and 1% Dextrose, pH 6.8) were inoculated with 20 to 30 small agar blocks (1 mm2) containing saprotrophic hyphae of this isolate. The cul-tures were incubated at 27°C and agitated at 200 rpm for 7 days. After this period, the media was removed and new media was added. In half of the cultures we added new glucose mini-mal media, and in the other half we added cacao-pod extract media (the same as the media above, but instead of dextrose it contained 1% lyophilized finely ground cacao-pod tissues); this cacao powder was kept inside a dialysis membrane (size cutoff at 12 kDa), so that only exudates from the cacao tissue permeated into the media. In order to obtain most of the short-duration transcripts (Newman et al. 1994), the cultures were grown in the new media for five different growth periods: 24 h, 48 h, 72 h, 6 days, and 8 days.
Isolate BP10 was used to construct the cDNA library corre-sponding to biotrophic-like mycelium induced by cacao meris-tem extracts and was also used for the three conditions assayed in the microarray analyses: i) A-Bio-CM, ii) A-Sap-CM, and iii) A-Sap-Gly.
Biotrophic-like cultures of isolate BP10 of M .perniciosa were obtained in vitro as described by Meinhardt and associates (2006). Briefly, spores from strain BP10 were plated on solid media (3% agar, 2% glycerol, caffeine at 5 mg liter–1, and in-dole-3-acetic acid [Auxin] at 10 mg liter–1) and incubated in the dark at 28°C until small white colonies appeared. Small agar blocks containing the colonies were transferred to liquid media (0.5% yeast extract, 5% glycerol, 0.25% K2HPO4, and 0.1% MPR trace elements solution [Mandels et al. 1962]) and incu-bated at 27°C in the dark with 120 rpm agitation. Colonies were allowed to grow for 14 days and, afterward, the mycelia were induced by the addition of 1% extract of young cacao meristems (3 g of frozen cacao meristems homogenized in 50 ml of the same liquid media and filter sterilized). Colonies were allowed to grow for an additional 14 days prior to RNA extraction. This biotrophic-like mycelium exhibited very slow growth; thus, a long growth period (total of 28 days) was necessary in order to obtain appropriate amounts of mycelia for RNA extraction. However, the absence of clamp connections was verified daily. This slow growth also hampered RNA extraction at different time intervals for this type of mycelium. The saprotrophic cul-tures of this same isolate induced with cacao meristem extract (A-Sap-CM) were obtained exactly as described for the biotro-phic-like cultures, but the saprotrophic mycelium was used instead of germinated spores. The A-Sap-Gly cultures (saprotro-phic mycelium grown in glycerol) were also obtained in the same way, but omitting the addition of cacao meristem extracts.
RNA isolation. Cultures of each type were processed for RNA extraction
using the RNeasy plant mini kit according to the manufac-turer’s protocol (Qiagen, Valencia, CA, U.S.A.). Qualitative and quantitative analyses of the RNA samples were performed through denaturing formaldehyde/agarose gel electrophoresis and optical density, as described previously (Sambrook and Russell 2001). In the case of the saprotrophic mycelia of iso-late CP02 used for the construction of cDNA libraries, equiva-lent amounts of total RNA obtained after each growth period (24 h, 48 h, 72 h, 6 days, and 8 days) were mixed. In total, five RNA populations were obtained: i) E-Sap-Glu, ii) E-Sap-CP, iii) E-Bio-CM for EST and A-Bio-CM for microarray analy-ses, iv) A-Sap-CM, and v) A-Sap-Gly.
DNA microarrays assemblage. The database of the Witches’ Broom Genome Project was
mined using the software Gene Projects (software registered
Vol. 21, No. 7, 2008 / 905
under protocol INPI 005–09/01/2004). Clones were designated according to the nomenclature system of the M. perniciosa Genome project, in which the strain, library name, library number, and plate number are considered. Description of shot-gun reads nomenclature is shown in Supplementary Data D. In all, 2,304 clones were selected, showing significant sequence similarity (BLASTx, e value ≤ 1E-05) to genes that code for known proteins of other fungal species. A fragment of a gene showing significant sequence similarity to a polyubiquitin of several fungal species was selected as a positive control. PCR-amplified inserts of the selected clones were purified, adjusted to a concentration of 300 ng μl–1, and spotted in triplicates onto aminosilane-treated glass slides (GAPS II; Corning Life Science, Lowell, MA, U.S.A.) using the Flexys Robot Arrayer (Perkin-Elmer Life Sciences, Waltham, MA, U.S.A.).
Amplification and labeling of the RNA and microarray hybridization.
The mRNA of the three conditions (A-Sap-Gly, A-Sap-CM, and A-Bio-CM) was amplified from total RNA using the cRNA technique described by Gomes and associates (2003). The amplified cRNA from each population was labeled with cyanine-3 CTP and cyanine-5 CTP (Perkin-Elmer Life Sci-ences), according to standard procedures. The marked cRNA was purified with AutoSeq G-50 columns (Amersham Biosci-ences, Piscataway, NJ, VA, U.S.A.) following the manufac-turer’s protocol and quantified through spectrophotometry. La-beled samples were hybridized and washed according to stan-dard procedures. Hybridizations included the following, with corresponding dye swaps for each comparison and one techni-cal replicate: i) A-Bio-CM(Cy3) versus A-Sap-Gly(Cy5), ii) A-Bio-CM(Cy5) versus A-Sap-Gly(Cy3), iii) A-Sap-CM(Cy3) versus A-Sap-Gly(Cy5), and iv) A-Sap-CM(Cy5) versus A-Sap-Gly(Cy3). In each case, 4 μg of labeled sample was used per hybridization. The chips were hybridized with their labeled targets in the HybStation (Perkin-Elmer Life Sciences) for 1 h at 55°C, 1 h at 50°C, and 19 h at 42°C. Washes were per-formed at 37°C with mild agitation as follows: 15 min in wash no. 1 (2× SSC [1× SSC is 0.15 M NaCl plus 0.015 M sodium citrate]), one time; 15 min in wash no. 2 (0.1× SSC and 0.1% sodium dodecyl sulfate), two times; and 15 min in wash no. 3 (0.1× SSC), two times. Slides were immediately dried by cen-trifugation at 1,000 rpm for 2 min and scanned with a confocal laser scanner (ScanArray Express; Perkin-Elmer Life Sciences). Preliminary data analysis was performed using the ScanArray Express software package (Perkin-Elmer Life Sciences). After dye-swap correction, nonlinear intensity-dependent dye bias was normalized within slides using the Lowess method (Yang et al. 2002). Normalization between technical replicates was done using empirical Bayesian statistics described with LIMMA (Smyth and Speed 2003). Fold changes were calculated by comparing the treatment channel (A-Sap-CM or A-Bio-CM) with the control channel (A-Sap-Gly). P values were generated by performing moderated t statistic (Lonnstedt and Speed 2002) on the comparison of normalized data points in the experimen-tal versus the control channels. We selected genes showing significant P value (<0.05) and with fold changes ≥2.0. Differ-entially expressed genes were classified as induced (+) or repressed (–).
A clusterization analysis of the differentially expressed genes was performed using the fold change between samples A-Sap-CM versus A-Sap-Gly and A-Bio-CM versus A-Sap-Gly, with the reference value of the A-Sap-Gly sample consid-ered 0 (Paux et al. 2005). Data clusterization was performed using the tools available at the EPClust website. The hierarchi-cal clusterization method was applied using correlation meas-ured based distance and complete linkage. In order to visualize
the clusters, we used the color matrix Green-Black-Red (10 exponential). Differentially expressed genes were subjected to BLASTx analysis and were manually annotated according to the Gene Ontology classification.
Construction of cDNA libraries. Because limited amounts of RNA were obtained using the
RNeasy protocol, the cDNA populations for library construction were created using the BD SMART cDNA synthesis system (BD Biosciences–Clontech, Palo Alto, CA, U.S.A.), which allows the creation of cDNA from small amounts of total RNA through the use of long-distance PCR (LD-PCR). We used 1 μg of total RNA to generate each of the cDNA populations. The E-Sap-Glu, E-Sap-CP, and E-Bio-CM full-length libraries were constructed following the protocol of the BD Creator SMART cDNA Library Construction kit (BD Biosciences) and direction-ally cloned into the pDNR-LIB plasmid, according to the manu-facturer’s instructions. The plasmids were then transformed into One-Shot Escherichia coli DH10B strain (Invitrogen Corpora-tion, Carlsbad, CA, U.S.A.) by electroporation. Individual white bacterial colonies derived from all three libraries were trans-ferred to 96-well microtiter dishes and grown in freezing me-dium (0.5% NaCl Luria-Bertani medium with 10% glycerol) prior to plasmid extraction or storage at –80°C. EST clones were designated using the nomenclature system created for the M. perniciosa Genome Project in which the strain, library name, library number, and plate number are considered.
In addition, a subtracted cDNA library was created, enriched for transcripts differentially expressed in the cacao-induced saprotrophic mycelium with regard to the glucose-grown saprotrophic mycelium of isolate CP02. For this subtracted library, we generated two cDNA populations: cacao-induced (tester) and glucose (driver) using the Super SMART cDNA synthesis kit (BD Biosciences) and used in the subsequent steps of the suppressive subtractive hybridization procedure, according to the instructions of the BD Clontech PCR-Select Subtraction kit (BD Biosciences). The products of the secon-dary PCR were inserted into the pGEM TEasy plasmid vector (Promega Corporation, Madison, WI, U.S.A.) according to the manufacturer’s instruction and transformed into One-shot E. coli DH10B strain (Invitrogen Corporation) by electroporation. This subtracted library was denominated E-Sap(C-G). The efficiency of the subtraction process was independently con-firmed via cDNA macroarray dot-blot differential screening (data not shown), as suggested by the manufacturer’s protocol and other authors (Cramer and Lawrence 2004).
EST sequencing and analysis. Plasmid DNA was extracted according to Engebrecht and
associates (1998) and DNA sequence analysis was carried out using the DYEnamic ET Dye Terminator kit (Amersham Bio-sciences) in a MegaBACE 1000 capillary sequencer (Amer-sham Biosciences). Chromatograms were submitted to the M. perniciosa database and subjected to automatic base calling and quality control using PHRED (Ewing et al. 1998); vector and polylinker sequences were masked using Cross-Match. All reads were searched for similarities against the NCBI nonre-dundant database using the BLASTx algorithm and against the M. perniciosa genomic database using the BLASTn algorithm of BLAST, version 2.1 (Altschul et al. 1997). Only reads that complied with one or more of the following criteria were fur-ther selected for trimming and clusterization: i) more than 200 bp with >20 quality grade attributed by PHRED (Ewing et al. 1998); ii) significant similarity with proteins in the NCBI non-redundant database (BLASTx with E value ≤ 1E-05), and iii) significant similarity with nucleotide sequences in the M. per-niciosa genomic database (BLASTn with E value ≤ 1E-10).

906 / Molecular Plant-Microbe Interactions
The selected reads were further trimmed according to Telles and Silva (2001) and clusterized using CAP3 (Huang and Madan 1999). Short clusters (≤100 bp) and clusterization arti-facts were removed (Telles et al. 2001). Remaining clusters were subjected to similarity searches against the NCBI nonre-dundant database using the BLASTx algorithm and against the M. perniciosa genomic database using the BLASTn algorithm (Altschul et al. 1997). Results from the similarity searches for each cluster were made available on-line with links to the annotation page created for the M. perniciosa Genome Project. Clusters were annotated manually and classified according to the Functional Catalogue FunCat (Ruepp et al. 2004). Because all four libraries were clusterized together, an electronic North-ern algorithm was used to visualize the distribution per library of the reads that form each cluster. This program is an in silico transcription profiling algorithm that counts the number of sequenced EST of a given gene within the whole EST popula-tion (normalized counts). This type of approach has been used before for other organisms (Audic and Claveric 1997; Clegg et al. 2002; Ohlrogge and Benning 2000; Ribichich et al. 2005).
Real-time PCR. Real-time PCR analysis was performed for 38 selected
genes (Table 2) using the standard curve method (Larionov et al. 2005). The different genes were assayed in the three differ-ent RNA samples used for DNA microarray analyses, and the sample A-Sap-Gly was used as the normalizing condition. In all, 16 of these transcripts were selected based on the EST analysis, 19 were selected from the microarray analysis, and the remaining 3 were tested with regard to their stability be-tween samples in order to use them as endogenous references: putative glyceraldehyde 3-phosphate dehydrogenase (GPDH), putative β-actin (ACT), and putative 60S rRNA (60S) (Table 2).
Total RNA (1 μg, treated with RQ1 DNAseI according to the manufacturer’s instructions; Invitrogen Corporation) was reverse transcribed using ImPromII (Promega Corporation) following the manufacturer’s protocol using 4 mM MgCl2 in a total volume of 20 μl. All PCR primers (MWG Biotech, Inc., Huntsville, AL, U.S.A.) were designed using the GeneScript online Real-Time Primer Design tool and sequence data from the Witches’ Broom Genome Project (Table 2). The primer temperature was set at 59 to 61°C and the amplicon size to 100 to 105 bp. The three sets of primers were used as possible internal controls span exon-exon boundaries, and thus were used to check the presence of genomic DNA in the different samples. Quantitative PCR was performed using SYBRGreen for the detection of fluorescence during amplification and as-says were performed on an ABI PRISM 7500 Sequence Detec-tion System (SDS) coupled to the ABI PRISM 7500 SDS soft-ware (Applied Biosystems, Foster City, CA, U.S.A.), using standard settings. A 16-μl RT-PCR reaction consisted of 8 μl of SYBRGreen Master Mix (Applied Biosciences), 300 nM each primer, and 25 ng of single-stranded cDNA. The thermal cycling conditions for SYBRGreen RT-PCR were 50°C for 2 min, then 94°C for 10 min, followed by 40 cycles of 94°C for 15 s and 60°C for 1 min. If the primer annealing temperature was lower than 60°C, an additional annealing step was added to the cycle for 30 s, prior to polymerization. A dissociation analysis was conducted after all amplifications to inspect for the formation of primer dimers and extraneous unintentional amplicons, such as the ones arising from amplification of ge-nomic DNA. Melting temperatures of the fragments were de-termined according to the manufacturer’s protocol (Table 2). No-template reactions were included as negative controls in every plate, and the standard curve of every primer pair was included in each experiment. Standard curves for each primer
pair were generated by serial dilutions of sample cDNA at 40 ng μl–1 in six 10-fold dilution steps and used for regression analyses. The variance of the duplicate measurements was <1%. Sequence Detection Software (Applied Biosystems) re-sults were imported into Microsoft Excel for further analysis. Raw expression levels were calculated from the average of the duplicate cycle threshold values using the standard curve ob-tained for each primer pair (ABI PRISM 7700 Sequence De-tection System User Bulletin No. 2). A normalization factor was obtained from the raw expression levels of the three nor-malization transcripts for each sample using the geNORM applet for Microsoft Excel (Vandesompele et al. 2002). For each gene, the fold change of expression level was obtained by dividing the normalized expression level of the same gene in the test conditions (A-Bio-CM and A-Sap-CM) by the normal-ized expression level of the gene in the control condition (A-Sap-Gly). The normalized expression level of each gene was obtained by dividing the average expression level of the gene by the normalization factor calculated by the geNorm algorithm.
ACKNOWLEDGMENTS
We thank the Brazilian financing agencies FAPESP (Process Nos. 2002/09280-1 and 2005/60432-5), CNPq (Process No. 471609/2003-0), Cargill, and SEAGRI. We also thank A. Pomela and the Fazenda Almirante Cacao for providing M. perniciosa isolates and spores used in this study.
LITERATURE CITED
Aime, M. C., and Phillips-Mora, W. 2005. The causal agents of witches' broom and frosty pod rot of cacao (chocolate, Theobroma cacao) form a new lineage of Marasmiaceae. Mycologia 97:1012-1022.
Akada, R., Yamamoto, J., and Yamashita, I. 1997. Screening and identifi-cation of yeast sequences that cause growth inhibition when overex-pressed. Mol. Gen. Genet. 254:267-274.
Altschul, S. F., Madden, T. L., Schaffer, A. A., Zhang, J., Zhang, Z., Miller, W., and Lipman, D. J. 1997. Gapped BLAST and PSI-BLAST: A new generation of protein database search programs. Nucleic Acids Res. 25:3389-3402.
Audic, S., and Claveric, J. M. 1997. The significance of digital gene ex-pression profiles. Genome Res. 7:986-995.
Bartley, B. G. D. 1986. Cacao, Theobroma cacao. Pages 25-42 in: Breed-ing for Durable Resistance in Perennial Crops. Food and Agriculture Organization of the United Nations, Rome.
Bidochka, M. J., Burke, S., and Ng, L. 1999. Extracellular hydrolytic en-zymes in the fungal genus Verticillium: Adaptations for pathogenesis. Can. J. Microbiol. 45:856-864.
Brazilian Ministry of Agriculture. 2005. Brazilian Agriculture in Figures: Agriculture—Production, Acreage, Yield, Imports, Exports, States Main Producers. 1991-2004: Permanent Crops/cocoa. Published online.
Ceita, G. D. O., Macedo, J. N. A., Santos, T. B., Alemanno, L., Gesteira, A. D., Micheli, F., Mariano, A. C., Gramacho, K. P., Silva, D. D. C., Meinhardt, L., Mazzafera, P., Pereira, G. A. G., and Cascardo, J. C. D. M. 2007. Involvement of calcium oxalate degradation during programmed cell death in Theobroma cacao tissues triggered by the hemibiotrophic fungus Moniliophthora pemiciosa. Plant Sci. 173:106-117.
Chuaqui, R. F., Bonner, R. F., Best, C. J. M., Gillespie, J. W., Flaig, M. J., Hewitt, S. M., Phillips, J. L., Krizman, D. B., Tangrea, M. A., Ahram, M., Linehan, W. M., Knezevic, V., and Emmert-Buck, M. R. 2002. Post-analysis follow-up and validation of microarray experiments. Nat. Genet. 32:509-514.
Clegg, N., Eroglu, B., Ferguson, C., Arnold, H., Moorman, A., and Nelson, P. S. 2002. Digital expression profiles of the prostate androgen-response program. J. Steroid Biochem. Mol. Biol. 80:13-23.
Coleman, M., Henricot, B., Arnau, J., and Oliver, R. P. 1997. Starvation-induced genes of the tomato pathogen Cladosporium fulvum are also induced during growth in planta. Mol. Plant-Microbe Interact. 10:1106-1109.
Cramer, R. A., and Lawrence, C. B. 2004. Identification of Alternaria brassicicola genes expressed in planta during pathogenesis of Arabi-dopsis thaliana. Fungal Genet. Biol. 41:115-128.
Csank, C., and Haynes, K. 2000. Candida glabrata displays pseudohyphal growth. FEMS (Fed. Eur. Microbiol. Soc.) Microbiol. Lett. 189:115-120.

Vol. 21, No. 7, 2008 / 907
Deising, H., Rauscher, M., Haug, M., and Heiler, S. 1995. Differentiation and cell-wall degrading enzymes in the obligately biotrophic rust fun-gus Uromyces viciae fabae. Can. J. Bot. Rev. Can. Bot. 73:S624-S631.
Derisi, J. L., Iyer, V. R., and Brown, P. O. 1997. Exploring the metabolic and genetic control of gene expression on a genomic scale. Science 278:680-686.
Divon, H. H., and Fluhr, R. 2007. Nutrition acquisition strategies during fungal infection of plants. FEMS (Fed. Eur. Microbiol. Soc.) Microbiol. Lett. 266:65-74.
Dongowski, G. and Bock, W. 1981. Characterization of the cleaving mechanism of pectinesterase of Aspergillus niger. Nahrung 25:K5-K7.
Donofrio, N. M., Oh, Y., Lundy, R., Pan, H., Brown, D. E., Jeong, J. S., Coughlan, S., Mitchell, T. K., and Dean, R. A. 2006. Global gene ex-pression during nitrogen starvation in the rice blast fungus, Magna-porthe grisea. Fungal Genet. Biol. 43:605-617.
Do Rio, M. C. S., De Oliveira, B. V., Thomazella, D. P. T., Da Silva, J. A. F., and Pereira, G. A. G. 2008 Production of calcium oxalate crystals by the basidiomycete Moniliophthora perniciosa, the causal agent of the Witches' Broom Disease of cacao. Curr. Microbiol. 56:363-370.
Dufresne, M., Perfect, S., Pellier, A. L., Bailey, J. A., and Langin, I. 2000. A GAL4-like protein is involved in the switch between biotrophic and necrotrophic phases of the infection process of Colletotrichum lindemu-thianum on common bean. Plant Cell 12:1579-1589.
Eastwood, D. C., Kingsnorth, C. S., Jones, H., and Burton, K. S. 2001. Genes with increased transcript levels following harvest of the sporo-phores of Agaricus bisporus have multiple physiological roles. Mycol. Res. 105:1223-1230.
Engebrecht, J., Brent, R., and Kaderbhai, M. A. 1998. Unit 1.6. minipreps of plasmid DNA. Pages 1.6.1-1.6.3. in: Current Protocols in Molecular Biology. F. M. Ausubel, R. Brent, R. E. Kingston, D. D. Moore, J. G. Seidman, J. A. Smith, and K. Struhl, (eds.), John Wiley and Sons, New York.
Evans, H. C. 1978. Witches’ broom disease of cocoa (Crinipellis pernici-osa) in Ecuador. I. The fungus. Ann. Appl. Biol. 89:186-192.
Evans, H. C. 1980. Pleomorphism in Crinipellis perniciosa, causal agent of Witches’ broom disease of cocoa. Trans. Br. Mycol. Soc. 74:515-526.
Ewing, B., Hillier, L., Wendl, M. C., and Green, P. 1998. Base-calling of automated sequencer traces using Phred. I. Accuracy assessment. Ge-nome Res. 8:175-185.
Fernandes, L., Loguercio-Leite, C., Esposito, E., and Reis, M. M. 2005. In vitro wood decay of Eucalyptus grandis by the basidiomycete fungus Phellinus flavomarginatus. Int. Biodeterior. Biodegrad. 55:187-193.
Ferreira, R. B., Monteiro, S., Freitas, R., Santos, C. N., Chen, Z. J., Batista, L. M., Duarte, J., Borges, A., and Teixeira, A. R. 2006. Fungal pathogens: The battle for plant infection. Crit. Rev. Plant Sci. 25:505-524.
Ferreira, R. B., Monteiro, S., Freitas, R., Santos, C. N., Chen, Z., Batista, L. M., Duarte, J., Borges, A., and Teixeira, A. R. 2007. The role of plant defence proteins in fungal pathogenesis. Mol. Plant Pathol. 8:677-700.
Frendo, P., Didierjean, L., Passelegue, E., and Burkard, G. 1992. Abiotic stresses induce a thaumatin-like protein in maize, cDNA isolation and sequence analysis. Plant Sci. 85:61-69.
Gage, M. J., Rane, S. G., Hockerman, G. H., and Smith, T. J. 2002. The virally encoded fungal toxin KP4 specifically blocks L-type voltage-gated calcium channels. Mol. Pharmacol. 61:936-944.
Gao, H. C., Wang, Y., Liu, X. D., Yan, T. F., Wu, L. Y., Alm, E., Arkin, A., Thompson, D. K., and Zhou, J. Z. 2004. Global transcriptome analysis of the heat shock response of Shewanella oneidensis. J. Bacteriol. 186:7796-7803.
Gardner, J. M., McBryde, C., Vystavelova, A., Lopes, M. D., and Jiranek, V. 2005. Identification of genes affecting glucose catabolism in nitro-gen-limited fermentation. FEMS (Fed. Eur. Microbiol. Soc.) Yeast Res. 5:791-800.
Giles, S. S., Perfect, J. R., and Cox, G. M. 2005. Cytochrome c peroxidase contributes to the antioxidant defense of Cryptococcus neoformans. Fungal Genet. Biol. 42:20-29.
Gotesson, A., Marshall, J. S., Jones, D. A., and Hardham, A. R. 2002. Characterization and evolutionary analysis of a large polygalacturonase gene family in the oomycete plant pathogen Phytophthora cinnamomi. Mol. Plant-Microbe Interact. 15:907-921.
Grahn, E., Askarieh, G., Holmner, A., Tateno, H., Winter, H. C., Goldstein, I. J., and Krengell, U. 2007. Crystal structure of the Marasmius oreades mushroom lectin in complex with a Xenotransplantation epitope. J. Mol. Biol. 369:710-721.
Gratao, P. L., Polle, A., Lea, P. J., and Azevedo, R. A. 2005. Making the life of heavy metal-stressed plants a little easier. Funct. Plant Biol. 32:481-494.
Griffith, G. W., Nicholson, J. N., Nenninger, A., Birch, R. N., and Hedger, J. N. 2003. Witches’ brooms and frosty pods: Two major pathogens of cacao. N. Z. J. Bot. 41:423-435.
Hahn, M., and Mendgen, K. 1997. Characterization of in planta induced rust genes isolated from a haustorium-specific cDNA library. Mol. Plant-Microbe Interact. 10:427-437.
Hahn, M., Neef, U., Struck, C., Gottfert, M., and Mendgen, K. 1997. A pu-tative amino acid transporter is specifically expressed in haustoria of the rust fungus Uromyces fabae. Mol. Plant-Microbe Interact. 10:438-445.
Halaouli, S., Asther, M., Sigoillot, J. C., Hamdi, M., and Lomascolo, A. 2006. Fungal tyrosinases: New prospects in molecular characteristics, bioengineering and biotechnological applications. J. Appl. Microbiol. 100:219-232.
Helmann, J. D., Wu, M. F. W., Kobel, P. A., Gamo, F. J., Wilson, M., Morshedi, M. M., Navre, M., and Paddon, C. 2001. Global transcrip-tional response of Bacillus subtilis to heat shock. J. Bacteriol. 183:7318-7328.
Herrmann, K. M. 1995a. The shikimate pathway as an entry to aromatic secondary metabolism. Plant Physiol. 107:7-12.
Herrmann, K. M. 1995b. The shikimate pathway—early steps in the bio-synthesis of aromatic compounds. Plant Cell 7:907-919.
Huang, X. and Madan, A. 1999. CAP3: A DNA sequence assembly pro-gram. Genome Res. 9:868-877.
Jacobson, E. S. 2000. Pathogenic roles for fungal melanins. Clin. Micro-biol. Rev. 13:708-717.
Kapich, A. N., Jensen, K. A., and Hammel, K. E. 1999. Peroxyl radicals are potential agents of lignin biodegradation. FEBS (Fed. Eur. Bio-chem. Soc.) Lett. 461:115-119.
Kilaru, A., Bailey, B. A., and Hasenstein, K. H. 2007. Moniliophthora per-niciosa produces hormones and alters endogenous auxin and salicylic acid in infected cocoa leaves. FEMS (Fed. Eur. Microbiol. Soc.) Micro-biol. Lett. 274:238-244.
Larionov, A., Krause, A., and Miller, W. 2005. A standard curve based method for relative real time PCR data processing. BMC Bioinf. 6:62.
Lau, G., and Hamer, J. E. 1996. Regulatory genes controlling MPG1 ex-pression and pathogenicity in the rice blast fungus Magnaporthe grisea. Plant Cell 8:771-781.
Lawrence, J. S., Campelo, A. M. F. L., and Figuereido, J. M. 1991. Enfer-midades do cacaueiro II—Doenças fúngicas que ocorrem nas folhas, ramos e tronco. Agrotropica 3:1-14.
Lenz, H., Wunderwald, P., and Eggerer, H. 1976. Partial purification and some properties of oxalacetase from Aspergillus niger. Eur. J. Biochem. 65:225-236.
Leuthner, B., Aichinger, C., Oehmen, E., Koopmann, E., Muller, O., Muller, P., Kahmann, R., Bolker, M., and Schreier, P. H. 2005. A H2O2-produc-ing glyoxal oxidase is required for filamentous growth and pathogenic-ity in Ustilago maydis. Mol. Genet. Genomics 272:639-650.
Liu, Y. B., Fiskum, G., and Schubert, D. 2002. Generation of reactive oxy-gen species by the mitochondrial electron transport chain. J. Neuro-chem. 80:780-787.
Lonnstedt, I., and Speed, T. 2002. Replicated microarray data. Stat. Sin. 12:31-46.
Luyten, K., Albertyn, J., Skibbe, F., Prior, B. A., Ramos, J., Thevelein, J. M., and Hohmann, S. 1994. The Fps1 gene-product functions as a glyc-erol facilitator in the yeast Saccharomyces cerevisiae. Folia Microbiol. 39:534-536.
Luyten, K., Albertyn, J., Skibbe, W. F., Prior, B. A., Ramos, J., Thevelein, J. M., and Hohmann, S. 1995. Fps1, A yeast member of the MIP family of channel proteins, is a facilitator for glycerol uptake and efflux and is inactive under osmotic stress. EMBO (Eur. Mol. Biol. Organ.) J. 14:1360-1371.
Mabrouk, S. S., Abdel-Fattah, A. F., and Ismail, A. M. 1979. Preparation and properties of pectic enzymes produced by Trichoderma lignorum. Zentralbl. Bakteriol. Naturwiss. 134:282-286.
Mandels, M., Reese, E. T., and Parrish, F. W. 1962. Sophorose as an in-ducer of cellulase in Trichoderma viride. J. Bacteriol. 83:400.
Marzluf, G. A. 1997. Genetic regulation of nitrogen metabolism in the fungi. Microbiol. Mol. Biol. Rev. 61:17-32.
Meinhardt, L. W., Bellato, C. D., Rincones, J., Azevedo, R. A., Cascardo, J. C. M., and Pereira, G. A. G. 2006. In vitro production of biotrophic-like cultures of Crinipellis perniciosa, the causal agent of witches' broom disease of Theobroma cacao. Curr. Microbiol. 52:191-196.
Nakagawa, T., Miyaji, T., Yurimoto, H., Sakai, Y., Kato, N., and Tomizuka, N. 2000. A methylotrophic pathway participates in pectin utilization by Candida boidinii. Appl. Environ. Microbiol. 66:4253-4257.
Nakagawa, T., Yamada, K., Fujimura, S., Ito, T., Miyaji, T., and Tomizuka, N. 2005. Pectin utilization by the methylotrophic yeast Pichia methano-lica. Microbiol.-SGM 151:2047-2052.
Newman, T., de Bruijin, F. J., Green, P., Keegstra, K., Kende, H., McIntosh, L., Ohlrogge, J., Raikhel, N., and Thomashow, M. 1994. Genes Galore: A summary of methods for accessing results from large-scale partial sequencing of anonymous Arabidopsis cDNA clones. Plant Physiol. 106:1241-1255.
908 / Molecular Plant-Microbe Interactions
Ohlrogge, J., and Benning, C. 2000. Unraveling plant metabolism by EST analysis. Curr. Opin. Plant Biol. 3:224-228.
Palfree, R. G. E., and Bussey, H. 1979. Yeast killer toxin—purification and characterization of the protein toxin from Saccharomyces cerevisiae. Eur. J. Biochem. 93:487-493.
Paux, E., Carocha, V., Marques, C., de Sousa, A. M., Borralho, N., Sivadon, P., and Grima-Pettenati, J. 2005. Transcript profiling of Eucalyptus xylem genes during tension wood formation. New Phytol. 167:89-100.
Pazzagli, L., Cappugi, G., Manao, G., Camici, G., Santini, A., and Scala, A. 1999. Purification, characterization, and amino acid sequence of cerato-platanin, a new phytotoxic protein from Ceratocystis fimbriata f. sp platani. J. Biol. Chem. 274:24959-24964.
Penman, D., Britton, G., Hardwick, K., Collin, H. A., and Isaac, S. 2000. Chitin as a measure of biomass of Crinipellis perniciosa, causal agent of witches’ broom disease of Theobroma cacao. Mycol. Res. 104:671-675.
Pereira, J. L., Ram, A., Figuereido, J. M., and de Almeida, L. C. 1989. La primera aparición de la “escoba de bruja” en la principal área produc-tora de cacao del Brasil. Turrialba 39:459-461.
Pereira, J. L., de Almeida, L. C., and Santos, S. M. 1996. Witches’ broom disease of cocoa in Bahia: Attempts at eradication and containment. Crop Prot. 15:743-752.
Phalip, V., Delalande, F., Carapito, C., Goubet, F., Hatsch, D., Leize-Wagner, E., Dupree, P., Van Dorsselaer, A., and Jeltsch, J. M. 2005. Di-versity of the exoproteome of Fusarium graminearum grown on plant cell wall. Curr. Genet. 48:366-379.
Pieterse, C. M. J., Derksen, A. M. C. E., Folders, J., and Govers, F. 1994. Expression of the Phytophthora infestans ipib and ipio genes in planta and in vitro. Mol. Gen. Genet. 244:269-277.
Prieto, R., and Woloshuk, C. P. 1997. ord1, an oxidoreductase gene re-sponsible for conversion of O-methylsterigmatocystin to aflatoxin in Aspergillus flavus. Appl. Environ. Microbiol. 63:1661-1666.
Purdy, L. H., and Schmidt, R. A. 1996. Status of cacao witches’ broom: Biology, epidemiology and management. Annu. Rev. Phytopathol. 34:573-594.
Qi, W. H., Chil, K., and Trail, F. 2006. Microarray analysis of transcript accumulation during perithecium development in the filamentous fun-gus Gibberella zeae (anamorph Fusarium graminearum). Mol. Genet. Genomics 276:87-100.
Rajeevan, M. S., Vernon, S. D., Taysavang, N., and Unger, E. R. 2001. Validation of array-based gene expression profiles by real-time (kinetic) RT-PCR. J. Mol. Diagn. 3:26-31.
Ribichich, K. F., Salem-Izacc, S. M., Georg, R. C., Vencio, R. Z., Navarro, L. D., and Gomes, S. L. 2005. Gene discovery and expression profile analysis through sequencing of expressed sequence tags from different developmental stages of the chytridiomycete Blastocladiella emersonii. Eukaryot. Cell 4:455-464.
Rincones, J., Meinhardt, L. W., Vidal, B. C., and Pereira, G. A. 2003. Elec-trophoretic karyotype analysis of Crinipellis perniciosa, the causal agent of witches’ broom disease of Theobroma cacao. Mycol. Res. 107:452-458.
Rincones, J., Mazotti, G. D., Griffith, G. W., Pomela, A., Figueira, A., Leal, G. A., Queiroz, M. V., Pereira, J. F., Azevedo, R. A., Pereira, G. A. G., and Meinhardt, L. W. 2006. Genetic variability and chromosome-length polymorphisms of the witches' broom pathogen Crinipellis per-niciosa from various plant hosts in South America. Mycol. Res. 110:821-832.
Ruepp, A., Zollner, A., Maier, D., Albermann, K., Hani, J., Mokrejs, M., Tetko, I., Guldener, U., Mannhaupt, G., Munsterkotter, M., and Mewes, H. W. 2004. The FunCat, a functional annotation scheme for systematic classification of proteins from whole genomes. Nucleic Acids Res. 32:5539-5545.
Sambrook, J., and Russell, D. W. 2001. Molecular Cloning: A Laboratory Manual. Cold Spring Harbor Laboratory, Cold Spring Harbor, NY, U.S.A.
Scarpari, L. M., Meinhardt, L. W., Mazzafera, P., Pomella, A. W., Schiavinato, M. A., Cascardo, J. C., and Pereira, G. A. 2005. Biochemi-cal changes during the development of witches' broom: The most im-portant disease of cocoa in Brazil caused by Crinipellis perniciosa. J. Exp. Bot. 56:865-877.
Schmitt, M. J. and Breinig, F. 2002. The viral killer system in yeast: From
molecular biology to application. FEMS (Fed. Eur. Microbiol. Soc.) Microbiol. Rev. 26:257-276.
Schmitt, M. J., and Breinig, F. 2006. Yeast viral killer toxins: Lethality and self-protection. Nat. Rev. Microbiol. 4:212-221.
Silva, S. D. V. M., and Matsuoka, K. 1999. Histologia da Interação Crinipellis perniciosa em Cacaueiros Suscetível e Resistente à Vas-soura-de-Bruxa. Fitopatol. Bras. 24:54-59.
Smyth, G. K., and Speed, T. 2003. Normalization of cDNA microarray data. Methods 31:265-273.
Solomon, P. S., and Oliver, R. P. 2001. The nitrogen content of the tomato leaf apoplast increases during infection by Cladosporium fulvum. Planta 213:241-249.
Solomon, P. S., and Oliver, R. P. 2002. Evidence that γ-aminobutyric acid is a major nitrogen source during Cladosporum fulvum infection of to-mato. Planta 214:414-420.
Solomon, P. S., Waters, O. D. C., Simmonds, J., Cooper, R. M., and Oliver, R. P. 2005. The Mak2 MAP kinase signal transduction pathway is re-quired for pathogenicity in Stagonospora nodorum. Curr. Genet. 48:60-68.
Soundararajan, S., Jedd, G., Li, X. L., Ramos-Pamplona, M., Chua, N. H., and Naqvi, N. I. 2004. Woronin body function in Magnaporthe grisea is essential for efficient pathogenesis and for survival during nitrogen star-vation stress. Plant Cell 16:1564-1574.
Stintzi, A. 2003. Gene expression profile of Campylobacter jejuni in re-sponse to growth temperature variation. J. Bacteriol. 185:2009-2016.
Struck, C., Ernst, M., and Hahn, M. 2002. Characterization of a develop-mentally regulated amino acid transporter (AAT1p) of the rust fungus Uromyces fabae. Mol. Plant Pathol. 3:23-30.
Telles, G. P., and Silva, F. R. 2001. Trimming and clustering sugarcane ESTs. Genet. Mol. Biol. 24:17-23.
Telles, G. P., Braga, M. D. V., Dias, Z., Lin, T. L., Quitzau, J. A. A., da Silva, F. R., and Meidanis, J. 2001. Bioinformatics of the sugarcane EST project. Genet. Mol. Biol. 24:9-15.
VanderKlei, I. J., Harder, W., and Veenhuis, M. 1991. Biosynthesis and as-sembly of alcohol oxidase, a peroxisomal matrix protein in methylotro-phic yeasts—a review. Yeast 7:195-209.
Vandesompele, J., De Preter, K., Pattyn, F., Poppe, B., Van Roy, N., De Paepe, A., and Speleman, F. 2002. Accurate normalization of real-time quantitative RT-PCR data by geometric averaging of multiple internal control genes. Genome Biol. 3:1-12.
Weber, I., Assmann, D., Thines, E., and Steinberg, G. 2006. Polar localiz-ing class V myosin chitin synthases are essential during early plant infection in the plant pathogenic fungus Ustilago maydis. Plant Cell 18:225-242.
Weiler, F., Rehfeldt, K., Bautz, F., and Schmitt, M. J. 2002. The Zygosac-charomyces bailii antifungal virus toxin zygocin: Cloning and expres-sion in a heterologous fungal host. Mol. Microbiol. 46:1095-1105.
Wurmbach, E., Yuen, T., Ebersole, B. J., and Sealfon, S. C. 2001. Gonad-otropin-releasing hormone receptor-coupled gene network organization. J. Biol. Chem. 276:47195-47201.
Yang, Y. H., Dudoit, S., Luu, P., Lin, D. M., Peng, V., Ngai, J., and Speed, T. P. 2002. Normalization for cDNA microarray data: A robust compos-ite method addressing single and multiple slide systematic variation. Nucleic Acids Res. 30: e15.
AUTHOR-RECOMMENDED INTERNET RESOURCES
Brazilian Ministry of Agriculture website: www.agricultura.gov.br EMBL-EBI Expression Profiler website: ep.ebi.ac.uk/EP/EPCLUST Gene Ontology website: www.geneontology.org geNorm applet: medgen.ugent.be/~jvdesomp/genorm/ GenScript Real-Time PCR Primer Design tool:
www.genscript.com/ssl-bin/app/primer Laboratório de Genômica e Expressão Witches’ (LGE) Broom Genome
Project: www.lge.ibi.unicamp.br/vassoura M. perniciosa Genome Project: www.lge.ibi.unicamp.br/vassoura Munich Information Center for Protein Sequences FunCat software:
mips.gsf.de/projects/funcat University of Washington Phil Green Laboratory website: www.phrap.org
Related Documents