Land 2022, 11, 157. https://doi.org/10.3390/land11020157 www.mdpi.com/journal/land Article Differential Evolution of Farmers’ Livelihood Strategies since the 1980s on the Loess Plateau, China Kongsen Wu 1,2 , Xinjun Yang 1,2, *, Jian Zhang 2 and Ziqiao Wang 2 1 Shaanxi Key Laboratory of Earth Surface System and Environmental Carrying Capacity, Northwest University, Xi’an 710127, China; [email protected] 2 College of Urban and Environmental Sciences, Northwest University, Xi’an 710127, China; [email protected] (J.Z.); [email protected] (Z.W.) * Correspondence: [email protected] Abstract: Understanding the evolution of farmers’ livelihood strategies (FLS) is crucial for main- taining the sustainable development of farmers’ livelihoods, especially on the arid Loess Plateau, China. This study constructed a novel analytical framework for analyzing the evolution of FLS and the critical influencing factors. Changwu County, an apple cultivation region, was selected as a case study. The results suggest that four types of livelihood strategies (crop-planting, ap- ple-planting, work-oriented, and part-time comprehensive) have emerged since the 1980s. The evolutionary process of leading FLS varies across geographic location. In the loess tableland region and economic fringe region, this evolution followed a progressive path from the crop-planting type to the apple-planting type to the work-oriented type, while in the loess gully region, loess ridge region, and economic core region, FLS jumped directly from the crop-planting type to the work-oriented type. The geographic location, training opportunities, garden area, cultivated land area, production and living materials, loan opportunities, and education level were found to be the critical factors influencing the differentiation and development of FLS. The analytical framework proposed here is also applicable for studying the evolution of FLS in other counties on the Loess Plateau, considering the representativeness of the selected case. Keywords: livelihood strategy; farmers; evolution and development; geographic location; livelihood capital 1. Introduction A livelihood comprises the capabilities, capital (including both material and social resources), and activities required for a means of living [1–3]. The livelihoods of farmers in developing countries and regions have attracted much attention, especially in remote and ecologically fragile regions [4–8]. Due to low urbanization and slow livelihood di- versification, most farmers in these regions have relied on natural resources to maintain their livelihoods. However, farmers’ livelihood activities have been changing continu- ously with developments in social productivity. Existing studies have found that, af- fected by various disturbances, farmers either actively or passively give up their original livelihood activities and seek new ones, creating new livelihood strategies [9–11]. Af- fected by the development of rural society and the economy, the trend toward part-time and non-agricultural activities in farmers’ livelihood strategies (FLS) in developing countries seems inevitable. The applicability of livelihood strategies not only affects the efficiency of the use of livelihood capital, but is also the key to livelihood outcome and stability, which play important roles in the continuous and stable operation of the entire livelihood system [12–14]. Therefore, it is of great practical value to understand FLS and their evolution. Citation: Wu, K.; Yang, X.; Zhang, J.; Wang, Z. Differential Evolution of Farmers’ Livelihood Strategies since the 1980s on the Loess Plateau, China. Land 2022, 11, 157. https://doi.org/10.3390/land11020157 Academic Editor: Charlie Shackleton Received: 28 December 2021 Accepted: 18 January 2022 Published: 19 January 2022 Publisher’s Note: MDPI stays neu- tral with regard to jurisdictional claims in published maps and insti- tutional affiliations. Copyright: © 2022 by the authors. Licensee MDPI, Basel, Switzerland. This article is an open access article distributed under the terms and conditions of the Creative Commons Attribution (CC BY) license (http://creativecommons.org/licenses /by/4.0/).

Welcome message from author
This document is posted to help you gain knowledge. Please leave a comment to let me know what you think about it! Share it to your friends and learn new things together.
Transcript
Land 2022, 11, 157. https://doi.org/10.3390/land11020157 www.mdpi.com/journal/land
Article
Differential Evolution of Farmers’ Livelihood Strategies since
the 1980s on the Loess Plateau, China
Kongsen Wu 1,2, Xinjun Yang 1,2,*, Jian Zhang 2 and Ziqiao Wang 2
1 Shaanxi Key Laboratory of Earth Surface System and Environmental Carrying Capacity,
Northwest University, Xi’an 710127, China; [email protected] 2 College of Urban and Environmental Sciences, Northwest University, Xi’an 710127, China;
[email protected] (J.Z.); [email protected] (Z.W.)
* Correspondence: [email protected]
Abstract: Understanding the evolution of farmers’ livelihood strategies (FLS) is crucial for main-
taining the sustainable development of farmers’ livelihoods, especially on the arid Loess Plateau,
China. This study constructed a novel analytical framework for analyzing the evolution of FLS and
the critical influencing factors. Changwu County, an apple cultivation region, was selected as a
case study. The results suggest that four types of livelihood strategies (crop-planting, ap-
ple-planting, work-oriented, and part-time comprehensive) have emerged since the 1980s. The
evolutionary process of leading FLS varies across geographic location. In the loess tableland region
and economic fringe region, this evolution followed a progressive path from the crop-planting type
to the apple-planting type to the work-oriented type, while in the loess gully region, loess ridge
region, and economic core region, FLS jumped directly from the crop-planting type to the
work-oriented type. The geographic location, training opportunities, garden area, cultivated land
area, production and living materials, loan opportunities, and education level were found to be the
critical factors influencing the differentiation and development of FLS. The analytical framework
proposed here is also applicable for studying the evolution of FLS in other counties on the Loess
Plateau, considering the representativeness of the selected case.
Keywords: livelihood strategy; farmers; evolution and development; geographic location;
livelihood capital
1. Introduction
A livelihood comprises the capabilities, capital (including both material and social
resources), and activities required for a means of living [1–3]. The livelihoods of farmers
in developing countries and regions have attracted much attention, especially in remote
and ecologically fragile regions [4–8]. Due to low urbanization and slow livelihood di-
versification, most farmers in these regions have relied on natural resources to maintain
their livelihoods. However, farmers’ livelihood activities have been changing continu-
ously with developments in social productivity. Existing studies have found that, af-
fected by various disturbances, farmers either actively or passively give up their original
livelihood activities and seek new ones, creating new livelihood strategies [9–11]. Af-
fected by the development of rural society and the economy, the trend toward part-time
and non-agricultural activities in farmers’ livelihood strategies (FLS) in developing
countries seems inevitable. The applicability of livelihood strategies not only affects the
efficiency of the use of livelihood capital, but is also the key to livelihood outcome and
stability, which play important roles in the continuous and stable operation of the entire
livelihood system [12–14]. Therefore, it is of great practical value to understand FLS and
their evolution.
Citation: Wu, K.; Yang, X.; Zhang, J.;
Wang, Z. Differential Evolution of
Farmers’ Livelihood Strategies since
the 1980s on the Loess Plateau,
China. Land 2022, 11, 157.
https://doi.org/10.3390/land11020157
Academic Editor: Charlie Shackleton
Received: 28 December 2021
Accepted: 18 January 2022
Published: 19 January 2022
Publisher’s Note: MDPI stays neu-
tral with regard to jurisdictional
claims in published maps and insti-
tutional affiliations.
Copyright: © 2022 by the authors.
Licensee MDPI, Basel, Switzerland.
This article is an open access article
distributed under the terms and
conditions of the Creative Commons
Attribution (CC BY) license
(http://creativecommons.org/licenses
/by/4.0/).
Land 2022, 11, 157 2 of 22
A livelihood strategy refers to the way that farmers combine and use different forms
of livelihood capital to achieve livelihood goals or pursue active livelihood outcomes
[1,2,15]. For the past 30 years, studies on FLS have mainly focused on the diversification
livelihood strategy and poverty, and livelihood strategies and their influencing factors.
Scoones divided FLS into four types: the extensification livelihood strategy, the agricul-
tural intensification livelihood strategy, the diversification livelihood strategy, and the
migration livelihood strategy [3]. Among them, the diversification livelihood strategy is a
process in which farmers rely on a combination of diversification livelihood activities and
social support capabilities to meet their needs in terms of maintaining and improving
their livelihoods [13]. Many scholars have explored the effect of the diversification live-
lihood strategy on the livelihood system of farmers, and concluded that this strategy is
not only conducive to improving the livelihood adaptability of farmers to external dis-
turbances, but also has a positive impact on eliminating poverty and improving liveli-
hood outcomes [16–20]. For example, Ho et al. revealed that the diversification livelihood
strategy can reduce risks and the uncertainties of livelihoods [21]. Through studies on the
diversification of the non-agricultural livelihood strategy in Zambia, Nambeye et al. in-
dicated that insufficient agricultural outcome is an important reason for farmers to adjust
their livelihood strategy to the diversified livelihood strategy, which will bring diversi-
fied sources of income [22]. Tukela et al. explored the relationship between strategy and
poverty in the Sidama Region, Ethiopia, and indicated that the diversification livelihood
strategy is more likely to reduce household poverty [23]. The above studies show that the
diversification livelihood strategy is of great significance for maintaining livelihood sta-
bility and reducing poverty.
With the continuous deepening of related research, studies have gradually begun to
focus on the influencing factors of FLS. However, most existing studies explored the ef-
fect on FLS from a single factor perspective. Some scholars have investigated the simi-
larities and differences in FLS in different locations in a diversified region to demonstrate
the role of geographic location in the formation and development of FLS [24,25]. Com-
plicated terrain conditions and differences in economic development among regions
have caused heterogeneity in the regional development conditions of farmers’ liveli-
hoods, resulting in the differentiation of FLS. Moreover, considering the development of
social productivity, some scholars have paid attention to the impact of climate change,
land use, policies, and other factors on FLS [26–33]. Raihan et al. explored the impact of
farmers’ adaptive choice of livelihood strategies in the face of climate change [34]. Mu-
latie et al. studied the impact of internal migration on the FLS in southwest Ethiopia [35].
Tang et al. studied the impact of returning farmland to forests on the FLS on the Loess
Plateau [36]; Sun et al. explored the influencing path of Targeted Poverty Alleviation
policies on FLS in China [37]. The research results of Mondal et al. show that the tour-
ism-oriented transfer of FLS contributes to the outcome of FLS [38]. In addition, liveli-
hood capital is a prerequisite for farmers’ livelihood activities and plays a supporting
role in the formation of FLS [39–43]. Farmers seek the best livelihood strategies by com-
bining different types of capital to maintain their livelihood security [44,45]. On this ba-
sis, scholars have conducted a large number of empirical studies on the impact of farm-
ers’ livelihood capital on FLS in developing countries and regions, which is of great rel-
evance to the sustainable development of farmers’ livelihoods [46–50]. For example, He
et al. studied the impact of human capital on FLS in Liangshan, Sichuan, and concluded
that human capital such as education, culture, and health status has a positive impact on
the choice of non-agricultural livelihood strategies [51]. By studying the role of
non-timber products in the FLS in the drylands of Sudan, Adam et al. revealed that nat-
ural capital is of great significance to the development of FLS in developing countries
[52]. Nath’s empirical research in coastal Bangladesh shows that different combinations
of livelihood capital lead to different combinations of livelihood strategies [53]. Malherbe
et al. studied the impact of social capital on FLS in the Solomon Islands, and concluded
that the accumulation of livelihood capital contributes to the development of diversified
Land 2022, 11, 157 3 of 22
livelihood strategies of farmers [54]. In contrast, few studies have explored the differen-
tiation and development of FLS from a comprehensive perspective that considers multi-
ple factors.
In reviewing the literature, we found that the existing studies are, in some ways,
insufficient. First, FLS are constantly adjusted in response to the development of
productivity. The existing body of research is composed primarily of static studies on the
status of FLS in a single period, while dynamic studies on the evolution of FLS are rela-
tively scarce. Second, it is necessary to construct an analytical framework that considers
the influence of multiple variables to explore the dynamic evolution of FLS.
China is the largest developing country in the world. According to the China Rural
Statistical Yearbook 2020 (https://data.cnki.net/yearbook/Single/N2020120306, the data
we obtained on 5 October 2021), at the end of 2019, the rural population was 551.62 mil-
lion, accounting for 39.4% of the total population. The sustainable livelihoods of the rural
population have become an important part of China’s “Rural Revitalization Strategy”.
Since the reform and opening up, China’s rural household structure and population em-
ployment characteristics have undergone tremendous changes. Members of the young
generation at the beginning of the reform and opening up are now mostly 50–60 years
old, and they have experienced the process of agricultural production that involves going
out to work and then returning home to engage in agricultural production. In addition,
the subsequent generation and new generation of families have been gradually separated
from the traditional extended family. Due to the lack of agricultural production skills,
family livelihood activities have gradually shifted to non-agricultural work. Elderly
people are engaged in agricultural production, while among younger workers, leaving
home to work has become the primary means of expanding rural livelihoods in China.
The Loess Plateau is a representative area of traditional agricultural production and the
main production area of grain crops in China. Since the reform and opening up, global
climate change, agricultural technology development, ecological protection policies, ur-
banization, and industrialization have considerably altered the development environ-
ment of traditional rural areas on the Loess Plateau. The employment direction has
shifted from agricultural to non-agricultural work, the economic structure has shifted
from primary industry to secondary and tertiary industries, and the agricultural crop
structure has shifted from grain crop planting to cash crops represented by fruits [55–58].
With these changes in the regional rural development environment, FLS have also con-
tinued to differentiate and develop. Understanding the dynamic evolution characteristics
of FLS can provide insights for policies targeting the healthy development of household
livelihoods and the rural economy on the Loess Plateau in the context of rural transfor-
mation. In addition, this information has important strategic value for the overall reali-
zation of rural revitalization in China.
Based on the regional development characteristics of the Loess Plateau, and drawing
on existing studies of farmers’ livelihoods, this paper constructed an analytical frame-
work specifically applicable to studying the evolution of FLS on the Loess Plateau. We
selected Changwu County, an apple cultivation region on the Loess Plateau, as the case
study area. The formation and evolution of FLS were investigated based on survey data
from farmers. This study aims to answer the following questions:
(1) How have FLS evolved?
(2) What are the main factors that have influenced the evolution of FLS?
The remainder of this paper is organized as follows. In Section 2, we construct the
analytical framework for FLS evolution. Section 3 presents the study area, study data,
and research methodology. Section 4 presents the research results of the evolution pro-
cess of FLS, influencing factors of FLS, and influence mechanisms. Section 6 discusses the
role of geographic location and livelihood capital in the evolution of FLS, the similarities
and differences with existing research, policy implications, the limitations of the study,
and future research. Finally, main conclusions of the study are presented in Section 6.
Land 2022, 11, 157 4 of 22
2. Analytical Framework
Multiple existing sustainable livelihood analytical frameworks, namely, the Sus-
tainable Livelihoods Approach (SLA) established by the UK’s Department for Interna-
tional Development (DFID) [2], the Livelihood Security Framework of Farmers proposed
by the Cooperative for American Remittances to Everywhere (CARE) [59], and the Sus-
tainable Livelihood Approach proposed by the United Nations Development Pro-
gramme (UNDP) [60], have been developed. However, these frameworks focus on dif-
ferent aspects of sustainable livelihoods. The SLA framework established by the DFID is
the most widely adopted and applied, and has become the classic paradigm for farmer
livelihood analysis. The SLA framework regards farmers as subjects who have certain
forms of livelihood capital that they use to earn a living in a context of vulnerability. The
acquisition of this livelihood capital is determined by the social, institutional, and or-
ganizational environment. This environment also affects the strategies that farmers use to
meet their livelihood goals. However, because the framework encompasses the entire
livelihood system, it provides insufficient information on specific intermediate links. In
addition, the framework is designed not for seeking a universal solution, but for sup-
porting analytical thinking. Therefore, it is necessary to adjust the framework according
to the study area in specific applications. For example, Chen et al. analyzed the livelihood
adaptability of farmers in the Minqin Oasis through an improved adaptive livelihood
framework [39], and Tang et al. used an improved livelihood framework to analyze the
livelihood sustainability of farmers on the Loess Plateau affected by the “Grain for
Green” program [36]. By referencing the SLA and accounting for the regional geograph-
ical environment, we constructed an analytical framework for studying the evolution of
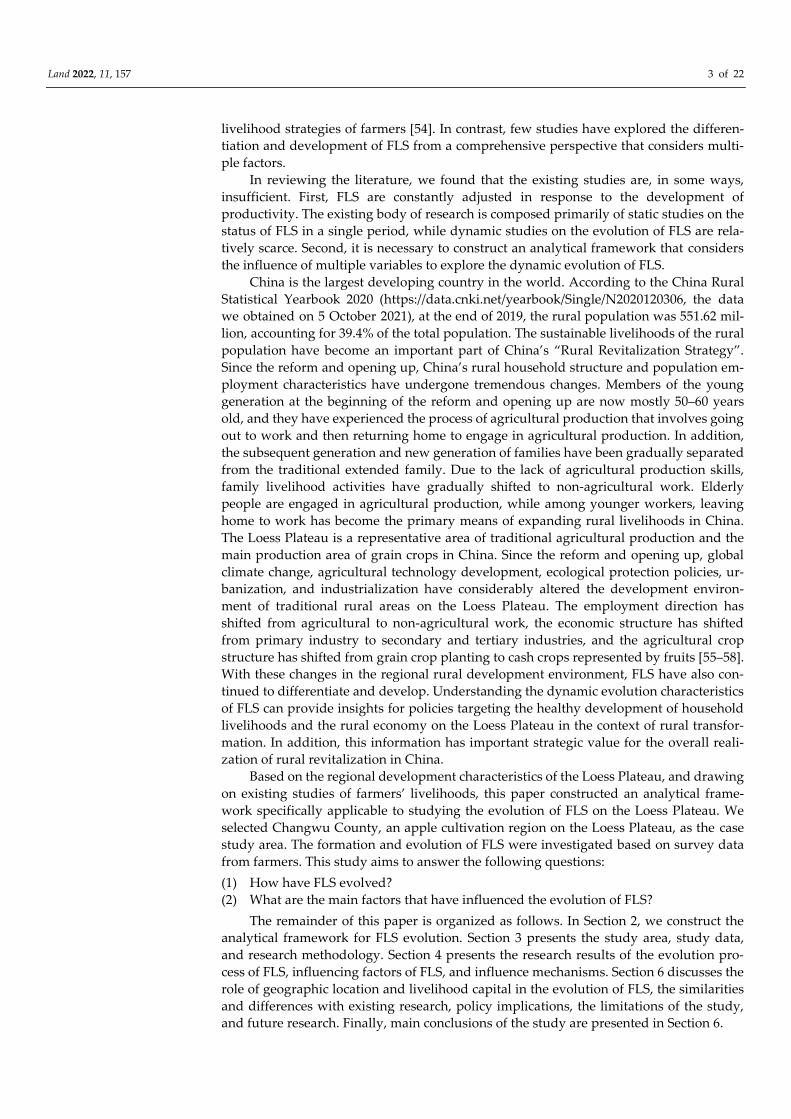
FLS on the Loess Plateau (Figure 1). In this framework, the livelihood strategy is the core,
and its formation and evolution are influenced by geographic location-related factors
(economic location, terrain location) and various forms of livelihood capital under a
uniform policy environment. According to this framework, we conducted study on the
evolution of FLS on the Loess Plateau.
Figure 1. Analytical framework for FLS evolution.
3. Materials and Methods
3.1. Study Area
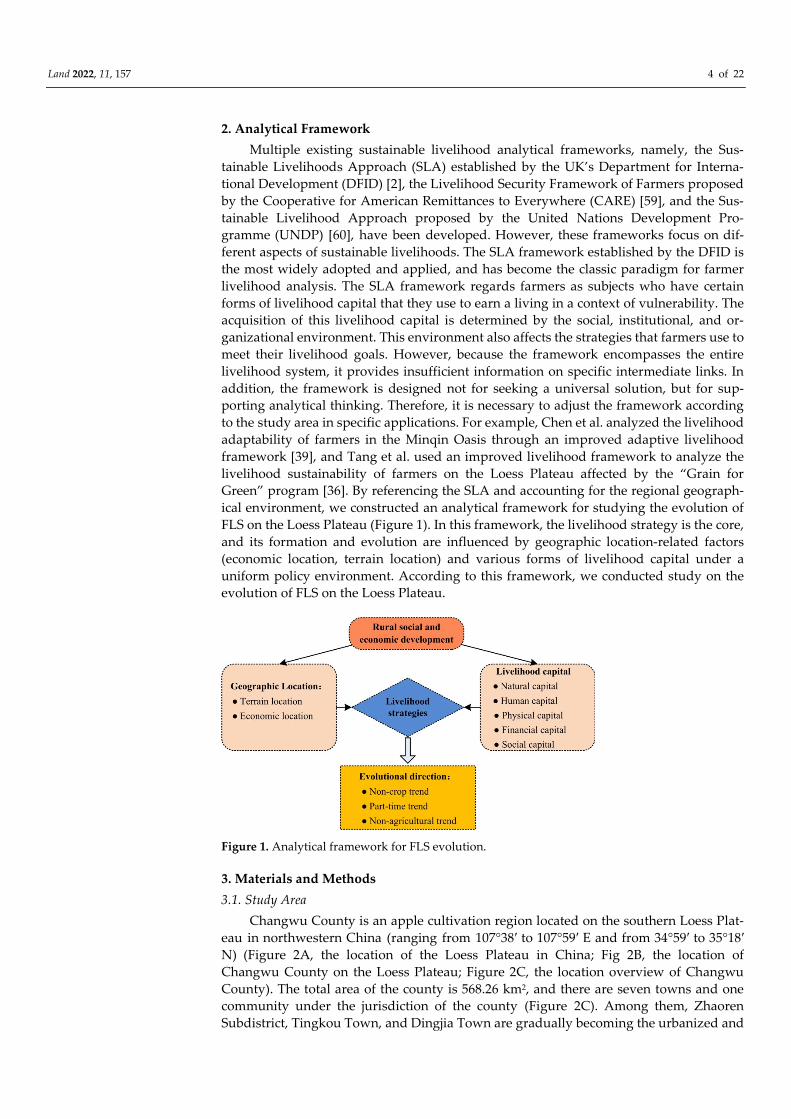
Changwu County is an apple cultivation region located on the southern Loess Plat-
eau in northwestern China (ranging from 107°38′ to 107°59′ E and from 34°59′ to 35°18′
N) (Figure 2A, the location of the Loess Plateau in China; Fig 2B, the location of
Changwu County on the Loess Plateau; Figure 2C, the location overview of Changwu
County). The total area of the county is 568.26 km2, and there are seven towns and one
community under the jurisdiction of the county (Figure 2C). Among them, Zhaoren
Subdistrict, Tingkou Town, and Dingjia Town are gradually becoming the urbanized and
Land 2022, 11, 157 5 of 22
economic core areas of Changwu County because they are an administrative center, coal
production region, and industrial park, while the remaining towns located in agricultural
production regions have become the economic fringe regions of this county. The terrain
of the county is primarily loess tableland, loess gully, and loess ridge. The elevation is
higher in the southwestern part and lower in the northeastern part, forming a typical lo-
ess plateau gully landform in the northern reaches of the Weihe River, the largest ana-
branch of the Yellow River.
Figure 2. Location of the study site on the Loess Plateau, China.
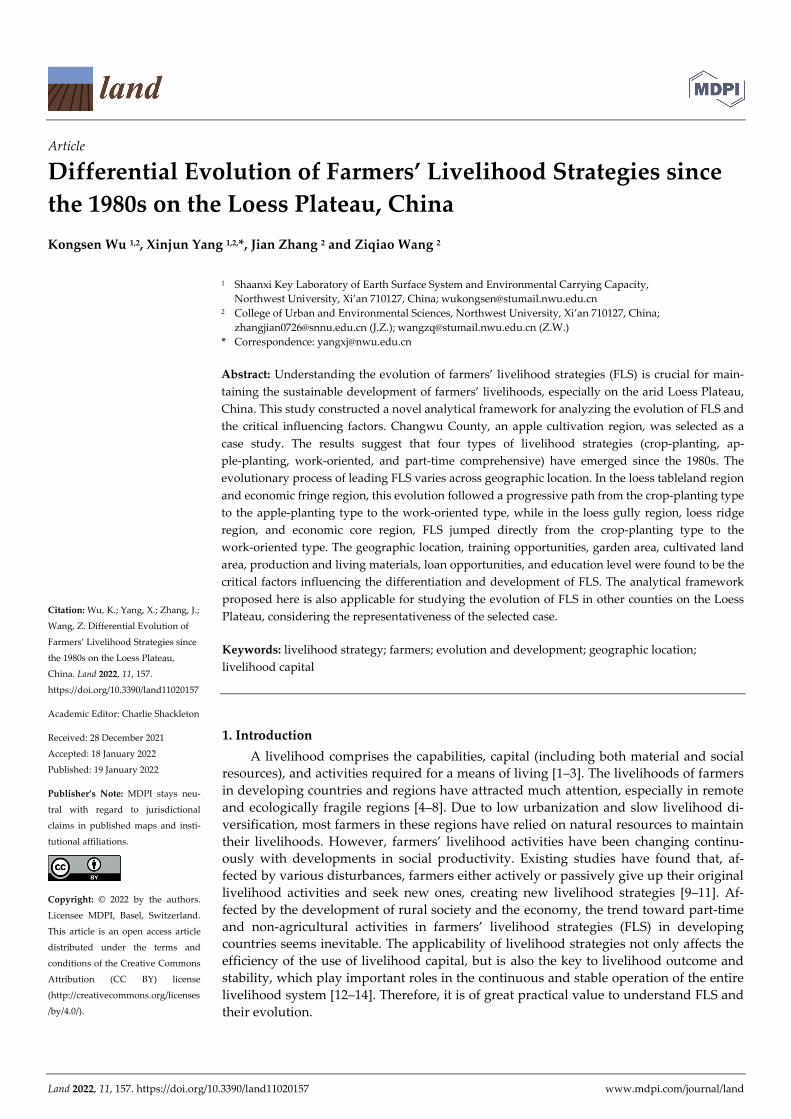
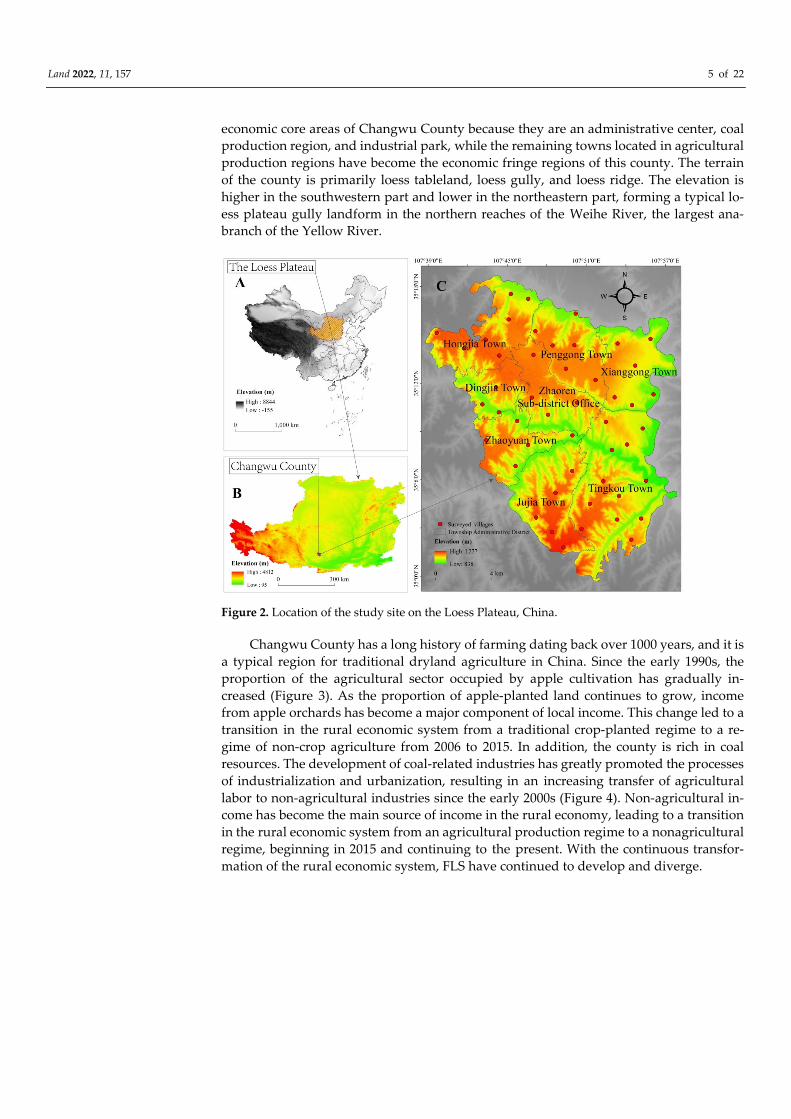
Changwu County has a long history of farming dating back over 1000 years, and it is
a typical region for traditional dryland agriculture in China. Since the early 1990s, the
proportion of the agricultural sector occupied by apple cultivation has gradually in-
creased (Figure 3). As the proportion of apple-planted land continues to grow, income
from apple orchards has become a major component of local income. This change led to a
transition in the rural economic system from a traditional crop-planted regime to a re-
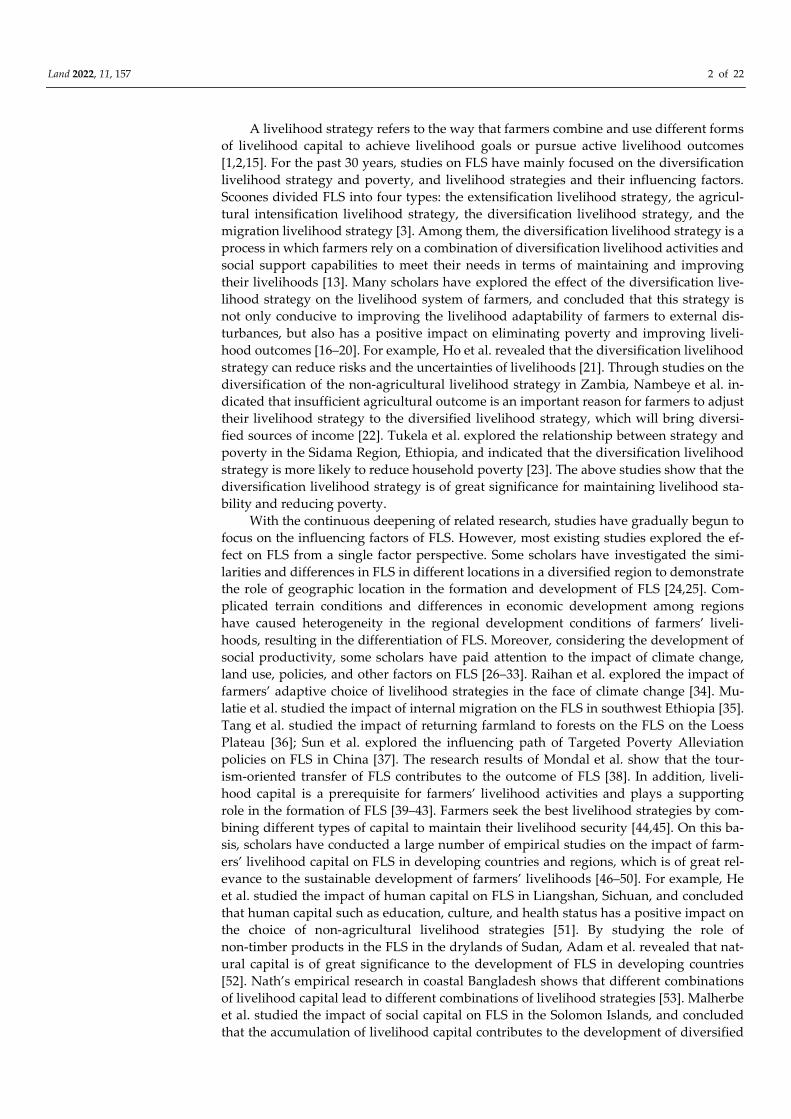
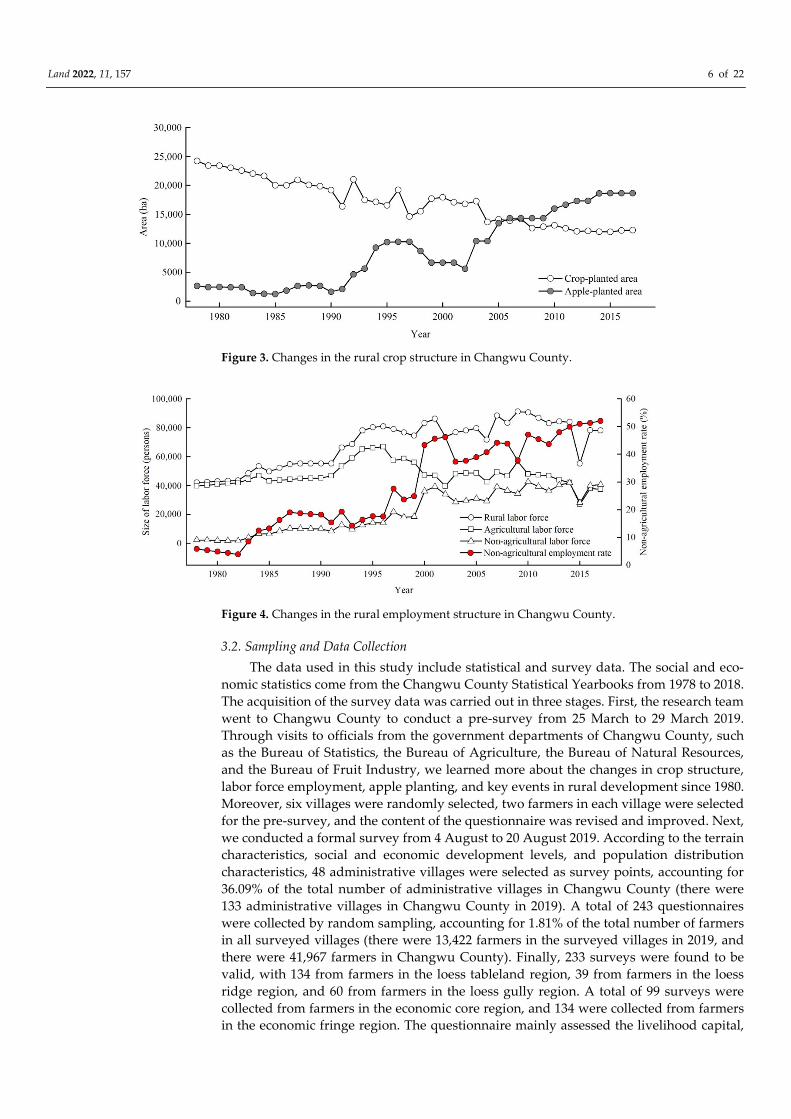
gime of non-crop agriculture from 2006 to 2015. In addition, the county is rich in coal
resources. The development of coal-related industries has greatly promoted the processes
of industrialization and urbanization, resulting in an increasing transfer of agricultural
labor to non-agricultural industries since the early 2000s (Figure 4). Non-agricultural in-
come has become the main source of income in the rural economy, leading to a transition
in the rural economic system from an agricultural production regime to a nonagricultural
regime, beginning in 2015 and continuing to the present. With the continuous transfor-
mation of the rural economic system, FLS have continued to develop and diverge.
Land 2022, 11, 157 6 of 22
Figure 3. Changes in the rural crop structure in Changwu County.
Figure 4. Changes in the rural employment structure in Changwu County.
3.2. Sampling and Data Collection
The data used in this study include statistical and survey data. The social and eco-
nomic statistics come from the Changwu County Statistical Yearbooks from 1978 to 2018.
The acquisition of the survey data was carried out in three stages. First, the research team
went to Changwu County to conduct a pre-survey from 25 March to 29 March 2019.
Through visits to officials from the government departments of Changwu County, such
as the Bureau of Statistics, the Bureau of Agriculture, the Bureau of Natural Resources,
and the Bureau of Fruit Industry, we learned more about the changes in crop structure,
labor force employment, apple planting, and key events in rural development since 1980.
Moreover, six villages were randomly selected, two farmers in each village were selected
for the pre-survey, and the content of the questionnaire was revised and improved. Next,
we conducted a formal survey from 4 August to 20 August 2019. According to the terrain
characteristics, social and economic development levels, and population distribution
characteristics, 48 administrative villages were selected as survey points, accounting for
36.09% of the total number of administrative villages in Changwu County (there were
133 administrative villages in Changwu County in 2019). A total of 243 questionnaires
were collected by random sampling, accounting for 1.81% of the total number of farmers
in all surveyed villages (there were 13,422 farmers in the surveyed villages in 2019, and
there were 41,967 farmers in Changwu County). Finally, 233 surveys were found to be
valid, with 134 from farmers in the loess tableland region, 39 from farmers in the loess
ridge region, and 60 from farmers in the loess gully region. A total of 99 surveys were
collected from farmers in the economic core region, and 134 were collected from farmers
in the economic fringe region. The questionnaire mainly assessed the livelihood capital,
Land 2022, 11, 157 7 of 22
livelihood activities, and income structure of farmers in different periods (1990, 2000,
2010 and 2018). Finally, we conducted a supplementary survey from 11 October to 15
October 2019. We randomly selected the heads of 20 surveyed villages from different re-
gions for a 30–50 min semi-structured interview. Among these heads of the surveyed
villages, eight were from the loess tableland region, six were from the loess ridge region,
six were from the loess gully region, fifteen were from the economic fringe region, and
five were from the economic core region. The interview content included ① the history
of and reason for apple planting in the villages; ② the main factors restricting the de-
velopment of the village and the future development direction; and ③ the evolution
process of population outflow and labor migration. The interview data can provide ref-
erence and support for the interpretation of the research results.
3.3. Classification Criteria for FLS
According to the survey, the livelihood activities of the farmers in the study region
are mainly crop cultivation, apple cultivation, and non-agricultural work. According to
the proportion of income obtained via various livelihood activities, the FLS were divided
into four types: the crop-planting livelihood strategy (CPLS), the apple-planting liveli-
hood strategy (APLS), the work-oriented livelihood strategy (WOLS), and the part-time
comprehensive livelihood strategy (PTLS). The classification criteria are shown in Table
1.
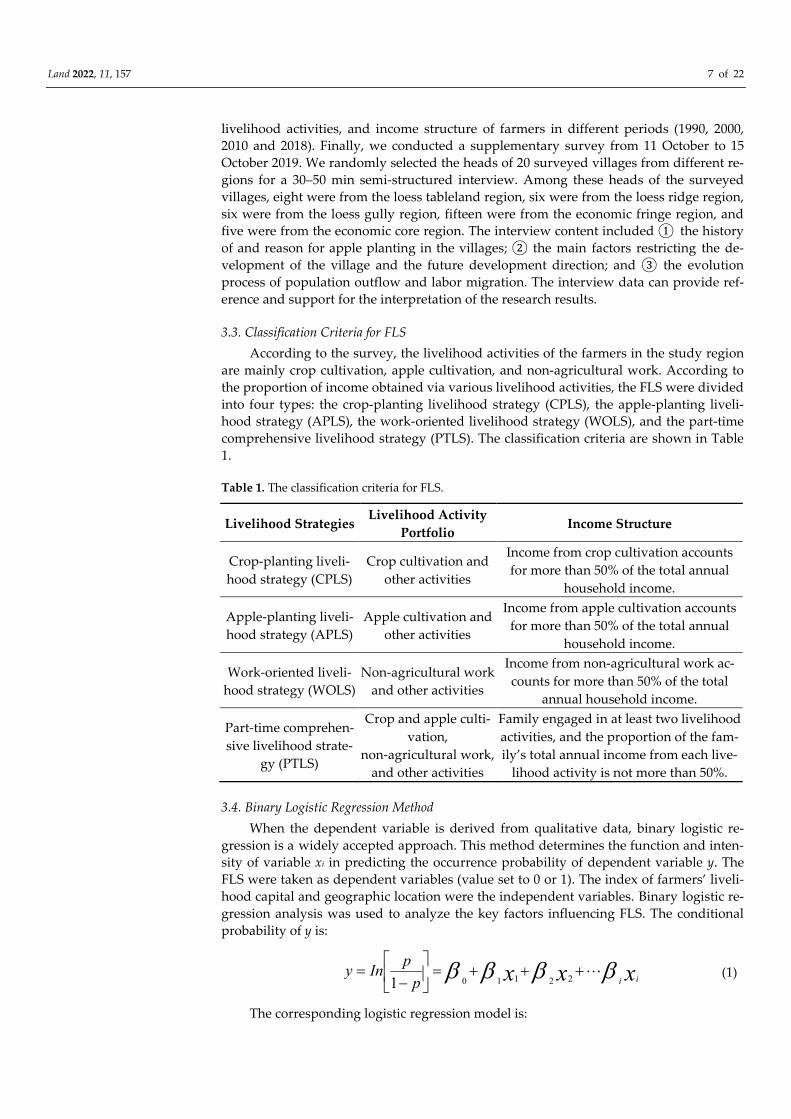
Table 1. The classification criteria for FLS.
Livelihood Strategies Livelihood Activity
Portfolio Income Structure
Crop-planting liveli-
hood strategy (CPLS)
Crop cultivation and
other activities
Income from crop cultivation accounts
for more than 50% of the total annual
household income.
Apple-planting liveli-
hood strategy (APLS)
Apple cultivation and
other activities
Income from apple cultivation accounts
for more than 50% of the total annual
household income.
Work-oriented liveli-
hood strategy (WOLS)
Non-agricultural work
and other activities
Income from non-agricultural work ac-
counts for more than 50% of the total
annual household income.
Part-time comprehen-
sive livelihood strate-
gy (PTLS)
Crop and apple culti-
vation,
non-agricultural work,
and other activities
Family engaged in at least two livelihood
activities, and the proportion of the fam-
ily’s total annual income from each live-
lihood activity is not more than 50%.
3.4. Binary Logistic Regression Method
When the dependent variable is derived from qualitative data, binary logistic re-
gression is a widely accepted approach. This method determines the function and inten-
sity of variable xi in predicting the occurrence probability of dependent variable y. The
FLS were taken as dependent variables (value set to 0 or 1). The index of farmers’ liveli-
hood capital and geographic location were the independent variables. Binary logistic re-
gression analysis was used to analyze the key factors influencing FLS. The conditional
probability of y is:
xxx iip
pIny
221101 (1)
The corresponding logistic regression model is:
Land 2022, 11, 157 8 of 22
)exp(1
)exp(
22110
22110
xxxxxx
ii
iiP
(2)
where P is the probability of selecting one type of livelihood strategy and x1, x2, … xi are
independent variables. Parameters β0, β1, β2, … βi are the undetermined regression coef-
ficients.
The independent variables selected for the binary logistic regression were two geo-
graphic location dimensions and livelihood capital. The geographic location variables
were the terrain location and economic location of the farmers (Table 2). In terms of live-
lihood capital, based on the sustainable livelihood framework [2] and considering the
actual situation of the research region, we selected relevant variables from natural capi-
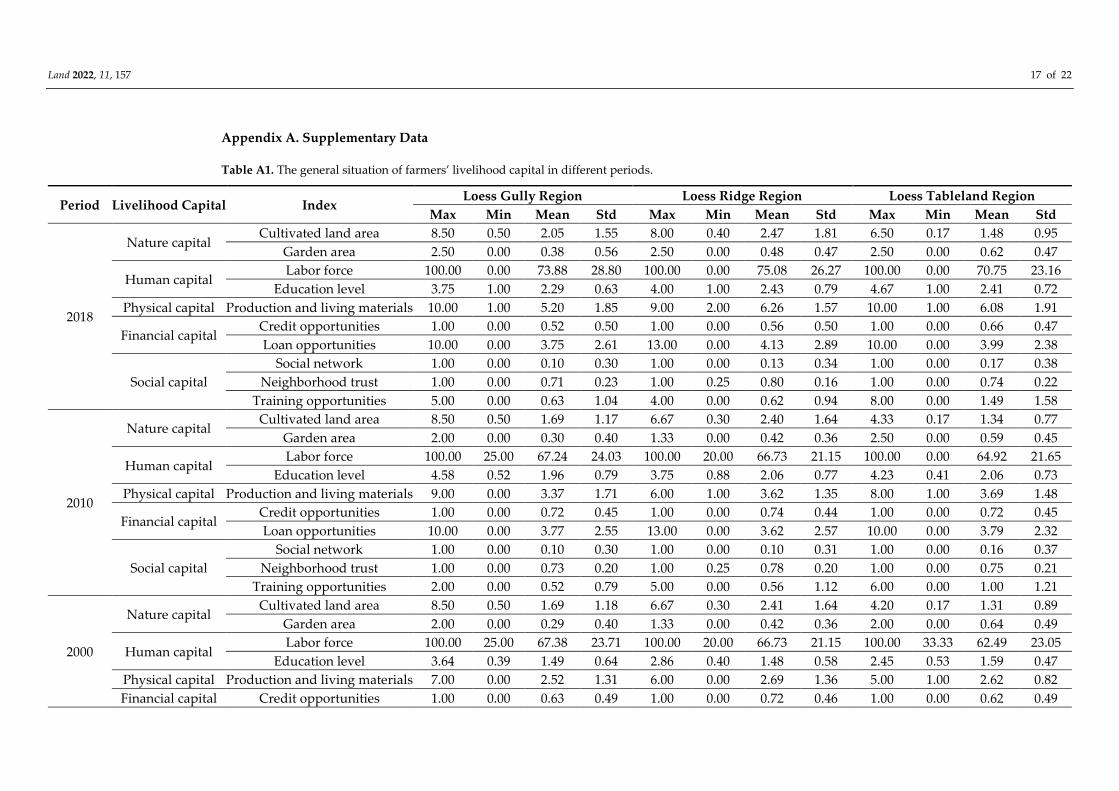
tal, human capital, physical capital, financial capital, and social capital (Table 2). A sta-
tistical description of each variable is presented in Table A1 in Appendix A.
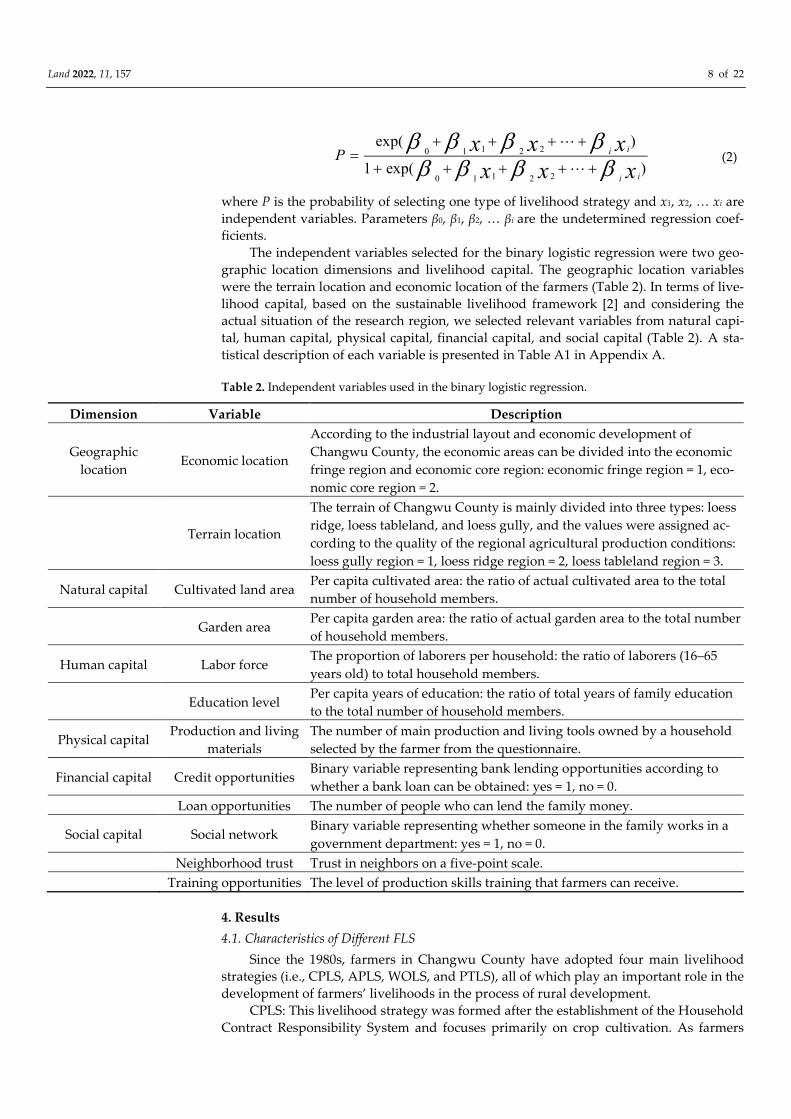
Table 2. Independent variables used in the binary logistic regression.
Dimension Variable Description
Geographic
location Economic location
According to the industrial layout and economic development of
Changwu County, the economic areas can be divided into the economic
fringe region and economic core region: economic fringe region = 1, eco-
nomic core region = 2.
Terrain location
The terrain of Changwu County is mainly divided into three types: loess
ridge, loess tableland, and loess gully, and the values were assigned ac-
cording to the quality of the regional agricultural production conditions:
loess gully region = 1, loess ridge region = 2, loess tableland region = 3.
Natural capital Cultivated land area Per capita cultivated area: the ratio of actual cultivated area to the total
number of household members.
Garden area Per capita garden area: the ratio of actual garden area to the total number
of household members.
Human capital Labor force The proportion of laborers per household: the ratio of laborers (16–65
years old) to total household members.
Education level Per capita years of education: the ratio of total years of family education
to the total number of household members.
Physical capital Production and living
materials
The number of main production and living tools owned by a household
selected by the farmer from the questionnaire.
Financial capital Credit opportunities Binary variable representing bank lending opportunities according to
whether a bank loan can be obtained: yes = 1, no = 0.
Loan opportunities The number of people who can lend the family money.
Social capital Social network Binary variable representing whether someone in the family works in a
government department: yes = 1, no = 0.
Neighborhood trust Trust in neighbors on a five-point scale.
Training opportunities The level of production skills training that farmers can receive.
4. Results
4.1. Characteristics of Different FLS
Since the 1980s, farmers in Changwu County have adopted four main livelihood
strategies (i.e., CPLS, APLS, WOLS, and PTLS), all of which play an important role in the
development of farmers’ livelihoods in the process of rural development.
CPLS: This livelihood strategy was formed after the establishment of the Household
Contract Responsibility System and focuses primarily on crop cultivation. As farmers
Land 2022, 11, 157 9 of 22
were limited by the level of productivity development, land immediately became the
major means of production for them. Therefore, the CPLS became the leading livelihood
strategy in the study region. Since then, farmers have gradually resolved the problem of
obtaining food and clothing. However, with the rapid development of productivity lev-
els, the status of the CPLS gradually declined in the early 21st century.
APLS: This type of livelihood strategy, with apple cultivation as the main livelihood
activity, emerged in the late 1980s. At that time, the Institute of Soil and Water Conser-
vation at the Chinese Academy of Sciences used apple cultivation to prevent soil erosion,
and experimented in several villages in Hongjia Town. Driven by economic benefits and
policy support, apple cultivation gradually expanded from the pilot region to the whole
county. Around the turn of the 21st century, the APLS became the leading livelihood
strategy and helped improve the income level of rural farmers. At present, the APLS is
still mainly followed in loess tableland region villages with superior apple growing con-
ditions.
WOLS: This livelihood strategy, with non-agricultural work as the main livelihood
activity, emerged in the late 1990s. It was initially pursued in the economic core region
and loess gully region. With the development of productivity, surplus rural labor began
to appear, and coupled with the decline in apple earnings, non-agricultural work became
the main livelihood activity of farmers. The WOLS also became the leading livelihood
strategy in rural areas. This livelihood strategy not only improved the economic income
of farmers, but also pushed the rural economic system into the non-agricultural phase.
PTLS: This livelihood strategy was formed in the late 1990s and is characterized by
diverse livelihood activities and a relative balance among different income sources.
Livelihood activities mainly take the form of a combination of crop cultivation, apple
cultivation, and non-agricultural work. The PTLS not only reduced livelihood risks, but
also increased and stabilized farmers’ household income.
4.2. Evolution of FLS
Since the 1980s, FLS have evolved in accordance with the regime shifts in the rural
economic system in Changwu County. However, the evolution of FLS has followed dif-
ferent patterns under different geographic locations.
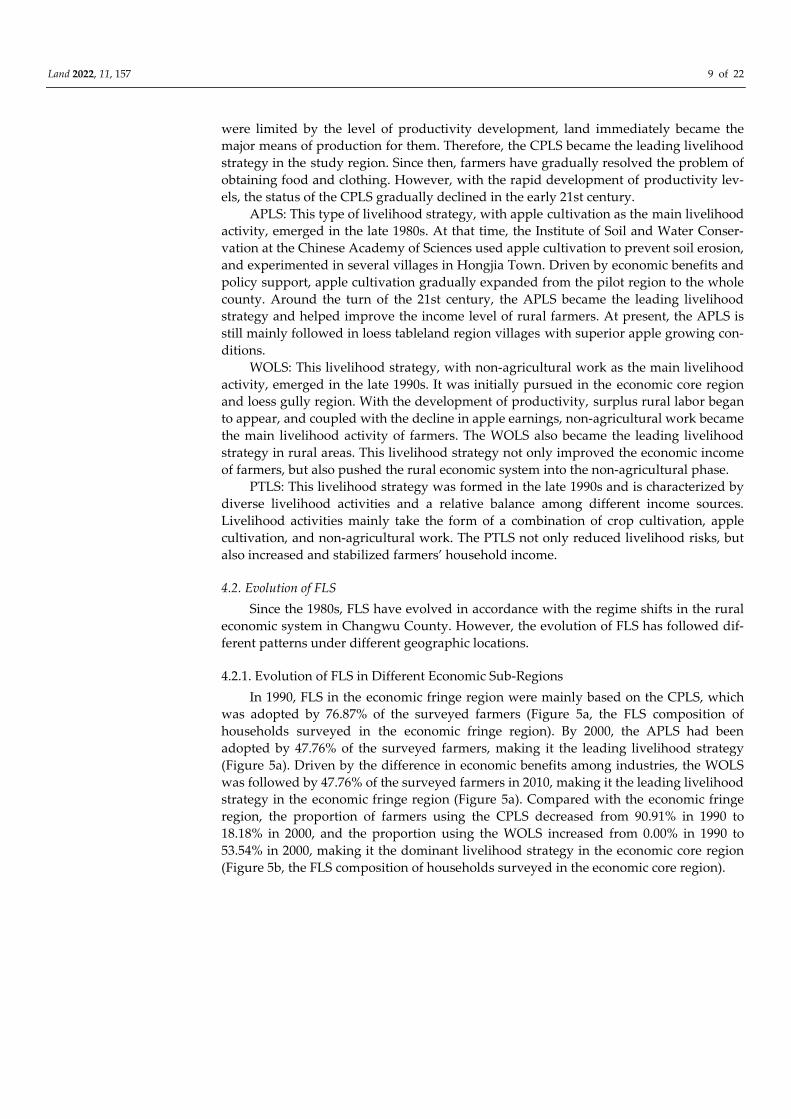
4.2.1. Evolution of FLS in Different Economic Sub-Regions
In 1990, FLS in the economic fringe region were mainly based on the CPLS, which
was adopted by 76.87% of the surveyed farmers (Figure 5a, the FLS composition of
households surveyed in the economic fringe region). By 2000, the APLS had been
adopted by 47.76% of the surveyed farmers, making it the leading livelihood strategy
(Figure 5a). Driven by the difference in economic benefits among industries, the WOLS
was followed by 47.76% of the surveyed farmers in 2010, making it the leading livelihood
strategy in the economic fringe region (Figure 5a). Compared with the economic fringe
region, the proportion of farmers using the CPLS decreased from 90.91% in 1990 to
18.18% in 2000, and the proportion using the WOLS increased from 0.00% in 1990 to
53.54% in 2000, making it the dominant livelihood strategy in the economic core region
(Figure 5b, the FLS composition of households surveyed in the economic core region).
Land 2022, 11, 157 10 of 22
Figure 5. The FLS composition of households surveyed in different economic sub-regions in dif-
ferent periods.
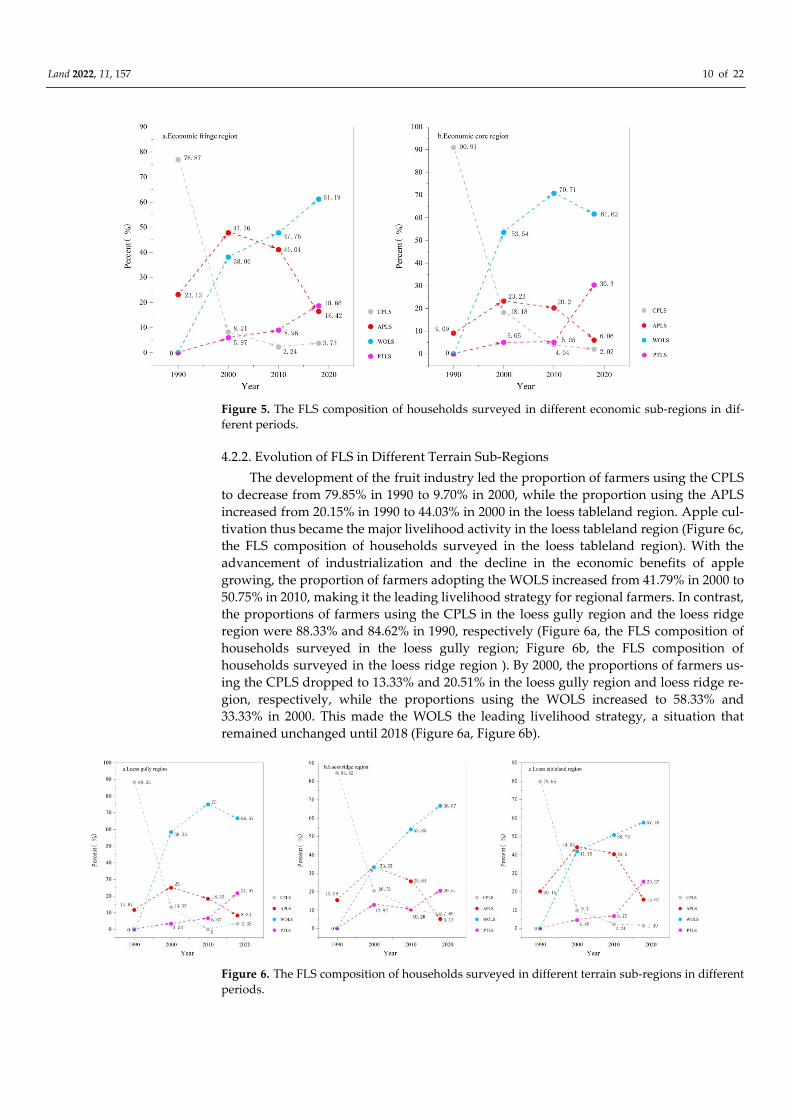
4.2.2. Evolution of FLS in Different Terrain Sub-Regions
The development of the fruit industry led the proportion of farmers using the CPLS
to decrease from 79.85% in 1990 to 9.70% in 2000, while the proportion using the APLS
increased from 20.15% in 1990 to 44.03% in 2000 in the loess tableland region. Apple cul-
tivation thus became the major livelihood activity in the loess tableland region (Figure 6c,
the FLS composition of households surveyed in the loess tableland region). With the
advancement of industrialization and the decline in the economic benefits of apple
growing, the proportion of farmers adopting the WOLS increased from 41.79% in 2000 to
50.75% in 2010, making it the leading livelihood strategy for regional farmers. In contrast,
the proportions of farmers using the CPLS in the loess gully region and the loess ridge
region were 88.33% and 84.62% in 1990, respectively (Figure 6a, the FLS composition of
households surveyed in the loess gully region; Figure 6b, the FLS composition of
households surveyed in the loess ridge region ). By 2000, the proportions of farmers us-
ing the CPLS dropped to 13.33% and 20.51% in the loess gully region and loess ridge re-
gion, respectively, while the proportions using the WOLS increased to 58.33% and
33.33% in 2000. This made the WOLS the leading livelihood strategy, a situation that
remained unchanged until 2018 (Figure 6a, Figure 6b).
Figure 6. The FLS composition of households surveyed in different terrain sub-regions in different
periods.
Land 2022, 11, 157 11 of 22
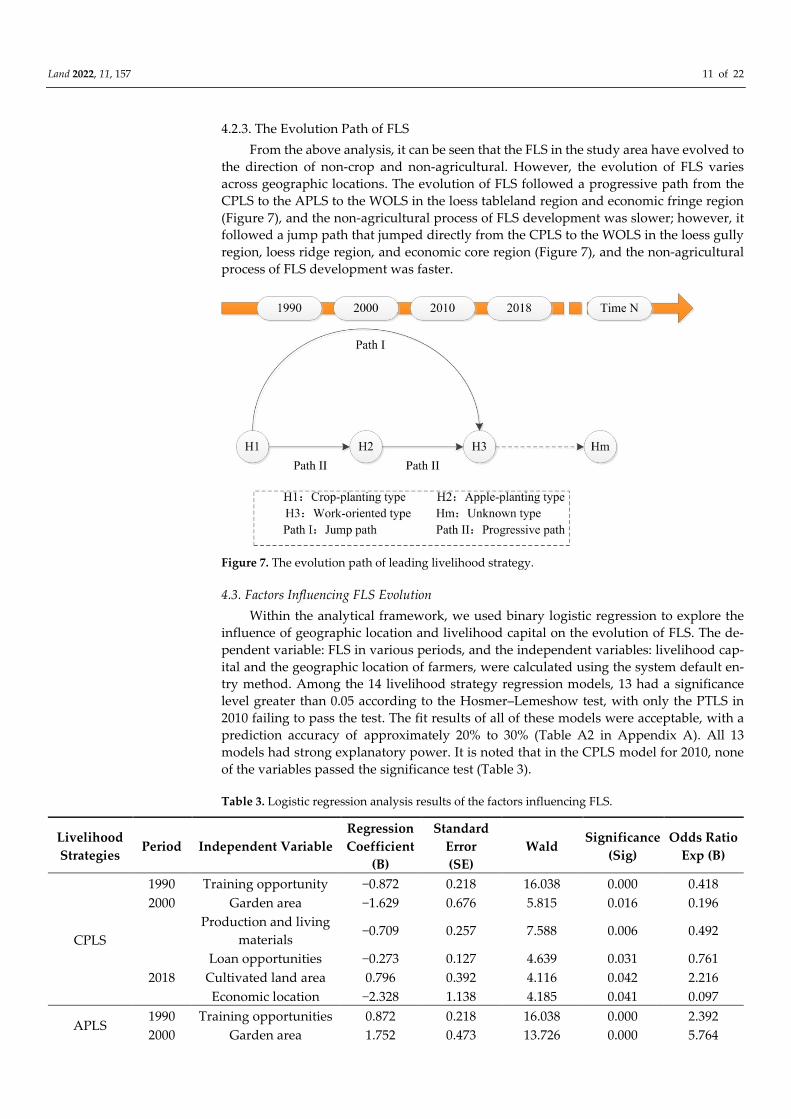
4.2.3. The Evolution Path of FLS
From the above analysis, it can be seen that the FLS in the study area have evolved to
the direction of non-crop and non-agricultural. However, the evolution of FLS varies
across geographic locations. The evolution of FLS followed a progressive path from the
CPLS to the APLS to the WOLS in the loess tableland region and economic fringe region
(Figure 7), and the non-agricultural process of FLS development was slower; however, it
followed a jump path that jumped directly from the CPLS to the WOLS in the loess gully
region, loess ridge region, and economic core region (Figure 7), and the non-agricultural
process of FLS development was faster.
Figure 7. The evolution path of leading livelihood strategy.
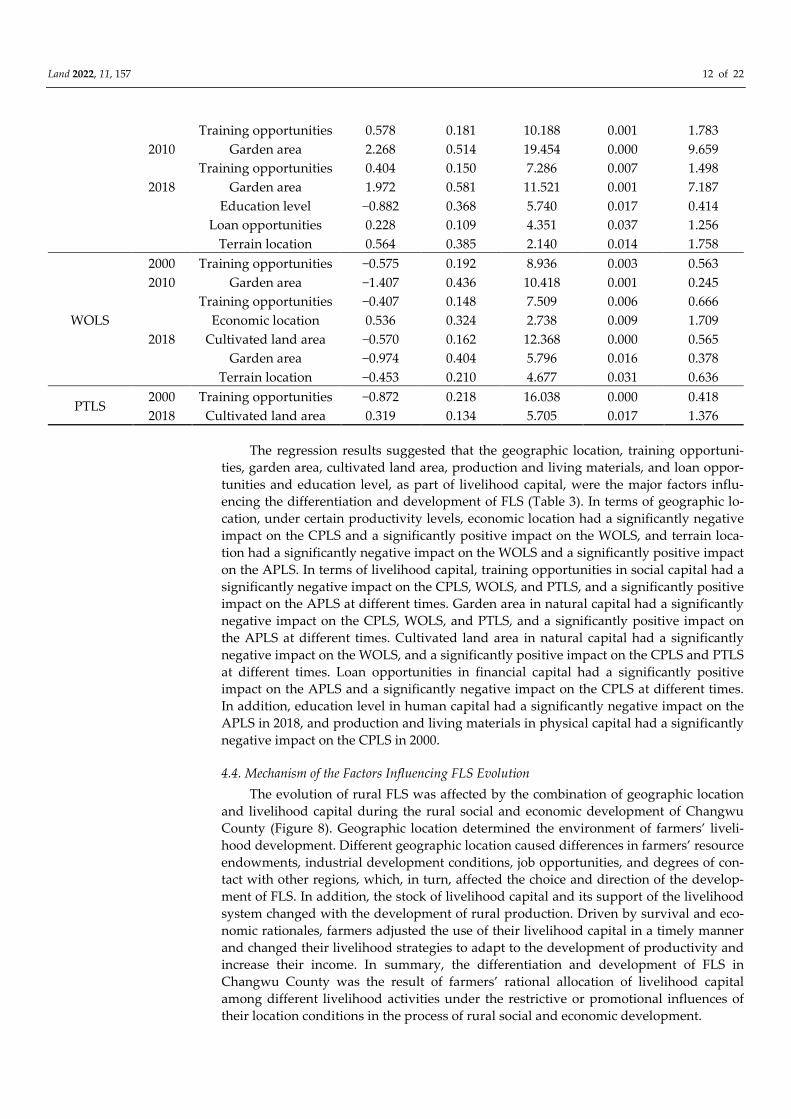
4.3. Factors Influencing FLS Evolution
Within the analytical framework, we used binary logistic regression to explore the
influence of geographic location and livelihood capital on the evolution of FLS. The de-
pendent variable: FLS in various periods, and the independent variables: livelihood cap-
ital and the geographic location of farmers, were calculated using the system default en-
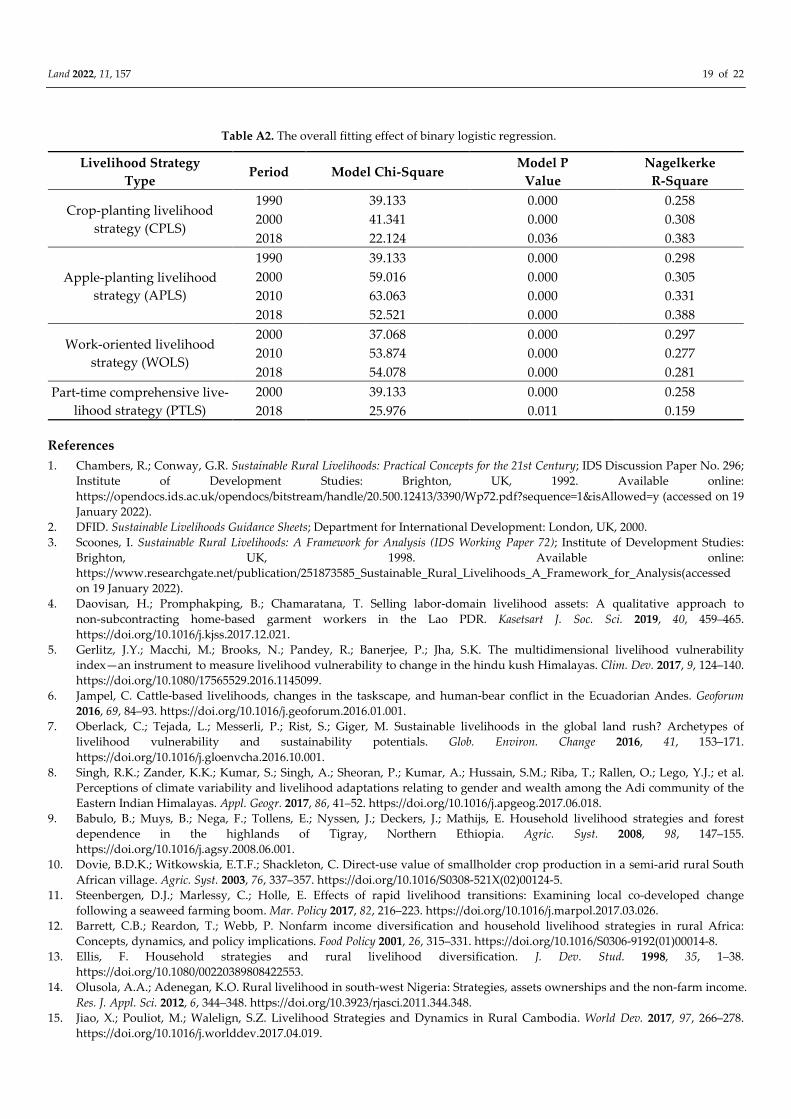
try method. Among the 14 livelihood strategy regression models, 13 had a significance
level greater than 0.05 according to the Hosmer–Lemeshow test, with only the PTLS in
2010 failing to pass the test. The fit results of all of these models were acceptable, with a
prediction accuracy of approximately 20% to 30% (Table A2 in Appendix A). All 13
models had strong explanatory power. It is noted that in the CPLS model for 2010, none
of the variables passed the significance test (Table 3).
Table 3. Logistic regression analysis results of the factors influencing FLS.
Livelihood
Strategies Period Independent Variable
Regression
Coefficient
(B)
Standard
Error
(SE)
Wald Significance
(Sig)
Odds Ratio
Exp (B)
CPLS
1990 Training opportunity −0.872 0.218 16.038 0.000 0.418
2000 Garden area −1.629 0.676 5.815 0.016 0.196
Production and living
materials −0.709 0.257 7.588 0.006 0.492
Loan opportunities −0.273 0.127 4.639 0.031 0.761
2018 Cultivated land area 0.796 0.392 4.116 0.042 2.216
Economic location −2.328 1.138 4.185 0.041 0.097
APLS 1990 Training opportunities 0.872 0.218 16.038 0.000 2.392
2000 Garden area 1.752 0.473 13.726 0.000 5.764
Land 2022, 11, 157 12 of 22
Training opportunities 0.578 0.181 10.188 0.001 1.783
2010 Garden area 2.268 0.514 19.454 0.000 9.659
Training opportunities 0.404 0.150 7.286 0.007 1.498
2018 Garden area 1.972 0.581 11.521 0.001 7.187
Education level −0.882 0.368 5.740 0.017 0.414
Loan opportunities 0.228 0.109 4.351 0.037 1.256
Terrain location 0.564 0.385 2.140 0.014 1.758
WOLS
2000 Training opportunities −0.575 0.192 8.936 0.003 0.563
2010 Garden area −1.407 0.436 10.418 0.001 0.245
Training opportunities −0.407 0.148 7.509 0.006 0.666
Economic location 0.536 0.324 2.738 0.009 1.709
2018 Cultivated land area −0.570 0.162 12.368 0.000 0.565
Garden area −0.974 0.404 5.796 0.016 0.378
Terrain location −0.453 0.210 4.677 0.031 0.636
PTLS 2000 Training opportunities −0.872 0.218 16.038 0.000 0.418
2018 Cultivated land area 0.319 0.134 5.705 0.017 1.376
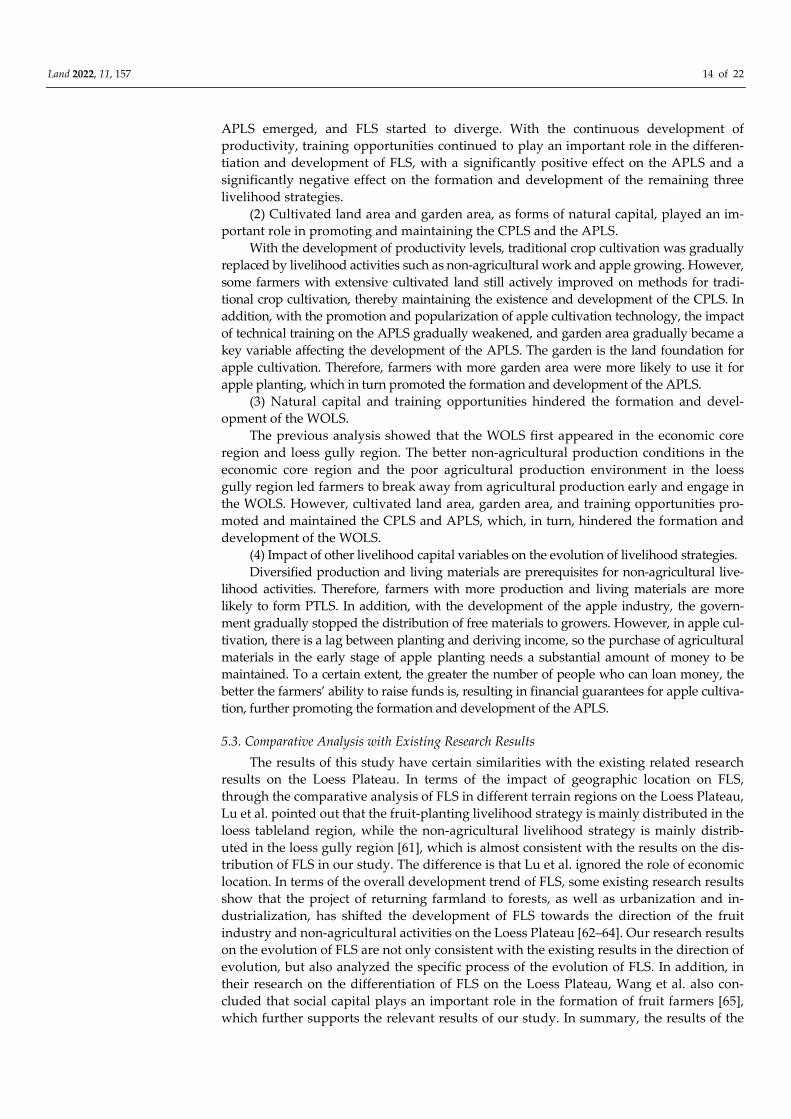
The regression results suggested that the geographic location, training opportuni-
ties, garden area, cultivated land area, production and living materials, and loan oppor-
tunities and education level, as part of livelihood capital, were the major factors influ-
encing the differentiation and development of FLS (Table 3). In terms of geographic lo-
cation, under certain productivity levels, economic location had a significantly negative
impact on the CPLS and a significantly positive impact on the WOLS, and terrain loca-
tion had a significantly negative impact on the WOLS and a significantly positive impact
on the APLS. In terms of livelihood capital, training opportunities in social capital had a
significantly negative impact on the CPLS, WOLS, and PTLS, and a significantly positive
impact on the APLS at different times. Garden area in natural capital had a significantly
negative impact on the CPLS, WOLS, and PTLS, and a significantly positive impact on
the APLS at different times. Cultivated land area in natural capital had a significantly
negative impact on the WOLS, and a significantly positive impact on the CPLS and PTLS
at different times. Loan opportunities in financial capital had a significantly positive
impact on the APLS and a significantly negative impact on the CPLS at different times.
In addition, education level in human capital had a significantly negative impact on the
APLS in 2018, and production and living materials in physical capital had a significantly
negative impact on the CPLS in 2000.
4.4. Mechanism of the Factors Influencing FLS Evolution
The evolution of rural FLS was affected by the combination of geographic location
and livelihood capital during the rural social and economic development of Changwu
County (Figure 8). Geographic location determined the environment of farmers’ liveli-
hood development. Different geographic location caused differences in farmers’ resource
endowments, industrial development conditions, job opportunities, and degrees of con-
tact with other regions, which, in turn, affected the choice and direction of the develop-
ment of FLS. In addition, the stock of livelihood capital and its support of the livelihood
system changed with the development of rural production. Driven by survival and eco-
nomic rationales, farmers adjusted the use of their livelihood capital in a timely manner
and changed their livelihood strategies to adapt to the development of productivity and
increase their income. In summary, the differentiation and development of FLS in
Changwu County was the result of farmers’ rational allocation of livelihood capital
among different livelihood activities under the restrictive or promotional influences of
their location conditions in the process of rural social and economic development.
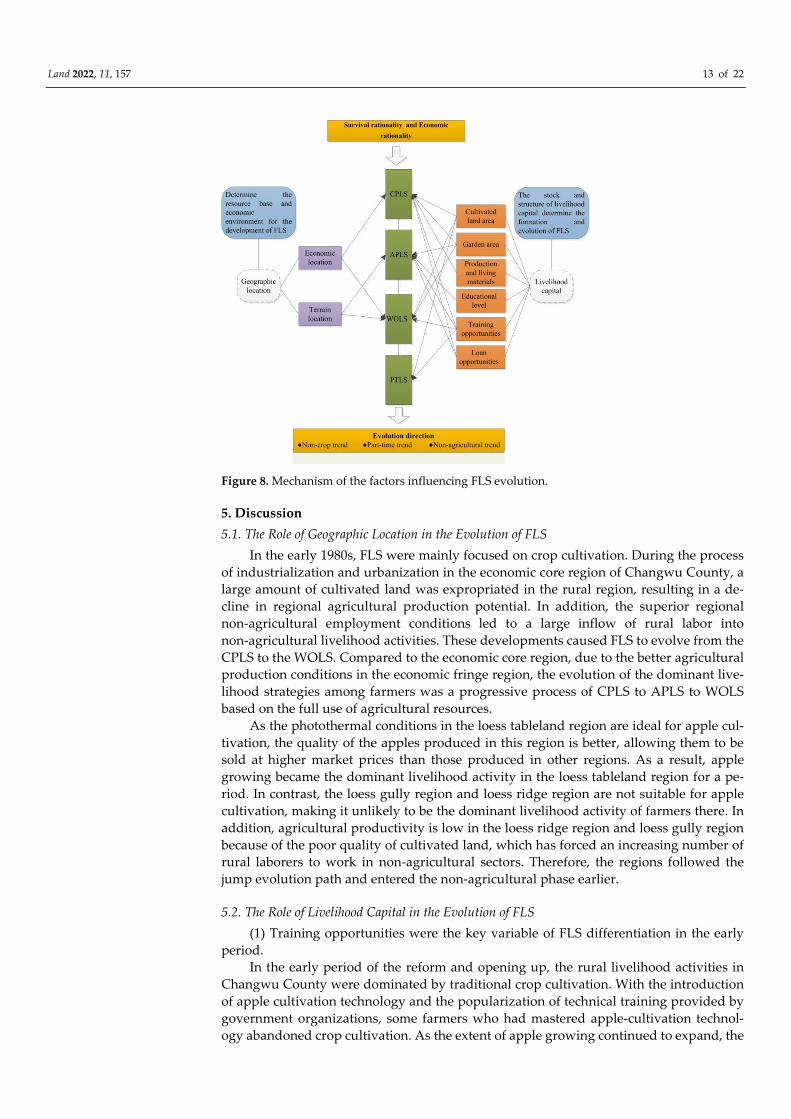
Land 2022, 11, 157 13 of 22
Figure 8. Mechanism of the factors influencing FLS evolution.
5. Discussion
5.1. The Role of Geographic Location in the Evolution of FLS
In the early 1980s, FLS were mainly focused on crop cultivation. During the process
of industrialization and urbanization in the economic core region of Changwu County, a
large amount of cultivated land was expropriated in the rural region, resulting in a de-
cline in regional agricultural production potential. In addition, the superior regional
non-agricultural employment conditions led to a large inflow of rural labor into
non-agricultural livelihood activities. These developments caused FLS to evolve from the
CPLS to the WOLS. Compared to the economic core region, due to the better agricultural
production conditions in the economic fringe region, the evolution of the dominant live-
lihood strategies among farmers was a progressive process of CPLS to APLS to WOLS
based on the full use of agricultural resources.
As the photothermal conditions in the loess tableland region are ideal for apple cul-
tivation, the quality of the apples produced in this region is better, allowing them to be
sold at higher market prices than those produced in other regions. As a result, apple
growing became the dominant livelihood activity in the loess tableland region for a pe-
riod. In contrast, the loess gully region and loess ridge region are not suitable for apple
cultivation, making it unlikely to be the dominant livelihood activity of farmers there. In
addition, agricultural productivity is low in the loess ridge region and loess gully region
because of the poor quality of cultivated land, which has forced an increasing number of
rural laborers to work in non-agricultural sectors. Therefore, the regions followed the
jump evolution path and entered the non-agricultural phase earlier.
5.2. The Role of Livelihood Capital in the Evolution of FLS
(1) Training opportunities were the key variable of FLS differentiation in the early
period.
In the early period of the reform and opening up, the rural livelihood activities in
Changwu County were dominated by traditional crop cultivation. With the introduction
of apple cultivation technology and the popularization of technical training provided by
government organizations, some farmers who had mastered apple-cultivation technol-
ogy abandoned crop cultivation. As the extent of apple growing continued to expand, the
Land 2022, 11, 157 14 of 22
APLS emerged, and FLS started to diverge. With the continuous development of
productivity, training opportunities continued to play an important role in the differen-
tiation and development of FLS, with a significantly positive effect on the APLS and a
significantly negative effect on the formation and development of the remaining three
livelihood strategies.
(2) Cultivated land area and garden area, as forms of natural capital, played an im-
portant role in promoting and maintaining the CPLS and the APLS.
With the development of productivity levels, traditional crop cultivation was gradually
replaced by livelihood activities such as non-agricultural work and apple growing. However,
some farmers with extensive cultivated land still actively improved on methods for tradi-
tional crop cultivation, thereby maintaining the existence and development of the CPLS. In
addition, with the promotion and popularization of apple cultivation technology, the impact
of technical training on the APLS gradually weakened, and garden area gradually became a
key variable affecting the development of the APLS. The garden is the land foundation for
apple cultivation. Therefore, farmers with more garden area were more likely to use it for
apple planting, which in turn promoted the formation and development of the APLS.
(3) Natural capital and training opportunities hindered the formation and devel-
opment of the WOLS.
The previous analysis showed that the WOLS first appeared in the economic core
region and loess gully region. The better non-agricultural production conditions in the
economic core region and the poor agricultural production environment in the loess
gully region led farmers to break away from agricultural production early and engage in
the WOLS. However, cultivated land area, garden area, and training opportunities pro-
moted and maintained the CPLS and APLS, which, in turn, hindered the formation and
development of the WOLS.
(4) Impact of other livelihood capital variables on the evolution of livelihood strategies.
Diversified production and living materials are prerequisites for non-agricultural live-
lihood activities. Therefore, farmers with more production and living materials are more
likely to form PTLS. In addition, with the development of the apple industry, the govern-
ment gradually stopped the distribution of free materials to growers. However, in apple cul-
tivation, there is a lag between planting and deriving income, so the purchase of agricultural
materials in the early stage of apple planting needs a substantial amount of money to be
maintained. To a certain extent, the greater the number of people who can loan money, the
better the farmers’ ability to raise funds is, resulting in financial guarantees for apple cultiva-
tion, further promoting the formation and development of the APLS.
5.3. Comparative Analysis with Existing Research Results
The results of this study have certain similarities with the existing related research
results on the Loess Plateau. In terms of the impact of geographic location on FLS,
through the comparative analysis of FLS in different terrain regions on the Loess Plateau,
Lu et al. pointed out that the fruit-planting livelihood strategy is mainly distributed in the
loess tableland region, while the non-agricultural livelihood strategy is mainly distrib-
uted in the loess gully region [61], which is almost consistent with the results on the dis-
tribution of FLS in our study. The difference is that Lu et al. ignored the role of economic
location. In terms of the overall development trend of FLS, some existing research results
show that the project of returning farmland to forests, as well as urbanization and in-
dustrialization, has shifted the development of FLS towards the direction of the fruit
industry and non-agricultural activities on the Loess Plateau [62–64]. Our research results
on the evolution of FLS are not only consistent with the existing results in the direction of
evolution, but also analyzed the specific process of the evolution of FLS. In addition, in
their research on the differentiation of FLS on the Loess Plateau, Wang et al. also con-
cluded that social capital plays an important role in the formation of fruit farmers [65],
which further supports the relevant results of our study. In summary, the results of the
Land 2022, 11, 157 15 of 22
case study reflect the actual development of FLS on the Loess Plateau to a certain extent,
and the analytical framework is applicable to the study on the FLS on the Loess Plateau.
From related studies in other regions, the research results of Wamalwa et al. show that
the effect of human capital, physical capital, financial capital, natural capital, and social capi-
tal is determined by forest, crop, livestock, and off-farm activities in Kieni Sub Counties,
Kenya [66]. Baruah et al. revealed that the training of aquaculture technology is of great sig-
nificance to the development of the livelihood strategy of fish farming in the high altitude
areas of Arunachal Pradesh [67]. Through a comparative analysis of the differences in the
livelihood choice of tea industry by farmers at different altitudes in the Himalayas, Jairu et al.
concluded that terrain location has an important impact on the participation of FLS in the tea
industry [68]. Due to differences in regional resource endowment, productivity levels, and
policy systems, etc., the FLS in the above study areas were different from those on the Loess
Plateau. However, these research results still show that geographic location and livelihood
capital have an important impact on the FLS. It can be seen that the analytical framework
designed in the current study still has certain applicability in other regions.
From the research sample, the farmers surveyed are involved in different terrain loca-
tions and different economic locations. The livelihood activities of the farmers include tradi-
tional agricultural production, fruit production, and non-agricultural production mainly
based on going out to work. According to the participation in these livelihood activities, four
types of livelihood strategies are formed, including CPLS, APLS, WOLS, and PTLS. This is in
considerable agreement with the relevant research results on the Loess Plateau [61,62,65]. In
addition, with the development of productivity and changes in the global environment, the
FLS in many developing countries and regions have gradually shifted towards a
non-agricultural direction [69–72]. It can be seen that due to the disparity in the outcome
benefits of different industries, when the level of productivity develops to a certain extent,
the non-agricultural transfer of FLS is inevitable. Therefore, although there will be differences
in specific livelihood strategies, our sample is highly representative of the overall direction of
the evolution of livelihood strategies. This also shows that the analytical framework has cer-
tain applicability to other regions.
5.4. Policy Implications
Breaking the limitation of geographic location on FLS is of considerable significance
to promote the sustainable development of farmers’ livelihoods. Therefore, it is necessary
to strengthen the construction of regional infrastructure for regional rural development,
especially on the Loess Plateau. To date, China has implemented many rural develop-
ment strategies and measures (beautiful villages, rural vitalization strategies, vil-
lage-to-village projects, immigration relocation, targeted poverty reduction strategies,
etc.) to promote the healthy development of farmers’ livelihoods, and has achieved tre-
mendous results. These strategic guidelines not only improve the rural social develop-
ment environment, but also promote the development of the rural economy through the
restructuring of rural industries and the integration of resources, as they provide expe-
rience and a reference for rural development and the development of farmers’ liveli-
hoods in developing countries.
Furthermore, to achieve rural revitalization and development, the Chinese gov-
ernment must attach importance to building up livelihood capital and promptly optimize
the structure of livelihood capital for farmers on the Loess Plateau. First, the education
department and human resources department should improve the adult education sys-
tem and production skills training system for farmers, and carry out re-education to ex-
pand farmers’ employment opportunities as well as periodic training on production
skills to promote the knowledge-based and energy-saving transformation of farmers’
human capital. Second, the financial sector and financial system should improve regional
microfinance credit projects and agricultural and non-agricultural special credit projects
to strengthen financial support for the development of rural farmers’ livelihoods. Finally,
local government departments should build online information platforms to promote the
Land 2022, 11, 157 16 of 22
diversified development of farmers’ information acquisition channels and enhance
farmers’ understanding of agricultural market information, employment information,
and national policy information.
5.5. Limitations of the Study and Future Research
There are still some insufficiencies in this study that need to be improved. In this study,
economic location and terrain location were used as geographic location variables to identify
the influencing factors of FLS evolution. The geographic location indicators selected are not
meticulous enough, resulting in the need for the accuracy of the influencing factor identifica-
tion result to be further improved. Therefore, an effective way to improve the accuracy of the
research results is through selecting more detailed geographic location indicators such as al-
titude, slope, traffic accessibility, and market location to analyze the influencing factors of the
evolution of FLS. In addition, the analytical framework still has room for expansion in terms
of influencing factor selection and research content. This is an area that is currently being
worked on, and this will continue in order to incorporate more detailed influencing factors
from multiple aspects, and to explore the comprehensive impact of the interactions among
influencing factors on the evolution and development of FLS. Moreover, in the context of
drastic changes in the global environment, the development of FLS is affected by many fac-
tors, such as climate change, policy changes, and production technology innovations. There-
fore, combining the actual situation of regional development and exploring the development
of FLS from the perspective of multiple factors is an important direction to promote relevant
research and achieve breakthroughs.
6. Conclusions
This study shows that the evolution of FLS in the study area has obvious non-crop
and non-agricultural directions. Geographic location and livelihood capital have a sig-
nificant impact on the evolution of FLS. Differences in economic location and terrain lo-
cation lead to differences in the resource endowment and industrial environment for re-
gional livelihood development, which, in turn, makes the evolution of FLS in different
economic sub-regions and terrain sub-regions follow two different evolution paths: the
progressive path, and the jump path. The difference in livelihood capital leads to the
differentiation of FLS options, which, in turn, promotes the dynamic evolution of FLS.
Natural capital still has an important influence on the evolution of FLS, and is the basis
for the development of CPLS and APLS. Social capital and financial capital play an im-
portant supporting role in the formation and development of APLS. Conversely, a lack of
natural capital and social capital shifts FLS towards the direction of non-agricultural
work. The results of the case study are representative the development of FLS and reflect
the characteristics of trends in the development of FLS on the Loess Plateau. The analyt-
ical framework is applicable to the Loess Plateau and other regions to a certain extent.
Author Contributions: Conceptualization, K.W. and X.Y.; Methodology, K.W.; Data Curation,
K.W.; Software, J.Z.; Writing—Original draft preparation, K.W.; Writing—Reviewing and Editing,
J.Z. and Z.W.; Supervision, X.Y. All authors have read and agreed to the published version of the
manuscript.
Funding: This study was supported by the National Natural Science Foundation of China (No.
41771574).
Data Availability Statement: The data presented in this study are available on request from the
corresponding author.
Acknowledgments: We would like to thank Sha Yin, Jianghao Ma, Feng Hu, Wenwei Han, and
Wenli Ye for contributing to the household survey and data collection. Furthermore, the authors
would like to express their appreciation to the anonymous reviewers for the insightful comments
that improved this manuscript.
Conflicts of Interest: The authors declare no conflict of interest.
Land 2022, 11, 157 17 of 22
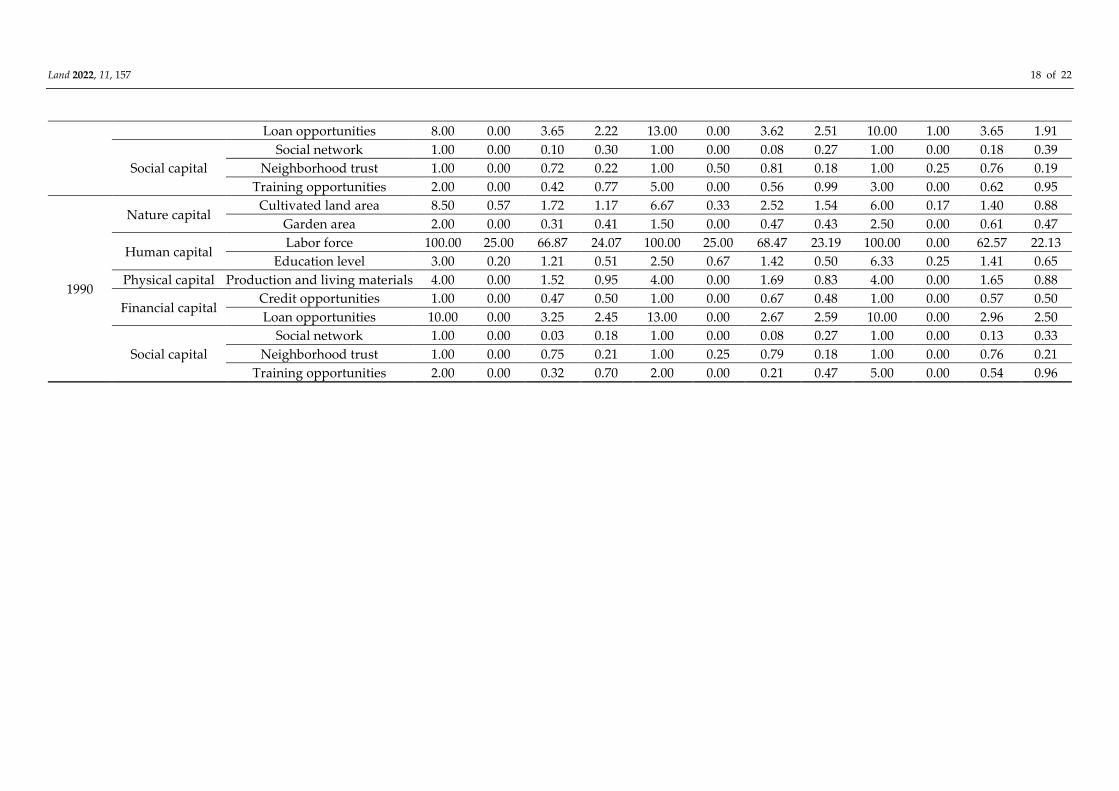
Appendix A. Supplementary Data
Table A1. The general situation of farmers’ livelihood capital in different periods.
Period Livelihood Capital Index Loess Gully Region Loess Ridge Region Loess Tableland Region
Max Min Mean Std Max Min Mean Std Max Min Mean Std
2018
Nature capital Cultivated land area 8.50 0.50 2.05 1.55 8.00 0.40 2.47 1.81 6.50 0.17 1.48 0.95
Garden area 2.50 0.00 0.38 0.56 2.50 0.00 0.48 0.47 2.50 0.00 0.62 0.47
Human capital Labor force 100.00 0.00 73.88 28.80 100.00 0.00 75.08 26.27 100.00 0.00 70.75 23.16
Education level 3.75 1.00 2.29 0.63 4.00 1.00 2.43 0.79 4.67 1.00 2.41 0.72
Physical capital Production and living materials 10.00 1.00 5.20 1.85 9.00 2.00 6.26 1.57 10.00 1.00 6.08 1.91
Financial capital Credit opportunities 1.00 0.00 0.52 0.50 1.00 0.00 0.56 0.50 1.00 0.00 0.66 0.47
Loan opportunities 10.00 0.00 3.75 2.61 13.00 0.00 4.13 2.89 10.00 0.00 3.99 2.38
Social capital
Social network 1.00 0.00 0.10 0.30 1.00 0.00 0.13 0.34 1.00 0.00 0.17 0.38
Neighborhood trust 1.00 0.00 0.71 0.23 1.00 0.25 0.80 0.16 1.00 0.00 0.74 0.22
Training opportunities 5.00 0.00 0.63 1.04 4.00 0.00 0.62 0.94 8.00 0.00 1.49 1.58
2010
Nature capital Cultivated land area 8.50 0.50 1.69 1.17 6.67 0.30 2.40 1.64 4.33 0.17 1.34 0.77
Garden area 2.00 0.00 0.30 0.40 1.33 0.00 0.42 0.36 2.50 0.00 0.59 0.45
Human capital Labor force 100.00 25.00 67.24 24.03 100.00 20.00 66.73 21.15 100.00 0.00 64.92 21.65
Education level 4.58 0.52 1.96 0.79 3.75 0.88 2.06 0.77 4.23 0.41 2.06 0.73
Physical capital Production and living materials 9.00 0.00 3.37 1.71 6.00 1.00 3.62 1.35 8.00 1.00 3.69 1.48
Financial capital Credit opportunities 1.00 0.00 0.72 0.45 1.00 0.00 0.74 0.44 1.00 0.00 0.72 0.45
Loan opportunities 10.00 0.00 3.77 2.55 13.00 0.00 3.62 2.57 10.00 0.00 3.79 2.32
Social capital
Social network 1.00 0.00 0.10 0.30 1.00 0.00 0.10 0.31 1.00 0.00 0.16 0.37
Neighborhood trust 1.00 0.00 0.73 0.20 1.00 0.25 0.78 0.20 1.00 0.00 0.75 0.21
Training opportunities 2.00 0.00 0.52 0.79 5.00 0.00 0.56 1.12 6.00 0.00 1.00 1.21
2000
Nature capital Cultivated land area 8.50 0.50 1.69 1.18 6.67 0.30 2.41 1.64 4.20 0.17 1.31 0.89
Garden area 2.00 0.00 0.29 0.40 1.33 0.00 0.42 0.36 2.00 0.00 0.64 0.49
Human capital Labor force 100.00 25.00 67.38 23.71 100.00 20.00 66.73 21.15 100.00 33.33 62.49 23.05
Education level 3.64 0.39 1.49 0.64 2.86 0.40 1.48 0.58 2.45 0.53 1.59 0.47
Physical capital Production and living materials 7.00 0.00 2.52 1.31 6.00 0.00 2.69 1.36 5.00 1.00 2.62 0.82
Financial capital Credit opportunities 1.00 0.00 0.63 0.49 1.00 0.00 0.72 0.46 1.00 0.00 0.62 0.49
Land 2022, 11, 157 18 of 22
Loan opportunities 8.00 0.00 3.65 2.22 13.00 0.00 3.62 2.51 10.00 1.00 3.65 1.91
Social capital
Social network 1.00 0.00 0.10 0.30 1.00 0.00 0.08 0.27 1.00 0.00 0.18 0.39
Neighborhood trust 1.00 0.00 0.72 0.22 1.00 0.50 0.81 0.18 1.00 0.25 0.76 0.19
Training opportunities 2.00 0.00 0.42 0.77 5.00 0.00 0.56 0.99 3.00 0.00 0.62 0.95
1990
Nature capital Cultivated land area 8.50 0.57 1.72 1.17 6.67 0.33 2.52 1.54 6.00 0.17 1.40 0.88
Garden area 2.00 0.00 0.31 0.41 1.50 0.00 0.47 0.43 2.50 0.00 0.61 0.47
Human capital Labor force 100.00 25.00 66.87 24.07 100.00 25.00 68.47 23.19 100.00 0.00 62.57 22.13
Education level 3.00 0.20 1.21 0.51 2.50 0.67 1.42 0.50 6.33 0.25 1.41 0.65
Physical capital Production and living materials 4.00 0.00 1.52 0.95 4.00 0.00 1.69 0.83 4.00 0.00 1.65 0.88
Financial capital Credit opportunities 1.00 0.00 0.47 0.50 1.00 0.00 0.67 0.48 1.00 0.00 0.57 0.50
Loan opportunities 10.00 0.00 3.25 2.45 13.00 0.00 2.67 2.59 10.00 0.00 2.96 2.50
Social capital
Social network 1.00 0.00 0.03 0.18 1.00 0.00 0.08 0.27 1.00 0.00 0.13 0.33
Neighborhood trust 1.00 0.00 0.75 0.21 1.00 0.25 0.79 0.18 1.00 0.00 0.76 0.21
Training opportunities 2.00 0.00 0.32 0.70 2.00 0.00 0.21 0.47 5.00 0.00 0.54 0.96
Land 2022, 11, 157 19 of 22
Table A2. The overall fitting effect of binary logistic regression.
Livelihood Strategy
Type Period Model Chi-Square
Model P
Value
Nagelkerke
R-Square
Crop-planting livelihood
strategy (CPLS)
1990 39.133 0.000 0.258
2000 41.341 0.000 0.308
2018 22.124 0.036 0.383
Apple-planting livelihood
strategy (APLS)
1990 39.133 0.000 0.298
2000 59.016 0.000 0.305
2010 63.063 0.000 0.331
2018 52.521 0.000 0.388
Work-oriented livelihood
strategy (WOLS)
2000 37.068 0.000 0.297
2010 53.874 0.000 0.277
2018 54.078 0.000 0.281
Part-time comprehensive live-
lihood strategy (PTLS)
2000 39.133 0.000 0.258
2018 25.976 0.011 0.159
References
1. Chambers, R.; Conway, G.R. Sustainable Rural Livelihoods: Practical Concepts for the 21st Century; IDS Discussion Paper No. 296;
Institute of Development Studies: Brighton, UK, 1992. Available online:
https://opendocs.ids.ac.uk/opendocs/bitstream/handle/20.500.12413/3390/Wp72.pdf?sequence=1&isAllowed=y (accessed on 19
January 2022).
2. DFID. Sustainable Livelihoods Guidance Sheets; Department for International Development: London, UK, 2000.
3. Scoones, I. Sustainable Rural Livelihoods: A Framework for Analysis (IDS Working Paper 72); Institute of Development Studies:
Brighton, UK, 1998. Available online:
https://www.researchgate.net/publication/251873585_Sustainable_Rural_Livelihoods_A_Framework_for_Analysis(accessed
on 19 January 2022).
4. Daovisan, H.; Promphakping, B.; Chamaratana, T. Selling labor-domain livelihood assets: A qualitative approach to
non-subcontracting home-based garment workers in the Lao PDR. Kasetsart J. Soc. Sci. 2019, 40, 459–465.
https://doi.org/10.1016/j.kjss.2017.12.021.
5. Gerlitz, J.Y.; Macchi, M.; Brooks, N.; Pandey, R.; Banerjee, P.; Jha, S.K. The multidimensional livelihood vulnerability
index—an instrument to measure livelihood vulnerability to change in the hindu kush Himalayas. Clim. Dev. 2017, 9, 124–140.
https://doi.org/10.1080/17565529.2016.1145099.
6. Jampel, C. Cattle-based livelihoods, changes in the taskscape, and human-bear conflict in the Ecuadorian Andes. Geoforum
2016, 69, 84–93. https://doi.org/10.1016/j.geoforum.2016.01.001.
7. Oberlack, C.; Tejada, L.; Messerli, P.; Rist, S.; Giger, M. Sustainable livelihoods in the global land rush? Archetypes of
livelihood vulnerability and sustainability potentials. Glob. Environ. Change 2016, 41, 153–171.
https://doi.org/10.1016/j.gloenvcha.2016.10.001.
8. Singh, R.K.; Zander, K.K.; Kumar, S.; Singh, A.; Sheoran, P.; Kumar, A.; Hussain, S.M.; Riba, T.; Rallen, O.; Lego, Y.J.; et al.
Perceptions of climate variability and livelihood adaptations relating to gender and wealth among the Adi community of the
Eastern Indian Himalayas. Appl. Geogr. 2017, 86, 41–52. https://doi.org/10.1016/j.apgeog.2017.06.018.
9. Babulo, B.; Muys, B.; Nega, F.; Tollens, E.; Nyssen, J.; Deckers, J.; Mathijs, E. Household livelihood strategies and forest
dependence in the highlands of Tigray, Northern Ethiopia. Agric. Syst. 2008, 98, 147–155.
https://doi.org/10.1016/j.agsy.2008.06.001.
10. Dovie, B.D.K.; Witkowskia, E.T.F.; Shackleton, C. Direct-use value of smallholder crop production in a semi-arid rural South
African village. Agric. Syst. 2003, 76, 337–357. https://doi.org/10.1016/S0308-521X(02)00124-5.
11. Steenbergen, D.J.; Marlessy, C.; Holle, E. Effects of rapid livelihood transitions: Examining local co-developed change
following a seaweed farming boom. Mar. Policy 2017, 82, 216–223. https://doi.org/10.1016/j.marpol.2017.03.026.
12. Barrett, C.B.; Reardon, T.; Webb, P. Nonfarm income diversification and household livelihood strategies in rural Africa:
Concepts, dynamics, and policy implications. Food Policy 2001, 26, 315–331. https://doi.org/10.1016/S0306-9192(01)00014-8.
13. Ellis, F. Household strategies and rural livelihood diversification. J. Dev. Stud. 1998, 35, 1–38.
https://doi.org/10.1080/00220389808422553.
14. Olusola, A.A.; Adenegan, K.O. Rural livelihood in south-west Nigeria: Strategies, assets ownerships and the non-farm income.
Res. J. Appl. Sci. 2012, 6, 344–348. https://doi.org/10.3923/rjasci.2011.344.348.
15. Jiao, X.; Pouliot, M.; Walelign, S.Z. Livelihood Strategies and Dynamics in Rural Cambodia. World Dev. 2017, 97, 266–278.
https://doi.org/10.1016/j.worlddev.2017.04.019.
Land 2022, 11, 157 20 of 22
16. Adepoju, A.O.; Obayelu, O.A. Livelihood diversification and welfare of rural households in Ondo State, Nigeria. J. Dev. Agric.
Econ. 2013, 5, 482–489. https://doi.org/10.5897/JDAE2013.0497.
17. Khatiwada, S.P.; Deng, W.; Paudel, B.; Khatiwada, J.R.; Zhang, J.F.; Su, Y. Household livelihood strategies and implication for
poverty reduction in rural areas of central Nepal. Sustainability 2017, 9, 612. https://doi.org/10.3390/su9040612.
18. Mengistu, D.; Haji, J. Factors affecting the choices of coping strategies for climate extremes: The case of Yabello District,
Borana Zone, Oromia National Regional State, Ethiopia. Sci. Res. 2015, 3, 129–136. https://doi.org/10.11648/j.sr.20150304.11.
19. Robaa, B.; Tolossa, D. Rural livelihood diversification and its effects on household food security: A case study at Damota Gale
Woreda, Wolayta, Southern Ethiopia. East. Afr. Soc. Sci. Res. Rev. 2016, 32, 93–118. https://doi.org/10.1353/eas.2016.0001.
20. Siraj, M.; Khan, H. Impact of micro hydropower projects on household income, expenditure and diversification of livelihood
strategies in Azad Jammu and Kashmir. Pak. Dev. Rev. 2019, 58, 45–63. https://doi.org/10.30541/v58i1pp.45-63.
21. Ho, T.D.N.; Tsusaka, T.W.; Kuwornu, J.K.M.; Datta, A.; Nguyen, L.T. Do rice varieties matter? Climate change adaptation and
livelihood diversification among rural smallholder households in the Mekong Delta region of Vietnam. Mitig. Adapt. Strateg.
Glob. Change 2022, 27, 8. https://doi.org/10.1007/s11027-021-09978-x.
22. Nambeye, E.; Mubanga, K.H. The Failure of Common Farming Systems in Promoting Livelihood Diversification and Food
Sufficiency among Smallholder Farmers: Evidence from Choma, Zambia. In Opportunities and Challenges of Smallholders and
Smallholding; Nova Science Publishers, Inc.: New York, NY, USA, 2021. pp.183–214.
23. Tukela, B.; Rao, C.A.; Rambabu, K. Analysis of Livelihood Diversification Practice on Reduction of Rural Poverty: The Case of
Hawassa Zuria Woreda of Sidama Region, Ethiopia. Int. J. All Res. Educ. Sci. Methods 2021, 9, 799–808.
24. Siqin, C.K.T.; Fang, Y.G.; Wang, H.; Xu, K. Household-livelihood Assets and Strategies in Farming-pastoral Region: The Case
of Shuangyushu Gaqa, Inner Mongolia. Sci. Geogr. Sin. 2017, 37, 1095–1103. https://doi.org/10.13249/j.cnki.sgs.2017.07.015. (In
Chinese).
25. Walelign, S.Z. Livelihood strategies, environmental dependency and rural poverty: The case of two villages in rural
Mozambique. Environ. Dev. Sustain. 2016, 18, 593–613. https://doi.org/10.1007/s10668-015-9658-6.
26. Chand, R. Labour migration as a livelihood strategy in far east Bhutan: A case study of a marginal Bhutanese Community.
Hrvat. Geogr. Glas. 2014, 75, 41–57. https://doi.org/10.21861/HGG.2013.75.02.03.
27. Martina, R.; Linstadter, A.; Frank, K.; Müller, B. Livelihood security in face of drought—Assessing the vulnerability of
pastoral households. Environ. Model. Softw. 2016, 75, 414–423. https://doi.org/10.1016/j.envsoft.2014.10.012.
28. Olsen, C.S.; Larsen, H.O. Alpine medicinal plant trade and Himalayan mountain livelihood strategies. Geogr. J. 2003, 169, 243–
254. https://doi.org/10.1111/1475-4959.00088.
29. Oostenbrugge, J.A.E.V.; Densen, W.L.T.V.; Machiels, M.A.M. How the uncertain outcomes associated with aquatic and land
resource use affect livelihood strategies in coastal communities in the Central Moluccas, Indonesia. Agric. Syst. 2004, 82, 57–91.
https://doi.org/10.1016/j.agsy.2004.01.002.
30. Qian, C.; Sasaki, N.; Jourdain, D.; Kim, S.M.; Shivakoti, P.G. Local livelihood under different governances of tourism
development in China–A case study of Huangshan mountain area. Tour. Manag. 2017, 61, 221–233.
https://doi.org/10.1016/j.tourman.2017.01.006.
31. Toillier, A.; Serpantié, G; Hervé; D; Lardon, S. Livelihood strategies and land use changes in response to conservation: Pitfalls
of community-based forest management in Madagascar. J. Sustain. For. 2011, 30, 20–56.
https://doi.org/10.1080/10549811003742357.
32. Chibinga, O.; Musimba, M.; Nyangito, M.; Simbaya, J.; Moses, D. Climate Variability impact on Livelihood Strategies among
Agro-Pastoralists in Southern Zambia. Agriculture 2021, 1, 25–29.
33. Tesfaye, Y.; Roos, A.; Campbell, B.M.; Bohlin, F. Livelihood strategies and the role of forest income in participatory-managed
forests of Dodola area in the bale highlands, southern Ethiopia. For. Policy Econ. 2011, 13, 258–265.
https://doi.org/10.1016/j.forpol.2011.01.002.
34. Raihan, F.; Milon, M. Livelihood vulnerability assessments and adaptation strategies to climate change: A case study in
Tanguar haor, Sylhet. J. Water Clim. Change 2021, 12, 3448–3463. https://doi.org/10.2166/wcc.2021.047.
35. Mulatie, C.; Timkete, A. Internal migration, rural livelihood strategies and sustainable forest management: Evidence from
Bench Maji, Kaffa and Sheka Zones, South West Ethiopia. Environ. Socio-Econ. Stud. 2021, 9, 20–31.
https://doi.org/10.2478/environ-2021-0015.
36. Tang, Q.; Bennett, S.J.; Xu, Y.; Li, Y. Agricultural practices and sustainable livelihoods: Rural transformation within the Loess
Plateau, China. Appl. Geogr. 2013, 41, 15–23. https://doi.org/10.1016/j.apgeog.2013.03.007.
37. Sun, Z.; Zhao, L.; Wang, S.Y.; Zhang, H.Y.; Wang, X.Y.; Wan, Z.Y. Targeted Poverty Alleviation and Households’ Livelihood
Strategy in a Relation-Based Society: Evidence from Northeast China. Int. J. Environ. Res. Public Health 2021, 18, 1747.
https://doi.org/10.3390/ijerph18041747.
38. Mondal, M.R. Tourism as a livelihood development strategy: A study of Tarapith Temple Town, West Bengal. Asia-Pac. J. Reg.
Sci. 2020, 4, 795–807. https://doi.org/10.1007/s41685-020-00164-6.
39. Chen, J.; Yin, S.; Gebhard, H.; Yang, X.J. Farmers’ livelihood adaptation to environmental change in an arid region: A case
study of the Minqin Oasis, northwestern China. Ecol. Indic. 2018, 93, 411–423. https://doi.org/10.1016/j.ecolind.2018.05.017.
40. Fang, Y.P.; Fan, J.; Shen, M.Y.; Song, M.Q. Sensitivity of livelihood strategy to livelihood capital in mountain areas: Empirical
analysis based on different settlements in the upper reaches of the Minjiang River, China. Ecol. Indic. 2014, 38, 225–235.
https://doi.org/10.1016/j.ecolind.2013.11.007.
Land 2022, 11, 157 21 of 22
41. Zhao, X.Y.; Liu, J.H.; Wang, W.J.; Lan, H.X.; Ma, P.Y.; Du, Y.X. Livelihood sustainability and livelihood intervention of
out-of-poverty farming households in poor mountainous areas: A case of Longnan mountainous area. Prog. Geogr. 2020, 39,
982–995. (In Chinese). https://doi.org/10.18306/dlkxjz.2020.06.009.
42. Mutabazi, K.D.; Amjath-Babu, T.S.; Sieber, S. Influence of livelihood resources on adaptive strategies to enhance climatic
resilience of farm households in Morogoro, Tanzania: An indicator-based analysis. Reg. Environ. Change 2015, 15, 1259–1268.
https://doi.org/10.1007/s10113-015-0800-7.
43. Salimah, N.; Muflikhati, I. Family capitals, livelihood strategies, and family well-being of plantation worker. J. Fam. Sci. 2016,
1, 13–23. https://doi.org/10.29244/jfs.1.1.13-23.
44. Bebbington, A. Capitals and capabilities: A framework for analyzing peasant viability, rural livelihoods and poverty. World
Dev. 1999, 27, 2021–2044. https://doi.org/10.1016/S0305-750X(99)00104-7.
45. Koczberski, G.; Curry, G.N. Making a living: Land pressures and changing livelihood strategies among oil palm settlers in
Papua New Guinea. Agric. Syst. 2005, 85, 324–339. https://doi.org/10.1016/j.agsy.2005.06.014.
46. Khosla, S.; Jena, P.R. Switch in livelihood strategies and social capital have a role to play in deciding rural poverty dynamics:
Evidence from panel data analysis from Eastern India. J. Asian Afr. Stud. 2020, 55, 76–94.
https://doi.org/10.1177/0021909619868243.
47. Kuang, F.Y.; Jin, J.J.; He, R.; Wan, X.Y.; Ning, J. Influence of livelihood capital on adaptation strategies: Evidence from rural
households in Wushen Banner, China. Land Use Policy 2019, 89, 104228. https://doi.org/10.1016/j.landusepol.2019.104228.
48. Longpichai, O.; Perret, S.R.; Shivakoti, G.P. Role of livelihood capital in shaping the farming strategies and outcomes of
smallholder rubber producers in southern thailand. Outlook Agric. 2012, 41, 117–124. https://doi.org/10.5367/oa.2012.0085.
49. Rakodi, C. A capital assets framework for analysing household livelihood strategies: Implications for policy. Dev. Policy Rev.
1999, 17, 315. https://doi.org/10.1111/1467-7679.00090.
50. Yuliati, Y.; Isaskar, R. Social capital and sustainable livelihood strategies in downstream area of Bengawan Solo River, East
Java, Indonesia. J. Sustain. Sci. Manag. 2018, 13, 201–209.
51. He, R.W.; Fang, F.; Liu, Y.W. Influence of human capital on the livelihood strategy of farming households in poor
mountainous areas: A case study of Liangshan Yi Autonomous Prefecture of Sichuan. China. Prog. Geogr. 2019, 38, 1282–1293.
https://doi.org/10.18306/dlkxjz.2019.09.002.
52. Adam, Y.O.; Pretzsch, J.; Pettenella, D. Contribution of Non-Timber Forest Products livelihood strategies to rural
development in drylands of Sudan: Potentials and failures. Agric. Syst. 2013, 117, 90–97.
https://doi.org/10.1016/j.agsy.2012.12.008.
53. Nath, S.; Laerhoven, F.V.; Driessen, P.; Nadiruzzaman, M. Capital, rules or conflict? Factors affecting livelihood-strategies,
infrastructure-resilience, and livelihood-vulnerability in the polders of Bangladesh. Sustain. Sci. 2020, 15, 1169–1183.
https://doi.org/10.1007/s11625-020-00818-6.
54. Malherbe, W.; Sauer, W.; Aswani, S. Social capital reduces vulnerability in rural coastal communities of Solomon Islands.
Ocean Coast. Manag. 2020, 191, 105186. https://doi.org/10.1016/j.ocecoaman.2020.105186.
55. Li, M.P.; Huo, X.X.; Peng, C.H.; Qiu, H.G.; Shangguan, Z.P.; Chang, C.; Huai, J. Complementary livelihood capital as a means
to enhance adaptive capacity: A case of the Loess Plateau, China. Glob. Environ. Change 2017, 47, 143–152.
https://doi.org/10.1016/j.gloenvcha.2017.10.004.
56. Nolan, S.; Unkovich, M.; Shen, Y.Y.; Li, L.L.; Bellotti, W. Farming systems of the Loess Plateau, Gansu Province, China. Agric.
Ecosyst. Environ. 2008, 124, 13–23. https://doi.org/10.1016/j.agee.2007.08.009.
57. Wu, B.; Parnwell, M.; Bradley, P. Farmer self-organizing innovation in the marginal areas of China: A study of farmer
communication networks in Zhidan, Loess Plateau. J. Rural. Coop. 2002, 30, 43–63. https://doi.org/10.22004/ag.econ.301308.
58. Zhen, N.H.; Fu, B.J.; Lü, Y.H.; Zheng, Z.M. Changes of livelihood due to land use shifts: A case study of Yanchang County in
the Loess Plateau of China. Land Use Policy 2014, 40, 28–35. https://doi.org/10.1016/j.landusepol.2013.05.004.
59. Frankenberger, T.R.; Drinkwate, M.; Maxwell, D. Operational Household Livelihood Security: A Holistic Approach for
Addressing Poverty and Vulnerability. 2000. Available online:
http://mkatherinemccaston.com/PDF/operationalizing_household_livelihood_security.pdf (accessed on 19 January 2022).
60. Krantz, L. The Sustainable Livelihood Approach to Poverty Reduction; Swedish International Development Cooperation Agency:
Stockholm, Sweden, 2001; pp. 42–98.
61. Lu, D.M.; Yang, X.J.; Shi, Y.Z.; Wang, Z.Q. Rural regime shifts and transformation development on the Loess Plateau. Acta
Geogr. Sin. 2020, 75, 348–364. https://doi.org/10.11821/dlxb202002010. (In Chinese)
62. Yang, Q.Q.; Yang, X.J.; Gao, Y.H. Change in vulnerability of rural human settlement in the semi-arid area of the Loess Plateau
since 1980: A case study of Jiaxian County, Shaanxi Province. Prog. Geogr. 2019, 38, 756–771.
https://doi.org/10.18306/dlkxjz.2019.05.012. (In Chinese)
63. Guo, B.; Xie, T.; Subrahmanyam, M.V. The impact of china’s grain for green program on rural economy and precipitation: A
case study of yan river basin in the loess plateau. Sustainability 2019, 11, 5336. https://doi.org/10.3390/su11195336.
64. Zhang, B.; Wu, P.; Zhao, X.; Gao, X.; Shi, Y. Assessing the spatial and temporal variation of the rainwater harvesting potential
(1971–2010) on the chinese loess plateau using the vic model. Hydrol. Processes 2014, 28, 534–544.
https://doi.org/10.1002/hyp.9608.
Land 2022, 11, 157 22 of 22
65. Wang, Z.Q.; Shi, C.P.; Jiang, W.; Yang, X.J. Rural transformation from the perspective of regime shifts of socio-ecological
systems in the Loess Plateau: A case study of Hongjia town in Changwu county, China. Geogr. Res. 2016, 35, 1510–1524.
https://doi.org/10.11821/dlyj201608009. (In Chinese)
66. Wamalwa, F.; Ondieki-Mwaura, F.; Ayuke, F. The Influence of Household Assets on Livelihood Choices in Kieni Sub
Counties, Kenya. Int. J. Soc. Sci. Humanit. Res. 2021, 6, 20–31.
67. Baruah, D.; Singh, N.D. Methodologies for Livelihood Support through Fish Farming at High Altitudes of Arunachal Pradesh.
J. Krishi Vigyan 2017, 5, 108–115. https://doi.org/10.5958/2349-4433.2017.00025.3.
68. Jairu, D.; Acharya, S.K. Impact of Altitude on the Livelihood of the Tea Garden Workers of North Bengal. Asian J. Agric. Ext.
Econ. Sociol. 2020, 38, 34–44. https://doi.org/10.9734/AJAEES/2020/v38i730373.
69. Bonye, S.Z.; Aasoglenang, T.A.; Yiridomoh, G.Y. Urbanization, agricultural land use change and livelihood adaptation
strategies in peri-urban Wa, Ghana Background to the study. SN Soc. Sci. 2021, 1, 9.
https://doi.org/10.1007/s43545-020-00017-1.
70. Kehinde, A.L.; Alao, O.T.; Busari, A.O.; Oyaromade, R. Climate Change, Cost of Providing Water and Livelihood
Diversification by Arable Crop Farmers in Nigeria. Niger. J. Agric. Econ. 2020, 10, 92–108.
https://doi.org/10.22004/ag.econ.310900.
71. Boncinelli, F.; Bartolini, F.; Casini, L.; Brunori, G. On farm non-agricultural activities: Geographical determinants of
diversification and intensification strategy. Lett. Spat. Resour. Sci. 2017, 10, 17–29. https://doi.org/10.1007/s12076-016-0168-4.
72. Lay, J.; Mahmoud, T.O.; M’Mukaria, G.M. Few Opportunities, Much Desperation: The Dichotomy of Non-Agricultural Activi-
ties and Inequality in Western Kenya. World Dev. 2008, 36, 2713–2732. https://doi.org/10.1016/j.worlddev.2007.12.003.
Related Documents