Differential brain activation patterns during perception of voice and tone onset time series: a MEG study Andrew C. Papanicolaou, a, * Eduardo Castillo, a Joshua I. Breier, a Robert N. Davis, a,b Panagiotis G. Simos, a and Randy L. Diehl c a Vivian L. Smith Center for Neurologic Research, Department of Neurosurgery, University of Texas—Houston Medical School, Houston, TX 77030, USA b Department of Psychology, University of Houston, Houston, TX, USA c Department of Psychology, University of Texas at Austin, Austin, TX, USA Received 14 January 2002; revised 18 July 2002; accepted 13 September 2002 Abstract Evoked magnetic fields were recorded from 18 adult volunteers using magnetoencephalography (MEG) during perception of speech stimuli (the endpoints of a voice onset time (VOT) series ranging from /ga/ to /ka/), analogous nonspeech stimuli (the endpoints of a two-tone series varying in relative tone onset time (TOT), and a set of harmonically complex tones varying in pitch. During the early time window (60 to 130 ms post-stimulus onset), activation of the primary auditory cortex was bilaterally equal in strength for all three tasks. During the middle (130 to 800 ms) and late (800 to 1400 ms) time windows of the VOT task, activation of the posterior portion of the superior temporal gyrus (STGp) was greater in the left hemisphere than in the right hemisphere, in both group and individual data. These asymmetries were not evident in response to the nonspeech stimuli. Hemispheric asymmetries in a measure of neurophysiological activity in STGp, which includes the supratemporal plane and cortex inside the superior temporal sulcus, may reflect a specialization of association auditory cortex in the left hemisphere for processing speech sounds. Differences in late activation patterns potentially reflect the operation of a postperceptual process (e.g., rehearsal in working memory) that is restricted to speech stimuli. © 2003 Elsevier Science (USA). All rights reserved. The contributions of the posterior portion of the left temporal lobe (especially Brodmann’s area 22) to language comprehension have been known at least since the time of Karl Wernicke. Following Wernicke’s (1874) seminal pub- lication, numerous reports on the effects of focal lesions have confirmed the early findings (e.g., Damasio, 1998). Further confirmation of the role of Wernicke’s area in lan- guage comprehension has been obtained during the last decade with functional brain imaging studies using positron emission tomography (PET) and functional magnetic reso- nance imaging (fMRI) (Binder et al., 1997; Demonet et al., 1993; Fiez et al., 1996; Petersen et al., 1988; Raichle, 1994). More recent imaging studies using magnetoencephalogra- phy (MEG) have shown that the posterior portion of the left superior temporal gyrus (STGp), which comprises the larg- est portion of Wernicke’s area, is necessary for phonologi- cal analysis of speech sounds, whereas both STGp and the middle temporal gyrus are activated when a task requires semantic in addition to phonological processing of spoken or printed words. This evidence (Breier et al., 1999a; Castillo et al., 2001; Simos et al., 1998, 1999, 2000a, 2002), collected noninvasively from normal adults and children, was further strengthened by the results of a direct cortical stimulation study involving four patients (Simos et al., 2000b). Other studies that examined the speech perception abilities of patients with left posterior temporal lesions (Blumstein et al., 1977) and the effects of electrocortical interference in this region (Boatman et al., 1995) corrobo- rate these findings. More recent reports, however, present * Corresponding author: Division of Clinical Neurosciences, Depart- ment of Neurosurgery, University of Texas—Houston Health Science Center, 6431 Fannin Street, Suite 7.152, Houston, TX 77030, USA. Fax: 1-713-500-7787. E-mail address: [email protected] (A.C. Papani- colaou). R Available online at www.sciencedirect.com NeuroImage 18 (2003) 448 – 459 www.elsevier.com/locate/ynimg 1053-8119/03/$ – see front matter © 2003 Elsevier Science (USA). All rights reserved. PII: S1053-8119(02)00020-4

Welcome message from author
This document is posted to help you gain knowledge. Please leave a comment to let me know what you think about it! Share it to your friends and learn new things together.
Transcript
Differential brain activation patterns during perception of voice andtone onset time series: a MEG study
Andrew C. Papanicolaou,a,* Eduardo Castillo,a Joshua I. Breier,a Robert N. Davis,a,b
Panagiotis G. Simos,a and Randy L. Diehlc
a Vivian L. Smith Center for Neurologic Research, Department of Neurosurgery, University of Texas—Houston Medical School,Houston, TX 77030, USA
b Department of Psychology, University of Houston, Houston, TX, USAc Department of Psychology, University of Texas at Austin, Austin, TX, USA
Received 14 January 2002; revised 18 July 2002; accepted 13 September 2002
Abstract
Evoked magnetic fields were recorded from 18 adult volunteers using magnetoencephalography (MEG) during perception of speechstimuli (the endpoints of a voice onset time (VOT) series ranging from /ga/ to /ka/), analogous nonspeech stimuli (the endpoints of atwo-tone series varying in relative tone onset time (TOT), and a set of harmonically complex tones varying in pitch. During the early timewindow (�60 to �130 ms post-stimulus onset), activation of the primary auditory cortex was bilaterally equal in strength for all three tasks.During the middle (�130 to 800 ms) and late (800 to 1400 ms) time windows of the VOT task, activation of the posterior portion of thesuperior temporal gyrus (STGp) was greater in the left hemisphere than in the right hemisphere, in both group and individual data. Theseasymmetries were not evident in response to the nonspeech stimuli. Hemispheric asymmetries in a measure of neurophysiological activityin STGp, which includes the supratemporal plane and cortex inside the superior temporal sulcus, may reflect a specialization of associationauditory cortex in the left hemisphere for processing speech sounds. Differences in late activation patterns potentially reflect the operationof a postperceptual process (e.g., rehearsal in working memory) that is restricted to speech stimuli.© 2003 Elsevier Science (USA). All rights reserved.
The contributions of the posterior portion of the lefttemporal lobe (especially Brodmann’s area 22) to languagecomprehension have been known at least since the time ofKarl Wernicke. Following Wernicke’s (1874) seminal pub-lication, numerous reports on the effects of focal lesionshave confirmed the early findings (e.g., Damasio, 1998).Further confirmation of the role of Wernicke’s area in lan-guage comprehension has been obtained during the lastdecade with functional brain imaging studies using positronemission tomography (PET) and functional magnetic reso-nance imaging (fMRI) (Binder et al., 1997; Demonet et al.,
1993; Fiez et al., 1996; Petersen et al., 1988; Raichle, 1994).More recent imaging studies using magnetoencephalogra-phy (MEG) have shown that the posterior portion of the leftsuperior temporal gyrus (STGp), which comprises the larg-est portion of Wernicke’s area, is necessary for phonologi-cal analysis of speech sounds, whereas both STGp and themiddle temporal gyrus are activated when a task requiressemantic in addition to phonological processing of spokenor printed words. This evidence (Breier et al., 1999a;Castillo et al., 2001; Simos et al., 1998, 1999, 2000a, 2002),collected noninvasively from normal adults and children,was further strengthened by the results of a direct corticalstimulation study involving four patients (Simos et al.,2000b). Other studies that examined the speech perceptionabilities of patients with left posterior temporal lesions(Blumstein et al., 1977) and the effects of electrocorticalinterference in this region (Boatman et al., 1995) corrobo-rate these findings. More recent reports, however, present
* Corresponding author: Division of Clinical Neurosciences, Depart-ment of Neurosurgery, University of Texas—Houston Health ScienceCenter, 6431 Fannin Street, Suite 7.152, Houston, TX 77030, USA. Fax:�1-713-500-7787.
E-mail address: [email protected] (A.C. Papani-colaou).
R
Available online at www.sciencedirect.com
NeuroImage 18 (2003) 448–459 www.elsevier.com/locate/ynimg
1053-8119/03/$ – see front matter © 2003 Elsevier Science (USA). All rights reserved.PII: S1053-8119(02)00020-4
contradictory results suggesting that the brain circuit spe-cialized for speech perception may not rely exclusively onleft posterior temporal lobe structures but may also com-prise homologous regions in the right hemisphere (for areview see Hickok and Poeppel, 2000).
Although the above findings clearly implicate STGp asbeing critical for the phonological analysis of speechsounds, it remains unclear from imaging results whether thisregion is also critically involved in lower-level analysis ofspeech stimuli, which presumably involves extraction ofperceptually relevant cues (phonetic analysis). It is alsounclear whether the role of this region is restricted to theanalysis of speech stimuli or whether it extends also to theanalysis of nonspeech sounds having comparable acousticcomplexity. The notion of a specialized perceptual mecha-nism for speech sounds has been advocated for many years(Liberman, 1996; Liberman et al., 1967; Liberman andMattingly, 1985; Studdert-Kennedy and Shankweiler,1970), and STGp is a plausible cortical substrate for such amechanism. Alternatively, STGp may be critical for theanalysis of certain complex acoustic stimuli, regardless ofwhether such stimuli are perceived as speech sounds or not.In other words, it is possible to create nonspeech stimuli thatcontain acoustic cues similar to those used by listeners todiscriminate speech sounds. Along these lines, a specializa-tion of the left STGp has been suggested for analyzing rapidtemporal cues regardless of whether they are embedded in aspeech context or not (Liegeois-Chauvel et al., 1999; Ni-cholls, 1996; Robin et al., 1990).
Early studies regarding hemispheric specialization forspeech perception using dichotic listening techniques foundthat subjects exhibited a right ear advantage, indicative ofgreater left hemisphere processing, for most speech stimuli(Bradshaw and Nettleton, 1981; Bryden, 1982; Cutting,1974). However, a right ear advantage was also observedfor the identification of certain nonspeech stimuli, includingsquare-wave segments differing in rise time (Blechner,1976) and temporal order judgments of multiple briefsounds differing in pitch or duration (Halperin et al., 1973).In contrast, perception of various other types of nonspeechsounds, such as isolated formant transitions (Blechner,1977) or sine-wave analogs of consonant–vowel syllables(Cutting, 1974), showed either a left-ear advantage or no earadvantage. Thus, the evidence from dichotic listening ex-periments is equivocal with respect to the possible special-ized role of the left hemisphere in the processing of non-speech sounds. Such stimuli might be processed by the samemechanism that handles speech sounds or, alternatively,processed bilaterally, even by the right hemisphere.
In the present study, we used MEG to record brainactivity of individual participants engaged in discriminating(a) consonant–vowel syllables varying along the voice onsettime (VOT) dimension, (b) nonspeech two-tone patterns ofthe same duration and intensity as the speech sounds andvarying along a relative tone onset time (TOT) dimension,and (c) harmonically complex tones varying in pitch. Given
that MEG can, in principle, provide an outline of regionallyelevated levels of neurophysiological activity in real time, itis well-suited to examine whether bilaterally symmetricactivation reported by several fMRI and PET studies (e.g.,Belin et al., 2002; Jancke et al., 2002) is a by-product of theprolonged signal integration time necessary to capture task-related hemodynamic responses.
Our choice of VOT and TOT stimuli was motivated bytwo considerations. First, we wanted to use a series ofnonspeech stimuli that are acoustically analogous to thespeech stimulus series, at least with respect to the primary(within-series) dimension of variation. For the stimulusranges used here, the VOT and TOT items may each bedescribed as consisting of a high- and a low-frequencycomponent, or spectral band, such that the onset of thelow-frequency component or band is delayed by some in-terval (ranging from 0 to 60 ms) relative to the onset of thehigh-frequency band. To this extent, then, both the VOT andTOT stimulus series are acoustically comparable. Second,although VOT (/ga/-/ka/) stimuli sound very different fromTOT stimuli, there are interesting similarities in how humanlisteners identify and discriminate members of the two sets.Lisker and Abramson (1970); Abramson and Lisker, 1970)showed that listeners perceive VOT stimuli categorically.That is, their phoneme labeling performance yielded rela-tively sharp category boundaries, and their ability to dis-criminate between adjacent stimuli along the VOT dimen-sion was near chance within a phoneme category, but nearperfect when a stimulus pair straddled a phoneme boundary.Pisoni (1977) reported quite similar categorical labeling anddiscrimination functions for TOT stimuli that shared therelative temporal onset properties of the VOT stimuli usedby Lisker and Abramson (1970). This parallel betweenspeech and nonspeech results suggests that there may becommon mechanisms involved in the processing of VOTand TOT stimuli. For example, Pisoni posited the existenceof a common mechanism that discriminates (or fails todiscriminate) differences in temporal order of componentevents at stimulus onset (see also Miller et al., 1976). Athird set of stimuli, consisting of harmonically complextones varying in fundamental frequency, were included inthe design of the present study. Like the TOT series, thesestimuli were not perceived as speech sounds but, unlike thetwo-tone TOT sounds, they did not contain any temporal orspectral cues that could support discrimination in a categor-ical fashion. Such stimuli are typically associated with bi-laterally symmetric or predominantly right superior tempo-ral lobe activation (Griffiths, 2001; Zatorre, 1988).
To understand the process by which brain activationmaps were constructed for each task, a brief introduction tothe MEG procedures may be useful. MEG is a completelynoninvasive method of functional brain imaging, akin toquantitative electroencephalography. It consists first of re-cording, on the head surface, magnetic flux associated withelectrical currents in activated sets of neurons (Lewine,1990; Papanicolaou, 1998; Papanicolaou and Tarkka,
449A.C. Papanicolaou et al. / NeuroImage 18 (2003) 448–459
1996). Second, it consists of estimating the location of suchsets or activity sources. Third, the method involves project-ing the sources onto a structural magnetic resonance imageof the brain allowing for visualization of the activated brainregions. MEG has undergone a rapid evolution during thepast few years and is used by an increasing large number ofcenters for mapping the primary sensory cortex (Nakasato etal., 1997; Ruohonen et al., 1996; Seki et al., 1996; Sobel etal., 1993), as well as association cortex (Rogers et al., 1991,1993; Simos et al., 1997).
The procedures for imaging the brain mechanisms ofsensory and cognitive functions through MEG can be sum-marized as follows. Stimuli evoke brain activity soon afterthey impinge on the sensory receptors. One basic aspect ofsuch activity is the intra- and extracellular flow of ions,which generate electrical currents and magnetic fields. Re-petitive application of the stimulus results in repeated evo-cation of the same currents and fields which, when recordedon the head surface, result in the well-known evoked po-tentials (EPs) and their magnetic counterparts, the evokedfields (EFs). The distribution of EFs on the head surfacelends itself, much more readily than the distribution of EPs,to mathematical estimates of the location and extent of brainactivation sources.
EFs, no less than the familiar evoked potentials, arewaveforms representing variations of brain activity overtime following stimulus presentation. Some of these varia-tions are observed consistently across various experimentalconditions and are referred to as components. There are twobasic types of components: early ones like the N1 (and itsmagnetic counterpart N1m) that have been shown to reflectactivation of primary sensory cortex (Nakasato et al., 1997;Ruohonen et al., 1996; Seki et al., 1996; Sobel et al., 1993),and those that occur later in time that reflect activation ofassociation cortex (Rogers et al., 1991, 1993; Simos et al.,1997). On the basis of the early components, one can con-struct images of the brain mechanisms of sensory functions,whereas the late ones are used for constructing maps ofhigher functions such as language.
In a series of studies involving more than 200 individualsthus far, we have established the spatiotemporal pattern ofbrain activation specific to simple somatosensory functions,aural language comprehension, and word reading, and haveverified their stability or reproducibility over time (Breier etal., 1999b, 2000). Moreover, in a series of investigationsstill in progress (Papanicolaou et al., 1999; Simos et al.,1999), the validity and topographical specificity of thesemaps have been established by comparing them with theresults of direct cortical stimulation mapping, and with theresults of the intracarotid amytal (Wada) procedure in morethan 60 adult patients and 20 children (see Breier et al.,1999c, 2001; Maestu et al., 2002, for initial reports on thesepatients). Having thus established the validity and the reli-ability of MEG mapping, we applied it in the present ex-periment to test three main predictions based on earlierresults reviewed above. We expected that the early EF
components reflecting early auditory processing of theVOT, TOT, and complex tone stimuli would be localized inthe primary auditory cortex and would be essentially bilat-erally equal in strength. We also expected that for the VOTstimuli, the middle (measured between �130 and 800 msafter stimulus onset) and late (observed between 800 and1400 ms) EF components would reflect predominant acti-vation of left hemisphere regions, primarily of the leftSTGp. Finally, we expected that the degree of posteriortemporal lobe activation in response to the complex tonestimuli would be, on average, bilaterally symmetric or showa slight right hemisphere advantage (Griffiths, 2001;Zatorre, 1988) and that the degree of left STGp activation inparticular would be lower in response to complex tonestimuli than to the speech syllables. In addition to testingthese predictions, we explored the issue of whether themiddle and late EF components for the TOT stimuli wouldalso show a predominant activation of the left STGp, or amore bilateral activation pattern, or even greater activationof the right STGp.
Materials and methods
Participants
Eighteen adult normal volunteers (11 males, 7 females)participated in the study and were paid for their participation.The participants had a mean age of 31.11 years (SD � 7.78)and ranged in age from 21 to 45 years. All participants hadnormal hearing. They participated in two separate experimen-tal sessions involving the VOT, TOT, and complex tone tasks,which were given in a different random order to each partici-pant. In one session, only behavioral responses were recorded;in the other session, brain activity was recorded.
Stimuli and procedures
Seven consonant–vowel tokens that formed a velar voicingseries with VOT values ranging from 0 to 60 ms in 10-ms stepsserved as stimuli in the VOT task. The syllables were preparedusing the cascade branch of the Klatt88 software synthesizer.Variation of VOT was achieved by broadening the bandwidthof F1 and exciting F2 and F3 with a noise source during theperiod between stimulus onset and voicing source onset. Thefundamental frequency (F0) was constant at 120 Hz for allsyllables. The nominal formant frequencies at stimulus onsetwere 300, 1840, and 1960 Hz and changed linearly across a55-ms transition period to 768 1333, and 2522 Hz. The tran-sitions were followed by a 200-ms steady-state segment result-ing in a total stimulus length of 255 ms. In addition, the relativebalance of low-frequency energy in the voicing source wasenhanced by setting the spectral tilt parameter of the Klattsynthesizer to 10 along the entire length of the syllable. Finally,the voiced portions of the stimuli were low-pass filtered at3200 Hz.
450 A.C. Papanicolaou et al. / NeuroImage 18 (2003) 448–459
In the TOT task, stimuli were seven two-tone tokens,constructed according to the parameters described by Pisoni(1977). The TOT, or delay in the onset of the lower (500Hz) tone in relation to the higher tone (1500 Hz), variedbetween 0 and 60 ms in 10-ms steps. The termination of thetwo tones occurred simultaneously. The duration of the1500-Hz tone was always 230 ms. Seven two-tone sounds,modeled after the 0-ms TOT token, served as stimuli in thethird task. The two tones started and ended simultaneously(with a total duration of 230 ms), but their frequency variedin equal steps, producing a change in pitch. The frequenciesof the lower and higher tones for each of the seven soundswere as follows: 500/1500 Hz (lowest pitch), 530/1600 Hz,560/1700 Hz, 590/1800 Hz, 620/1900 Hz, 650/2000 Hz,680/2100 Hz (highest pitch).
In all three tasks, the stimuli were presented binaurally inpairs with an onset-to-onset interval of 2 s between pairmembers. The second stimulus could be any of the sevenitems of the respective series. During the MEG recordings,the subjects were asked to decide if the two tokens in eachpair were the same or different, responding by raising theirright (or left) index finger if the tokens were the same. Theresponding hand was counterbalanced across subjects. Theinterval between stimulus pairs was varied randomly acrosstrials between 3 and 4 s. Stimulus delivery was accom-plished via two 5-m-long plastic tubes terminating in earinserts. Stimulus intensity was 80 dB SPL at the subject’souter ear. EFs were recorded to the first stimulus of eachpair to ensure that the brain activity recorded correspondedto perceptual analysis operations, and did not reflect theadditional cognitive operations that matching of the stimulientails. The first stimulus in every pair was always a tokenfrom either endpoint of the VOT, TOT, or complex toneseries, i.e., either a /ga/ with a 0-ms VOT or a /ka/ with a�60 ms VOT in the VOT task, a token with either a 0-msor a �60-ms TOT in the TOT task, and either a lowest- orhighest-pitch tone for the complex tone task. In this mannerbrain activity was always recorded in response to perceptu-ally unambiguous stimuli.
MEG recordings were conducted with a whole-head,148-channel neuromagnetometer array (4-D Neuroimaging,Magnes WH 2500) housed in a magnetically shielded cham-ber. The magnetic flux measurements were filtered with abandpass filter between 0.1 and 50 Hz and digitized at 250Hz. Intrinsic noise in each channel was � 10 fT/Hz. Tofurther reduce the amount of magnetic noise produced byremote sources, the MEG data were submitted to an inter-active noise reduction procedure that aided in reducingenvironmental noise and is part of the signal analysissoftware. This procedure uses the magnetic flux record-ings obtained on-line from 11 “reference sensors” (six mag-netometers, and five first-order axial gradiometers) locatedat a distance of approximately 30 cm above the array of 148magnetometers. The distance between these reference sen-sors and the intracranial generators of magnetic flux ensuresthat they record only “extraneous” flux (i.e., flux that is not
due to neuronal currents). Following each recording sessionthe magnetic flux values recorded at each time point withineach epoch were partialed out from the corresponding mag-netic flux values measured by each of the 148 magnetom-eters. The single-trial EF segments in response to 70–80stimulus presentations were averaged separately for eachsensor after excluding those containing eye movement (asindicated by a peak-to-peak amplitude in the electro-oculo-gram in excess of 50 �V) or other myogenic or mechanicalartifacts. Finally, the averaged epochs were digitally filteredwith a low-pass filter of 20 Hz to improve signal quality andadjusted relative to the mean amplitude in the 150-ms pre-stimulus period to remove dc offset.
The intracranial generators of the observed EFs at suc-cessive 4-ms intervals were modeled as equivalent currentdipoles (ECDs) by using the nonlinear Levenberg–Mar-quardt algorithm on a spherical head model. This methodsearched for the ECD that was most likely to have producedthe observed magnetic field distribution at a given point intime (according to the Biot–Savart law). ECD solutionswere considered as satisfactory on meeting two criteria: (1)a correlation coefficient of at least 0.90 between the ob-served and “best” predicted magnetic field distributions, and(2) a 95% confidence volume of 30 cm3 or smaller. Thelatter corresponded to the region that was most likely (i.e.,in 95% of all possible repetitions of the measurement) tocontain the source of the observed magnetic field distribu-tion. The dipole fitting algorithm was applied to the mag-netic flux measurements obtained from a group of 34–38sensors, always including both magnetic flux extrema. ECDlocation was computed in reference to a Cartesian coordi-nate system defined by a set of three anatomical landmarks(fiduciary points): the right and left external meati and thenasion. The line passing through the right and left externalmeati served as the Y axis. The line between the nasion andthe midpoint of the Y axis defined the X axis, and the lineperpendicular to the X–Y plane, passing through the inter-section of the X and Y axes, defined the Z axis. The positionof the magnetometers relative to the subject’s head wasprecisely determined using five coils, three of which wereattached to the fiduciary points and two on the forehead. Thecoils were turned on briefly at the beginning and again at theend of the recording session, and their precise location inthree-dimensional space was determined using a localiza-tion algorithm. During the recording session a fiberopticmotion detector was used to ensure that the subject did notchange position relative to the sensor.
The degree of activation of a particular area, or the totalduration of its activation, was estimated by the total numberof successive dipoles that accounted for the EF components.Several studies from our group and others (Breier et al.,1999c, 2001; Papanicolaou et al., 1999; Simos et al., 1998a,1999; Maestu et al., 2002) have provided evidence that theprocedure for constructing brain activation profiles used inthe present study is sufficiently accurate for identifying:(1) the hemisphere that is more prominently involved in
451A.C. Papanicolaou et al. / NeuroImage 18 (2003) 448–459
basic linguistic functions, and (2) specific regions within thedominant hemisphere that are indispensable for particularprocesses such as decoding and encoding of auditory andprinted words. The results of these studies directly supportthe concurrent validity of our approach to deriving activa-tion maps. The construct validity of the measure of brainactivation used in this procedure reflects the degree to whichthe measure provides an accurate representation of both thespatial and temporal extent of regionally elevated levels ofneurophysiological activity. The rationale for using thenumber of sequential activity sources as a dependent mea-sure is based on the premise that processing of an incomingauditory stimulus requires a transient increase in neuronalsignaling in one or more neuronal populations. This in turnproduces a time-limited increase in intracellular currentswhich, once integrated, can be represented as an electricaldipole. The strength of the dipole (i.e., the magnitude ofintracellular current) at each point in time is directly relatedto the strength of the resulting magnetic flux. The dipolarnature of the source can be ascertained from the dipolarappearance of the surface distribution of recorded magneticflux (contour map). Assuming the presence of a dipolarsource, the degree of confidence with which the underlyingsource is estimated by the dipole fitting program directlyreflects the strength of the recorded magnetic flux at thatpoint in time. (The correlation coefficient between the ob-served and an ideal or hypothesized underlying source is awidely used index of the degree to which the computedsource solution approximates that of a dipolar source.) Thenumber of activity source solutions that exceed a particu-lar—empirically defined criterion—reflects the amount oftime that the rate of neuronal signaling in a particular patchof cortex produces a detectable extracranial signature. Thisis a simplified account, as other factors also contribute to thestrength of the recorded magnetic flux, such as the orienta-tion of the cortical patch containing the active neuronsrelative to the plane of each magnetometer sensor and thecharacteristics of background noise, or magnetic flux pro-duced by sources not related to the neurophysiological ac-tivity that processing of the stimuli entails. The empiricallyestablished concurrent validity of this measure, however,lends credence to the plausibility of the claim that theduration of focal cortical activity may be used as a measureof the “degree of engagement” of a particular cortical regionin a given task. This measure complements similar measuresemployed by other imaging modalities, such as the spatialextent of cortex that shows differential hemodynamic mod-ulation across two different tasks.
Results
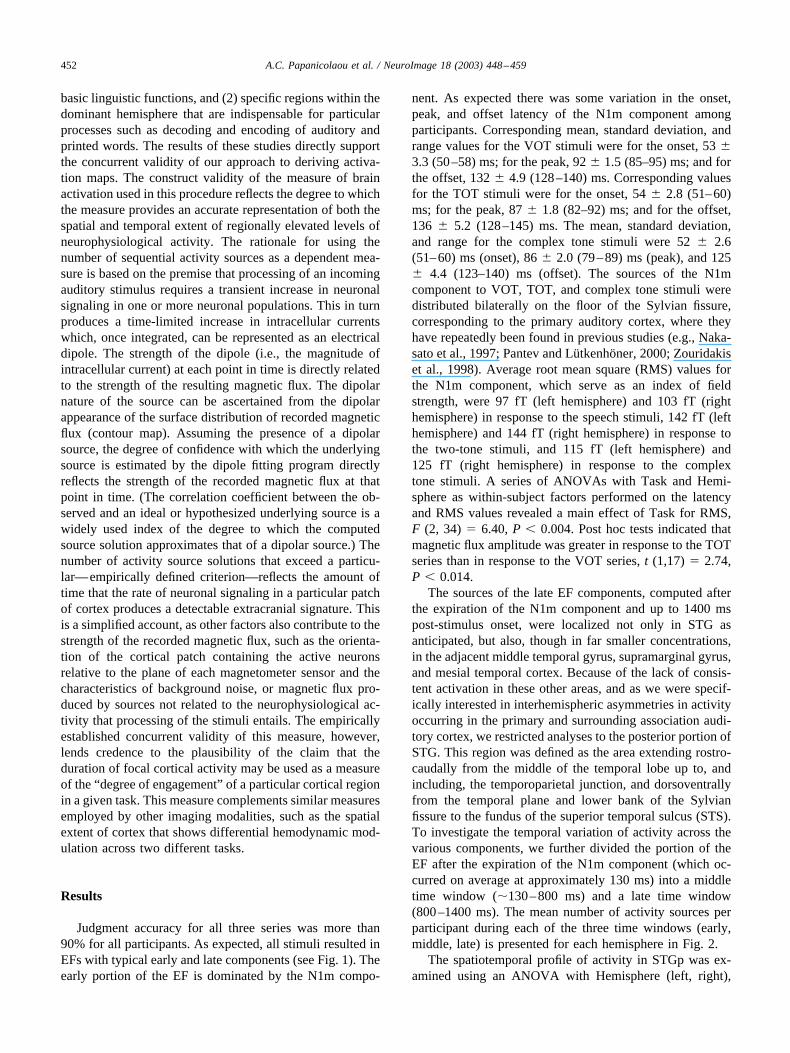
Judgment accuracy for all three series was more than90% for all participants. As expected, all stimuli resulted inEFs with typical early and late components (see Fig. 1). Theearly portion of the EF is dominated by the N1m compo-
nent. As expected there was some variation in the onset,peak, and offset latency of the N1m component amongparticipants. Corresponding mean, standard deviation, andrange values for the VOT stimuli were for the onset, 53 �3.3 (50–58) ms; for the peak, 92 � 1.5 (85–95) ms; and forthe offset, 132 � 4.9 (128–140) ms. Corresponding valuesfor the TOT stimuli were for the onset, 54 � 2.8 (51–60)ms; for the peak, 87 � 1.8 (82–92) ms; and for the offset,136 � 5.2 (128–145) ms. The mean, standard deviation,and range for the complex tone stimuli were 52 � 2.6(51–60) ms (onset), 86 � 2.0 (79–89) ms (peak), and 125� 4.4 (123–140) ms (offset). The sources of the N1mcomponent to VOT, TOT, and complex tone stimuli weredistributed bilaterally on the floor of the Sylvian fissure,corresponding to the primary auditory cortex, where theyhave repeatedly been found in previous studies (e.g., Naka-sato et al., 1997; Pantev and Lutkenhoner, 2000; Zouridakiset al., 1998). Average root mean square (RMS) values forthe N1m component, which serve as an index of fieldstrength, were 97 fT (left hemisphere) and 103 fT (righthemisphere) in response to the speech stimuli, 142 fT (lefthemisphere) and 144 fT (right hemisphere) in response tothe two-tone stimuli, and 115 fT (left hemisphere) and125 fT (right hemisphere) in response to the complextone stimuli. A series of ANOVAs with Task and Hemi-sphere as within-subject factors performed on the latencyand RMS values revealed a main effect of Task for RMS,F (2, 34) � 6.40, P � 0.004. Post hoc tests indicated thatmagnetic flux amplitude was greater in response to the TOTseries than in response to the VOT series, t (1,17) � 2.74,P � 0.014.
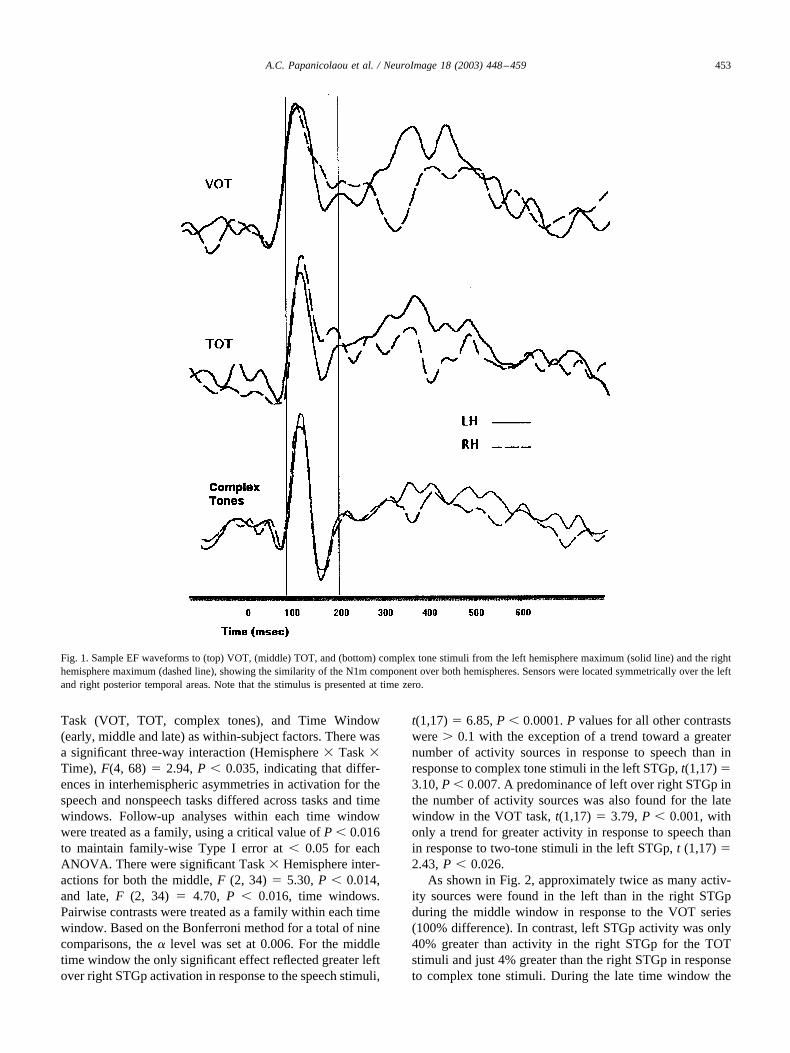
The sources of the late EF components, computed afterthe expiration of the N1m component and up to 1400 mspost-stimulus onset, were localized not only in STG asanticipated, but also, though in far smaller concentrations,in the adjacent middle temporal gyrus, supramarginal gyrus,and mesial temporal cortex. Because of the lack of consis-tent activation in these other areas, and as we were specif-ically interested in interhemispheric asymmetries in activityoccurring in the primary and surrounding association audi-tory cortex, we restricted analyses to the posterior portion ofSTG. This region was defined as the area extending rostro-caudally from the middle of the temporal lobe up to, andincluding, the temporoparietal junction, and dorsoventrallyfrom the temporal plane and lower bank of the Sylvianfissure to the fundus of the superior temporal sulcus (STS).To investigate the temporal variation of activity across thevarious components, we further divided the portion of theEF after the expiration of the N1m component (which oc-curred on average at approximately 130 ms) into a middletime window (�130–800 ms) and a late time window(800–1400 ms). The mean number of activity sources perparticipant during each of the three time windows (early,middle, late) is presented for each hemisphere in Fig. 2.
The spatiotemporal profile of activity in STGp was ex-amined using an ANOVA with Hemisphere (left, right),
452 A.C. Papanicolaou et al. / NeuroImage 18 (2003) 448–459
Task (VOT, TOT, complex tones), and Time Window(early, middle and late) as within-subject factors. There wasa significant three-way interaction (Hemisphere � Task �Time), F(4, 68) � 2.94, P � 0.035, indicating that differ-ences in interhemispheric asymmetries in activation for thespeech and nonspeech tasks differed across tasks and timewindows. Follow-up analyses within each time windowwere treated as a family, using a critical value of P � 0.016to maintain family-wise Type I error at � 0.05 for eachANOVA. There were significant Task � Hemisphere inter-actions for both the middle, F (2, 34) � 5.30, P � 0.014,and late, F (2, 34) � 4.70, P � 0.016, time windows.Pairwise contrasts were treated as a family within each timewindow. Based on the Bonferroni method for a total of ninecomparisons, the � level was set at 0.006. For the middletime window the only significant effect reflected greater leftover right STGp activation in response to the speech stimuli,
t(1,17) � 6.85, P � 0.0001. P values for all other contrastswere � 0.1 with the exception of a trend toward a greaternumber of activity sources in response to speech than inresponse to complex tone stimuli in the left STGp, t(1,17) �3.10, P � 0.007. A predominance of left over right STGp inthe number of activity sources was also found for the latewindow in the VOT task, t(1,17) � 3.79, P � 0.001, withonly a trend for greater activity in response to speech thanin response to two-tone stimuli in the left STGp, t (1,17) �2.43, P � 0.026.
As shown in Fig. 2, approximately twice as many activ-ity sources were found in the left than in the right STGpduring the middle window in response to the VOT series(100% difference). In contrast, left STGp activity was only40% greater than activity in the right STGp for the TOTstimuli and just 4% greater than the right STGp in responseto complex tone stimuli. During the late time window the
Fig. 1. Sample EF waveforms to (top) VOT, (middle) TOT, and (bottom) complex tone stimuli from the left hemisphere maximum (solid line) and the righthemisphere maximum (dashed line), showing the similarity of the N1m component over both hemispheres. Sensors were located symmetrically over the leftand right posterior temporal areas. Note that the stimulus is presented at time zero.
453A.C. Papanicolaou et al. / NeuroImage 18 (2003) 448–459
percentage difference between left and right STGp was100% in the VOT task, 5% in the TOT task, and �4.5% inthe complex tone task.
The distribution of individual scores supported the groupdata. Laterality indices were computed to describe hemi-spheric asymmetries in the number of activity sources inSTGp, using the formula (L-STGp � R-STGp) / (L-STGp� R-STGp). Consistent, left-leaning asymmetries werefound only during the VOT task for both the middle (17 of18 participants, binomial test: P � 0.0001) and late (15 of18 participants, binomial test: P � 0.008) time windows. Anonsignificant majority of participants showed a similartrend during the middle time window in the TOT task(12/18, P � 0.24). This trend was reversed during the latewindow in the TOT task (6/18 participants) and during themiddle and late windows in the complex tone task (7/18 and9/18 participants, respectively).
A second set of analyses focused on the RMS and prod-uct-moment (Q) values associated with satisfactory ECD
solutions during the middle and late time windows. Q is anestimate of the strength of the intracranial current producingthe observed magnetic flux distribution at a particular pointin time. Both parameters indicated a general reduction in thestrength of stimulus-locked, focal neurophysiological activ-ity during the late time window, but no significant effectsinvolving Task or Hemisphere were present. Mean andstandard deviation values are listed in Table 1.
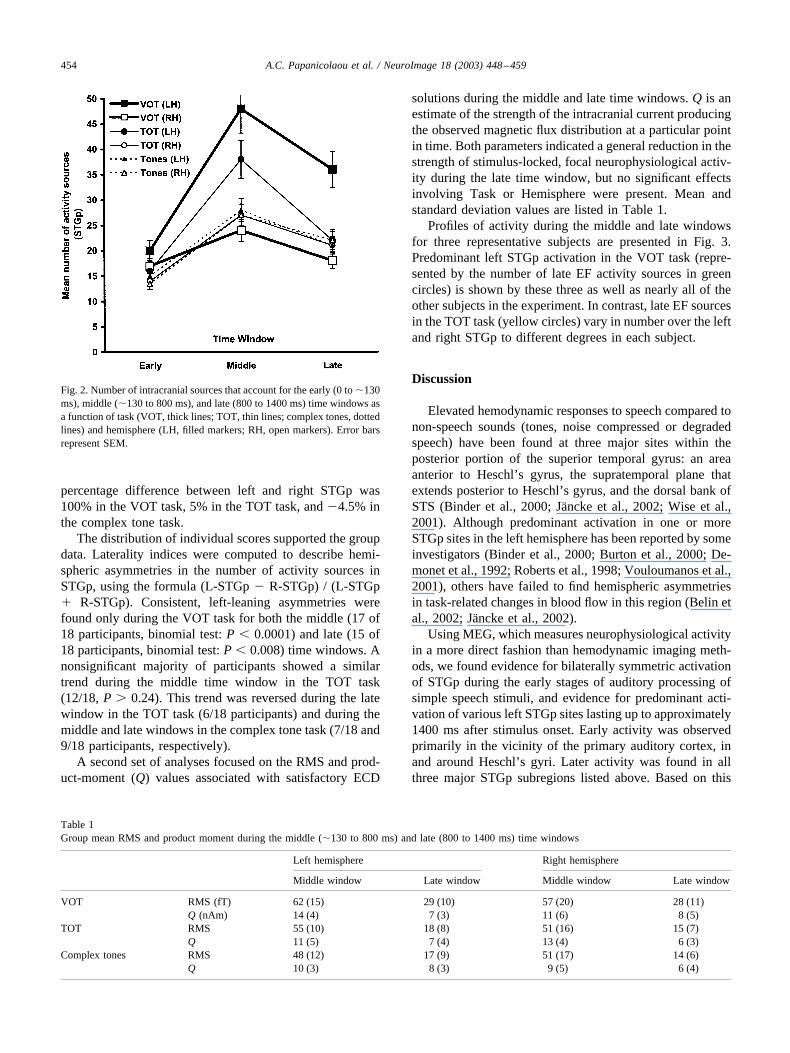
Profiles of activity during the middle and late windowsfor three representative subjects are presented in Fig. 3.Predominant left STGp activation in the VOT task (repre-sented by the number of late EF activity sources in greencircles) is shown by these three as well as nearly all of theother subjects in the experiment. In contrast, late EF sourcesin the TOT task (yellow circles) vary in number over the leftand right STGp to different degrees in each subject.
Discussion
Elevated hemodynamic responses to speech compared tonon-speech sounds (tones, noise compressed or degradedspeech) have been found at three major sites within theposterior portion of the superior temporal gyrus: an areaanterior to Heschl’s gyrus, the supratemporal plane thatextends posterior to Heschl’s gyrus, and the dorsal bank ofSTS (Binder et al., 2000; Jancke et al., 2002; Wise et al.,2001). Although predominant activation in one or moreSTGp sites in the left hemisphere has been reported by someinvestigators (Binder et al., 2000; Burton et al., 2000; De-monet et al., 1992; Roberts et al., 1998; Vouloumanos et al.,2001), others have failed to find hemispheric asymmetriesin task-related changes in blood flow in this region (Belin etal., 2002; Jancke et al., 2002).
Using MEG, which measures neurophysiological activityin a more direct fashion than hemodynamic imaging meth-ods, we found evidence for bilaterally symmetric activationof STGp during the early stages of auditory processing ofsimple speech stimuli, and evidence for predominant acti-vation of various left STGp sites lasting up to approximately1400 ms after stimulus onset. Early activity was observedprimarily in the vicinity of the primary auditory cortex, inand around Heschl’s gyri. Later activity was found in allthree major STGp subregions listed above. Based on this
Fig. 2. Number of intracranial sources that account for the early (0 to �130ms), middle (�130 to 800 ms), and late (800 to 1400 ms) time windows asa function of task (VOT, thick lines; TOT, thin lines; complex tones, dottedlines) and hemisphere (LH, filled markers; RH, open markers). Error barsrepresent SEM.
Table 1Group mean RMS and product moment during the middle (�130 to 800 ms) and late (800 to 1400 ms) time windows
Left hemisphere Right hemisphere
Middle window Late window Middle window Late window
VOT RMS (fT) 62 (15) 29 (10) 57 (20) 28 (11)Q (nAm) 14 (4) 7 (3) 11 (6) 8 (5)
TOT RMS 55 (10) 18 (8) 51 (16) 15 (7)Q 11 (5) 7 (4) 13 (4) 6 (3)
Complex tones RMS 48 (12) 17 (9) 51 (17) 14 (6)Q 10 (3) 8 (3) 9 (5) 6 (4)
454 A.C. Papanicolaou et al. / NeuroImage 18 (2003) 448–459
evidence one may surmise that association cortex in the leftSTGp is preferentially engaged during processing of simplespeech stimuli. However, support for the controversialclaim that the left STGp is further specialized for the pho-
nological and/or phonetic analysis of speech stimuli wouldrequire evidence for selective activation of this area inresponse to speech stimuli as compared with auditory stim-uli that are not perceived as speech. Two such sets of stimuli
Fig. 3. Locations of activity sources during the late components of the EFs in response to speech (green circles) and nonspeech stimuli (yellow circles forTOT tokens and magenta circles for complex tones) for three representative subjects. Source locations computed at the peak of the N1m component are shownas red (speech), blue (TOT), or white (complex tones) triangles. For the MEG data slice thickness is 1 cm. Note the variety of activation profiles during inthe TOT task, which contrasts sharply with the more invariable profile obtained during the VOT task.
455A.C. Papanicolaou et al. / NeuroImage 18 (2003) 448–459
were used in the present study. The two-tone stimuli containa temporal acoustic cue (TOT), which is acoustically andperceptually equivalent to voice-onset time, a cue used bylisteners to discriminate among voiced (/b/, /d/, /g/) andvoiceless (/p/, /t/, /k/) consonants. In contrast, complex tonestimuli lack acoustic cues known to be essential for theperception of speech sounds. Although neither stimulusseries can be perceived as speech, TOT tokens can beperceived categorically like voiced and voiceless conso-nants. Our data failed to provide strong support for thehypothesis that STGp is specialized for phonological and/orphonetic analysis of speech sounds. The number of activitysources in the left STGp during the middle window, reflect-ing neuronal signaling around the time that a perceptualdecision regarding the identity of the stimulus is made, didnot differ significantly between the VOT and TOT series.There was, however, a significant difference betweenspeech stimuli and complex tones, suggesting that leftSTGp activation may require the presence of certain pho-netically relevant acoustic cues that were absent from thelatter stimulus series. Interestingly, there was a decline inthe degree of left STGp activity, in both the middle and latewindows, from speech to nonspeech analogues to complextones. This trend cannot be accounted for by task differ-ences in the early auditory processing associated withacoustic differences among the three stimulus sets, sinceactivity in the early window did not reveal trends in thesame direction. Therefore, linguistic context per se (speechin the VOT task, nonspeech in the TOT task) may alsomodulate activity in left STGp in addition to the presence ofa phonetically relevant acoustic cue. This preliminary evi-dence may suggest that speech stimuli, even those that haveno lexical referents, receive specialized processing by neu-rophysiological mechanisms located in the posterior part ofthe superior temporal gyrus.
Disagreements among previous functional brain imagingstudies with respect to the degree of lateralized, speech-specific activation of STGp may be explained, at least inpart, by the presence of large individual differences inflatingthe contribution of sampling error in the data. Inspection ofindividual activation profiles revealed a great degree ofvariability, with 10 participants showing greater activity inthe VOT than in the TOT task and the remaining 8 partic-ipants showing the opposite trend. The difficulty in detect-ing consistent hemispheric asymmetries in the context ofspeech processing tasks may also be due in part to the factthat hemodynamic measures reflect underlying changes intissue metabolism resulting from neurophysiological pro-cesses that occur both early (and appear bilaterally symmet-ric) and late after stimulus onset. Other contributing factorsmay include masking effects produced by scanner noise (infMRI studies) (Hermannn et al., 2000), problems related tothe need to match stimuli in the experimental and baselineconditions (validity of the subtraction protocol), and differ-ences among studies in image analysis procedures (e.g.,whether image “flipping” is employed) (Jancke et al., 2002).
Given the lack of major differences in the degree ofactivity in response to speech tokens and their two-toneanalogs during the early and middle time windows, what arewe to make of the different pattern that emerges during thelate time window? It appears unlikely that this pattern isattributable to differences in perceptual processing per se. Ina reaction time study (Pisoni and Tash, 1974), listeners wereable to categorize synthetic VOT stimuli accurately in under600 ms, and in even less time when the stimuli were highlyunambiguous series-endpoint stimuli (such as those used toelicit the evoked magnetic fields recorded in the presentstudy). Because these reaction times reflect both perceptualprocessing and response selection and execution, the actualperceptual processing times are no doubt considerablyshorter still. Thus, we can assume that by the beginning ofthe late time window in the present study (i.e., 800 mspost-stimulus onset), perceptual processing of a given stim-ulus was essentially complete. One possible explanation forthese results is that the left STGp remains more active forthe VOT task during the late time window to support con-tinued activation of the representation of the speech stimuliin working memory. Recall that during the VOT, TOT, andcomplex tone tasks, participants heard stimulus pairs anddecided if the two items were the same or different. Thebrain activity reported and analyzed in this study was re-corded as participants heard the first member of a stimuluspair and awaited presentation of a second member. Thecontinued activation of the left STGp during the late win-dow may reflect the operation of a covert rehearsal process,or “articulatory loop” in working memory (Baddeley,1986), perhaps in tandem with prefrontal areas, to supportthe continued representation of such stimuli and therebyfacilitate comparisons with subsequently presented stimuli.Such a memory rehearsal process is known to be specific tospeech, at least among auditory stimuli, which would ex-plain why the continued activation of the left STGp was notobserved for the TOT stimuli (Kim et al., 2002; Schweitzeret al., 2000). Moreover, sustained electrophysiological ac-tivity that lasts for several seconds in various lateral tem-poral lobe sites has been found during intracranial record-ings in patients performing working memory tasks(Ojemann and Schoenfield-McNeill, 1999).
Hemisphere differences in the field strength of the N1mcomponent in response to speech stimuli (vowels) maydepend on specific tasks demands (Poeppel et al., 1996). Ingeneral, however, brain activity represented by the earlycomponent of the EF appears to be similar in response toboth speech and nonspeech stimuli, with differences beingapparent only during later processing (e.g., Eulitz et al.,1995). In fact, evidence from a series of earlier MEG studiessuggests that systematic variations in the intensity of N1mactivity in response to the VOT and TOT series used inthe present study are virtually identical for speech andnonspeech stimuli (Simos et al., 1998b,c). Interestingly,changes in the N1m amplitude paralleled the perceptualidentification functions displayed by the same participants.
456 A.C. Papanicolaou et al. / NeuroImage 18 (2003) 448–459
Modulation of the amplitude of the magnetic mismatchfield, which occurs slightly later than the N1m response andoriginates in the vicinity of the primary auditory cortex inthe supratemporal plane, may also reflect phonetic disfinc-tions (Phillips et al., 2000). In the present study, while earlyactivity was essentially bilaterally equivalent for bothspeech and nonspeech stimuli, we did observe greater mag-netic flux amplitude in response to the TOT compared withthe VOT stimuli. The differences in overall activation be-tween the speech and nonspeech conditions may reflectacoustic differences between the two sets of stimuli. It isunlikely that the modulation of N1m field strength wasdue in any way to stimulus-related effects in other mea-sures of brain activity that were observed during the laterportions of the EF. Not only did the profile of the earlyeffects on N1m RMS not match the profiles of later stimu-lus-specific changes (e.g., in terms of laterality), but theformer were also in the opposite direction compared withthe latter.
In sum, current findings suggest the presence of an areain the left STGp that is involved in phonological and/orphonetic processing. This area may also be involved, tosome extent, in processing of nonspeech stimuli containingcues analogous to speech stimuli. Activity in this region isweakened when the auditory stimuli do not contain speech-like acoustic cues. Given the evidence for some involve-ment of this area previously thought to be specialized forspeech in nonspeech processing, it would be of interest tomanipulate the acoustic characteristics of nonspeech stimulito determine under what conditions the latter componentsbecome active.
Acknowledgments
This research was supported by NIH Grant RO1NS37941 and NICHD Grant RO1 HD 38346 to Andrew C.Papanicolaou.
References
Abramson, A.S., and Lisker, L., 1970. Discriminability along the voic-ing continuum: cross-language tests, in: Proceedings, 6th Interna-tional Congress of Phonetics Sciences, Academia, Prague, pp. 569-573.
Baddeley, A.D., 1986. Working Memory. Clarendon Press, Oxford.Belin, P., Zatorre, R.J., Ahad, P., 2002. Human temporal-lobe response to
vocal sounds. Cogn. Brain Res. 13, 17–26.Binder, J.R., Frost, J.A., Hammeke, T.A., Cox, R.W., Rao, S.M., Prieto, T.,
1997. Human brain language areas identified by functional magneticresonance imaging. J. Neurosci. 17, 353–362.
Binder, J.R., Frost, J.A., Hammeke, T.A., Bellgowan, P.S., Springer, J.A.,Kaufman, J.N., Possing, E.T., 2000. Human temporal lobe activationby speech and nonspeech sounds. Cereb. Cortex 10, 512–528.
Blechner, M. J. 1976. Right-ear advantage for musical stimuli differing in
rise time. (Status report on speech research, SR-47). Haskins Labora-tories, New Haven, CT.
Blechner, M.J., 1977. Left-ear advantage for sounds characterized by arapidly varying resonance frequency. Psychon. Bull. Rev. 9, 63–366.
Blumstein, S.E., Cooper, W.E., Zurif, E.G., Caramazza, A., 1977. Theperception and production of voice-onset time in aphasia. Neuropsy-chologia 15, 371–383.
Boatman, D., Lesser, R.P., Gordon, B., 1995. Auditory speech processingin the left temporal lobe: an electrical interference study. Brain Lang.51, 269–290.
Bradshaw, J.L., Nettleton, N.C., 1981. The nature of hemispheric special-ization in man. Behav. Brain Sci. 4, 51–92.
Breier, J.I., Simos, P.G., Zouridakis, G., Papanicolaou, A.C., 1998. Rela-tive timing of neuronal activity in distinct temporal lobe areas during arecognition memory task for words. J. Clin. Exp. Neuropsychol. 20,782–790.
Breier, J.I., Simos, P.G., Zouridakis, G., Papanicolaou, A.C., 1999a. Tem-poral course of regional brain activation associated with phonologicaldecoding. J. Clin. Exp. Neuropsychol. 21, 465–476.
Breier, J.I., Simos, P.G., Zouridakis, G., Papanicolaou, A.C., 1999b. Lat-eralization of cerebral activation in auditory verbal and nonverbalmemory tasks using magnetoencephalography. Brain Topogr. 12, 89–97.
Breier, J.I., Simos, P.G., Zouridakis, G., Wheless, J.W., Willmore, L.J.,Constantinou, J.E., Maggio, W.W., Papanicolaou, A.C., 1999c. Lan-guage dominance determined by magnetic source imaging: a compar-ison with the Wada procedure. Neurology 53, 938–945.
Breier, J.I., Sios, P.G., Zouridakis, G., Papanicolaou, A.C., 2000. Lateral-ization of activity associated with language function using magnetoen-cephalography: a reliability study. J. Clin. Neurophys. 17, 503–510.
Breier, J.I., Simos, P.G., Wheless, J.W., Constantinou, J.E.C., Baumgarter,J.E., Venkatarman, V., Papanicolaou, A.C., 2001. Language dominancein children as determined by magnetic source imaging and the intra-carotid amobarbital procedure: a comparison. J. Child Neurol. 16,124–130.
Bryden, P. 1982. Laterality: Functional Asymmetry in the Intact Brain.Academic Press, New York.
Burton, M.W., Small, S.L., Blumstein, S.E., 2000. The role of segmenta-tion in phonological processing: an fMRI investigation. J. Cogn. Neu-rosci. 12, 679–690.
Castillo, E.M., Simos, P.G., Davis, R.N., Breier, J.I., Fitzgerald, M., Pa-panicolaou, A.C., 2001. Levels of word processing and incidentalmemory: dissociable mechanisms in the temporal lobe. NeuroReport12, 3561–3566.
Cutting, J.E., 1974. Two left-hemisphere mechanisms in speech percep-tion. Percept. Psychophys. 16, 601–612.
Damasio, H. 1998. Neuroanatomical correlates of the aphasias, in: Sarno,M.T. (Ed.), Acquired Aphasia, 3rd ed., Academic Press, San Diego,CA.
Demonet, J.F., Chollet, F., Ramsay, S., Cardebat, D., Nespoulous, J.L.,Wise, R., Rascol, A., Frackowiak, R., 1992. The anatomy of phono-logical and semantic processing in normal subjects. Brain 115, 1753–68.
Demonet, J.F., Wise, R., Frackowiak, R.S.J., 1993. Language functionsexplored in normal subjects by positron emission tomography: a criticalreview. Hum. Brain Mapp. 1, 39–47.
Eulitz, C., Diesch, E., Pantev, C., Hampson, S., Elbert, T., 1995. Magneticand electric brain activity evoked by the processing of tone and vowelstimuli. J. Neurosci. 15, 2748–2755.
Fiez, J.A., Raichle, M.E., Balota, D.A., Talal, P., Petersen, S.E., 1996. PETactivation of posterior temporal regions during auditory word presen-tation and verb generation. Cereb. Cortex 6, 1–10.
Griffiths, T.D., 2001. The neural processing of complex sounds. Ann. NYAcad. Sci. 930, 133–142.
Halperin, Y., Nachshon, I., Carmon, A., 1973. Shift in ear superiority indichotic listening to temporally patterned nonverbal stimuli. J. Acoust.Soc. Am. 5, 46–50.
457A.C. Papanicolaou et al. / NeuroImage 18 (2003) 448–459
Herrmann, C.S., Oertel, U., Wang, Y., Maess, B., Friederici, A.D., 2000.Noise affects auditory and linguistic processing differently: an MEGstudy. NeuroReport 11, 227–229.
Hickok, G., Poeppel, D., 2000. Towards a functional neuroanatomy ofspeech perception. Trends Cogn. Sci. 4, 131–138.
Jancke, L., Wustenberg, T., Scheich, H., Henze, H.J., 2002. Phoneticperception and the temporal cortex. NeuroImage 15, 733–746.
Kim, J.J., Kim, M.S., Lee, J.S., Lee, D.S., Lee, M.C., Kwon, J.S., 2002.Dissociation of working memory processing associated with native andsecond languages: a PET investigation. NeuroImage 15, 879–891.
Lewine, J.D., 1990. Neuromagnetic techniques for the noninvasive analysisof brain function, in: Freeman, S.E., Fukushima, E., Green, E.R. (Eds.),Noninvasive Techniques in Biology and Medicine, San FranciscoPress, San Francisco.
Liberman, A.M., 1996. Speech: A Special Code. MIT Press, Cambridge,MA.
Liberman, A.M., Mattingly, I.G., 1985. The motor theory of speech per-ception revised. Cognition 21, 1–36.
Liberman, A.M., Cooper, F.S., Shankweiler, D., Studdert-Kennedy, M.,1967. Perception of the speech code. Psychol. Rev. 74, 431–461.
Liegeois-Chauvel, C., de Graaf, J.B., Laguitton, V., Chauvel, P., 1999.Specialization of left auditory cortex for speech perception in mandepends on temporal coding. Cereb. Cortex 9, 484–496.
Lisker, L., and Abramson, A.S. 1970. The voicing dimension: some ex-periments in comparative phonetics, in: Proceedings, 6th InternationalCongress of Phonetic Sciences, Academia, Prague, pp. 563–567.
Maestu, F., Ortiz, T., Fernandez, A., Amo, C. Martin, P., Fernandez, S.,and Sola, R.G., 2002. Spanish language mapping using MEG: a vali-dation study. NeuroImage 17, 1579–1586.
Miller, J.D., Wier, C.C., Pastore, R.E., Kelly, W.J., Dooling, R.J., 1976.Discrimination and labeling of noise-buzz sequences with varyingnoise-lead times: an example of categorical perception. J. Acoust. Soc.Am. 60, 410–417.
Nakasato, N., Kumabe, T., Kanno, A., Ohtomo, S., Mizoi, K., Yoshimoto,T., 1997. Neuromagnetic evaluation of cortical auditory function inpatients with temporal lobe tumors. J. Neurosci. 86, 610–618.
Nicholls, M.E.R., 1996. Temporal processing asymmetries between thecerebral hemispheres: evidence and implications. Laterality 1, 97–137.
Ojemann, G.A., Schoenfield-McNeill, J., 1999. Activity of neurons inhuman temporal cortex during identification and memory for namesand words. J. Neurosci. 19, 5674–5682.
Pantev, C., Lutkenhoner, B., 2000. Magnetoencephalographic studies offunctional organization and plasticity of the human auditory cortex.J. Clin. Neurophysiol. 17, 130–142.
Papanicolaou, A.C., 1998. Fundamentals of Functional Brain Imaging: AGuide to the Methods and Their Applications to Psychology andBehavioral Neurosciences. Swets & Zeitlinger, Amsterdam.
Papanicolaou, A.C., Tarkka, I.M., 1996. Magnetoencephalography, in:Bigler, E.D. (Ed.), Neuroimaging I: Basic Science, Plenum, New York.
Papanicolaou, A.C., Simos, P.G., Breier, J.I., Zouridakis, G., Willmore,L.J., Wheless, J.W., Constantinou, J.E., Maggio, W.W., Gormley,W.B., 1999. Magnetoencephalographic mapping of the language-spe-cific cortex. J. Neurosurg. 90, 85–93.
Petersen, S.E., Fox, P.T., Posner, M.I., Mintun, M., Raichle, M.E., 1988.Positron emission tomographic studies of the cortical anatomy of sin-gle-word processing. Nature 331, 585–589.
Phillips, C., Pellathy, T., Marantz, A., Yellin, E., Wexler, K., Poeppel, D.,McGinnis, M., Roberts, T., 2000. Auditory cortex accesses phonolog-ical categories: an MEG mismatch study. J. Cogn. Neurosci. 12, 1038–1055.
Pisoni, D.B., 1977. Identification and discrimination of the relative onsettime of two component tones: implications for voicing perception instops. J. Acoust. Soc. Am. 61, 1352–1361.
Pisoni, D.B., Tash, J., 1974. Reaction times to comparisons within andacross phonetic categories. Percept. Psychophys. 15, 285–290.
Poeppel, D., Yellin, E., Phillips, C., Roberts, T.P., Roley, H.A., Wexler, K.,
Marantz, A., 1996. Task-induced asymmetry of the auditory evokedM100 neuromagnetic field elicited by speech sounds. Cogn. Brain Res4, 231–242.
Raichle, M.E., 1994. Images of the mind: studies with modern imagingtechniques. Annu. Rev. Psychol. 45, 333–356.
Roberts, T.P.L., Poepel, D., Rowley, H.A., 1998. Magnetoencephalogra-phy and functiona MRI: a quantitative study of speech perception, in:Proceedings, 20th Annual IEEE/EMBS Conference, pp. 2120–2123.
Robin, D.A., Tranel, D., Damasio, H., 1990. Auditory perception of tem-poral and spectral events in patients with focal left and right cerebrallesions. Brain Lang. 39, 539–555.
Rogers, R.L., Basile, L.F., Papanicolaou, A.C., Eisenberg, H.M., 1993.Magnetoencephalography reveals two distinct sources associated withlate positive evoked potentials during a visual oddball task. Cereb.Cortex 3, 163–169.
Rogers, R.L., Baumann, S.B., Papanicolaou, A.C., Bourbon, T.W., Alagar-samy, S., Eisenberg, H.M., 1991. Localization of the P3 sources usingmagnetoencephalography and magnetic resonance imaging. Electroen-cephalogr. Clin. Neurophysiol. 79, 308–321.
Ruohonen, J.O., Ravazzani, P., Iloniemi, R.J., Galardi, G., Nilsson, J.,Panizza, M., Amadio, S., Grandori, F., Comi, G., 1996. Motor cortexmapping with combined MEG and magnetic stimulation. Electroen-cephalogr. Clin. Neurophysiol. Suppl. 46, 317–322.
Sarvas, J., 1987. Basic mathematical and electromagnetic concepts of thebiomedical inverse problem. Phys. Med. Biol. 32, 11–22.
Schweitzer, J.B., Faber, T.L., Grafton, S.T., Tune, L.E., Hoffman, J.M.,Kilts, C.D., 2000. Alterations in the functional anatomy of workingmemory in adult attention deficit hyperactivity disorder. Am. J. Psy-chiatry 157, 278–280.
Seki, K., Nakasato, N., Fujita, S., Hatanaka, K., Kawamura, T., Kanno, A.,Yoshimoto, T., 1996. Neuromagnetic evidence that the P100 compo-nent of the pattern reversal visual evoked response originates in thebottom of the calcarine fissure. Electroencephalogr. Clin. Neuro-physiol. 100, 436–442.
Simos, P.G., Basile, L.F., Papanicolaou, A.C., 1997. Source localization ofthe N400 response in a sentence-reading paradigm using evoked mag-netic fields and magnetic resonance imaging. Brain Res. 762, 29–39.
Simos, P.G., Breier, J.I., Zourdakis, G., Papanicolaou, A.C., 1998a. Iden-tification of language-related brain activity using magnetoencephaolog-raphy. J. Clin. Exp. Neuropsychol. 2, 706–722.
Simos, P.G., Breier, J.I., Zourdakis, G., Papanicolaou, A.C., 1998b. Mag-netic fields elicited by a tone onset time continuum in humans. Cogn.Brain Res. 6, 285–294.
Simos, P.G., Diehl, R., Breier, J.I., Molis, M., Zourdakis, G., Papanicolaou,A.C., 1998c. MEG correlates of categorical perception on a voice onsetcontinuum in humans. Cogn. Brain Res. 7, 215–219.
Simos, P.G., Papanicolaou, A.C., Breier, J.I., Wheless, J.W., Constantinou,J.E., Gormley, W.B., Maggio, W.W., 1999. Localization of language-specific cortex by using magnetic source imaging and electrical stim-ulation mapping. J. Neurosurg. 91, 787–796.
Simos, P.G., Papanicolaou, A.C., Breier, J.I., Fletcher, J.M., Foorman,B.R., Bergman, E., Fishbeck, K., Papanicolaou, A.C., 2000a. Brainactivation profiles in dyslexic children during nonword reading: amagnetic source imaging study. Neurosci. Lett. 290, 61–65.
Simos, P.G., Breier, J.I., Wheless, J.W., Maggio, W.W., Fletcher, J.M.,Castillo, E.M., Papanicolaou, A.C., 2000b. Brain mechanisms for read-ing: the role of the superior temporal gyrus in word and pseudowordnaming. NeuroReport 11, 2443–2447.
Simos, P.G., Breier, J.I., Fletcher, J.M., Foorman, B.R., Castillo, E.M.,Fletcher, J.M., Papanicolaou, A.C., 2002. Brain mechanisms for read-ing words and pseudowords: an integrated approach. Cereb. Cortex 12,297–305.
Sobel, D.F., Gallen, C.C., Schwartz, B.J., Waltz, T.A., Copeland, B.,Yamada, S., Hirschkoff, E.C., Bloom, F.E., 1993. Locating the cen-
458 A.C. Papanicolaou et al. / NeuroImage 18 (2003) 448–459
tralsulcus: comparison of MR anatomic and magnetoencephalographicfunctional methods. Am. J. Neuroradiol. 14, 915–925.
Studdert-Kennedy, M., 1974. The perception of speech, in: Sebeok, T.A.(Ed.), Current Trends in Linguistics, Mouton, The Hague, vol. XII.
Studdert-Kennedy, M., Shankweiler, D., 1970. Hemispheric specializationfor speech perception. J. Acoust. Soc. Am. 48, 579–594.
Vouloumanos, A., Kiehl, K.A., Werker, J.F., Liddle, P.F., 2001. Detectionof sounds in the auditory stream: event-related fMRI evidence fordifferential activation to speech and nonspeech. J. Cogn. Neurosci. 13,994–1005.
Wernicke, K., 1874. Der aphasische Symptommenkomplex. Cohn &Weigert, Breslau.
Wise, R.J., Scott, S.K., Blank, S.C., Mummery, C.J., Murphy, K., War-burton, E.A., 2001. Separate neural subsystems within ‘Wernicke’sarea’. Brain 124, 83–95.
Zatorre, R., 1988. Pitch perception of complex tones and human cerebrallobe function. J. Acoust. Soc. Am. 84, 566–572.
Zouridakis, G., Simos, P.G., Papanicolaou, A.C., 1998. Multiple bilaterallyasymmetric cortical sources for the auditory N1m component. BrainTopogr. 10, 183–189.
459A.C. Papanicolaou et al. / NeuroImage 18 (2003) 448–459
Related Documents