Journal of the American Society of Nephrology 1371 Differences in the Dynamics of Parathyroid Hormone Secretion in Hemodialysis Patients With Marked 1 Secondary Hyperparathyroidism Arnold J. Felsenfeld,2 Aquiles Jara, Madelaine PahI, Jordi Bover, and Mariano Rodriguez A.J. Felsenfeld, A. Jara, M. PahI, J. Bover, M. Rodriguez, Departments of Medicine, Wadsworth VA Medical Center, UCLA, Los Angeles, and UC Irvine, Irvine, CA, and the Unit of Investigation, Hospital Reina Sofia, Cordoba, Spain (J. Am. Soc. Nephrol. 1995; 6:1371-1378) ABSTRACT Hemodialysis patients with predialysis intact parathy- roid hormone (PTH) levels of more than 500 pg/mL are generally considered to have marked secondary hyperparathyroidism. Because the serum calcium level in these patients varies from low to high, it is not clear whether every hemodialysis patient with a PTH level > 500 pg/mL is part of a uniform group. The dynamics of PTH secretion in 21 hemodialysis patients with predialysis (basal) intact PTH levels > 500 pg/mL (range, 506 to 1978 pg/mL) has been evaluated. The basal/maximal PTH ratio, an indicator of the degree of relative PTH stimulation in the baseline state, was inversely correlated with the maximal PTH (r = -0.71), the basal serum calcium (r = -0.70), and the differ- ence between the serum calcium at basal and max- imal PTH (r = 0.81); the latter is the decrement in serum calcium from baseline necessary to maximally stim- ulate PTH. Because the basal PTH level appeared to be disproportionately influenced by hypocalcemla, the 21 patients were separated into two groups on the basis of the basal serum calcium (Group I < 9 mg/dL and Group II > 9 mg/dL). Basal PTH was not different between the Iwo groups, even though maximally stimulated PTH (1,219 ± 204 versus2,739 ± 412 pg/mL: P < 0.01) as induced by hypocalcemia and maxi- mally suppressed PTH (2 17 ± 37 versus 528 ± 1 04; P = 0.05) as induced by hypercalcemia were less in Group I with the low basal calcium; moreover, the ratio of basal/maximal PTH was higher (73 ± 6 versus 47 ± 5%; P < 0.01) in Group I with the low basal calcium. These results suggest that the reason for a basal PTH > 500 pg/mL may be different among hemodialysis patients. In hypocalcemic patients, the 1 Received March 9, 1995. Accepted May 23, 1995. 2 Correspondenceto Dr. A.J. Feisenfeid, Nephrology Section (W1 1 1L). Wadsworth VA Medical Center, 1 1301 Wiishire Blvd., Los Angeies, CA 90073. 1046-6673/0605-1371103.00/0 Journal of the American Society of Nephrology Copyright © 1995 by the American SocIety of Nephrology low serum calcium appeared to be a major impetus for the high basal PTH level. In conclusion, ( 1) the maximally stimulated PTH appears to provide a better means of separating patients with marked secondary hyperparathyroidism than the basal PTH and (2) he- modialysis patients with basal PTH levels > 500 pg/mL may not be a uniform group. Key Words: Calcium hypocalcemia. maximal parathyroid hormone, minimal parathyroid hormone. set point of calcium I n renal osteodystrophy, the different forms of bone disease are characterized by substantial differ- ences in parathyroid hormone (PTH) ( 1-4). In osteitis fibrosa, the bone disease associated with marked secondary hyperparathyroidism (2#{176} HPT). PTH levels are considerably higher than in the forms of renal osteodystrophy associated with low bone turnover such as adynamic bone and aluminum bone disease ( 1-4). In a previous study. we compared the secretory characteristics of the parathyroid gland in different forms of renal osteodystrophy and showed that the basal, maximal, and minimal levels of intact PTH, the set point of calcium, the slope of the PTH-calcium curve, and the ratio of basal to maximal PTH in the basal state were higher in hemodialysis patients with osteitis fibrosa than in hemodialysis patients with adynamic bone or low-turnover aluminum bone dis- ease (1). Hemodialysis patients with predialysis intact PTH levels higher than 500 pg/mL are considered to have marked 2#{176} HPT, and because osteitis fibrosa is present in this group ofpatients (2,4), treatment with calcitriol is generally recommended (5-9). However, it is not clear whether every hemodialysis patient with PTH levels exceeding 500 pg/mL should be included as part of a uniform group of patients sharing the same abnormalities in parathyroid gland function (PTH- calcium curve). This concern is especially pertinent considering that the serum calcium level, the main regulator of P’FH secretion, varies considerably in this group of patients (5-9) and, as a result, may affect the predialysis PTH level. Thus, it is reasonable to address how the difference in the predialysis serum calcium affects the dynamics of PTH secretion. We have now had the opportunity to evaluate the dynamics of PTH secretion in 2 1 hemodialysis patients with predialysis PTH levels > 500 pg/mL (range, 506 to 1,978 pg/mL). Our results suggest that considerable differences In PTH secretory patterns are present in hemodialysis patients with low serum calcium as opposed to those with normal or elevated serum calcium.

Welcome message from author
This document is posted to help you gain knowledge. Please leave a comment to let me know what you think about it! Share it to your friends and learn new things together.
Transcript

Journal of the American Society of Nephrology 1371
Differences in the Dynamics of Parathyroid HormoneSecretion in Hemodialysis Patients With Marked
1Secondary HyperparathyroidismArnold J. Felsenfeld,2 Aquiles Jara, Madelaine PahI, Jordi Bover, and Mariano Rodriguez
A.J. Felsenfeld, A. Jara, M. PahI, J. Bover, M. Rodriguez,Departments of Medicine, Wadsworth VA MedicalCenter, UCLA, Los Angeles, and UC Irvine, Irvine, CA,and the Unit of Investigation, Hospital Reina Sofia,
Cordoba, Spain
(J. Am. Soc. Nephrol. 1995; 6:1371-1378)
ABSTRACTHemodialysis patients with predialysis intact parathy-roid hormone (PTH) levels of more than 500 pg/mL aregenerally considered to have marked secondaryhyperparathyroidism. Because the serum calciumlevel in these patients varies from low to high, it is notclear whether every hemodialysis patient with a PTHlevel > 500 pg/mL is part of a uniform group. Thedynamics of PTH secretion in 21 hemodialysis patientswith predialysis (basal) intact PTH levels > 500 pg/mL(range, 506 to 1978 pg/mL) has been evaluated. Thebasal/maximal PTH ratio, an indicator of the degreeof relative PTH stimulation in the baseline state, wasinversely correlated with the maximal PTH (r = -0.71),the basal serum calcium (r = -0.70), and the differ-ence between the serum calcium at basal and max-imal PTH (r = 0.81); the latter is the decrement in serumcalcium from baseline necessary to maximally stim-ulate PTH. Because the basal PTH level appeared tobe disproportionately influenced by hypocalcemla,the 21 patients were separated into two groups on thebasis of the basal serum calcium (Group I < 9 mg/dLand Group II > 9 mg/dL). Basal PTH was not differentbetween the Iwo groups, even though maximallystimulated PTH (1,219 ± 204 versus2,739 ± 412 pg/mL:P < 0.01) as induced by hypocalcemia and maxi-mally suppressed PTH (2 17 ± 37 versus 528 ± 104; P =
0.05) as induced by hypercalcemia were less inGroup I with the low basal calcium; moreover, theratio of basal/maximal PTH was higher (73 ± 6 versus47 ± 5%; P < 0.01) in Group I with the low basalcalcium. These results suggest that the reason for abasal PTH > 500 pg/mL may be different among
hemodialysis patients. In hypocalcemic patients, the
1 Received March 9, 1995. Accepted May 23, 1995.2 Correspondenceto Dr. A.J. Feisenfeid, Nephrology Section (W1 1 1L). Wadsworth
VA Medical Center, 1 1301 Wiishire Blvd., Los Angeies, CA 90073.
1046-6673/0605-1371103.00/0
Journal of the American Society of NephrologyCopyright © 1995 by the American SocIety of Nephrology
low serum calcium appeared to be a major impetusfor the high basal PTH level. In conclusion, ( 1) themaximally stimulated PTH appears to provide a bettermeans of separating patients with marked secondaryhyperparathyroidism than the basal PTH and (2) he-
modialysis patients with basal PTH levels > 500 pg/mLmay not be a uniform group.
Key Words: Calcium hypocalcemia. maximal parathyroid
hormone, minimal parathyroid hormone. set point of calcium
I n renal osteodystrophy, the different forms of bone
disease are characterized by substantial differ-
ences in parathyroid hormone (PTH) ( 1-4). In osteitisfibrosa, the bone disease associated with marked
secondary hyperparathyroidism (2#{176}HPT). PTH levels
are considerably higher than in the forms of renal
osteodystrophy associated with low bone turnover
such as adynamic bone and aluminum bone disease
( 1-4). In a previous study. we compared the secretory
characteristics of the parathyroid gland in different
forms of renal osteodystrophy and showed that the
basal, maximal, and minimal levels of intact PTH, theset point of calcium, the slope of the PTH-calcium
curve, and the ratio of basal to maximal PTH in the
basal state were higher in hemodialysis patients with
osteitis fibrosa than in hemodialysis patients with
adynamic bone or low-turnover aluminum bone dis-
ease (1).Hemodialysis patients with predialysis intact PTH
levels higher than 500 pg/mL are considered to have
marked 2#{176}HPT, and because osteitis fibrosa is present
in this group ofpatients (2,4), treatment with calcitriol
is generally recommended (5-9). However, it is not
clear whether every hemodialysis patient with PTH
levels exceeding 500 pg/mL should be included as
part of a uniform group of patients sharing the same
abnormalities in parathyroid gland function (PTH-
calcium curve). This concern is especially pertinent
considering that the serum calcium level, the main
regulator of P’FH secretion, varies considerably in this
group of patients (5-9) and, as a result, may affect the
predialysis PTH level. Thus, it is reasonable to address
how the difference in the predialysis serum calcium
affects the dynamics of PTH secretion. We have now
had the opportunity to evaluate the dynamics of PTH
secretion in 2 1 hemodialysis patients with predialysis
PTH levels > 500 pg/mL (range, 506 to 1,978 pg/mL).
Our results suggest that considerable differences In
PTH secretory patterns are present in hemodialysis
patients with low serum calcium as opposed to those
with normal or elevated serum calcium.
PTH Secretion in Dialysis Patients With Secondary Hypertension
1372 Volume #{243}‘ Number 5 #{149}1995
METHODS
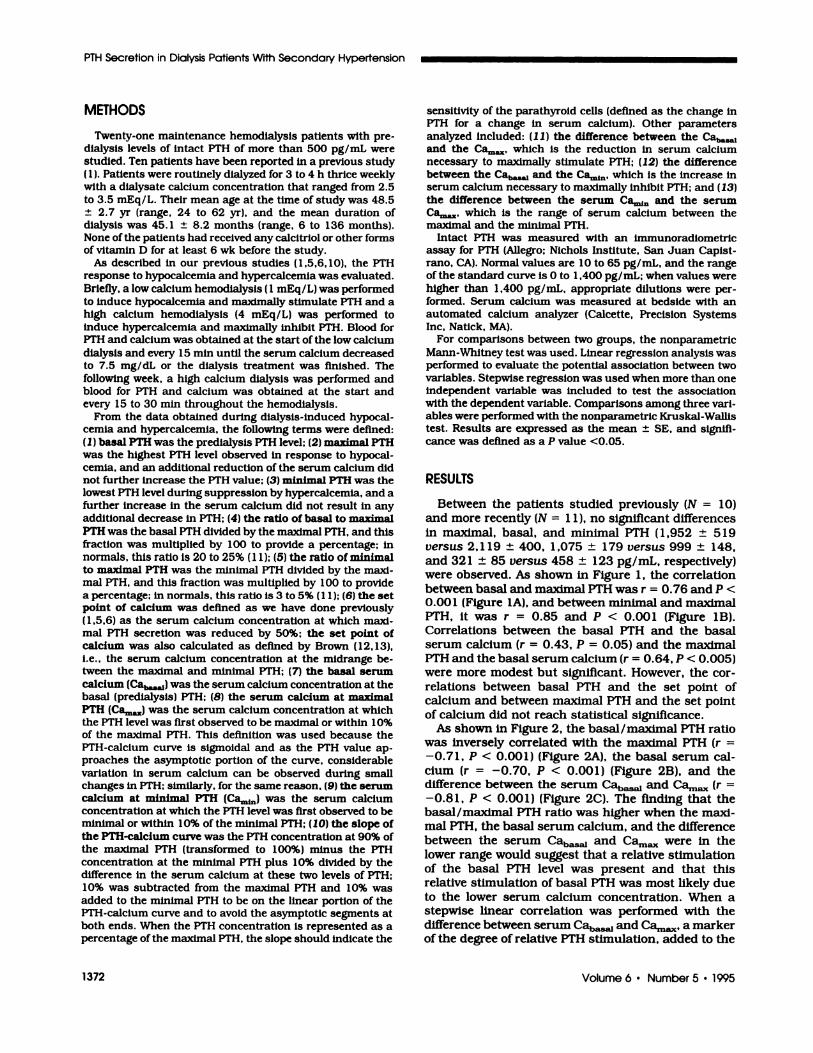
Twenty-one maintenance hemodlalysis patients with pre-dialysis levels of intact PTH of more than 500 pg/mL werestudied. Ten patients have been reported In a previous studyI 1). Patients were routinely dialyzed for 3 to 4 h thrice weeklywith a dialysate calcium concentration that ranged from 2.5to 3.5 mEq/L. TheIr mean age at the time of study was 48.5± 2.7 yr (range. 24 to 62 yr). and the mean duration ofdialysis was 45. 1 ± 8.2 months (range. 6 to 136 months).None of the patients had received any calcitriol or other formsof vitamin D for at least 6 wk before the study.
As described in our previous studies ( 1 .5,6, 10). the PTHresponse to hypocalcemia and hypercalcemia was evaluated.
Briefly. a low calcium hemodialysis (1 mEq/L) was performedto induce hypocalcemia and maximally stimulate PTH and ahigh calcium hemodialysis (4 mEq/L) was performed toinduce hypercalcemia and maximally inhibit PTH. Blood forPTH and calcium was obtained at the start of the low calcium
dialysis and every 15 mm until the serum calcium decreasedto 7.5 mg/dL or the dialysis treatment was finished. Thefollowing week, a high calcium dialysis was performed andblood for PTH and calcium was obtained at the start andevery 15 to 30 mm throughout the hemodlalysis.
From the data obtained during dialysis-induced hypocal-cemia and hypercalcemia, the following terms were defined:(1) basal PTH was the predialysis PTH level; (2) maximal PTHwas the highest PTH level observed in response to hypocal-cemia. and an additional reduction of the serum calcium didnot further increase the PTH value: (3) minimal PTH was thelowest PTH level during suppression by hypercalcemia. and afurther Increase in the serum calcium did not result in anyadditional decrease in PTH; (4) the ratio of basal to maximal
PTH was the basal PTH divided by the maximal PTH. and thisfraction was multiplied by 100 to provide a percentage; innormals, this ratio is 20 to 25% ( 1 1); (5) the ratio of minimalto maximal PTH was the minimal PTH divided by the maxi-mal PTH, and this fraction was multiplied by 100 to providea percentage; in normals. this ratio is 3 to 5% ( 1 1 ); (6) the setpoint of calcium was defined as we have done previously( 1 .5.6) as the serum calcium concentration at which maxi-mal PTH secretion was reduced by 50%; the set point ofcalcium was also calculated as defined by Brown (12,13).i.e. . the serum calcium concentration at the midrange be-tween the maximal and minimal PTH; (7) the basal serum
calcium (Cabasal) was the serum calcium concentration at thebasal (predialysis) PTH; (8) the serum calcium at maximalPTH (Cam,,,j was the serum calcium concentration at whichthe PTH level was first observed to be maximal or within 10%of the maximal PTH. This definition was used because thePTH-calcium curve is sigmoidal and as the PTH value ap-proaches the asymptotic portion of the curve. considerablevariation in serum calcium can be observed during smallchanges in PTH; similarly. for the same reason, (9) the serumcalcium at minimal PTH (Ca,,�1�) was the serum calciumconcentration at which the PTH level was first observed to beminimal or within 10% of the minimal PTH; (10) the slope ofthe PTH-calcium curve was the PTH concentration at 90% ofthe maximal PTH (transformed to 100%) minus the PTHconcentration at the minimal PTH plus 10% divided by thedifference in the serum calcium at these two levels of P’FH;10% was subtracted from the maximal PTH and 10% wasadded to the minimal PTH to be on the linear portion of thePTH-calcium curve and to avoid the asymptotic segments atboth ends. When the PTH concentration is represented as apercentage of the maximal PTH, the slope should indicate the
sensitivity of the parathyroid cells (defined as the change inPTH for a change in serum calcium). Other parameters
analyzed included: (1 1) the difference between the Cabasaland the Ca,11,,,,. which is the reduction In serum calciumnecessary to maximally stimulate PTH; (12) the differencebetween the Cabas,,� and the � which is the increase inserum calcium necessary to maximally inhibit PTH; and (13)the difference between the serum � and the serumCam,,,,, which is the range of serum calcium between themaximal and the minimal PTH.
Intact PTH was measured with an immunoradiometricassay for PTH (Allegro; Nichols Institute, San Juan Capist-rano, CA). Normal values are 10 to 65 pg/mL, and the rangeof the standard curve is 0 to 1 .400 pg/mL; when values werehigher than 1 .400 pg/mL. appropriate dilutions were per-formed. Serum calcium was measured at bedside with anautomated calcium analyzer (Calcette, Precision SystemsInc. Natick, MA).
For comparisons between two groups. the nonparametric
Mann-Whitney test was used. Linear regression analysis wasperformed to evaluate the potential association between twovariables. Stepwise regression was used when more than oneindependent variable was included to test the associationwith the dependent variable. Comparisons among three van-ables were performed with the nonparametric Kruskal-Wallistest. Results are expressed as the mean ± SE, and signifi-cance was defined as a P value <0.05.
RESULTS
Between the patients studied previously (N = 10)
and more recently (N = 1 1 ), no significant differences
in maximal, basal, and minimal PTH ( 1 .952 ± �19
versus 2,119 ± 400, 1,075 ± 179 versus 999 ± 148,
and 32 1 ± 85 versus 458 ± 1 23 pg/mL. respectively)
were observed. As shown in Figure 1 , the correlation
between basal and maximal PTH was r = 0.76 and P <
0.001 (Figure 1A). and between minimal and maximal
PTH, it was r = 0.85 and P < 0.001 (Figure 1B).
Correlations between the basal PTH and the basal
serum calcium (r = 0.43, P = 0.05) and the maximal
PTH and the basal serum calcium (r = 0.64, P < 0.005)
were more modest but significant. However, the cor-
relations between basal PTH and the set point of
calcium and between maximal PTH and the set point
of calcium did not reach statistical significance.
As shown in Figure 2, the basal/maximal PTH ratio
was inversely correlated with the maximal PTH (r =
-0.71 , P < 0.001) (Figure 2A), the basal serum cal-
cium (r = -0.70, P < 0.001) (Figure 2B). and thedifference between the serum Cabasal and Cam� (r =
-0.8 1 , P < 0.00 1) (Figure 2C). The finding that the
basal/maximal PTH ratio was higher when the maxi-
mal PTH, the basal serum calcium, and the difference
between the serum Cabasal and � were in the
lower range would suggest that a relative stimulation
of the basal PTH level was present and that this
relative stimulation of basal PTH was most likely due
to the lower serum calcium concentration. When a
stepwise linear correlation was performed with the
difference between serum Cabas� and � a maker
of the degree of relative PTH stimulation, added to the

r=O.76P< .001
4
2
U U
U
U
U
U
#{149}1
U U
A Basal/Maximal PTH (%l
100- U
UU
80U
U
U #{149} #{149}60 ‘� U
40 U
U
20UUU
U
U
‘_o 500 1000
Basal PTH (pg/mI)
BMaximal PTH (pg/mU (Thousandsi
6-
4. U
U
2- #{149}
6
U
U
BBasal/Maximal PTH 1%)
1oo� U
UU
80
60 -
40 -
20 -
r=.0.70P<.ool
U #{149} U
UU U
U
‘Jo 500 1000 1500
Minimal PTH (pg/mll
U
U U
U
‘�7 8 9
Basal Calcium (mg/do
10 11
U
60
40
20 -
r = �0.81
U P<.ool
U
U U
UU
UU
2
Journal of the American Society of Nephrology 1373
Felsenfeld et ai
AMaximal PTI-I lpgIml) (Thousands)
6-
r=0.85P< .001
.U #{149}
. U
1500 2000
r-�0.71P < .001
2 4
Maximal PTH (pg/mi) (Thousands)
U U
Figure 1. (A) The correlation between the basal and themaximal PTH levels is shown. (B) The correlation between theminimal and maximal PTH levels is shown. The terms aredefined in the Methods.
correlation between basal and maximal PTH, the r
value increased from 0.76 to 0.92.
Traditionally, the predialysis (basal) PTH level is
used to characterize the magnitude of 2#{176}HPT; how-
ever, our fmdings presented in Figures 1 and 2 mdi-
cate that the basal PTH level not only was dependent
on the secretory capacity of the parathyroid gland. but
also was affected by the serum calcium concentration.
To further analyze the effect of the basal serum cal-
cium on the dynamics of PTH secretion, the patients
were separated into two groups. fIrst, based on differ-
ences in the maximal PTH and, second, based on
differences in the basal serum calcium. As opposed to
the basal PTH, the maximal PTH, which represents
the maximal secretory capacity of the parathyroid
gland during hypocalcemia, is unaffected by the basal
serum calcium. The separation according to basal
serum calcium was performed to determine whether
differences in parathyroid gland function were present
despite the absence of any difference in basal PTH
levels.
C Basal/Maximal PTH (%)
100
80
0.5 1 1.5
. � (mg/dl)
Figure 2. The correlations between the basal/maximal PTH
ratio and the maximal PTH (A), the basal serum calcium (B),and the difference between the serum calcium at basal PTH(CabO�) and the serum calcium at maximal PTH (Camax)
(C) are shown. The terms are defined in the Methods.
The 2 1 patients were first separated into two groups
according to the maximal PTH: Group I, with maximal
PTH levels < 1 .200 pg/mL (N = 8). and Group II, with
maximal PTH levels > 1 .500 pg/mL (N = 13); no

PTH Secretion in Dialysis Patients With Secondary Hypertension
1374 Volume 6 ‘ Number 5 ‘ 1995
patient had a maximal PTH level between 1 .200 and
1 .500 pg/mL. The mean age of the patients was
similar in both groups (Group versus I, 5 1 .5 ± 2.8
versus Group II, 46.4 ± 4.0 yr); however, the duration
of dialysis was longer in Group II (25.6 ± 6.2 versus59.3 ± 1 1 .5 months; P < 0.02). Comparisons of the
parameters of the PTH-calcium curve are shown in
Table 1 . The difference in maximal PTH between the
two groups was present because maximal PTH was
used to separate the groups. However, it should be
noted that although the maximal and minimal PTH
levels were more than threefold higher in Group II, the
basal PTH level was less than twofold higher in Group
II. As shown in Figure 3A, the difference between the
maximal and minimal PTH and the basal PTH was the
result of a lower basal/maximal PTH ratio (P < 0.001)
in Group II. The minimal/maximal PTH ratio was
similar In the two groups (Table 1 ). As shown in Figure
4, the basal serum calcium concentration was less (P
< 0.005) in Group I. as were the serum Ca,� (P =
0.05), the serum Ca��1� (P < 0.02), and the difference
between serum Cabas� and Ca,� (P < 0.001); the
difference between the serum Cabasal and Ca�1�tended to be greater in Group I (P = 0.08). The overall
range in serum calcium between the serum Cabasal
and Camji� was similar between the two groups (Group
1,2.17 ± 0.24versusGroupll,2.21 ±0.l8mg/dL),as
was the slope of the PTH-calcium curve. The set point
of calcium as calculated by our method and the
method of Brown tended to be higher in Group II but
did not attain significance (P = 0.09 and P = 0.08,
respectively).
The 2 1 patients were also divided in two groups
according to the basal serum calcium-Group I <9
mg/dL (N = 8) and Group II >9 mg/dL (N = 13). The
mean age (Group I, 48.0 ± 3.6 versus Group II, 48.9 ±
3.8 yr) and the duration of dialysis (Group I, 33.8 ±
9.8 versus Group II, 53.4 ± 1 1.5 months) were not
different. The comparison of the parameters of the
PTH-calcium curve is shown in Table 2. By defmition,
the basal serum calcium was less in Group I than in
Group II (8.30 ± 0.14 versus 9.87 ± 0.17 mg/dL).
Despite the fact that the basal PTH level was not
different between the two groups, both maximal PTH
(P < 0.01) and minimal PTH (P = 0.05) were higher in
Group II. As shown in Figure 3B, the basal/maximal
PTH ratio was higher (P < 0.02) in Group I. The
minimal/maximal PTH ratio was similar in the two
groups (Table 2). As shown in Figure 5, the PTH-
calcium curve was shifted to the left in Group I. The
serum Ca� (P < 0.001), the serum Ca�1� (P < 0.001),
the difference between serum Cabasal and Ca,� (P <
0.003), and the set point of calcium, calculated by
both methods (P < 0.001), were less In Group I. The
difference between Ca�1� and Cabasal was higher in
Group I (P < 0.04). The overall range of the PTH-
calcium curve (2.27 ± 0.26 versus 2. 15 ± 0. 17 mg/dL)
and the slope of the PTH-calcium curve were not
different between the two groups.
The set point of calcium was calculated by two
different methods-the serum calcium concentration
at 50% the maximal PTH and the serum calcium
concentration at the midrange between the minimal
and the maximal PTH. Because the mean minimal
PTH for the 2 1 patients was 1 8% of the maximal PTH,
the set point of calcium by the second method was
lower than the set point of calcium as calculated by
the first method. However, the correlation between the
two methods for the calculation of the set point of
calcium was significant and approached unity (r =
0.98, P < 0.00 1).
TABLE 1. A comparison of the PTH-calcium curve in two groups divided according to the maximal PTH�
ParameterGroup b
(N = 8)Group IF(N = 13)
P Value
Basal PTH (pg/mL) 697 ± 62 1,245 ± 126 <0.004Maximal PTH (pg/mL) 952 ± 67 2,904 ± 368
Minimal PTH (pg/mL) 179 ± 17 552 ± 99 <0.007Minimal/Maximal PTH (%) 18 ± 1 18 ± 2 NSBasal/Maximal PTH (%) 74 ± 5 47 ± 5 <0.004Set Point (mg/dL) 9.08 ± 0.25 9.58 ± 0.16 =0.09Set Point 1 (mg/dL) 8.89 ± 0.26 9.39 ± 0.16 =0.08Camax (mg/dL) 8.16 ± 0.27 8.71 ± 0.18 =0.05Cam,. (mg/dL) 10.34 ± 0.19 10.91 ± 0.16 <0.02Basal Calcium (mg/dL) 8.55 ± 0.30 9.72 ± 0.20 <0.005CabO� Camax (mg/dL) 0.38 ± 0.06 1.02 ± 0.13 <0.001Camin CabO� (mg/dL) 1.79 ± 0.27 1.19 ± 0.20 =0.08Cam,. Camax (mg/dL) 2.17 ± 0.24 2.21 ± 0.18 NSSlope (% PTH/mg of calcium) -61 ± 6 -54 ± 6 NS
a Values are the mean ± SE. NS, not significant.b Group I, maxima) PTH < 1 .200 pg/mL.C Group ii, maximal PTH > 1 .500 pg/mL. No patient had a value between 1200 and 1.500 pg/mL.d Difference based on definition of the groups.

CaP = 0.05
8.16 8.7lmg/dI
I____.i �
0.38
mg/dI � Ca,... 8.55vs9.72m9/dl
P<.005
P<.001�-1.02mg/dl
80
60
40
20
A Basal/Maximal PTH O%l
100
*p< .004
75
25
0Maximal PTH< 1200 pg/mI
B Basal/Maximal PTH (%l
100*
75
50
25
0
Maxima) PTH
� .. < 1200 pg/mO�
Li
*
Maximal PTH> 1500 pg/mI
*
. � � S, �Ca_,, 10.34 10.71 mg/d/
P<0.02
Serum Calcium 1mg/do
Felsenfeld et al
Journal of the American Society of Nephrology 1375
Basal Calcium Basal Calcium< 9 mg/dl > 9 mg/dl
Figure 3. When the 21 hemodialysis patients were dividedinto two groups on the basis ofthe maximal PTH level (<1,200
and >1 .500 pg/mL, no patient had a maximal PTH between1,200 and 1,500 pg/mL) and the basal/maximal PTH ratiowas higher in the group with the lower maximal PTH (A).
When they were divided on the basis of the basal serumcalcium (<9 mg/dL and >9 mg/dL), the basal/maximal PTHratio was higher in the group with the lower basal calcium(B).
DISCUSSION
Dynamic testing of PTH secretion was performed in
2 1 maintenance hemodialysis patients with a predi-
alysis PTH of more than 500 pg/mL. Because the
relationship between PTH and serum calcium is best
expressed as a sigmoidal curve, dynamic testing al-
lows the matching of PTH for a specific serum calcium
level; thus, the effect that any change in predialysis
serum calcium may have on the PTH level is removed.
In this study, it was possible to appreciate how a
reduction in predialysis (basal) serum calcium in the
hypocalcemic group resulted in basal PTH levels sim-
ilar to those in the normocalcemic group; however,
distinct differences In the maximal PTH secretory
capacity, the degree of relative PTH stimulation in the
baseline state (ratio of basal/maximal PTH), and the
PTH 1%)
100
7 8 9 10 11
Figure 4. Shown are the PTH-calcium curves for the twogroups separated on the basis of the maximal PTH (<1,200and >1 .500 pg/mL); maximal PTH was transformed to 100%
for each patient. The serum calcium at maximal PTH(Camax), basal PTH (Caba�l), and minimal PTH (Camin) wasless in the group with a maximal PTH < 1 .200 pg/mL. Thedecrement in serum calcium from basal PTH necessary tomaximally stimulate PTH (maximal PTH) was less in the groupwith the lower maximal PTH (0.38 versus 1 .02 mg/dL). Al-though not shown, the difference in serum calcium between
the serum calcium at minimal (Camin) and at maximal(Camax) PTH was not different between the two groups(2.17 ± 0.24 versus2.21 ± 0.18 mg/dL).
difference in serum calcium between basal and max-
imal PTH (Cabasal Ca,��) were still present between
the two groups. At the same time, dynamic testing of
PTH secretion showed that although the range of
serum calcium between maximal and minimal PTH
was similar between the hypocalcemic and normocal-
cemic groups, the PTH-calcium curve was shifted to
the left in the hypocalcemic group, suggesting the
possibility that PTH secretion in the hemodialysis
patient may adapt to the ambient serum calcium.
Finally, dynamic PTH testing allowed for the determi-
nation of the relative degree of PTH stimulation in the
baseline state (basal/maximal PTH ratio) and the
ability to maximally suppress PTH during hypercalce-
mia (minimal/maximal PTH ratio). As was shown in
this study. hypocalcemia resulted in an increase in
the basal/maximal PTH ratio, thus demonstrating
that basal PTH was stimulated relative to maximal
PTH in the hypocalcemic group. The minimal/maxi-
mal PTH ratio was similar in the hypocalcemic and
normocalcemic groups, indicating that despite
marked differences in maximal PTH levels between the
two groups, PTH suppression was proportionally sim-
ilar between the two groups.
The correlation between minimal and maximal PTH
was better than that between basal and maximal PTH.
This result was likely because the minimal/maximal
PTH ratio was constant while the basal/maximal PTH
ratio varied inversely with the basal serum calcium

Carn..
P< .001
PTH (%( 7.90 8.87mg/d/
100 - �- Mxxims/Pfl”
80 #{149}\.
L_�_���5 �r�g� 8.30v;987mg/d Basal
60 55� Ca,... ct!�ci5yrn_I.5’\,� .- <9_5t:-’�� �
P< .001 � �-----1 .Olmg/dI ‘ � 8.78 vs 9.76 mg/dO > �40 ‘�
� � MA�haa/PTh
20- U
Ca,, 10.18 � 11.O2mg/dI
PTH Secretion in Dialysis Patients With Secondary Hypertension
1376 Volume 6 ‘ Number 5 #{149}1995
TABLE 2. A comparison of the PTH-calcium curve in two groups divided according to basal calcium#{176}
ParameterGroup b
(N = 8)Group IF(N = 13)
P Value
Basal PTH (pg/mL) 846 ± 108 1,153 ± 140 NSMaximal PTH (pg/mL) 1,219 ± 204 2,739 ± 412 <0.01
Minimal PTH (pg/mL) 217 ± 37 528 ± 104 =0.05Minimal/Maximal PTH (%) 18 ± 1 19 ± 2 NSBasal/Maximal PTH (%) 73 ± 6 47 ± 5 <0.01Set Point (mg/dL) 8.78 ± 0.10 9.76 ± 0.15 <0.001Set Point 1 (mg/dL) 8.62 ± 0.12 9.56 ± 0.15 <0.001Camax (mg/dL) 7.90 ± 0.14 8.87 ± 0.18 <0.001Cam,. (mg/dL) 10. 18 ± 0. 19 11.02 ± 0. 1 1 <0.003Basal Calcium (mg/dL)d 8.30 ± 0.14 9.87 ± 0.17Ca�sai Camax (mg/dL) 0.40 ± 0.07 1.01 ± 0.13 <0.001Cam,. Cabasal (mg/dL) 1.87 ± 0.27 1.14 ± 0.18 <0.04Camin Camax (mg/dL) 2.27 ± 0.26 2.15 ± 0.17 NSSlope (% PTH/mg of calcium) -66 ± 9 -51 ± 3 NS
a Values are the mean :0: SE. NS, not significant.b Group I, basal calcium <9 mg/dL.C Group II, basal calcium >9 mg/dL.d Difference based on definition of the groups.
7 8 9 10 11
Serum Calcium lmg/dIl
Figure 5. Shown are the PTH-calcium curves for the twogroups separated on the basis of the basal serum calcium(<9 mg/dL and >9 mg/dL); maximal PTH was transformed to100% for each patient. The serum calcium at maximal PTH(Camax), minimal PTH (Camin), and the set point of calciumwas less in the group with a basal calcium <9 mg/dL. Thedecrement in serum calcium necessary to maximally stimu-late PTH (maximal PTH) was less in the group with the lowerbasal calcium (0.40 versus 1 .01 mg/dL). Although not shown,
the difference in serum calcium between the serum calciumat minimal (Camin) and maximal (Camax) PTH was not differ-ent between the two groups (2.27 ± 0.26 versus 2.15 ± 0.17mg/dL).
concentration; thus, the basal PTH level was dispro-
portionately increased in patients with hypocalcemia.
The 2 1 hemodialysis patients were separated into
two groups based both on the maximal PTH and on
the basal serum calcium. When the groups were
separated according to the maximal PTH, the group
with the lower maximal PTH was characterized by a
low basal calcium and an increased basal/maximal
PTH ratio. However, it should also be noted that even
in the group with the lower maximal PTH, the maximal
PTH level was approximately 10-fold higher than in
normal individuals ( 1 1 ) and still these patients were
hypocalcemic; this serves to illustrate the magnitude
of the skeletal resistance to PTH present in uremia.
When the groups were separated according to the
basal calcium, the group with the lower basal calcium
was characterized by a higher basal/maximal PTH
ratio, which would account for the fact that basal PTH
levels were not different between the two groups.
Thus, despite a more than twofold difference In the
maximal secretory capacity of the parathyroid gland
(maximal PTH) between the two groups, the basal PTH
levels were not different because hypocalcemia stun-
ulated PTH secretion in the group with the lower basal
serum calcium; this difference in the degree of PTH
stimulation in the baseline state is shown by the fact
that the mean ratio ofbasal/maximal PTH was 73% in
the hypocalcemic group and only 47% in the normo-
calcemic group. These results indicate that the reason
for a basal PTH >500 pg/mL may not be uniform
among hemodialysis patients and would also suggest
that in patients with a low basal serum calcium, the
low serum calcium is a major impetus for the increase
in the basal PTH.
The results of this study also suggest that the
clinical response to calcitriol treatment may be differ-
ent in this group of patients. In patients with a low
basal calcium, a high basal/maximal PTH ratio, and a
lower maximal PTH, a clinical response to calcitriol
would be expected because a calcitriol-induced in-
crease in serum calcium should reduce PTH levels.
Moreover, calcitriol should have an inhibitory effect on
PTH transcription because the lower maximal PTH
level would suggest a smaller parathyroid gland mass

Felsenfeld et al
Journal of the American Society of Nephrology 1377
( 14, 15). However, in patients with a normal to in-
creased basal calcium, a moderate increase in the
basal/maximal PTH ratio as compared with a normal
value of 25% ( 1 1), and a markedly increased maximal
PTH level, it is conceiveable that calcitriol treatment
may not be as effective. Indeed, this latter group may
include a significant number of patients with nodular
hyperplasia ofthe parathyroid gland (16-19), which is
associated with a decrease in vitamin D receptors (17),
decreased responsiveness to increases in calcium
(20), and DNA changes Indicative of a greater prolifer-
alive capacity (2 1 ); moreover, it may be associated
with acquired genetic changes that may result in
autonomous paathyroid cell proliferation (22). An-
other intriguing clinical question is whether the
former group. as the result of the stimulatory effect of
the low serum calcium and high basal/maximal PTH
ratio, Is evolving into the latter group, with a greater
parathyroid gland mass and more autonomous PTH
secretion. The finding that patients with the lower
maximal PTH had a shorter duration of dialysis lends
credence to this possibility.
The separation of patients into two groups accord-
ing to maximal PTH and to basal calcium served to
ifiustrate several other noteworthy fmdings. In the
groups with the lower maximal PTH and the lower
basal calcium, the difference between the serum
Cabas� and � was less; this is in agreement with
the finding that the basal/maximal PTH ratio was
higher and would emphasize that basal PTH was
relatively stimulated. Whether the patients were sep-
arated on the basis of maximal PTH or basal calcium,
the range of the PTH-calcium curve (difference be-
tween the serum � and Ca,�,1�) was similar. How-
ever, the PTH-calcium curve was shifted to the left in
the groups with the lower maximal PTH and the lower
basal calcium. These results suggest the intriguing
possibility that (1 ) secretion by the paathyroid glandmay adapt to the ambient serum calcium; and (2) the
range of serum calcium for PTH secretion (sigmoidal
PTH-calcium curve) remains constant.
The clinical implications of our findings would sug-
gest that even when only the predialysis (basal) PTH is
available, a similar predialysis PTH level between a
hypocalcemic patient and a normocalcemic patient
would suggest the presence of certain differences. The
hypocalcemic patient would be expected to have a
decreased maximal PTH, a higher basal/maximal PTH
ratio, and a reduced difference between Cabas� and
Ca� than his or her normocalcemic counterpart.
The lower maximal secretory capacity of the parathy-
roid gland in the hypocalcemic patient would suggest
a smaller parathyroid gland mass. The higher basal/
maximal ratio and the reduced difference between
Cabas� and Ca� would indicate that the relative
degree of PTH stimulation was higher in the hypocal-
cemic patient; thus, the hypocalcemic patient would
be expected to be positioned higher on the steep
portion of the PTH-calcium curve. Consequently, an
increase in serum calcium should result in a greater
proportional decrease in PTH in the hypocalcemic
patient than in the normocalcemic patient. Both the
smaller secretory capacity of the parathyroid gland
and the potential for a greater response in PTH for a
change in calcium would suggest the likelihood of a
greater response to calcitriol in the hypocalcemic pa-
tient.
We and others believe that the set point of calcium
as defined in this study provides information on the
serum calcium concentration at which PTH is secreted
(8, 13). Brown has advanced the concept that the set
point of calcium should be defined as the midrange
between the minimal and the maximal PTH (12,13),
whereas we have used the serum calcium concentra-
tion at 50% of the maximal PTH to represent the set
point ofcalcium ( 1 ,5,6,8). The correlation between the
two methods of calculating the set point of calcium
approached unity (r = 0.98). Although either method
should provide similar information, it should be noted
that the set point of calcium as calculated by the
method ofBrown was slightly less (9.20 ± 0. 15 versus
9.39 ± 0. 15 mg/dL) than the set point of calcium as
calculated by our method.
In normal humans, serum calcium is tightly regu-
lated in a narrow range through the action of PTH on
bone and kidney and the action of calcitriol on gut
absorption (23,24). In the dialysis patient. calcium
regulation is altered because the kidney is nonfunc-
tional, resistance to the calcemic action of PTH on
bone is present (25,26), and intestinal calcium is
malabsorbed as the result of a calcitriol deficiency
(27). Because marked 2#{176}HPT (basal PTH > 500 pg/
mL) was present in the hemodialysis patients studied,
it would be expected that these patients would have
osteitis fibrosa (2,4); indeed, in the 10 patients studied
previously and included as part of this study. a bone
biopsy showed osteitis fibrosa (5). Moreover, the ex-
tent of cellular activity and the bone formation rate
have been shown to correlate with the basal PTH level
in several studies (4,28). In this study, the basal
serum calcium appeared to have a modest correlation
with the basal and the maximal PTH levels. However,
in other forms of renal osteodystrophy such as ady-
namic bone and low-turnover aluminum bone dis-
ease-both of which are characterized by decreased
cellular activity and bone formation-the serum cal-
cium level does not appear to depend on the PTH level
( 1 ). Thus, it would appear that calcium regulation may
be more PTH dependent in dialysis patients with
marked 2#{176}HPT and osteltis fibrosa than in dialysis
patients with a modest PTH elevation and low bone
turnover.
In conclusion, when 2 1 hemodialysis patients with
marked 2#{176}HPT were separated into two groups ac-
cording to maximal PTH levels, distinct differences
were observed in the characteristics of PTH secretion
and serum calcium regulation. In the group with the
lower maximal PTH level, a low serum calcium ap-
peared to be responsible for stimulating PTH In the

PTH Secretion in Dialysis Patients With Secondary Hypertension
1378 Volume 6 . Number 5 #{149}1995
baseline state. Similarly. when patients were sepa-
rated on the basis of differences in serum calcium,
basal PTH levels were similar in both groups. How-
ever, maximal and minimal PTH levels were lower in
the hypocalcemic group, indicating that hypocalcemia
disproportionately increased the basal PTH. The range
of serum calcium for PTH secretion (sigmoidal PTH-
calcium curve) remained constant, even though the
PTH-calcium curve was shifted to the left in the
groups with the lower maximal PTH and the lower
basal calcium; this finding suggests that the PTH-
calcium curve may adapt to the ambient serum cal-
cium concentration. Furthermore, the results of this
study suggest the possibility of a different clinical
response to calcitriol treatment in these two groups of
patients and also raises the question of whether he-
modialysis patients with lower maximal PTH levels,
higher basal/maximal PTH ratios, and lower serum
calcium levels are evolving to a stage in which PTH
secretion may become more autonomous.
REFERENCES
1 . Felsenfeld Al, Rodriguez M, Dunlay R, Llach F: A com-paison of parathyroid-gland function in haemodialysispatients with different forms of renal osteodystrophy.Nephrol Dial Transplant 199 1 ;6:244-25 1.
2. Sherrard DJ, Hercz G, Pci Y, et at.: The spectrum of bonedisease in end-stage renal failure-an evolving disorder.Kidney mt 1993;43:436-442.
3. Malluche HH, Monier-Faugere MC: The role of bonebiopsy In the management of patients with renal os-teodystrophy. J Am Soc Nephrol 1994;4: 1631-1642.
4. Torres A, Lorenzo V. Hernandez D, et at. : Bone diseasein predlalysis. hemodialysis. and CAPD patients: Evi-dence of a better bone response to PTH in hemodialysispatients. Kidney Int 1995, in press.
5. Dunlay R, Rodriguez M, Felsenfeld A, Llach F: Directinhibitory effect of calcitriol on parathyroid function(sigmoidal curve) in dialysis patients. Kidney mt 1989;36:1093-1098.
6. Rodriguez M, Felsenfeld AJ, Williams C, Pederson JA,Llach F: The effect of long-term Intravenous calcitrioladministration on parathyroid function in hemodialysispatients. J Am Soc Nephrol 199 1 ;2: 10 14-1020.
7. Malberti F, Surian M, Cosci P: Effect of chronic mntrave-nous calcitriol on parathyroid function and set point ofcalcium In dialysis patients with refractory secondaryhyperparathyroidism. Nephrol Dial Transplant 1992;7:822-828.
8. Felsenfeld AJ, Llach F: Parathyroid gland function inchronic renal failure. Kidney Int 1993;43:77l-789.
9. Galhieni M, Brancaccio D, Padovese P. et at: Low-doseIntravenous calcitriol treatment of secondary hyperpar-athyroldism in hemodlalysis patients. Kidney Int 1992;42:1191-1198.
10. Felsenfeld AJ, Rodriguez M, Coleman M, Ross D, LiachF: Desferrioxamine therapy in hemodialysis patientswith aluminum-associated bone disease. Kidney mt1989;35: 137 1-1378.
1 1 . Brent GA, LeBoff MS. Seely EW, Conlin PR, Brown EM:Relationship between the concentration and rate ofchange of calcium and serum Intact parathyroid hor-
mone levels in normal humans. J Clin Endocrinol Metab1988;67:944-950.
12. Brown EM: Four-parameter model of the sigmoidal rela-tionship between parathyroid hormone release and ex-tracellular calcium concentration in normal and abnor-mal parathyroid tissue. J Clin Endocrinol Metab 1983;56:572-581.
13. Brown EM: Mechanisms underlying the regulation ofparathyroid hormone secretion in vivo and in vitro. CurrOpin Nephrol Hypertens 1993;2:54 1-551.
14. McCarron DA, Muther RS, Lenfesty B, Bennett WM:Parathyroid function in persistent hyperparathyroldism:Relationship to gland size. Kidney Int 1982;22:662-670.
15. Johnson WJ, McCarthy JT, Van Heerden JA, Sterioff S.Grant CS, Kao PC: Results of subtotal parathyroidec-tomy In hemodialysis patients. Am J Med 1988;84:23-32.
16. Gagne ER, Urena P. Leite-Silva S. et at.: Short andlong-term efficacy oftotal parathyroldectomy with imme-diate autografting compared with subtotal parathyroid-ectomy in hemodialysis patients. J Am Soc Nephrol1992;3: 1008-10 17.
17. Fukuda N, Tanaka H, Tominaga Y, Fukagawa M, Kuro-kawa K, Seino Y: Decreased 1 .25-dihydroxyvitamin D3receptor density is associated with a more severe form ofparathyroid hyperplasia in chronic uremic patients. JClin Invest 1993;92:1436-1443.
18. Heilman P. Akerstrom G, Ljunghall S. Rastad J: Surgi-cal fmdings and results of subtotal and total parathy-roidectomy in hypercalcemic patients with uremic hy-perparathyroidism. Acta Chir Scand 1989; 155:573-582.
19. Krause MW, Hedinger CE: Pathologic study of parathy-roid glands in tertiary hyperparathyroidism. Hum Pathol1985; 16:772-784.
20. Wailfelt C, Larsson R, Gylfe E, Ljunghall 5, Rastad J,Akerstrom G: Secretory disturbance in hyperplasticparathyroid nodules of uremic hyperparathyroidism:Implication for parathyroid autotransplantation. WorldJ Surg 1988;12:431-438.
2 1 . Tominaga Y, Tanaka Y, Sato K, et at.: Recurrent renalhyperparathyroidism and DNA analysis of autograftedparathyroid tissue. World J Surg 1992; 16:595-603.
22. Falchetti A, Bale AE, Amorosi A, et aL: Progression ofuremic hyperparathyroidism involves allelic loss onchromosome 1 1 . J Clin Endocrinol Metab 1993;76: 139-144.
23. ParfittAM: Bone and plasma calcium homeostasis. Bone1987;8[Suppl 11:51-58.
24. Parfitt AM, Kleerekoper M: The divalent ion homeostaticsystem-physiology and metabolism of calcium, phos-phorus. magnesium. and bone. In: Maxwell MH, Klee-man CR, Eds. Clinical Disorders of Fluid and ElectrolyteMetabolism. New York: McGraw-Hill; 1980:269.
25. Massry 5G. Coburn JW, Lee DBW, Jowsey J. KleemanCR: Skeletal resistance to parathyroid hormone In renalfailure: Studies In 105 human subjects. Ann Intern Med1973;78:357-364.
26. Bover J, Jara A, Trinidad P. Rodriguez M, Martin-MaleA, Felsenfeld AJ: The calcemic response to PTH in therat: Effect of elevated PTH levels and uremia. Kidney Int1994;46:3 10-317.
27. Coburn JW, Hartenbower DL, Massry SG: Intestinalabsorption of calcium and the effect of renal insuffi-ciency. Kidney Int 1973;4:96-103.
28. Quarles LD, Lobaugh B, Murphy G: Intact parathyroidhormone overestimates the presence and severity ofparathyrold-medlated osseous abnormalities in uremia.J Clin Endocrinol Metab 1992;75: 145-150.
Related Documents