8 Am iC/in Nuir l992;55:8- 13. Printed in USA. © 1992 American Society for Clinical Nutrition Differences in skeletal muscle and bone mineral mass between black and white females and their relevance to estimates of body composition13 Oscar Ortiz, Mary Russell, Tracey L Daley, Richard N Baumgartner, Masako Waki, Steven Lichiman, Jack Wang, Richard N Pierson, Jr, and Steven B Heymsfield ABSTRACI’ This study tested the hypothesis that black fe- males have an increase in skeletal muscle and bone mineral mass compared with white females matched for age (±5 y), weight (±2 kg), height (±3 cm), and menstrual status. Conven- tional [underwater weighing, whole body ‘#{176}K counting (WBC), 3H20 dilution] and newly developed (dual-photon absorptiom- etry) techniques were used to provide ethnicity-independent es- timates of body composition in 28 pairs of matched subjects. Black females had greater appendicular skeletal muscle (P < 0.001), bone mineral (P < 0.001), and total body potassium (TBK) (P = 0.05) compared with white females. Two classic coefficients used in body composition research [density of fat- free mass (FFM) for underwater weighing and TBK/FFM for WBC] differed significantly (P < 0.05) between black and white females; currently applied coefficients underestimated fat in black females. This study confirms that black and white females differ in body composition and that errors in fat estimates occur when ethnicity is not accounted for in body composition mod- els. AmiClinNutr l992;55:8-13. KEY WORDS Body composition, ethnicity, obesity Introduction Obesity is a major health problem in the United States (1); its prevalence varies between ethnic groups. Overall, black fe- males between the ages of 20 and 60 y have the highest rates of obesity and its associated complications, such as diabetes and high blood pressure (2). With increasing attention focusing on the relation between ethnicity and obesity, an important concern is the accuracy of quantifying body fat and other tissue compartments. Although there are many body-composition techniques (3), most depend on the assumption that ethnicity is an insignificant contributor to the compartmental determinants ofbody weight. For example, the widely applied body mass index (BMI; wt/ht2) is used to classify subjects of similar age and gender, independent of their ethnic status, into categories of equivalent body composi- tion (4). Despite the assumption that body composition is independent of ethnic status, there is growing evidence that black females in particular have a relatively larger skeletal muscle and bone min- eral mass than do white females. Stimulated by the low osteo- porosis fracture rate observed in black females, Cohn et al (5) compared total body potassium (TBK) and calcium in black females with matched white female control subjects. Both ele- ments were increased by -5-l0% in the black females, sug- gesting larger skeletal muscle and bone mineral mass as com- pared with the white female control group. Recent studies using regional dual-photon techniques amply confirmed an increase in bone mineral density in black females (6, 7). If skeletal muscle and bone mineral masses differ between black and white females, then many, if not most, body-com- position techniques would fail to account for these ethnic dif- ferences in the components ofbody weight and would therefore provide inaccurate estimates of fat and other tissue compart- ments (8- 10). Prevalence estimates of overweight and obesity would be affected also. Until recently investigators were limited in their capabilities for evaluating several major body compartments, such as bone mineral, in vivo. The introduction over the last several years of dual-photon-absorptiometry (DPA) systems for evaluating whole-body bone mineral mass and soft tissue composition (10- 1 2) now makes it feasible to examine the associations between ethnicity and body composition. The specific aim of this study was to test the hypothesis that black and white females matched for age, weight, height, and menstrual status differ significantly in the proportions of body weight contributed by skeletal muscle mass and bone mineral mass. Support for this hypothesis would imply that the two widely used research methods of evaluating body composition, underwater weighing (1 3) and whole-body ‘#{176}K counting (14), will be inaccurate when the currently used models are applied to black females. A secondary aim of the study was to establish the validity of these two methods as presently applied in black females. I From the Department of Medicine, Obesity Research Center, St Luke’s-Roosevelt Hospital, Columbia University College of Physicians and Surgeons, New York, and the Department of Pathology, University of New Mexico School of Medicine, Albuquerque, NM. 2 Supported by NIH grant PO1-DK428 18. 3 Address reprint requests to SB Heymsfield, Weight Control Unit, 4 1 1 West 1 14th Street, New York, NY 10025. Received January 8, 1991. Accepted for publication June 5, 1991. by guest on November 17, 2015 ajcn.nutrition.org Downloaded from

Welcome message from author
This document is posted to help you gain knowledge. Please leave a comment to let me know what you think about it! Share it to your friends and learn new things together.
Transcript
8 Am iC/in Nuir l992;55:8- 13. Printed in USA. © 1992 American Society for Clinical Nutrition
Differences in skeletal muscle and bone mineral massbetween black and white females and their relevanceto estimates of body composition13
Oscar Ortiz, Mary Russell, Tracey L Daley, Richard N Baumgartner, Masako Waki,Steven Lichiman, Jack Wang, Richard N Pierson, Jr, and Steven B Heymsfield
ABSTRACI’ This study tested the hypothesis that black fe-
males have an increase in skeletal muscle and bone mineral
mass compared with white females matched for age (±5 y),
weight (±2 kg), height (±3 cm), and menstrual status. Conven-
tional [underwater weighing, whole body ‘�#{176}Kcounting (WBC),
3H20 dilution] and newly developed (dual-photon absorptiom-
etry) techniques were used to provide ethnicity-independent es-
timates of body composition in 28 pairs of matched subjects.
Black females had greater appendicular skeletal muscle (P
< 0.001), bone mineral (P < 0.001), and total body potassium
(TBK) (P = 0.05) compared with white females. Two classic
coefficients used in body composition research [density of fat-
free mass (FFM) for underwater weighing and TBK/FFM for
WBC] differed significantly (P < 0.05) between black and white
females; currently applied coefficients underestimated fat in black
females. This study confirms that black and white females differ
in body composition and that errors in fat estimates occur when
ethnicity is not accounted for in body composition mod-
els. AmiClinNutr l992;55:8-13.
KEY WORDS Body composition, ethnicity, obesity
Introduction
Obesity is a major health problem in the United States (1);
its prevalence varies between ethnic groups. Overall, black fe-
males between the ages of 20 and 60 y have the highest rates of
obesity and its associated complications, such as diabetes and
high blood pressure (2).
With increasing attention focusing on the relation between
ethnicity and obesity, an important concern is the accuracy of
quantifying body fat and other tissue compartments. Although
there are many body-composition techniques (3), most depend
on the assumption that ethnicity is an insignificant contributor
to the compartmental determinants ofbody weight. For example,
the widely applied body mass index (BMI; wt/ht2) is used to
classify subjects of similar age and gender, independent of
their ethnic status, into categories of equivalent body composi-
tion (4).
Despite the assumption that body composition is independent
of ethnic status, there is growing evidence that black females in
particular have a relatively larger skeletal muscle and bone min-
eral mass than do white females. Stimulated by the low osteo-
porosis fracture rate observed in black females, Cohn et al (5)
compared total body potassium (TBK) and calcium in black
females with matched white female control subjects. Both ele-
ments were increased by �-5-l0% in the black females, sug-
gesting larger skeletal muscle and bone mineral mass as com-
pared with the white female control group. Recent studies using
regional dual-photon techniques amply confirmed an increase
in bone mineral density in black females (6, 7).
If skeletal muscle and bone mineral masses differ between
black and white females, then many, if not most, body-com-
position techniques would fail to account for these ethnic dif-
ferences in the components ofbody weight and would therefore
provide inaccurate estimates of fat and other tissue compart-
ments (8- 10). Prevalence estimates of overweight and obesity
would be affected also.
Until recently investigators were limited in their capabilities
for evaluating several major body compartments, such as bone
mineral, in vivo. The introduction over the last several years of
dual-photon-absorptiometry (DPA) systems for evaluating
whole-body bone mineral mass and soft tissue composition (10-
1 2) now makes it feasible to examine the associations between
ethnicity and body composition.
The specific aim of this study was to test the hypothesis that
black and white females matched for age, weight, height, and
menstrual status differ significantly in the proportions of body
weight contributed by skeletal muscle mass and bone mineral
mass. Support for this hypothesis would imply that the two
widely used research methods of evaluating body composition,
underwater weighing (1 3) and whole-body ‘�#{176}Kcounting (14),
will be inaccurate when the currently used models are applied
to black females. A secondary aim of the study was to establish
the validity of these two methods as presently applied in black
females.
I From the Department of Medicine, Obesity Research Center, St
Luke’s-Roosevelt Hospital, Columbia University College of Physicians
and Surgeons, New York, and the Department of Pathology, Universityof New Mexico School of Medicine, Albuquerque, NM.
2 Supported by NIH grant PO1-DK428 18.3 Address reprint requests to SB Heymsfield, Weight Control Unit,
4 1 1 West 1 14th Street, New York, NY 10025.
Received January 8, 1991.Accepted for publication June 5, 1991.
by guest on Novem
ber 17, 2015ajcn.nutrition.org
Dow
nloaded from
ETHNICITY AND BODY COMPOSITION 9
The between-day CVs for bone-mineral and total appendicular
Methods
Subjects
Black females aged 20-70 y were recruited in several ways.
Some were hospital employees and some were recruited through
newspaper advertisements and via leaflets circulated in the local
community. Subjects enrolled in the study met four criteria:
absence of medical illness as substantiated by medical history
and a physical examination, a BMI < 30 (in kg/m2), absence of
atypical diet history, and daily physical activities that included
full ambulation and recreational exercise. Each black female
was then matched to a white female control subject, recruited
similarly, by age (±5 y), weight (±2 kg), height (±3 cm), and
menstrual status. The white subjects met similar health, diet,
and physical-activity criteria as were established for the black
subjects. The investigation was approved by the Institutional
Review Board ofSt Luke’s-Roosevelt Hospital Center and each
subject signed an informed-consent form before the study began.
Protocol
On completion ofthe screening evaluation, subjects underwent
body-composition studies that included anthropometry, DPA,
3H20 dilution, underwater weighing, and whole-body “#{176}K
counting. The results ofthese procedures were then used to cal-
culate compartmental masses and other relevant body-compo-
sition indices.
Experimental procedures
Anthropometry. Body weight and height were measured to
within 0.01 kg and 0. 10 cm by using an electronic scale (Weight-
Tronix, Scale Electronics Development, New York) and stadi-
ometer (Holtain Limited, Crosswell, Wales, UK), respectively.
Waist and hip circumferences were measured at the costal margin
and at the maximum horizontal girth between waist and thigh
by using a steel measuring tape, as defined in the Airlie Confer-
ence proceedings (15).
Dual-photon absorptiometry. A whole-body DPA scanner(DP-
4, Lunar Radiation, Madison, WI) was used to quantify total-
body and regional bone-mineral and appendicular skeletal mus-
cle mass as previously described (1 3, 16). Each patient scan,
requiring ‘-50 mm, was followed by studies ofseven frozen beef
phantoms of known fat content. On the basis of the phantom
calibrations, the ratio of soft-tissue attenuations (R5�) at the
scanner’s two energy levels (7 and 16 fI) was used to partition
soft tissue into fat and lean components.
On analysis of the patient’s scan, the DPA instrument’s soft-
ware allowed separation of the body into six regions, including
upper and lower appendages ( 16). Bone mineral mass and RST
were then calculated by system software for the whole body and
for the upper and lower appendages. The appendicular soft tissue
was then further divided into fat and fat-free components by
using the measured R�- and the soft-tissue phantom calibration.
We assumed that the fat-free and bone-mineral-free mass of the
appendages represented skeletal muscle plus a small and rela-
tively constant skin mass. Details of the calculations involved
are presented elsewhere ( 16). We previously demonstrated good
correlations between skeletal muscle mass by using this method
compared with other noninvasive techniques ofestimating skel-
etal muscle (16). Appendicular skeletal muscle represents about
two-thirds to three-fourths of total-body-skeletal-muscle mass.
skeletal muscle, as measured by DPA, are 1 .0% and 3.0%, re-
spectively.
The long-bone lengths in the upper (neck of the humerus to
styloid process of ulna) and lower (neck of the femur to medial
malleolus of the tibia) extremities were measured in the DPA
scan. The actual length of the extremity long bones was then
calculated by using the ratio of total body length in the scan to
actual height as an internal standard.
3H20 dilution. Subjects received 0.19 Bq 3H2O, which was
followed by a 3-h blood sample (17). The 3H2O-dilution volume
was calculated after correction for urinary isotope losses. The
CV for this procedure is 1 .5%. Total-body-water volume was
estimated as the 3H2O dilution space X 0.95, based on correction
for nonaqueous hydrogen exchange. Aqueous mass was calcu-
lated as the product oftotal-body-water volume and water density
at 37 #{176}C(0.994 g/cm3).
Underwater weighing. Body density was measured by using
water submersion in a previously described four-point platform
scale system (1 8). Body density was calculated after adjustment
for water temperature and for residual lung volume, the latter
established after underwater weighing by using the system de-
scribed by Wilmore (19). The CV for body density derived by
underwater weighing is 0.4% at our Center.
Whole-body 40K counting. TBK was evaluated in a 4-ir whole-
body counter (20, 2 1). Adjustments in the raw counts were made
for body size based on a previously reported 42K calibration
study (2 1). The CV for the 9-mm counting procedure is 3%.
Body-composition calculations
The DPA study provided estimates oftotal-body and regional
bone mineral mass and bone density and appendicular-skeletal-
muscle mass. Body weight was also compartmentalized into
mineral, water, protein, and fat by using a method based on
measured bone mineral (DPA), 3H2O dilution volume, and body
density (underwater weighing) (20). Briefly, bone mineral (mea-
sured by DPA) is first adjusted upward to total body mineral by
using data detailed in previous cadaver studies (10). Body density
is then corrected for mineral and water densities (3.042 and
0.994 g/cm3, respectively), the remainder representing the con-
tributions of protein and fat (1 .340 and 0.900 g/cm3, respec-
tively). Note that these compartmental densities represent phys-
ical properties ofthe chemical compounds involved and therefore
should not be confused with the density value of bone that is
provided by DPA. The combined mass ofprotein and fat is then
calculated by subtracting mineral and aqueous mass from body
weight. Lastly, fat mass is estimated given the mass and density
ofthe protein plus fat mixture (Eq 1, Table 1). In sum, estimatedbone mineral, 3H2O-dilution volume, and body density are used
to separate body weight into four components: mineral, protein,water, and fat.
The importance of this approach in estimating fat is that no
assumptions are made that could potentially be confounded by
ethnic status, age, or gender. Previous studies show excellent
agreement between results from using this four-compartment
model and those derived by using neutron-activation method-
ology (20). The CV for fat mass estimated by this approach is
3.0%, and fat-free mass (FFM) is considered to be the sum of
protein, water, and mineral.
Two conventional reference methods of estimating body fat
are underwater weighing and whole-body �‘#{176}Kcounting (14). The
primary assumption ofthe underwater-weighing method is that
by guest on Novem
ber 17, 2015ajcn.nutrition.org
Dow
nloaded from
10 ORTIZ ET AL
5 1 ± SD (range); n = 28.
t In kg/m2.
TABLE 1Equations used to estimate fat and density of fat-free body mass5
Number(ref) Equation
1 (20) Fat(kg) = [BW-(A + M)][�!�-�_ 205]DP+F
2 (3) Fat (kg) = [BW] [� - 4.50]
3(10) d���1(g/cm3) = [(1.0063 X fA) + (0.7463 X fP)
+ (0.3287 fM)]’
S A, aqueous mass (in kg); BW, body weight (in kg); Db, body density(in g/cm3); dFFM, density of FFM (in g/cm3); DP+F, density of proteinplus fat (in g/cm3); f, fraction; M, total body mineral (in kg); and P,protein (in kg).
the densities of fat and FFM are 0.900 and 1 . 100 g/cm3, re-
spectively. According to this method, total body fat is calculated
as presented in equation 2 (Table 1). A relative increase in the
bone mineral (whose density is 3.042 g/cm3) content of FFM
could increase the density of FFM in black females, thereby
causing errors in fat estimates. Similarly, a relative decrease in
the hydration ofthe FFM could increase its density. We explored
these possibilities by directly calculating the density of FFM
(dFFM) based on the four-compartment estimates as shown in
equation 3 (Table 1).
The primary assumption of the whole-body-’#{176}K-counting
method is that the potassium concentration ofFFM on the basis
of an individual’s age and gender is known and constant (14,
17). At our center the value of 59.8 mmol/kg was established
for healthy white females (n = 30, age 4 1 .9 ± 4.7 y) aged 35-
49 y and is the presently used appropriate constant for estimating
fat in the TBK model. According to this method, FFM (in kg)
is first calculated as TBK (in mmol)/59.8, and fat (in kg) is then
equal to body weight - FFM.
Statistical analysis
Some of the subjects were unable to complete all of the pro-
cedures, eg, underwater weighing because offear of submersion,
or whole-body counting because of claustrophobia. The total
number of paired subjects therefore varies for each body-com-
position comparison between black and white females. Between-
group differences for each body-composition estimate were
evaluated by two-tailed paired t tests. Results are presented as
group means ± SDs.
Results
The baseline information for subject evaluation is presented
in Table 2. A total of 28 black females and respective white
female control subjects met the four study-entry criteria. There
were no significant differences between the groups in age, height,
weight, and BMI. The study groups were, on average, middle-
aged (44.2 and 43.6 y) and the mean BMIs for both groups (23.9
and 23.6) approximated the 50th percentile for nationally rep-
resentative samples ofblack and white women (22). There were
no significant differences between the groups in body-fat distri-
bution as indicated by the waist-to-hip ratio in black (0.81 ± 0.05)
vs white (0.80 ± 0.04) females.
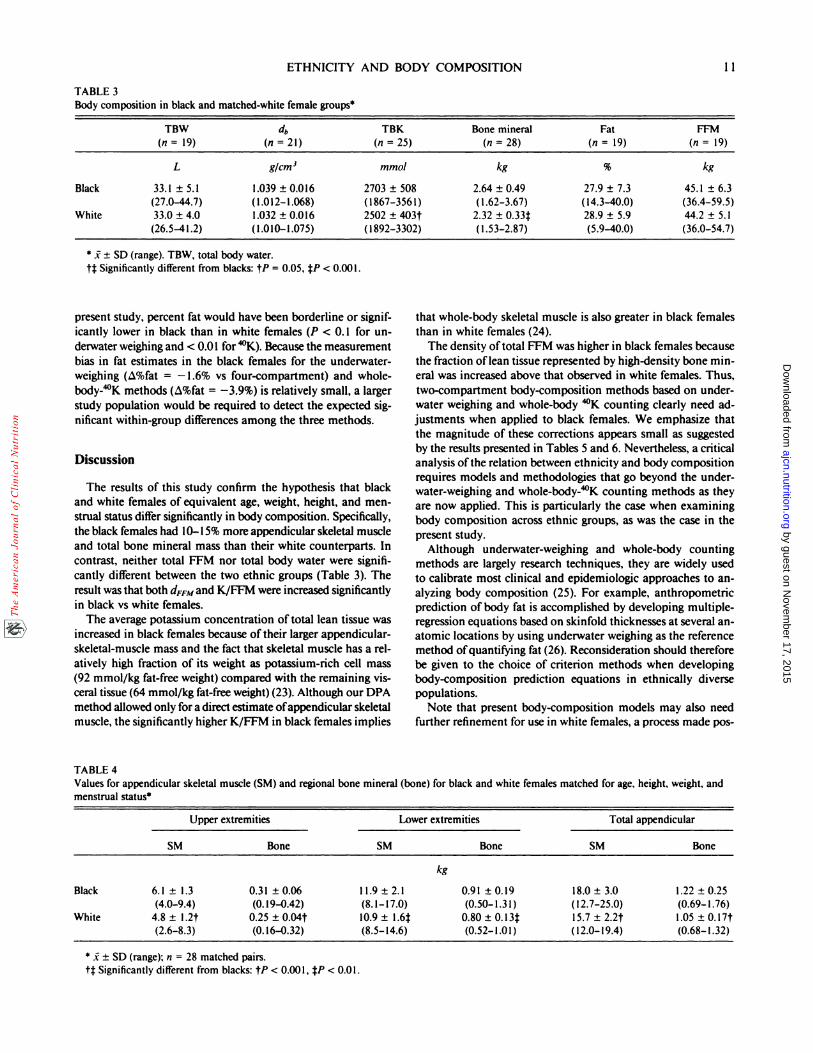
The results ofbody-composition studies are presented in Table
3. Both TBK and bone mineral were significantly increased by
8.0% and 13.8% (P = 0.05 and P < 0.001) in black females
relative to their matched white counterparts. Total bone density
in the black females was 1. 18 ± 0. 14 g/cm2, which was signifi-
cantly (n = 28 pairs; P < 0.001) higher than the bone density
observed in white females (1.09 ± 0.09 g/cm2).
Results for appendicular skeletal muscle and bone mineral
are presented in Table 4. Black females had greater skeletal mus-
cle and bone mineral in the upper (both P < 0.001), lower (both
P < 0.01), and combined extremities (+14.6%, +16.2%; both P
< 0.001) than did white females. Both the upper- and lower-
extremity bone lengths (n = 28 pairs) were significantly (P < 0.05
and P < 0.01, respectively) longer in the black females (53.8
± 7.5 and 80.3 ± 10.4 cm) by -2 cm than in the white females
(52.7 ± 4.2 and 78.1 ± 6.2 cm).
The total appendicular-skeletal-muscle mass was combined
with total-body bone mineral to provide an estimate of mus-
culoskeletal mass (n = 28 pairs). Black females had 20.6 ± 3.6
kg of musculoskeletal mass, which was 14.7% higher than that
observed in white females (18.0 ± 2. 1 kg, P < 0.004). Overall,
musculoskeletal mass represented 33 ± 5% and 29 ± 3% of body
weight in black and white females (P < 0.002), respectively.
The results of two-compartment, body-composition-model
coefficients-dFFM and K/FFM-in black and white females are
presented in Table 5. Both dFFM and K/FFM were significantly
(P < 0.05) higher in black than in white females. The hydration
of FFM (ie, total body water/FFM) was similar between black
and white subjects (n = 19; 0.734 ± 0.041 vs 0.747 ± 0.037 (NS).
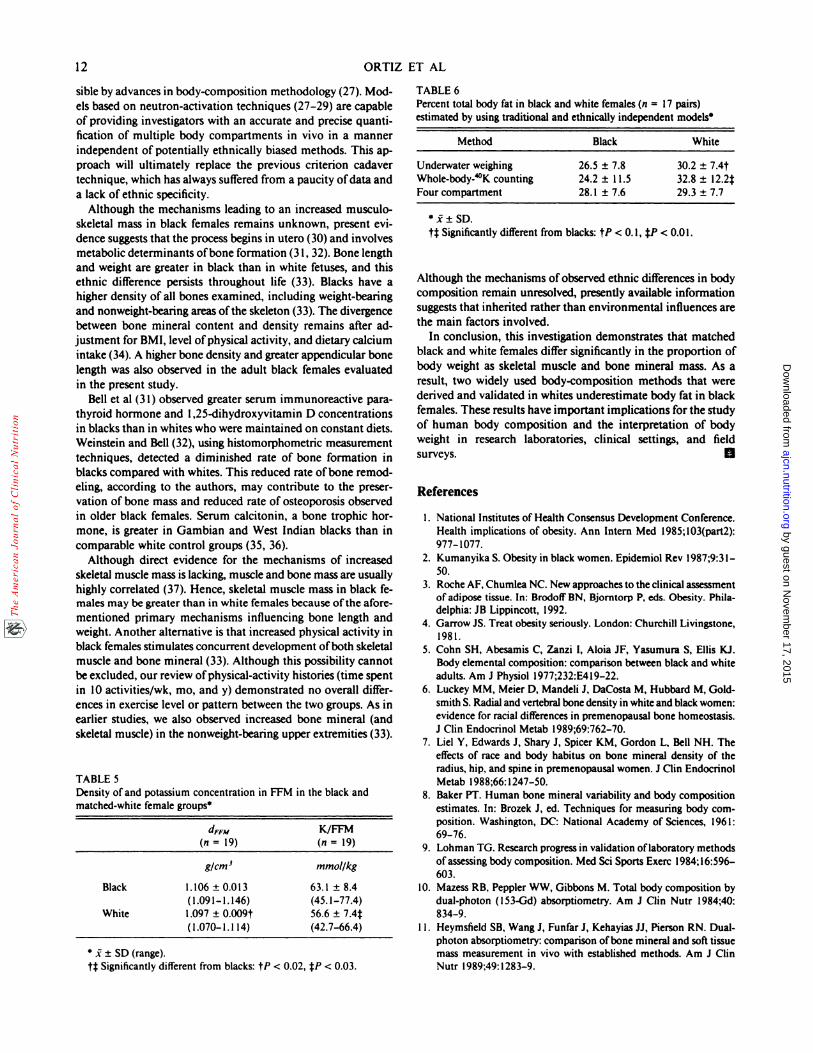
The ethnically distinct coefficient for density and potassium
content of FFM (ie, dFFM and K/FFM) implies that systematic
errors are made in the estimate of percent body fat when tra-
ditional underwater-weighing and whole-body-”#{176}K (dFFM = 1.100
g/cm3 and TBK/FFM = 59.8 mmol/kg) models are used in black
females. This subtle measurement bias is demonstrated in Table
6, which presents percent body fat for black and white females
derived by traditional underwater-weighing and whole-body-�#{176}K
methods and by our assumption-independent four-compartment
model in the 17 pairs ofwomen in whom all ofthe measurements
were available. Although in white females the underwater-
weighing and whole-body-�#{176}K methods provided larger results
for percentage fat than did the four-compartment model, they
underestimate fat in black females. Had these two-compartment
methods been used to compare black and white females in the
TABLE 2Baseline r esults for blac k and matched-w hite female grou ps5
Body massGroup Age
y
Weight
kg
Height
m
indext
Black 44.2 ± 15.2
(24-79)
62.3 ± 5.8(50.3-78.5)
1.61 ± 5.8( 1 .52- 1 .73)
23.9 ± 2.5
(20.0-29.3)
White 43.6 ± 15.3
(24-78)
62.0 ± 6.6
(50.8-76.7)
1.62 ± 5.7
( 1.50-1 .72)23.6 ± 2.2
( I 9.6-28.2)
by guest on Novem
ber 17, 2015ajcn.nutrition.org
Dow
nloaded from
ETHNICITY AND BODY COMPOSITION 11
5 1 ± SD (range); n = 28 matched pairs.
t� Significantly different from blacks: tP < 0.001, jP < 0.01.
TABLE 3Body compo sition in black and m atched-white female groups5
TBW(n = 19)
db(n = 21)
TBK(n = 25)
Bone mineral(n = 28)
Fat(n = 19)
FFM(n = 19)
L g/cm3 mmo/ kg % kg
Black
White
33.1 ± 5.1
(27.0-44.7)33.0 ± 4.0
(26.5-41 .2)
1.039 ± 0.016
( I .01 2-1 .068)1.032 ± 0.016
( 1 .010-1 .075)
2703 ± 508
( I 867-356 1)
2502 ± 403t( 1892-3302)
2.64 ± 0.49
( 1.62-3.67)2.32 ± 0.33�
( 1.53-2.87)
27.9 ± 7.3
( 14.3-40.0)
28.9 ± 5.9
(5.9-40.0)
45.1 ± 6.3
(36.4-59.5)44.2 ± 5.1
(36.0-54.7)
5 1 ± SD (range). TBW, total body water.
if Significantly different from blacks: tP = 0.05, fP < 0.001.
present study, percent fat would have been borderline or signif-
icantly lower in black than in white females (P < 0. 1 for un-
derwater weighing and < 0.01 for ‘�#{176}K).Because the measurement
bias in fat estimates in the black females for the underwater-
weighing (�%fat = - 1.6% vs four-compartment) and whole-
body-’�#{176}Kmethods (�%fat = -3.9%) is relatively small, a larger
study population would be required to detect the expected sig-
nificant within-group differences among the three methods.
Discussion
The results of this study confirm the hypothesis that black
and white females of equivalent age, weight, height, and men-
strual status differ significantly in body composition. Specifically,
the black females had 10-15% more appendicular skeletal muscle
and total bone mineral mass than their white counterparts. In
contrast, neither total FFM nor total body water were signifi-
cantly different between the two ethnic groups (Table 3). The
result was that both dFFM and K/FFM were increased significantly
in black vs white females.
The average potassium concentration oftotal lean tissue was
increased in black females because oftheir larger appendicular-
skeletal-muscle mass and the fact that skeletal muscle has a rel-
atively high fraction of its weight as potassium-rich cell mass
(92 mmol/kg fat-free weight) compared with the remaining vis-
ceral tissue (64 mmol/kg fat-free weight)(23). Although our DPA
method allowed only for a direct estimate ofappendicular skeletal
muscle, the significantly higher K/FFM in black females implies
TABLE 4
that whole-body skeletal muscle is also greater in black females
than in white females (24).
The density oftotal FFM was higher in black females because
the fraction oflean tissue represented by high-density bone mm-
eral was increased above that observed in white females. Thus,
two-compartment body-composition methods based on under-
water weighing and whole-body �#{176}Kcounting clearly need ad-
justments when applied to black females. We emphasize that
the magnitude of these corrections appears small as suggested
by the results presented in Tables 5 and 6. Nevertheless, a critical
analysis ofthe relation between ethnicity and body composition
requires models and methodologies that go beyond the under-
water-weighing and whole-body-”#{176}K counting methods as they
are now applied. This is particularly the case when examining
body composition across ethnic groups, as was the case in the
present study.
Although underwater-weighing and whole-body counting
methods are largely research techniques, they are widely used
to calibrate most clinical and epidemiologic approaches to an-
alyzing body composition (25). For example, anthropometric
prediction of body fat is accomplished by developing multiple-
regression equations based on skinfold thicknesses at several an-
atomic locations by using underwater weighing as the reference
method ofquantifying fat (26). Reconsideration should therefore
be given to the choice of criterion methods when developing
body-composition prediction equations in ethnically diverse
populations.
Note that present body-composition models may also need
further refinement for use in white females, a process made pos-
Values for appendicular skeletal muscle (SM) and regional bone mineral (bone) for black and white females matched for age, height, weight, and
menstrual status5
Upper extremities Lowe r extremities Total appendicular
SM Bone SM Bone SM Bone
kg
Black
White
6.1 ± 1.3
(4.0-9.4)4.8 ± l.2t
(2.6-8.3)
0.31 ± 0.06
(0. 19-0.42)
0.25 ± 0.04t
(0. 16-0.32)
1 1.9 ± 2.1
(8. 1- 17.0)10.9 ± l.6j
(8.5- 14.6)
0.91 ± 0.19
(0.50- 1.3 1)0.80 ± 0.l3�
(0.52- 1 .0 1)
18.0 ± 3.0
( I 2.7-25.0)
15.7 ± 2.2t
( 1 2.0- 19.4)
1.22 ± 0.25
(0.69-1.76)1.05 ± 0.17t
(0.68-1.32)
by guest on Novem
ber 17, 2015ajcn.nutrition.org
Dow
nloaded from
S � � SD (range).
tt Significantly different from blacks: tP < 0.02, tP < 0.03.
12
sible by advances in body-composition methodology (27). Mod-
els based on neutron-activation techniques (27-29) are capable
of providing investigators with an accurate and precise quanti-
fication of multiple body compartments in vivo in a manner
independent of potentially ethnically biased methods. This ap-
proach will ultimately replace the previous criterion cadaver
technique, which has always suffered from a paucity ofdata and
a lack of ethnic specificity.
Although the mechanisms leading to an increased musculo-
skeletal mass in black females remains unknown, present cvi-
dence suggests that the process begins in utero (30) and involves
metabolic determinants ofbone formation (3 1, 32). Bone length
and weight are greater in black than in white fetuses, and this
ethnic difference persists throughout life (33). Blacks have a
higher density of all bones examined, including weight-bearing
and nonweight-bearing areas ofthe skeleton (33). The divergence
between bone mineral content and density remains after ad-
justment for BMI, level ofphysical activity, and dietary calcium
intake (34). A higher bone density and greater appendicular bone
length was also observed in the adult black females evaluated
in the present study.
Bell et al (3 1) observed greater serum immunoreactive para-
thyroid hormone and 1,25-dihydroxyvitamin D concentrations
in blacks than in whites who were maintained on constant diets.
Weinstein and Bell (32), using histomorphometric measurement
techniques, detected a diminished rate of bone formation in
blacks compared with whites. This reduced rate ofbone remod-
cling, according to the authors, may contribute to the preser-
vation of bone mass and reduced rate of osteoporosis observed
in older black females. Serum calcitonin, a bone trophic hor-
mone, is greater in Gambian and West Indian blacks than in
comparable white control groups (35, 36).
Although direct evidence for the mechanisms of increased
skeletal muscle mass is lacking, muscle and bone mass are usually
highly correlated (37). Hence, skeletal muscle mass in black fe-males may be greater than in white females because ofthe afore-
mentioned primary mechanisms influencing bone length and
weight. Another alternative is that increased physical activity in
black females stimulates concurrent development ofboth skeletal
muscle and bone mineral (33). Although this possibility cannot
be excluded, our review ofphysical-activity histories (time spent
in 10 activities/wk, mo, and y) demonstrated no overall differ-
ences in exercise level or pattern between the two groups. As in
earlier studies, we also observed increased bone mineral (and
skeletal muscle) in the nonweight-bearing upper extremities (33).
TABLE 5
Density ofand potassium concentration in FFM in the black and
matched-white female groups
dFFM
(n=19)K/FFM
(n=19)
g/cm3 mmol/kg
Black 1.106 ± 0.013(1.091-1.146)
63.1 ± 8.4(45.1-77.4)
White 1.097 ± 0.009t
(1.070-1.1 14)
56.6 ± 7.4�
(42.7-66.4)
ORTIZ ET AL
TABLE 6Percent total body fat in black and white females (n = 17 pairs)estimated by using traditional and ethnically independent models5
Method Black White
Underwater weighing 26.5 ± 7.8 30.2 ± 7.4t
Whole-body-�#{176}K counting 24.2 ± 1 1.5 32.8 ± 12.2f
Four compartment 28.1 ± 7.6 29.3 ± 7.7
S � � SD.
if Significantly different from blacks: tP < 0. 1, �P < 0.01.
Although the mechanisms ofobserved ethnic differences in body
composition remain unresolved, presently available information
suggests that inherited rather than environmental influences are
the main factors involved.
In conclusion, this investigation demonstrates that matched
black and white females differ significantly in the proportion of
body weight as skeletal muscle and bone mineral mass. As a
result, two widely used body-composition methods that were
derived and validated in whites underestimate body fat in black
females. These results have important implications for the study
of human body composition and the interpretation of body
weight in research laboratories, clinical settings, and field
surveys. B
References
1. National Institutes of Health Consensus Development Conference.Health implications of obesity. Ann Intern Med l985;l03(part2):
977-1077.
2. Kumanyika S. Obesity in black women. Epidemiol Rev l987;9:31-
50.3. Roche AF, Chumlea NC. New approaches to the clinical assessment
ofadipose tissue. In: Brodoff BN, Bjorntorp P. eds. Obesity. Phila-delphia: JB Lippincott, 1992.
4. Garrow JS. Treat obesity seriously. London: Churchill Livingstone,1981.
5. Cohn SH, Abesamis C, Zanzi I, Aloia iF, Yasumura S. Ellis KJ.
Body elemental composition: comparison between black and white
adults. Am J Physiol l977;232:E4l9-22.6. Luckey MM, Meier D, Mandeli J, DaCosta M, Hubbard M, Gold-
smith S. Radial and vertebral bone density in white and black women:evidence for racial differences in premenopausal bone homeostasis.
J Clin Endocrinol Metab l989;69:762-70.7. Lid Y, Edwards J, Shary J, Spicer KM. Gordon L, Bell NH. The
effects of race and body habitus on bone mineral density of theradius, hip, and spine in premenopausal women. J Clin Endocrinol
Metab l988;66: 1247-50.8. Baker PT. Human bone mineral variability and body composition
estimates. In: Brozek J, ed. Techniques for measuring body com-position. Washington, DC: National Academy of Sciences, 1961:69-76.
9. Lohman TG. Research progress in validation oflaboratory methods
ofassessing body composition. Med Sci Sports Exerc 1984;16:596-603.
10. Mazess RB, Peppler WW, Gibbons M. Total body composition by
dual-photon (1 53-Gd) absorptiometry. Am J Clin Nutr 1984;40:834-9.
1 1 . Heymsfield SB, Wang J, Funfar J, Kehayias JJ, Pierson RN. Dual-photon absorptiometry: comparison ofbone mineral and soft tissuemass measurement in vivo with established methods. Am J ClinNutr l989;49: 1283-9.
by guest on Novem
ber 17, 2015ajcn.nutrition.org
Dow
nloaded from
ETHNICITY AND BODY COMPOSITION 13
12. Gotfredsen A, Jensen J, Borg J, Christiansen C. Measurement of
lean body mass and total body fat using dual photon absorptiometry.
Metabolism l986;35:88-93.
13. Brozek J, Grande F, Anderson T, Keys A. Densitometric analysis
ofbody composition: revision ofsome assumptions. Ann NY Acad
Sci 1963;llO:ll3-40.
14. Pierson RN Jr, Lin DHY, Phillips RA. Total body potassium in
health: the effects ofage, sex, height and fat. Am J Physiol 1974;226:
206- 12.
15. Lohman TG, Roche AF, Martorell R, eds. Anthropometric stan-
dardization reference manual. Champaign, IL: Human Kinetics
Books, 1988.
16. Heymsfield SB, Smith R, Aulet M, et al. Appendicular skeletal muscle
mass: measurement by dual photon absorptiometry. Am J Clin Nutr
1990;52:2 14-8.
17. Pierson RN Jr, Wang J, Colt E, Neumann P. Body composition
measurements in normal men: the potassium, sodium, sulfate, and
tritium space in 58 adults. J Chronic Dis l982;35:4l9-28.
18. Akers R, Buskirk ER. An underwater weighing system utilizing “force
cube” transducers. J Appl Physiol 1969;26:649-52.
19. Wilmore J. A simplified method for determination of residual lung
volumes. J Appl Physiol 1969;27:96-lOO.
20. Heymsfield SB, Lichtman 5, Baumgartner RN, et al. Body com-
position ofhumans: comparison oftwo improved four-compartment
models that differ in expense, technical complexity, and radiation
exposure. Am J Clin Nutr 1990;52:52-8.
2 1 . Pierson RN Jr, Wang J, Thornton JC, Van Itallie TB, Colt EWD.
Body potassium by 4-pi counting: an anthropometric correction.
Am J Physiol l984;245:F234-9.
22. Najjar Mi, Roland M. Anthropometric reference data and prevalence
ofoverweight, US 1976-80. Vital Health Stat [1 1] l987;238.
23. Lentner C, ed. Geigy scientific tables. Vol 1. West Caldwell, NJ:
Ciba-Geigy, 1981.
24. Burkinshaw L. Models of the distribution of protein in the humanbody. In: Ellis KJ, Yasamura S. Morgan WD, eds. In vivo body
composition studies. London: Institute of Physical Sciences in Med-
icine, 1987:15-24.
25. Heymsfield SB, Wang J, Lichtman 5, Kamen Y, Kehayias J, Pierson
RN Jr. Body composition in elderly subjects: a critical appraisal of
clinical methodology. Am J Clin Nutr l989;50:l 167-75.
26. Durnin JVGA, Womersley J. Body fat assessed from total body
density and its estimation from skinfold thicknesses: measurementson 481 men and women aged from 16 to 72 years. BrJ Nutr l974;32:77-97.
27. Cohn SH, Vartsky D, Yasumura 5, et al. Compartmental bodycomposition based on total-body nitrogen, potassium, and calcium.Am J Physiol l980;239:E524-30.
28. Kehayias JJ, Heymsfield SB, Dilmanian FA, Wang J, Gunther D,
Pierson RN. Measurement ofbody fat by neutron inelastic scattering:
comments on installation, operation, and error analysis. In: Yasa-mum 5, Woodward H, eds. In vivo body composition studies. Lon-don: Institute for Physical Sciences in Medicine, 1990:339-46.
29. Heymsfield SB, Wang J, Kehayias J, Heshka S, Lichtman 5, PiersonRN Jr. Chemical determination of human body density in vivo:
relevance to hydrodensitometry. Am J Clin Nutr l989;50:l282-9.30. Choi SC, Trotter M. A statistical study ofthe multivariate structure
and race-sex differences of American white and negro fetal skeletons.Am J Phys Anthropol 1970;33:307-l2.
31. Bell NH, Greene A, Epstein 5, Oexmann M, Shaw S, Shary J. Ev-idence for alteration of the vitamin D-endocrine system in blacks.
J Clin Invest l985;76:470-3.32. Weinstein R, Bell N. Diminished rates ofbone formation in normal
black adults. New EngI J Med l988;3l9:1698-701.33. Pollitzer WS, Anderson JB. Ethnic and genetic differences in bone
mass: a review with a hereditary vs environmental perspective. AmJ Clin Nutr l989;50:1244-59.
34. Anderson JJB, Tylavsky FA, Lacey JM, Talmage RV. Black-white
differences in bone status of young women according to calciumintake. In: Cohn DB, Martin TJ, Meunier PJ, eds. Calcium regulation
and bone metabolism. Vol 9. Amsterdam: Excerpts Medica, 1987:696(abstr).
35. Mulder H, Hackeng WHL, Silberbusch J. Racial differences in serum
calcitonin. Lancet l979;2: 154 (letter).36. Stevenson JC, Myers CH, Ajdukiewica AB. Racial differences in
calcitonin and katacalcin. CalcifTissue lnt l984;36:725-8.37. Ellis K, Cohn S. Correlation between skeletal calcium mass and
muscle mass in man. J Appl Physiol 1975;38:455-60.
by guest on Novem
ber 17, 2015ajcn.nutrition.org
Dow
nloaded from
Related Documents