1 Differences in predator composition alters the direction of structure- 1 mediated predation risk in macrophyte communities 2 3 Simone Farina 1*,2 , Rohan Arthur 3 , Jordi F. Pagès 2 , Patricia Prado 4,5 , Javier Romero 6 , Adriana Vergés 7 , 4 Glenn Hyndes 8 , Ken L. Heck, Jr 5 , Sybil Glenos 5 , Teresa Alcoverro 2,3 5 1 Present address::Fondazione IMC - Centro Marino Internazionale Onlus · Località Sa Mardini · 09072 Torregrande, Oristano (Italy) 6 2 Department d’Ecologia Marina, Centre d’Estudis Avançats de Blanes (CEAB-CSIC). C/ Accés a la Cala St. Francesc, 14, 17300 Blanes, Girona, 7 Spain; Email: [email protected] 8 3 Nature Conservation Foundation, 3076/5, 4th Cross, Gokulam Park, 570 002 Mysore, Karnataka (India) 9 4 Present address: Institut de Recerca i Tecnología Agroalimentairíes (IRTA), Aquatic Ecosystems, Tarragona, Spain 10 5 Dauphin Island Sea Lab, Univ. of South Alabama, Dauphin Island, AL 35628, 11 6 Departamento de Ecología, Facultad de Biología, Universidad de Barcelona, Avda, Diagonal 645, 08028 Barcelona, Spain 12 7 Centre for Marine Bio-Innovation and Evolution & Ecology Research Centre, School of Biological, Earth and Environmental Sciences, University of 13 New South Wales, Sydney NSW 2056, Australia 14 8 Centre for Marine Ecosystems Research, School of Natural Sciences, Edith Cowan University, 270 Joondalup Drive, Joondalup, WA 6027, Australia 15 * Corresponding author: Ph.: +39 0783 22002, E-mail: [email protected] 16 17 Please find the published version of this manuscript in Oikos: 18 http://dx.doi.org/10.1111/oik.01382 19 20 21

Welcome message from author
This document is posted to help you gain knowledge. Please leave a comment to let me know what you think about it! Share it to your friends and learn new things together.
Transcript

1
Differences in predator composition alters the direction of structure-1
mediated predation risk in macrophyte communities 2
3
Simone Farina 1*,2, Rohan Arthur 3, Jordi F. Pagès 2, Patricia Prado 4,5, Javier Romero6, Adriana Vergés7, 4
Glenn Hyndes 8, Ken L. Heck, Jr5, Sybil Glenos5, Teresa Alcoverro2,3 5
1Present address::Fondazione IMC - Centro Marino Internazionale Onlus · Località Sa Mardini · 09072 Torregrande, Oristano (Italy) 6
2 Department d’Ecologia Marina, Centre d’Estudis Avançats de Blanes (CEAB-CSIC). C/ Accés a la Cala St. Francesc, 14, 17300 Blanes, Girona, 7 Spain; Email: [email protected] 8
3 Nature Conservation Foundation, 3076/5, 4th Cross, Gokulam Park, 570 002 Mysore, Karnataka (India) 9
4 Present address: Institut de Recerca i Tecnología Agroalimentairíes (IRTA), Aquatic Ecosystems, Tarragona, Spain 10
5 Dauphin Island Sea Lab, Univ. of South Alabama, Dauphin Island, AL 35628, 11
6 Departamento de Ecología, Facultad de Biología, Universidad de Barcelona, Avda, Diagonal 645, 08028 Barcelona, Spain 12
7Centre for Marine Bio-Innovation and Evolution & Ecology Research Centre, School of Biological, Earth and Environmental Sciences, University of 13 New South Wales, Sydney NSW 2056, Australia 14
8 Centre for Marine Ecosystems Research, School of Natural Sciences, Edith Cowan University, 270 Joondalup Drive, Joondalup, WA 6027, Australia 15
*Corresponding author: Ph.: +39 0783 22002, E-mail: [email protected] 16
17
Please find the published version of this manuscript in Oikos: 18
http://dx.doi.org/10.1111/oik.01382 19
20
21
2
Abstract 22
Structural complexity strongly influences the outcome of predator-prey interactions in benthic 23
marine communities affecting both prey concealment and predator hunting efficacy. How habitat 24
structure interacts with species-specific differences in predatory style and antipredatory strategies 25
may therefore be critical in determining higher trophic functions. We examined the role of 26
structural complexity in mediating predator-prey interactions across macrophyte habitats 27
encompassing different levels of structural complexity in three different bioregions: Western 28
Mediterranean Sea (WMS), Eastern Indian Ocean (EIO) and Northern Gulf of Mexico (NGM). 29
Using sea urchins as model prey, we measured survival rates of small (juveniles) and medium 30
(young adults) size classes in different habitat zones: within the macrophyte habitat, along the 31
edge and in bare sandy spaces. At each site we also measured structural variables and predator 32
abundance. Generalised linear models identified biomass and predatory fish abundance as the 33
main determinants of predation intensity but the efficiency of predation was also influenced by 34
urchin size class. Interestingly though, the direction of structure-mediated effects on predation 35
risk was markedly different between habitats and bioregions. In WMS and NGM, where 36
predation by roving fish was relatively high, structure served as a critical prey refuge, particularly 37
for juvenile urchins. In contrast, in EIO, where roving fish predation was low, predation was 38
generally higher inside structurally complex environments where sea stars were responsible for 39
much of the predation. Larger prey were generally less affected by predation in all habitats, 40
probably due to the absence of large predators. Overall, our results indicate that, while the 41
structural complexity of habitats is critical in mediating predator-prey interactions, the direction 42
of this mediation is strongly influenced by differences in predator composition. Whether the 43
regional pool of predators is dominated by visual roving species or chemotactic benthic predators 44
may determine if structure dampens or enhances the influence of top-down control in marine 45
macrophyte communities. 46
3
Key words: bottom predators, fish predators, seagrass, sea urchin, structure, top-down control. 47
Introduction 48
As a key ecological driver, predation strongly influences community structure and 49
ecosystem processes (Menge 2000). Besides controlling direct trophic pathways, the presence of 50
predators in a system can also influence other species interactions and have cascading effects to 51
lower trophic groups, with far-ranging consequences for the overall functioning of the ecosystem 52
(Schmitz, Krivan and Ovadia 2004). However, the ability of predators to influence ecosystem 53
structuring is far from universal, and in many ecosystems, predation plays a relatively small role 54
(Matson and Hunter 1992). Several factors contribute to explaining the importance of predation 55
within a community, including predatory guild composition within a region, habitat structural 56
complexity or site-specific predatory strategies. 57
The ability of predators to control ecosystem processes is strongly mediated by the 58
architectural or structural complexity of habitats, which can, paradoxically, work both to enhance or 59
reduce predation, depending on the circumstance (Bartholomew, Diaz and Cicchetti 2000). 60
Specifically structure can significantly lower predation risk when it serves as a refuge for prey 61
(Masahiro, N, Y, M, Y, F and M 2013) but can also increase susceptibility to predators that use 62
structure for ambush or camouflage (Hoese, Law, Rao and Herberstein 2006, Rawlins 2011). 63
Therefore, the value of aquatic macrophyte ecosystem as a refuge is strongly dependent on the 64
relationship between vegetation density and the predator-prey community that inhabits it 65
(Manatunge, Asaeda and Priyadarshana 2000, Scheinin, Scyphers, Kauppi, Heck and Mattila 2012). 66
Whether structure facilitates or dampens the strength of predation pressure in ecosystems is heavily 67
dependent on the dominant predatory strategies employed by the carnivore guild. Predators that 68
depend on vision and speed in sighting and capturing their prey are often seriously disadvantaged 69
by habitat complexity (Crowder and Cooper 1982, McGinley, J.E. and Weis 2009). This is because 70
4
highly structured environments do not only significantly reduce a visual predator’s hunting 71
efficiency (Duffy and Hay 2001), but also provide plenty of shelter for prey species (Gotceitas and 72
Colgan 1989). In contrast, predators that use cryptic sit-and-wait or sit-and-pursue strategies 73
perform much better in structurally complex environments (Preisser, Orrock and Schmitz 2007). 74
Because of these differential evolutionary strategies, the composition of the predator guild can make 75
all the difference to the strength and type of predation occurring within an ecosystem, depending on 76
whether the dominant predators benefit from, or are hampered by, increasing habitat complexity. 77
Terrestrial and aquatic systems differ considerably in the generation times of their principal 78
primary producers which potentially explain why aquatic systems are generally more strongly 79
influenced by top-down processes than terrestrial systems (Shurin, Gruner and Hillebrand 2006). 80
This has served to make them ideal model systems to test the influence of predatory processes on 81
community organization (Orth, Heck and van Montfrans 1984) . In these systems, as on land, 82
predator composition is determined by a suite of interacting forces operating at different scales, 83
from local habitat-specific resource availability and, inter-specific competitive interactions, to larger 84
scale variations in juvenile recruitment, population dynamics and migration (Connolly and 85
Roughgarden 1999). In addition, variations at biogeographic scales arising from historical 86
distribution patterns and evolutionary history can also strongly influence predator guilds and 87
predator-prey interactions (Jackson, Kirby, Berger, Bjorndal, Botsford, Bourque, Bradbury, Cooke, 88
Erlandson, Estes, Hughes, Kidwell, Lange, Lenihan, Pandolfi, Peterson, Steneck, Tegner and 89
Warner 2001). These affect the ability to predict the importance of predation at a particular location. 90
In this study, we examined the importance of habitat and biogeographic differences in 91
predatory guilds in modifying structure-mediated predation patterns across a range of macrophyte 92
habitats. Apart from being among the most productive nearshore communities in temperate and 93
subtropical seas, macrophyte habitats encompass widely different levels of structural complexity, 94
from thin filamentous algae to large vertical expansions. We quantified structure-mediated 95

5
predation patterns in eleven macrophyte habitats distributed across three ocean basins (Indian 96
Ocean, Mediterranean Sea and Gulf of Mexico), representing a range of structural types with widely 97
varying predator communities. Predation risk was estimated inside the habitat, in the edge and 98
outside. Generally the edges are less structurally complex than the inner zones allowing greater 99
possibilities of movement for example for predatory fish (Gorman, Gregory and Schneider 2009), 100
but it can still provide a certain degree of habitat influence on predation with respect to the sandy 101
areas totally exposed. 102
We used a test on thetering sea urchin to evaluate the proportion of roving and habitat-103
associated predation at every zone (Fig.1). To determine if predation patterns were mediated by 104
prey size, we quantified predation rates on small and medium size classes of sea urchins. At each 105
location we measured biomass and canopy heights to estimate habitat complexity (Orth, Heck and 106
van Montfrans 1984) and predator abundance to determine the relative importance of macrophyte 107
habitat structure and regional predatory guild composition in determining the strength of predation 108
across these three distinct biogeographic areas. 109
110
Materials and methods 111
We used the survival ratio of the most common species of sea urchin in each region (see below) as 112
model prey, using tethering techniques to quantify prey survival. We used both small (juveniles) 113
and medium (young adults) size classes of urchins as prey, since they are the most vulnerable to 114
predators, whereas larger adult urchins are rarely preyed on by extant predator communities 115
(Guidetti 2004, Sala 1997). In order to expose urchins to different conditions of structure and 116
predator complexes, we estimated survival ratios in three treatments: (i) prey placed within 117
vegetated habitat (structure present, habitat-associated predators and roving predatory fish present); 118
(ii) prey placed at the edge of vegetated habitat (no structure, habitat-associated predators and 119

6
roving predatory fish present); and (iii) prey placed in sandy open space away from vegetated 120
habitats (no structure and no habitat-associated predators, roving predatory fish present; Fig. 1). 121
Thus, predation assays were designed to estimatethe influence of habitat structure on predation 122
while still exposing model prey to specific habitat-associated predators, using habitat edges and 123
nearby sandy open spaces as proxies of predation processes that occur independent of structure 124
(Smith, Hindell, Jenkins and Connolly 2010). 125
126
1. Study area and study design 127
This study took place in the Western Mediterranean Sea (Catalonia; Spain), Eastern Indian 128
Ocean (Perth; Western Australia) and Northern Gulf of Mexico (Florida; United States) (see 129
Appendix 1 for geographical references). In each region, we selected a range of dominant and 130
representative macrophyte habitats with varying levels of structural complexity (see below), and 131
performed urchin predation assays at two replicate locations for each habitat (site A and B) except 132
for the Northern Gulf of Mexico, where predation was measured in only one location (site A). For 133
this reason, we restrict our comparisons to the Western Mediterranean Sea and the Eastern Indian 134
Ocean, and use observations from the Northern Gulf of Mexico to supplement and reinforce our 135
principal results. 136
1.1. Western Mediterranean Sea (WMS). Predation assays and surveys were carried out in two 137
locations 4 km apart along the Costa Brava (Spain): “Site A” (Fenals) and “Site B” (Canyelles). We 138
tested the survival ratio of small (less than 3 cm test diameter, TD) and medium (3 to 5 cm TD) 139
sized Paracentrotus lividus (Lamarck) that approximately can reach up to 7 cm diameter 140
(Boudouresque and Verlaque 2001) in four of the most representative macrophyte habitats of the 141
region between 5-10m depth. In the WMS, these comprised two types of seagrass meadows, 142
Posidonia oceanica (L.) Delile and Cymodocea nodosa (Ucria) Asch., and two algae assemblages, 143
namely: ‘turf-forming algae’, consisting of brushy and sparsely-branched, small filamentous algae 144
7
(e.g. Cladophoraceae, Rhodomelaceae), and ‘erect algae’, consisting of erect algal growth forms 145
such as Dictyotaceae and Stypocaulaceae (Ballesteros 1992, Sala, Ballesteros, Dendrinos, Di 146
Franco, Ferretti, Foley, Fraschetti, Friedlander, Garrabou, Güçlüsoy, Guidetti, Halpern, Hereu, 147
Karamanlidis, Kizilkaya, Macpherson, Mangialajo, Mariani, Micheli, Pais, Riser, Rosenberg, Sales, 148
Selkoe, Starr, Tomas and Zabala 2012). 149
1.2. Eastern Indian Ocean (EIO). The study was performed in two locations 45km apart in 150
Perth (Western Australia): “Site A” (Marmion reef) and “Site B” (Bird Rock). We measured 151
the survival ratio of small (around 3 cm TD) and medium size (5-6 cm TD) classes of the sea 152
urchin Heliocidaris erythogramma (Valenciennes), which can reach 9 cm diameter in Australia 153
(Keesing 2007), in four of the most representative macrophyte habitats in the region at 5m 154
depth. The habitats used in EIO were: meadows of the seagrasses Posidonia sinuosa 155
Cambridge and Kuo and Amphibolis griffithii J.M. (Black) den Hartog, and two algal-156
dominated reef habitats comprising the kelp Ecklonia radiata (C.Agardh) J.Agardh and ‘turf-157
forming algae’ assemblages (e.g. Sargassaceae, Dasyaceae). 158
1.3. Northern Gulf of Mexico (NGM). The study was conducted at the T.H. Stone Memorial 159
Park in St. Joseph Bay, in the North-east Gulf of Mexico (Florida; United States). The survival 160
ratio of small (< 3 cm TD) and medium sized (3 to 3.5 cm TD) sea urchin, Lytechinus 161
variegatus (Lamarck), which can grow to 9 cm diameter (Watts, McClintock and Lawrence 162
2001), were evaluated in three representative shallow seagrass habitats (1-1.5m depth): 163
Thalassia testudinum Banks & Sol. ex K.D.Koenig, Halodule wrightii Ascherson and 164
Syringodium filiforme Kützing. 165
166
2. Habitat structure 167

8
We classified structural complexity macrophyte habitat using canopy height and shoot 168
biomass (Heck and Crowder 1991, Orth, Heck and van Montfrans 1984) without, however, 169
considering the heterogeneity of rocky substrate on which algae grow. Since it would offset the 170
comparison with habitats placed on sandy bottom, abiotic shelters, such as crevices and holes, 171
were carefully avoided when sea urchins were placed on rocky bottoms 172
2.1. Canopy height. We measured canopy height in situ for each macrophyte community as the 173
maximum height of seagrass leaves or algae thalli of 35-50 haphazardly selected areas 174
distributed within the habitat. 175
2.2. Biomass. Ten replicates of seagrass shoots and three replicates of kelp fronds were 176
randomly collected by hand. Three replicates of algae assemblages of “turf-forming” and 177
“erect” algae were randomly collected with a flat-bladed paint scraper from a 0.10 m2 quadrat. 178
All samples (except kelp, see below) were dried in an oven for 48 h at 80°C and then weighed. 179
Since individual kelp were too big to be dried and weighed whole, its biomass was estimated 180
using dry weights of equal circular-cut samples of stipe, lamina and lateral parts of the thallus, 181
which were used to estimate the dry weight of the entire kelp thallus based on known 182
proportions of these parts. The dry weights (DW) were calculated in grams per m2 and 183
multiplied by density when necessary. 184
185
3. Predator abundance 186
We classified fish and invertebrate bottom predators dependent on their mode of predation 187
in relation to habitat structure: (i) habitat-associated fish predators, with limited movements, and 188
largely restricted to the habitat, (ii) roving predatory fish that move over large areas, often moving 189
between habitats, and (iii) habitat-associated bottom predators (cryptic invertebrate predators), such 190
as crustaceans, molluscs and sea stars. At each habitat, we measured the abundance of habitat-191

9
associated bottom predators and predatory fish (e.g. species of Labridae, Sparidae or Muricidae). 192
Large size classes of roving predatory fish, such as Sparus Aurata in the Mediterranean Sea, are 193
characterized by a very high mobility and they usually are very difficult to count using standard 194
underwater visual census techniques especially outside Marine Protected Areas. Scuba divers 195
estimated the abundance of predators using five replicate underwater visual transects (25x2m) as a 196
modified version of the methodology used in García-Rubies (1997). 197
Transects were conducted for each habitat independently, with the exception of turf-forming 198
and erect algae in the Western Mediterranean Sea (or turf and kelp in the case of Eastern Indian 199
Ocean) since they were interspersed within a rocky matrix. Visual transects were conducted along 200
the inside and the edge zones of habitats. 201
We could not conduct visual censuses for habitat-associated fish predators in the Northern Gulf of 202
Mexico, and, as a result fish data from this region were treated as absent from the statistical 203
analysis. 204
205
4. Survival ratio 206
The experiments were carried out during the summer in each region, when predator 207
activity is generally highest (Heck and Valentine 1995, Sala and Zabala 1996, Vanderklift, 208
How, Wernberg, MacArthur, Heck and Valentine 2007). Sea urchins were collected from rocky 209
reefs near the study sites using SCUBA. Ten individual sea urchins per size class (small and 210
medium) were marked by tethering (Aronson and Heck 1995, Ebert 1965, McClanahan 1998) 211
and placed randomly inside the habitat (inside, n=10 per size class and habitat), at the edge of 212
the habitat (edge, n=10 per size class and habitat) and on bare sandy spaces (sand, n=10 per 213
size class). Urchins were tied with a fishing line to metal pegs firmly fixed to soft substrates or 214
attached to pieces of concrete brick on rocky substrates. In all cases, sea urchins were able to 215

10
move within a range approximately of 0.5m2 to seek shelter, but they could not get out of the 216
effect of the zone conditions to which they were exposed. After the experiment was set up, we 217
checked urchin survival every day. We considered that predation had occurred if we found the 218
monofilament intact but without the urchin, if some urchin skeletal remains were found or 219
when the Aristotle's lantern membrane was removed (Guidetti 2004, Sala 1997). All samples 220
that had the nylon line broken or absent were excluded (this occurred in very few cases). The 221
experiment was stopped when a minimum of 50% of individuals were consumed in at least one 222
of the habitats being observed. As a result, the time of estimation of predation between 223
bioregions was not equal and was determined based on local predation activity. Although this 224
manipulative technique has associated artefacts such as reduced escape capacity or chemical 225
attraction to pierced prey (Curran and Able 1998) that might affect absolute estimates, it 226
allowed for a uniform comparison of relative predation risk between locations and structural 227
complexities (Farina, Tomas, Prado, Romero and Alcoverro 2009, Pagès, Farina, Gera, Arthur, 228
Romero and Alcoverro 2012). 229
230
5. Data analysis 231
For each bioregion, we ranked habitats based on their structural complexity from the lowest 232
to the highest biomass in grams of dry weight per square metre (g DWm-2) and canopy height (cm). 233
We estimated survival as the ratio between the number of days an individual urchin survived and 234
the total days of the experiment, expressed on a scale from 0 to 1. A linear regression model was 235
carried out to determine the importance of the predictor variables biomass, canopy height, density 236
of habitat-associated predators (fish and bottom predators) and the size class of prey in influencing 237
survival ratio inside each habitat. In order to compare predation patterns at the bioregional scale, we 238
calculated average urchin survival ratio inside, at the edge and outsidehabitats. We selected the 239
zones with a gradually decreasing of structure influencing predator-prey interactions and one is 240

11
totally exposed. The inner zones reflect the highest influence of the habitat structure, while the edge 241
zones, taken outside but very close the vegetation, are only under the influence of the canopy 242
shadow (Gorman, Gregory and Schneider 2009). Finally the outside zones do not receive any 243
influence of the structure, but it allows to measure the potential pressure of roving predatory fish in 244
the area. 245
We compared differences among zones with a nonparametric Mann-Whitney U-Test and we 246
represented it in boxplots. We also generated cumulative survival curves to identify potential 247
patterns at the habitat scale. To do this we compared survival curves between “inside habitat” and 248
“habitat edge” on a daily basis (Kaplan-Meier estimation of censored survival data); differences 249
over the time of experiments were tested with the nonparametric Coxph-test and they were 250
summarized in boxplots. All analyses were performed using R software (R Development Core 251
Team 2010). 252
253
Results 254
Habitat structure 255
We used canopy height values measured at each location to classify habitats based on their 256
complexity. As expected, canopy height was highest in Posidonia spp. (average values of 257
36.21±2.32 cm in Western Mediterranean Sea and 40.60±1.71 cm in Eastern Indian Ocean) and 258
kelp forests (average value of 47.83±2.51cm) and lowest in turf algae (average value of 1.83±0.15 259
cm in WMS and 6.9±0.5 cm in EIO; see Fig. 2a). 260
However, biomass was highest in the macrophyte communities dominated by erect algae and 261
Posidonia oceanica in the WMS (1448.96±57.12 and 998.2±7.79 g DWm2 respectively), and by 262
kelp forests and turf algae in EIO (977.775±13.84 and 870 ± 360.75 g DWm2 respectively), while 263

12
some of the smaller seagrasses had very low biomass values (e.g. Cymodocea nodosa 56.73±1.655 264
g DWm2; see Fig.2b). 265
Predator abundance 266
Visual census estimation of predator composition and abundance showed large 267
differences between regions and habitats (Fig.3). In the WMS, P. oceanica, turf and erect algae 268
assemblages had a high density of habitat-associated predatory fish such as Coris julis 269
(Linnaeus) (e.g. 11 ±2.2 ind/50m2), Diplodus vulgaris (Forster) (4.7 ±0.3 ind/50m2) and 270
Diplodus sargus (Linnaeus) (1.9 ±1.1 ind/50m2). In contrast, bottom predator abundance was 271
lower and we found 0.9 ±0.5 ind/50m2 of bottom predatory snails Hexaplex trunculus 272
(Linnaeus) in P. oceanica and 0.5 ±0.1 ind/50m2 in turf and erect algae, while none of these 273
known predator species were found in C. nodosa (Fig.3a). 274
In the EIO, we estimated very high densities of habitat-associated bottom predators. The 275
common carnivorous sea star Patiriella brevispina (Clark) was found in Posidonia sinuosa and 276
Amphibolis griffithii at average densities of 26.6 ±6.1 and 36.6 ±6.14 ind/50m2, respectively. 277
We also detected the large sea star Coscinasterias calamaria (0.1± 0.1 ind/50m2 in seagrasses 278
and 0.2 ±0.1 ind/50m2 in algae habitats), as well as a few unidentified species of habitat-279
associated predatory fish in kelp and turf-forming algae on rocky bottoms (Fig.3b). 280
Finally, in the NGM we found the lowest densities of predators. The crab Libinia 281
emarginata (Hinsch) and the predatory snail Fasciolaria tulipa (Linnaeus) were detected in 282
Thalassia testudium (0.8 ±0.4 and 0.4 ±0.2 ind/50m2 respectively), and the crab Callinectes 283
sapidus was found in Syringodium filiforme (0.2 ±0.2 ind/50m2; Fig.3c). Roving predatory fish 284
and habitat-associated predatory fish were not estimated at this location (see methods). 285
Survival ratio 286

13
The linear model identified macrophyte biomass and predatory fish abundance as the most 287
important factors explaining overall urchin survival ratio (p=0.018; R2=0.33), but size class of prey 288
influenced predator efficiency almost significantly (p=0.051;see Appendix 2 for the full linear 289
model Table). In the model, that included only explanatory variables relevant to the habitats 290
(biomass, canopy height), size class of prey and predator composition (habitat-associated predatory 291
fish and habitat-associated bottom predators), an important part of the variance associated with the 292
survival ratio was still unexplained. In fact, when introducing bioregions and habitats as factors 293
additional important differences emerged. On the whole, sea urchin predation generally differed 294
significantly among the three habitat zones (inside, on the edge and outside macrophyte habitats), 295
but with contrasting patterns observed in the three bioregions (Fig.4 supported by Appendix 3). In 296
the WMS and the NGM, survival ratio of the juveniles was significantly lower outside and at the 297
edge of habitats than inside habitats. For example, in WMS an average of 30% of urchins survived 298
inside habitats, while at the edge and outside only 10% did. The opposite trend was observed in EIO 299
where, for both juveniles and young adults sea urchins, survival was higher outside the habitat (70 300
and 100%, respectively) than at the edge (10% and 40%, respectively) or inside the habitat (10% 301
and 60%, respectively). In the WMS, there was no difference in survival ratio among habitat zones 302
(inside-edge-outside) in medium sizes that generally survived better than small sizes in all habitats 303
(Fig.4). In the NGM, survival of the medium size class mirrored the effects on smaller urchins, i.e. 304
survival was highest inside (100%) compared with the edge or outside habitats (~75%). 305
At the habitat scale (Fig.5 supported by Appendix 4), we found that the survival of juveniles 306
sea urchins in WMS was significantly higher inside than at the edge of all habitats with the 307
exception of turf assemblages, where there was no difference. In contrast, for the young adults, 308
urchin survival was not significantly different in any of the habitats. In EIO, differences in survival 309
trends between inside and the edge of habitats were not significant for either small or medium sizes 310
of sea urchins, with the exception of A. griffithii, where values were higher at the edge of habitats. 311

14
The trends in urchin survival ratio in NGM for the two size classes of prey were significantly higher 312
inside the habitat than at the edge. 313
314
Discussion 315
While habitat structure (biogenic or otherwise) is clearly an important agent 316
determining predation risk, our results suggest that it is strongly dependent on regional 317
predator pools, which can drive predation risk in habitats with very similar structure in 318
completely opposite directions, either reducing or enhancing top-down control within the 319
ecosystem. Thus, while complex macrophyte habitats serve as an effective shelter from 320
predation in the Western Mediterranean Sea, where roving or habitat-associated fish are the 321
dominant predators, highly structured macrophytes constitute dangerous habitats for prey in 322
the Eastern Indian Ocean due to the abundance of bottom predators. Although not replicated 323
fully, the Northern Gulf of Mexico showed similar trends as the Mediterranean, with 324
macrophyte habitats providing efficient shelters from roving predatory fish, and urchins being 325
safer inside rather than on the edge or outside macrophyte habitats. 326
The large variations in growth form and spatial configurations of dominant plant 327
species are often a significant contributor to habitat structure in vegetated habitats (Crowder 328
and Cooper 1982, Madsen, Chambers, James, Koch and Westlake 2001). Within the same 329
bioregion, the macrophyte communities in our study encompassed a range of biogenic 330
structures and complexity with varying biomass and canopy heights that differ considerably in 331
their refuge value for prey. The model indicates that structural complexity was an adequate 332
predictor of prey survival across all bioregions (Fig.5). In areas like the Mediterranean Sea 333
and the Gulf of Mexico, complex habitats offered far better refuge for prey, particularly for 334
smaller size classes. In fact, when roving and habitat-associated fish are the dominant 335
predators (as in the WMS), increasing structural complexity can strongly reduce predation 336
15
risk. Highly structured habitats like P. oceanica and erect algae constitute a much safer 337
refuge for juvenile urchins than turf algae. In the WMS, C.nodosa is an exception to this 338
general trend and may be driven more by the configuration of the landscape, which has been 339
observed to strongly influence predation depending on the spatial attributes of the habitats and 340
the surrounding matrix within which it is housed (Farina et al. unpublished). Meadows of C. 341
nodosa in the WMS typically grow close to the coast, are very isolated from other macrophyte 342
communities, and house very low densities of habitat-associated fish (Guidetti and Bussotti 343
2000), which combined, potentially explain the relatively high urchin survival here despite its 344
structure. 345
In contrast with the WMS, structurally complex habitats offered very little refuge for 346
small sea urchins in the Eastern Indian Ocean. Survival rates were lower in EIO where bottom 347
predators were more abundant than fish. Strikingly different from that observed in holder 348
experiments (Keough and Butler 1979), bottom predators like Patiriella brevispina feed 349
inside structurally complex environments and were found inside Amphibolis griffithii, 350
Posidonia sinuosa as well as turf habitats. It is likely that these bottom species are the 351
dominant predators of juvenile urchins in the EIO, and their presence inside structurally 352
complex habitats makes dense macrophyte stands very dangerous for small size classes of 353
urchins. 354
Interestingly, our results indicate that predation on large adult urchins was generally 355
low across all habitats and bioregions. Habitat structure did not constitute a refuge for larger 356
urchin size classes, as they were visible to predators in even the most structured habitats. 357
However, as observed elsewhere, adult urchins probably do not need to rely on structural 358
complexity, their size itself being refuge enough, with few sufficiently large extant visual 359
predators able to prey on them, even within Marine Protected Areas (Guidetti 2004). This was 360
particularly important because predation on small sizes was very high across all three 361

16
bioregions, indicating that survival of juveniles may be a critical bottleneck shaping urchin 362
population structure. 363
Our results show that habitat structure can work both ways in mediating predator-364
prey interactions, either by reducing or enhancing top-down control. The effect is largely a 365
function of predator identity, which determines whether habitat complexity serves as a major 366
restriction that prevents effective hunting (through refuge) or enhances predation by providing 367
a camouflage or hiding space for predators (Bartholomew, Diaz and Cicchetti 2000). This 368
dual mediatory role results in a dynamic arms race among predators capable of exploiting 369
habitats of different structural characteristics within the ecosystem mosaic. Predators in our 370
large-scale study spanned a spectrum of predatory strategies (visual hunt, camouflage, 371
ambush and chemotaxis). Evolutionary and behavioral predispositions enable species that rely 372
on acute visual senses and speed to perform much better over large, relatively open expanses 373
(Canion and Heck 2009). In contrast, species that rely more on camouflage, ambush or 374
chemotaxis (James and Heck 1994) may be much more effective in the dense undergrowth 375
provided by structurally complex macrophyte communities (Martin, Fodrie, Heck and Mattila 376
2010). A clear example of these two strategies is evident by comparing the seagrasses 377
Posidonia oceanica in the WMS with Amphibolis griffithii in EIO; both have very similar 378
canopy height and biomass (Fig.2), but have very different types of predators. Although A. 379
griffithii has a structure characterized by tree-like fronds and an open space below its canopy 380
that may facilitate access for medium-sized fish (Hyndes, Kendrick, MacArthur and Stewart 381
2003), predation signs found on urchin prey tests in our study were typically made by sea 382
stars. In contrast, most predation signs in P. oceanica could be clearly assigned to fish that 383
most likely hunted visually. This reflects, the dominant predator groups observed in the two 384
regions (Fig. 3). These compositional differences appear to be critical in determining survival 385
ratios in the community with P. oceanica being one of the safest habitats for urchins in the 386
17
WMS, while A. griffithii, despite having a similar canopy height and biomass, is one of the 387
most predation-prone habitats we observed in the EIO.Our observed trends are most likely 388
driven by compositional differences in predators among habitats. In our study, predation 389
inside the habitat structure in the WMS and NGM was almost always lower than predation at 390
the edges and in the sand indicating that fish predators clearly dominated the predatory pool. 391
At least in the Mediterranean, this trend was also confirmed by our in-water surveys that 392
showed fish predators were by far the most dominant in this system compared with bottom 393
predators. This supports the observation that fish predators may be the main consumers of sea 394
urchins in macroalgal and seagrass communities in the Mediterranean (Sala 1997). In striking 395
contrast, predation inside and at the edge of the habitats tended to be higher when compared 396
to sand predation in EIO (Fig.4), a pattern that holds in almost every habitat from simple turf 397
forming algae to the more complex kelp E. radiata (Appendix 4). This was also related to the 398
predator guild composition that, in this region, was characterized by a high density of bottom 399
predators which can move up inside the structure to the edge (Fig.3). In fact, seagrass 400
meadows had very high densities of sea stars while fish predators were practically absent. 401
These observations conform with similar results by Vanderklift, How, Wernberg, MacArthur, 402
Heck and Valentine (2007) and Tuya, Vanderklift, Hyndes, Wernberg, Thomsen and Hanson 403
(2010), which indicate that fish were restricted to habitats close to rocky reefs and roving fish 404
predators were very rare in the area. 405
While natural differences in predator composition between habitats may play a large 406
role in determining predation rates, we cannot discount directed human harvest as an agent 407
influencing differences in predator composition. All of our studied habitats have been subject 408
to sustained fishing pressure (Halpern, Walbridge, Selkoe, Kappel, Micheli, D'Agrosa, Bruno, 409
Casey, Ebert, Fox, Fujita, Heinemann, Lenihan, Madin, Perry, Selig, Spalding, Steneck and 410
Watson 2008). As top predatory fish are selectively removed from coastal waters, there is an 411

18
increasing simplification of trophic webs that can have major modifications on the predator 412
pool in any given region (Jackson, Kirby, Berger, Bjorndal, Botsford, Bourque, Bradbury, 413
Cooke, Erlandson, Estes, Hughes, Kidwell, Lange, Lenihan, Pandolfi, Peterson, Steneck, 414
Tegner and Warner 2001). In extreme cases, the removal of top predators can lead to meso-415
predator release (for instance, invertebrate predators), which could dramatically modify the 416
structure-predation relationship and change the landscape of risk that prey species experience 417
in these regions (Oksanen, Fretwell, Arruda and Niemela 1981). 418
When the prey concerned are themselves key functional elements in the ecosystem, 419
as sea urchins often are in macrophyte communities (Alcoverro and Mariani 2002, Woodley 420
1999), these distributional differences in the predatory pool can have vital consequences for 421
the functioning of the system. Modifications of predator guilds of sea urchins can affect the 422
abundance and distribution of these species, and their effects may cascade and affect other 423
ecosystem processes (top-down control). For instance, the sea urchin P. lividus we used in this 424
study is among one of the most important herbivores in the Mediterranean (Hereu, Zabala, 425
Linares and Sala 2005, Prado, Tomas, Pinna, Farina, Roca, Ceccherelli, Romero and 426
Alcoverro 2012) and has often been observed to overgraze macrophyte communities when 427
released from predation (Boudouresque and Verlaque 2001). In contrast, sea urchins are 428
relatively rare in the Australian macrophyte communities we studied (Vanderklift and 429
Kendrick 2004) and may be functionally less important to ecosystem structure. Of course, 430
their low numbers may, at least in part, be influenced by the high levels of predation observed 431
inside Australian macrophyte communities. Consequently, in areas that are controlled by 432
roving and habitat-associated predatory fish (i.e. Mediterranean and Gulf of México), a much 433
higher impact of overfishing is expected in macrophyte communities. In contrast, in areas 434
where the main predators are bottom invertebrate predators (i.e. Australia), the impact of 435
overfishing may not manifest so directly, although it may still appear through indirect 436

19
pathways. These differences make it difficult to generalize about the nature of habitat 437
structure-predation relationship across regions and local contexts. To fully understand and 438
manage ecosystem function, it is therefore crucial to determine the main types of predators 439
(fish versus invertebrate) dominant in each habitat, as structure can strongly modify 440
ecosystem function. Whether it enhances or limits predation is contingent completely on the 441
predatory pool, and may imply potentially very different habitat-specific management 442
directions. 443
444
445
446
447
448
Acknowledgements 449
This research was carried out thanks to the collaboration of CEAB-CSIC and University of 450
Barcelona (Catalonia, Spain) with Edith Cowan University (Perth, Western Australia, 451
Australia) and Dauphin Island Sea Lab (Alabama, United States). We thank A. Gera, G. Roca, 452
R. Czarnik, C. Willison and P. Kiss for their help with field work. This research has been 453
funded by the Spanish Ministry of Science and Innovation (projects CTM2010-22273-C02-01 454
and 02). The Spanish Ministry of Education supported JP (scholarship AP2008). 455
456
457
20
LITERATURE CITED 458
Alcoverro, T. and Mariani, S. 2002. Effects of sea urchin grazing on seagrass (Thalassodendron 459 ciliatum) beds of a Kenyan lagoon. - Marine Ecology-Progress Series 226: 255-263. 460 Aronson, R. B. and Heck, K. L. 1995. Tethering experiments and hypothesis: testing in ecology. - 461 Marine Ecology-Progress Series 121: 307-309. 462 Ballesteros, E. 1992. Els vegetals i la zonació litoral: espècies, comunitats i factors que influeixen 463 en la seva distribució. - Enric Ballesteros i Sagarra. 464 Bartholomew, A., et al. 2000. New dimensionless indices of structural habitat complexity: predicted 465 and actual effects on a predator's foraging success. - Marine Ecology-Progress Series 206: 45-58. 466 Boudouresque, C. F. and Verlaque, M. 2001. Ecology of Paracentrotus lividus. - In: John, M. L. 467 (ed.) Developments in Aquaculture and Fisheries Science. Elsevier, pp. 177-216. 468 Canion, C. R. and Heck, K. L. 2009. Effect of habitat complexity on predation success: re-469 evaluating the current paradigm in seagrass beds. - Marine Ecology-Progress Series 393: 37-46. 470 Connolly, S. R. and Roughgarden, J. 1999. Theory of marine communities: competition, predation, 471 and recruitment dependent interaction strength -Ecological Monographs 69: 277-296. 472 Crowder, L. B. and Cooper, W. E. 1982. Habitat structural complexity and the interaction between 473 bluegills and their prey -Ecology 63: 1802-1813. 474 Curran, M. C. and Able, K. W. 1998. The value of tethering fishes (winter flounder and tautog) as a 475 tool for assessing predation rates. - Marine Ecology Progress Series 163: 45-51. 476 Duffy, J. E. and Hay, M. E. 2001. The ecology and evolution of marine consumer-prey interactions. 477 -. 478 Ebert, T. A. 1965. A technique for the individual marking of sea urchins. - Ecology 46. 479 Farina, S., et al. 2009. Seagrass meadow structure alters interactions between the sea urchin 480 Paracentrotus lividus and its predators. - Marine Ecology-Progress Series 377: 131-137. 481 García-Rubies, A. 1997. Estudi ecològic de les poblacions de peixos litorals sobre substrat rocos a 482 la Mediterrània Occidental: efecte de la fondaria, el substrat, l'estacionalitat i la proteccion. - 483 Universitat de Barcelona, Barcelona. 484 Gorman, A. M., et al. 2009. Eelgrass patch size and proximity to the patch edge affect predation 485 risk of recently settled age 0 cod (Gadus). - Journal of Experimental Marine Biology and Ecology 486 371: 1-9. 487 Gotceitas, V. and Colgan, P. 1989. Predator foraging success and habitat complexity: quantitative 488 test of the threshold hypothesis. - Oecologia 80: 158-166. 489 Guidetti, P. 2004. Consumers of sea urchins, Paracentrotus lividus and Arbacia lixula, in shallow 490 Mediterranean rocky reefs. - Helgoland Marine Research 58: 110-116. 491 Guidetti, P. and Bussotti, S. 2000. Fish fauna of a mixed meadow composed by the seagrasses 492 Cymodocea nodosa and Zostera noltii in the Western Mediterranean. - Oceanologica Acta 23: 759-493 770. 494 Halpern, B. S., et al. 2008. A Global Map of Human Impact on Marine Ecosystems. - Science 319: 495 948-952. 496 Heck, K. L. and Valentine, J. F. 1995. Sea-urchin herbivory, evidence for long-lasting effects in 497 subtropical seagrass meadows -Journal of Experimental Marine Biology and Ecology 189: 205-217. 498 Heck, K. L. J. and Crowder, L. B. 1991. Habitat structure and predator-prey interactions in 499 vegetated aquatic systems. - In: Bell SS, M. E., Mushinsky HR, eds. (ed.) Habitat structure: The 500 physical arrangement of objects in space. Chapman and Hall, pp. 281-299. 501 Hereu, B., et al. 2005. The effects of predator abundance and habitat structural complexity on 502 survival of juvenile sea urchins. - Marine Biology 146: 293-299. 503 Hoese, F. J., et al. 2006. Distinctive yellow bands on a sit-and-wait predator: prey attractant or 504 camouflage? - Behaviour 143: 763-781. 505

21
Hyndes, G. A., et al. 2003. Differences in the species- and size-composition of fish assemblages in 506 three distinct seagrass habitats with differing plant and meadow structure. - Marine Biology 142: 507 1195-1206. 508 Jackson, J. B. C., et al. 2001. Historical Overfishing and the Recent Collapse of Coastal 509 Ecosystems. - Science 293: 629-637. 510 James, L. P. and Heck, L. K. J. 1994. The effects of habitat complexity and light intensity on 511 ambush predation within a simulated seagrass habitat. - Journal of Experimental Marine Biology 512 and Ecology 176: 187-200. 513 Keesing, J. K. 2007. Ecology of Heliocidaris erythrogramma. - In: Lawrence JM (ed) Edible sea 514 urchins: biology and ecology. 515 Keough, M. J. and Butler, A. J. 1979. The role of asteroid predators in the organization of a sessile 516 community on pier pilings. - Marine Biology 51: 167-177. 517 Madsen, J. D., et al. 2001. The interaction between water movement, sediment dynamics and 518 submersed macrophytes. - Hydrobiologia 444: 71-84. 519 Manatunge, J., et al. 2000. The Influence of Structural Complexity on Fish–zooplankton 520 Interactions: A Study Using Artificial Submerged Macrophytes. - Environmental Biology of Fishes 521 58: 425-438. 522 Martin, C., et al. 2010. Differential habitat use and antipredator response of juvenile roach (Rutilus 523 rutilus) to olfactory and visual cues from multiple predators. - Oecologia 162: 893-902. 524 Masahiro, H., et al. 2013. Habitat preference rather than predation risk determines the distribution 525 patterns of filefish Rudarius ercodes in and around seagrass habitats. - Marine Ecology Progress 526 Series 488: 255-266. 527 Matson, P. A. and Hunter, M. D. 1992. Special Feature: The Relative Contributions to Top-Down 528 and Bottom-Up Forces in Population and Community Ecology. - Ecology 73: 723. 529 McClanahan, T. R. 1998. Predation and the distribution and abundance of tropical sea urchin 530 populations. - Journal of Experimental Marine Biology and Ecology 221: 231-255. 531 McGinley, M., et al. 2009. Predation. - In: J.S., W. (ed.) The Encyclopedia of Earth. - 532 Environmental Information Coalition, National Council for Science and the Environment. 533 Menge, B. A. 2000. Top-down and bottom-up community regulation in marine rocky intertidal 534 habitats. - Journal of Experimental Marine Biology and Ecology 250: 257-289. 535 Oksanen, L., et al. 1981. Exploitation Ecosystems in Gradients of Primary Productivity. - The 536 American Naturalist 118: 240-261. 537 Orth, R., et al. 1984. Faunal communities in seagrass beds: A review of the influence of plant 538 structure and prey characteristics on predator-prey relationships. - Estuaries and coasts 7: 339-350. 539 Pagès, J. F., et al. 2012. Indirect interactions in seagrasses: fish herbivores increase predation risk to 540 sea urchins by modifying plant traits. - Functional Ecology: n/a-n/a. 541 Prado, P., et al. 2012. Habitat and Scale Shape the Demographic Fate of the Keystone Sea Urchin 542 <italic>Paracentrotus lividus</italic> in Mediterranean Macrophyte Communities. - Plos One 7: 543 e35170. 544 Preisser, E. L., et al. 2007. Predator hunting mode and habitat domain alter nonconsumptive effects 545 in predator-prey interactions. - Ecology 88: 2744-2751. 546 Rawlins, A. D. 2011. A Note on a Camouflage Pursuit Problem. - The Quarterly Journal of 547 Mechanics and Applied Mathematics 64: 47-56. 548 Sala, E. 1997. Fish predators and scavengers of the sea urchin Paracentrotus lividus in protected 549 areas of the north-west Medieterranean Sea. - Marine Biology 129: 531-539. 550 Sala, E., et al. 2012. The Structure of Mediterranean Rocky Reef Ecosystems across Environmental 551 and Human Gradients, and Conservation Implications. - Plos One 7: e32742. 552 Sala, E. and Zabala, M. 1996. Fish predation and the structure of the sea urchin Paracentrotus 553 lividus populations in the NW Mediterranean. - Marine Ecology Progress Series 140: 71-81. 554 Scheinin, M., et al. 2012. The relationship between vegetation density and its protective value 555 depends on the densities and traits of prey and predators. - Oikos 121: 1093-1102. 556

22
Schmitz, O. J., et al. 2004. Trophic cascades: the primacy of trait-mediated ondirect interactions. - 557 Ecology letters 7: 153-163. 558 Shurin, J. B., et al. 2006. All wet or dried up? Real differences between aquatic and terrestrial food 559 webs. - Proceedings of the Royal Society B: Biological Sciences 273: 1-9. 560 Smith, T. M., et al. 2010. Seagrass patch size affects fish responses to edges. - Journal of Animal 561 Ecology 79: 275-281. 562 Tuya, F., et al. 2010. Proximity to rocky reefs alters the balance between positive and negative 563 effects on seagrass fauna. - Marine Ecology Progress Series 405: 175-186. 564 Vanderklift, M. A., et al. 2007. Proximity to reef influences density of small predatory fishes, while 565 type of seagrass influences intensity of their predation on crabs. - Marine Ecology-Progress Series 566 340: 235-243. 567 Vanderklift, M. A. and Kendrick, G. A. 2004. Variation in abundances of herbivorous invertebrates 568 in temperate subtidal rocky reef habitats. - Marine and Freshwater Research 55: 93-103. 569 Watts, S. A., et al. 2001. The ecology of Lytechinus variegatus. - In: John, M. L. (ed.) 570 Developments in Aquaculture and Fisheries Science. Elsevier, pp. 375-393. 571 Woodley, J. D. 1999. Sea-urchins exert top-down control of macroalgae on Jamaican coral reefs 572 (1). - Coral Reefs 18: 192-192. 573
574
575
576
577
578
579
580
581
582
583
584
585
586

23
Figure legends 587
588
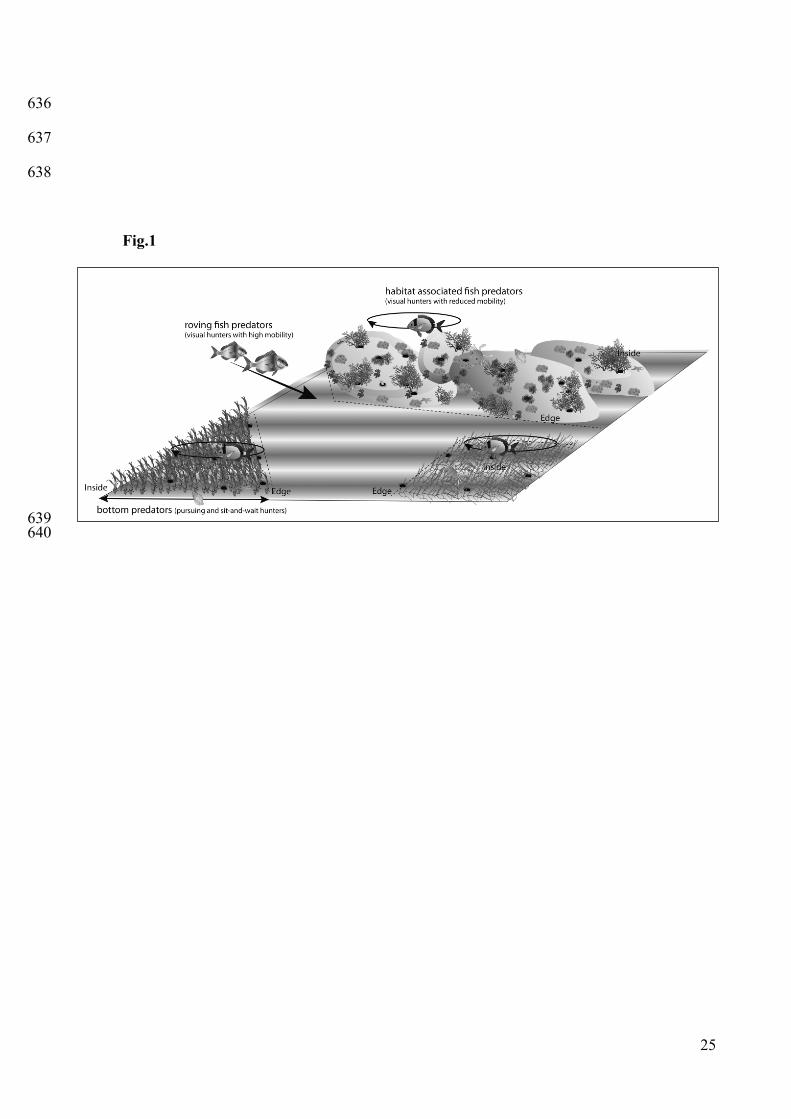
Fig.1 Diagram representing an example of a seagrass and algae assemblage mosaic and its 589
associated predator guild, including roving predatory fish , habitat-associated fish predators and 590
bottom predators. In nature sea urchins are present inside the habitats but also in the edge. The 591
innner zone may be infested by bottom predators, but in all likelihood it constitutes a barrier to fish 592
predators, which are forced to hunt visually outside the canopy. On the contrary the edge is highly 593
subjected to predatory fish, especially those that are very mobile, and the bottom predators at the 594
same time, coming from the inner of the habitat structure. 595
596
Fig.2 a) Canopy height mean (±SE) and b) biomass mean (±SE) are used to determine 597
structural complexities of turf-forming and erect algae, Cymodocea nodosa, Posidonia oceanica in 598
the Western Mediterranean Sea (WMS); turf-forming algae, Amphibolis griffithii, Posidonia 599
sinuosa, Ecklonia radiata in Eastern Indian Ocean (EIO); Halodule wrightii, Thalassia testudinum, 600
Syringodium filiforme in the Northern Gulf of Mexico (NGM). Each region’s habitats are listed in 601
increasing order of canopy height, from left to right. 602
603
Fig.3 Abundance mean (±SE) of fish predators and bottom predators in 50m2. a) Western 604
Mediterranean Sea (Cymodocea nodosa, turf-forming and erect algae assemblages, Posidonia 605
oceanica); b) Eastern Indian Ocean (Amphibolis griffithii, Posidonia sinuosa, Ecklonia radiata and 606
turf-forming algae), and c) the Northern Gulf of Mexico (Syringodium filiforme, Halodule wrightii, 607
Thalassia testudinum and). Visual census was not effective in detecting roving predatory fish 608
abundance which were underestimated, especially in the Mediterranean Sea and in the North Gulf 609
of Mexico where urchin survival was lowest outside the habitats (see Methods for details). 610

24
611
Fig.4 Boxplots (median and interquartile range) showing bioregional patterns in urchin 612
survival ratio in the three habitat zones (inside, in the edge and outside). Results were analysed with 613
the non-parametrical Mann-Whitney U-test (p-level<0.05) and significant differences were 614
represented with lower-case letters above each bar. 615
616
Fig.5 Boxplots (median and interquartile range) representing survival ratio of urchin size 617
classes inside and at the edge of each habitat: a) Western Mediterranean Sea (Cymodocea nodosa, 618
turf-forming algae, Posidonia oceanica, erect algae assemblages); b) Eastern Indian Ocean 619
(Amphibolis griffithii, Posidonia sinuosa, turf-forming algae, and Ecklonia radiata) and c) the 620
Northern Gulf of Mexico (Syringodium filiforme, Halodule wrightii, Thalassia testudinum). 621
Significant differences were estimated comparing the cumulative curves of survivorship with the 622
nonparametric Coxph-test (Appendix 4) and represented with asterisks. 623
624
625
626
627
628
629
630
631
632
633
634
635
25
636
637
638
Fig.1
639 640

26
Fig.2
641
642
643
644
645
646
647
648
649
650
651
652
653
654
655

27
Fig.3
656
657
658

28
Fig.4
659
660
661
662
663
664
665
666
667
668
669
670
671
672
673
674
675

29
676
Fig.5 677
678
679
Related Documents