Sex Differences in Cortical Thickness Mapped in 176 Healthy Individuals between 7 and 87 Years of Age Elizabeth R. Sowell 1 , Bradley S. Peterson 2 , Eric Kan 1 , Roger P. Woods 3 , June Yoshii 1 , Ravi Bansal 2 , Dongrong Xu 2 , Hongtu Zhu 2 , Paul M. Thompson 1 and Arthur W. Toga 1 1 Laboratory of Neuro Imaging, Department of Neurology, University of California, Los Angeles, CA, USA, 2 Department of Psychiatry and the New York State Psychiatric Institute, Columbia College of Physicians and Surgeons, USA and 3 Ahmanson-Lovelace Brain Mapping Center, Department of Neurology, University of California, Los Angeles School of Medicine, Los Angeles, CA, USA Findings from previous magnetic resonance imaging studies of sex differences in gray matter have been inconsistent, with some showing proportionally increased gray matter in women and some showing no differences between the sexes. Regional sex differ- ences in gray matter thickness have not yet been mapped over the entire cortical surface in a large sample of subjects spanning the age range from early childhood to old age. We applied algorithms for cortical pattern matching and techniques for measuring cortical thickness to the structural magnetic resonance images of 176 healthy individuals between the ages of 7 and 87 years. We also mapped localized differences in brain size. Maps of sex differences in cortical thickness revealed thicker cortices in women in right inferior parietal and posterior temporal regions even without correcting for total brain volume. In these regions, the cortical mantle is up to 0.45 mm thicker, on average, in women than in men. Analysis of a subset of 18 female and 18 male subjects matched for age and brain volume confirmed the significance of thicker gray matter in temporal and parietal cortices in females, independent of brain size differences. Further analyses were conducted in the adult subjects where gender differences were evaluated using height as a covariate, and similar sex differences were observed even when body size differences between the sexes were controlled. Together, these results suggest that greater cortical thickness in posterior temporal inferior parietal regions in females relative to males are independent of differences in brain or body size. Age-by-sex interactions were not significant in the temporoparietal region, suggesting that sex differences in these regions are present from at least late childhood and then are maintained throughout life. Male brains were larger than female brains in all locations, though male enlargement was most prominent in the frontal and occipital poles, bilaterally. Given the large sample and the large range of ages studied, these results help to address controversies in the study of central nervous system sexual dimorphisms. Keywords: brain size, gender, gray matter, MRI, parietal lobes, temporal lobes Introduction On average, men have larger brains than women, a sex difference that cannot be explained entirely by differences in body size (Peters and others 1998). Although brain size is highly variable across subjects, and many women have larger brains than do many men, substantial interest in sex differences in neural structures has been generated, in part, by observations of sex differences in cognitive functions (Kimura 2000). A male advantage for spatial abilities has been observed widely in humans and other animals (Jones and others 2003). This advantage may be specific to cognitive functions geared toward simultaneous or holistic processing (Halpern and Tan 2001), and it is exemplified in tasks such as mental rotation (Roberts and Bell 2000). A female advantage has been noted for verbal abilities such as verbal fluency and verbal memory (Sommer and others 2004), perhaps because these tasks require sequential processing, which is thought to afford performance advantages to women (Halpern and Tan 2001). Given the apparent specificity of differences in male and female cognitive advan- tages, and regional specificity of brain--behavior relationships, global differences in brain size between the sexes that have been readily observed with relatively gross methods might not be the most relevant structural dimorphism when investigating neural substrates of sex differences in cognition. Quantitative magnetic resonance imaging (MRI) studies of intracranial gray matter volumes have yielded inconsistent findings in adults. Some show that females actually have increased total gray matter relative to males after controlling for the overall increase in male brain size (Gur and others 1999; Goldstein and others 2001; Lemaitre and others 2005); whereas others report no sex difference in total gray matter volume in adults after controlling for brain size (Filipek and others 1994; Blatter and others 1995; Courchesne and others 2000; Good and others 2001b; Ge and others 2002); yet others show de- creased gray matter in women relative to men after brain size correction (Resnick and others 2000; Sullivan and others 2004). Regional differences in cortical volumes across the sexes have shown that women have increased gray matter (controlling for overall brain size) compared with men in frontal (Goldstein and others 2001; Gur and others 2002), parietal (Nopoulos and others 2000; Allen and others 2003), and occipital (Allen and others 2003) cortices. Studies measuring cortical thickness and gray matter density have also shown proportional local in- creases in gray matter in women, primarily in the parietal lobes (Good and others 2001a; Luders and others 2006; Narr and others 2005; Im and others 2006) and temporal lobes (Luders and others 2006; Im and others 2006). Thus, whereas a consen- sus of studies of total gray matter volume have tended to show no sex differences, the regional volumetric and gray matter distribution patterns tend to show an enlargement in females when controlling for brain size. In children, postmortem studies have shown larger brain sizes in males emerging during the first 4 or 5 years of life (Dekaban 1978), findings that have been confirmed in numerous de- velopmental imaging studies (Caviness and others 1996; Giedd and others 1997, 1999; Courchesne and others 2000; De Bellis and others 2001; Sowell, Trauner, and others 2002). Without correcting for overall brain size, some studies have reported that volumes of cortical gray matter are increased in boys relative to girls (Caviness and others 1996; Giedd and others 1999; Courchesne and others 2000), and some have shown no Cerebral Cortex July 2007;17:1550--1560 doi:10.1093/cercor/bhl066 Advance Access publication August 31, 2006 Ó The Author 2006. Published by Oxford University Press. All rights reserved. For permissions, please e-mail: [email protected] by guest on February 27, 2015 http://cercor.oxfordjournals.org/ Downloaded from

Welcome message from author
This document is posted to help you gain knowledge. Please leave a comment to let me know what you think about it! Share it to your friends and learn new things together.
Transcript

Sex Differences in Cortical ThicknessMapped in 176 Healthy Individualsbetween 7 and 87 Years of Age
Elizabeth R. Sowell1, Bradley S. Peterson2, Eric Kan1,
Roger P. Woods3, June Yoshii1, Ravi Bansal2, Dongrong Xu2,
Hongtu Zhu2, Paul M. Thompson1 and Arthur W. Toga1
1Laboratory of Neuro Imaging, Department of Neurology,
University of California, Los Angeles, CA, USA, 2Department of
Psychiatry and the New York State Psychiatric Institute,
Columbia College of Physicians and Surgeons, USA and3Ahmanson-Lovelace Brain Mapping Center, Department of
Neurology, University of California, Los Angeles School of
Medicine, Los Angeles, CA, USA
Findings from previous magnetic resonance imaging studies of sexdifferences in gray matter have been inconsistent, with someshowing proportionally increased gray matter in women and someshowing no differences between the sexes. Regional sex differ-ences in gray matter thickness have not yet been mapped over theentire cortical surface in a large sample of subjects spanning theage range from early childhood to old age. We applied algorithmsfor cortical pattern matching and techniques for measuring corticalthickness to the structural magnetic resonance images of 176healthy individuals between the ages of 7 and 87 years. We alsomapped localized differences in brain size. Maps of sex differencesin cortical thickness revealed thicker cortices in women in rightinferior parietal and posterior temporal regions even withoutcorrecting for total brain volume. In these regions, the corticalmantle is up to 0.45 mm thicker, on average, in women than in men.Analysis of a subset of 18 female and 18 male subjects matched forage and brain volume confirmed the significance of thicker graymatter in temporal and parietal cortices in females, independent ofbrain size differences. Further analyses were conducted in the adultsubjects where gender differences were evaluated using height asa covariate, and similar sex differences were observed even whenbody size differences between the sexes were controlled. Together,these results suggest that greater cortical thickness in posteriortemporal inferior parietal regions in females relative to males areindependent of differences in brain or body size. Age-by-sexinteractions were not significant in the temporoparietal region,suggesting that sex differences in these regions are present from atleast late childhood and then are maintained throughout life. Malebrains were larger than female brains in all locations, though maleenlargement was most prominent in the frontal and occipital poles,bilaterally. Given the large sample and the large range of agesstudied, these results help to address controversies in the study ofcentral nervous system sexual dimorphisms.
Keywords: brain size, gender, gray matter, MRI, parietal lobes,temporal lobes
Introduction
On average, men have larger brains than women, a sex
difference that cannot be explained entirely by differences in
body size (Peters and others 1998). Although brain size is highly
variable across subjects, and many women have larger brains
than do many men, substantial interest in sex differences in
neural structures has been generated, in part, by observations
of sex differences in cognitive functions (Kimura 2000). A
male advantage for spatial abilities has been observed widely
in humans and other animals (Jones and others 2003). This
advantage may be specific to cognitive functions geared toward
simultaneous or holistic processing (Halpern and Tan 2001),
and it is exemplified in tasks such as mental rotation (Roberts
and Bell 2000). A female advantage has been noted for verbal
abilities such as verbal fluency and verbal memory (Sommer and
others 2004), perhaps because these tasks require sequential
processing, which is thought to afford performance advantages
to women (Halpern and Tan 2001). Given the apparent
specificity of differences in male and female cognitive advan-
tages, and regional specificity of brain--behavior relationships,
global differences in brain size between the sexes that have
been readily observed with relatively gross methods might not
be the most relevant structural dimorphism when investigating
neural substrates of sex differences in cognition.
Quantitative magnetic resonance imaging (MRI) studies of
intracranial gray matter volumes have yielded inconsistent
findings in adults. Some show that females actually have
increased total gray matter relative to males after controlling
for the overall increase in male brain size (Gur and others 1999;
Goldstein and others 2001; Lemaitre and others 2005); whereas
others report no sex difference in total gray matter volume in
adults after controlling for brain size (Filipek and others 1994;
Blatter and others 1995; Courchesne and others 2000; Good
and others 2001b; Ge and others 2002); yet others show de-
creased gray matter in women relative to men after brain size
correction (Resnick and others 2000; Sullivan and others 2004).
Regional differences in cortical volumes across the sexes have
shown that women have increased gray matter (controlling
for overall brain size) compared with men in frontal (Goldstein
and others 2001; Gur and others 2002), parietal (Nopoulos and
others 2000; Allen and others 2003), and occipital (Allen and
others 2003) cortices. Studies measuring cortical thickness
and gray matter density have also shown proportional local in-
creases in gray matter in women, primarily in the parietal lobes
(Good and others 2001a; Luders and others 2006; Narr and
others 2005; Im and others 2006) and temporal lobes (Luders
and others 2006; Im and others 2006). Thus, whereas a consen-
sus of studies of total gray matter volume have tended to show
no sex differences, the regional volumetric and gray matter
distribution patterns tend to show an enlargement in females
when controlling for brain size.
In children, postmortem studies have shown larger brain sizes
in males emerging during the first 4 or 5 years of life (Dekaban
1978), findings that have been confirmed in numerous de-
velopmental imaging studies (Caviness and others 1996; Giedd
and others 1997, 1999; Courchesne and others 2000; De Bellis
and others 2001; Sowell, Trauner, and others 2002). Without
correcting for overall brain size, some studies have reported
that volumes of cortical gray matter are increased in boys
relative to girls (Caviness and others 1996; Giedd and others
1999; Courchesne and others 2000), and some have shown no
Cerebral Cortex July 2007;17:1550--1560
doi:10.1093/cercor/bhl066
Advance Access publication August 31, 2006
� The Author 2006. Published by Oxford University Press. All rights reserved.
For permissions, please e-mail: [email protected]
by guest on February 27, 2015http://cercor.oxfordjournals.org/
Dow
nloaded from
differences across sexes (De Bellis and others 2001; Sowell,
Trauner, and others 2002). Similar to findings in the adult
literature, when controlling for the enlargement of the male
brain, findings of sex differences in gray matter volume in
children have been inconsistent, with some reporting no sex
difference (De Bellis and others 2001), and some showing
enlargement in females, most prominently in the medial and
lateral temporal cortices (Sowell, Trauner, and others 2002).
Interactions between age and sex in measures of overall and
regional brain volumes are also of interest in studies of
development and aging, particularly given the robust differ-
ences between the sexes in levels of steroid hormones and in
cognitive functions that emerge across the life span. Few studies
have explicitly examined sex differences in the correlations of
gray matter volumes with age in children. One prominent study
from Giedd and others suggested that nonlinear age-related
changes in absolute volumes of gray matter may peak earlier in
girls than boys across most of the brain regions evaluated (Giedd
and others 1999), although the nonlinear (quadratic) interac-
tion of sex with age in gray matter volumes was not statistically
significant, indicating that gray matter changes with age actually
progress at similar rates in boys and girls. Similar results of
nonsignificant statistical interactions of age with sex in children
and young adults were reported by Pfefferbaum and others
(1994). Others have reported that maturation of gray matter
proceeds more rapidly in boys than in girls (De Bellis and others
2001), as evidenced by significant age-by-sex interactions.
The interactions of sex with age in studies of brain volume
have been more widely examined in adults and the elderly. As
with the studies in children, findings have been inconsistent.
Many have reported more prominent age effects on gray matter
structures in men (Coffey and others 1998; Xu and others 2000;
Raz and others 2004; Sullivan and others 2004; DeCarli and
others 2005). Raz and others have shown that sex differences
were more prominent in younger than in older adults (Raz and
others 2004), but their findings did not support the hypothesis
that the effect of aging is accelerated in men (Raz and others
1997). In a longitudinal study from the same group, no age-by-
sex interactions for cortical volumes were observed (Raz and
others 2005). Other investigators have also failed to find age-by-
sex interactions in adult and elderly populations (Salat and
others 2004; Lemaitre and others 2005). One group reported
accelerated volume loss in men in the frontal and temporal
lobes but accelerated loss in women in the parietal lobes
(Murphy and others 1996).
Differences in findings between studies may stem from
differences in the age range of the subjects evaluated. Although
sex differences in volumes of cortical gray matter have been
studied in children and adults, no study to our knowledge has
thus far investigated sex differences in cortical thickness across
the human life span from young childhood to old age. This is the
focus of the current report, in which we apply methods for
cortical pattern matching and measure cortical thickness in
a group of 176 normal individuals aged 7--87 years. Because our
methods ensure that anatomically homologous points are
matched across the entire surface of each brain hemisphere,
we were able to evaluate cortical thickness in millimeters
without scaling brain data sets into a standard template space.
To determine whether differences in cortical thickness be-
tween sexes were independent of the larger volumes of the
male brains, we also assessed differences in cortical thickness in
a subset of 18 female subjects who were closely matched,
subject by subject, to 18 male subjects for age and total brain
volume. Given our large sample size across such awide age range,
we also assessed age-by-sex interactions in cortical thickness
across the cerebrum. Generally, we expected thicker cortices in
females, given our previous findings from independent samples
using similar methods for matching cortical patterns (Luders
and others 2006; Narr and others 2005). Additionally, we inves-
tigated localized sex differences in brain size to assess regional
specificity in the male pattern of brain enlargement.
Methods
SubjectsBrain imaging data were collected from 176 normal control subjects 7--
87 years of age. Eighty-six women were studied (mean age 33.9 years,
standard deviation [SD] = 22.3; 83 were right handed) and 90 men (mean
age 31.0 years, SD = 21.3; 79 were right handed). The same subjects were
studied in our previous assessment of the age correlates of gray matter
density across the lifespan (Sowell, Peterson, and others 2003), although
sex effects were not evaluated in that prior report. All subjects were
recruited from community households randomly selected from a tele-
marketing database. Subjects were excluded from participation if they
had a history of concussion, substance abuse, or seizure disorder.
Further, subjects were thoroughly screened for neurological impair-
ments, psychiatric illness, history of learning disability, or developmental
delay using a structured diagnostic interview either administered or
reviewed by a board-certified child and adult psychiatrist (B.S.P.).
Informed consent was obtained from all subjects and for the children
from their parents as well.
MRI Scan AcquisitionAll subjects were scanned (by B.S.P.) with a single 1.5-T superconduct-
ing magnet (Signa; General Electric, Milwaukee, WI) located at Yale
University. The MRI protocol collected was a whole-brain spoiled gradi-
ent recalled acquisition in the steady state T1-weighted series collected
in the sagittal plane with repetition time = 24 ms, echo time = 5 ms,
number of excitations = 2, flip angle = 45 degrees, field of view of
30 cm, 124 slices with section thickness of 1.2 mm, and no gaps.
Image ProcessingDetails of the image analysis procedures have been described previously
(Sowell, Thompson, and others 2001, 2003; Sowell, Thompson, Mattson,
and others 2002; Sowell and others 2004; Thompson and others 2004).
Briefly, the magnetic resonance images from each individual were
analyzed with a series of manual and automated procedures that in-
cluded 1) transforming brain volumes into a standardized 3-dimensional
(3D) coordinate space (Mazziotta and others 1995) using a 12-parameter,
linear, automated image registration algorithm (Woods and others
1998); 2) Semiautomated tissue segmentation was conducted for each
volume data set to classify voxels based on signal intensity as most
representative of gray matter, white matter, or cerebrospinal fluid (CSF)
(Sowell and others 1999); 3) removing nonbrain tissue (i.e., scalp, orbits)
and cerebellum and excluding the left hemisphere from the right;
4) automatically extracting the cortical surface of each hemisphere,
which was represented as a high-resolution mesh of 131 072 trian-
gulated elements spanning 65 536 surface points in each hemisphere
(MacDonald and others 1994); 5) tracing 35 sulcal and gyral landmarks
on the lateral and interhemispheric surfaces of each hemisphere;
6) transforming image volumes back into their own native image
acquisition space by mathematically inverting the transformation that
took them into standard space (step (1) above); 7) spatially registering
with a rigid-body 6-parameter transformation all segmented images and
brain surfaces for each individual by defining 80 standardized, manually
defined anatomical landmarks (40 in each hemisphere, the first and last
points on each of 20 of the 35 sulcal lines drawn in each hemisphere)
(Sowell, Thompson, Rex, and others 2002; Sowell, Peterson, and others
2003); 8) measuring cortical thickness in millimeters averaged within
a 15-mm sphere attached to each point on the cortical surface (see
below); and 9) estimating relative local brain growth measured at each
Cerebral Cortex July 2007, V 17 N 7 1551
by guest on February 27, 2015http://cercor.oxfordjournals.org/
Dow
nloaded from
cortical surface point in each hemisphere (see below) (Sowell and
others 2004).
Image analysts (J.Y. and E.K.) who were blind to subject sex and age
traced each of 17 sulci (Sylvian fissure and central, precentral,
postcentral, superior temporal sulcus (STS) main bodies, STS ascending
branch, STS posterior branch, primary intermediate sulcus, secondary
intermediate sulcus, inferior temporal, superior frontal, inferior frontal,
intraparietal, transverse occipital, olfactory, occipitotemporal, and
collateral sulci) on the lateral brain surface in each hemisphere of
each subject’s brain. An additional set of 12 sulci were outlined on each
interhemispheric surface (callosal sulcus, inferior callosal outline,
superior rostral sulcus, inferior rostral sulcus, paracentral sulcus,
anterior, and posterior segments of the cingulate sulcus, outer segment
double parallel cingulate sulcus when present, parieto-occipital sulcus,
anterior and posterior segments of the calcarine sulcus, and the
subparietal sulcus). In addition to contouring the major sulci, a set of
6 midline landmark curves bordering the longitudinal fissure were
outlined in each hemisphere to establish hemispheric gyral limits.
Spatially registered grayscale image volumes in coronal, axial, and
sagittal planes were available simultaneously to help clarify brain
anatomy. We have developed detailed criteria for delineating the
cortical lines and for starting and stopping points for each sulcus using
brain surface atlases as references (Ono and others 1990; Duvernoy and
others 1991). These criteria have been described previously along with
reliability measures (Sowell, Thompson, Rex, and others 2002). Com-
plete details of the written anatomical protocol can be obtained from
the authors.
Gray matter thickness was calculated using the Eikonal fire equation
(Sapiro 2001; Thompson and others 2004). Although the brain image
volumes acquired for this study had voxel dimensions of approximately
1 3 1 3 1.2 mm, we supersampled the image data to create voxel
dimensions of 0.33 mm3. The 3D Eikonal equation was applied only to
voxels that segmented as gray matter, and a smoothing kernel was used
to average gray matter thickness within a 15-mm sphere at each point
on the cortical surface. This allowed us to calculate cortical thickness
for each subject with an effective resolutionmuch finer than the original
voxel size, given that the error associated with localizing anatomy on the
inner and outer cortical surfaces was averaged with the unbiased error
of all other voxels within the smoothing kernel. Points on the cortical
surfaces surrounding and between the sulcal contours drawn on each
individual’s brain surface were calculated using the averaged sulcal
contours as anchors to drive 3D cortical surface mesh models from each
subject into correspondence using fluid warping parameters described
in more detail in another report (Thompson and others 2004). This
allows the creation of average surface models and the creation of maps
of sex differences on gray matter thickness or local brain size. To map
gray matter thickness onto the surface rendering of each subject, the
coordinate for each point on the brain surface for each individual
(anatomically matched across individuals) was mapped to the same
anatomical location in their ‘‘thickness’’ volume, and the average gray
matter thickness value within the 15-mm sphere was calculated. The
average gray matter thickness value within the sphere was then doubled
to estimate the maximum thickness at each point on the cortical
surface. In a previous report, we helped to establish the validity of these
methods by showing close regional correspondence between the
cortical thickness maps created for normally developing children in
vivo (Sowell and others 2004) and for the 1929 postmortem data of Von
Economo (Von Economo 1929). In our earlier report (Sowell and others
2004), we also assessed test--retest reliability of cortical thickness
measures among individuals with 2 image volumes acquired at short
intervals and showed maximal error estimates of 0.15 mm.
Local sex differences in brain size were also assessed using the
‘‘distance from the center of the hemisphere’’ (DFC-H) measure (Sowell
and others 2004). DFC-H is a measure of radial expansion calculated in
millimeters for the distance from the group average center of mass
within each hemisphere (in the nonscaled image data) to each of the 65
536 matched hemisphere surface points in each individual.
Statistical AnalysesAfter the basic preprocessing steps were conducted for each individual,
total brain volume, total gray matter volume, total white matter volume,
and total CSF volume were calculated for each individual from the
segmented volumes. Statistical significance of sex differences in the
total volumes was assessed with t-tests.
Statistical maps of differences between sexes were created for gray
matter thickness and DFC-H for the entire sample. In these analyses, the
correlation (Pearson’s r) between group membership (i.e., male or
female) and gray matter thickness or DFC-H at each point on the brain
surface was calculated for the comparison of males with females. A
significance threshold of P = 0.05 was used to illustrate local changes in
gray matter thickness or DFC-H at each point on the cortical surface.
Statistical maps were also generated to evaluate age-by-sex interac-
tions and the effects of sex when body height was statistically
controlled. To evaluate the age-by-sex interaction, analysis of variance
was used to compare a full model, which included sex-by-age and sex-
by-age2 interactions, with a reduced model that did not include these
interactions. The main effects of sex, age, and age2 were included in
both of these linear models. F-ratios were computed at each point on
the cortical surface and were converted to uncorrected P values. An
uncorrected threshold of P = 0.05 was used to illustrate the regions
where interactions between sex and one or both of the age terms (age
or age2) should be considered. Similar analyses were conducted to hold
body height constant while evaluating sex differences.
The statistical maps (uncorrected) are crucial for allowing us to
visualize the spatial patterns of sex difference and age-by-sex inter-
actions in gray matter thickness and brain size. Nevertheless, permuta-
tion methods (Bullmore and others 1999) were used to assess the
significance of the statistical maps of the main effects of sex on cortical
thickness and brain size and to correct for multiple comparisons (i.e., for
the statistical tests at each of 65 536 surface points in each hemisphere)
as follows. Nine coarse regions of interest (ROIs) for each hemisphere
were created for each individual from a probabilistic atlas (Evans and
others 1996) for the frontal lobe (ventral and dorsal regions separated by
an axial plane passing through the intersection of the posterior extent of
the inferior frontal sulcus and the precentral sulcus in each hemi-
sphere), parietal lobe, temporal lobe, and occipital lobe by transforming
the probabilistic ROIs from standardized space back into the resliced
space of each individual using an automated 12-parameter affine trans-
formation (Woods and others 1998). The new ROIs for all individuals
were then averaged to create regional masks, and the ventral and dorsal
frontal, parietal, and occipital ROIs were separated into medial and
lateral regions. In the permutation analyses, subjects were randomly
assigned to sex groups for 10 000 new correlation analyses at each
surface point in each ROI, and the number of significant results (i.e., gray
matter thickness or DFC-H at any surface point that significantly differed
between sexes at the threshold of P = 0.05) that occurred in the real test
for group differences was compared with the null distribution of sig-
nificant results that occurred by chance. In other words, the threshold
for assessing the significance of statistical maps based on the permuta-
tion tests (within each ROI) was determined objectively by calculating
the surface area (number of surface points) of significant effects in the
real test of group differences. That surface area within any tested ROI
was used as the threshold for comparison with the random tests for that
ROI, and if fewer than 5% (i.e., P < 0.05) of the results from random tests
reached or exceeded the surface area of the real test, the statistical map
(within ROIs) was considered significant.
It is not possible to perform an exact permutation test that separates
the effects of sex-by-age interactions from the main effects of sex and
age (given that by definition, the main effects of sex, age, and age2 must
be held constant). The same is true for the evaluation of sex differences
when body height is also included in the equation. However, approx-
imate permutation tests, based on permutation of the residuals of these
statistical models, have been described and validated (Freedman and
Lane 1983; Anderson and Legendre 1999; Anderson and Ter Braak
2003). While holding constant the portions of variance in cortical
thickness that are attributed by the reduced model to sex, age, and age2,
the associated residual variances in thickness not attributable to these
factors were permuted randomly across all subjects irrespective of
sex or age. The new set of observations generated by combining the
permuted contribution to cortical thickness with the nonpermuted
contribution associated with the main effects of sex and age was then
analyzed using the same statistical model as was used to analyze the
1552 Sex Differences in Cortical Thickness d Sowell and others
by guest on February 27, 2015http://cercor.oxfordjournals.org/
Dow
nloaded from
original data. By combining a large number of such permutations (N =10 000), a distribution for the number of brain locations where the
uncorrected P value was less than 0.05 was created. Based on this
distribution and the number of such points observed in the original data,
a P value was assigned for each of the same 9 ROIs (per hemisphere)
described above for permutation of the main effects of sex. Despite the
fact that only residuals were permuted, this analysis was analogous to
the exact permutation testing performed for the main effects of sex
under the assumption of no significant age-by-sex interactions. Similar
permutation analyses were conducted to evaluate the effects of sex
when height was residualized out.
Results
Volume Analyses
As shown in Table 1, males have larger total brain, gray matter,
and white matter volumes than do females (P < 0.001 for all).
Although the groups did not differ significantly on mean age, we
conducted analyses using both age and sex to predict total
volumes so as to ensure that volume differences were not
attributable to age differences between the groups. The unique
predictive value of sex on the total volumes was still significant
while controlling for the variance associated with age.
Gray Matter Thickness
Maps of differences in cortical thickness between males and
females can be seen in Figure 1A. The greatest difference
between the sexes occurred in right inferior parietal and
posterior temporal regions where the female cortex on average
was approximately 0.45 mm thicker than the male cortex in the
unscaled brain image data, even without controlling for brain
size. A similar, though less robust, pattern of thicker cortices in
females was observed in the left posterior temporal and left
ventral frontal regions. Statistical maps in Figure 1B show that
the difference in cortical thickness between males and females
was statistically significant in these regions on a point-by-point
basis (uncorrected for multiple comparisons). The cortex of the
males was significantly thicker than that of the females only in
small regions of the anterior temporal and orbitofrontal regions
in the right hemisphere (shown in white in Fig. 1B).
Results of ROI permutation analyses (shown in Table 2)
confirm the significance of sex differences in cortical thickness
in right lateral parietal (P = 0.048), right lateral temporal (P =0.024), and left medial occipital (P = 0.017) regions. Female
cortices were thicker at trend levels of significance in the left
lateral ventral frontal and left lateral occipital regions. Male
cortices were not significantly thicker than females in any
region in these permutation analyses.
Because measures of cortical thickness were assessed in the
native, unscaled image space without correcting for total brain
or total gray matter volume and therefore because subtle
differences between groups in overall brain size could have
confounded comparisons of cortical thickness, maps of differ-
ences between the sexes in cortical thickness were created for
the subset of 36 subjects (18 males and 18 females) who had
been individually matched for total brain volume and age. Sex
differences for total gray and total white matter volumes for the
matched subjects were no longer significant in this subsample
(P = 0.98 for white matter and P = 0.69 for gray matter). Maps of
differences in thickness of gray matter between these matched
subjects are shown in Figure 2A, and they demonstrate that
even after brain size was controlled, and when total volume of
gray matter did not differ between the sexes, females had
thicker cortices (up to 0.6 mm) than did males in right lateral
frontal, parietal, and temporal cortices. Statistical maps in Figure
2B show the significance of these effects, and permutation
results are shown in Table 3. The pattern of results in the subset
of matched subjects is similar to that observed in the whole
group, and the effects are considerably more robust, despite the
reduced sample size.
Because the effects of differences in body size on cortical
thickness between the sexes may be different than the effects of
total brain size, we also conducted analyses where we used sex,
body height, and sex-by-body height interactions to predict
cortical thickness. Unlike brain volume and age, height and age
were highly correlated between 7 and 20 years (r = 0.89), and
height effects could not be differentiated during this part of the
age range. Thus, these analyses were conducted only with adult
subjects greater than 20 years of age (n = 119) where the
correlation between age and body height was nonsignificant. As
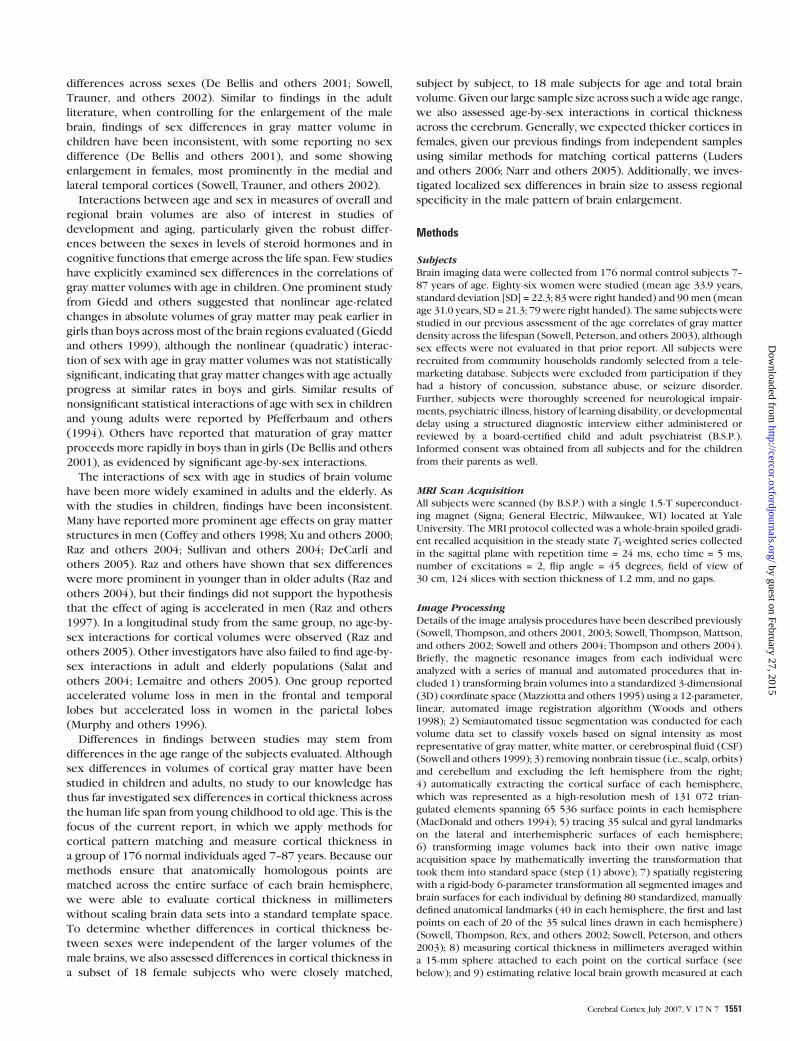
shown in Figure 3A, even when body height is controlled, adult
females have thicker cortex in left and right inferior parietal
(permutation results, P = 0.019 and 0.026, respectively), left and
right lateral temporal (permutation results P = 0.0098 and
0.0172, respectively), and left inferior frontal cortices (permu-
tation results P = 0.023).
Because the age range of our subjects was so large, we
assessed for the interactions of age or age2 with sex in
predicting cortical thickness within the entire sample. As
shown in Figure 3B, statistical maps for the interaction were
not significant in the temporoparietal cortices where the main
effects of sex were largest (shown in Fig. 1A, 2A). This suggests
that the thicker female cortices in the temporoparietal region
are present from at least late childhood (the youngest age
sampled in the present report) and consistent through old age.
Statistical maps show significant interactions of sex with age2 in
bilateral dorsal frontal and right inferior temporal regions (Fig.
3B). Permutation analyses were significant in both the left (P =0.01) and right (P = 0.03) dorsal frontal regions, the right
temporal region (P = 0.007), and the medial dorsal frontal region
in the right hemisphere (P = 0.03). The interactions were
somewhat complex to deconstruct, but visual examination of
the quadratic curves in the dorsal frontal regions shown in
Figure 4 suggests that older women tend to show more linear
effects of aging than do men in these regions. In other words,
the initial downward slopes are steeper in the males than the
females, perhaps supporting the notion that age effects are
more prominent in men as suggested in numerous other reports
(Coffey and others 1998; Xu and others 2000; Raz and others
2004; Sullivan and others 2004; DeCarli and others 2005). At the
very least, we can conclude that sex differences in these regions
are not stable throughout the life span.
Table 1Volumetric results for sex differences in total brain volume, total gray matter, total white matter,
and total CSF
Volume differences
Total volume (cm3) Gray mattervolume (cm3)
White mattervolume (cm3)
CSF volume (cm3)
Female 1355.9 (SD 97.9) 744.2 (SD 85.3) 444.3 (SD 62.9) 164.7 (SD 48.8)Male 1544.2 (SD 118.8) 844.9 (SD 84.5) 518.4 (SD 76.6) 177.6 (SD 53.3)Sexdifference
t 5 11.487,P\ 0.001
t 5 7.860,P\ 0.001
t 5 7.039,P\ 0.001
t 5 1.673,P 5 0.096
Cerebral Cortex July 2007, V 17 N 7 1553
by guest on February 27, 2015http://cercor.oxfordjournals.org/
Dow
nloaded from

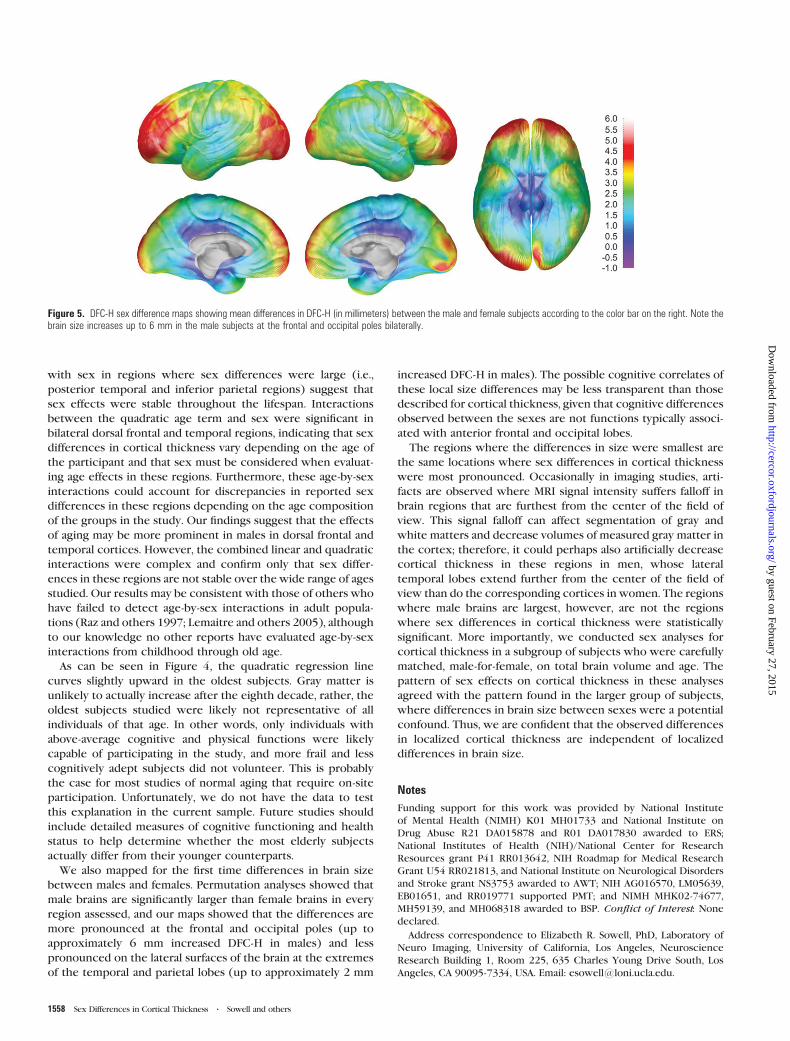
Brain Size
Maps of local brain size differences (DFC-H) between males and
females can be seen in Figure 5. The greatest difference
between the sexes occurs bilaterally in the frontal and occipital
poles, where male brains extend on average up to 6 mm beyond
the female brains. Statistical maps (not shown) reveal that the
difference in DFC-H between males and females is significant in
most locations. DFC-H is not significantly greater in females than
in males at any location. ROI permutation results were highly
significant in all ROIs (P values from 0.0001 to 0.0006) and thus
are not shown in tabular format.
Discussion
This study confirms the presence of regionally specific sex
differences in gray matter thickness over the human lifespan. It
shows that the cortical ribbon is actually thicker in some brain
regions in females, despite the fact that females tend to have
smaller bodies, and smaller brains, including smaller overall gray
and white matter volumes than do men. The regions in which
cortices are most prominently thicker in females than in males
are in the right hemisphere association cortices, particularly the
temporal and parietal lobes. In these regions, the cortex is up to
0.45 mm thicker in women; permutation analyses confirmed
that these effects were not attributable to chance. The non-
significant age-by-sex interactions in these regions suggest that
the sex differences in temporoparietal cortices are stable across
the life span. Rather than scaling the imaging data or statistically
controlling for overall brain size as other research groups have
done, we paired female subjects individually with male subjects
matched on age and brain volume in a subset of 36 of the
original 176 subjects studied. Notably, sex effects in this
subgroup in the temporal and parietal cortices were even
more significant than they were in the larger group, confirming
that differences in cortical thickness are not mediated by
differences in overall brain size. The findings of increased
significance in the matched sample, despite the considerably
reduced statistical power, may be consistent with findings in
other samples showing increases in regional gray matter
volumes that emerge only after controlling for overall differ-
ences in brain size between the sexes (Gur and others 1999;
Goldstein and others 2001).
The pattern of results from analyses where body height was
statistically controlled in adult subjects was similar to the
Figure 1. (A) Maps of differences between the sexes in thickness of gray matter (males coded 1, females coded 0 for all maps displayed) for the entire group of 176 subjectsshowing differences in gray matter (in millimeters) between the male and female subjects according to the color bar on the right. Warmer colors ( <0 on the color bar) are regionswhere gray matter thickness is greater in the female than in the male subjects, and cooler colors ( >0) are regions where the males have greater gray matter thickness than thefemale subjects. Note the approximately 0.45 mm increase in cortical thickness in females in the right posterior temporal lobe. These maps are constructed without any brainscaling, so represent absolute thickness increases in women. (B) Maps of statistically significant differences in gray matter thickness between the sexes for the entire group of 176subjects according to the color bar on the right (Pearson’s correlation coefficients ranging from –0.2 to 0.2 ranging from orange on the negative end to pink on the positive end).Regions in red correspond to correlation coefficients that show significant increase in gray matter thickness in the female subjects at a threshold of P = 0.05 and those in whitecorrespond to significant increase in the male subjects at a threshold of P = 0.05.
1554 Sex Differences in Cortical Thickness d Sowell and others
by guest on February 27, 2015http://cercor.oxfordjournals.org/
Dow
nloaded from

pattern of results from simple correlations between sex and
cortical thickness in the entire sample and in the brain size--
matched sample. That is, independent of body size differences
between males and females, females still have thicker cortex
than males in numerous lateral cortical regions. Whereas in no
case did group differences extend beyond the lateral surfaces of
the temporal, parietal, and frontal lobes, variation in the pattern
of results occurred when brain volume and height were used to
control brain and body size differences between the sexes.
Specifically, when the whole group and brain volume--matched
group were evaluated, right hemisphere effects were more
prominent than left, but when height was controlled in adult
subjects, the pattern of results was bilateral. Thus, while height
and brain volume are correlated in this sample (r = 0.32), and in
other samples (r = 0.55 [Baare and others 2001]), there are
apparent differences in the pattern of results whether brain size
correction or body size correction is used. Age differences in
the different subsets of subjects used for the simple correlation
maps, the brain size--corrected maps, and the height-corrected
maps could result in the different pattern of results. However,
age-by-sex interactions were not significant in the lateral
cortices in either hemisphere where gender effects were
observed in the various analyses (as shown in Figs 3B and 4).
This means that regardless of the age evaluated, gender differ-
ences should be comparable, at least in the lateral cortices of the
temporal, frontal, and parietal lobes. Inferring actual differences
based on qualitative visual comparison of the different maps
Figure 2. (A) Gray matter thickness sex difference maps for the subgroup of 36 age- and brain volume--matched subjects showing differences in gray matter (in millimeters)between the male and female subjects according to the color bar on the right. Warmer colors ( <0 on the color bar) are regions where females have thicker gray matter than themales, and cooler colors ( <0) are regions where the males have thicker gray matter than the females. Note the approximately 0.6-mm thicker cortices in females in the rightposterior temporal lobe. (B) Statistical differences between the sexes in gray matter thickness for the subgroup of 36 age- and brain volume--matched subjects showing thesignificance of gray matter thickness differences between the male and female subjects according to the color bar on the right (Pearson’s correlation coefficients ranging from –0.2to 0.2). Regions overlaid in red correspond to correlation coefficients that show significant increase in gray matter thickness in the female subjects at a threshold of P = 0.05. Therewere no regions where the male subjects had thicker cortex than the females at a threshold of P = 0.05.
Table 2Permutation results for gray matter thickness in the entire group of 176 subjects
Gray matter sex difference for 176 subjects
Region Females thicker
L R
Medial dorsal frontal 0.171 1.00Medial ventral frontal 0.157 0.349Medial occipital 0.017 0.066Medial parietal 0.162 0.382Lateral dorsal frontal 0.429 0.351Lateral ventral frontal 0.068 0.251Lateral occipital 0.083 0.188Lateral parietal 0.216 0.048Lateral temporal 0.208 0.024
Only the results for female thicker than male are shown separately for each ROI. Male thicker
than female results were not significant in any of the ROIs. The numbers presented are P values
representing a ratio of the number of random tests that matched or exceeded the number of
significant surface points (at P 5 0.05) in the real test to the total number of randomizations run
(i.e., 10 000).
Cerebral Cortex July 2007, V 17 N 7 1555
by guest on February 27, 2015http://cercor.oxfordjournals.org/
Dow
nloaded from
may be inappropriate anyway given that we did not statistically
test the difference between the simple correlation maps and the
maps where height or brain volume were controlled.
The regional pattern of increased thickness of cortical gray
matter in females is similar to the findings reported in in-
dependent young adult samples using similar surface-based
methods for studying cortical thickness (Luders and others
2006; Im and others 2006). In both of these previous reports,
women were observed to have thicker parietal cortices than
men. Our results are consistent with prior volumetric findings of
increased parietal lobe gray matter in women (Nopoulos and
others 2000; Allen and others 2003) and with findings of greater
gray matter density in women detected with voxel-based
analyses (Good and others 2001a). Frederikse and others
(1999), in contrast, reported increased volumes in inferior
parietal lobes in men, although they did not measure gray
matter separately, rendering their results difficult to compare
with ours. In addition to the parietal lobe effects, we observed
large regions of increased cortical thickness in women in the
posterior temporal regions, consistent with prior studies that
measured cortical thickness directly (Luders and others 2006;
Im and others 2006) but not consistent with a prior voxel-based
morphometry study (Good and others 2001a). Age differences
in the samples assessed could have led to discrepancies in
findings. Our findings of nonsignificant age-by-sex interactions
in the posterior temporal and inferior parietal regions where the
main effects of sex were most robust for cortical thickness
suggest that the sex differences in this region are independent
of age in our subjects. Methodological differences between
studies using conventional volumetric measures, voxel-based
morphometry, and measures of cortical thickness using surface-
based methods could also have produced inconsistencies in
findings. Specifically, surface-based methods are likely to im-
prove anatomical correspondence between subjects and, thus,
may provide increased sensitivity to detect group differences in
regions where anatomical variability can yield poorly matched
anatomy from the signal-based averaging of images that is
employed in voxel-based morphometry studies. Further, con-
ventional volumetric studies are limited to evaluating sex
differences in regions that can be visually identified and
anatomically defined, which may not represent the actual
boundaries of regions, such as those identified here that have
the largest sex differences.
The cellular bases for the thicker cortices in women com-
pared with men cannot be determined using current in vivo
imaging technologies. Nevertheless, the pattern of regional
differences in thickness across the sexes may be consistent
with postmortem findings of increased neuronal density and
Figure 3. (A) Statistical P maps of the sex difference in cortical thickness in adults (aged >20 years) with height differences partialled out. The map is color coded according to thebar, and regions in red are statistically significant at a P value of 0.05 or less. Regions in pink and blue (i.e., on the dorsal and medial surfaces of the brain) do not approachsignificance with P values between 0.5 and 1.0. (B) Statistical P maps of the combined interaction terms age by sex and age2 by sex. The map is color coded according to the bar,and regions in red are statistically significant at a P value of 0.05 or less. Regions in pink (i.e., on the lateral surface of the right temporal and parietal lobes) do not approachsignificance with P values near 1.0.
1556 Sex Differences in Cortical Thickness d Sowell and others
by guest on February 27, 2015http://cercor.oxfordjournals.org/
Dow
nloaded from
increased cortical volumes in the posterior temporal cortex of
women (Witelson and others 1995; Harasty and others 1997).
Regional cortical thickening in women may also be consistent
with the profile of cognitive differences long observed between
the sexes, particularly the female advantage on language tasks
that may be attributable to their thicker cortices in posterior
perisylvian language regions. Gur and others (1999) have
suggested that more cortical gray matter in women may provide
a computational advantage (compared with possible differences
in white matter, which would affect speed of information
transfer). This hypothesis may also be consistent with our
findings, although we should note that thicker cortices were
most prominent in the right hemisphere, which is usually
nondominant for language.
A thicker cortex, however, may not necessarily be better
than a thinner one. Studies of normal development, for example,
have consistently shown cortical thinning to occur with age as
part of normal brain maturation (Jernigan and others 1991;
Giedd and others 1999; Sowell and others 2004). Thinning of
frontal and parietal cortices in normally developing children,
moreover, is associated with improvements in performance on
language tasks (Sowell, Delis, and others 2001; Sowell and
others 2004). Cortical thinning during childhood and adoles-
cence is thought to derive both from progressive changes in
myelination (Yakovlev and Lecours 1967; Benes and others
1994) and from regressive changes, such as synaptic pruning
(Huttenlocher and de Courten 1987). Both of these cellular
changes are thought to improve computational speed and effici-
ency as redundant synapses are eliminated and oft-used cortical
circuits are insulated with myelin. The parietal cortex subserves
visuospatial functions, and thus, thinner cortices in men within
temporoparietal regions, if it indeed arises from greater prun-
ing and myelination during development and more efficient
computational processing, may contribute to the superior vis-
uospatial skills of men. This hypothesis is testable through
longitudinal studies in which detailed cognitive assessments
would accompany detailed morphological studies. Differences
in the rates of cortical maturation between males and females,
and relationships between cortical maturation and changes in
cognitive function, could be assessed across the cerebrum.
Most of the analyses in this report were focused on sex effects
on the entire sample of 176 subjects collapsed across the age
range from 7 to 87 years. The nonsignificant interactions of age
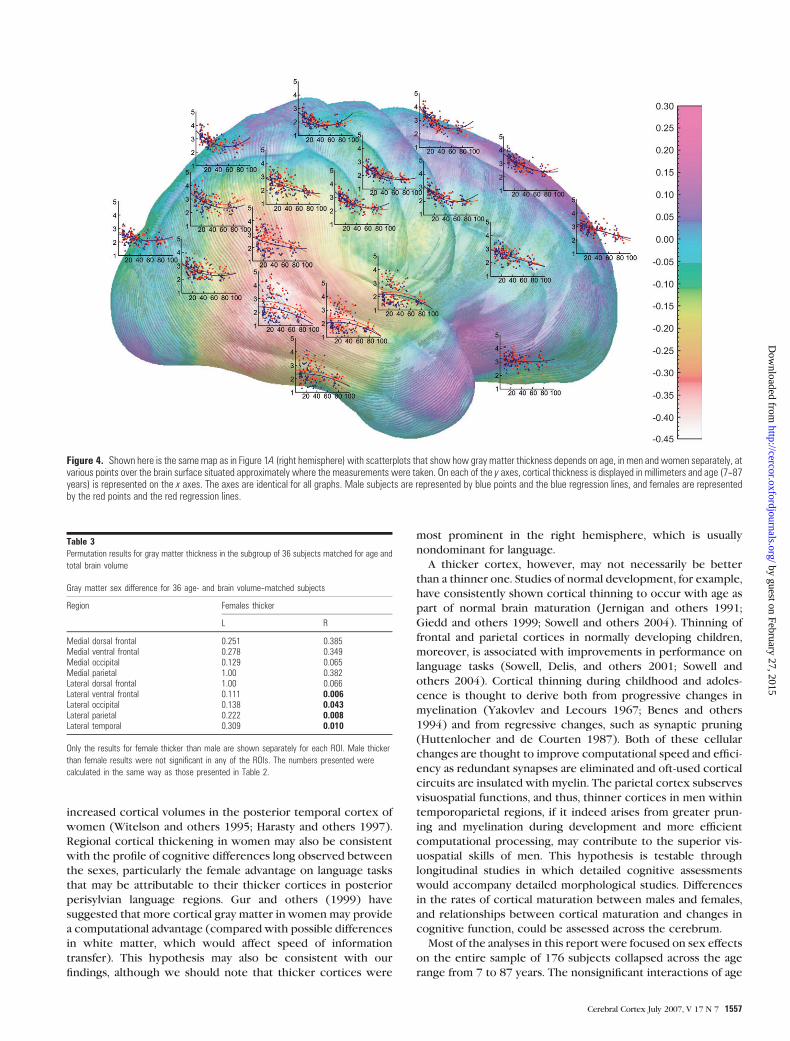
Figure 4. Shown here is the same map as in Figure 1A (right hemisphere) with scatterplots that show how gray matter thickness depends on age, in men and women separately, atvarious points over the brain surface situated approximately where the measurements were taken. On each of the y axes, cortical thickness is displayed in millimeters and age (7--87years) is represented on the x axes. The axes are identical for all graphs. Male subjects are represented by blue points and the blue regression lines, and females are representedby the red points and the red regression lines.
Table 3Permutation results for gray matter thickness in the subgroup of 36 subjects matched for age and
total brain volume
Gray matter sex difference for 36 age- and brain volume--matched subjects
Region Females thicker
L R
Medial dorsal frontal 0.251 0.385Medial ventral frontal 0.278 0.349Medial occipital 0.129 0.065Medial parietal 1.00 0.382Lateral dorsal frontal 1.00 0.066Lateral ventral frontal 0.111 0.006Lateral occipital 0.138 0.043Lateral parietal 0.222 0.008Lateral temporal 0.309 0.010
Only the results for female thicker than male are shown separately for each ROI. Male thicker
than female results were not significant in any of the ROIs. The numbers presented were
calculated in the same way as those presented in Table 2.
Cerebral Cortex July 2007, V 17 N 7 1557
by guest on February 27, 2015http://cercor.oxfordjournals.org/
Dow
nloaded from
with sex in regions where sex differences were large (i.e.,
posterior temporal and inferior parietal regions) suggest that
sex effects were stable throughout the lifespan. Interactions
between the quadratic age term and sex were significant in
bilateral dorsal frontal and temporal regions, indicating that sex
differences in cortical thickness vary depending on the age of
the participant and that sex must be considered when evaluat-
ing age effects in these regions. Furthermore, these age-by-sex
interactions could account for discrepancies in reported sex
differences in these regions depending on the age composition
of the groups in the study. Our findings suggest that the effects
of aging may be more prominent in males in dorsal frontal and
temporal cortices. However, the combined linear and quadratic
interactions were complex and confirm only that sex differ-
ences in these regions are not stable over the wide range of ages
studied. Our results may be consistent with those of others who
have failed to detect age-by-sex interactions in adult popula-
tions (Raz and others 1997; Lemaitre and others 2005), although
to our knowledge no other reports have evaluated age-by-sex
interactions from childhood through old age.
As can be seen in Figure 4, the quadratic regression line
curves slightly upward in the oldest subjects. Gray matter is
unlikely to actually increase after the eighth decade, rather, the
oldest subjects studied were likely not representative of all
individuals of that age. In other words, only individuals with
above-average cognitive and physical functions were likely
capable of participating in the study, and more frail and less
cognitively adept subjects did not volunteer. This is probably
the case for most studies of normal aging that require on-site
participation. Unfortunately, we do not have the data to test
this explanation in the current sample. Future studies should
include detailed measures of cognitive functioning and health
status to help determine whether the most elderly subjects
actually differ from their younger counterparts.
We also mapped for the first time differences in brain size
between males and females. Permutation analyses showed that
male brains are significantly larger than female brains in every
region assessed, and our maps showed that the differences are
more pronounced at the frontal and occipital poles (up to
approximately 6 mm increased DFC-H in males) and less
pronounced on the lateral surfaces of the brain at the extremes
of the temporal and parietal lobes (up to approximately 2 mm
increased DFC-H in males). The possible cognitive correlates of
these local size differences may be less transparent than those
described for cortical thickness, given that cognitive differences
observed between the sexes are not functions typically associ-
ated with anterior frontal and occipital lobes.
The regions where the differences in size were smallest are
the same locations where sex differences in cortical thickness
were most pronounced. Occasionally in imaging studies, arti-
facts are observed where MRI signal intensity suffers falloff in
brain regions that are furthest from the center of the field of
view. This signal falloff can affect segmentation of gray and
white matters and decrease volumes of measured gray matter in
the cortex; therefore, it could perhaps also artificially decrease
cortical thickness in these regions in men, whose lateral
temporal lobes extend further from the center of the field of
view than do the corresponding cortices in women. The regions
where male brains are largest, however, are not the regions
where sex differences in cortical thickness were statistically
significant. More importantly, we conducted sex analyses for
cortical thickness in a subgroup of subjects who were carefully
matched, male-for-female, on total brain volume and age. The
pattern of sex effects on cortical thickness in these analyses
agreed with the pattern found in the larger group of subjects,
where differences in brain size between sexes were a potential
confound. Thus, we are confident that the observed differences
in localized cortical thickness are independent of localized
differences in brain size.
Notes
Funding support for this work was provided by National Institute
of Mental Health (NIMH) K01 MH01733 and National Institute on
Drug Abuse R21 DA015878 and R01 DA017830 awarded to ERS;
National Institutes of Health (NIH)/National Center for Research
Resources grant P41 RR013642, NIH Roadmap for Medical Research
Grant U54 RR021813, and National Institute on Neurological Disorders
and Stroke grant NS3753 awarded to AWT; NIH AG016570, LM05639,
EB01651, and RR019771 supported PMT; and NIMH MHK02-74677,
MH59139, and MH068318 awarded to BSP. Conflict of Interest: None
declared.
Address correspondence to Elizabeth R. Sowell, PhD, Laboratory of
Neuro Imaging, University of California, Los Angeles, Neuroscience
Research Building 1, Room 225, 635 Charles Young Drive South, Los
Angeles, CA 90095-7334, USA. Email: [email protected].
Figure 5. DFC-H sex difference maps showing mean differences in DFC-H (in millimeters) between the male and female subjects according to the color bar on the right. Note thebrain size increases up to 6 mm in the male subjects at the frontal and occipital poles bilaterally.
1558 Sex Differences in Cortical Thickness d Sowell and others
by guest on February 27, 2015http://cercor.oxfordjournals.org/
Dow
nloaded from
References
Allen JS, Damasio H, Grabowski TJ, Bruss J, Zhang W. 2003. Sexual
dimorphism and asymmetries in the gray-white composition of the
human cerebrum. Neuroimage 18:880--894.
Anderson MJ, Legendre P. 1999. An Empirical comparison of permuta-
tion methods for tests of partial regression coefficients in a linear
model. J Stat Comput Simul 62:271--303.
Anderson MJ, Ter Braak CJ. 2003. Permutation tests for multi-factorial
analysis of variance. J Stat Comput Simul 73:85--113.
Baare WF, Hulshoff Pol HE, Boomsma DI, Posthuma D, de Geus EJ,
Schnack HG, van Haren NE, van Oel CJ, Kahn RS. 2001. Quantitative
genetic modeling of variation in human brain morphology. Cereb
Cortex 11:816--824.
Benes FM, Turtle M, Khan Y, Farol P. 1994. Myelination of a key relay
zone in the hippocampal formation occurs in the human brain
during childhood, adolescence, and adulthood. Arch Gen Psychiatry
51:477--484.
Blatter DD, Bigler ED, Gale SD, Johnson SC, Anderson CV, Burnett BM,
Parker N, Kurth S, Horn SD. 1995. Quantitative volumetric analysis of
brain MR: normative database spanning 5 decades of life. Am J
Neuroradiol 16:241--251.
Bullmore ET, Suckling J, Overmeyer S, Rabe-Hesketh S, Taylor E,
Brammer MJ. 1999. Global, voxel, and cluster tests, by theory and
permutation, for a difference between two groups of structural MR
images of the brain. IEEE Trans Med Imaging 18:32--42.
Caviness VS Jr, Kennedy DN, Richelme C, Rademacher J, Filipek PA.
1996. The human brain age 7--11 years: a volumetric analysis based
on magnetic resonance images. Cereb Cortex 6:726--736.
Coffey CE, Lucke JF, Saxton JA, Ratcliff G, Unitas LJ, Billig B, Bryan RN.
1998. Sex differences in brain aging: a quantitative magnetic
resonance imaging study. Arch Neurol 55:169--179.
Courchesne E, Chisum HJ, Townsend J, Cowles A, Covington J, Egaas B,
Harwood M, Hinds S, Press GA. 2000. Normal brain development and
aging: quantitative analysis at in vivo MR imaging in healthy
volunteers. Radiology 216:672--682.
De Bellis MD, Keshavan MS, Beers SR, Hall J, Frustaci K, Masalehdan A,
Noll J, Boring AM. 2001. Sex differences in brain maturation during
childhood and adolescence. Cereb Cortex 11:552--557.
DeCarli C, Massaro J, Harvey D, Hald J, Tullberg M, Au R, Beiser A,
D’Agostino R, Wolf PA. 2005. Measures of brain morphology and
infarction in the framingham heart study: establishing what is
normal. Neurobiol Aging 26:491--510.
Dekaban AS. 1978. Changes in brain weights during the span of human
life: relation of brain weights to body heights and body weights. Ann
Neurol 4:345--356.
Duvernoy HM, Cabanis EA, Vannson JL. 1991. The human brain: surface,
three-dimensional sectional anatomy and MRI. Vienna, Austria:
Springer-Verlag.
Evans AC, Collins DL, Holmes CJ. 1996. Automatic 3D regional MRI
segmentation and statistical probabilistic anatomical maps. New
York: Academic Press.
Filipek PA, Richelme C, Kennedy DN, Caviness VS Jr. 1994. The young
adult human brain: an MRI-based morphometric analysis. Cereb
Cortex 4:344--360.
Frederikse ME, Lu A, Aylward E, Barta P, Pearlson G. 1999. Sex
differences in the inferior parietal lobule. Cereb Cortex 9:896--901.
Freedman D, Lane D. 1983. A Nonstochastic interpretation of reported
significance levels. J Bus Econ Stat 1:292--298.
Ge Y, Grossman RI, Babb JS, Rabin ML, Mannon LJ, Kolson DL. 2002. Age-
related total gray matter and white matter changes in normal adult
brain. Part II: quantitative magnetization transfer ratio histogram
analysis. Am J Neuroradiol 23:1334--1341.
Giedd JN, Blumenthal J, Jeffries NO, Castellanos FX, Liu H, Zijdenbos A,
Paus T, Evans AC, Rapoport JL. 1999. Brain development during
childhood and adolescence: a longitudinal MRI study. Nat Neurosci
2:861--863.
Giedd JN, Castellanos FX, Rajapakse JC, Vaituzis AC, Rapoport JL. 1997.
Sexual dimorphism of the developing human brain. Prog Neuro-
psychopharmacol Biol Psychiatry 21:1185--1201.
Goldstein JM, Seidman LJ, Horton NJ, Makris N, Kennedy DN, Caviness
VS Jr, Faraone SV, Tsuang MT. 2001. Normal sexual dimorphism of
the adult human brain assessed by in vivo magnetic resonance
imaging. Cereb Cortex 11:490--497.
Good CD, Johnsrude I, Ashburner J, Henson RN, Friston KJ, Frackowiak
RS. 2001a. Cerebral asymmetry and the effects of sex and handedness
on brain structure: a voxel-based morphometric analysis of 465
normal adult human brains. Neuroimage 14:685--700.
Good CD, Johnsrude IS, Ashburner J, Henson RN, Friston KJ, Frackowiak
RS. 2001b. A voxel-based morphometric study of ageing in 465
normal adult human brains. Neuroimage 14:21--36.
Gur RC, Gunning-Dixon F, Bilker WB, Gur RE. 2002. Sex differences in
temporo-limbic and frontal brain volumes of healthy adults. Cereb
Cortex 12:998--1003.
Gur RC, Turetsky BI, Matsui M, Yan M, Bilker W, Hughett P, Gur RE.
1999. Sex differences in brain gray and white matter in healthy
young adults: correlations with cognitive performance. J Neurosci
19:4065--4072.
Halpern DF, Tan U. 2001. Stereotypes and steroids: using a psycho-
biosocial model to understand cognitive sex differences. Brain Cogn
45:392--414.
Harasty J, Double KL, Halliday GM, Kril JJ, McRitchie DA. 1997.
Language-associated cortical regions are proportionally larger in
the female brain. Arch Neurol 54:171--176.
Huttenlocher PR, de Courten C. 1987. The development of synapses in
striate cortex of man. Hum Neurobiol 6:1--9.
Im K, Lee JM, Lee J, Shin YW, Kim IY, Kwon JS, Kim SI. 2006. Gender
difference analysis of cortical thickness in healthy young adults with
surface-based methods. Neuroimage.
Jernigan TL, Trauner DA, Hesselink JR, Tallal PA. 1991. Maturation of
human cerebrum observed in vivo during adolescence. Brain
114:2037--2049.
Jones CM, Braithwaite VA, Healy SD. 2003. The evolution of sex
differences in spatial ability. Behav Neurosci 117:403--411.
Kimura D. 2000. Sex and cognition. Cambridge, MA: MIT Press.
Lemaitre H, Crivello F, Grassiot B, Alperovitch A, Tzourio C, Mazoyer B.
2005. Age- and sex-related effects on the neuroanatomy of healthy
elderly. Neuroimage 26:900--911.
Luders E, Narr KL, Thompson PM, Rex DE, Woods RP, Deluca H, Jancke
L, Toga AW. 2006. Gender effects on cortical thickness and the
influence of scaling. Hum Brain Mapp 27:314--324.
MacDonald D, Avis D, Evans A. 1994. Multiple surface identification and
matching in magnetic resonance images. Proc Vis Biomed Comput
2359:160--169.
Mazziotta JC, Toga AW, Evans A, Fox P, Lancaster J. 1995. A probabilistic
atlas of the human brain: theory and rationale for its development.
The International Consortium for Brain Mapping (ICBM). Neuro-
image 2:89--101.
Murphy DG, DeCarli C, McIntosh AR, Daly E, Mentis MJ, Pietrini P,
Szczepanik J, Schapiro MB, Grady CL, Horwitz B, and others. 1996.
Sex differences in human brain morphometry and metabolism: an in
vivo quantitative magnetic resonance imaging and positron emission
tomography study on the effect of aging. Arch Gen Psychiatry
53:585--594.
Narr KL, Bilder RM, Toga AW, Woods RP, Rex DE, Szeszko PR, Robinson
D, Sevy S, Gunduz-Bruce H, Wang YP, and others. 2005. Mapping
cortical thickness and gray matter concentration in first episode
schizophrenia. Cereb Cortex 15:708--719.
Nopoulos P, Flaum M, O’Leary D, Andreasen NC. 2000. Sexual di-
morphism in the human brain: evaluation of tissue volume, tissue
composition and surface anatomy using magnetic resonance imag-
ing. Psychiatry Res 98:1--13.
Ono M, Kubik S, Abernathey CD. 1990. Atlas of the cerebral sulci.
Stuttgart: G. Thieme Verlag.
Peters M, Jancke L, Staiger JF, Schlaug G, Huang Y, Steinmetz H. 1998.
Unsolved problems in comparing brain sizes in Homo sapiens. Brain
Cogn 37:254--285.
Pfefferbaum A, Mathalon DH, Sullivan EV, Rawles JM, Zipursky RB, Lim
KO. 1994. A quantitative magnetic resonance imaging study of
changes in brain morphology from infancy to late adulthood. Arch
Neurol 51:874--887.
Raz N, Gunning-Dixon F, Head D, Rodrigue KM, Williamson A, Acker JD.
2004. Aging, sexual dimorphism, and hemispheric asymmetry of the
Cerebral Cortex July 2007, V 17 N 7 1559
by guest on February 27, 2015http://cercor.oxfordjournals.org/
Dow
nloaded from
cerebral cortex: replicability of regional differences in volume.
Neurobiol Aging 25:377--396.
Raz N, Gunning FM, Head D, Dupuis JH, McQuain J, Briggs SD, LokenWJ,
Thornton AE, Acker JD. 1997. Selective aging of the human cerebral
cortex observed in vivo: differential vulnerability of the prefrontal
gray matter. Cereb Cortex 7:268--282.
Raz N, Lindenberger U, Rodrigue KM, Kennedy KM, Head D, Williamson
A, Dahle C, Gerstorf D, Acker JD. 2005. Regional brain changes in
aging healthy adults: general trends, individual differences and
modifiers. Cereb Cortex 15(11):1676--1689.
Resnick SM, Goldszal AF, Davatzikos C, Golski S, Kraut MA, Metter EJ,
Bryan RN, Zonderman AB. 2000. One-year age changes in MRI brain
volumes in older adults. Cereb Cortex 10:464--472.
Roberts JE, Bell MA. 2000. Sex differences on a mental rotation task:
variations in electroencephalogram hemispheric activation between
children and college students. Dev Neuropsychol 17:199--223.
Salat DH, Buckner RL, Snyder AZ, Greve DN, Desikan RS, Busa E, Morris
JC, Dale AM, Fischl B. 2004. Thinning of the cerebral cortex in aging.
Cereb Cortex 14:721--730.
Sapiro G. 2001. Geometric partial differential equations and image
analysis. Cambridge, UK: Cambridge University Press.
Sommer IE, Aleman A, Bouma A, Kahn RS. 2004. Do women really have
more bilateral language representation than men? A meta-analysis of
functional imaging studies. Brain 127:1845--1852.
Sowell ER, Delis D, Stiles J, Jernigan TL. 2001. Improved memory func-
tioning and frontal lobe maturation between childhood and adoles-
cence: a structural MRI study. J Int Neuropsychol Soc 7:312--322.
Sowell ER, Peterson BS, Thompson PM, Welcome SE, Henkenius AL,
Toga AW. 2003. Mapping cortical change across the human life span.
Nat Neurosci 6:309--315.
Sowell ER, Thompson PM, Holmes CJ, Batth R, Jernigan TL, Toga AW.
1999. Localizing age-related changes in brain structure between
childhood and adolescence using statistical parametric mapping.
Neuroimage 9:587--597.
Sowell ER, Thompson PM, Leonard CM, Welcome SE, Kan E, Toga AW.
2004. Longitudinal mapping of cortical thickness and brain growth
in normal children. J Neurosci 24(38):8223--8231.
Sowell ER, Thompson PM, Mattson SN, Tessner KD, Jernigan TL, Riley EP,
Toga AW. 2002. Regional brain shape abnormalities persist into
adolescence after heavy prenatal alcohol exposure. Cereb Cortex
12:856--865.
Sowell ER, Thompson PM, Rex D, Kornsand D, Tessner KD, Jernigan TL,
Toga AW. 2002. Mapping sulcal pattern asymmetry and local cortical
surface gray matter distribution in vivo: maturation in perisylvian
cortices. Cereb Cortex 12:17--26.
Sowell ER, Thompson PM, Tessner KD, Toga AW. 2001. Mapping
continued brain growth and gray matter density reduction in dorsal
frontal cortex: inverse relationships during postadolescent brain
maturation. J Neurosci 21:8819--8829.
Sowell ER, Thompson PM, Welcome SE, Henkenius AL, Toga AW,
Peterson BS. 2003. Cortical abnormalities in children and adoles-
cents with attention deficit hyperactivity disorder. Lancet
362:1699--1707.
Sowell ER, Trauner DA, Gamst A, Jernigan TL. 2002. Development
of cortical and subcortical brain structures in childhood and
adolescence: a structural MRI study. Dev Med Child Neurol
44:4--16.
Sullivan EV, Rosenbloom M, Serventi KL, Pfefferbaum A. 2004. Effects of
age and sex on volumes of the thalamus, pons, and cortex. Neurobiol
Aging 25:185--192.
Thompson PM, Hayashi KM, Sowell ER, Gogtay N, Giedd JN, Rapoport JL,
de Zubicaray GI, Janke AL, Rose SE, Semple J, and others. 2004.
Mapping cortical change in Alzheimer’s disease, brain development,
and schizophrenia. Neuroimage 23(Suppl 1):S2--S18.
Von Economo CV. 1929. The cytoarchitectonics of the human cerebral
cortex. London: Oxford Medical Publications.
Witelson SF, Glezer II, Kigar DL. 1995. Women have greater density of
neurons in posterior temporal cortex. J Neurosci 15:3418--3428.
Woods RP, Grafton ST, Holmes CJ, Cherry SR, Mazziotta JC. 1998.
Automated image registration: I. General methods and intrasubject,
intramodality validation. J Comput Assist Tomogr 22:139--152.
Xu J, Kobayashi S, Yamaguchi S, Iijima K, Okada K, Yamashita K. 2000.
Gender effects on age-related changes in brain structure. Am J
Neuroradiol 21:112--118.
Yakovlev PI, Lecours AR. 1967. The myelogenetic cycles of regional
maturation of the brain. In: Minkowski A, editor. Regional de-
velopment of the brain in early life. Oxford: Blackwell Scientific.
p 3--70.
1560 Sex Differences in Cortical Thickness d Sowell and others
by guest on February 27, 2015http://cercor.oxfordjournals.org/
Dow
nloaded from
Related Documents