University of South Carolina Scholar Commons eses and Dissertations 12-14-2015 Dietary Paerns and Prostate Cancer Aggressiveness in African-American and European- American Men Lara Ryan Schneider University of South Carolina - Columbia Follow this and additional works at: hps://scholarcommons.sc.edu/etd Part of the Epidemiology Commons is Open Access esis is brought to you by Scholar Commons. It has been accepted for inclusion in eses and Dissertations by an authorized administrator of Scholar Commons. For more information, please contact [email protected]. Recommended Citation Schneider, L. R.(2015). Dietary Paerns and Prostate Cancer Aggressiveness in Aican-American and European-American Men. (Master's thesis). Retrieved from hps://scholarcommons.sc.edu/etd/3250

Welcome message from author
This document is posted to help you gain knowledge. Please leave a comment to let me know what you think about it! Share it to your friends and learn new things together.
Transcript
University of South CarolinaScholar Commons
Theses and Dissertations
12-14-2015
Dietary Patterns and Prostate CancerAggressiveness in African-American and European-American MenLara Ryan SchneiderUniversity of South Carolina - Columbia
Follow this and additional works at: https://scholarcommons.sc.edu/etd
Part of the Epidemiology Commons
This Open Access Thesis is brought to you by Scholar Commons. It has been accepted for inclusion in Theses and Dissertations by an authorizedadministrator of Scholar Commons. For more information, please contact [email protected].
Recommended CitationSchneider, L. R.(2015). Dietary Patterns and Prostate Cancer Aggressiveness in African-American and European-American Men. (Master'sthesis). Retrieved from https://scholarcommons.sc.edu/etd/3250
DIETARY PATTERNS AND PROSTATE CANCER AGGRESSIVENESS IN AFRICAN-
AMERICAN AND EUROPEAN-AMERICAN MEN
by
Lara Ryan Schneider
Bachelor of Arts
The Ohio State University, 2008
Bachelor of Science
The Ohio State University, 2012
Submitted in Partial Fulfillment of the Requirements
For the Degree of Master of Science in Public Health in
Epidemiology
The Norman J. Arnold School of Public Health
University of South Carolina
2015
Accepted by:
Susan Steck, Director of Thesis
James Hussey, Reader
Anwar Merchant, Reader
Lacy Ford, Senior Vice Provost and Dean of Graduate Studies

ii
© Copyright by Lara Ryan Schneider, 2015
All Rights Reserved.
iii
DEDICATION
For Donald and Joricia Schneider, for their continued love and support.
iv
ACKNOWLEDGEMENTS
Special thanks to Dr. Susan Steck, for her commitment, direction, and support of
this project; additional thanks to Drs. James Hussey and Anwar Merchant, for their input
on this work.
v
ABSTRACT
Several foods and nutrients have been linked to prostate cancer risk, but the effect
of overall diet on prostate cancer outcomes is not well understood. Previous research has
primarily examined a posteriori dietary patterns in relation to prostate cancer; studies that
have used a priori dietary patterns and their relationship with prostate cancer have been
inconclusive. Furthermore, racial differences in prostate cancer incidence and
aggressiveness are not well understood. Data from the case-only North Carolina-
Louisiana Prostate Cancer Project (PCaP) was used to examine the association between
overall dietary pattern, as measured by the Mediterranean Diet (MED) score and the
Dietary Approaches to Stop Hypertension (DASH) score, and prostate cancer
aggressiveness in African-American (AA) and European-American (EA) men. Dietary
patterns were assessed using a modified NCI Diet History Questionnaire for a final
sample of 1,899 participants. Higher MED scores were found to be inversely associated
with high aggressive prostate cancer overall (OR: 92; 95% CI: 0.84-0.99; p trend: 0.03);
and results were similar for AA men and EA men. DASH scores were not significantly
associated with prostate cancer aggressiveness. These results suggest that following a
Mediterranean diet may decrease the risk of developing high aggressive prostate cancer.
vi
TABLE OF CONTENTS
DEDICATION ....................................................................................................................... iii
ACKNOWLEDGEMENTS ........................................................................................................ iv
ABSTRACT ............................................................................................................................v
LIST OF TABLES ................................................................................................................. vii
CHAPTER 1: INTRODUCTION ..................................................................................................1
CHAPTER 2: BACKGROUND & LITERATURE REVIEW ...........................................................10
CHAPTER 3: RESEARCH METHODS .......................................................................................34
CHAPTER 4: RESULTS ..........................................................................................................48
CHAPTER 5: DISCUSSION .....................................................................................................81
REFERENCES .......................................................................................................................88
vii
LIST OF TABLES
Table 2.1: Summary table of articles concerning dietary patterns and prostate cancer
outcomes ................................................................................................................24
Table 3.1: Components and scoring standards for the diet quality indices ......................47
Table 4.1: Dietary and demographic characteristics of PCaP participants by high and low-
intermediate aggressiveness ..................................................................................54
Table 4.2: Dietary and demographic characteristics of PCaP participants by race ..........56
Table 4.3: Assessment of confounding by 10% rules for covariates – numeric diet
scores......................................................................................................................58
Table 4.4: Assessment of confounding by 10% rules for covariates – categorical diet
scores......................................................................................................................59
Table 4.5: Association between dietary scores (numeric) and prostate cancer
aggressiveness ........................................................................................................61
Table 4.6: Association between dietary score (numeric) and prostate cancer
aggressiveness, stratified by race ...........................................................................62
Table 4.7: Association between dietary score (categorized) and prostate cancer
Aggressiveness .......................................................................................................63
Table 4.8: Association between dietary score (categorized) and prostate cancer
aggressiveness by
race .........................................................................................................................64
Table 4.9: Stratification by potential effect modifiers, MED ............................................66
Table 4.10: Stratification by potential effect modifiers, DASH quintiles .........................67
Table 4.11: Stratification by potential effect modifiers, DASH tertiles ............................69
Table 4.12: Association between dietary score (numeric) and prostate cancer
aggressiveness, including age as categorical variable ...........................................70
viii
Table 4.13: Association between dietary score (numeric) and prostate cancer
aggressiveness, stratified by race, including age as categorical variable ..............71
Table 4.14: Association between dietary score (categorized) and prostate cancer
aggressiveness, including age as categorical variable ...........................................72
Table 4.15: Association between dietary score (categorized) and prostate cancer
aggressiveness by race, including age as categorical variable ...............................73
Table 4.16: Spearman correlation between MED and DASH scores ................................75
Table 4.17: Means and standard deviations of selected nutrients and dietary factors across
dietary scores .........................................................................................................76
Table 4.18: Comparison of men excluded for missing data to study population included in
final analysis ..........................................................................................................78
Table 4.19: Sensitivity Analysis for excluded men ...........................................................80
1
CHAPTER 1
INTRODUCTION
1. Statement of problem
General
Prostate cancer is the most commonly diagnosed cancer in American men and is
the second leading cause of cancer mortality. There were an estimated 233,000 new
prostate cancer cases diagnosed in the United States (U.S.) in 2014, accounting for 27%
of all male cancer diagnoses; in the same year, 29,480 estimated deaths were attributed to
prostate cancer, or 10% of all cancer-related deaths in American men (Siegel, Ma et al.
2014). Between the years 1975-1988, incident rates of prostate cancer showed small
increases; a sharp increase in the number of prostate cancer diagnoses in the years 1988-
1992 reflects the introduction of the prostate-specific antigen (PSA) blood test for
screening, with the number of new cases declining in subsequent years (Edwards, Noone,
et al. 2014; Siegel, Ma et al. 2014).
Several risk factors for prostate cancer are known, including age, race/ethnicity,
and family history. The majority of new cases are diagnosed between the ages of 65-74
years (36.6%), and less than 11% of all diagnoses occur in men younger than 55 years of
age. Incidence rates differ by race: African Americans (AA) are more likely than any
other race or ethnicity to be diagnosed with prostate cancer (223.9 new cases per
100,000). American Indian and Alaskan natives have the lowest prostate cancer incidence
(71.5 and 79.3 new cases per 100,000, respectively), while whites (139.9 new cases per
2
100,000) and Hispanics (121.8 new cases per 100,000) fall between the two extremes
(Howlander, Noone et al. 2014). Family history has been shown to increase the risk of
developing prostate cancer, with Grönberg finding a positive correlation between the
number of affected family members and the risk of disease (2003).
Although prostate cancer is the most common cancer in men, the high 5-year
survival rate (98.9%) and slow growth of prostate cancers has led to recent changes in the
U.S. Preventive Services Task Force screening recommendations. In May 2012, they
released a report that recommended against PSA screening tests for adult males without
symptoms, citing the asymptomatic nature of most cases, high false-positive rates for the
PSA screening test, and the potentially harmful side effects of treatment options (Moyer
2012). Other cancer-related organizations advocate for screening only among high-risk
individuals (older, AA men, and/or those with a family history). An alternative to the
PSA blood test is the digital rectal exam (DRE), or the tactile examination of the prostate
by a physician. Both methods are widely accepted, and the decision to perform either test
is at the discretion of the primary care physician and patient. If prostate cancer is
detected, treatment plans may be as mild as no action to as invasive as radical
prostatectomy (Bill-Axelson, Holmberg et al. 2005).
Survival rates for prostate cancer remain high, even when measured at 10 (96.9%)
and 15 (94%) years. These rates best reflect local and regional stage diagnoses; distant
stage prostate cancers only have a 28% 5-year survival rate. Mortality rates also vary by
race: AA men are almost twice as likely as European American (EA) or Hispanic men to
die of prostate cancer (Howlander, Noone et al. 2014). Often, prostate cancer does not
cause death: other health complications result in death before the metastasis of the tumor.
3
Given that the majority of diagnosed prostate cancers are indolent and not likely to cause
clinical symptoms or death, there has been a recent shift in the focus on studying risk
factors for overall prostate cancer to investigating risk factors for aggressive prostate
cancer.
Regional Disparities
The data for this population-based study were collected from men residing in
Louisiana and North Carolina; these states exhibit distinctive prostate cancer statistics
and trends. Louisiana had an estimated 3,720 new prostate cancer cases diagnosed in
2014; the age-adjusted prostate cancer incidence rate in the state between 2006 and 2010
was 169.3 new cases per 100,000 men. In North Carolina, an estimated 7,580 new cases
were diagnosed, though the 2006-2010 incidence rate was lower, with only 151.9 new
cases per 100,000 men. Both state’s incidence rates are higher than the national average
(146.6 per 100,000 men) over the same time period. In 2014, approximately 920 deaths in
men living in North Carolina were attributed to prostate cancer, while less than half that
number (n=400) of deaths in Louisiana men were caused by prostate cancer. However,
the prostate cancer mortality rate in Louisiana is slightly higher than in North Carolina
(26.6 versus 25.8 deaths per 100,000), after adjusting for age (Siegel, Ma et al. 2014).
Racial Disparities
Incidence and Mortality
AA men have the greatest prostate cancer risk of any racial or ethnic group in the
United States (Gann 2002). Between 2005 and 2009, prostate cancer incidence rates for
AA men (228.8 per 100,000) and EA men (140.3 per 100,000) indicate that AA men are
1.63 times more likely to develop prostate cancer than EA men. This disparity is more
4
pronounced when comparing mortality rates: AA men are 2.44 times more likely to die
from prostate cancer than EA men (DeSantis, Naishadham et al. 2013). Several reasons
that may account for this discrepancy are discussed further here.
Screening and PSA
AA men are less likely than EA men to be screened for prostate cancer. In a study
by Jones et al., EA men were significantly more likely to have received a DRE prostate
cancer screening (OR=2.08, 95% CI: 1.03-4.21) than AA men; PSA screening tests also
occur more frequently in EA men than in AA men (Jones, Liu et al. 2008; Carpenter,
Howard et al. 2009; Carpenter, Godley et al. 2010). In a biracial sample of North
Carolina men diagnosed with prostate cancer, Conlisk et al. found that having a recent
PSA screening test was significantly (p=0.01) and inversely correlated with stage at
diagnosis for AA men, but not for EA men (p=0.20) (Conlisk, Lengerich et al. 1999). A
family history of prostate cancer was positively associated with having a recent PSA test
(OR=3.03, 95% CI: 1.13-8.10), but not a DRE, in AA men (Bloom, Stewart et al. 2006).
Disease Diagnosis and Treatment
The stage and grade of prostate cancer at time of diagnosis differs between AA
men and EA men. Race is an independent predictor of prostate cancer stage at diagnosis,
with AA men consistently presenting more advanced stage cancer than EA men
(Schwartz, Crossley-May et al. 2003; Ward, Jemal et al. 2004). AA men are almost twice
as likely to present with late stage prostate cancer then EA men; the likelihood of early-
stage diagnosis remains lower for AA men than EA men across socioeconomic status,
clinical factors, and pathologic factors (Bennett, Ferreira et al. 1998; Ward, Jemal et al.
2004; Hoffman, Gilliland et al. 2001; Jones, Liu et al. 2008). Measures of disease grade
5
(i.e., Gleason grade) tend to be higher in AA men: multiple studies have found that a
higher proportion of AA men than EA men (20% versus 12%) will present with high-
grade tumors (Fowler & Bigler 1999; Reddy, Shapiro et al. 2003; Gaines, Turner et al.
2014).
Despite their higher rates of diagnosis for distant stage prostate cancer, AA men
are less likely to receive aggressive treatment therapies, namely radical prostatectomy
(Klabunde, Potosky et al. 1998; Underwood, De Monner et al. 2004; Harlan, Potosky et
al. 2001; Shavers, Brown et al. 2004). They are also more likely than their EA
counterparts to remain untreated (Tewari, Horninger et al. 2005). Across all treatment
options, mortality rates for AA men remain higher than for EA men (Godley, Schneck, et
al. 2003); when access to care is adjusted for, disparities in outcome are attenuated across
treatment arms (Optenberg, Thompson et al. 1995).
Genetics
Family history is a long established risk factor for prostate cancer; a portion of the
hereditary nature of prostate cancer occurrence has been attributed to genetic variants and
gene-environment interactions (Schaid 2004; Stephenson 2008; Alvarez-Cubero, Saiz
2013). Genes that have been linked with increased prostate cancer risk include: ELAC2
(HPC2), MSR1, and RNASEL (HPC1) for familial cases; AR, ATBF1, EPHB2 (ERK), and
KLF6 for sporadic cases; and AR, BRCA1, BRCA2, CHEK2 (RAD53), CYP17, CYP1B1,
CYP3A4, GSTM1, GSTP1, GSTT1, PON1, SRD5A2, and VDR with both familial and
sporadic cases (Dong 2006). Most of these genes are associated with tumor suppression,
cell regulation, or androgen reception (Barbieri, Tomlins 2014). Racial differences in the
frequency of allele presentation have been found and may explain part of the prostate
6
cancer disparities between AA and EA men (Ziegler-Johnson, Spangler et al. 2008;
Freedland, Isaacs 2005).
Socioeconomic factors
Socioeconomic status (SES) has been found to explain some of the prostate
cancer disparities between AA and EA men. In a study conducted by Du, et al., lower
SES was associated with decreased survival in all prostate cancer cases (HR: 1.31; 95%
CI: 1.25-1.36); when comparing mortality between AA and EA men, socioeconomic
status was found to be a significant factor in the survival disparities between the two
groups (Du, Fang et al. 2006). SES has been found to have a greater impact on prostate
cancer outcomes in AA men than EA men, both in terms of stage at diagnosis and
mortality (Conlisk, Lengerich et al. 1999; Steenland, Rodriguez et al. 2004). Education, a
common proxy for SES, has been shown to have a significant effect on mortality rates in
AA men: those who completed 12 or less years of education had a prostate cancer
mortality rate double that of men completing 12 or more years of education (RR: 2.17;
95% CI: 1.82-2.58) (Albano, Ward et al. 2007). AA men have historically lower levels of
SES and educational attainment than EA men; this likely has contributed to disparities in
prostate cancer (U.S. Census Bureau 2012).
Diet
Several individual components of dietary intake have been associated with
prostate cancer occurrence, and differing levels of intake by race may account for some
of the disparities in disease incidence. Increased intakes of fat, particularly animal fats,
have been shown to be associated with increased prostate cancer incidence and fatality,
with intake differences accounting for approximately 10% of AA-EA incidence
7
disparities (Gann 2002; Pelser, Mondul et al. 2013; Whittemore, Kolonel et al. 1995).
Intake of dairy and dairy products above recommended levels has also been shown to
modestly increase the risk of prostate cancer (Rodriguez, McCullough et al. 2003).
Conversely, high intakes of soy, fiber, fruits and vegetables, and vitamins D & E,
selenium, and lycopene (tomatoes) have been inversely associated with prostate cancer
(Hardin, Cheng et al. 2011; Cheung, Wadhera et al. 2008; Hurst, Hooper et al. 2012).
However, supplemental vitamin intake does not appear to be protective in reducing
prostate cancer risk, and there is some suggestion that certain supplements (e.g., vitamin
E) may be harmful under certain conditions, as seen in the Selenium and Vitamin E
Cancer Prevention Trial (SELECT) (400 IU/day vitamin E intervention: HR: 1.13; 95%
CI: 0.95-1.35; P = 0.06) (Lippman, Klein et al. 2009). Variations in intakes between AA
and EA men, due to cultural eating habits, food availability, or gene-diet interaction may
explain racial differences in prostate cancer (Reedy, Shapiro et al. 2003; Discacciati,
Wolk 2014), and it is likely the combination of dietary factors, rather than single foods or
nutrients alone, that will have the largest impact.
2. Proposal and Specific Aims
The purpose of this case-only study was to examine the association between
overall dietary pattern and prostate cancer aggressiveness, particularly in relation to racial
disparities in prostate cancer between AA and EA men. Two dietary indexes, the
Mediterranean Diet Score (MED), and the Dietary Approaches to Stop Hypertension
(DASH), evaluate diet quality based on intakes of specific foods and food groups; the
association between overall diet quality and prostate cancer aggressiveness, as
determined by PSA count, stage and Gleason sum, in the large, case-only North Carolina-
8
Louisiana Prostate Cancer Project (PCaP) was evaluated using these two dietary
measures. My specific aim was to examine the relationship between diet quality and
prostate cancer aggressiveness among AA and EA men using two different dietary
indexes: 1) the MED diet score, as a measure of conformity to a Mediterranean diet; and
the 2) DASH diet score as a measure of conformity to the Dietary Approaches to Stop
Hypertension (DASH) diet.
3. Significance of Research
Prostate cancer is the most commonly diagnosed malignancy and the second most
common cause of cancer mortality in American men (Siegel, Ma et al. 2014). Age, race,
and family history are established risk factors for increased risk of prostate cancer; diet
has been proposed as possible risk factor, yet evidence of the influence of overall dietary
patterns remains inconclusive. To date, five studies have examined overall diet according
to the MED or alternate MED (aMED) in relation to prostate cancer (Ax, Garmo et al.
2014; Bosire, Stampfer et al. 2013; Kenfield, DuPre et al. 2014; Möller, Galeone et al.
2013; Muller, Severi et al. 2009). None have used DASH to evaluate prostate cancer
outcomes. The remaining body of evidence for total diet and prostate cancer is based on
study-specific dietary patterns (Ambrosini, Fritschi et al. 2008; Askari, Parizi et al. 2014;
De Stefani, Ronco et al. 2010; Jackson, Walker et al. 2009; Jackson, Tulloch-Reid et al.
2013; Tseng, Breslow et al. 2004; Walker, Aronson et al. 2005; Wu, Hu et al. 2006).
While there is a large body of literature on the association between individual dietary
factors and prostate cancer, much of this evidence is contradictory and does not account
for effects of other foods consumed. The lack of consistent measures of both individual
diet components and overall dietary patterns hinders comparability across studies, and
9
impedes the formulation of dietary recommendations for prostate cancer prevention and
treatment.
This study utilized widely-accepted, standardized dietary indexes to evaluate overall diet;
therefore, results are easy to interpret in the context of overall diet recommendations.
Results from this study may support the adoption of the dietary pattern recommendations
as a prostate cancer prevention strategy.
10
CHAPTER 2
BACKGROUND & LITERATURE REVIEW
1. Primary Hypothesis - Dietary Pattern and Prostate Cancer
Dietary Patterns
A dietary pattern is defined as “the quantities, proportions, variety or combination
of different foods, drinks, and nutrients in diets, and the frequency with which they are
habitually consumed” (Krebs-Smith 2014). Rather than examining individual food or
nutrient consumption, dietary pattern analysis attempts to examine disease outcomes in
terms of habitual intakes of all foods, beverages, and supplements. The benefit of looking
at overall intake patterns, as opposed to individual nutrient or food intakes, is that
patterns attempt to account for “the highly interrelated nature of dietary exposures…. It is
often difficult to separate out the specific effect of nutrients or foods… in relation to
disease risk” (Jacques, Tucker 2001). The reductionist approach, or emphasizing the role
of single nutrients or foods, is useful for identifying individual foods that have substantial
health effects; however, using dietary pattern as a measure of nutritional exposure allows
for study of the health effects of food combinations, often culturally specific, on disease
prevention and outcomes (Jacobs, Steffen 2003).
Past research on the effect of dietary patterns on prostate cancer has relied on
reported food intakes of the study population to determine the dietary patterns of
analysis; the heterogeneity of diet quality assessment makes comparison and consensus
of results difficult (see Table 2.1). The earliest study to examine the relationship between
11
patterns of dietary intake and prostate cancer was a cohort study conducted by Tseng, et
al. using data from the National Health and Nutrition Examination Survey
Epidemiological Follow-up Study cohort. The pattern, characterized by high intakes of
fruits, vegetables, fish, and shellfish; a “red meat-starch” pattern, characterized by high
intakes of red meats, potatoes, salty snacks, cheese, sweets, and desserts; and a
“Southern” pattern, characterized by high intakes of beans, rice, cornbread, grits, sweet
potatoes, and okra; none of the diets were found to be significantly associated with an
increased risk of prostate cancer (Tseng, Breslow, et al. 2004). However, there was a
non-significant inverse association for both the “red meat-starch” (highest tertile vs.
lowest tertile RR: 0.8; 95% CI: 0.4-1.4) and “Southern” (RR: 0.6; 95% CI: 0.4-1.1) seen
within the American men sampled. The protective effect seen with the “red meat-starch”
pattern, given the similarity of the “red meat-starch” dietary pattern to the “Western” diet,
is counterintuitive. The “Western” diet, characterized by high intakes of fatty meats,
dairy products, refined cereals, salt, refined sugars, and refined vegetable oils, has been
shown to be associated with the high rates of chronic disease in developed nations
(Cordain, Boyd Eaton et al. 2005). Others have examined the association between the
Western diet and prostate cancer: the majority of these studies have found a significant,
positive association between a Western pattern of consumption and prostate cancer
(Ambrosini, Fritschi et al. 2008; Askari, Parizi et al. 2014; De Stafani, Ronco et al. 2010;
Walker, Aronson et al. 2005; Wu, Hu et al. 2006).
Patterns characterized by high intakes of fruit and vegetables have been shown to
offer protection against prostate cancer incidence and aggressive forms of prostate
cancer, but these associations were not statistically significant (Ambrosini, Fritschi et al.
12
2008; Askari, Parizi et al. 2014; De Stafani, Ronco et al. 2010; Jackson, Tulloch-Reid et
al. 2013; Jackson, Walker et al. 2009; Muller, Severi et al. 2009; Walker, Aronson et al.
2005; Wu, Hu et al. 2006).
Few studies have used a priori dietary pattern indexes in prostate cancer research.
The index most commonly used to assess diet in relation to prostate cancer is the MED,
or the closely related aMED. A cohort study of Swedish men did not find a significant
association between high conformity to MED and odds of prostate cancer (OR: 1.01;
95% CI: 0.75-1.37); they did find a significant, inverse relationship between eating a low-
carbohydrate, high-protein diet and prostate cancer (OR: 0.77; 95% CI: 0.61-0.96) (Ax,
Garmo et al. 2014). Bosire et al. found in a cohort of American men that a high aMED
score did not translate into a decreased risk of advanced prostate cancer diagnosis (HR:
1.00; 95% CI: 0.87-1.15); and there was no association with risk of death from prostate
cancer (HR: 0.80: 95% CI: 0.59-1.10) (Bosire, Stampfer et al. 2013). Other studies using
MED or aMED measures, including a cohort, a case-only cohort, and case-control, also
found no significant association with prostate cancer outcomes (Kenfield, Du Pre et al.
2014; Möller, Galeone et al. 2013; Muller, Severi, et al. 2009).
Only one study has used the HEI-2010 to assess diet quality when exploring
prostate cancer cases: HEI-2010 score was not significantly associated with the stage of
diagnosis (HR: 1.10; 95% CI: 0.96-1.26) or with mortality (HR: 0.96; 95% CI: 0.71-1.30)
of prostate cancer though there was an inverse association with total prostate cancer risk
for those with high adherence to the HEI-2010 dietary guidelines (HR: 0.92; 95% CI:
0.86-0.98) (Bosire, Stampfer et al. 2013). To our knowledge, the DASH index has not
been used in any prostate cancer study to date.
13
Dietary Indices
Mediterranean Diet Score
The Mediterranean diet specifically refers to food patterns typically seen in 1960s
throughout Greece, Crete, and southern Italy: diets of people residing in these areas
during the time period were characterized by high intakes of plant-based foods (fruits
vegetables, whole grains, nuts, seeds, beans, and potatoes); seasonally fresh and locally
grown foods; dessert and sweet consumption limited to a few times a week; olive oil as
the primary source of fat; low-to-moderate daily consumption of dairy products, fish, and
poultry; low consumption of red meat; and moderate wine consumption. (Willett, Sacks
et al. 1995). In the now-famous Seven Countries Study, Ansel Keys found that people
adhering to what is now known as the Mediterranean diet had greatly reduced rates of
coronary heart disease (Keys 1980). Trichopoulou et al. began scoring diets on their
adherence to traditional Mediterranean diets in their 1995 study “Diet and overall
survival in elderly people.” Median values of intakes for eight component characteristics
(vegetables, legumes, fruits and nuts, dairy products, cereals, meat and meat products,
ethanol, and monounsaturated:saturated fat ratio) were calculated: those with intakes
above the median for positive components (vegetables, legumes, fruits and nuts, cereals,
ethanol, and monounsaturated:saturated fat ratio, were given a score of 1 for that
component, and those below the median were given a score of 0; meat and meat products
and dairy products were scored in reverse. High scores (highest possible = 8) were found
to be associated with improved survival in the elderly (Trichopoulou, Kouris-Blazos et al.
1995). More recent versions have included scores for fish and poultry, increasing the
maximum score to 9, with other scoring variations being used while maintaining similar
14
food groups (Trichopoulou, Costacou wt al. 2003; Panagiotakos, Pitsavos et al. 2006;
Rumawas, Dwyer et al. 2009). Further applications have linked high MED scores to
decreased incidence of colorectal, breast, and prostate cancers (Trichopoulou, Lagiou et
al. 2000).
Dietary Approaches to Stop Hypertension Score
The Dietary Approaches to Stop Hypertension (DASH) originated in a clinical
trial of the same name: the multicenter, randomized feeding trial was designed to test the
combined effects of food on blood pressure and found that certain dietary patterns could
help control hypertension (Appel, Moore, et al. 1997). The diet emphasizes fruit,
vegetable, low-fat dairy, whole grains, poultry, fish, and nut consumption while
minimizing red meat, sweets, sugar-sweetened beverages, total fat, saturated fat, and
cholesterol intakes (Sacks, Svetkey et al. 2001). A systematic review of cohort studies
using the DASH score as a measure of dietary quality found a significant risk reduction
in cancer incidence and mortality (RR: 0.85; 95% CI: 0.82-0.88) (Schwingshackl,
Hoffmann 2015).
Mechanisms
There are several ways that diet may influence prostate cancer risk. There is
evidence to suggest that consuming certain foods may increase inflammation within the
body, while other foods decrease inflammation (Cui, Jin et al. 2012; Cavicchia, Steck et
al. 2009; Giugliano, Ceriello et al. 2006). Chronic inflammation has been linked with
certain types of cancer, including prostate cancer: inflammatory markers, specifically C-
reactive protein (CRP) are high in men with metastases, and elevated CRP is associated
with poor prognosis in men diagnosed with prostate cancer (Lehrer, Diamond et al. 2006;
15
Trautner, Cooper, et al. 1980; Latif, McMillan et al. 2002). Dietary fat may produce DNA
damage through fatty acid oxidation into lipid radicals, increasing circulating androgen
concentrations, inhibiting healthy cell communication and transduction, and negatively
impacting the immune system (Kolonel 2001). Food preparation methods, especially
charring meat, may also introduce carcinogens into the body, elevating cancer risk (De
Marzo, Nakai et al. 2007; John, Stern et al. 2011). Fruits and vegetables contain a number
of anticarcinogenic substances (such as carotenoids, flavonoids, isoflavones, among
others), which can decrease cell proliferation, regulate DNA methylation, and increase
apoptosis of cancer cells (Steinmetz, Potter 1996). Fiber, which increases sex-hormone-
binding globulin and improves insulin sensitivity, may decrease prostate cancer risk by
reducing androgen levels in the blood and controlling antiapoptotic effects of circulating
insulin (Tabung, Steck et al. 2012; Chan, Stampfer et al. 1998). Alcohol consumption,
regardless of type, increases serum estrogen while decreasing androgens; it also weakens
cell defenses against carcinogens (Dennis, Hayes 2001).
Potential Confounders
Age
Age is a known risk factor of prostate cancer: prostate cancer incidence is
positively correlated with increasing age, peaking in the 65-74 age group (Howlander,
Noone et al. 2014). In men under the age of 60, prostate cancer prevalence is much lower
than other cancer types (Jemal, Siegel et al. 2009). Screening frequency decreases as age
increases, and prostate cancer prognoses worsen with age (Zeliadt, Penson et al. 2003;
Grönberg, Damber et al. 1994).
16
Family History
Another known risk factor for prostate cancer is family history. A diagnosis of a
first-degree relation (father or brother) with prostate cancer approximately doubles a
man’s prostate cancer risk; risk increases with the number of affected relatives (Crawford
2003; Grönberg 2003). Genetics and common environment both play a role, though
heritable genetic variations are estimated to contribute to 43% of cases diagnosed in the
aged 55 and younger; genetics confer less risk as age of diagnosis increases (Carter,
Beaty et la. 1992). Men with a familial history also tend to be diagnosed before the age of
60, due in part to a greater propensity to receive prostate cancer screening (Bratt, Garmo
et al., 2010; Crawford 2003).
Screening
Previously, prostate cancer screening was recommended for all men beginning at
age 50; with the release of the U.S. Preventive Task Force report on prostate cancer
screening recommendations, only men with known risk factors or who are exhibiting
symptoms are recommended to be tested. Current screening methods include the PSA test
and the DRE: the PSA tests measures the level of PSA in blood serum (higher levels are
associated with prostate cancer), while the DRE requires a physician to digitally feel the
prostate for lumps, tenderness, hard areas, or general enlargement (Barrett 2002). AA
men are less likely than EA men to be screened for prostate cancer, and screening is less
likely to improve stage at diagnosis for AA men than EA men (Jones, Liu et al. 2008;
Carpenter, Howard et al. 2009; Carpenter, Godley et al. 2010; Conlisk, Lengerich et al.
1999). The high rates of survival associated with early stage prostate cancer have been

17
partially attributed to proactive screening programs in the last 20 years (Howlander,
Noone 2014).
Stage and Grade at Diagnosis
Prostate cancer progression is measured in four intervals according to the
American Joint Committee on Cancer (AJCC) Tumor, Nodes, Metastases (TNM) system.
In first stage prostate cancer, T1, the physician is unable to feel or see the tumor; often
cancer in this stage is found incidentally or as a result of increased PSA levels.
Progression to the next stage, T2, is characterized by tumor(s) that are able to be felt
(with a DRE) or seen by ultrasound. T2 prostate cancer is still confined to the prostate.
When the cancer has grown outside of the prostate, particularly the seminal vesicles, T3
cancer is diagnosed; further spreading of the cancer cells from the prostate to the rectum
and bladder tissues or bone marrow is classified as T4, or late stage prostate cancer
(American Cancer Society 2015).
The Gleason system grades cancer tissues by appearance (as viewed under a
microscope) and is the most common grading system for prostate cancers. Possible
Gleason scores range from 2 (indicating well-differentiated cells in both primary and
secondary patterns) to 10 (indicating poorly-differentiated cells in both primary and
secondary patterns). Both cancer stage and grade are associated with prostate cancer
outcomes, with later stage and higher grade cancers displaying higher mortality rates and
shorter survival times (Drake, Keane et al. 2006; Gandaglia, Karakiewicz et al. 2014).
Comorbidities
Comorbid conditions that are often found with prostate cancer include
cardiovascular disease, hypertension, and diabetes; the Charlson Index uses a weighted
18
impact score to estimate the impact of these conditions on mortality (Charlson, Pompei et
al. 1987). A greater Charlson score in prostate cancer cases increases the risk of non-
prostate cancer mortality, and this effect is greater in EA men than AA men (Chamie,
Daskivich et al 2011; Putt, Long et al. 2009). In prostate cancer cases where comorbidity
is high, non-aggressive treatments are recommended because of the greater risk of death
from other causes (Daskivich, Chamie et al. 2011).
Socioeconomic Status
Lower socioeconomic status has been shown to be associated with higher cancer
risk and mortality rates, yet for prostate cancer, higher SES is associated with increased
risk of prostate cancer diagnosis (Clegg, Reichman et al. 2009; Major, Norman Oliver et
al. 2012). This phenomenon is often attributed to regular prostate cancer screenings in
more affluent men, and is reflected in lower mortality rates for men of higher SES
(Clegg, Reichman et al. 2009; Byers, Wolf et la. 2008). Education level, a common proxy
for SES, is also associated with increased prostate cancer incidence, likely due to
increased awareness of prostate cancer screening (Clegg, Reichman et al. 2009).
Increased rates of insurance and access to health care, along with better quality health
care likely account for better prostate cancer outcomes in those with greater SES (Du,
Fang et al. 2006; Major, Norman Oliver et al. 2012).
Body Mass Index
Higher body mass index (BMI) has been found to be associated with increased
risk of aggressive forms of prostate cancer and prostate cancer mortality (Su, Arab et al.
2011; Rodriguez et al. 2001; Hague, Van Den Eeden et al. 2014; Stacewicz-Sapuntzakis,
Borthakur et al. 2008). Interestingly, one study found that high BMI increased the risk of
19
aggressive prostate cancer but offered protection for less-aggressive forms of the disease
(Giovannucci, Liu et al. 2007). Excess weight may increase androgen production, leading
to increased risk of prostate cancer by loss of tumor control (Stacewicz-Sapuntzakis,
Borthakur et al. 2008).
Physical Activity
Physical activity may lower risk of prostate cancer (Whittemore, Kolonel et al.
1995; Giovannucci, Liu et al. 2007). A meta-analysis found consistent, protective effects
of occupational, recreational, and total physical activity (Liu, Hu et al. 2011). The
mechanisms of physical activity’s effect on prostate cancer are unclear, but proposed
causes include enhanced immune systems, decreased hormone levels, and lower BMI
(Lee, Sesso et al. 2001).
Smoking
Smoking is a known causative agent of lung cancer, and has been shown to
increase the risk of other cancers; however, evidence that smoking affects prostate cancer
risk is inconclusive, as seen in Hickey et al.’s systematic review (2001). Several cohort
and nested case-control studies have found positive but weak associations between
smoking and prostate cancer incidence, but more have found no association at all
(Hickey, Do et al. 2001; Giovannucci, Rimm et al. 1993). Smoking is known to affect
male hormone levels, increase genetic mutation rates, and decrease immune function;
upon this biological basis, smoking may be associated with prostate cancer, despite a lack
of epidemiological evidence (Hickey, Du et al. 2001). The U.S. Surgeon General has
concluded that smoking is a ‘probable’ contributor to prostate cancer mortality (US
Department of Health and Human Services 2004).
20
Alcohol
There are inconsistent findings on the effect of alcohol on prostate cancer risk.
One systematic review found moderate alcohol consumption (less than or equal to three
drinks per day) is not associated with prostate cancer risk, but imbibing seven or more
alcoholic drinks per day may increase prostate cancer risk (Dennis, Hayes 2001). A meta-
analysis of alcohol dose response found no association with prostate cancer, even at high
doses (Rota, Scotti et al. 2012). Alcohol may increase cell permeability and inhibit cell
repair mechanisms, leading to prostate cancer susceptibility (Dennis, Hayes 2001; Garro,
Lieber 1990).
Non Steroidal Anti-Inflammatory Drugs
Non steroidal anti-inflammatory drugs (NSAIDs) help decrease inflammation and
reduce pain and fever. Common NSAID medications include aspirin, ibuprofen, and
naproxen; regular use of these medications may confer a reduced risk of prostate cancer
by reducing the damaging effects of chronic inflammation and inhibiting cyclooxygenase
(COX) enzymes (Bosetti, Rosato et al. 2014; Wagenlehner et al. 2007). COX inhibitors
have shown pro-apoptotic properties thought to regulate cell proliferation (Fleshner,
Zlotta 2007). However, long-term use of some NSAIDs causes increased risk of
cardiovascular problems and gastrointestinal bleeding, and severe side effects must be
considered.
Fats and Animal Meats
There is strong evidence that higher intakes of dietary fat and animal meats
increase prostate cancer risk. Several ecologic studies have found a positive association
between fat consumption and prostate cancer mortality and incidence (Stacewicz-
21
Sapuntzakis, Borthakor et al. 2008; Rose, Boyar et al. 1986; Kolonel 2001). Cohort
studies have consistently found strong, positive associations between saturated fat, animal
fat, and meat consumption and prostate cancer (Stacewicz-Sapuntzakis, Borthakor et al.
2008; Whittemore, Kolonel et al. 1991; Kolonel 2001; Hayes, Ziegler et al. 1999). In a
study of Hawaii residents, high intake of saturated fats was estimated to account for 13%
of prostate cancer cases (Hankin, Zhao et al. 1992); between 10-15% of the disparity in
prostate cancer cases among AA, EA, and Asian American men has been attributed to
differences in saturated fat intakes (Crawford 2003).
Dairy Products, Calcium, and Vitamin D
There is probable evidence that diets high in calcium increase prostate cancer risk,
though evidence that dairy products themselves increase risk is more limited (World
Cancer Research Fund/American Institute for Cancer Research 2007). A meta-analysis
conducted by Aune, et al. found that high intakes of total dairy products, milk, cheese,
total calcium, and dairy calcium were associated with increased risk of prostate cancer
(2015). Pettersson et al. found that whole milk consumption after prostate cancer
diagnosis was positively associated with fatal outcomes (Pettersoson, Ksperzyk et al.
2012; Song, Chavarro et al. 2013). However, calcium and dairy product intakes do not
necessarily correlate, and results for one should not be interpreted for the other (Aune,
Navarro Rosenblatt et al. 2015).
Vitamin D has been shown to exhibit anticancer effects on prostate cancer cells in
laboratory settings (Schwartz 2009; Beer, Myrthue 2006). Studies on sunlight exposure
and prostate cancer have shown generally positive benefits for increased UV exposure
and prostate cancer outcomes (Schwartz 2013). It is hypothesized that “vitamin D
22
maintains the normal phenotype of prostatic cells and that vitamin D deficiency permit[s]
the development of clinical prostate cancer from preclinical precursors,” though benefits
of vitamin D may vary by calcium levels (Schwartz 2013).
Fruits and Vegetables
High intakes of vegetables and fruits are the basis of most healthy diet
recommendations, since the high nutrient density and low calorie density of these foods
help maintain healthy weight and optimal body functions. Many antioxidants and
flavonoids are found in fruits and vegetables, yet the literature does not provide
convincing evidence that overall vegetable and fruit intakes affect prostate cancer
outcomes in the United States (Stacewicz-Sapuntzakis, Borthakor et al. 2008; Wu, Hu et
al. 2006). Cruciferous vegetables, including broccoli, cabbage, and Brussel sprouts,
contain isothiocyanates which have demonstrated anticancer properties in laboratory and
in vivo setting (Sing, Srivastava et al. 2005; Melchini, Traka et al 2013). Fiber is also a
beneficial component of fruits and vegetables. Previously in PCaP, higher fiber intake
was associated with reduced odds of high aggressive prostate cancer (Tabung, Steck et al.
2012).
Lycopene, Tomatoes, and Tomato-based products
While all vegetables are recommended for their numerous health benefits,
tomatoes in particular, which contain lycopene, have been shown to offer protection
against prostate cancer. Lycopene is a powerful antioxidant that may also help in DNA
repair. Two meta-analyses found modest protective effects of lycopene (Etminan,
Takkouche et al. 2004; Chen, Song et al. 2013). A review by the U.S. Food and Drug
Administration (FDA) concluded that there is limited evidence supporting tomato and
23
lycopene consumption as a method of decreasing prostate cancer risk (Kavanaugh,
Trumbo et al. 2007).
Fish/omega-3
Fish and fish oil (primarily omega-3 fatty acids) consumption do not have conclusive
evidence of a positive or negative association with prostate cancer incidence, though a
meta-analysis found a 63% percent reduction in cancer-specific mortality for men with
the high levels of intake (Szymanski, Wheeler et al. 2010). Most studies, regardless of
design, have found null or insignificant improvement in prostate cancer risk with
increasing fish oil or omega-3 fatty acid intakes (Willett 1997).
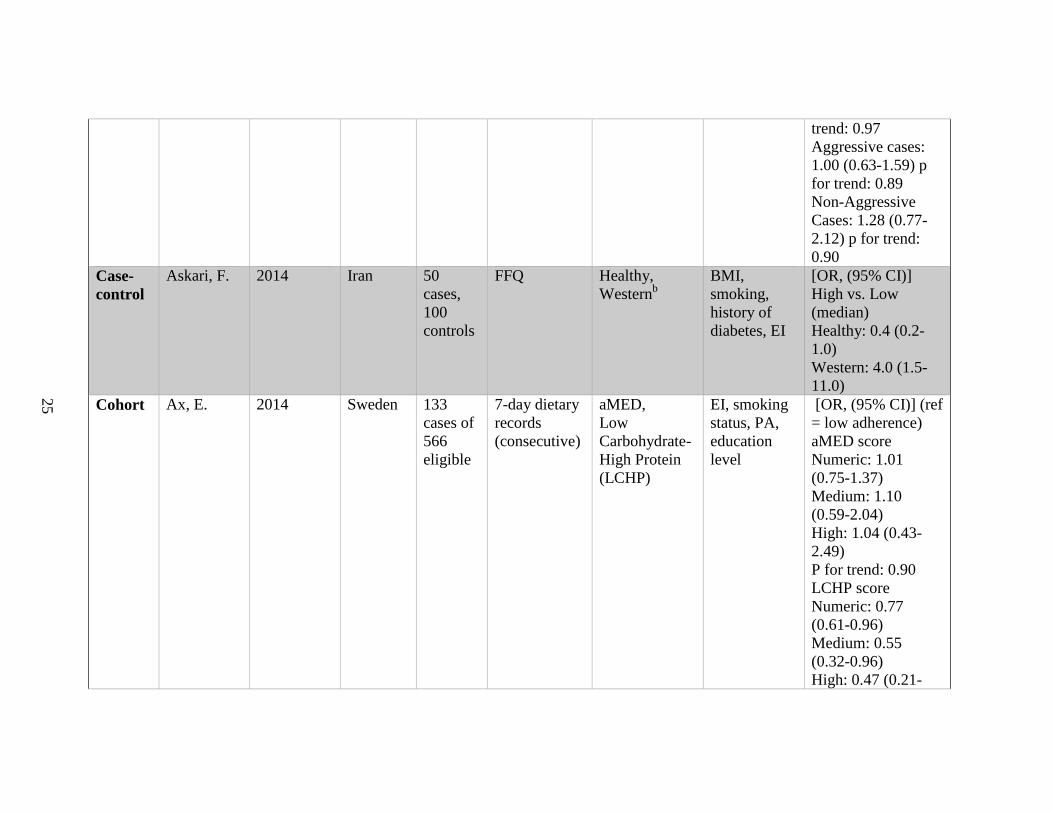
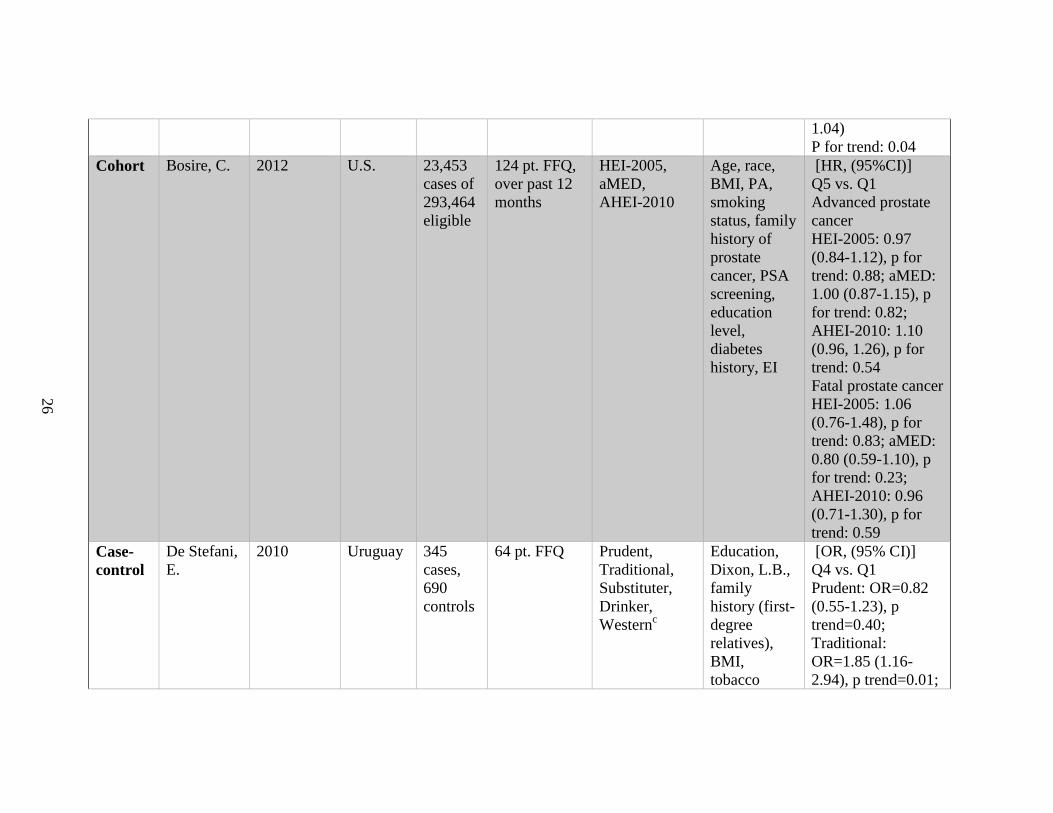
24
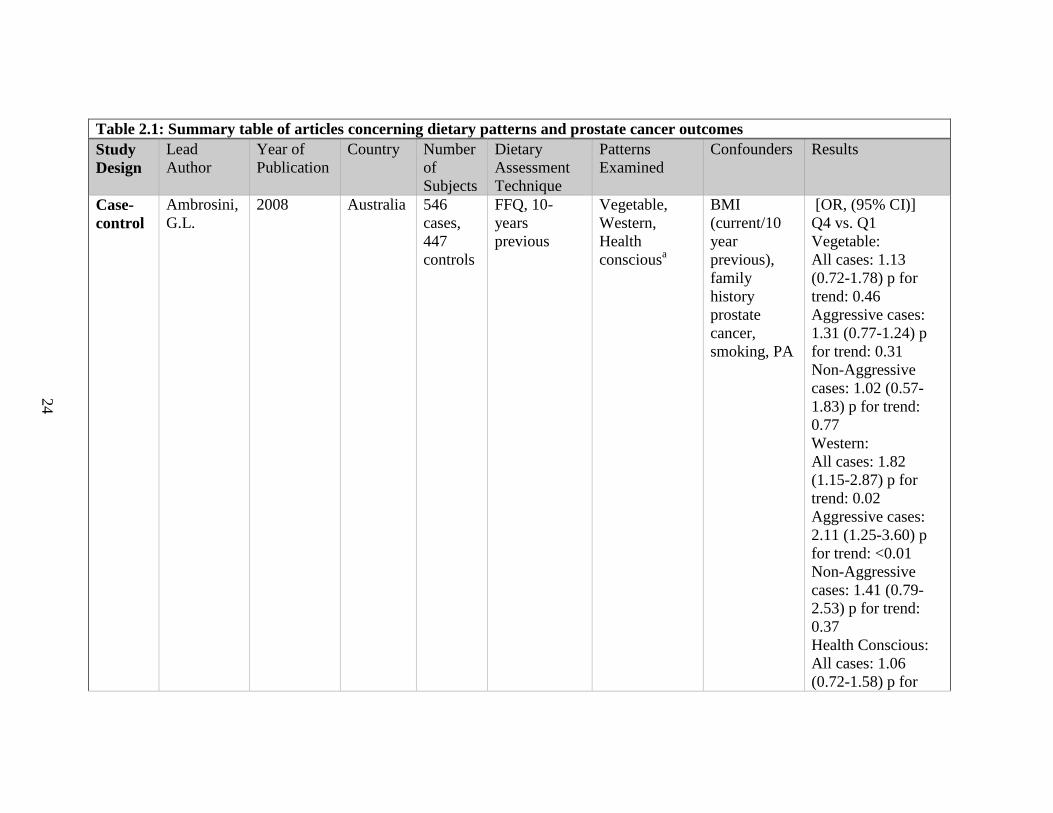
Table 2.1: Summary table of articles concerning dietary patterns and prostate cancer outcomes
Study
Design
Lead
Author
Year of
Publication
Country Number
of
Subjects
Dietary
Assessment
Technique
Patterns
Examined
Confounders Results
Case-
control
Ambrosini,
G.L.
2008 Australia 546
cases,
447
controls
FFQ, 10-
years
previous
Vegetable,
Western,
Health
consciousa
BMI
(current/10
year
previous),
family
history
prostate
cancer,
smoking, PA
[OR, (95% CI)]
Q4 vs. Q1
Vegetable:
All cases: 1.13
(0.72-1.78) p for
trend: 0.46
Aggressive cases:
1.31 (0.77-1.24) p
for trend: 0.31
Non-Aggressive
cases: 1.02 (0.57-
1.83) p for trend:
0.77
Western:
All cases: 1.82
(1.15-2.87) p for
trend: 0.02
Aggressive cases:
2.11 (1.25-3.60) p
for trend: <0.01
Non-Aggressive
cases: 1.41 (0.79-
2.53) p for trend:
0.37
Health Conscious:
All cases: 1.06
(0.72-1.58) p for
25
trend: 0.97
Aggressive cases:
1.00 (0.63-1.59) p
for trend: 0.89
Non-Aggressive
Cases: 1.28 (0.77-
2.12) p for trend:
0.90
Case-
control
Askari, F. 2014 Iran 50
cases,
100
controls
FFQ Healthy,
Westernb
BMI,
smoking,
history of
diabetes, EI
[OR, (95% CI)]
High vs. Low
(median)
Healthy: 0.4 (0.2-
1.0)
Western: 4.0 (1.5-
11.0)
Cohort Ax, E. 2014 Sweden 133
cases of
566
eligible
7-day dietary
records
(consecutive)
aMED,
Low
Carbohydrate-
High Protein
(LCHP)
EI, smoking
status, PA,
education
level
[OR, (95% CI)] (ref
= low adherence)
aMED score
Numeric: 1.01
(0.75-1.37)
Medium: 1.10
(0.59-2.04)
High: 1.04 (0.43-
2.49)
P for trend: 0.90
LCHP score
Numeric: 0.77
(0.61-0.96)
Medium: 0.55
(0.32-0.96)
High: 0.47 (0.21-
26
1.04)
P for trend: 0.04
Cohort Bosire, C. 2012 U.S. 23,453
cases of
293,464
eligible
124 pt. FFQ,
over past 12
months
HEI-2005,
aMED,
AHEI-2010
Age, race,
BMI, PA,
smoking
status, family
history of
prostate
cancer, PSA
screening,
education
level,
diabetes
history, EI
[HR, (95%CI)]
Q5 vs. Q1
Advanced prostate
cancer
HEI-2005: 0.97
(0.84-1.12), p for
trend: 0.88; aMED:
1.00 (0.87-1.15), p
for trend: 0.82;
AHEI-2010: 1.10
(0.96, 1.26), p for
trend: 0.54
Fatal prostate cancer
HEI-2005: 1.06
(0.76-1.48), p for
trend: 0.83; aMED:
0.80 (0.59-1.10), p
for trend: 0.23;
AHEI-2010: 0.96
(0.71-1.30), p for
trend: 0.59
Case-
control
De Stefani,
E.
2010 Uruguay 345
cases,
690
controls
64 pt. FFQ Prudent,
Traditional,
Substituter,
Drinker,
Westernc
Education,
Dixon, L.B.,
family
history (first-
degree
relatives),
BMI,
tobacco
[OR, (95% CI)]
Q4 vs. Q1
Prudent: OR=0.82
(0.55-1.23), p
trend=0.40;
Traditional:
OR=1.85 (1.16-
2.94), p trend=0.01;
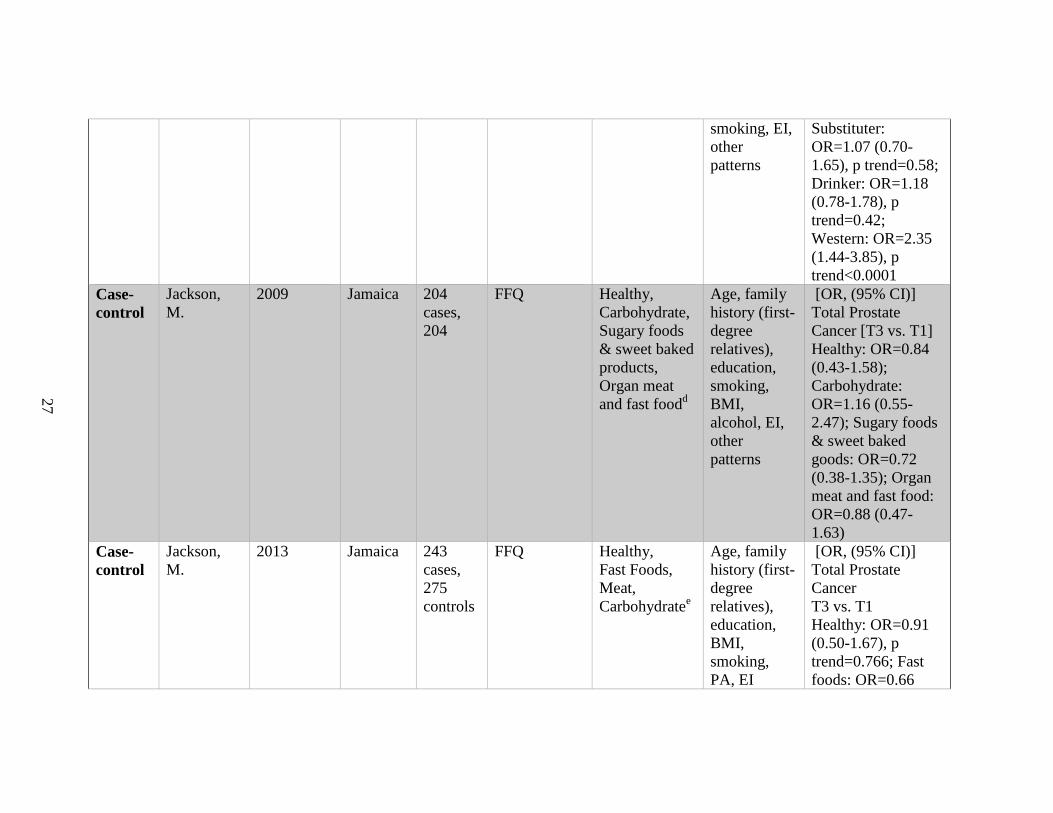
27
smoking, EI,
other
patterns
Substituter:
OR=1.07 (0.70-
1.65), p trend=0.58;
Drinker: OR=1.18
(0.78-1.78), p
trend=0.42;
Western: OR=2.35
(1.44-3.85), p
trend<0.0001
Case-
control
Jackson,
M.
2009 Jamaica 204
cases,
204
FFQ Healthy,
Carbohydrate,
Sugary foods
& sweet baked
products,
Organ meat
and fast foodd
Age, family
history (first-
degree
relatives),
education,
smoking,
BMI,
alcohol, EI,
other
patterns
[OR, (95% CI)]
Total Prostate
Cancer [T3 vs. T1]
Healthy: OR=0.84
(0.43-1.58);
Carbohydrate:
OR=1.16 (0.55-
2.47); Sugary foods
& sweet baked
goods: OR=0.72
(0.38-1.35); Organ
meat and fast food:
OR=0.88 (0.47-
1.63)
Case-
control
Jackson,
M.
2013 Jamaica 243
cases,
275
controls
FFQ Healthy,
Fast Foods,
Meat,
Carbohydratee
Age, family
history (first-
degree
relatives),
education,
BMI,
smoking,
PA, EI
[OR, (95% CI)]
Total Prostate
Cancer
T3 vs. T1
Healthy: OR=0.91
(0.50-1.67), p
trend=0.766; Fast
foods: OR=0.66
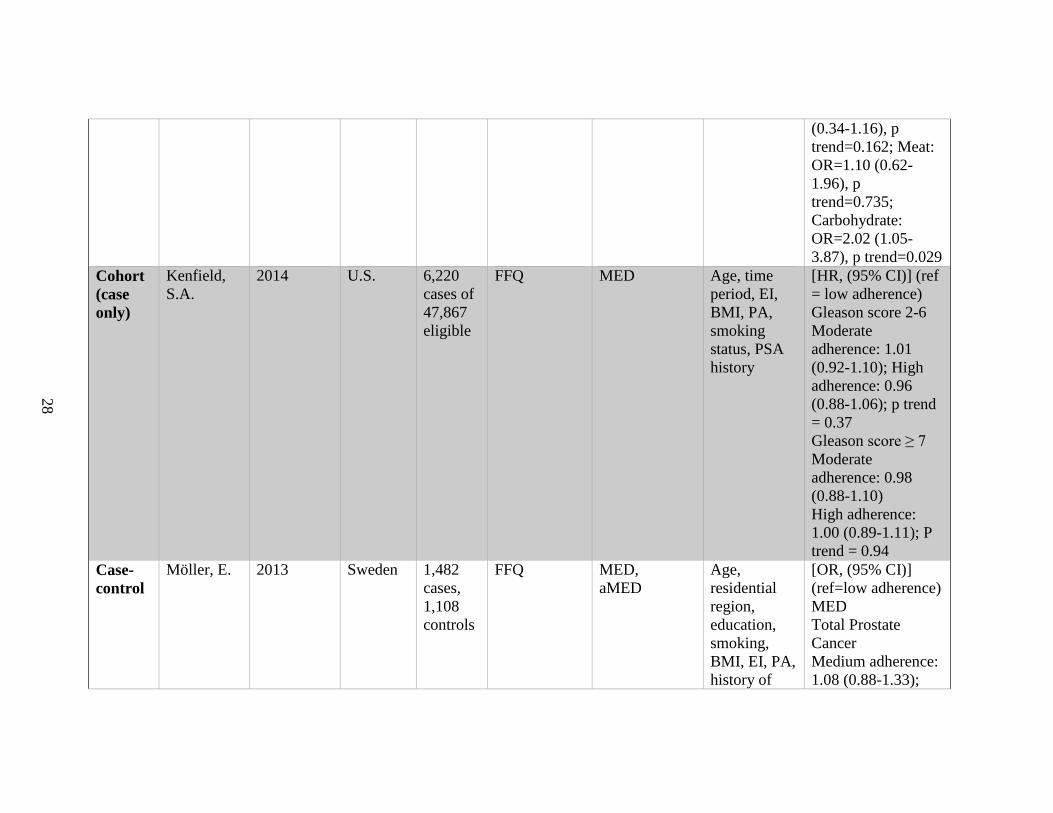
28
(0.34-1.16), p
trend=0.162; Meat:
OR=1.10 (0.62-
1.96), p
trend=0.735;
Carbohydrate:
OR=2.02 (1.05-
3.87), p trend=0.029
Cohort
(case
only)
Kenfield,
S.A.
2014 U.S. 6,220
cases of
47,867
eligible
FFQ MED Age, time
period, EI,
BMI, PA,
smoking
status, PSA
history
[HR, (95% CI)] (ref
= low adherence)
Gleason score 2-6
Moderate
adherence: 1.01
(0.92-1.10); High
adherence: 0.96
(0.88-1.06); p trend
= 0.37
Gleason score ≥ 7
Moderate
adherence: 0.98
(0.88-1.10)
High adherence:
1.00 (0.89-1.11); P
trend = 0.94
Case-
control
Möller, E. 2013 Sweden 1,482
cases,
1,108
controls
FFQ MED,
aMED
Age,
residential
region,
education,
smoking,
BMI, EI, PA,
history of
[OR, (95% CI)]
(ref=low adherence)
MED
Total Prostate
Cancer
Medium adherence:
1.08 (0.88-1.33);
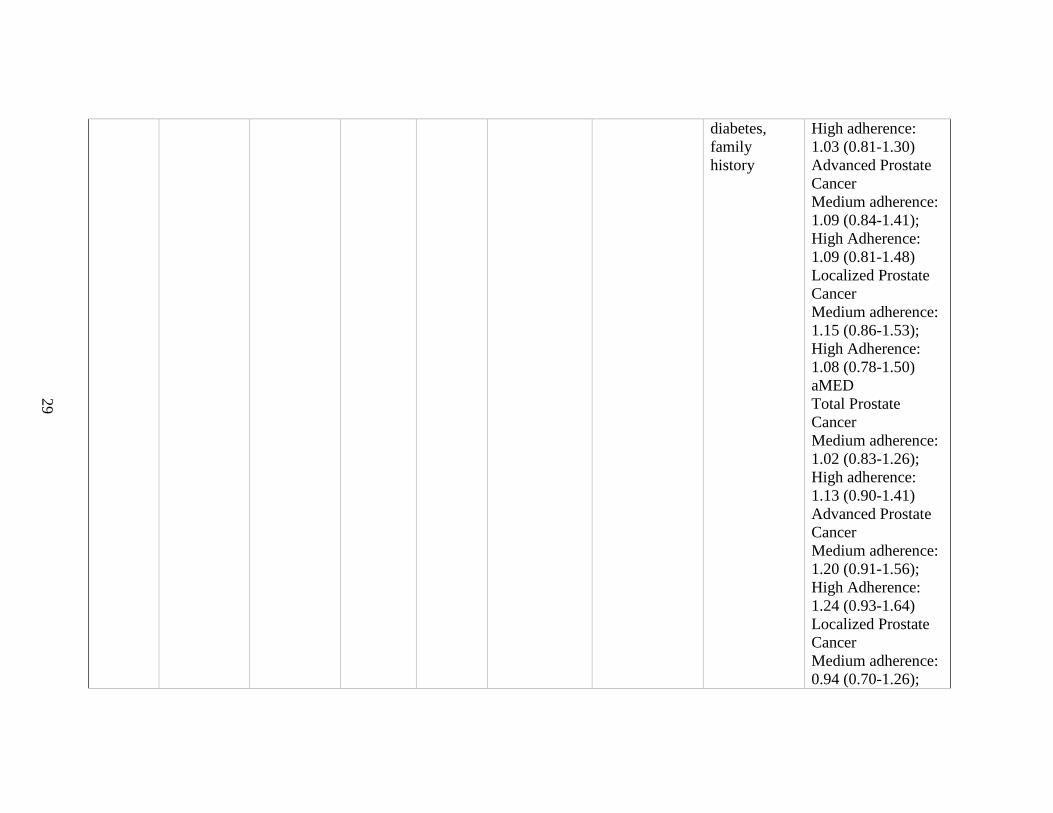
29
diabetes,
family
history
High adherence:
1.03 (0.81-1.30)
Advanced Prostate
Cancer
Medium adherence:
1.09 (0.84-1.41);
High Adherence:
1.09 (0.81-1.48)
Localized Prostate
Cancer
Medium adherence:
1.15 (0.86-1.53);
High Adherence:
1.08 (0.78-1.50)
aMED
Total Prostate
Cancer
Medium adherence:
1.02 (0.83-1.26);
High adherence:
1.13 (0.90-1.41)
Advanced Prostate
Cancer
Medium adherence:
1.20 (0.91-1.56);
High Adherence:
1.24 (0.93-1.64)
Localized Prostate
Cancer
Medium adherence:
0.94 (0.70-1.26);
30
High Adherence:
1.12 (0.83-1.52)
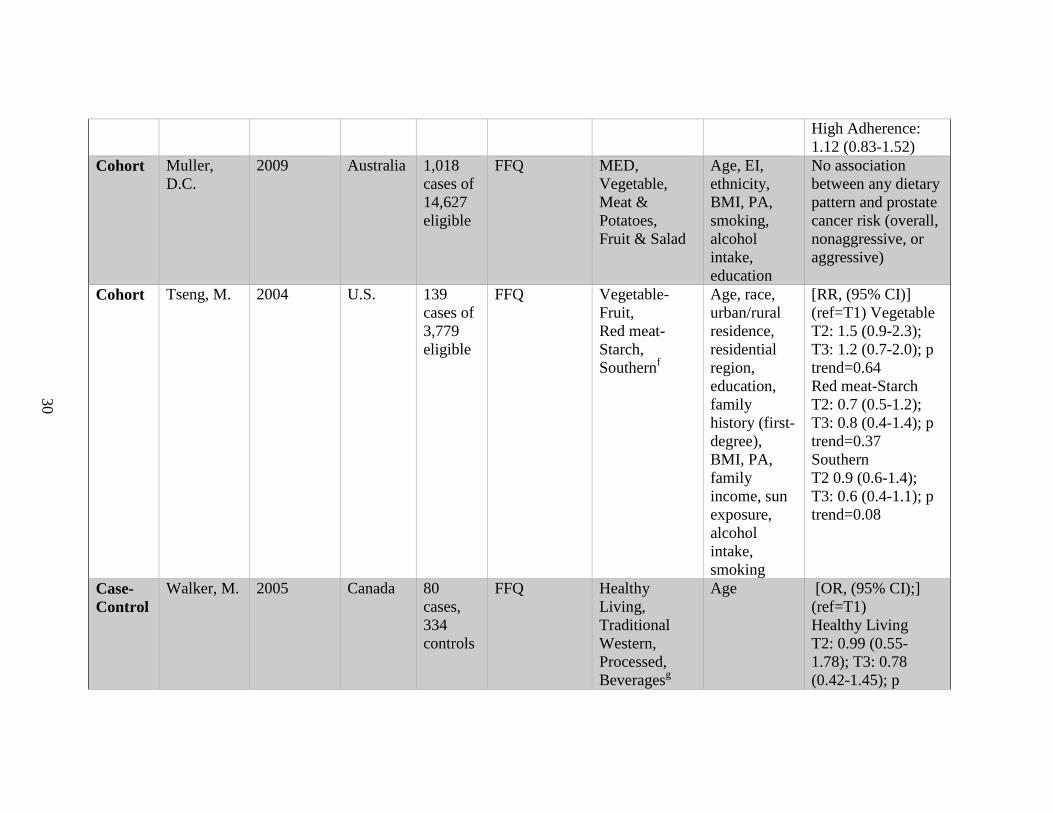
Cohort Muller,
D.C.
2009 Australia 1,018
cases of
14,627
eligible
FFQ MED,
Vegetable,
Meat &
Potatoes,
Fruit & Salad
Age, EI,
ethnicity,
BMI, PA,
smoking,
alcohol
intake,
education
No association
between any dietary
pattern and prostate
cancer risk (overall,
nonaggressive, or
aggressive)
Cohort Tseng, M. 2004 U.S. 139
cases of
3,779
eligible
FFQ Vegetable-
Fruit,
Red meat-
Starch,
Southernf
Age, race,
urban/rural
residence,
residential
region,
education,
family
history (first-
degree),
BMI, PA,
family
income, sun
exposure,
alcohol
intake,
smoking
[RR, (95% CI)]
(ref=T1) Vegetable
T2: 1.5 (0.9-2.3);
T3: 1.2 (0.7-2.0); p
trend=0.64
Red meat-Starch
T2: 0.7 (0.5-1.2);
T3: 0.8 (0.4-1.4); p
trend=0.37
Southern
T2 0.9 (0.6-1.4);
T3: 0.6 (0.4-1.1); p
trend=0.08
Case-
Control
Walker, M. 2005 Canada 80
cases,
334
controls
FFQ Healthy
Living,
Traditional
Western,
Processed,
Beveragesg
Age [OR, (95% CI);]
(ref=T1)
Healthy Living
T2: 0.99 (0.55-
1.78); T3: 0.78
(0.42-1.45); p
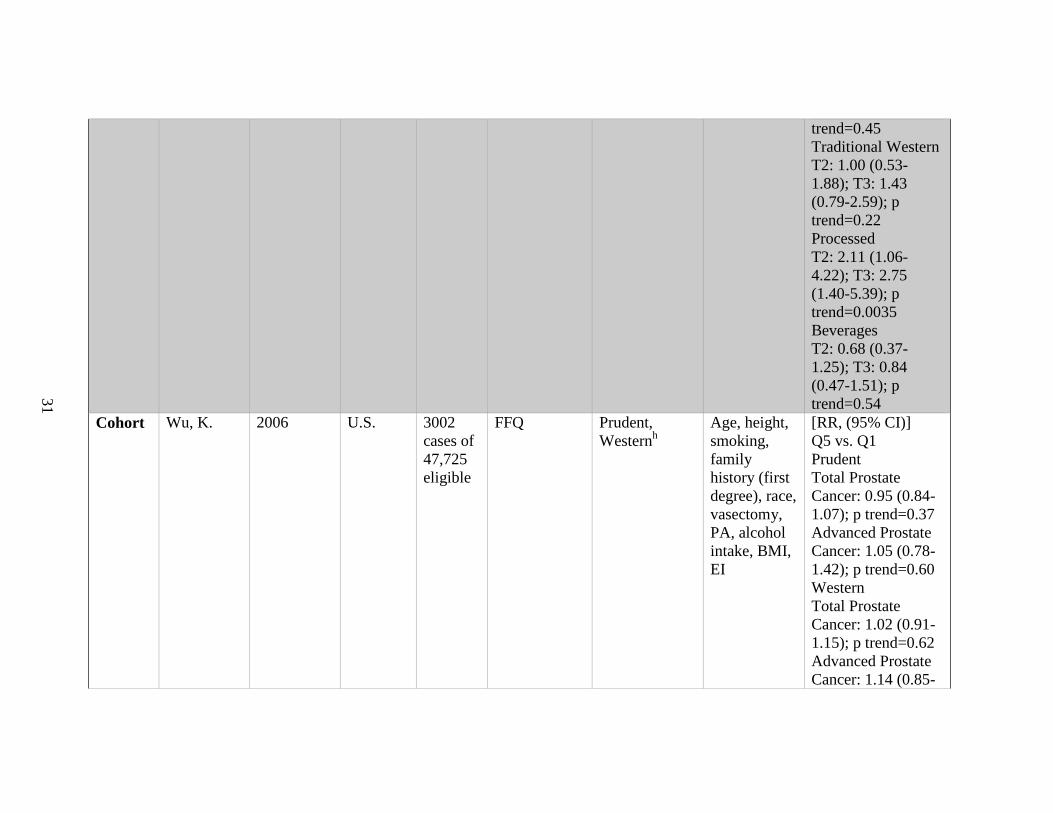
31
trend=0.45
Traditional Western
T2: 1.00 (0.53-
1.88); T3: 1.43
(0.79-2.59); p
trend=0.22
Processed
T2: 2.11 (1.06-
4.22); T3: 2.75
(1.40-5.39); p
trend=0.0035
Beverages
T2: 0.68 (0.37-
1.25); T3: 0.84
(0.47-1.51); p
trend=0.54
Cohort Wu, K. 2006 U.S. 3002
cases of
47,725
eligible
FFQ Prudent,
Westernh
Age, height,
smoking,
family
history (first
degree), race,
vasectomy,
PA, alcohol
intake, BMI,
EI
[RR, (95% CI)]
Q5 vs. Q1
Prudent
Total Prostate
Cancer: 0.95 (0.84-
1.07); p trend=0.37
Advanced Prostate
Cancer: 1.05 (0.78-
1.42); p trend=0.60
Western
Total Prostate
Cancer: 1.02 (0.91-
1.15); p trend=0.62
Advanced Prostate
Cancer: 1.14 (0.85-
32
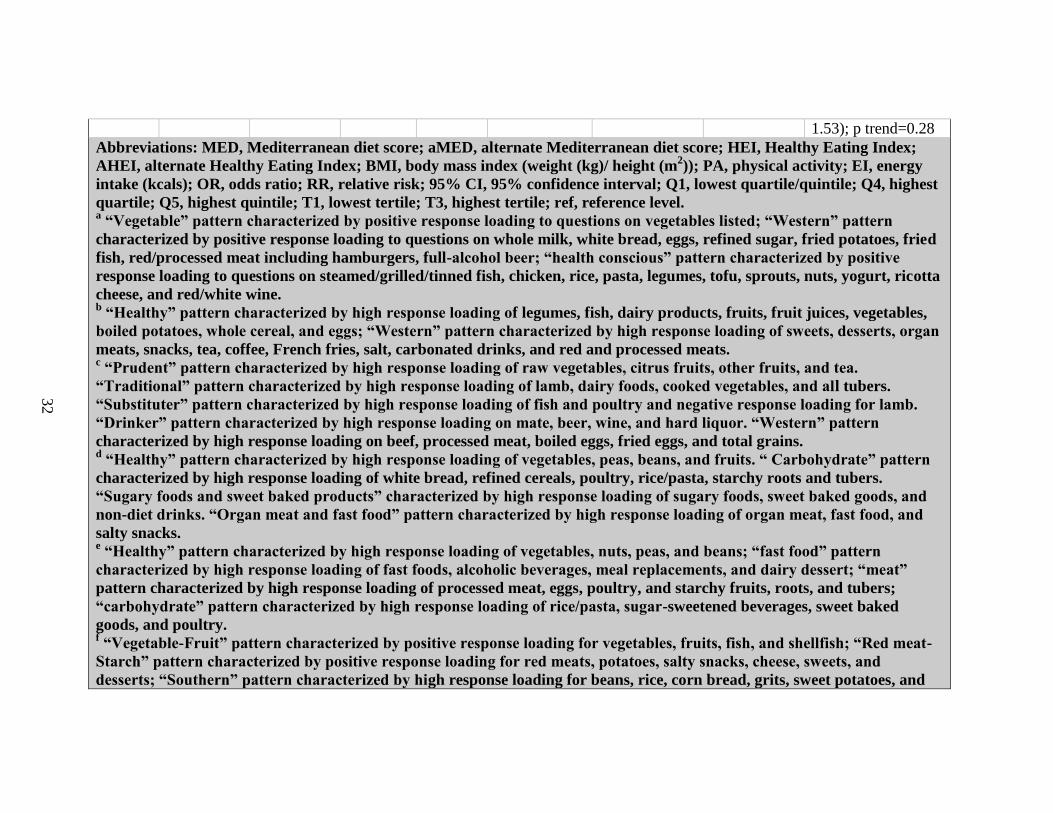
1.53); p trend=0.28
Abbreviations: MED, Mediterranean diet score; aMED, alternate Mediterranean diet score; HEI, Healthy Eating Index;
AHEI, alternate Healthy Eating Index; BMI, body mass index (weight (kg)/ height (m2)); PA, physical activity; EI, energy
intake (kcals); OR, odds ratio; RR, relative risk; 95% CI, 95% confidence interval; Q1, lowest quartile/quintile; Q4, highest
quartile; Q5, highest quintile; T1, lowest tertile; T3, highest tertile; ref, reference level. a “Vegetable” pattern characterized by positive response loading to questions on vegetables listed; “Western” pattern
characterized by positive response loading to questions on whole milk, white bread, eggs, refined sugar, fried potatoes, fried
fish, red/processed meat including hamburgers, full-alcohol beer; “health conscious” pattern characterized by positive
response loading to questions on steamed/grilled/tinned fish, chicken, rice, pasta, legumes, tofu, sprouts, nuts, yogurt, ricotta
cheese, and red/white wine. b “Healthy” pattern characterized by high response loading of legumes, fish, dairy products, fruits, fruit juices, vegetables,
boiled potatoes, whole cereal, and eggs; “Western” pattern characterized by high response loading of sweets, desserts, organ
meats, snacks, tea, coffee, French fries, salt, carbonated drinks, and red and processed meats. c “Prudent” pattern characterized by high response loading of raw vegetables, citrus fruits, other fruits, and tea.
“Traditional” pattern characterized by high response loading of lamb, dairy foods, cooked vegetables, and all tubers.
“Substituter” pattern characterized by high response loading of fish and poultry and negative response loading for lamb.
“Drinker” pattern characterized by high response loading on mate, beer, wine, and hard liquor. “Western” pattern
characterized by high response loading on beef, processed meat, boiled eggs, fried eggs, and total grains. d “Healthy” pattern characterized by high response loading of vegetables, peas, beans, and fruits. “ Carbohydrate” pattern
characterized by high response loading of white bread, refined cereals, poultry, rice/pasta, starchy roots and tubers.
“Sugary foods and sweet baked products” characterized by high response loading of sugary foods, sweet baked goods, and
non-diet drinks. “Organ meat and fast food” pattern characterized by high response loading of organ meat, fast food, and
salty snacks. e “Healthy” pattern characterized by high response loading of vegetables, nuts, peas, and beans; “fast food” pattern
characterized by high response loading of fast foods, alcoholic beverages, meal replacements, and dairy dessert; “meat”
pattern characterized by high response loading of processed meat, eggs, poultry, and starchy fruits, roots, and tubers;
“carbohydrate” pattern characterized by high response loading of rice/pasta, sugar-sweetened beverages, sweet baked
goods, and poultry. f “Vegetable-Fruit” pattern characterized by positive response loading for vegetables, fruits, fish, and shellfish; “Red meat-
Starch” pattern characterized by positive response loading for red meats, potatoes, salty snacks, cheese, sweets, and
desserts; “Southern” pattern characterized by high response loading for beans, rice, corn bread, grits, sweet potatoes, and
33
okra. g “Healthy Living” pattern characterized by high response loading of vegetables, fruits, whole grains, fish, and poultry;
“traditional western” pattern characterized by high response loading of red meats, processed meats, milk, sweets, and hard
liquor; “processed” pattern characterized by high response loading of processed meats, red meats, organ meats, refined
grains, onions, tomatoes, vegetable oils, juices, bottled water, and soft drinks; “beverages” pattern was characterized by
high response loading of tap water, soft drinks, fruit juices, potatoes, poultry and margarine, and inversely associated with
beer, liquor, wine, and cream in coffee. h “Prudent pattern characterized by high response loading of fruits, vegetables, whole grains, fish, and poultry; “Western”
pattern characterized by high response loading of red and processed meats, refined grains, and high-fat dairy.
34
CHAPTER 3
RESEARCH METHODS
1. Background
This study utilized data from the North Carolina-Louisiana Prostate Cancer
Project (PCaP), a population-based, case-only study designed to study racial differences
in prostate cancer aggressiveness and survival. This research was designated as part of
Project 3, nutritional modulation of prostate cancer aggressiveness, of the PCaP structure.
2. Sample Size
A total of 2,258 men were recruited for participation in the PCaP sample
population: of these, 1,130 identified as AA and 1,128 identify as EA. Approximately
half (52%) of the participating men were North Carolina residents; the remaining men all
resided in Louisiana.
3. PCaP Methods
Study Population
As stated in paper “The North Carolina-Louisiana Prostate Cancer Project
(PCaP): Methods and Design of a Multidisciplinary Population-Based Cohort Study of
Racial Differences in Prostate Cancer Outcomes,” by Schroeder et al., “residents of the
North Carolina and Louisiana study areas with a first diagnosis of histologically
confirmed adenocarcinoma of the prostate [were] eligible to participate if they [were] 40-
79 years old at diagnosis, [could] complete the study interview in English, [did] not live
in an institution (nursing home), [were] not cognitively impaired or in a severe debilitated
35
physical state, and [were] not under the influence of alcohol, severely medicated, or
apparently psychotic at the time of the interview.
“Eligible men also must self-identify as at least part African American/Black or
Caucasian American/White in response to the open-ended interview question, ‘what is
your race?’ Participants who indicated more than one group [were] asked if one best
describes them; if not, multiple groups [were] recorded. This classification may be used
as a proxy measure of race/ethnicity as a social construct or as a proxy measure of race as
a biologic construct, as deemed appropriate for the individual PCaP Consortium projects.
Participants [were] asked if they consider themselves to be Cajun, Creole, or
Hispanic/Latino prior to the question about race, so that these ethnic groups [were]
defined independent of African American or Caucasian American race/ethnicity.
“North Carolina enrollment of patients diagnosed on or after July 1, 2004, began
in September 2004. At present, the North Carolina study area consists of 42 counties
Louisiana enrollment began in 13 parishes surrounding New Orleans in September 2004,
but was discontinued because of Hurricane Katrina (August 29, 2005). This period of
data collection (referred to as ‘Louisiana Phase I’) included study visits with 122 African
American and 95 Caucasian American participants.” A second phase of Louisiana
enrollment includes an expanded study area (including at least eight additional parishes in
southern Louisiana. “Louisiana data and samples collected during Phase I will be
analyzed separately from data and samples collected during Phase II and will be used
primarily to compare pre- and post-Katrina experiences (Schroeder, Bensen et al. 2006).”
36
Rapid Case Ascertainment
“Eligible North Carolina patients [were] identified by the Rapid Case
Ascertainment Core Facility, a collaborative effort of the UNC-Lineberger
Comprehensive Cancer Center and the North Carolina Central Cancer Registry
(NCCCR). North Carolina state law mandates regular reporting of all newly diagnosed
cancers (excluding non-melanoma skin cancers), and the NCCCR is authorized to release
contact and eligibility information to PCaP by the North Carolina Advisory Committee
on Cancer Coordination and Control. In Louisiana, eligible patients [were] identified by
the Louisiana Tumor Registry (LTR) in the School of Public Health at LSUHSC. LTR
operations are mandated by Louisiana law, which directs all hospitals, pathology
laboratories, health care facilities, and medical care providers to report cancer cases or
provide LTR staff with access to this information. Case ascertainment field
representatives abstract[ed] pathology reports, review[ed] information used to screen
eligibility and ensure[d] that ascertainment in hospitals and local urology clinics [was] as
complete and rapid as possible.\ These data [were] entered into a relational database that
[was] regularly downloaded into the PCaP Subject Tracking Database (Schroeder,
Bensen et al. 2006).”
Randomized Recruitment
“Caucasian Americans account[ed] for a greater proportion of North Carolina
patients than African Americans; therefore, a randomized recruitment procedure [was]
used to generate comparable ascertainment and enrollment rates by race and state over
the entire enrollment period. This sampling method improve[d] efficiency without
compromising estimation of main effects and risk difference modification (additive scale
37
interactions) by race, and appropriate analysis requires only that the sampling
probabilities are included as stratum-specific offset terms in some analytic models. To
apply randomized recruitment, each ascertained case [was] assigned a random number
and recruited only if that number [was] less than or equal to its race specific sampling
probability, which is 100% for African Americans and 44% for Caucasian Americans
(Schroeder, Bensen et al. 2006).”
Physician Notification
“Recruitment [began] with a mailed request to the diagnosing physician for
permission to contact their patient, as mandated by the North Carolina and Louisiana
cancer registries. Written physician permission [was] not required; instead, physicians
[were] given 3 weeks to notify PCaP if a patient should not be contacted for any reason,
including ineligibility due to mental illness or impairment, nursing home residence, or
severe physical debilitation. Passive physician permission, and access to patient
information under a limited waiver of consent to identify and contact potential PCaP
participants, was approved by the UNC and LSUHSC IRBs and DoD HSRRB
(Schroeder, Bensen et al. 2006).”
Enrollment
“Patients with active or passive physician consent [were] sent an introductory
letter and brochure describing PCaP. One week later an experienced enrollment specialist
[called] to confirm eligibility, explain the study, answer questions, solicit participation,
and schedule an in home visit. Demographic and pathology report data (without
personally identifiable information) [were] retained for cases who could not be contacted
or who decline[d] participation, so that characteristics of non-participants could be
38
compared with those of participants to assess potential selection bias. Reasons for
declining participation [were] recorded when known. Enrollment specialists [were]
required to make multiple attempts to contact each potential participant. If a valid phone
number could not be identified, the patient’s urologist [was] asked to provide the patient
with the PCaP introductory letter at his next appointment. Patients who could not be
contacted within 90 days [were] sent a letter asking them to contact the study directly. If
no contact [was] made within the next 30 days, the patient [was] classified as ‘unable to
contact.’(Schroeder, Bensen et al. 2006) “
Study Visit
“Participants [were] visited in their home (or other location of their choosing) by
a trained Registered Nurse. Participants [were] asked to fast for 6 hr prior to the study
visit, which [was] scheduled in the morning whenever possible, and to gather all
medications and supplements used in the 2 weeks prior to the visit. Study nurses [began]
each visit by explaining the study and obtaining HIPAA authorization and formal written
informed consent to: (1) conduct the questionnaire interview, (2) make anthropometric
measurements, (3) obtain samples of adipose tissue, blood, urine, and toenails, (4) allow
temporary release of paraffin embedded prostate tissue blocks, and (5) allow retrieval and
abstraction of medical records. Study consent forms [were] read aloud to illiterate
participants in the presence of a witness not associated with PCaP. After consent forms
[were] signed, the study nurse collect[ed] biologic samples, [made] anthropometric
measurements and administer[ed] the questionnaire. Study visits [took] approximately 4
hr to complete, including two 15-min breaks. Participants [were] partially compensated
for their time with a payment of up to $75 for completing the entire PCaP study visit.
39
“All study visit protocols [were] documented in a manual of procedures. To
ensure consistency, patient safety, and confidentiality, study nurses must be certified and
periodically re-certified to conduct all aspects of the visit. Interview and biologic sample
collection data [were] reviewed on an ongoing basis to identify variation among study
nurses or between study sites that cannot be explained by acceptable or expected trends.
In addition, project managers at each site call randomly selected study participants after
study visits [were] completed to assess nurse performance and solicit feedback
(Schroeder, Bensen et al. 2006).”
Anthropometric Measures
“Weight (to the nearest 0.1 kg), height, and waist and hip circumferences (in cm)
[were] measured after biologic sample collection using standardized instruments.
Participants [were] asked their usual weight and height at age 25 and their weight 1 year
prior to the visit (Schroeder, Bensen et al. 2006).”
Study Questionnaires
“Study nurses administer[ed] a series of structured questionnaires that solicit[ed]
information regarding:
Background characteristics: self-described race and ethnicity, marital status, religion,
education, income, tobacco use, physical activity.
Occupation: current employment, occupation and industry, longest and second
occupation and industry, military service, occupations associated with pesticide use.
Family history: prostate cancer in first- and second-degree relatives.
Health status: general health and comorbid conditions.
40
Health care: usual sources of care, health insurance, traditional health beliefs, perceived
access, and quality of care.
Prostate cancer diagnosis and screening history: PSA tests, digital rectal exams, urinary
and sexual symptoms, previous prostate biopsies.
Medication survey: all prescription and over-the-counter medications and supplements
used in the prior 2 weeks (transcribed by study nurses).
Non-steroidal anti-inflammatory drugs (NSAIDs): frequency and duration of use for
prescription and over-the-counter NSAIDs taken during the past 5 years at least once a
month for 1 week or longer, with product name show cards to aid recall.
Vitamins and supplements (including herbal products).
Diet History Questionnaire (DHQ): The DHQ was developed by the National Cancer
Institute and modified by PCaP Project 3 investigators to include Southern foods. The
DHQ asks about intake frequency and usual portion size for 124 food items, as well as
food preparation methods. Participants are asked to recall their usual diet for the year
prior to diagnosis. Questionnaire responses are linked to the updated DHQ Nutrient
Database through the NCI-developed Diet*Calc software to estimate intake of fatty acid
and antioxidant micronutrients, including omega-3 and omega-6 polyunsaturated fatty
acids, carotenoids, and tocopherols (Schroeder, Bensen et al. 2006).”
Medical Records Retrieval and Abstraction
“Medical records [were] requested from the diagnosing physician of consenting
participants. Trained staff use[d] a relational database designed specifically for PCaP to
abstract information concerning comorbid conditions, family history of prostate cancer,
urologic symptoms, indications for diagnostic examinations and biopsies, prostate cancer

41
screening examinations, and laboratory assays at or near diagnosis, imaging examinations
used in staging, clinical stage and grade (as recorded), and initial treatment information.
In addition, abstractors independently derive[d] clinical stage according to a standardized
protocol. Pathologic stage, grade, and other prostatectomy data [were] recorded
separately, when available. Approximately 10% of medical records [were] selected at
random and abstracted to assess consistency between abstractors (Schroeder, Bensen et
al. 2006).”
4. Variables
Primary Outcome
Cases were classified in three categories based on clinical grade (Gleason grade),
clinical stage, and PSA at diagnosis. High aggressive cases were defined as having a
Gleason sum ≥8 OR PSA>20 ng/ml OR Gleason sum=7 and stage T3-T4; low aggressive
cases were defined as having a Gleason sum<7 AND stageT1-T2 AND PSA<10 ng/ml;
all other cases were classified as intermediate aggressive. For the purposes of this study
and all included analyses, cases were dichotomized into high aggressive (as defined
above) and low-intermediate aggressive (all other cases). This dichotomization will allow
for the calculation of the odds of high aggressive prostate cancer, and analyses to be
conducted similarly to a case-control study where men with high aggressive prostate
cancer will serve as “cases” and men with low or intermediate aggressive prostate cancer
will serve as the comparison group, or “controls.”
42
Main Exposures: Dietary Pattern Score
Mediterranean Diet Score
The MED scores followed the scoring scheme outlined by Trichopoulou, et al.
(2003). A total of nine dietary components were evaluated: grains and cereals, refined
grains, fatty acids, vegetables, legumes, fruits and nuts, fish, and alcohol. The median
intake value (in grams per day) for each component was calculated from the sample
scores for the nine components reflect if intake was above or below the median. For
grains and cereals, fatty acids (calculated as the ratio of monounsaturated fatty acids to
saturated fatty acids in g/day), vegetables, legumes, fruits and nuts, and fish, intakes
above the median were scored 1 and intakes below the median were scored 0. Refined
grains and meat and poultry were scored 1 for intake values below the median, 0 for
values above the median. An alcohol score of 1 was given to men consuming 10-50 g
alcohol/day; all other alcohol intake ranges were scored 0 (see Table 3.1).
Median cutoff values were calculated from the responses given in cups/ounces per day.
For mixed dishes, the percentage of each relevant component were estimated using
common recipes; that percentage was applied to the cup/oz. value, and summed into the
total component value. All values were adjusted to reflect intake in grams/day.
Dietary Approaches to Stop Hypertension Score
DASH scores followed the scoring scheme outlined by Fung et al. (2008): eight
components (whole grains, low fat dairy, vegetables, legumes and nuts, fruit and fruit
juices, red and processed meats, sodium, and sweetened beverages) were scored on a 1-5
scale. For whole grains, low fat dairy, vegetables, legumes and nuts, and fruit and fruit
juices, the highest intake quintiles received a score of 5, with the lowest quintile receiving
43
a score of 1; for red and processed meats, sodium, and sugar sweetened beverages, the
scoring scheme is inverted (lowest quintiles receive scores of 5). Scores may range from
8-40, with 40 reflecting the healthiest patterns of consumption (see Table 3.1).
Values may be evaluated as reported, since evaluation is based on quintiles and/or
tertiles. For mixed dishes, the percentage of each relevant component will be estimated
using common recipes; that percentage will be used to calculate the serving amount and
summed into the total component value. Responses were standardized across frequency
to achieve a common time denominator.
Potential Confounders and/or Effect modifiers
Age: Age was included as a continuous variable.
Race: Race was dichotomized into AA and EA men.
Study Site: Site was designated as either North Carolina (University of North Carolina)
or Louisiana (post-Hurricane Katrina, Louisiana State University).
Family History: Family history was dichotomized into “yes” or “no”: those coded as
“yes” positively indicated prior prostate cancer diagnoses in their family; all others were
coded as “no.”
Education: Education was defined on four levels: less than high school diploma, earned
high school diploma, some college/VoTec, and college graduate (including post-graduate
studies).
Screening History: Screening history was defined on four levels: PSA test only, DRE
only, PSA and DRE tests, and neither PSA nor DRE test.
BMI: BMI was evaluated as both a continuous and categorical (<25 kg/m2, ≥25 kg/m
2 but
<30 kg/m2, and ≥30 kg/m
2) variable.
44
Smoking Status: Smoking status was defined as current smoker, past smoker, and never
smoker.
NSAID Use: NSAID use was dichotomized into “yes” for those reporting regular use and
“no” for all others.
Physical Activity: MET hours per week were calculated from reported physical activity
levels and frequencies.
Comorbidity: Comorbidity was assessed using Charlson’s Comorbidity Index; scores
were categorized into 0, 1-2, and 3 or greater.
5. Analyses
Missing Data
Any participants missing outcome, covariate, or exposure data were not included
in the final analyses.
Statistical Methods
All procedures were performed using SAS, version 9.4 statistical software with
the intention of determining:
1. Diet scores, evaluated as numeric variables and as categorical variables. MED
scores were categorized as low (0-3), moderate (4-5) and high (6-9) conformity.
DASH scores were evaluated using two categorizations, tertiles and quintiles,
where cutpoints were determined based on the distribution among low-
intermediate aggressive cases.
2. Univariate distributions of exposures, outcomes, and potential covariates.
3. Logistic regression (2-level outcome) simple model for each dietary score,
including dietary score, age, total energy intake, and race.
45
4. Multivariate logistic regression models further adjusting for study site, family
history, BMI, education level, screening history, smoking status, physical activity,
NSAID use, and comorbidities. Decisions to include these covariates in the model
were based on previous literature and the “ten percent rule.” Variables were added
separately one at a time to the crude model, and percent change in the beta-
coefficient for the exposure was calculated. If the percent change was equal to or
greater than 10%, then variables were retained in the final model.
5. P-values for linear test for trend, with the exposures evaluated as both numeric
variables and categorical variables. Categorical linear trend tests were conducted
using an ordered dummy variable in lieu of category.
6. Possible effect modification by race, age, smoking status, and BMI were
identified by inclusion of an interaction term of dietary score*covariate in the
model; interaction terms significant at the 0.10 level, and that changed the OR by
more than 10%, were included in the final model. Stratification by effect
modifiers was performed to estimate effects within strata of age, smoking and
BMI.
7. Pearson correlation between the MED and DASH scores was calculated.
8. Average intakes for total energy, fat, saturated fat, carbohydrates, protein,
polyunsaturated fatty acids, monounsaturated fatty acids, alcohol, lycopene,
calcium, vitamin A, vitamin C, vitamin E, vitamin D, and fiber were calculated
for the total sample and categorized dietary scores.
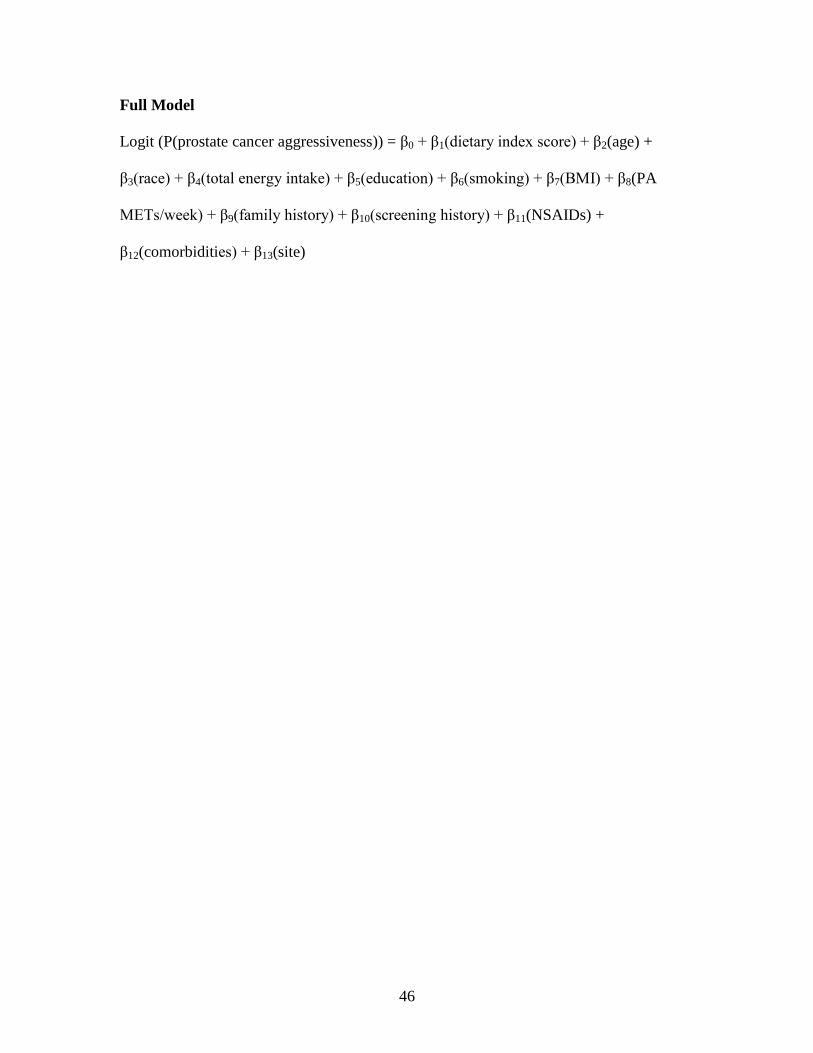
46
Full Model
Logit (P(prostate cancer aggressiveness)) = β0 + β1(dietary index score) + β2(age) +
β3(race) + β4(total energy intake) + β5(education) + β6(smoking) + β7(BMI) + β8(PA
METs/week) + β9(family history) + β10(screening history) + β11(NSAIDs) +
β12(comorbidities) + β13(site)
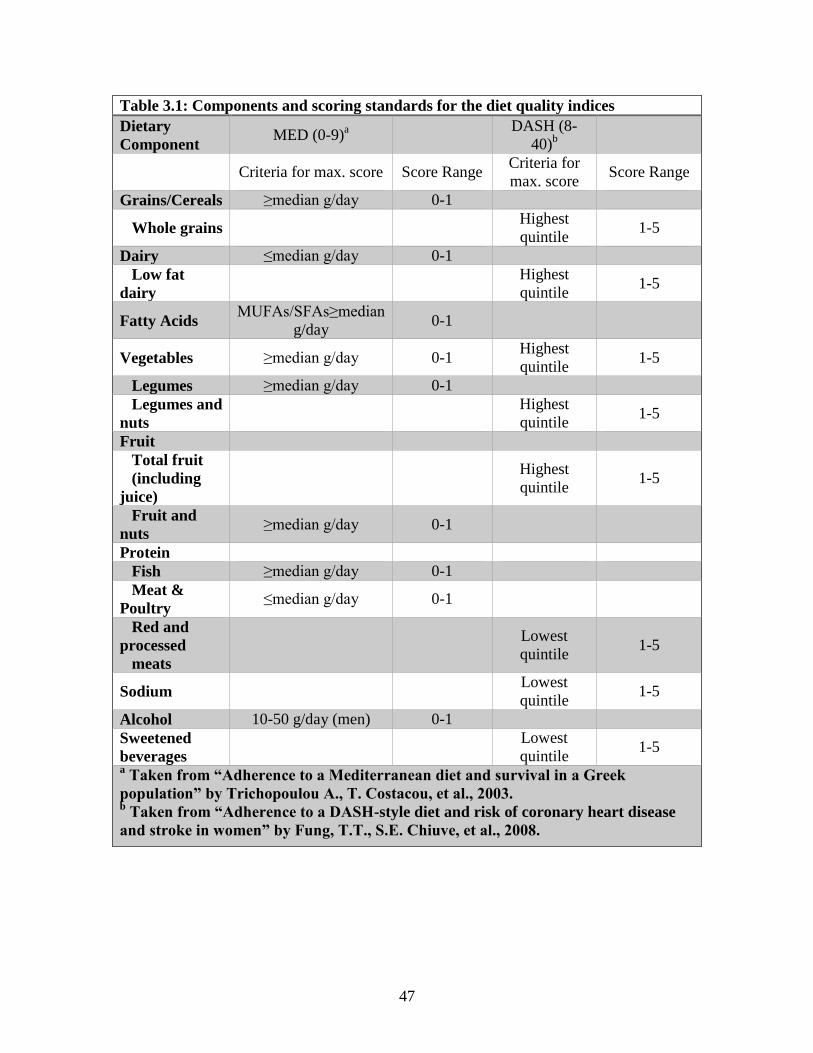
47
Table 3.1: Components and scoring standards for the diet quality indices
Dietary
Component MED (0-9)
a
DASH (8-
40)b
Criteria for max. score Score Range Criteria for
max. score Score Range
Grains/Cereals ≥median g/day 0-1
Whole grains Highest
quintile 1-5
Dairy ≤median g/day 0-1
Low fat
dairy
Highest
quintile 1-5
Fatty Acids MUFAs/SFAs≥median
g/day 0-1
Vegetables ≥median g/day 0-1 Highest
quintile 1-5
Legumes ≥median g/day 0-1
Legumes and
nuts
Highest
quintile 1-5
Fruit
Total fruit
(including
juice)
Highest
quintile 1-5
Fruit and
nuts ≥median g/day 0-1
Protein
Fish ≥median g/day 0-1
Meat &
Poultry ≤median g/day 0-1
Red and
processed
meats
Lowest
quintile 1-5
Sodium Lowest
quintile 1-5
Alcohol 10-50 g/day (men) 0-1
Sweetened
beverages
Lowest
quintile 1-5
a Taken from “Adherence to a Mediterranean diet and survival in a Greek
population” by Trichopoulou A., T. Costacou, et al., 2003. b Taken from “Adherence to a DASH-style diet and risk of coronary heart disease
and stroke in women” by Fung, T.T., S.E. Chiuve, et al., 2008.
48
CHAPTER 4
RESULTS
Tables 4.1 - 4.2: Descriptive Statistics
The final sample size included 1,899 men, with 1,567 low-intermediate
aggressive cases of prostate cancer and 332 high aggressive cases of prostate cancer.
Within the sample, 908 of the men identified as AA (47.8%) and 991 identified as EA
(52.2%). MED scores ranged from 0 to 9 with a mean and SD of 4.19 ± 1.65. DASH
scores ranged from 11to 36 with a mean and SD of 22.01 ± 4.37; both MED and DASH
scores were normally distributed.
Aggressiveness Comparisons (Table 4.1)
Participants diagnosed with high aggressive prostate cancer were significantly
older, had higher body mass index, consumed more calories per day, identified as AA,
were more likely to have less than a high school education, were more likely to be current
or former smokers, and were less likely to have been screened for prostate cancer
previously than low-intermediate cases.
Racial Differences (Table 4.2)
AA men included in this study were younger, less active, consumed more calories
per day, were less educated, more likely to be a current smoker, less likely to use
NSAIDs regularly or to have been previously screened for prostate cancer, and had fewer
comorbidities than their EA counterparts.
49
Tables 4.3 - 4.4: Confounding
Previous research has indicated that BMI, physical activity, education level,
smoking status, NSAIDs use, family history, screening history, and comorbidities may
confound the association between dietary measures and prostate cancer (Ax, Garmo, et al
2014; Bosire, Stampfer, et al. 2012; Tseung, Breslow, et al. 2004). Therefore, all these
factors were justified for inclusion in the fully adjusted logistic regression models. To
determine which of these known confounders presented as such in this dataset, the “ten
percent rule” was used to assess each covariate: screening history and smoking history
were found to highly impact the numeric dietary scores, while BMI, education level,
smoking history, family history, and screening history showed substantial changes to
dietary score estimates when evaluated categorically.
Tables 4.5 - 4.8: Final Models
Numeric dietary pattern scores (Tables 4.5-4.6)
For all men, higher MED and DASH scores were significantly inversely
associated with the odds of aggressive prostate cancer: for every one point increase in
MED score, odds of aggressive prostate cancer diagnosis decreased by 12% (95% CI:
0.82 -0.96), while a point increase in DASH score decreased aggressive diagnosis odds
by 4% (95% CI: 0.93, 0.99). After adjusting for all confounders, the statistically
significant inverse associate between MED score and odds of aggressive prostate cancer
remained, while the association seen for the DASH score was attenuated.
Interaction p-values for race and diet scores were not statistically significant (p
interaction= 0.11 and 0.15 for numeric MED and DASH scores, respectively). However,
because one of our a priori aims was to examine associations by race, we stratified
50
primary analyses by race and present those results in Table 4.6. In EA men, a decrease in
aggressive prostate cancer diagnosis of 12% and 5% were observed with increasing MED
and DASH scores, respectively; the inverse association remained within the sample but
there is not enough evidence to detect this relationship to the population. For AA men,
higher MED scores were associated with lower odds of aggressive prostate cancer
diagnosis (OR: 0.89; 95% CI: 0.80-0.99), though the effect was not significant when
adjusted for multiple confounders. No significant association between DASH scores and
aggressiveness was observed in AA men.
Categorical dietary pattern scores (Table 4.7-4.8)
As shown in Table 4.7, men with the highest MED scores (6-9) had a 34%
decreased odds of an aggressive prostate cancer diagnosis compared to men with the
lowest MED scores (0-3) (p trend: 0.09). The odds of aggressive prostate cancer
decreased by 35% for men in the highest tertile of DASH scores compared to men in the
lowest tertile (p trend: 0.02); this association was attenuated and no longer statistically
significant in the adjusted model (OR: 0.76; 95% CI: 0.55-1.06; p trend = 0.23). When
comparing DASH quintiles, men in the second highest quintile were significantly less
likely to be diagnosed with aggressive prostate cancer than men in the lowest quintile
(OR: 0.63; 95% CI: 0.43-0.92). When AA men and EA men were evaluated separately,
AA men with the highest MED scores were less likely to have aggressive prostate cancer
than AA men in with the lowest MED scores (OR: 0.56; 95% CI: 0.32-0.97) (Table 4.8).
Tables 4.9 - Table 4.11: Effect Modification
The interaction term with BMI was significant in the numeric DASH models (p
interaction term = 0.09), but not for any categorized DASH models or MED models.
51
Although the interaction terms were not significant, higher MED and DASH scores
appeared to have the most beneficial effect on men classified as ‘overweight (BMI 25 or
greater but less than 30). Age (‘less than 65 years’ and ‘65 years or older’) and smoking
status had significant interaction terms in all MED score models and in numeric DASH
models. Increased conformity to both MED and DASH dietary patterns showed larger
inverse associations for men aged 65 and older than for men younger than 65 on
aggressive prostate cancer diagnosis. For all models, never and former smokers were
observed to have lower odds of aggressive prostate cancer than current smokers.
Tables 4.12 - Table 4.15: Sensitivity Analyses Using Categorized Age Models
Analyses re-run with age categorized into ‘less than 65 years’ and ’65 years or
older’ showed no substantial deviation from results found with the continuous age
variable included in the model.
Table 4.16: Spearman Correlation between MED and DASH scores
Moderate, positive linear associations were found between numeric MED and
DASH scores, MED categories and DASH quintiles, and MED categories and DASH
tertiles for all men, AA men, and EA men (correlation coefficients were 0.53 for numeric
variables and 0.46 for categorical variables, all p values <0.0001).
Table 4.17: Means and Standard Deviations of Select Nutrients Across Total Sample
and Dietary Score Categories
Table 4.17 shows the average intakes of select nutrients across the total sample
and dietary score categories. For all dietary score categories, those with the highest scores
also has the highest intakes of energy, fat, carbohydrates, protein, polyunsaturated fatty
acids, monounsaturated fatty acids, lycopene, vitamin A, vitamin C, vitamin E, vitamin
52
D, and fiber; the exceptions were calcium and saturated fat, where those with moderate
adherence to the MED diet had the highest calcium consumption when compared to low/
high MED adherence, and alcohol, where there was no universal trend of consumption
for any of the dietary categories. For all nutrients except alcohol, participants in the
highest dietary score category had an average intake above the sample average.
Tables 4.18-4.19: Comparison of Research Participants Included in Analyses to
Those Excluded Due to Missing Data
Men with missing PSA screening history/Gleason scores, implausible caloric
intakes (<500 kcal/day or >6000 kcal/day), and/or missing covariate information (n=359)
were excluded from final analyses. Excluded men were compared to included men to
determine if data was missing at random or in association with the outcome; those
missing other covariates were more likely to be diagnosed with aggressive prostate
cancer (p value = 0.04), indicating the missing data may be associated with the outcome.
Men excluded from analyses consumed more calories each day and were less physically
active; they were also more likely to identify as AA, reside in Louisiana, have less
education, be a current smoker, and have never been screened for prostate cancer.
All adjusted models were rerun, including all men with aggressive data (both
included in primary analysis and those excluded for missing data) for comparison with
association measures of included subjects; further sensitivity analysis was conducted by
artificially placing all high aggressive cases with missing variables into the highest
categories of dietary scores and artificially placing all low-moderate aggressive cases
with missing variables into the lowest categories of dietary scores (Table 4.19). These

53
sensitivity analyses revealed similar results to the main analyses, suggesting that the
exclusion of subjects with missing data did not substantially bias the results.
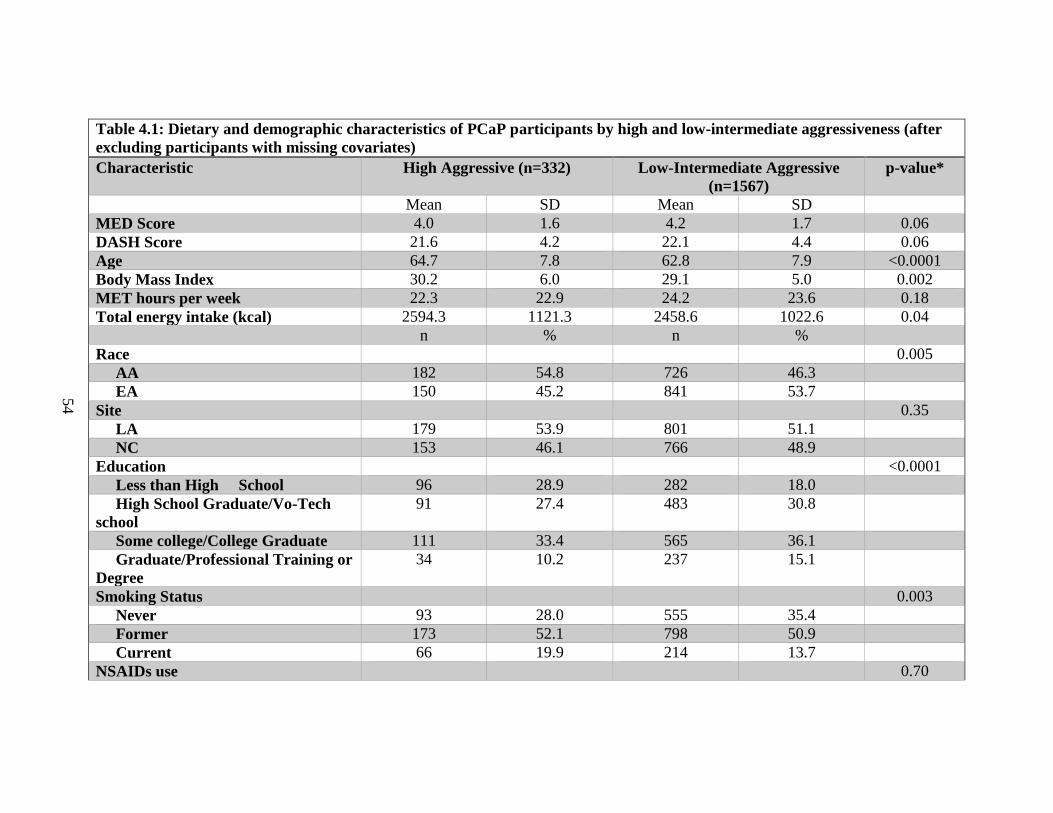
54
Table 4.1: Dietary and demographic characteristics of PCaP participants by high and low-intermediate aggressiveness (after
excluding participants with missing covariates)
Characteristic High Aggressive (n=332) Low-Intermediate Aggressive
(n=1567)
p-value*
Mean SD Mean SD
MED Score 4.0 1.6 4.2 1.7 0.06
DASH Score 21.6 4.2 22.1 4.4 0.06
Age 64.7 7.8 62.8 7.9 <0.0001
Body Mass Index 30.2 6.0 29.1 5.0 0.002
MET hours per week 22.3 22.9 24.2 23.6 0.18
Total energy intake (kcal) 2594.3 1121.3 2458.6 1022.6 0.04
n % n %
Race 0.005
AA 182 54.8 726 46.3
EA 150 45.2 841 53.7
Site 0.35
LA 179 53.9 801 51.1
NC 153 46.1 766 48.9
Education <0.0001
Less than High School 96 28.9 282 18.0
High School Graduate/Vo-Tech
school
91 27.4 483 30.8
Some college/College Graduate 111 33.4 565 36.1
Graduate/Professional Training or
Degree
34 10.2 237 15.1
Smoking Status 0.003
Never 93 28.0 555 35.4
Former 173 52.1 798 50.9
Current 66 19.9 214 13.7
NSAIDs use 0.70
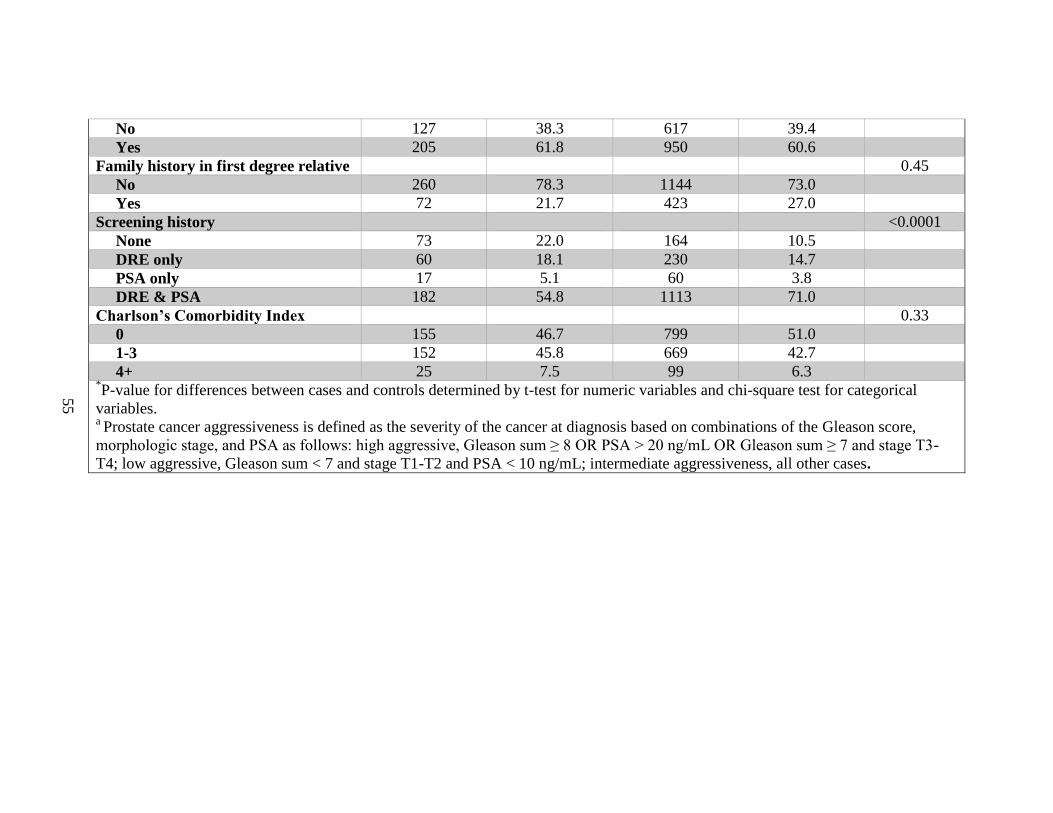
55
No 127 38.3 617 39.4
Yes 205 61.8 950 60.6
Family history in first degree relative 0.45
No 260 78.3 1144 73.0
Yes 72 21.7 423 27.0
Screening history <0.0001
None 73 22.0 164 10.5
DRE only 60 18.1 230 14.7
PSA only 17 5.1 60 3.8
DRE & PSA 182 54.8 1113 71.0
Charlson’s Comorbidity Index 0.33
0 155 46.7 799 51.0
1-3 152 45.8 669 42.7
4+ 25 7.5 99 6.3 *P-value for differences between cases and controls determined by t-test for numeric variables and chi-square test for categorical
variables. a Prostate cancer aggressiveness is defined as the severity of the cancer at diagnosis based on combinations of the Gleason score,
morphologic stage, and PSA as follows: high aggressive, Gleason sum ≥ 8 OR PSA > 20 ng/mL OR Gleason sum ≥ 7 and stage T3-
T4; low aggressive, Gleason sum < 7 and stage T1-T2 and PSA < 10 ng/mL; intermediate aggressiveness, all other cases.
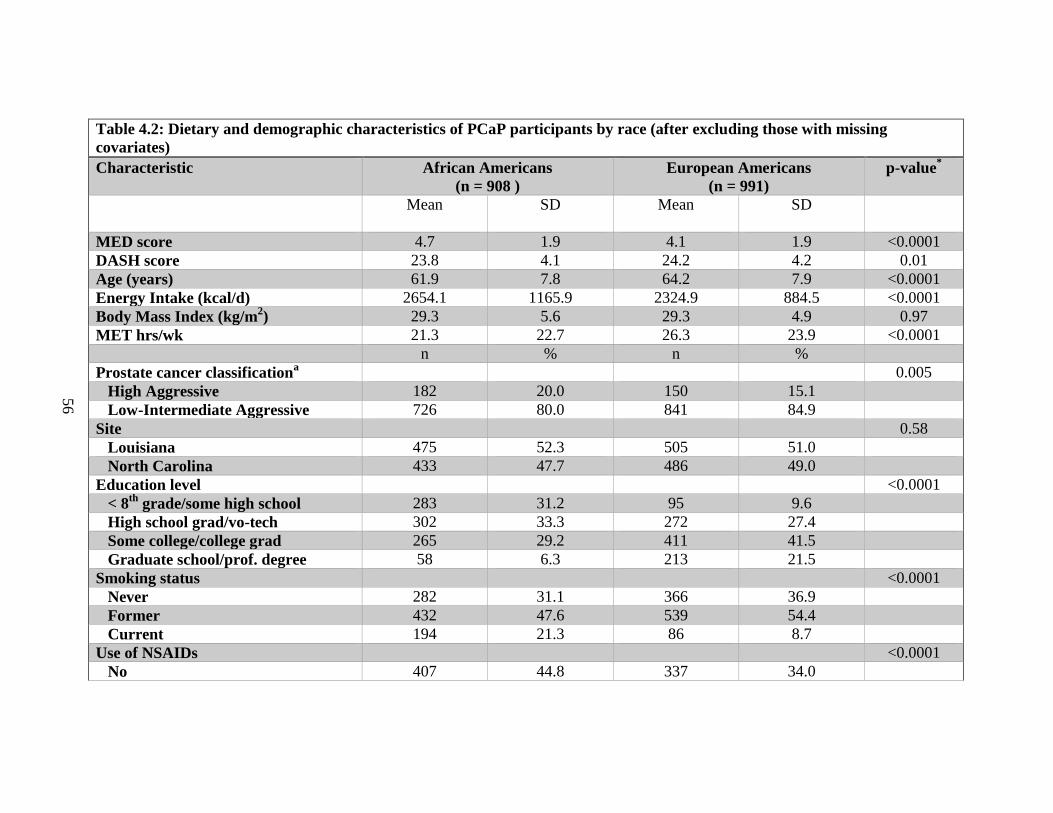
56
Table 4.2: Dietary and demographic characteristics of PCaP participants by race (after excluding those with missing
covariates)
Characteristic African Americans
(n = 908 )
European Americans
(n = 991)
p-value*
Mean
SD
Mean
SD
MED score 4.7 1.9 4.1 1.9 <0.0001
DASH score 23.8 4.1 24.2 4.2 0.01
Age (years) 61.9 7.8 64.2 7.9 <0.0001
Energy Intake (kcal/d) 2654.1 1165.9 2324.9 884.5 <0.0001
Body Mass Index (kg/m2) 29.3 5.6 29.3 4.9 0.97
MET hrs/wk 21.3 22.7 26.3 23.9 <0.0001
n % n %
Prostate cancer classificationa 0.005
High Aggressive 182 20.0 150 15.1
Low-Intermediate Aggressive 726 80.0 841 84.9
Site 0.58
Louisiana 475 52.3 505 51.0
North Carolina 433 47.7 486 49.0
Education level <0.0001
< 8th
grade/some high school 283 31.2 95 9.6
High school grad/vo-tech 302 33.3 272 27.4
Some college/college grad 265 29.2 411 41.5
Graduate school/prof. degree 58 6.3 213 21.5
Smoking status <0.0001
Never 282 31.1 366 36.9
Former 432 47.6 539 54.4
Current 194 21.3 86 8.7
Use of NSAIDs <0.0001
No 407 44.8 337 34.0
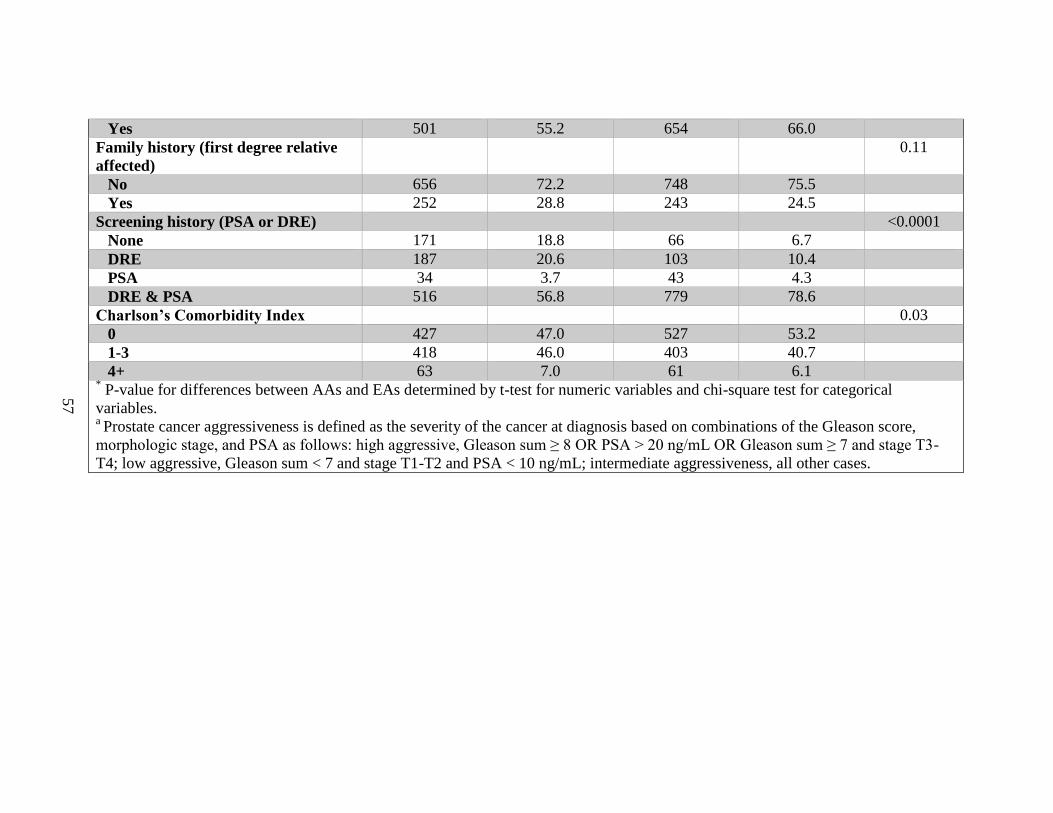
57
Yes 501 55.2 654 66.0
Family history (first degree relative
affected)
0.11
No 656 72.2 748 75.5
Yes 252 28.8 243 24.5
Screening history (PSA or DRE) <0.0001
None 171 18.8 66 6.7
DRE 187 20.6 103 10.4
PSA 34 3.7 43 4.3
DRE & PSA 516 56.8 779 78.6
Charlson’s Comorbidity Index 0.03
0 427 47.0 527 53.2
1-3 418 46.0 403 40.7
4+ 63 7.0 61 6.1 * P-value for differences between AAs and EAs determined by t-test for numeric variables and chi-square test for categorical
variables. a Prostate cancer aggressiveness is defined as the severity of the cancer at diagnosis based on combinations of the Gleason score,
morphologic stage, and PSA as follows: high aggressive, Gleason sum ≥ 8 OR PSA > 20 ng/mL OR Gleason sum ≥ 7 and stage T3-
T4; low aggressive, Gleason sum < 7 and stage T1-T2 and PSA < 10 ng/mL; intermediate aggressiveness, all other cases.
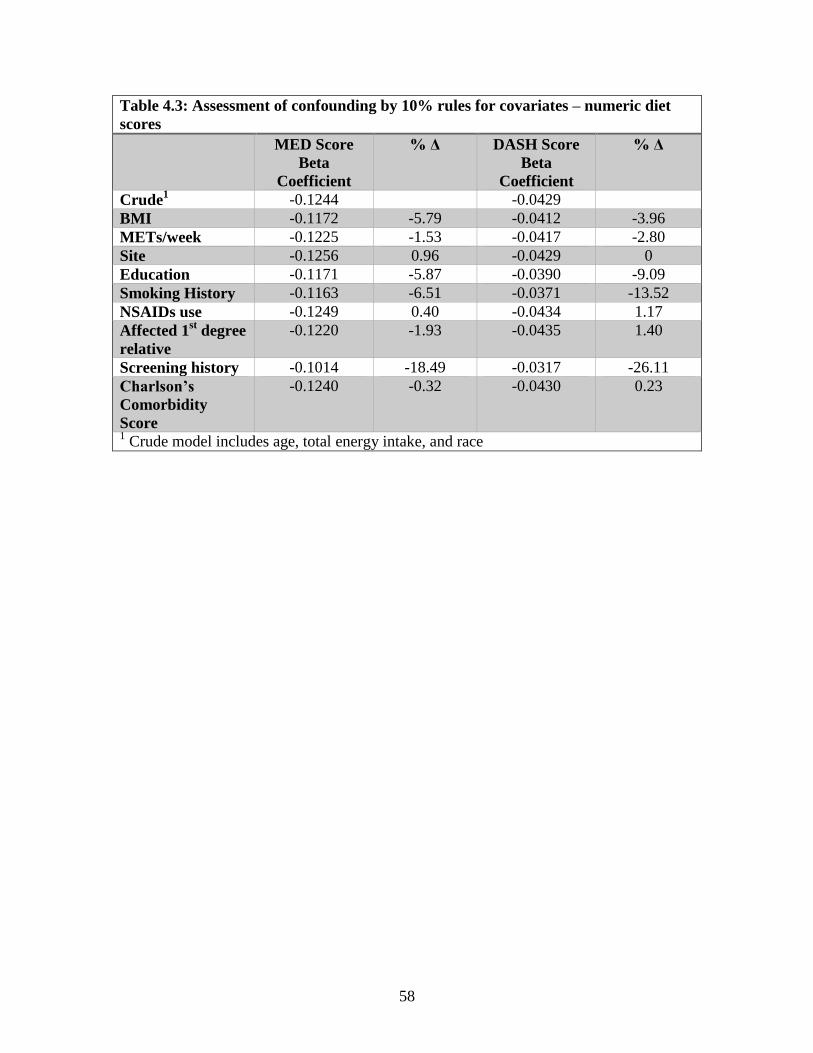
58
Table 4.3: Assessment of confounding by 10% rules for covariates – numeric diet
scores
MED Score
Beta
Coefficient
% Δ DASH Score
Beta
Coefficient
% Δ
Crude1 -0.1244 -0.0429
BMI -0.1172 -5.79 -0.0412 -3.96
METs/week -0.1225 -1.53 -0.0417 -2.80
Site -0.1256 0.96 -0.0429 0
Education -0.1171 -5.87 -0.0390 -9.09
Smoking History -0.1163 -6.51 -0.0371 -13.52
NSAIDs use -0.1249 0.40 -0.0434 1.17
Affected 1st degree
relative
-0.1220 -1.93 -0.0435 1.40
Screening history -0.1014 -18.49 -0.0317 -26.11
Charlson’s
Comorbidity
Score
-0.1240 -0.32 -0.0430 0.23
1 Crude model includes age, total energy intake, and race
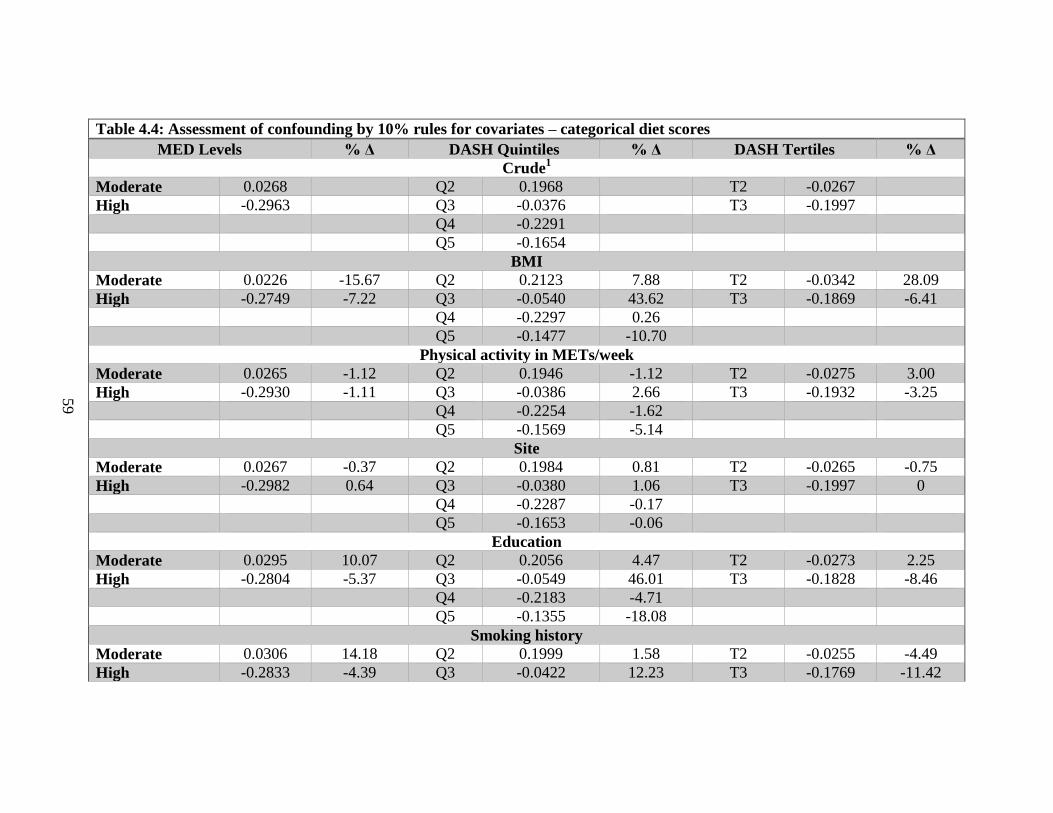
59
Table 4.4: Assessment of confounding by 10% rules for covariates – categorical diet scores
MED Levels % Δ DASH Quintiles % Δ DASH Tertiles % Δ
Crude1
Moderate 0.0268 Q2 0.1968 T2 -0.0267
High -0.2963 Q3 -0.0376 T3 -0.1997
Q4 -0.2291
Q5 -0.1654
BMI
Moderate 0.0226 -15.67 Q2 0.2123 7.88 T2 -0.0342 28.09
High -0.2749 -7.22 Q3 -0.0540 43.62 T3 -0.1869 -6.41
Q4 -0.2297 0.26
Q5 -0.1477 -10.70
Physical activity in METs/week
Moderate 0.0265 -1.12 Q2 0.1946 -1.12 T2 -0.0275 3.00
High -0.2930 -1.11 Q3 -0.0386 2.66 T3 -0.1932 -3.25
Q4 -0.2254 -1.62
Q5 -0.1569 -5.14
Site
Moderate 0.0267 -0.37 Q2 0.1984 0.81 T2 -0.0265 -0.75
High -0.2982 0.64 Q3 -0.0380 1.06 T3 -0.1997 0
Q4 -0.2287 -0.17
Q5 -0.1653 -0.06
Education
Moderate 0.0295 10.07 Q2 0.2056 4.47 T2 -0.0273 2.25
High -0.2804 -5.37 Q3 -0.0549 46.01 T3 -0.1828 -8.46
Q4 -0.2183 -4.71
Q5 -0.1355 -18.08
Smoking history
Moderate 0.0306 14.18 Q2 0.1999 1.58 T2 -0.0255 -4.49
High -0.2833 -4.39 Q3 -0.0422 12.23 T3 -0.1769 -11.42
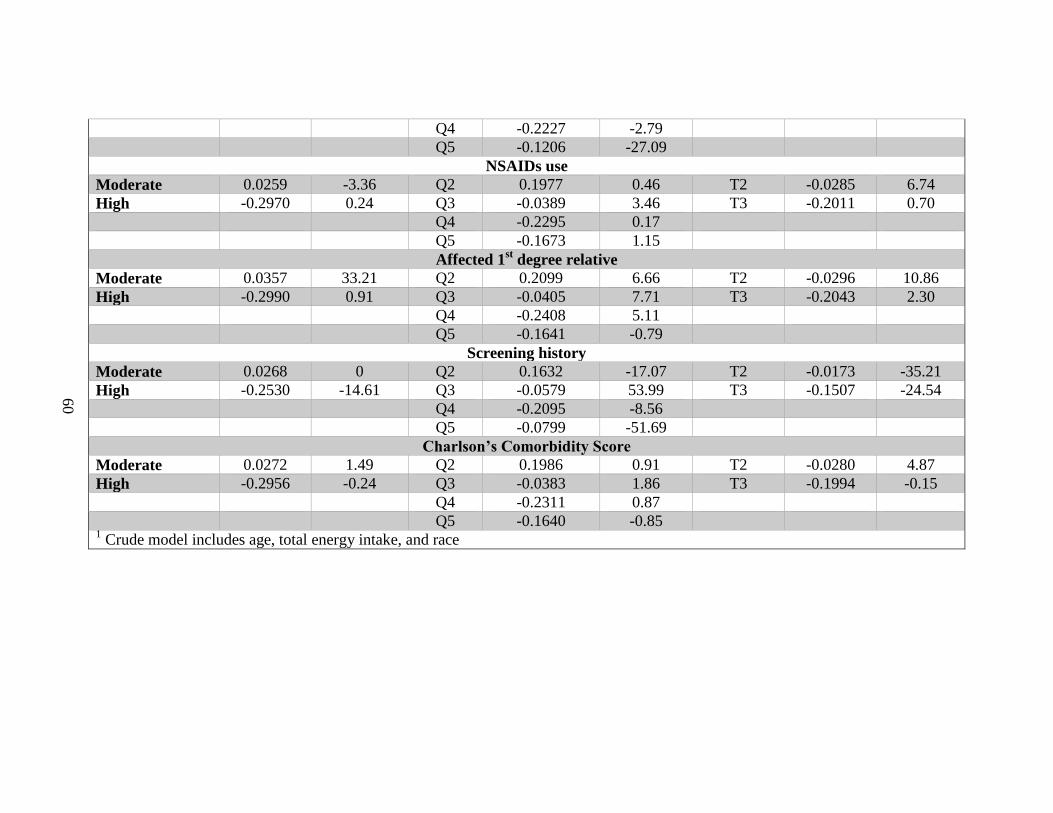
60
Q4 -0.2227 -2.79
Q5 -0.1206 -27.09
NSAIDs use
Moderate 0.0259 -3.36 Q2 0.1977 0.46 T2 -0.0285 6.74
High -0.2970 0.24 Q3 -0.0389 3.46 T3 -0.2011 0.70
Q4 -0.2295 0.17
Q5 -0.1673 1.15
Affected 1st degree relative
Moderate 0.0357 33.21 Q2 0.2099 6.66 T2 -0.0296 10.86
High -0.2990 0.91 Q3 -0.0405 7.71 T3 -0.2043 2.30
Q4 -0.2408 5.11
Q5 -0.1641 -0.79
Screening history
Moderate 0.0268 0 Q2 0.1632 -17.07 T2 -0.0173 -35.21
High -0.2530 -14.61 Q3 -0.0579 53.99 T3 -0.1507 -24.54
Q4 -0.2095 -8.56
Q5 -0.0799 -51.69
Charlson’s Comorbidity Score
Moderate 0.0272 1.49 Q2 0.1986 0.91 T2 -0.0280 4.87
High -0.2956 -0.24 Q3 -0.0383 1.86 T3 -0.1994 -0.15
Q4 -0.2311 0.87
Q5 -0.1640 -0.85 1 Crude model includes age, total energy intake, and race
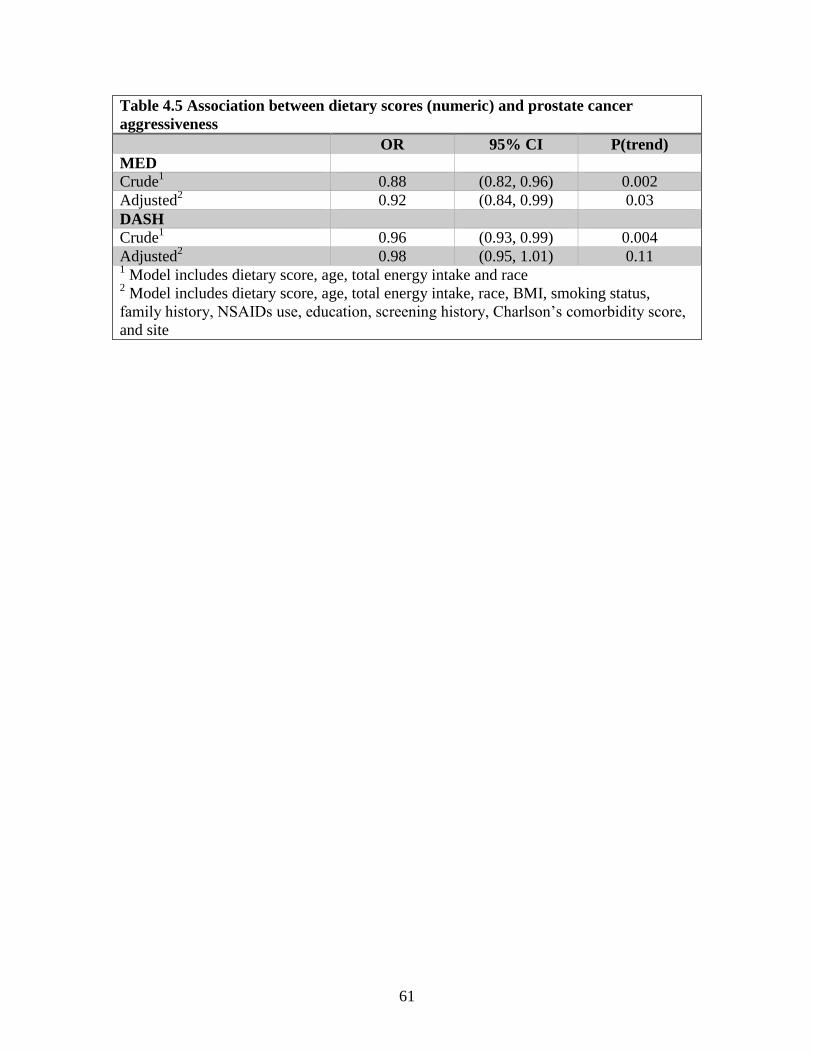
61
Table 4.5 Association between dietary scores (numeric) and prostate cancer
aggressiveness
OR 95% CI P(trend)
MED
Crude1 0.88 (0.82, 0.96) 0.002
Adjusted2 0.92 (0.84, 0.99) 0.03
DASH
Crude1 0.96 (0.93, 0.99) 0.004
Adjusted2 0.98 (0.95, 1.01) 0.11
1 Model includes dietary score, age, total energy intake and race
2 Model includes dietary score, age, total energy intake, race, BMI, smoking status,
family history, NSAIDs use, education, screening history, Charlson’s comorbidity score,
and site
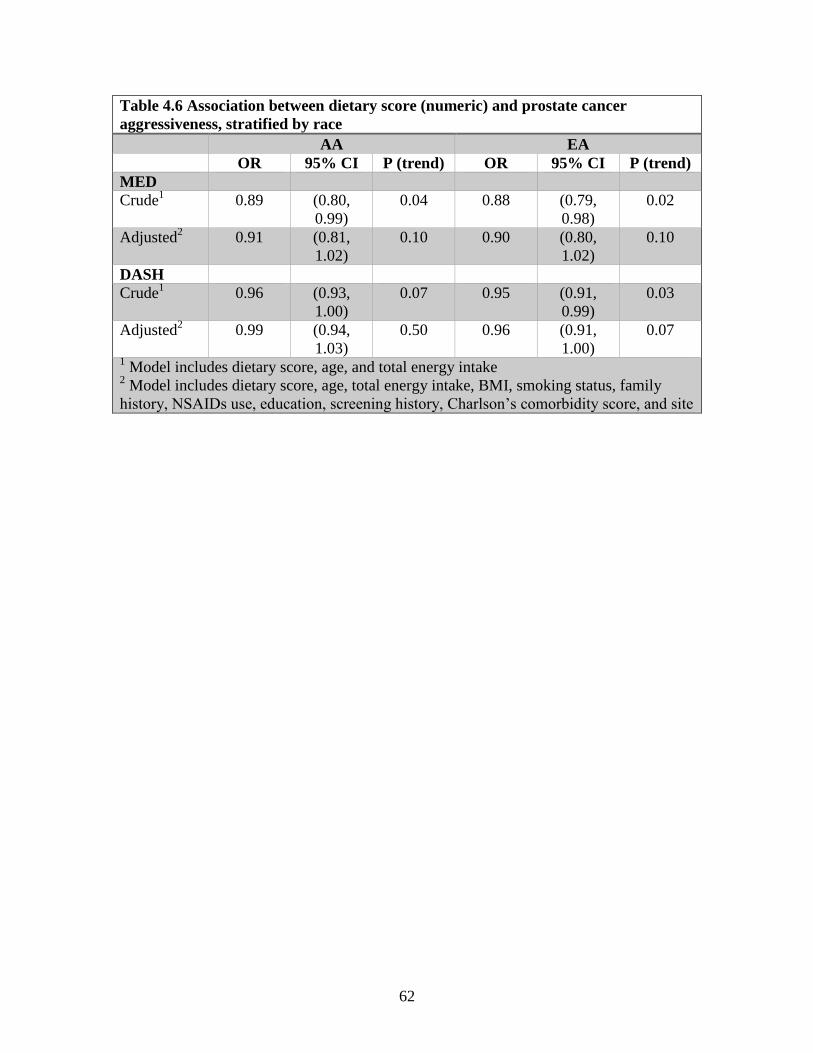
62
Table 4.6 Association between dietary score (numeric) and prostate cancer
aggressiveness, stratified by race
AA EA
OR 95% CI P (trend) OR 95% CI P (trend)
MED
Crude1 0.89 (0.80,
0.99)
0.04 0.88 (0.79,
0.98)
0.02
Adjusted2 0.91 (0.81,
1.02)
0.10 0.90 (0.80,
1.02)
0.10
DASH
Crude1 0.96 (0.93,
1.00)
0.07 0.95 (0.91,
0.99)
0.03
Adjusted2 0.99 (0.94,
1.03)
0.50 0.96 (0.91,
1.00)
0.07
1 Model includes dietary score, age, and total energy intake
2 Model includes dietary score, age, total energy intake, BMI, smoking status, family
history, NSAIDs use, education, screening history, Charlson’s comorbidity score, and site
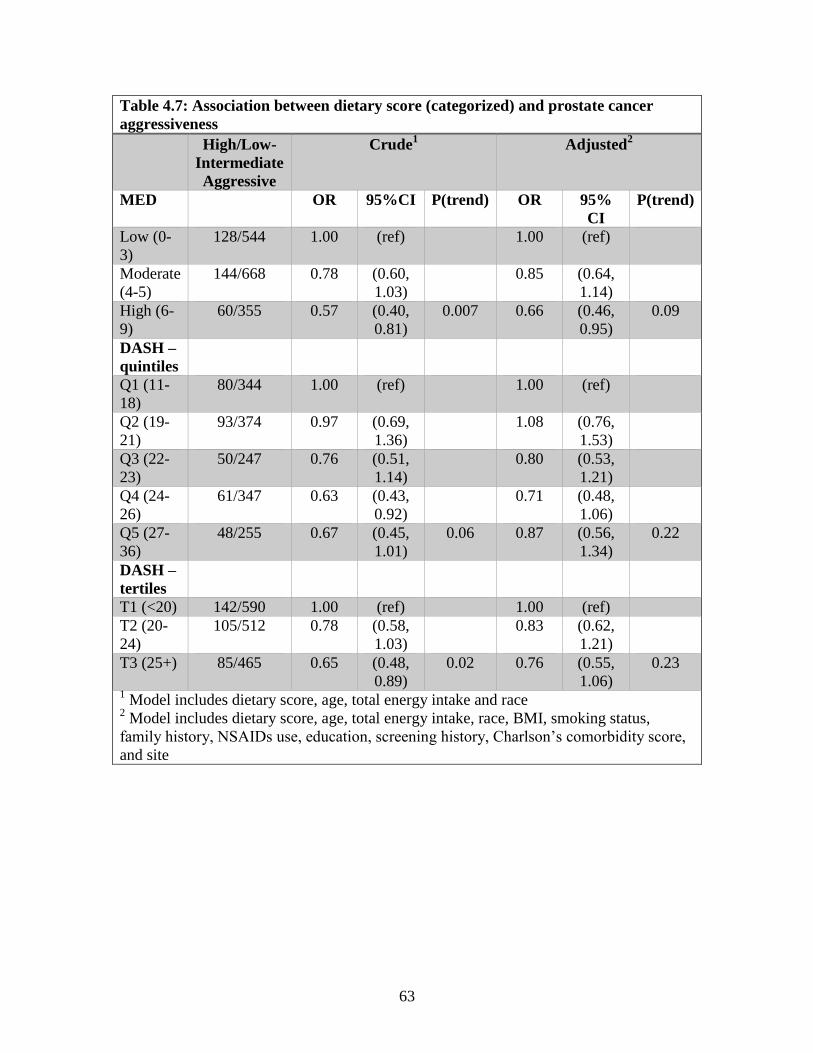
63
Table 4.7: Association between dietary score (categorized) and prostate cancer
aggressiveness
High/Low-
Intermediate
Aggressive
Crude1 Adjusted
2
MED OR 95%CI P(trend) OR 95%
CI
P(trend)
Low (0-
3)
128/544 1.00 (ref) 1.00 (ref)
Moderate
(4-5)
144/668 0.78 (0.60,
1.03)
0.85 (0.64,
1.14)
High (6-
9)
60/355 0.57 (0.40,
0.81)
0.007 0.66 (0.46,
0.95)
0.09
DASH –
quintiles
Q1 (11-
18)
80/344 1.00 (ref) 1.00 (ref)
Q2 (19-
21)
93/374 0.97 (0.69,
1.36)
1.08 (0.76,
1.53)
Q3 (22-
23)
50/247 0.76 (0.51,
1.14)
0.80 (0.53,
1.21)
Q4 (24-
26)
61/347 0.63 (0.43,
0.92)
0.71 (0.48,
1.06)
Q5 (27-
36)
48/255 0.67 (0.45,
1.01)
0.06 0.87 (0.56,
1.34)
0.22
DASH –
tertiles
T1 (<20) 142/590 1.00 (ref) 1.00 (ref)
T2 (20-
24)
105/512 0.78 (0.58,
1.03)
0.83 (0.62,
1.21)
T3 (25+) 85/465 0.65 (0.48,
0.89)
0.02 0.76 (0.55,
1.06)
0.23
1 Model includes dietary score, age, total energy intake and race
2 Model includes dietary score, age, total energy intake, race, BMI, smoking status,
family history, NSAIDs use, education, screening history, Charlson’s comorbidity score,
and site
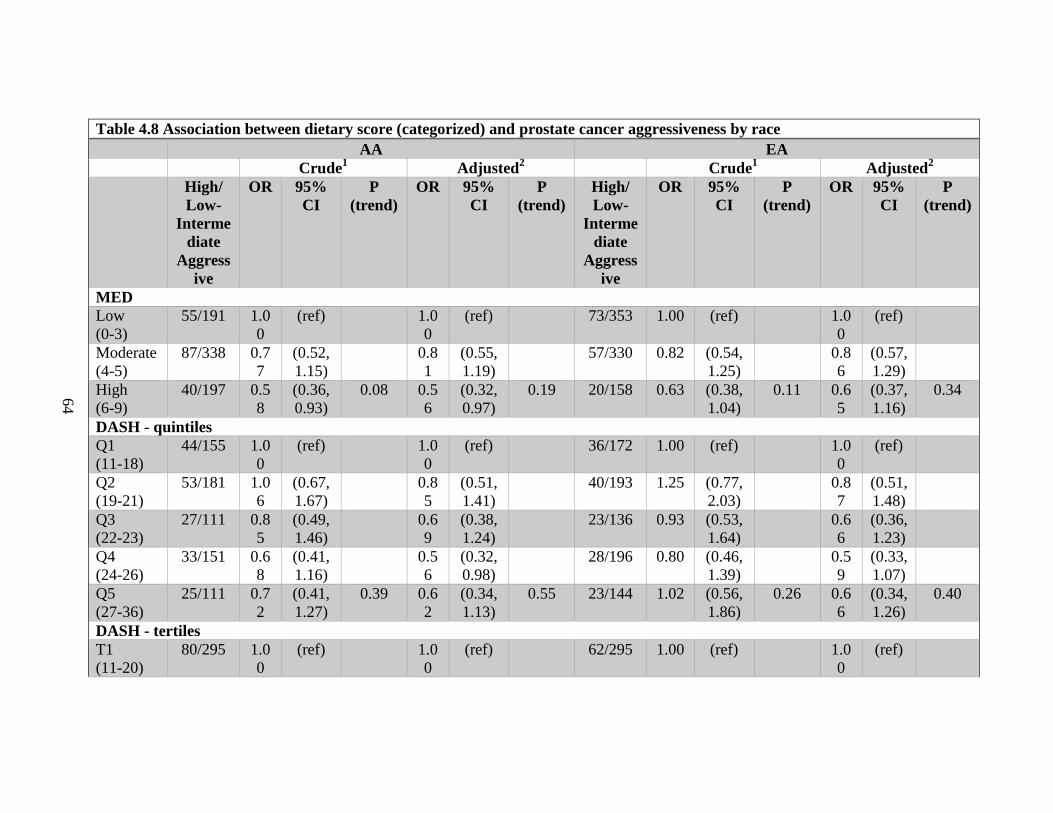
64
Table 4.8 Association between dietary score (categorized) and prostate cancer aggressiveness by race
AA EA
Crude1 Adjusted
2 Crude
1 Adjusted
2
High/
Low-
Interme
diate
Aggress
ive
OR 95%
CI
P
(trend)
OR 95%
CI
P
(trend)
High/
Low-
Interme
diate
Aggress
ive
OR 95%
CI
P
(trend)
OR 95%
CI
P
(trend)
MED
Low
(0-3)
55/191 1.0
0
(ref) 1.0
0
(ref) 73/353 1.00 (ref) 1.0
0
(ref)
Moderate
(4-5)
87/338 0.7
7
(0.52,
1.15)
0.8
1
(0.55,
1.19)
57/330 0.82 (0.54,
1.25)
0.8
6
(0.57,
1.29)
High
(6-9)
40/197 0.5
8
(0.36,
0.93)
0.08 0.5
6
(0.32,
0.97)
0.19 20/158 0.63 (0.38,
1.04)
0.11 0.6
5
(0.37,
1.16)
0.34
DASH - quintiles
Q1
(11-18)
44/155 1.0
0
(ref) 1.0
0
(ref) 36/172 1.00 (ref) 1.0
0
(ref)
Q2
(19-21)
53/181 1.0
6
(0.67,
1.67)
0.8
5
(0.51,
1.41)
40/193 1.25 (0.77,
2.03)
0.8
7
(0.51,
1.48)
Q3
(22-23)
27/111 0.8
5
(0.49,
1.46)
0.6
9
(0.38,
1.24)
23/136 0.93 (0.53,
1.64)
0.6
6
(0.36,
1.23)
Q4
(24-26)
33/151 0.6
8
(0.41,
1.16)
0.5
6
(0.32,
0.98)
28/196 0.80 (0.46,
1.39)
0.5
9
(0.33,
1.07)
Q5
(27-36)
25/111 0.7
2
(0.41,
1.27)
0.39 0.6
2
(0.34,
1.13)
0.55 23/144 1.02 (0.56,
1.86)
0.26 0.6
6
(0.34,
1.26)
0.40
DASH - tertiles
T1
(11-20)
80/295 1.0
0
(ref) 1.0
0
(ref) 62/295 1.00 (ref) 1.0
0
(ref)
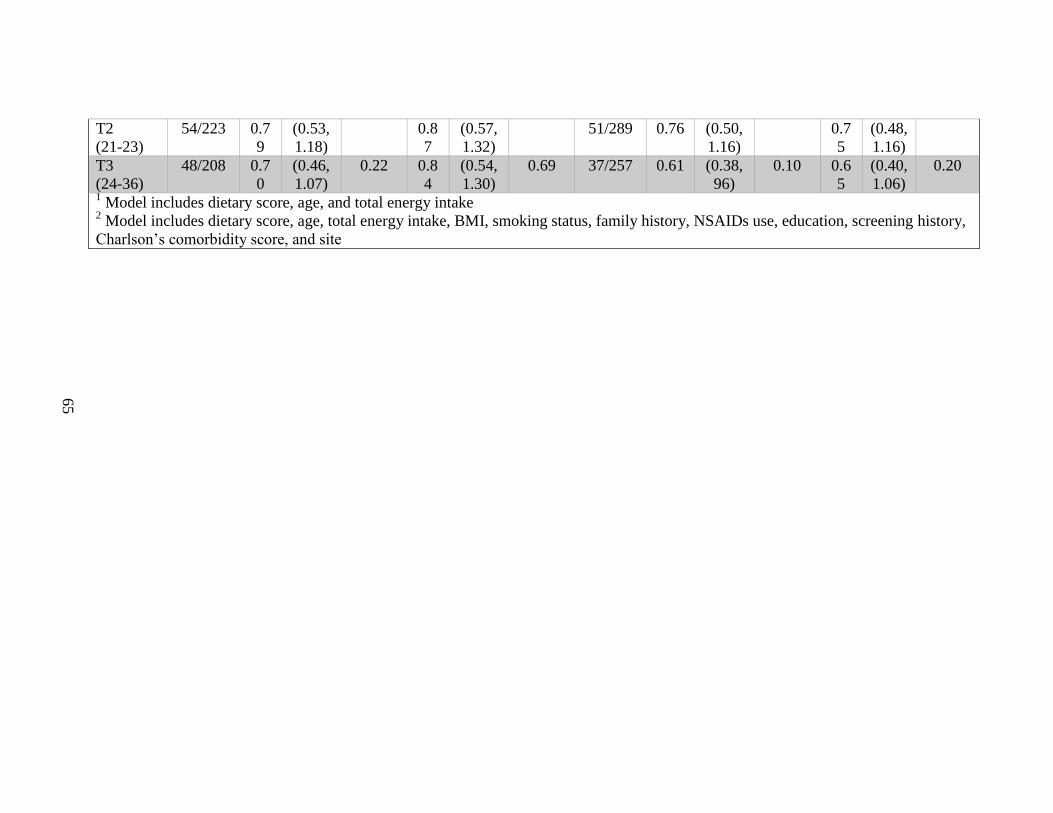
65
T2
(21-23)
54/223 0.7
9
(0.53,
1.18)
0.8
7
(0.57,
1.32)
51/289 0.76 (0.50,
1.16)
0.7
5
(0.48,
1.16)
T3
(24-36)
48/208 0.7
0
(0.46,
1.07)
0.22 0.8
4
(0.54,
1.30)
0.69 37/257 0.61 (0.38,
96)
0.10 0.6
5
(0.40,
1.06)
0.20
1 Model includes dietary score, age, and total energy intake
2 Model includes dietary score, age, total energy intake, BMI, smoking status, family history, NSAIDs use, education, screening history,
Charlson’s comorbidity score, and site
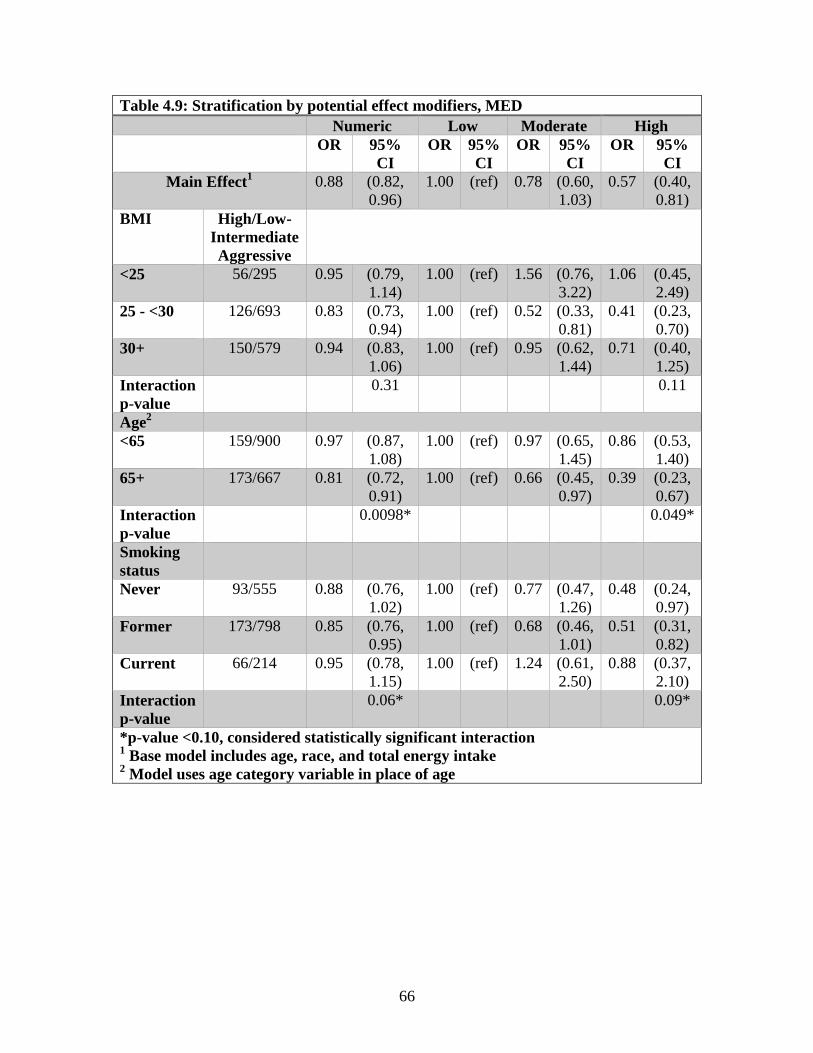
66
Table 4.9: Stratification by potential effect modifiers, MED
Numeric Low Moderate High
OR 95%
CI
OR 95%
CI
OR 95%
CI
OR 95%
CI
Main Effect1 0.88 (0.82,
0.96)
1.00 (ref) 0.78 (0.60,
1.03)
0.57 (0.40,
0.81)
BMI High/Low-
Intermediate
Aggressive
<25 56/295 0.95 (0.79,
1.14)
1.00 (ref) 1.56 (0.76,
3.22)
1.06 (0.45,
2.49)
25 - <30 126/693 0.83 (0.73,
0.94)
1.00 (ref) 0.52 (0.33,
0.81)
0.41 (0.23,
0.70)
30+ 150/579 0.94 (0.83,
1.06)
1.00 (ref) 0.95 (0.62,
1.44)
0.71 (0.40,
1.25)
Interaction
p-value
0.31 0.11
Age2
<65 159/900 0.97 (0.87,
1.08)
1.00 (ref) 0.97 (0.65,
1.45)
0.86 (0.53,
1.40)
65+ 173/667 0.81 (0.72,
0.91)
1.00 (ref) 0.66 (0.45,
0.97)
0.39 (0.23,
0.67)
Interaction
p-value
0.0098* 0.049*
Smoking
status
Never 93/555 0.88 (0.76,
1.02)
1.00 (ref) 0.77 (0.47,
1.26)
0.48 (0.24,
0.97)
Former 173/798 0.85 (0.76,
0.95)
1.00 (ref) 0.68 (0.46,
1.01)
0.51 (0.31,
0.82)
Current 66/214 0.95 (0.78,
1.15)
1.00 (ref) 1.24 (0.61,
2.50)
0.88 (0.37,
2.10)
Interaction
p-value
0.06* 0.09*
*p-value <0.10, considered statistically significant interaction 1 Base model includes age, race, and total energy intake
2 Model uses age category variable in place of age
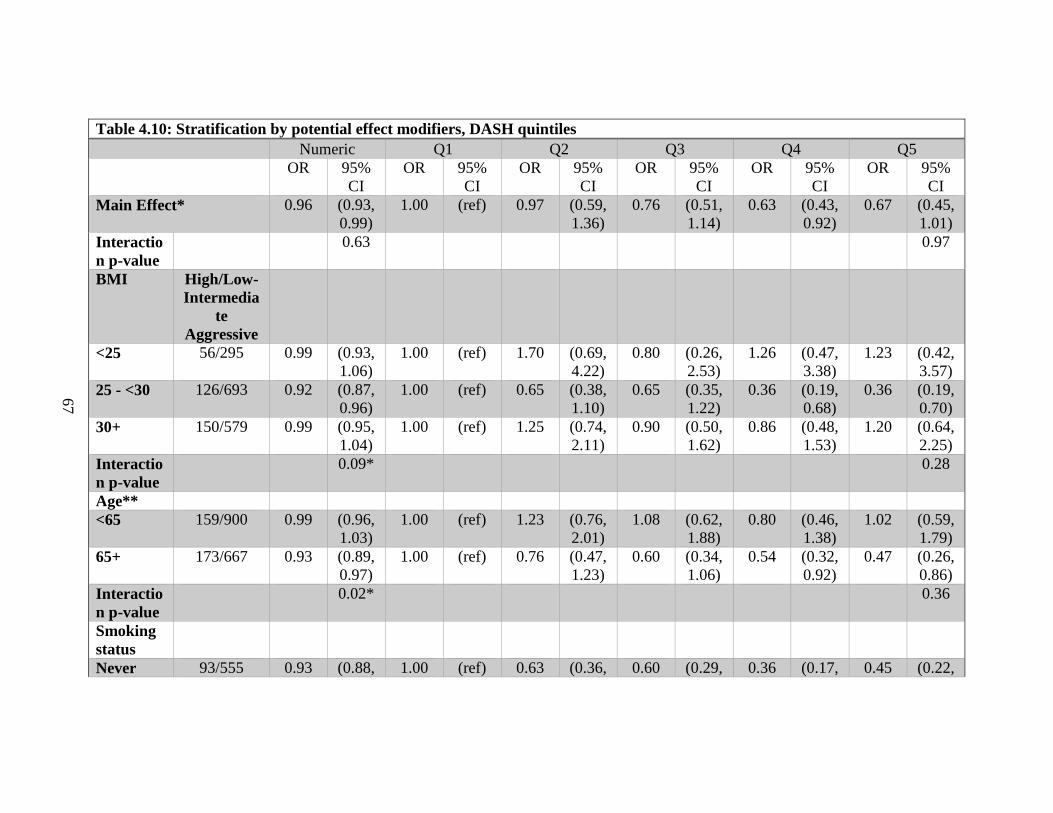
67
Table 4.10: Stratification by potential effect modifiers, DASH quintiles
Numeric Q1 Q2 Q3 Q4 Q5
OR 95%
CI
OR 95%
CI
OR 95%
CI
OR 95%
CI
OR 95%
CI
OR 95%
CI
Main Effect* 0.96 (0.93,
0.99)
1.00 (ref) 0.97 (0.59,
1.36)
0.76 (0.51,
1.14)
0.63 (0.43,
0.92)
0.67 (0.45,
1.01)
Interactio
n p-value
0.63 0.97
BMI High/Low-
Intermedia
te
Aggressive
<25 56/295 0.99 (0.93,
1.06)
1.00 (ref) 1.70 (0.69,
4.22)
0.80 (0.26,
2.53)
1.26 (0.47,
3.38)
1.23 (0.42,
3.57)
25 - <30 126/693 0.92 (0.87,
0.96)
1.00 (ref) 0.65 (0.38,
1.10)
0.65 (0.35,
1.22)
0.36 (0.19,
0.68)
0.36 (0.19,
0.70)
30+ 150/579 0.99 (0.95,
1.04)
1.00 (ref) 1.25 (0.74,
2.11)
0.90 (0.50,
1.62)
0.86 (0.48,
1.53)
1.20 (0.64,
2.25)
Interactio
n p-value
0.09* 0.28
Age**
<65 159/900 0.99 (0.96,
1.03)
1.00 (ref) 1.23 (0.76,
2.01)
1.08 (0.62,
1.88)
0.80 (0.46,
1.38)
1.02 (0.59,
1.79)
65+ 173/667 0.93 (0.89,
0.97)
1.00 (ref) 0.76 (0.47,
1.23)
0.60 (0.34,
1.06)
0.54 (0.32,
0.92)
0.47 (0.26,
0.86)
Interactio
n p-value
0.02* 0.36
Smoking
status
Never 93/555 0.93 (0.88, 1.00 (ref) 0.63 (0.36, 0.60 (0.29, 0.36 (0.17, 0.45 (0.22,
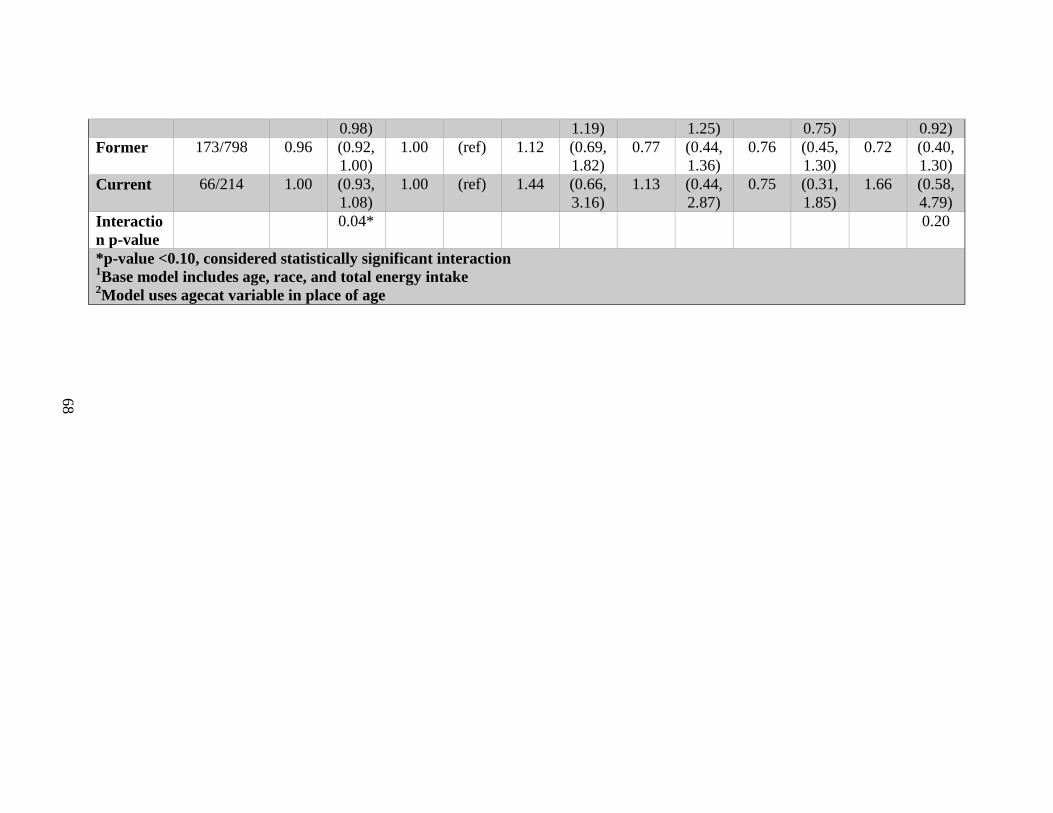
68
0.98) 1.19) 1.25) 0.75) 0.92)
Former 173/798 0.96 (0.92,
1.00)
1.00 (ref) 1.12 (0.69,
1.82)
0.77 (0.44,
1.36)
0.76 (0.45,
1.30)
0.72 (0.40,
1.30)
Current 66/214 1.00 (0.93,
1.08)
1.00 (ref) 1.44 (0.66,
3.16)
1.13 (0.44,
2.87)
0.75 (0.31,
1.85)
1.66 (0.58,
4.79)
Interactio
n p-value
0.04* 0.20
*p-value <0.10, considered statistically significant interaction 1Base model includes age, race, and total energy intake
2Model uses agecat variable in place of age
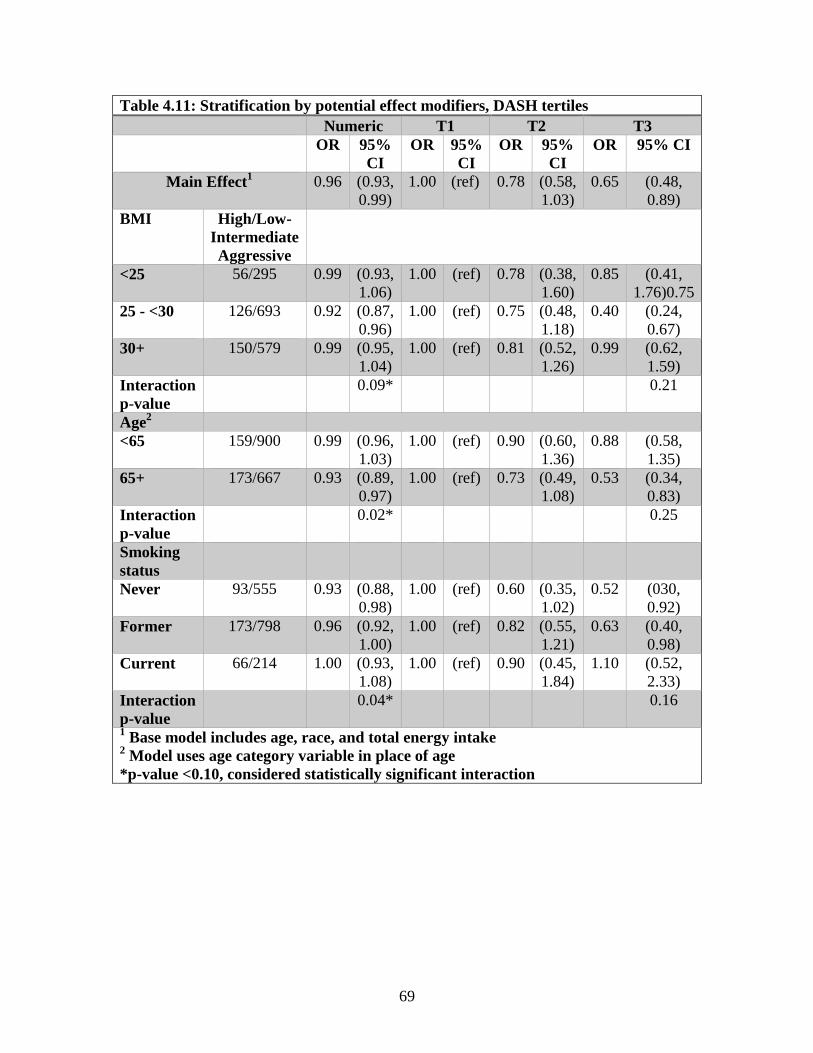
69
Table 4.11: Stratification by potential effect modifiers, DASH tertiles
Numeric T1 T2 T3
OR 95%
CI
OR 95%
CI
OR 95%
CI
OR 95% CI
Main Effect1 0.96 (0.93,
0.99)
1.00 (ref) 0.78 (0.58,
1.03)
0.65 (0.48,
0.89)
BMI High/Low-
Intermediate
Aggressive
<25 56/295 0.99 (0.93,
1.06)
1.00 (ref) 0.78 (0.38,
1.60)
0.85 (0.41,
1.76)0.75
25 - <30 126/693 0.92 (0.87,
0.96)
1.00 (ref) 0.75 (0.48,
1.18)
0.40 (0.24,
0.67)
30+ 150/579 0.99 (0.95,
1.04)
1.00 (ref) 0.81 (0.52,
1.26)
0.99 (0.62,
1.59)
Interaction
p-value
0.09* 0.21
Age2
<65 159/900 0.99 (0.96,
1.03)
1.00 (ref) 0.90 (0.60,
1.36)
0.88 (0.58,
1.35)
65+ 173/667 0.93 (0.89,
0.97)
1.00 (ref) 0.73 (0.49,
1.08)
0.53 (0.34,
0.83)
Interaction
p-value
0.02* 0.25
Smoking
status
Never 93/555 0.93 (0.88,
0.98)
1.00 (ref) 0.60 (0.35,
1.02)
0.52 (030,
0.92)
Former 173/798 0.96 (0.92,
1.00)
1.00 (ref) 0.82 (0.55,
1.21)
0.63 (0.40,
0.98)
Current 66/214 1.00 (0.93,
1.08)
1.00 (ref) 0.90 (0.45,
1.84)
1.10 (0.52,
2.33)
Interaction
p-value
0.04* 0.16
1 Base model includes age, race, and total energy intake
2 Model uses age category variable in place of age
*p-value <0.10, considered statistically significant interaction
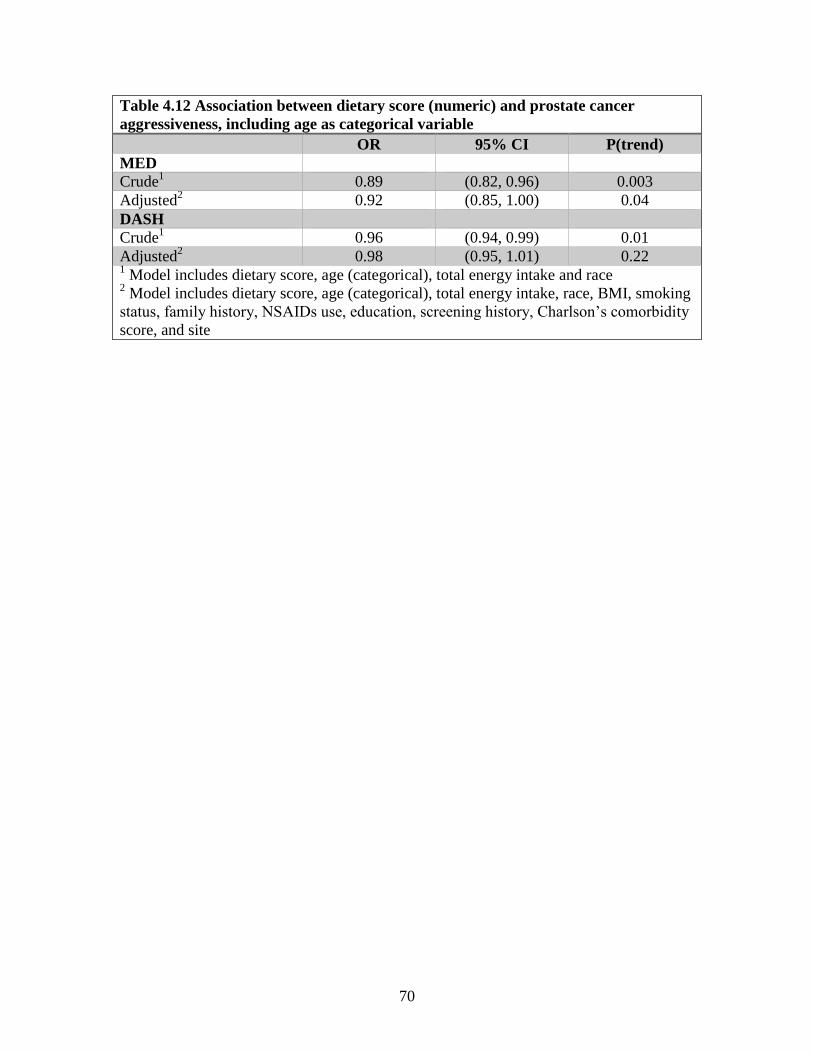
70
Table 4.12 Association between dietary score (numeric) and prostate cancer
aggressiveness, including age as categorical variable
OR 95% CI P(trend)
MED
Crude1 0.89 (0.82, 0.96) 0.003
Adjusted2 0.92 (0.85, 1.00) 0.04
DASH
Crude1 0.96 (0.94, 0.99) 0.01
Adjusted2 0.98 (0.95, 1.01) 0.22
1 Model includes dietary score, age (categorical), total energy intake and race
2 Model includes dietary score, age (categorical), total energy intake, race, BMI, smoking
status, family history, NSAIDs use, education, screening history, Charlson’s comorbidity
score, and site
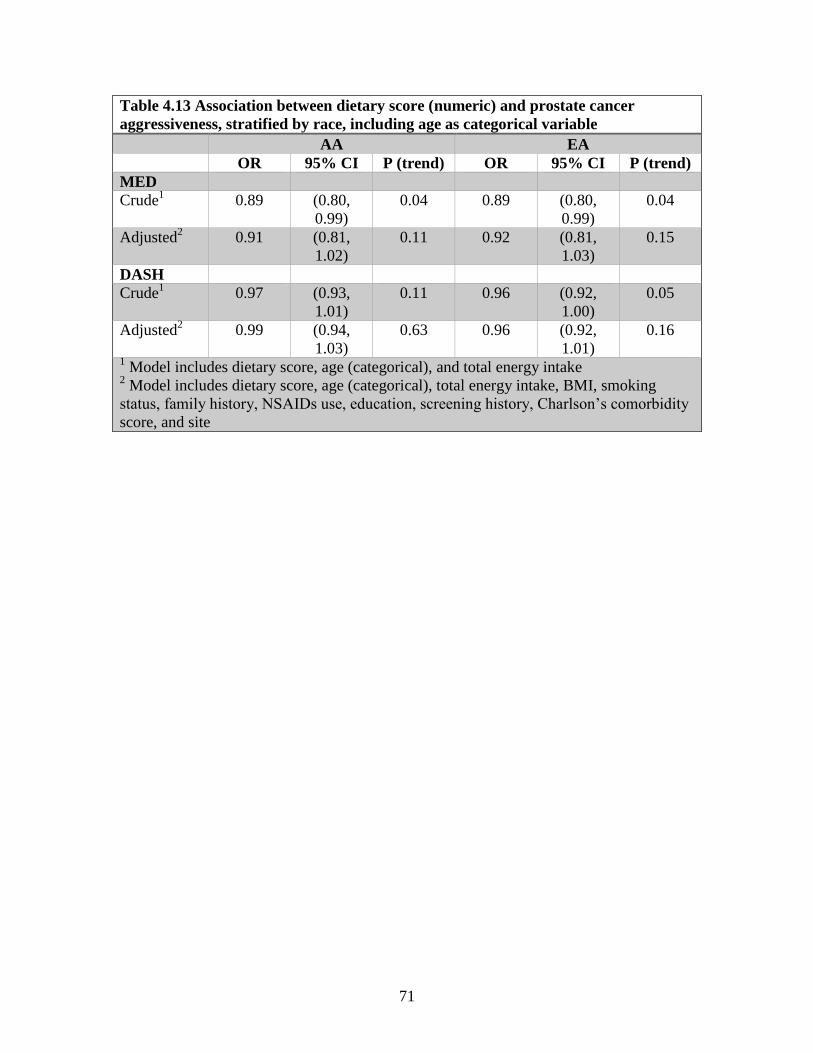
71
Table 4.13 Association between dietary score (numeric) and prostate cancer
aggressiveness, stratified by race, including age as categorical variable
AA EA
OR 95% CI P (trend) OR 95% CI P (trend)
MED
Crude1 0.89 (0.80,
0.99)
0.04 0.89 (0.80,
0.99)
0.04
Adjusted2 0.91 (0.81,
1.02)
0.11 0.92 (0.81,
1.03)
0.15
DASH
Crude1 0.97 (0.93,
1.01)
0.11 0.96 (0.92,
1.00)
0.05
Adjusted2 0.99 (0.94,
1.03)
0.63 0.96 (0.92,
1.01)
0.16
1 Model includes dietary score, age (categorical), and total energy intake
2 Model includes dietary score, age (categorical), total energy intake, BMI, smoking
status, family history, NSAIDs use, education, screening history, Charlson’s comorbidity
score, and site
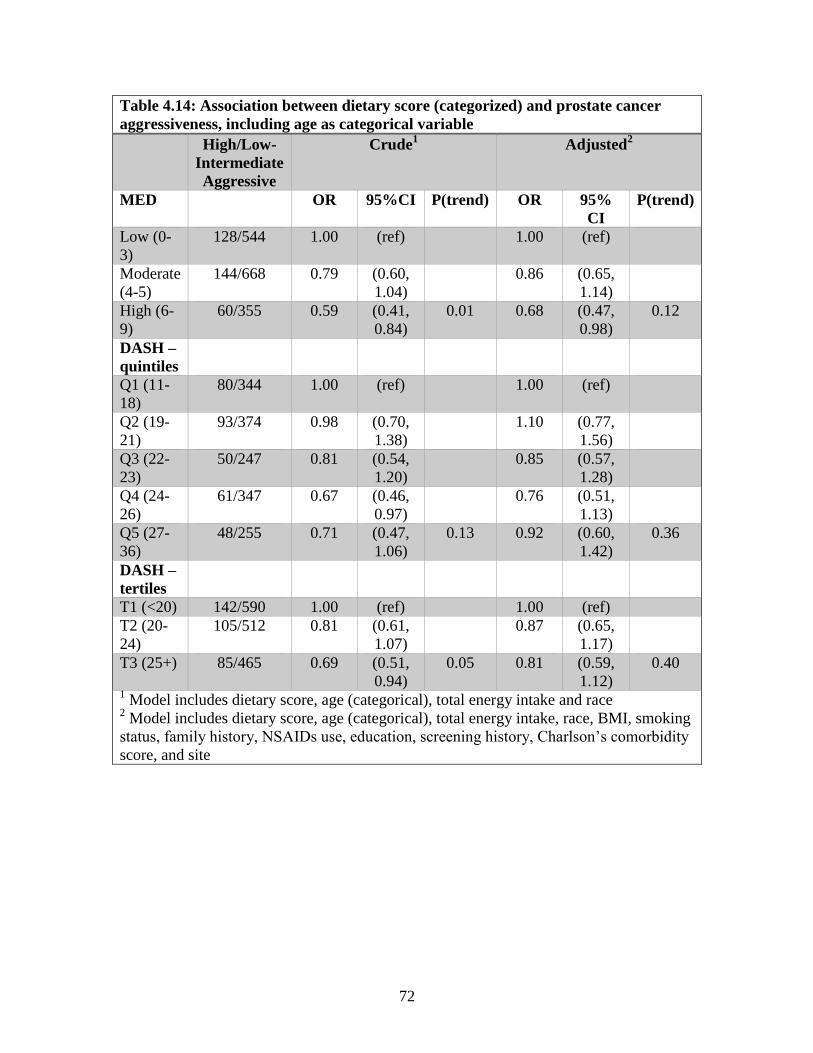
72
Table 4.14: Association between dietary score (categorized) and prostate cancer
aggressiveness, including age as categorical variable
High/Low-
Intermediate
Aggressive
Crude1 Adjusted
2
MED OR 95%CI P(trend) OR 95%
CI
P(trend)
Low (0-
3)
128/544 1.00 (ref) 1.00 (ref)
Moderate
(4-5)
144/668 0.79 (0.60,
1.04)
0.86 (0.65,
1.14)
High (6-
9)
60/355 0.59 (0.41,
0.84)
0.01 0.68 (0.47,
0.98)
0.12
DASH –
quintiles
Q1 (11-
18)
80/344 1.00 (ref) 1.00 (ref)
Q2 (19-
21)
93/374 0.98 (0.70,
1.38)
1.10 (0.77,
1.56)
Q3 (22-
23)
50/247 0.81 (0.54,
1.20)
0.85 (0.57,
1.28)
Q4 (24-
26)
61/347 0.67 (0.46,
0.97)
0.76 (0.51,
1.13)
Q5 (27-
36)
48/255 0.71 (0.47,
1.06)
0.13 0.92 (0.60,
1.42)
0.36
DASH –
tertiles
T1 (<20) 142/590 1.00 (ref) 1.00 (ref)
T2 (20-
24)
105/512 0.81 (0.61,
1.07)
0.87 (0.65,
1.17)
T3 (25+) 85/465 0.69 (0.51,
0.94)
0.05 0.81 (0.59,
1.12)
0.40
1 Model includes dietary score, age (categorical), total energy intake and race
2 Model includes dietary score, age (categorical), total energy intake, race, BMI, smoking
status, family history, NSAIDs use, education, screening history, Charlson’s comorbidity
score, and site
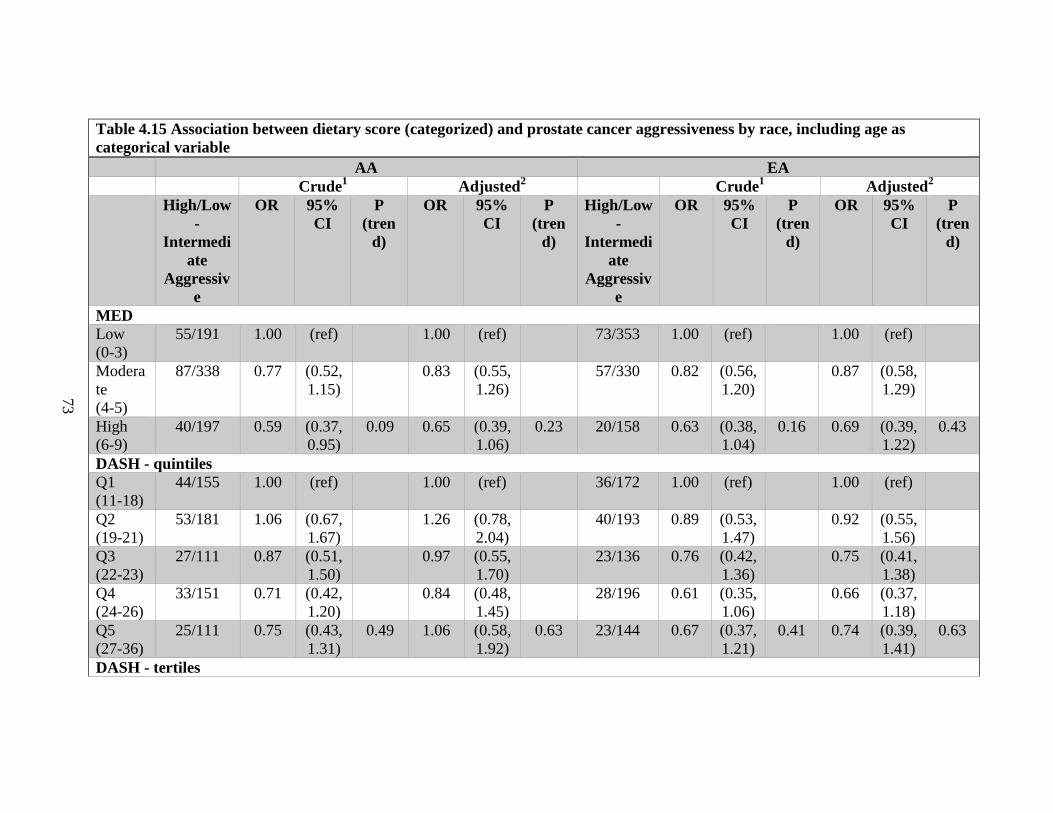
73
Table 4.15 Association between dietary score (categorized) and prostate cancer aggressiveness by race, including age as
categorical variable
AA EA
Crude1 Adjusted
2 Crude
1 Adjusted
2
High/Low
-
Intermedi
ate
Aggressiv
e
OR 95%
CI
P
(tren
d)
OR 95%
CI
P
(tren
d)
High/Low
-
Intermedi
ate
Aggressiv
e
OR 95%
CI
P
(tren
d)
OR 95%
CI
P
(tren
d)
MED
Low
(0-3)
55/191 1.00 (ref) 1.00 (ref) 73/353 1.00 (ref) 1.00 (ref)
Modera
te
(4-5)
87/338 0.77 (0.52,
1.15)
0.83 (0.55,
1.26)
57/330 0.82 (0.56,
1.20)
0.87 (0.58,
1.29)
High
(6-9)
40/197 0.59 (0.37,
0.95)
0.09 0.65 (0.39,
1.06)
0.23 20/158 0.63 (0.38,
1.04)
0.16 0.69 (0.39,
1.22)
0.43
DASH - quintiles
Q1
(11-18)
44/155 1.00 (ref) 1.00 (ref) 36/172 1.00 (ref) 1.00 (ref)
Q2
(19-21)
53/181 1.06 (0.67,
1.67)
1.26 (0.78,
2.04)
40/193 0.89 (0.53,
1.47)
0.92 (0.55,
1.56)
Q3
(22-23)
27/111 0.87 (0.51,
1.50)
0.97 (0.55,
1.70)
23/136 0.76 (0.42,
1.36)
0.75 (0.41,
1.38)
Q4
(24-26)
33/151 0.71 (0.42,
1.20)
0.84 (0.48,
1.45)
28/196 0.61 (0.35,
1.06)
0.66 (0.37,
1.18)
Q5
(27-36)
25/111 0.75 (0.43,
1.31)
0.49 1.06 (0.58,
1.92)
0.63 23/144 0.67 (0.37,
1.21)
0.41 0.74 (0.39,
1.41)
0.63
DASH - tertiles
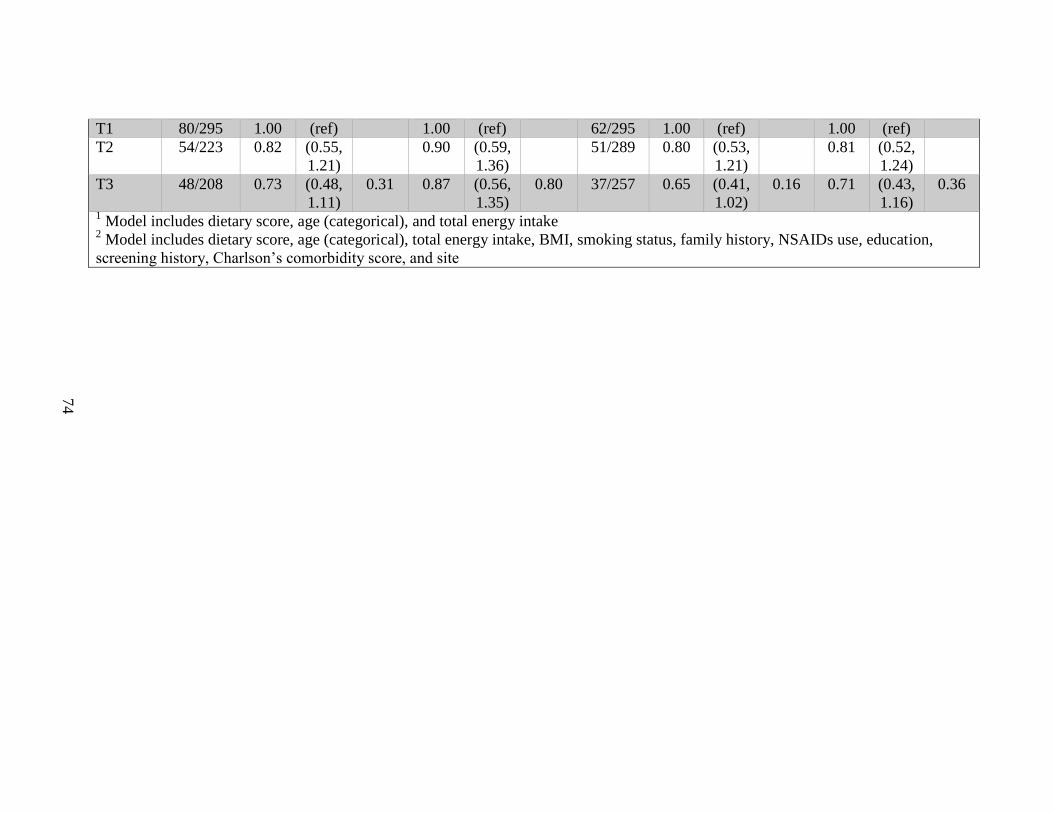
74
T1 80/295 1.00 (ref) 1.00 (ref) 62/295 1.00 (ref) 1.00 (ref)
T2 54/223 0.82 (0.55,
1.21)
0.90 (0.59,
1.36)
51/289 0.80 (0.53,
1.21)
0.81 (0.52,
1.24)
T3 48/208 0.73 (0.48,
1.11)
0.31 0.87 (0.56,
1.35)
0.80 37/257 0.65 (0.41,
1.02)
0.16 0.71 (0.43,
1.16)
0.36
1 Model includes dietary score, age (categorical), and total energy intake
2 Model includes dietary score, age (categorical), total energy intake, BMI, smoking status, family history, NSAIDs use, education,
screening history, Charlson’s comorbidity score, and site
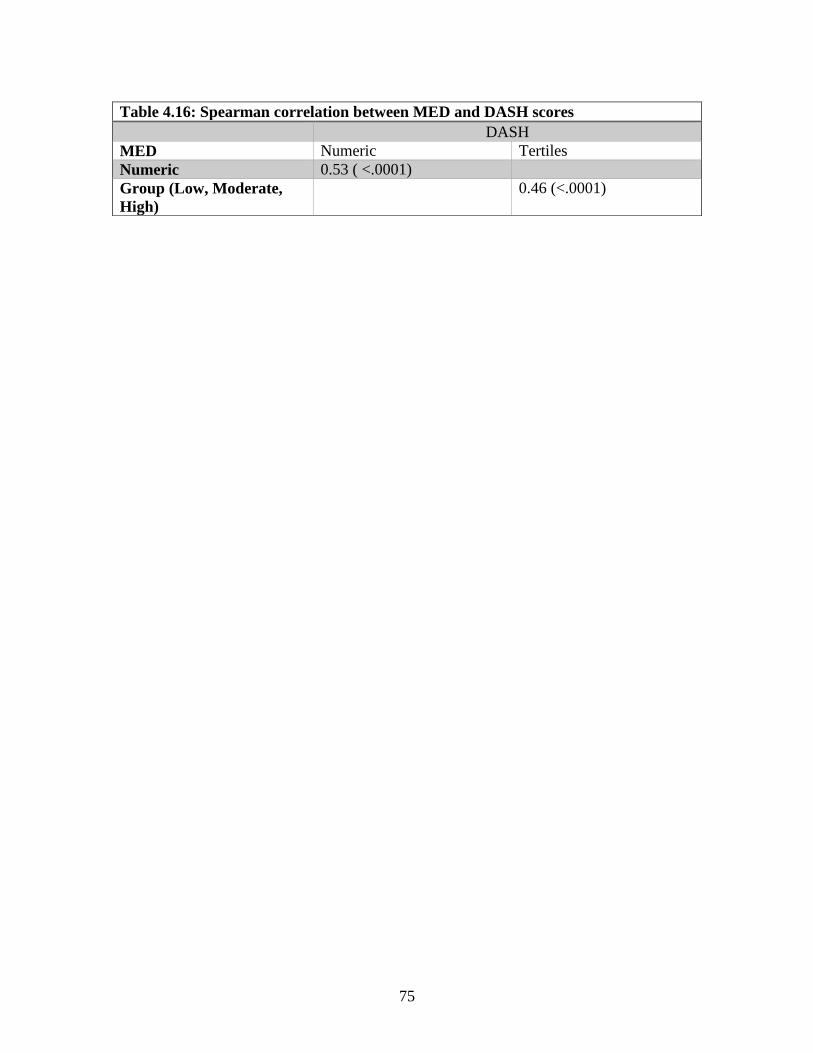
75
Table 4.16: Spearman correlation between MED and DASH scores
DASH
MED Numeric Tertiles
Numeric 0.53 ( <.0001)
Group (Low, Moderate,
High)
0.46 (<.0001)
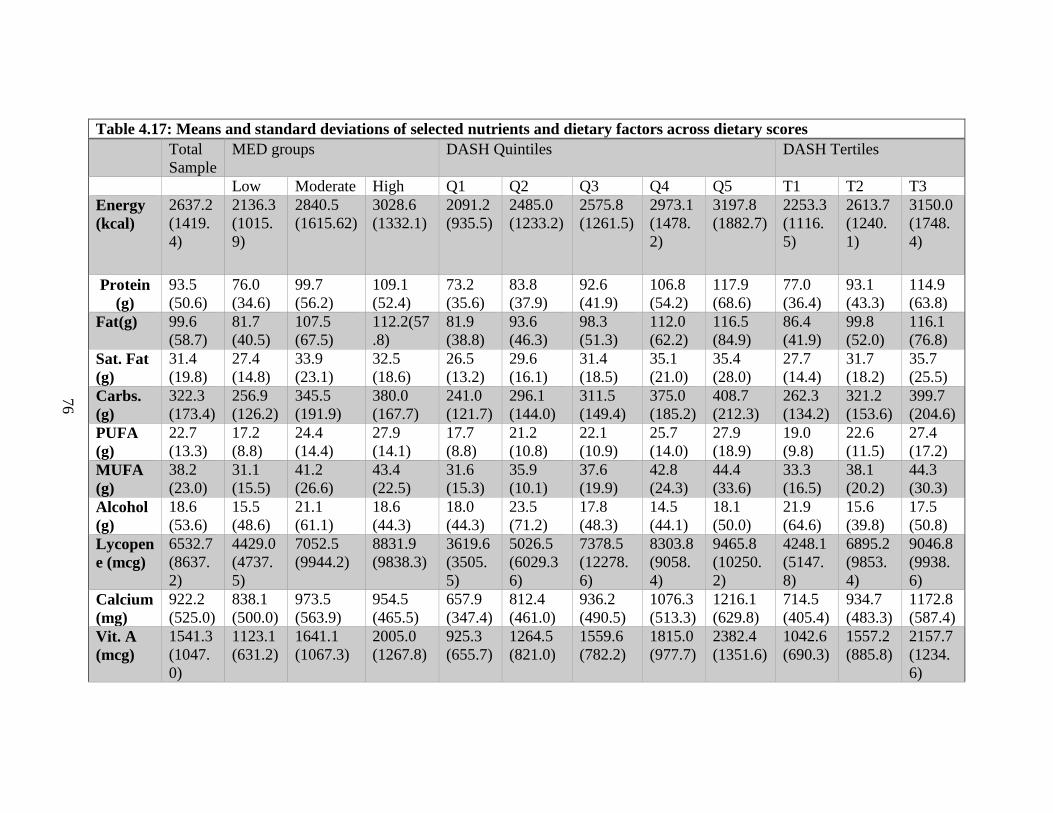
76
Table 4.17: Means and standard deviations of selected nutrients and dietary factors across dietary scores
Total
Sample
MED groups DASH Quintiles DASH Tertiles
Low Moderate High Q1 Q2 Q3 Q4 Q5 T1 T2 T3
Energy
(kcal)
2637.2
(1419.
4)
2136.3
(1015.
9)
2840.5
(1615.62)
3028.6
(1332.1)
2091.2
(935.5)
2485.0
(1233.2)
2575.8
(1261.5)
2973.1
(1478.
2)
3197.8
(1882.7)
2253.3
(1116.
5)
2613.7
(1240.
1)
3150.0
(1748.
4)
Protein
(g)
93.5
(50.6)
76.0
(34.6)
99.7
(56.2)
109.1
(52.4)
73.2
(35.6)
83.8
(37.9)
92.6
(41.9)
106.8
(54.2)
117.9
(68.6)
77.0
(36.4)
93.1
(43.3)
114.9
(63.8)
Fat(g) 99.6
(58.7)
81.7
(40.5)
107.5
(67.5)
112.2(57
.8)
81.9
(38.8)
93.6
(46.3)
98.3
(51.3)
112.0
(62.2)
116.5
(84.9)
86.4
(41.9)
99.8
(52.0)
116.1
(76.8)
Sat. Fat
(g)
31.4
(19.8)
27.4
(14.8)
33.9
(23.1)
32.5
(18.6)
26.5
(13.2)
29.6
(16.1)
31.4
(18.5)
35.1
(21.0)
35.4
(28.0)
27.7
(14.4)
31.7
(18.2)
35.7
(25.5)
Carbs.
(g)
322.3
(173.4)
256.9
(126.2)
345.5
(191.9)
380.0
(167.7)
241.0
(121.7)
296.1
(144.0)
311.5
(149.4)
375.0
(185.2)
408.7
(212.3)
262.3
(134.2)
321.2
(153.6)
399.7
(204.6)
PUFA
(g)
22.7
(13.3)
17.2
(8.8)
24.4
(14.4)
27.9
(14.1)
17.7
(8.8)
21.2
(10.8)
22.1
(10.9)
25.7
(14.0)
27.9
(18.9)
19.0
(9.8)
22.6
(11.5)
27.4
(17.2)
MUFA
(g)
38.2
(23.0)
31.1
(15.5)
41.2
(26.6)
43.4
(22.5)
31.6
(15.3)
35.9
(10.1)
37.6
(19.9)
42.8
(24.3)
44.4
(33.6)
33.3
(16.5)
38.1
(20.2)
44.3
(30.3)
Alcohol
(g)
18.6
(53.6)
15.5
(48.6)
21.1
(61.1)
18.6
(44.3)
18.0
(44.3)
23.5
(71.2)
17.8
(48.3)
14.5
(44.1)
18.1
(50.0)
21.9
(64.6)
15.6
(39.8)
17.5
(50.8)
Lycopen
e (mcg)
6532.7
(8637.
2)
4429.0
(4737.
5)
7052.5
(9944.2)
8831.9
(9838.3)
3619.6
(3505.
5)
5026.5
(6029.3
6)
7378.5
(12278.
6)
8303.8
(9058.
4)
9465.8
(10250.
2)
4248.1
(5147.
8)
6895.2
(9853.
4)
9046.8
(9938.
6)
Calcium
(mg)
922.2
(525.0)
838.1
(500.0)
973.5
(563.9)
954.5
(465.5)
657.9
(347.4)
812.4
(461.0)
936.2
(490.5)
1076.3
(513.3)
1216.1
(629.8)
714.5
(405.4)
934.7
(483.3)
1172.8
(587.4)
Vit. A
(mcg)
1541.3
(1047.
0)
1123.1
(631.2)
1641.1
(1067.3)
2005.0
(1267.8)
925.3
(655.7)
1264.5
(821.0)
1559.6
(782.2)
1815.0
(977.7)
2382.4
(1351.6)
1042.6
(690.3)
1557.2
(885.8)
2157.7
(1234.
6)
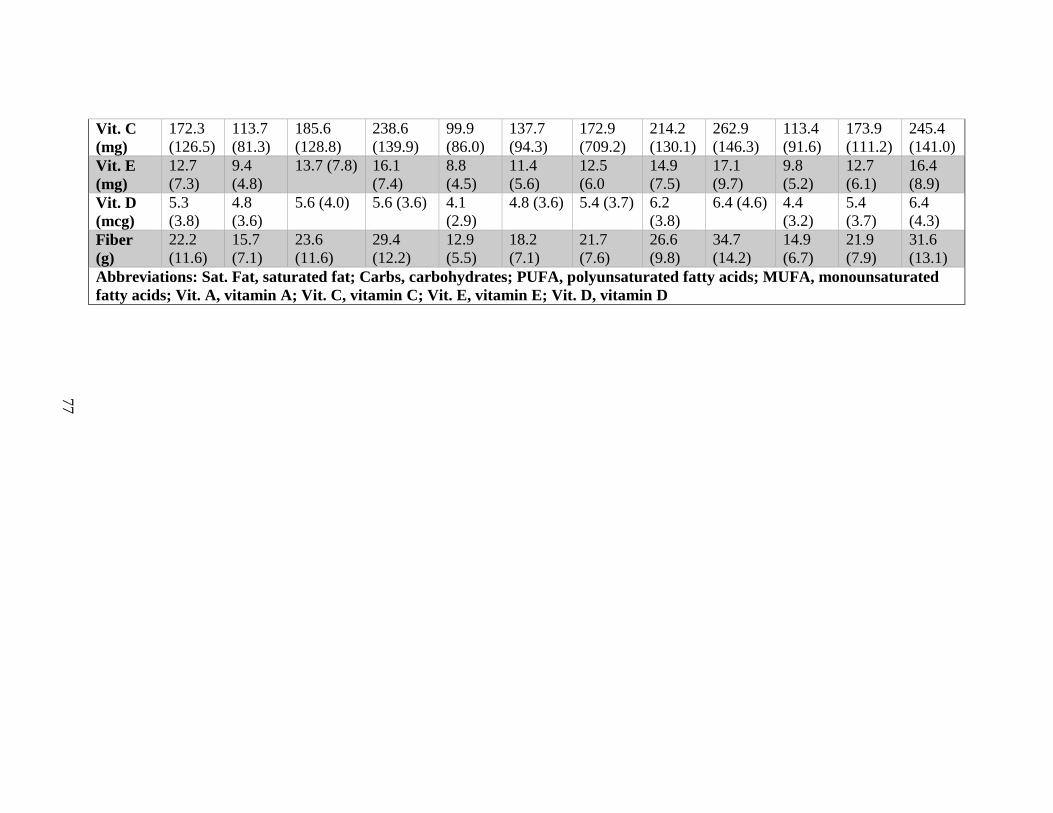
77
Vit. C
(mg)
172.3
(126.5)
113.7
(81.3)
185.6
(128.8)
238.6
(139.9)
99.9
(86.0)
137.7
(94.3)
172.9
(709.2)
214.2
(130.1)
262.9
(146.3)
113.4
(91.6)
173.9
(111.2)
245.4
(141.0)
Vit. E
(mg)
12.7
(7.3)
9.4
(4.8)
13.7 (7.8) 16.1
(7.4)
8.8
(4.5)
11.4
(5.6)
12.5
(6.0
14.9
(7.5)
17.1
(9.7)
9.8
(5.2)
12.7
(6.1)
16.4
(8.9)
Vit. D
(mcg)
5.3
(3.8)
4.8
(3.6)
5.6 (4.0) 5.6 (3.6) 4.1
(2.9)
4.8 (3.6) 5.4 (3.7) 6.2
(3.8)
6.4 (4.6) 4.4
(3.2)
5.4
(3.7)
6.4
(4.3)
Fiber
(g)
22.2
(11.6)
15.7
(7.1)
23.6
(11.6)
29.4
(12.2)
12.9
(5.5)
18.2
(7.1)
21.7
(7.6)
26.6
(9.8)
34.7
(14.2)
14.9
(6.7)
21.9
(7.9)
31.6
(13.1)
Abbreviations: Sat. Fat, saturated fat; Carbs, carbohydrates; PUFA, polyunsaturated fatty acids; MUFA, monounsaturated
fatty acids; Vit. A, vitamin A; Vit. C, vitamin C; Vit. E, vitamin E; Vit. D, vitamin D
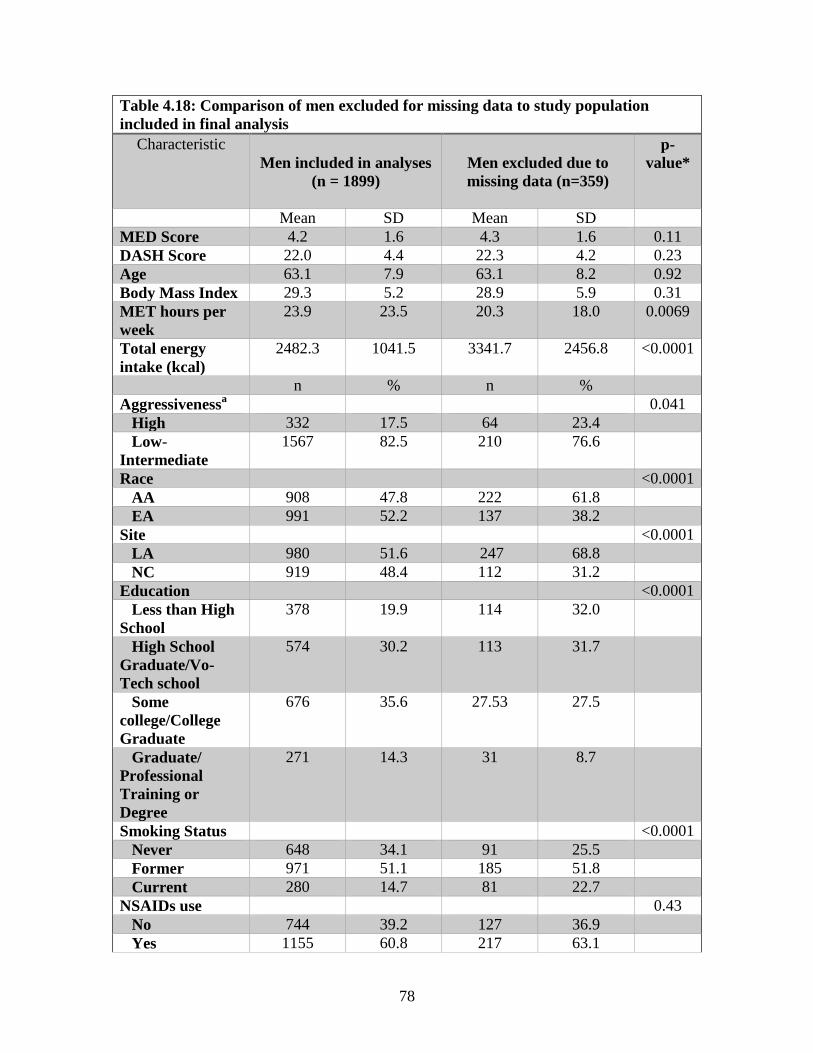
78
Table 4.18: Comparison of men excluded for missing data to study population
included in final analysis
Characteristic
Men included in analyses
(n = 1899)
Men excluded due to
missing data (n=359)
p-
value*
Mean SD Mean SD
MED Score 4.2 1.6 4.3 1.6 0.11
DASH Score 22.0 4.4 22.3 4.2 0.23
Age 63.1 7.9 63.1 8.2 0.92
Body Mass Index 29.3 5.2 28.9 5.9 0.31
MET hours per
week
23.9 23.5 20.3 18.0 0.0069
Total energy
intake (kcal)
2482.3 1041.5 3341.7 2456.8 <0.0001
n % n %
Aggressivenessa 0.041
High 332 17.5 64 23.4
Low-
Intermediate
1567 82.5 210 76.6
Race <0.0001
AA 908 47.8 222 61.8
EA 991 52.2 137 38.2
Site <0.0001
LA 980 51.6 247 68.8
NC 919 48.4 112 31.2
Education <0.0001
Less than High
School
378 19.9 114 32.0
High School
Graduate/Vo-
Tech school
574 30.2 113 31.7
Some
college/College
Graduate
676 35.6 27.53 27.5
Graduate/
Professional
Training or
Degree
271 14.3 31 8.7
Smoking Status <0.0001
Never 648 34.1 91 25.5
Former 971 51.1 185 51.8
Current 280 14.7 81 22.7
NSAIDs use 0.43
No 744 39.2 127 36.9
Yes 1155 60.8 217 63.1
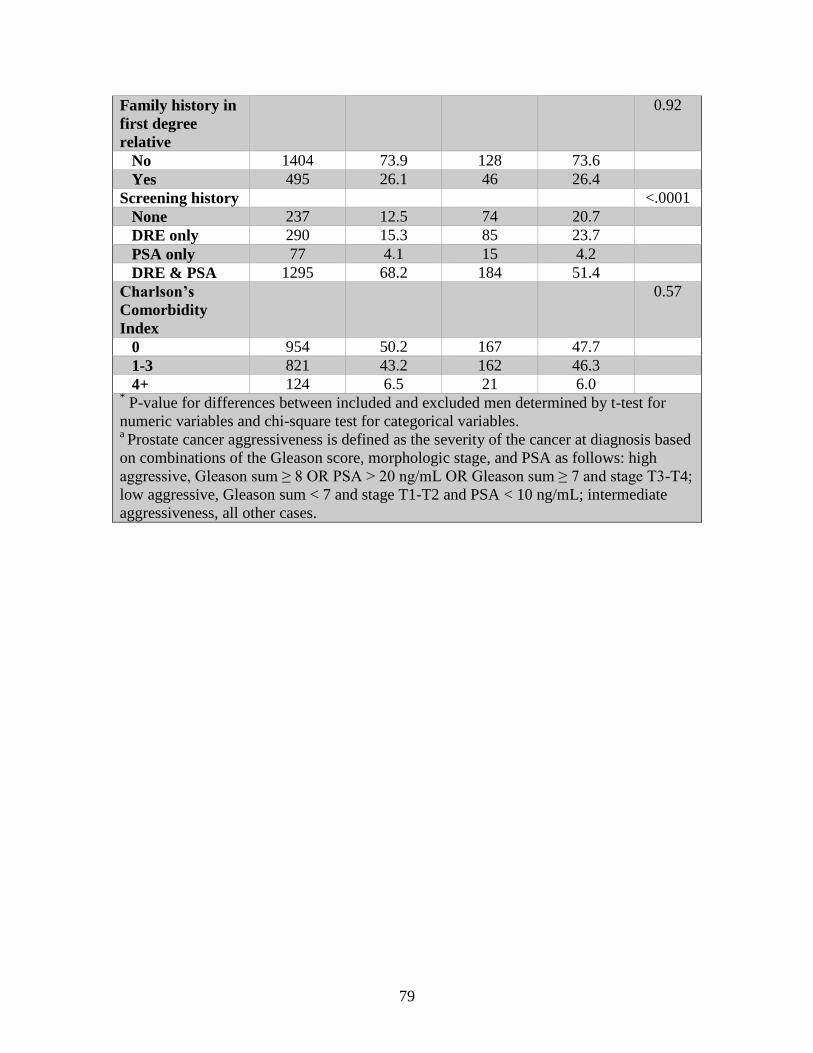
79
Family history in
first degree
relative
0.92
No 1404 73.9 128 73.6
Yes 495 26.1 46 26.4
Screening history <.0001
None 237 12.5 74 20.7
DRE only 290 15.3 85 23.7
PSA only 77 4.1 15 4.2
DRE & PSA 1295 68.2 184 51.4
Charlson’s
Comorbidity
Index
0.57
0 954 50.2 167 47.7
1-3 821 43.2 162 46.3
4+ 124 6.5 21 6.0 * P-value for differences between included and excluded men determined by t-test for
numeric variables and chi-square test for categorical variables. a Prostate cancer aggressiveness is defined as the severity of the cancer at diagnosis based
on combinations of the Gleason score, morphologic stage, and PSA as follows: high
aggressive, Gleason sum ≥ 8 OR PSA > 20 ng/mL OR Gleason sum ≥ 7 and stage T3-T4;
low aggressive, Gleason sum < 7 and stage T1-T2 and PSA < 10 ng/mL; intermediate
aggressiveness, all other cases.
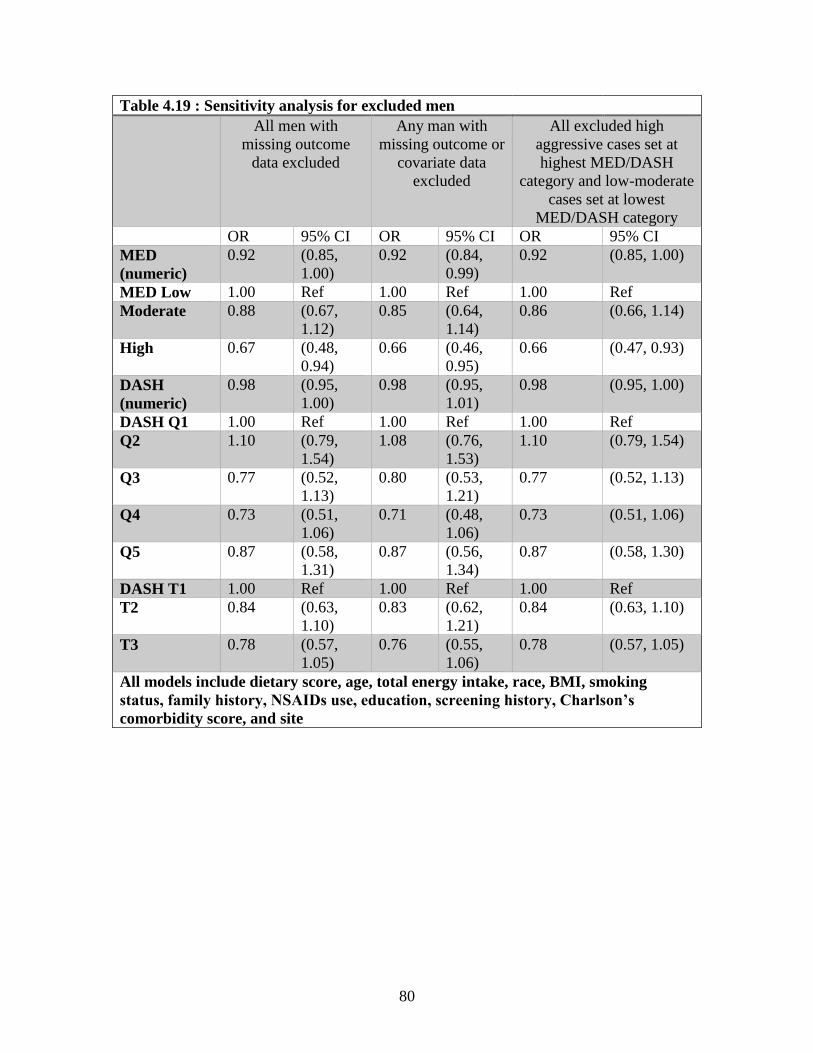
80
Table 4.19 : Sensitivity analysis for excluded men
All men with
missing outcome
data excluded
Any man with
missing outcome or
covariate data
excluded
All excluded high
aggressive cases set at
highest MED/DASH
category and low-moderate
cases set at lowest
MED/DASH category
OR 95% CI OR 95% CI OR 95% CI
MED
(numeric)
0.92 (0.85,
1.00)
0.92 (0.84,
0.99)
0.92 (0.85, 1.00)
MED Low 1.00 Ref 1.00 Ref 1.00 Ref
Moderate 0.88 (0.67,
1.12)
0.85 (0.64,
1.14)
0.86 (0.66, 1.14)
High 0.67 (0.48,
0.94)
0.66 (0.46,
0.95)
0.66 (0.47, 0.93)
DASH
(numeric)
0.98 (0.95,
1.00)
0.98 (0.95,
1.01)
0.98 (0.95, 1.00)
DASH Q1 1.00 Ref 1.00 Ref 1.00 Ref
Q2 1.10 (0.79,
1.54)
1.08 (0.76,
1.53)
1.10 (0.79, 1.54)
Q3 0.77 (0.52,
1.13)
0.80 (0.53,
1.21)
0.77 (0.52, 1.13)
Q4 0.73 (0.51,
1.06)
0.71 (0.48,
1.06)
0.73 (0.51, 1.06)
Q5 0.87 (0.58,
1.31)
0.87 (0.56,
1.34)
0.87 (0.58, 1.30)
DASH T1 1.00 Ref 1.00 Ref 1.00 Ref
T2 0.84 (0.63,
1.10)
0.83 (0.62,
1.21)
0.84 (0.63, 1.10)
T3 0.78 (0.57,
1.05)
0.76 (0.55,
1.06)
0.78 (0.57, 1.05)
All models include dietary score, age, total energy intake, race, BMI, smoking
status, family history, NSAIDs use, education, screening history, Charlson’s
comorbidity score, and site
81
CHAPTER 5
DISCUSSION
Summary of Results
Higher conformity to the Mediterranean diet (as measured by the MED score) and
to the DASH diet (as measured by the DASH score) were associated with decreased odds
of aggressive prostate cancer. The associations were statistically significant for numeric
measures of dietary quality in simple models adjusted for age, total energy intake, and
race. Associations were attenuated when further adjustment for BMI, smoking status,
family history, NSAIDs use, education, screening history, site, and comorbidities
occurred, though the inverse direction of the associations remained. Though there is not
enough evidence to claim healthy dietary patterns improve prostate cancer outcomes,
high diet quality is unlikely detrimental for prostate health, and the Mediterranean diet, in
particular, was inversely associated with prostate cancer aggressiveness among the
highest conformers. There was a significant benefit for both AA men and EA men,
though the benefit was slightly greater for EA men than AA men. Age modified the
association between diet quality and prostate cancer aggressiveness: men aged 65 and
older were shown to have a statistically significantly greater benefit from higher MED
and DASH scores than men younger than 65 years of age.
Significance of Findings
Previous research that has examined the association between Mediterranean diet
adherence (measured by the MED or aMED scores) and prostate cancer outcomes have
82
largely found modest, statistically not significant inverse relationships (Ax, Garmo et al.
2014; Bosire, Stampfer et al. 2013; Kenfield, Du Pre et al. 2014; Möller, Galeone et al.
2013; Muller, Severi et al. 2009). However, this study found a statistically significant
inverse relationship between MED score and prostate cancer aggressiveness even after
adjustment for potential confounders. Men in the highest level of MED score (score=6-9)
had 34% lower odds of aggressive prostate cancer compared to those with the lowest
scores (score=0-3). The sample population of this study is unique in that it included AA
and EA American men in equal proportion; previous research conducted with American
men sampled men from the NIH-AARP and Health Professionals Follow-up Study
cohorts represented mostly EA men (Bosire, Stampfer et al. 2013; Kenfield, Du Pre et al.
2014). Other research on a priori dietary patterns and prostate cancer outcomes was
based on Australian and Swedish populations (Muller, Severi et al. 2009; Ax. Garmo et
la. 2014; Möller, Galeone et al. 2013). The scoring in this study was consistent with the
Kenfield study (2014) and Möller study (2013); the Kenfield sample had a greater
number of participants in the ‘high adherence’ category (29.2% vs. 21.9%), though the
average MED score in the Möller study for both cases and controls was similar to this
one (4.4/4.4 vs. 4.2/4.0). Bosire, et al. (2013) and Ax, et al. (2014) used the alternative
MED scoring systems, though the score distributions were similarly distributed in both
studies were similar to this sample; Muller, et al (2009) compared quartiles, and the
average aMED score was consistent with averages (4.4 for both cases and controls) seen
in this study. The case-only sample consisting of half AA men and half EA men,
combined with the NCI-modified FFQ used to assess diet, may contribute to the deviation
of this study’s results from previous research.
83
This is the first known study to evaluate conformity to the DASH diet in relation
to prostate cancer aggressiveness, though previous work has examined DASH diet
adherence in relation to other cancers. Anic, et al. (2015) found that greater adherence to
the DASH diet reduced the risk of lung cancer in former smokers, while another study
found that higher DASH scores were significantly associated with decreased risk of
colorectal cancer for men (Jones-McLean, et al. 2015; Dixon, Subar et al. 2007).
Americans with the highest DASH scores had lower cancer mortality than those with the
lowest scores in multiple studies (Liese, Krebs-Smith et al. 2015; Harmon, Boushey et al.
2015; Schwingshackl, Hoffman 2015). The results of this study further corroborate
previous research that suggests that healthy eating, in accordance with the DASH Eating
Plan, reduces the risk of several cancers, including aggressive cancer of the prostate.
While both the MED and DASH scores are meant to grade healthiness of diet, the
two have different criteria that define healthiness. All grains are considered beneficial in
MED scoring, while DASH scoring only considers whole grains as healthy; conversely,
the MED score classifies all dairy as negative, whereas low-fat dairy contributes
positively to the DASH score. Fish, but no other animal protein, are positively scored for
MED; fish are not considered separately for DASH, but only red and processed meats
contribute (negatively) to the DASH score. The MED also considers moderate alcohol
and high unsaturated- to-saturated ratio fat intakes beneficial to health; the DASH does
not account for consumption of either, but does discount high sodium and sugary
beverage consumption. Vegetable, fruit, nut, and bean consumption in both patterns is
considered positively. The differences between the two scoring schemes are reflected in
their moderate correlation (see Table 4.16).
84
Neither dietary pattern measure showed significant differences by race. To the
best of our knowledge, no other studies have examined total dietary quality and prostate
cancer outcomes stratified by race, so further research is needed to corroborate our
findings. Higher scores on both dietary pattern measures were modified by age, with a
significantly greater benefit seen in men aged 65 and older compared to men younger
than 65 years of age. There is evidence that healthy eating and cancer mortality are not
associated in older men but midlife diet may affect aging (Nobbs, Yaxley et al. 2015;
Assmann, Lassale et al. 2015). The results of this study suggest that healthy diets in later
life may still impact cancer aggressiveness.
Strengths and Weaknesses
This study has several strengths and weaknesses. A main weakness of this study
was the recruitment process, which did not enroll equal number of research subjects
based on aggressiveness of disease. Typical case-control studies recruit participants based
on disease diagnosis, with the intent to maximize power to analyze the disease of interest.
In the current study, as all participants had prostate cancer, the ability to detect
differences by cancer aggressiveness was limited by the smaller sample size of high
aggressive cases. Only 17% of the men included in analysis were diagnosed with high
aggressive prostate cancer, limiting statistical power. Furthermore, a lack of healthy
control group and inclusion of only AA and EA men somewhat limits the generalizability
of this study’s findings.
Another potential weakness of this study was the measurement of the dietary data.
The NCI DHQ, modified to include regional dishes of North Carolina and Louisiana,
assessed participants’ diet for the year prior to diagnosis. Food frequency questionnaires
85
can be inaccurate, as information is forgotten, misremembered, or purposefully falsified.
The quality of food frequency questionnaire data is not regarded as highly as alternative
assessment methods, as complete history is impossible because the questions were
closed-ended (Willett 2012). Even assuming complete accuracy of dietary information,
only food intakes for the year prior to diagnosis were assessed. Due to the long latency
and slow progression periods possible for prostate cancer, diet for the year before
diagnosis likely has less impact on prostate cancer outcomes than mid-life or lifetime
diet.
Due to missing outcome, exposure, and covariate data, 359 men were excluded
from analysis. When these men were compared to the final sample, there was a
significant difference in outcomes between included and excluded men, with excluded
men (with diagnostic measurements) more likely to have high aggressive prostate cancer.
When the excluded men with available aggressiveness scores were included in the
analysis, there was no change in the association estimates; this remained the case when
previously excluded men with high aggressive prostate cancer were artificially given the
highest dietary scores and the men with low to intermediate aggressive prostate cancers
were given the lowest dietary scores. Because the associations were unchanged by
including previously missing subjects in direct opposition to the hypothesis, it is unlikely
that selection bias affected the association estimates.
Despite these weaknesses, this study also had a number of strengths. Because
recruitment was based on race rather than disease status, the sample population was ideal
to study racial differences in prostate cancer aggressiveness. While no significant racial
differences were found in this study, the study’s design lends confidence to the
86
conclusion that the effect of overall diet quality on prostate cancer aggressiveness is
similar for AA and EA men. The recruitment design also limited the recall bias
commonly associated with case-control studies and dietary recalls. All participants had
diagnosed prostate cancer, and it is unlikely that high aggressive cases remembered their
eating habits differently than men with low or intermediate aggressive disease. Also, due
to the high prevalence of indolent prostate cancer in the American population, enrolling
only men with confirmed prostate cancer and utilizing low-intermediate aggressive cases
as the comparison group may have reduced outcome misclassification. In traditional case-
control studies, some “controls” may be erroneously assumed to be disease-free because
they had not been screened previously. Another strength of PCaP is that data on a large
number of potential confounders and effect modifiers were collected from research
subjects and used in the analyses. However, residual or unmeasured confounding cannot
be ruled out in any observational study. Results in the fully adjusted models were
attenuated from those in the simple models, suggesting some confounding by the
included covariates.
Recommendations for Future Research
Higher conformity to Mediterranean and DASH diets was associated with lower
odds of aggressive prostate cancer. Further analyses using this dataset should examine
each component of the MED and DASH diets and their associations with prostate cancer
aggressiveness. The Mediterranean diet differentiates fish consumption from other
protein sources, unlike the DASH Easting Plan, which does not. Since fish has been
shown to decrease prostate cancer risk in several previous studies, determining if high
scores in the fish component of the MED score are associated with prostate cancer
87
aggressiveness would further clarify the possible benefits of consuming fish and omega-3
fatty acids. Similar analyses using each pattern’s components could better define the
potential benefits and harms of specific food groups.
The modification of the association between dietary pattern and aggressiveness by
age should be further explored. Diet was measured only in the year prior to diagnosis for
all men, regardless of age, so we were unable to examine diet at other life stages or
changes in diet over time. Possible effects of improving diet at various stages of life
would help explain the timeline for dietary modifications on health and shape dietary
recommendations for each age group.
In conclusion, it was found that men who consume diets with higher conformity
to the Mediterranean diet and the DASH Eating Plan were less likely to be diagnosed
with high aggressive prostate cancer than those who scored lower; this association was
modified by age, with men aged 65 and older receiving greater benefit from a healthy diet
in relation to prostate cancer stage than men younger than 65. This study contributes to
the body of literature on overall diet and prostate cancer, particularly as it relates to
aggressiveness of disease. While previous studies have been inconclusive on the
association between a priori dietary patterns and prostate cancer risk, the results of this
study suggest that an overall healthy diet may protect men from aggressive prostate
cancers.
88
REFERENCES
Albano, J.D., E. Ward, et al. (2007). “Cancer mortality in the United States by education
and race.” J Natl Cancer Inst 99:1384-1394.
Alvarez-Cubero, M.J., M. Saiz, et al. (2013). “Genetic analysis of the principal genes
related to prostate cancer: A review.” Urol Oncol 31(8):1419-1429.
Ambrosini, G.L., L. Fritschi, et al. (2008). “Dietary patterns identified using factor
analysis and prostate cancer risk: a case control study in Western Australia.” Ann
Epidemiol 18:364-370.
American Cancer Society (2015). How is prostate cancer staged? ASC; Atlanta, GA.
Accessed 13 April, 2015.
http://www.cancer.org/cancer/prostatecancer/detailedguide/prostate-cancer-
staging
Anic G.M., Park Y., Subar, A.F., Schap T.E., Reedy J. (2015). “Index-based dietary
patterns and risk of lung cancer in the NIH-AARP diet and health study.” Eur J
Clin Nutr doi: 10.1038/ejcn.2015.122.
Appel, L.J., T.J. Moore, et al. (1997). “A clinical trial and the effects of dietary patterns
on blood pressure.” N Engl J Med 336(16):1117-1124.
Askari, F., M.K. Parizi, et al. (2014). “Dietary patterns in relation to prostate cancer in
Iranian men: a case-control study.” Asian Pac J Cancer Prev 15(5):2159-2163.
Assmann, K.E., Lassale, C., Angreeva, V.A., et al. (2015) “A healthy dietary pattern at
midlife, combined with a regulated energy intake, is related to increased odds for
healthy aging.” J Nutr doi: 10.3945/jn.115.210740.
Aune, D., D.A. Navarro Rosenblatt, et al. (2015). “Dairy products, calcium, and prostate
cancer risk: a systematic review and meta-analysis of cohort studies.” Am J Clin
Nutr 101(1):87-117.
Ax, E., H. Garmo, et al. (2014). “Dietary patterns and prostate cancer risk: report from
the population based ULSAM cohort study of Swedish men.” Nutr Cancer
66(1):77-87.
89
Barbieri, C.E. and S.A. Tomlins. (2014). “The prostate cancer genome: perspectives and
potential.” Urol Oncol 32(1):e15-e22.
Barrett, D.M. Mayo Clinic on Prostate Health. Philadelphia: Mason Crest Publishing,
2002.
Beer, T.M., A. Myrthue. “Calcitrol in the treatment of prostate Cancer.” Anticancer Res
26(4A):2647-2651.
Bennett, C.L., M.R. Ferreira, et al. (1998).” Relation between literacy, race, and stage of
presentation among low-income patients with prostate cancer.” J Clin Oncol
16(9):3101-3104.
Bill-Axelson, A., L. Holmberg, et al. (2005). “Radical Prostatectomy versus watchful
waiting in early prostate cancer.” N Engl J Med 352:1977-1984.
Bloom, J.R., S.L. Stewart, et al. (2006). “Family history, perceived risk, and prostate
cancer screening among African American men.” Cancer Epidemiol Biomarkers
Prev 15(11):2167-2173.
Bosetti, C., V. Rosato, et al. (2014). “Aspirin and prostate cancer prevention.” Recent
Results Cancer Res 202:90-100.
Bosire, C., M.J. Stampfer, et al. (2013). “Index-based dietary patterns and the risk of
prostate cancer in the NIH-AARP Diet and Health Study.” Am J Epidemiol
177(6):504-513.
Bratt, O., H. Garmo, et al. (2010). “Effects of prostate-specific antigen testing on familial
prostate cancer risk estimates.” J Natl Cancer Inst 102(7):1336-1343.
Byers, T.E., H.J. Wolf, et al. (2008). “The impact of socioeconomic status on survival
after cancer in the United States: findings from the National Program of Cancer
Registries Patterns of Care Study.” Cancer 113(3):582-591.
Carpenter, W.R., P.A. Godley, et al. (2009). “Racial differences in trust and regular
source of patient care and the implications for prostate cancer screening use.”
Cancer Causes Control 115:5048-5059.
Carpenter, W.R., D.L. Howard, et al. (2010). “Racial differences in PSA screening
interval and stage at diagnosis.” Cancer Causes Control 21:1071-1080.
Carter, B.S., T.H. Beaty, et al. (1992). “Mendelian inheritance of familial prostate
cancer.” Proc Natl Acad Sci 89:3367-3371.
90
Cavicchia, P.P., S.E. Steck, et al. (2009). “A new dietary inflammatory index predicts
interval changes in high-sensitivity c-reactive protein.” J Nutr 139:2365-2372.
Chamie, K., T.J. Daskivich, et al. (2012). “Comorbidities, treatment and ensuing survival
in men with prostate cancer.” J Gen Intern Med 27(5):492-499.
Chan, J.M., M.J. Stampfer, et al. (1998). “Plasma insulin-like growth factor-1 and
prostate cancer risk: a prospective study.” Science 279(5350):563-566.
Charlson, M.E., P. Pompei, et al. (1987). “A new method of classifying prognostic
comorbidity in longitudinal studies: development and validation.” J Chronic Dis
40(5):373-383.
Chen, J., Y. Song, et al. (2013). Lycopene/tomato consumption and the risk of prostate
cancer; a systematic review and meta-analysis of prospective studies.” J Nutr Sci
Vitaminol (Tokyo) 59(3):213-223.
Cheung, E., P. Wadhera, et al. (2008). “Diet and prostate cancer risk reduction.” Expert
Rev Anticancer Ther 8(1):43-50.
Clegg, L.X., M.E. Reichman, et al. (2009). “Impact fo socioeconomic status in cancer
incidence and stage at diagnosis: select findings from the surveillance,
epidemiology, and end results: National Lingitudinal Mortality Study.” Cancer
Causes Control 20(4):417-435.
Conlisk, E.A., E.J. Lengerich, et al. (1999). “Prostate cancer: demographic and
behavioral correlates of stage diagnosis among blacks and whites in North
Carolina.” Urology 53(6):1194-1199.
Cordain, L., S. Boyd Eaton, et al. (2005). “Origins and evolution of the Western diet:
health implications for the 21st century.” Am J Clin Nutr 81(2):341-354.
Crawford, E.D. (2003). “Epidemiology of prostate cancer.” Urology 62(6 suppl 1):3-12.
Cui, X., Y. Jin, et al. (2012). “Suppression of DNA damage in human peripheral blood
lymphocytes by a juice concentrate: a randomized, double-blind, placebo-
controlled trial.” Mol Nutr Food Res 56:666-670.
Daskivich, T.J., K. Chamie, et al. (2011). “Comorbidity and competing risks for mortality
in men with prostate cancer.” Cancer 117(20):4642-4650.
De Marzo, A.M., Y. Nakai, et al. (2007). “Inflammation, atrophy, and prostate
carcinogenesis.” Urol Oncol – Semin Ori 25(5):298-400.
91
De Stefani, E., A.L. Ronco, et al. (2010). “Dietary patterns and risk of advanced prostate
cancer: a principal component analysis in Uruguay.” Cancer Causes Control
21:1009-1016.
Dennis, L.K., R.B. Hayes. (2001). “Alcohol and prostate cancer.” Epidemiol Rev
23(1):110-114.
DeSantis, C., D. Naishadham, et al. (2013). “Cancer Statistics for African Americans,
2013.” Ca Cancer J Clin 2013(63):151-166.
Discacciati, A. and A. Wolk. (2014). “Lifestyle and dietary factors in prostate cancer
prevention.” Prostate Cancer Prevention 202:27-37.
Dixon L.B., Subar A.F., Peters U., et al. (2007). “Adherence to the USDAFood Guide,
DASH Eating Plan, and Mediterranean dietary pattern reduces risk of colorectal
adenoma.” J Nutr 137(11):2443-2450.
Dong, J-T. (2006). “Prevalent mutations in prostate cancer.” J Cell Biochem 97(3):433-
447.
Du, X.L., S. Fang, et al. (2006). “Racial disparity and socioeconomic status in association
with survival on older men with local/regional stage prostate carcinoma.” Cancer
106(6):1276-1285.
Edwards, B.K., A-M. Noone, et al. (2014). Annual report to the nation on the status of
cancer, 1975-2010, featuring prevalence of the comorbidity and impact of
survival among persons with lung, colorectal, breast, or prostate cancer.
Cancer:1290-1314.
Etminan M., B. Takkouche, et al. (2004). “The role of tomato products and lycopene on
the prevention of prostate cancer: a meta-analysis of observational studies.”
Cancer Epidemiol Biomarkers Prev 13(3):340-345.
Fleshner, N., A.R. Zlotta. (2007). “Prostate cancer prevention: past, present, and future.”
Cancer 110(9):1889-1899.
Fowler, J.E., Jr. and S.A. Bigler. (1999). “A prospective study if the serum prostate
specific antigen concentrations and Gleason histologic scores of black and white
men with prostate carcinoma.” Cancer 86(5):836-841.
Freedland, S.J. and W.B. Isaacs. (2005). “Explaining racial differences in prostate cancer
in the United States: sociology or biology?” Prostate 62:243-252.
92
Fung, T.T., K.M. Rexrode, et al. (2009). “Mediterranean diet and incidence of and
mortality from coronary heart disease and stroke in women.” Circulation
119:1093-1100.
Gaines A.R., E.L. Turner, et al. (2014). “The association between race and prostate
cancer risk on intial biopsy in an equal access, multiethnic cohort.” Cancer
Causes Control 15:1029-1035.
Gandaglia, G. P.I. Karakiewicz, et al. (2014). “The effect of age at diagnosis on prostate
cancer mortality: a grade-forgrade and stage-for-stage analysis.” Eur J Surg
Oncol 40(12):1706-1715.
Gann, P.H. (2002). “Risk factors for prostate cancer.” Rev Urol 4(suppl 5):S3-S10.
Garro, A.J., C.S. Lieber. (1990). “Alcohol and cancer.” Annu Rev Pahrmacol Toxicol
30:219-249.
Giovannucci, E., Y. Liu, et al. (2007). “Risk factors for prostate cancer incidence and
progression in the health professionals follow-up study.” Int J Cancer
121(7):1571-1578.
E. Giovannucci, E., E.B. Rimm, et al. (1993). “Smoking and risk of total and fatal
prostate cancer in United States health professionals.” Cancer Epidemiol
Biomarkers Prev 8(4 Pt 1):277-282.
Giugliano, D., A. Ceriello, et al. (2006). “The effects of diet on inflammation: emphasis
on the metabolic syndrome.” J Am Coll Cardiol 48:677-685.
Godley, P.A., A.P. Schenck, et al. (2003). “Racial differences in mortality among
medicare recipients after treatment of localized prostate cancer.” J Natl Cancer
Inst 95(2):1702-1710.
Gonzoles, J.F., N.D. Barnard, et al. (2014). “Applying the precautionary principle to
nutrition and cancer.” J Am College Nutr 33(3):239-246.
Grönberg, H. (2003). Prostate Cancer Epidemiology. Lancet, 361(9360):859-64.
Grönberg, H., J.E. Damber, et al. (1994). “Patient age as a prognostic factor in prostate
cancer.” J Urol 152(3):892-895.
Hague, R., S.K. Van Den Eeden, et al. (2014). “Association of body mass index and
prostate cancer mortality.” Obes Res Clin Pract 8(4):e374-381.
Hankin, J.H., L.P. Zhao, et al. (1992). “Attributable risk of breast, prostate, and lung
cancer in Hawaii due to saturated fat.” Cancer Causes Control 3(1):17-23.
93
Hardin, J., I. Cheng, et al. (2011). “Impact of consumption of vegetable, fruit, grain, and
high glycemic index foods on aggressive prostate cancer risk.” Nutr Cancer
63(6):860-872.
Harlan, L.C., A. Potosky, et al. (2001). “Factors associated with initial therapy for
clinically localized prostate cancer: Prostate Cancer Outcomes Study.” J Natl
Cancer Inst 93(24):1864-1971.
Harmon B.E., Boushey C.J., Shvetsov Y.B., et al. (2015). “Associations of key diet-
quality indexes with mortality in the Multiethnic Cohort: the Dietary Patterns
Methods Project.” Am J Clin Nutr 101(3):587-597.
Hayes, R.B., R.G. Ziegler, et al. (1999). “Dietary factors and risks for prostate cancer
among balcks and whites in the United States.” Cancer Epidemiol Biomarkers
Prev 8(1):25-34.
Hėbert, J.R., T.G. Hurley, et al. (2012). “A diet, physical activity, and stress reduction
intervention in men with rising prostate-specific antigen (PSA) after treatment for
prostate cancer.” Cancer Epidemiol 36(2):e128-e136.
Hickey, K., K.A. Do, et al. (2001). “Smoking and prostate cancer.” Epidemiol Rev
23(1):115-125.
Hoffman, R.M., F.D. Gilliland, et al. (2001). “Racial and ethnic difference in advanced-
stage prostate cancer: the Prostate Cancer Outcomes Study.” J Natl Cancer Inst
93:488-395.
Howlander, N., A-M. Noone, et al. (2014). “SEER Cancer Statistics Review, 1975-
2011.” National Cancer Institute, Bethesda, MD.
http://seer.cancer.gov/csr/1975_2011/. Accessed 23 March, 2015.
Hurst, R., L. Hooper, et al. (2012). “Selenium and prostate cancer: systematic review and
meta-analysis.” Am J Clin Nutr 96(1):111-122.
Inlander, C.B., J.W. Norwood. Understanding prostate disease. New York: Macmillan,
1999.
Itsiopoulos, C., A. Hodge, et al. (2009). “Can the Mediterranean diet prevent prostate
cancer?” Mol Nutr Food Res 53:227-239.
Jackson, M., M. Tulloch-Reid, et al. (2013). “Dietary patterns as predictors of prostate
cancer in Jamaican men.” Nutr Cancer 65(3): 367-374.
94
Jackson, M., S. Walker, et al. (2009). “Are food patterns associated with prostate cancer
in Jamaican men: a preliminary report.” Infectious Agents & Cancer 4(Suppl
1):S5.
Jacobs, D.R., L.M. Steffen. (2003). “Nutrients, foods, and dietary patterns as exposures in
research: a framework for food synergy.” Am J Clin Nutr 78(3):5085-5135.
Jacques, P.F., K.L. Tucker (2001). “Are dietary patterns useful for understanding the role
of diet in chronic disease?” Am J Clin Nutr 73(1):1-2.
Jemal, A., R. Siegel, et al. (2009). “Cancer statistics, 2009.” Ca Cancer J Clin 59(4):225-
249.
John, E.M., M.C. Stern, et al. (2011). “Meat consumption, cooking practices, meat
mutagen, and riak of prostate cancer.” Nutr Cancer 63(4):525-537.
Jones, B.A., W-L. Liu, et al. (2008). “Explaining the race difference in prostate cancer
stage at diagnosis.” Cancer Epidemiol Biomarkers Prev 17(10):2825-2834.
Jnes-McLean E., Hu J., Greene-Finestone L.S., de Groh M. (2015). “A DASH dietary
pattern and the risk of colorectal cancer in Canadian adults.” Health Promot
Chronic Dis Prev Can 35(1):12-20.
Kavanaugh, C.J., P.R. Trumbo, et al. (2007). “The U.S. Food and Drug Administration’s
evidence-based review for qualified health claims: tomatoes, lycopene and
prostate cancer.” J Natl Cancer Inst 99(14):1074-1085.
Kenfield, S.A., N. DuPre, et al. (2014). “Mediterranean Diet and prostate cancer risk and
mortality in the Health Professionals Follow-up Study.” Eur Urol 65:887-894.
Kennedy, E.T., J. Ohls, et al. (1995). “The Healthy Eating Index: Design and
applications.” J Am Diet Assoc 95(10):1103-1108.
Keys, A. Seven Countries: A multivariate analysis of death and coronary heart disease.
Cambridge, MA: Harvard University Press, 1980.
Klabunde, C.N., A.L. Potosky, et al. (1998). “Trends and black/white differences in
treatment for nonmetastatic prostate cancer.” Med Care 36(9):1337-1348.
Krebs-Smith, S. (2014). “Approaches to Dietary Pattern Analysis: Potential to Inform
Guidance.” [Power Point]. Retrived 3 Apr, 2015 from
http://health.gov/dietaryguidelines/2015-
binder/meeting2/docs/workGroupPresentations/DGAC_Patttern_Sue_Krebs_Smit
h_2-27-14.pdf.
95
Kolonel, L.N. (2001). “Fat, meat, and prostate cancer.” Epidemiol Rev 23(1):72-81.
Latif, Z., D.C. McMillan, et al. (2002). “The relationship of circulating insulin-like
growth factor 1, its binding protein-3, prostate specific antigen and C-reactive
protein with disease stage in prostate cancer.” BJU Int 89:396-399.
Lee, I-M., H.D. Sesso, et al. (2001). “A prospective cohort study of physical activity and
body size in relation to prostate cancer risk (United States).” Cancer Causes
Control 12(2):187-193.
Lehrer, S., E.J. Diamond, et al. (2005). “C-reactive protein is significantly associated
with prostate-specific antigen and metastatic disease in prostate cancer.” BJU Int
95:961-962.
Liese, A.D., Krebs-Smith S.M., Suber A.F., et al. (2015). “The Dietary Patterns Methods
Project: synthesis of findings across cohorts and relevance to dietary guidance.” J
NutrI 145(3):393-402.
Lin, P-H., W. Aronson, et al. (2015). “Nutrition, dietary interventions and prostate
cancer: the latest evidence.” BMC Med 13:3.
Lippman, S.M., E.A. Klein, et al. (2009). “Effect of Selenium and Vitamin E on risk of
prostate cacner and other cancers: The Selenium and Vitamin E Cancer
Prevention Trial (SELECT).” JAMA 301(1):39-51.
Liu, Y., F. Hu, et al. (2011). “Does physical activity reduce the risk of prostate cancer? A
systematic review and meta-analysis.” Eur Urol 60(5):1029-1044.
Major, J.M., M. Norman Oliver, et al. (2012). “Socioeconomic status, healthcare density,
and risk of prostate cancer among African American and Caucasian men in a
large prospective study.” Cancer Causes Controls 23(7):1185-1191.
Melchini, A., M.H. Traka, et al. (2013). “Antiproliferative activity of the dietary
isothiocyanate erucin, a bioactive compound from cruciferous vegetables, pn
human prostate cancer cells.” Nutr Cancer 65(1):132-138.
Miller, P.E., M.C. Morey, et al. (2012). Dietary patterns differ between urban and rural
older, long-term survivors of breast, prostate, and colorectal cancer and are
associated with body mass index.” J Acad Nutr Diet 112(6):824-831.e1.
Möller, E., C. Galeone, et al. (2013). “Mediterranean Diet Score and prostate cancer risk
in a Swedish population-based case-control study.” J Nutr Sci 2:e15.
96
Moyer, V.A. on behalf of U.S Preventative Services Task Force. (2012). Screening for
prostate cancer: U.S. Preventative Services Task Force recommendation
statement. Ann Intern Med 157:120-134.
Muller, D.C., G. Severi, et al. (2009). “Dietary patterns and prostate cancer risk.” Cancer
Epidemiol Biomarkers Prev 18(11):3126-3129.
Niclis, C., M. del Pilar Diaz, et al. (2012). “Dietary habits and prostate cancer prevention:
a review of observational studies by focusing on South America.” Nutr Cancer
64(1):22-33.
Nobbs H.M., Yaxley A., Thomas J., et al. (2015) “Do dietary patterns in older age
influence the development of cancer and cardiovascular disease: A longitudinal
study of ageing.” Clin Nutr doi:10.1016/j.clnu.2015.04.003.
Optenberg, S.A., I.M. Thompson, et al. (1995). “Race, treatment, and long-term survival
from prostate cancer in an equal-access medical care delivery system.” JAMA
274(20):1599-1605.
Panagiotakos, D.B., C. Pitsavos, et al. (2006). “Dietary patterns: a Mediterranean diet
score and its relation to clinical and biological markers of cardiovascular disease
risk.” Nutr Metab Cardiovas 16:559-568.
Pelser, C., A.M. Mondul, et al. (2013). “Dietary fat, fatty acids, and risk of prostate
cancer in the NIH-AARP diet and health study.” Cancer Epidemiol Biomarkers
Prev 22(4):697-707.
Pettersson, A., J.L. Kasperzyk, et al. (20120> “Milk and dairy consumption among men
with prostate cancer and risk of metastases and prostate cancer death.” Cancer
Epidemiol Biomarkers Prev 21(3):428-436.
Putt, M., J.A. Long, et al. (2009). “Racial differences in the impact of comorbidities on
survival among elderly men with prostate cancer.” Med Care Res Rev 66(4):409-
435.
Reddy, S., M. Shapiro, et al. (2003). “Prostate cancer in black and white Americans.”
Cancer Metastasis Rev 22(1):83-86.
Rodriguez, C., M.L. McCullough, et al. (2003). “Calcium, dairy products, and risk of
prostate cancer in a prospective cohort of United States men,” Cancer Epidemiol
Biomarkers Prev 12(7):597-603.
Rodriguez, C., A.V. Patel, et a. (2001). “Body mass index, height, and prostate cancer
mortality in two large cohorts of adult men in the United States.” Cancer
Epidemiol Biomarkers Prev 10(4):345-353.
97
Rose, D.P., A.P. Boyar, et al. (1986). “International comparisons of mortality rates for
cancer of the breast, ovary, prostate, and colon, and per capita food consumption.”
Cancer 58(11):2363-2371.
Rota, M., L. Scotti, et al. (2012). “Alcohol consumption and prostate cancer risk: a meta-
analysis of the dose-risk relation.” Eur J Cancer Prev 21(4):350-359.
Rumawas, M.E., J.T. Dwyer, et al. (2009). “The development of the Mediterranean-Style
Dietary Pattern Score and its application to the American Diet in the Framingham
Offspring Cohort.” J Nutr 139:1150-1156.
Sacks, F.M., L.P. Svetkey, et al. (2001). “Effects of blood pressure of reduced dietary
sodium and the Dietary Approaches to Stop Hypertension (DASH) diet.” N Engl J
Med 344(1):3-10.
Schaid, D.J. (2004). “The complex genetic epidemiology of prostate cancer.” Hum Mol
Genet 13(rev. 1):R103-R121.
Schroeder, J.C., J.T. Bensen, et al. (2006). The North Carolina-Louisiana Prostate Cancer
Project (PCaP): Methods and design of a multidisciplinary population-based
cohort study of racial differences in prostate cancer outcomes. The Prostate
66:1162-1176.
Schwartz, G.G. (2009). “Vitamin D and intervention trials in prostate cancer: from theory
to therapy.” Ann Epidemiol 19(2):96-102.
Schwartz, G.G. (2013). “Vitamin D, sunlight, and the epidemiology of prostate cancer.”
Anticancer Agents Med Chem 13(1):45-57.
Schwartz, K.L., H. Crossley-May, et al. (2003). “Race, socioeconomic status and stage at
diagnosis for five common malignancies.” Cancer Causes Control 14:761-766.
Schwingshakl L., Hoffman G. (2015). “Diet quality as assessed by the Healthy Eating
Index, the Alternative Healthy Eating Index, the Dietary Approaches to Stop
Hypertension score, and health outcomes a systematic review and meta-analysis
of cohort studies.” J Acad Nutr Diet 115(5):780-800.
Shavers, V.L., M.L. Brown, et al. (2004). “Race/ethnicity and the receipt of watchful
waiting for the initial management of prostate cancer.” J Gen Intern Med
19(2):146-155.
Siegel, R., J. Ma, et al. (2014). Cancer Statistics, 2014. Ca Cancer J Clin 64(1):9-29.
98
Singh, S.V., S.K. Srivastava, et al. (2005). “Sulforaphane-induced cell death in human
prostate cancer cells is initiated by reactiveoxygen species.” J Biol Chem
280(20):19911-19924.
Song, Y., J.E. Chavarro, et al. (2013). “Whole milk intake is associated with prostate
cancer-specific motality among U.S. male physicians.”J Nutr 143(2):189-196.
Stacewicz-Sapuntzakis, M., G. Borthakur et al. (2008). “Correlations of dietary patterns
with prostate health.” Mol Nutr Food Res 52(1):114-130.
Steenland, K., C. Rodriguez, et al. (2004). “Prostate cancer incidence and survival in
relation to education (United States).” Cancer Causes Controls 15(9):939-945.
Steinmetz, K.A., J.D. Potter, (1996). “Vegetables, fruit, and cencer prevention: a review.”
J Am Diet Assoc 96(10):1027-1039.
Stephenson, J. (2008). “Prostate cancer genes.” JAMA 299(11):1252.
Su, J.L., L. Arab, et al. (2011). Obesity and prostate cancer aggressiveness among
African and Caucasian Americans in a population-based study. Cancer Epidemiol
Biomarkers Prev 20(5):844-853.
Szymanski, K.M., D.C. Wheeler, et al. (2010). “Fish consumption and prostate cancer
risk: a review and meta-analysis.” Am J Clin Nutr doi:10.3945/ajcn.2010.29530.
Tabung, F., S.E. Steck, et al. (2012). “Intake of grains and dietary fiber and prostate
cancer aggressiveness by race.” Prostate Cancer 2012:323296.
Tewari, A., W. Horninger, et al. (2005). “Factors contributing to the racial differences in
prostate cancer mortality.” BJU Int 96(9):1247-52.
Thatai, L.C., M. Banerjee, et al. (2004). “Racial disparity in clinical course and outcome
of metastatic andrgen-independent prostate cancer.” Urology 64(4):738-743.
Torfadottir, J.E., U.A. Valdimarsdottir, et al. (2013). “Consumption of fish products
across the lifespan and prostate cancer risk.” PLoS One 8(4):e59799.
Trautner, K., E.H. Cooper at al. (1980). “An elevation of serum protein profiles in the
long-term surveillance or prostate cancer.” Scand J Urol Nephrol 14:143-149.
Trichopoulou, a. T. Costacou, et al. (2003). “Adherence to a Mediterranean diet and
survival in a Greek Population.” N Engl J Med 348(26):2599-2608.
Trichopoulou, A., A. Kouris-Blazos, et al. (1995). “Diet and overall survival in elderly
people.” BMJ 311:1457-1460.
99
Trichopoulou, A., P. Lagiou, et al. (2000). “Cancer and Mediterranean dietary traditions.”
Cancer Epidemiol Biomarkers Prev 9:869-873.
Tseng, M., R.A. Breslow, et al. (2004). “Dietary patterns and prostate cancer risk in the
National Health and Nutrition Examination Survey Epidemiologucal Follow-up
Study cohort.” Cancer Epidemiol Biomarkers Prev 13:71-77.
Underwood, W., S. De Monner, et al. (2004). “Racial/ethnic disparities in the treatment
of localized/regional prostate cancer.” J Urol 171(4):1504-1507.
U.S. Census Bureau. (2012). “Education.” Statistical Abstract of the United States:
2012:151.
U.S. Census Bureau. (2009). “Income, Expenditures, Poverty, and Wealth.” Statistical
Abstract of the United States: 2012:464.
U.S. Department of Health and Human Services. (2004). “The Health consequences of
smoking. A report of the Surgeon General.” Washington, D.C.: U.S. Department
of Health and Human Services.
Vidal, A.C., and S.J. Freedland. (2014). “Can we eat our way to a lower prostate cancer
risk, and if so, how?” Eur Urol 65:895-896.
Wagenlehner, F.M., J.E. Elkahwaji, et al. (2009). “The role of inflammation and infection
in the pathogenesis of prostate carcinoma.” BJU Int 100(4):733-737.
Ward, E., A. Jemal, et al. (2004). “Cancer disparities by race/ethnicity and
socioeconomic status.” Ca Cancer J Clin 54:78-93.
Walker, M., K.J. Aronson, et al. (2005). Dietary patterns and risk of prostate cancer in
Ontario, Canada. Int J Cancer 116:592-598.
Whittemore, A.S., L.N. Kolonel, et al. (1995). “Prostate cancer in relation to diet,
physical activity, and body size in blacks, whites, and Asians in the United States
and Canada.” J Natl Cancer Inst 87(9):652-661.
Willett, W.C. Nutritional Epidemiology – 3rd
Edition. Oxford: Oxford University Press,
2012.
Willett, W.C. (1997). “Specific fatty acids and risks of breast and prostate cancer: dietary
intake.” Am J Clin Nutr 66(6):1557S-1563S.
Willett, W.C., F. Sacks, et al. (1995). “Mediterranean diet pyramid: a cultural model for
healthy eating.” Am J Clin Nutr 61(6):14025-14065.
100
World Cancer Research Fund/American Institute for Cancer Research. (2007). “Food,
Nutrition, physical activity and the prevention of cancer: a global perspective.”
Washington, D.C.: AIRC.
Wu, K., F.B. Hu, et al. (2006). Dietary patterns and risk of prostate cancer in U.S. men.
Cancer Epidemiol Biomarkers Prev 15(1):167-171.
Zeigler-Johnson, C.M., E. Spangler, et al. (2008). “Genetic susceptibility to prostate
cancer in men of African descent: implications for global disparities in incidence
and outcomes.” Can J Urol 15(1):2872-3882.
Zeliadt, S.B., D.F. Penson. (2003). “Race independently predicts prostate specific antigen
testing frequency afoloowing a prostate carcinoma diagnosis.” Cancer 98(3):496-
503.
Zymanski, K.M., D.C. Wheeler, et al. (2010). “Fish consumption and prostate cancer
risk: a review and meta-analysis.” Am J Clin Nutr 92(5):1223-1233
Related Documents