Dietary Guidelines for Children and Adolescents in Australia incorporating the Infant Feeding Guidelines for Health Workers Endorsed 10 April 2003

Welcome message from author
This document is posted to help you gain knowledge. Please leave a comment to let me know what you think about it! Share it to your friends and learn new things together.
Transcript
i
CONTENTS
Dietary Guidelines for Children and Adolescents in Australia
Dietary Guidelines for Children andAdolescents in Australia
incorporating the
Infant Feeding Guidelines forHealth Workers
Endorsed 10 April 2003
ii Dietary Guidelines for Children and Adolescents in Australia
CONTENTS© Commonwealth of Australia 2003
ISBN Print: 1864961538 Online:1864961473
This work is copyright. Apart from any use as permitted under the Copyright Act 1968,no part may be reproduced by any process without prior written permission from AusInfo.Requests and enquiries concerning reproduction and rights should be addressed to theManager, Legislative Services, AusInfo, GPO Box 1920, Canberra ACT 2601.Email address: [email protected]
The strategic intent of the NHMRC is to provide leadership and work with other relevantorganisations to improve the health of all Australians by:
• fostering and supporting a high quality and internationally recognised research base;• providing evidence based advice;• applying research evidence to health issues thus translating research into better health
practice and outcomes; and• promoting informed debate on health and medical research, health ethics and related
issues.
This document is sold through AusInfo Government Info Bookshops at a price which coversthe cost of printing and distribution only. For publication purchases please contact AusInfoon their toll-free number 132 447.
DisclaimerThis document is a general guide to appropriate practice, to be followed only subject to theclinician’s judgement in each individual case.
The guidelines are designed to provide information to assist decision–making and are based onthe best information available at the date of compilation.
It is planned to review this Guideline in 2008. For further information regarding the status of thisdocument, please refer to the NHMRC web address: http://www.nhmrc.gov.au
Materials including a poster, booklet and brochure for the general public and nutritioneducators are available by contacting the Population Health Publications Officer,Commonwealth Department of Health and Ageing on toll free 1800 020 103 Ext 8654 or atemail: [email protected]
The Australian dietary guidelines and Food for Health information can also be found on theinternet at http://www.nhmrc.gov.au/publications/nhome.htm
Reliable information about food, nutrition and health is also available from:• Nutrition Australia — www.nutritionaustralia.org• Dietitians Association of Australia (DAA) — www.daa.asn.au• Food Standards Australia New Zealand (FSANZ) — www.foodstandards.gov.au who also
produce The official shopper’s guide to food additives and labels: know what you are eatingat a glance (published by Murdoch)
• Local community health centres• State Departments of health• Baby, child and youth health centres• Accredited practising dietitians in private practice (look in the yellow pages)or in hospitals
and community centres• National Heart Foundation of Australia — www.heartfoundation.com.au• Diabetes Australia — www.diabetesaustralia.com.au
iii
CONTENTS
Dietary Guidelines for Children and Adolescents in Australia
C O N T E N T S
Preface vii
The Working Party xi
Assessing the evidence xiii
The consultation process xv
Dietary Guidelines for Children and Adolescents in Australia xvii
BACKGROUND INFORMATION
1 Encourage and support breastfeeding 1Terminology 1Background 1Scientific basis 4Relationship to other guidelines 14Conclusion 14Evidence 14References 15
2 Children and adolescents need sufficient nutritious foodsto grow and develop normally 21Terminology 21Background 22Scientific basis 22Practical aspects of this guideline 30Relationship to other guidelines 37Conclusion 37Evidence 37References 37
3 Enjoy a wide variety of nutritious foods 45Terminology 45Background 45Scientific basis 46Practical aspects of this guideline 51Relationship to other guidelines 61Conclusion 62Evidence 62References 62
iv Dietary Guidelines for Children and Adolescents in Australia
CONTENTS
3.1 Eat plenty of vegetables, legumes and fruits 67Terminology 67Background 68Scientific basis 69Practical aspects of this guideline 73Relationship to other guidelines 75Conclusion 75Evidence 75References 76
3.2 Eat plenty of cereals (including breads, rice, pasta and noodles),preferably wholegrain 81Terminology 81Background 82Scientific basis 83Practical aspects of this guideline 88Relationship to other guidelines 90Conclusion 91Evidence 91References 91
3.3 Include lean meat, fish, poultry and/or alternatives 99Terminology 99Background 100Scientific basis 104Practical aspects of this guideline 114Relationship to other guidelines 115Conclusion 116Evidence 116References 116
3.4 Include milks, yoghurts, cheeses and/or alternatives 123Terminology 123Background 124Scientific basis 126Practical aspects of this guideline 134Relationship to other guidelines 134Conclusion 136Evidence 136References 136
3.5 Choose water as a drink 145Background 145Scientific basis 147Practical aspects of this guideline 148
v
CONTENTS
Dietary Guidelines for Children and Adolescents in Australia
Relationship to other guidelines 155Conclusion 156Evidence 156References 156
3.6 Limit saturated fat and moderate total fat intake 161Terminology 161Background 162Scientific basis 166Practical aspects of this guideline 171Relationship to other guidelines 171Conclusion 172Evidence 172References 172
3.7 Choose foods low in salt 177Terminology 177Background 178Scientific basis 179Practical aspects of this guideline 185Relationship to other guidelines 188Conclusion 189Evidence 189References 190
3.8 Consume only moderate amounts of sugars and foodscontaining added sugars 195Terminology 195Background 196Scientific basis 202Practical aspects of this guideline 210Relationship to other guidelines 211Conclusion 211Evidence 211References 212
4 Care for your child’s food: prepare and store it safely 217Background 217Scientific basis 219Practical aspects of this guideline 222Relationship to other guidelines 230Conclusion 231Evidence 231References 232
vi Dietary Guidelines for Children and Adolescents in Australia
CONTENTS
SPECIAL CONSIDERATIONS
A The foetal origins of disease hypothesis, or Barker hypothesis 237Implications for public health 241Postnatal growth and breastfeeding 242Conclusion 242References 243
B Growth, growth references and obesity cut-off points 245Definitions 245Growth 245Growth references 246Classification of overweight and obesity in children and adolescents 250References 254
C The nutrition of Aboriginal and Torres Strait Islander peoples 257Current health and nutritional status 257Social determinants of Indigenous Australians’ health 258Health aspects of traditional diets and lifestyles 260Contemporary diet 261Contemporary use of traditional foods 265The National Aboriginal and Torres Strait Islander Nutrition Strategyand Action Plan 265Dietary guidelines for Australia’s Indigenous peoples 266References 267
D Social status, nutrition and the cost of healthy eating 273Social status and nutrition 273The cost of healthy eating 276References 278
E Dietary guidelines and the sustainability of food systems 279References 281
INFANT FEEDING GUIDELINES FOR HEALTH WORKERS
Dietary Guidelines for Children and Adolescents in Australia vii
PREFACE
P R E FAC E
The Australian government has been providing nutrition advice for more than 75years. In the past two decades the National Health and Medical Research Councilhas developed and disseminated public health guidelines providing dietaryadvice for Australians. The first edition of the Dietary Guidelines for Childrenand Adolescents in Australia was published in 1995. This current document isthe first revision of those guidelines; it also incorporates the revised InfantFeeding Guidelines for Health Workers, which were originally published in 1996.The Dietary Guidelines for Australian Adults and the Dietary Guidelines forOlder Australians have been published separately. All these guidelines seek topromote the potential benefits of healthy eating, not only to reduce the risk ofdiet-related disease but also to improve the community’s health and wellbeing.
The Australian Food and Nutrition Policy, endorsed in 1992, aims to improve thehealth of Australians and reduce the burden of preventable diet-related death,illness and disability through strategies that support the dietary guidelines. It isestimated that the current economic cost to the nation of the principal diet-related conditions—coronary heart disease, stroke and cancer—is about $6billion a year, so the potential economic benefit of an effective nutrition-basedpreventive strategy is enormous.
The Australian Food and Nutrition Policy is based on the principles of goodnutrition, ecological sustainability and equity. This edition of the DietaryGuidelines for Children and Adolescents is consistent with these principles. Thefood system must be economically viable and the quality and integrity of theenvironment must be maintained. In this context, among the importantconsiderations are conservation of scarce resources such as topsoil, water andfossil energy and problems such as salinity. Other important considerations havebeen noted in Food for Health, the Nutrition Taskforce’s report to the NewZealand Ministry of Health. They include change in consumer demand towardsfoods that are fresher and lower in fat and the recent restructuring of the foodindustry from a protected industry to an open, competitive one. Although thishas led to greater concentration of ownership, pricing strategy and policydevelopment in the food sector, it has also given health policy makers greateraccess to the industry. In addition, globalisation is playing an increasing role inframing the management of the Australian food supply.
This book describes the scientific rationale for the guidelines and is intended forhealth professionals. Other documents will be produced in a format that is moresuitable for children, adolescents and their carers. The guidelines may also beuseful for health professionals wanting to develop diets for children and infantsin other health circumstances: it must always be remembered, however, that
viii
PREFACE
Dietary Guidelines for Children and Adolescents in Australia
these guidelines are for healthy children and adolescents and may not satisfy thespecific nutritional requirements of children and adolescents with particulardiseases or conditions. For the purposes of these Guidelines for Children andAdolescents, infants are defined as children under the age of 12 months, toddlersas children aged 1 to 2 years and preschoolers as children aged 3 to 5 years;young child means a child aged 1 to 5 years, primary school age is 6 to 11 years,and an adolescent is someone aged 12 to 18 years.
The Dietary Guidelines are an essential tool to support broader strategies toimprove nutrition outcomes in Australia as outlined in Eat Well Australia: AnAgenda for Action in Public Health Nutrition which was endorsed in 2001 by theAustralian Health Ministers
Compared with the previous edition, this edition of the guidelines focuses moreon food groups and lifestyle patterns, moving away from specific nutrients. Inparticular, the references to the Australian Guide to Healthy Eating will make iteasier for children, adolescents, carers and nutrition educators to implement theguidelines. The Australian Guide to Healthy Eating is not the only food guide inuse in Australia, and the Working Party recognises the potential for using othersuitable guides to promote diets consistent with these guidelines.
The guidelines apply to the total diet: they should not be used to assess the‘healthiness’ of individual food items, nor should individual guidelines be takenin isolation. Some of the guidelines detail the relationships between differentfood groups as part of the total diet; others deal with aspects of nutrition wheremore care is needed and further aspects of nutrition and a healthy lifestyle
Two of the guidelines relate to the quantity and quality of the food needed bychildren and adolescents—getting the right types of foods in the appropriateamounts to grow and to meet the body’s nutrient needs. The ‘variety’ guidelinecreates a positive setting for nutrition and reflects the fact that good, nutritiousfood is one of the great pleasures of life. The sections of this guideline detail therelationships between different food groups as part of the total diet. Given themajor epidemic of obesity we are currently experiencing in Australia, especiallyamong children, the other of these two guidelines deals with appropriateamounts of food for growth whilst also encouraging children and adolescents tobe active. Another of the guidelines stresses the need to be vigilant in terms offood safety and, given the increasing awareness of the importance of earlynutrition, there is a guideline encouraging everyone to support and promotebreastfeeding.
The guidelines are not ranked in order of importance; rather, they form aconsistent and complete package when considered together. Detailed informationabout requirements for specific nutrients in the Australian diet is provided in theNHMRC’s Recommended Dietary Intakes for Use in Australia. The recommendeddietary intakes and the dietary guidelines complement each other in providingcomprehensive nutrition advice for the Australian community.
The revision process involved extensive consultation with the Australiancommunity, the food industry and experts. The guidelines are based on the best
ix
PREFACE
Dietary Guidelines for Children and Adolescents in Australia
evidence available, although the Working Party notes that in some cases theevidence for each guideline statement is not complete. In these instances,guidance is provided with the community’s safety and health as the primaryconcern. The guidelines are a distillation of current knowledge about therelationship between diet, growth and development, and disease; the nutrientsavailable in the Australian food supply; and the contribution diet can make tooptimising quality of life and reducing the levels of morbidity and mortalityamong Australians. Their implementation will result in significant health gains forthe community.
Each guideline is supported by background information prepared by members ofthe Working Party, with some additional assistance, as detailed in the nextsection. Dr Katrine Baghurst, from CSIRO Health Sciences and Nutrition, andProfessor Colin Binns, from the School of Public Health at Curtin University ofTechnology, chaired the Working Party.
Katrine BaghurstColin Binns
September 2002
xi
PREFACE
T H E W O R K I N G P A RT Y
The Working Party developed the guidelines in accordance with National Healthand Medical Research Council procedures and in keeping with the followingterms of reference established by the NHMRC.
T E R M S O F R E F E R E N C E
• Undertake a review of the Dietary Guidelines for Australians … and theDietary Guidelines for Children and Adolescents … and other relatedNHMRC dietary guidelines as identified.
• Undertake broad consultation to develop a suite of resources for both setsof guidelines including:
– comprehensive scientific background papers explaining the rationalefor each guideline
– appropriate consumer resources.
• Produce a Dissemination and Evaluation Plan for both sets of guidelines.
• Report to the Health Advisory Committee.
M E M B E R S O F T H E W O R K I N G P A RT Y
Dr Katrine Baghurst (Co-chair)CSIRO Health Sciences and Nutrition
Prof. Colin Binns (Co-chair)School of Public Health, Curtin University of Technology
Prof. A Stewart TruswellHuman Nutrition Unit, University of Sydney
Dr Amanda LeePublic Health Services, Queensland Department of Health
Dr Peter WilliamsSmart Foods Centre, School of Nutrition and Dietetics, University of Wollongong
Dr Ivor DreostiCSIRO Health Sciences and Nutrition
Assoc. Prof. Malcolm RileyNutrition & Dietetics Unit, Monash University
Dietary Guidelines for Children and Adolescents in Australia
xii
WORKING PARTY
Dietary Guidelines for Children and Adolescents in Australia
Ms Isobel BrownGovernment Relations Australia Ltd
Dr Merelie HallRoyal Australian College of General Practitioners
Dr Geoff DavidsonGastroenterology Unit, Women’s and Children’s Hospital, Adelaide
Ms Pat CrottyConsumer representative
Ms Sue JeffresonFood Standards Australia New Zealand
Secretariat
Ms Karina Desarmia, Ms Lorraine O’Connor, Ms Tess Hill and Ms Linda RobertsonNational Health and Medical Research Council
Ms Jacinta Dugbaza, Ms Leticia White, Ms Michelle CoadCommonwealth Department of Health and Ageing
O T H E R C O N T R I B U TO R S
A number of the chapters were co-authored by experts, and the Working Partythanks them for their contribution.
Dr Trevor BeardMenzies Centre for Population Health Research, University of Tasmania
Dr Tim GillInternational Taskforce on Obesity, Human Nutrition Unit, University of Sydney
Ms Kirsti McVay, Ms Rochelle Finlay and Ms Patricia BlenmanFood Standards Australian New Zealand
Dr Mi Kyung LeeSchool of Public Health, Curtin University of Technology
Assoc. Prof. David ForbesDepartment of Child Health, University of Western Australia
The Working Party expresses particular thanks to Ms Dympna Leonard (TropicalPublic Health Unit, Queensland Health, Cairns) for her contribution to thesection on the nutrition of Aboriginal and Torres Strait Islander peoples.
Ms Leanne Lester (School of Public Health, Curtin University of Technology), andMs Sally Record (CSIRO Health Sciences and Nutrition) helped with statisticalanalysis of the results of the 1995 National Nutrition Survey.
xiii
WORKING PARTY
Dietary Guidelines for Children and Adolescents in Australia
A S S E S S I N G T H E E V I D E N C E
The National Health and Medical Research Council has released a guide calledHow to Use the Evidence Assessment and Application of Scientific Evidence. Thisguide relates, however, to evidence assessment in connection with clinicalpractice. In many cases evidence-based guidelines for clinical practice deal withevidence associated with a specific disease and a specific therapeutic agent.Similar criteria are not easily used for evidence assessment related to food andthe maintenance of general community health and wellbeing, which is theprimary focus of dietary guidelines.
A number of initiatives are under way around the world to try to develop anevidence-based approach to nutrition and health, but this has generally been inresponse to the need for ‘proof’ in relation to health claims for food components.Food Standards Australia New Zealand (formerly the Australia New Zealand FoodAuthority) has developed a set of proposed levels of evidence for food or healthclaims that is similar to, but somewhat broader in scope than, the NHMRCapproach for clinical guidelines. Nevertheless, the FSANZ set is still primarilyintended for assessing evidence of the efficacy of individual nutrients or foodcomponents in relation to a specific health outcome.
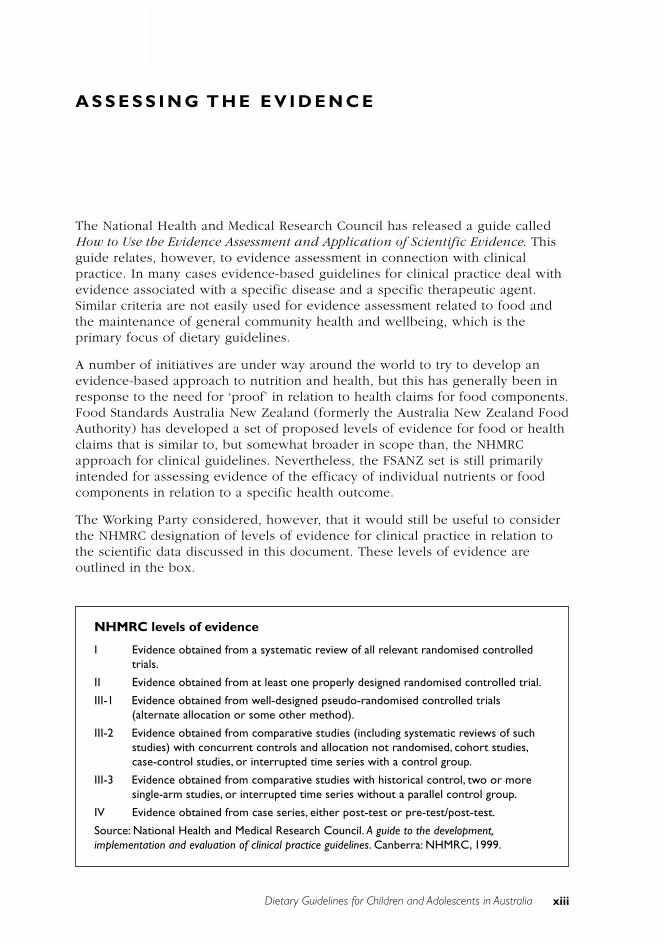
The Working Party considered, however, that it would still be useful to considerthe NHMRC designation of levels of evidence for clinical practice in relation tothe scientific data discussed in this document. These levels of evidence areoutlined in the box.
NHMRC levels of evidence
I Evidence obtained from a systematic review of all relevant randomised controlledtrials.
II Evidence obtained from at least one properly designed randomised controlled trial.
III-1 Evidence obtained from well-designed pseudo-randomised controlled trials(alternate allocation or some other method).
III-2 Evidence obtained from comparative studies (including systematic reviews of suchstudies) with concurrent controls and allocation not randomised, cohort studies,case-control studies, or interrupted time series with a control group.
III-3 Evidence obtained from comparative studies with historical control, two or moresingle-arm studies, or interrupted time series without a parallel control group.
IV Evidence obtained from case series, either post-test or pre-test/post-test.
Source: National Health and Medical Research Council. A guide to the development,implementation and evaluation of clinical practice guidelines. Canberra: NHMRC, 1999.
xiv
ASSESSING THE EVIDENCE
Dietary Guidelines for Children and Adolescents in Australia
Six levels of evidence are designated by the NHMRC. Level I is based on asystematic review of all relevant randomised controlled trials and Level II isbased on evidence obtained from at least one properly designed randomisedcontrolled trial. There are very few Level I and Level II food-based nutritiontrials, although some nutrient-supplement trials fall into these categories. Mostfood–health studies fall into Level III, the level of evidence that includes studydesigns such as cohort studies, case-control studies, and comparative ecologicalstudies with historical controls.
Because of the nature of the dietary guidelines, the background papers weredeveloped as a result of a process of comprehensive, rather than systematic,reviewing of the literature. At the conclusion of each guideline, there is asummary of the NHMRC levels of evidence for the literature cited.
The NHMRC notes, ‘A decision should be made about what is feasible andappropriate in a given situation and the extent to which reasonable standardshave been met by the available body of evidence’.
The evidence base for the background papers was developed using a variety ofdata bases and search terms. The literature was assessed using data bases andabstracting systems including the Cochrane Data Base for Randomised ControlTrials; Medline, HealthStar, CINAHL using ‘systematic review’ filter, PubMed,Embase, Food & Technology Abstracts, Emerald, BioSis, Australasian MedicalIndex, Science Direct, Current Contents and searches of citations found inidentified papers. Terms used in searches included food groupings such as fruits,vegetables, nuts & seeds, legumes, cereals, meat, poultry, fish, dairy, milk,yoghurt, cheeses, soy, water, alcohol, breastmilk (and breast feeding) anddietary/food intake patterns as well as nutrients such as fats (total and types),carbohydrates sugars, starches, protein, iron, zinc, B12, calcium and salt as wellas physical activity. These were investigated where relevant in relation to healthoutcomes such as overweight, obesity, growth, heart disease, cancers of varioussorts, diabetes, bone density and osteoporosis, cognition and ageing. Whilstsearches concentrated on human studies and those available in the Englishlanguage, findings from some animal studies were included to provide evidenceon possible mechanisms. The reviews were completed in January 2002 but somekey papers published since then have been included.
xv
ASSESSING THE EVIDENCE
Dietary Guidelines for Children and Adolescents in Australia
T H E C O N S U LTAT I O N P R O C E S S
Development of the Dietary Guidelines for Children and Adolescents,incorporating the Infant Feeding Guidelines for Health Workers, involvedconsultation with the Australian community and with experts working in thefields of public health and nutrition. Preliminary consultation took place fromDecember 2000 until May 2001 and involved the following:
• analysis of 104 completed and returned questionnaires dealing with thecontent and use of the first edition of the dietary guidelines
• establishment of an interactive website providing information about thereview of the guidelines
• several meetings with stakeholders.
The public consultation process took place between July and August 2001,allowing about six weeks for consideration of the draft guidelines andpreparation and lodgment of submissions. Notification was published in theCommonwealth of Australia Gazette and on the NHMRC website. Copies of draftdocuments and supporting information were available free of charge from theOffice of the NHMRC and the website. In addition, notices were placed in otherpublications and with media such as newspapers and radio and circulated tobodies expected to be interested.
The Dietary Guidelines for Children and Adolescents in Australia, incorporatingthe Infant Feeding Guidelines for Health Workers, were jointly submitted forconsultation with the Dietary Guidelines for Australian Adults. Ninety-threesubmissions were received. The Working Party met in September 2001 toconsider the submissions; initial revisions were made by the end of December2001 and were then reconsidered by the Working Party.
Additional specialist comment was obtained from Dr Peter Hartman (Universityof Western Australia), Dr Jane Scott (University of Glasgow), Dr Karen Cashell(University of Canberra), Ms Anne Croker (Australian Breastfeeding Association—formerly the Nursing Mothers Association of Australia), Ms Judy Seal (StrategicInter-Governmental Nutrition Alliance and Tasmania Health), Dr Wendy Oddy(NHMRC fellow, Curtin University of Technology) and Dr Gulnara Semonova(Director, Australian Breastfeeding Association Lactation Resource Centre).
The document was then technically edited by Ms Chris Pirie.
xvi
ASSESSING THE EVIDENCE
Dietary Guidelines for Children and Adolescents in Australia
xvii
ASSESSING THE EVIDENCE
Dietary Guidelines for Children and Adolescents in Australia
D I E TA RY G U I D E L I N E S F O R C H I L D R E N A N DA D O L E S C E N T S I N A U S T R A L I A
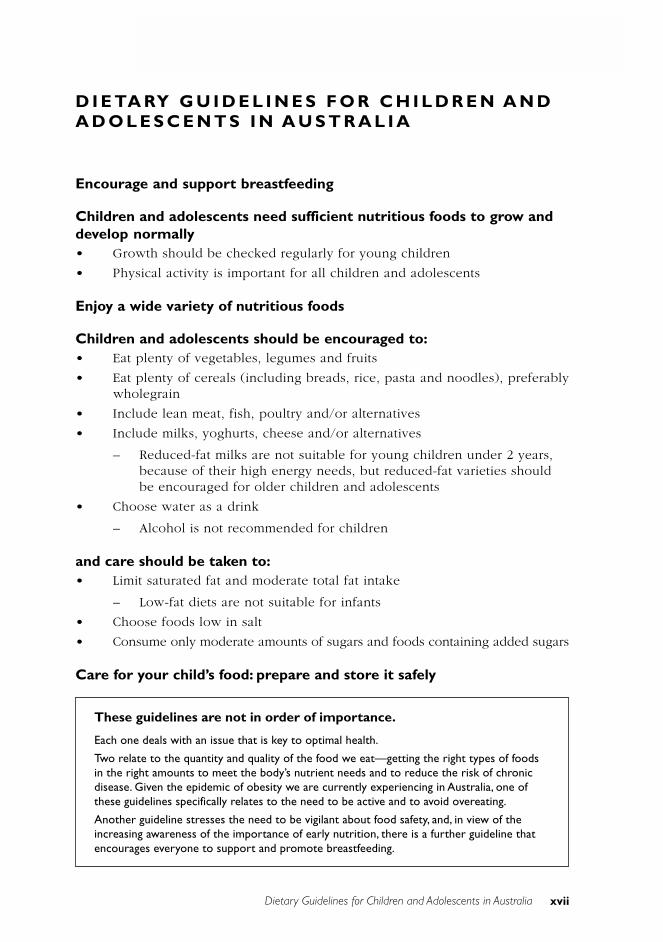
Encourage and support breastfeeding
Children and adolescents need sufficient nutritious foods to grow anddevelop normally• Growth should be checked regularly for young children
• Physical activity is important for all children and adolescents
Enjoy a wide variety of nutritious foods
Children and adolescents should be encouraged to:• Eat plenty of vegetables, legumes and fruits
• Eat plenty of cereals (including breads, rice, pasta and noodles), preferablywholegrain
• Include lean meat, fish, poultry and/or alternatives
• Include milks, yoghurts, cheese and/or alternatives
– Reduced-fat milks are not suitable for young children under 2 years,because of their high energy needs, but reduced-fat varieties shouldbe encouraged for older children and adolescents
• Choose water as a drink
– Alcohol is not recommended for children
and care should be taken to:• Limit saturated fat and moderate total fat intake
– Low-fat diets are not suitable for infants
• Choose foods low in salt
• Consume only moderate amounts of sugars and foods containing added sugars
Care for your child’s food: prepare and store it safely
These guidelines are not in order of importance.
Each one deals with an issue that is key to optimal health.
Two relate to the quantity and quality of the food we eat—getting the right types of foodsin the right amounts to meet the body’s nutrient needs and to reduce the risk of chronicdisease. Given the epidemic of obesity we are currently experiencing in Australia, one ofthese guidelines specifically relates to the need to be active and to avoid overeating.
Another guideline stresses the need to be vigilant about food safety, and, in view of theincreasing awareness of the importance of early nutrition, there is a further guideline thatencourages everyone to support and promote breastfeeding.

xix
ASSESSING THE EVIDENCE
Dietary Guidelines for Children and Adolescents in Australia
Background information
1Dietary Guidelines for Children and Adolescents in Australia
1. ENCOURAGE AND SUPPORT BREASTFEEDING
1 E N C O U R AG E A N D S U P P O RTB R E A S T F E E D I N G
C o l i n B i n n s
T E R M I N O L O G Y
Exclusive breastfeeding
Exclusive breastfeeding means that an infant is receiving only breastmilk, whichincludes expressed breastmilk and milk from a wet nurse. The infant might alsoreceive medications and vitamins or minerals, as required.
Complementary food
Complementary food means any food—be it manufactured or locally prepared—that is suitable as a complement to breastmilk or infant formula when eitherbecomes insufficient to satisfy an infant’s nutritional requirements. Such food isalso commonly called weaning food or breastmilk supplement.1
Research methodology and data collection
A variety of methods are used to study and record breastfeeding rates. Reportedstudies use different sampling methods and may rely on mothers’ memory ofpast events. Studies that use frequent interviews of a representative cohort anduse standard definitions are more accurate.2
B A C K G R O U N D
Breastfeeding is the normal and most appropriate method for feeding infants andis closely related to immediate and long-term health outcomes. Exclusivebreastfeeding to the age of six months gives the best nutritional start to infantsand is now recommended by a number of authorities.3–6 The World HealthOrganization reviewed breastfeeding duration and identified more than 3000references <www.who.int/inf-pr-2001/en/note2001-07.html>. The WHO ExpertConsultation then recommended exclusive breastfeeding for six months, thenintroduction of complementary foods and continued breastfeeding thereafter. It isrecommended that breastfeeding continue until 12 months of age and thereafteras long as mutually desired.5 In many societies breastfeeding continues wellbeyond the age of 12 months, with benefit to both infant and mother.7,8
If for any reason breastmilk is discontinued before 12 months of age, acommercial infant formula should be used—instead of cow’s milk—as the mainsource of milk. Breastmilk from a healthy, well-nourished mother is adequate as
2 Dietary Guidelines for Children and Adolescents in Australia
1. ENCOURAGE AND SUPPORT BREASTFEEDING
the sole source of nutrients for full-term infants from birth until about six monthsof life. Low-birthweight infants should have their nutritional needs assessed by apaediatrician.
Apart from their nutritional suitability, colostrum and mature human milk arehygienic and provide immunoglobulins and other anti-infective agents, whichplay a major role in protecting infants against infection and disease. Breastmilkalso contains a number of unique growth factors9 and is a convenient,inexpensive food source posing no environmental cost. (See the Infant FeedingGuidelines for Health Workers, which are incorporated in the Dietary Guidelinesfor Children and Adolescents in Australia, for a more detailed discussion ofbreastfeeding.)
Current practices
Although the majority (80–90 per cent) of women in Australia commencebreastfeeding, just under a third of them have introduced other foods or havestopped breastfeeding by three months.8 There is also evidence of considerablevariation between socio-economic groups in terms of both the acceptance andthe maintenance of breastfeeding in the Australian community: women in highersocio-economic groups are more likely to breastfeed.10,11 Support andencouragement from family members, friends and the whole community arerequired if breastfeeding rates and the duration of breastfeeding are to bemaximised.
From a public health viewpoint, there is considerable room for improvement inboth the rates and the duration of breastfeeding in Australia; such improvementsoffer benefits for maternal, infant and child health. An initiation rate in excess of90 per cent, and 80 per cent of mothers breastfeeding at six months, areachievable goals in Australia. Of the developed countries, Norway consistentlyreports the highest breastfeeding rates, ones that Australia should strive toachieve:
• Ninety-two per cent of mothers are breastfeeding their child when it isthree months of age.
• Eighty per cent are breastfeeding their child at six months.
• Forty per cent are still breastfeeding their child at 12 months.12
The advantages of breastfeeding continue beyond the six-month period, andAustralians other than mothers can play an important part in makingbreastfeeding an easy and viable option. Encouragement and support—from acombination of hospitals and health centres, families, friends, social groups andplaces of work—will ensure that women can breastfeed successfully.
Breastfeeding is included in these Dietary Guidelines for Children andAdolescents in acknowledgment of the nutritional, health, social and economicbenefits it provides for the Australian community and of the need for family andcommunity support. Breastfeeding promotion should be combined with otherhealth-promotion programs.13
3Dietary Guidelines for Children and Adolescents in Australia
1. ENCOURAGE AND SUPPORT BREASTFEEDING
Historically, breastfeeding or the use of a wet nurse was the only way to feed aninfant. Rickets, scurvy and hypernatraemia were associated with early artificialfeeding: knowledge of infant requirements was limited before the developmentof modern infant formula. In reviews of infant feeding in Australia, Hitchcockand Lund-Adams and Heywood14 describe the decline in breastfeeding rates inAustralia and other developed countries that occurred during the 20th century.
Breastfeeding reached a low point in Australia in the 1960s; records from Victoriashow that only 50–60 per cent of mothers were breastfeeding on discharge fromhospital and only 21 per cent after three months.16 In the early 1970sbreastfeeding rates started to rise again in Australia and comparable overseascountries, beginning in the higher socio-economic groups. By 1983 both theprevalence and the duration of breastfeeding in Australia were among thehighest in the western world, with 85 per cent at discharge and 54–55 per centthree months later.17 Breastfeeding has remained around this level for the pasttwo decades. In 1984–85 a joint survey in Western Australia and Tasmaniaindicated a continued trend to increasing breastfeeding rates and duration.During the preceding five years, prevalence rates at hospital discharge rose from82 to 86 per cent in Western Australia and from 72 to 81 per cent in Tasmania. Atsix months after discharge 45 per cent of mothers in both states were stillbreastfeeding.18
In 1992–93 in Western Australia and in 1995–96 in Queensland, Scott et al.11
conducted a survey that found a continuing trend to increased breastfeedingrates and duration in those states. In the preceding years the hospitals had abreastfeeding discharge rate of 82 per cent, and at six months 46 per cent ofmothers were still breastfeeding. Women born in Australia or New Zealand werealmost twice as likely to be breastfeeding at discharge compared with womenborn in other countries.
Donath and Amir10 analysed the data from the 1995 National Nutrition Surveyand found that breastfeeding rates were 81.8 per cent on discharge from hospitaland 57.1 per cent fully breastfed at three months. At six months, it is estimatedthat 18.6 per cent of babies are fully breastfed and 46.2 per cent fully or partiallybreastfed. At one year of age, 21.2 per cent of infants are receiving somebreastmilk. Thus, in Australia at present fewer than 20 per cent are achieving thegoal of being exclusively breastfed to age six months.
Australia has a long history of promoting and supporting breastfeeding in itspublic health policy. The importance of breastfeeding led to its inclusion in theDietary Guidelines for Australians endorsed by National Health and MedicalResearch Council in June 1982. In 1981 Australia became a signatory to the WHOInternational Code of Marketing of Breast-milk Substitutes, the stated aim ofwhich was:
… to contribute to the provision of safe and adequate nutrition for infants,by the protection and promotion of breastfeeding and by ensuring theproper use of breastmilk substitutes, when these are necessary, on thebasis of adequate information and through appropriate marketing anddistribution.14
4 Dietary Guidelines for Children and Adolescents in Australia
1. ENCOURAGE AND SUPPORT BREASTFEEDING
The Infant Feeding Guidelines for Health Workers provide more information onthe WHO Code and its implications for health workers. In 1987 the NutritionTaskforce of the Better Health Commission set targets for the year 2000 ofincreasing the prevalence of breastfeeding at discharge from hospital to 95 percent and increasing the proportion still breastfeeding at three months to 80 percent.19 The rationale behind the targets was to continue the promotion ofbreastfeeding, so that rates in at-risk groups would increase, the average periodof breastfeeding would be lengthened, and overall levels of breastfeeding wouldbe maintained. With current knowledge of the benefits of breastfeeding and thehealth risks for infants not receiving breastmilk, extending the goal to 80 percent breastfeeding at six months would be appropriate.
S C I E N T I F I C B A S I S
Breastfeeding physiology
Milk production and secretion are under endocrine and autocrine control.20 Whenthe infant suckles at the breast, mechano-receptors are stimulated, resulting inthe release of oxytocin and prolactin into the blood, from the posterior andanterior pituitary respectively. Oxytocin stimulates the contraction of cells andsecretion of milk from the alveolus; prolactin is responsible for milk productionin the alveolus. The commonly termed let-down reflex can also be stimulated byseeing the infant or hearing its cries; it can be inhibited by stress such as pain oranxiety.21 Close mother–child contact immediately after birth helps to establishlactation, and frequent suckling or feeding on demand helps to maintain it.22,23
Milk synthesis is related to the rate at which the breast is emptied.20
A review of early contact practices found, ‘Mothers should have contact withtheir babies as soon after birth and for as long as they wish. Interventions aimedat either delaying or speeding up the time of the first feed should be avoided’.24
Hospital practices at the time of birth can be the first line of support for a newmother: difficulties encountered can be quickly resolved by staff withappropriate experience, and hospitals can encourage ‘rooming-in’ to facilitatefrequent mother–child contact.
Breastmilk is uniquely suited to the needs of infants throughout the duration oflactation and provides all the nutrients required for at least the first six months oflife. The composition of breastmilk is compromised only in mothers with severemalnutrition. Breastmilk is a living tissue that cannot be duplicated by any othermeans. It is very important for pre-term infants.
Colostrum, the secretion produced in the first few days after giving birth,provides all the nutrients, including water, required by the neonate. Incomposition, it differs from both transitional milk and mature milk, containinghigher levels of protein, vitamin A and vitamin B
12 and less fat. It also contains
lactoferrin, immunoglobulin A, enzymes, maternal antibodies, living cells—leukocytes, neutrophils and macrophages—and non-pathogenic bacteria, which
5Dietary Guidelines for Children and Adolescents in Australia
1. ENCOURAGE AND SUPPORT BREASTFEEDING
act in the gut of the newborn to limit the growth of pathogenic bacteria andviruses and to protect against illness.22,25
The composition of this first secretion after birth gradually changes as lactation isestablished and production of milk begins in the breast tissue. By seven tofourteen days after birth, lactation should be established and the transition fromcolostrum to mature milk should be under way. The nutrient composition ofmature expressed human milk shows variation in and between individuals—depending on maternal diet and the stage of lactation—although mean rangesare remarkably consistent for the species. The energy content is based on the fat,protein and carbohydrate levels and varies between 270 and 315 kilojoules (65–75 kcal) per 100 millilitres, largely as a result of variation in the fat content. Fattypically increases three- to four-fold during a single feed and also shows diurnalvariation. It provides much of the energy and omega-3 and omega-6 long-chainpolyunsaturated fatty acids; it also carries the fat-soluble vitamins A, D, E and K,as well as prostaglandins.22,25 This fat is typically better absorbed by the infant’sgastrointestinal tract than the fat in cow’s milk, and the lipase present increasesthe efficiency of absorption. Mature milk continues to provide immune factorsand enzymes to the infant. (For details of milk composition see the InfantFeeding Guidelines for Health Workers.)
Breastmilk also provides all the major minerals and trace elements known to beessential for healthy full-term infants. Although the levels of some micro-nutrients appear to be low in comparison with other milks, the highbioavailability of these components in human milk ensures that no deficienciesoccur. Infants’ actual nutrient requirements are not precisely known, but thenutrients in human milk have obviously been adequate for infants for thousandsof years. As a result, the composition of infant formula26 and the recommendeddietary intakes for groups of infants in Australia are based on the nutrientcomposition of human milk.27 No infant formula can exactly mimic breastmilk,though. Breastmilk is constantly changing—throughout lactation and throughoutthe feed. In addition, constituents of breastmilk are still being discovered, andmany of them cannot be replicated.28
The health benefits of breastfeeding
There are many benefits to be gained from breastfeeding—for the infant, themother and the community. These benefits are summarised in Box 1.1 (see alsothe Infant Feeding Guidelines for Health Workers for an expanded version).Costs to the community of not breastfeedung are also discussed later in thissection. Increasingly, there is interest in the long-term effects of perinatalnutrition, commonly referred to as the foetal origins of disease, or Barkerhypothesis. Inadequate or inappropriate foetal and early infant nutrition has beenlinked with subsequent chronic disease in adulthood.29,30
6 Dietary Guidelines for Children and Adolescents in Australia
1. ENCOURAGE AND SUPPORT BREASTFEEDING
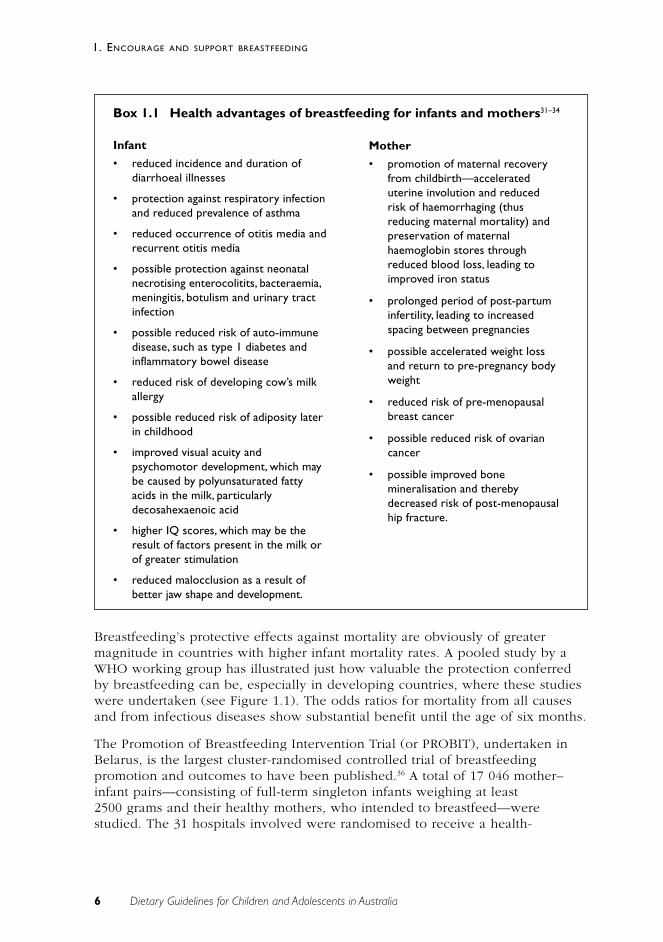
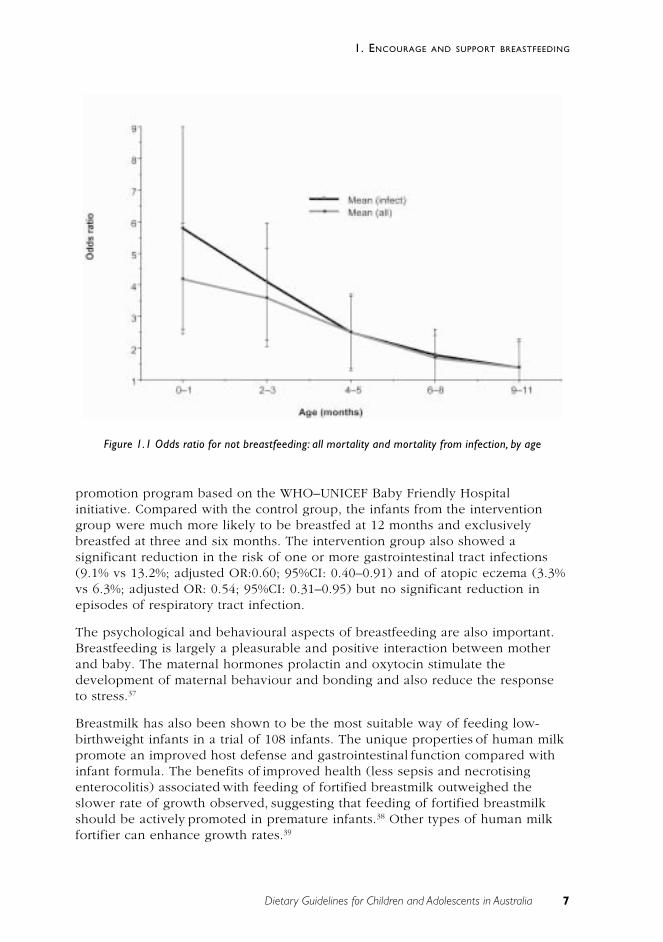
Breastfeeding’s protective effects against mortality are obviously of greatermagnitude in countries with higher infant mortality rates. A pooled study by aWHO working group has illustrated just how valuable the protection conferredby breastfeeding can be, especially in developing countries, where these studieswere undertaken (see Figure 1.1). The odds ratios for mortality from all causesand from infectious diseases show substantial benefit until the age of six months.
The Promotion of Breastfeeding Intervention Trial (or PROBIT), undertaken inBelarus, is the largest cluster-randomised controlled trial of breastfeedingpromotion and outcomes to have been published.36 A total of 17 046 mother–infant pairs—consisting of full-term singleton infants weighing at least2500 grams and their healthy mothers, who intended to breastfeed—werestudied. The 31 hospitals involved were randomised to receive a health-
Mother
• promotion of maternal recoveryfrom childbirth—accelerateduterine involution and reducedrisk of haemorrhaging (thusreducing maternal mortality) andpreservation of maternalhaemoglobin stores throughreduced blood loss, leading toimproved iron status
• prolonged period of post-partuminfertility, leading to increasedspacing between pregnancies
• possible accelerated weight lossand return to pre-pregnancy bodyweight
• reduced risk of pre-menopausalbreast cancer
• possible reduced risk of ovariancancer
• possible improved bonemineralisation and therebydecreased risk of post-menopausalhip fracture.
Box 1.1 Health advantages of breastfeeding for infants and mothers31–34
Infant
• reduced incidence and duration ofdiarrhoeal illnesses
• protection against respiratory infectionand reduced prevalence of asthma
• reduced occurrence of otitis media andrecurrent otitis media
• possible protection against neonatalnecrotising enterocolitits, bacteraemia,meningitis, botulism and urinary tractinfection
• possible reduced risk of auto-immunedisease, such as type 1 diabetes andinflammatory bowel disease
• reduced risk of developing cow’s milkallergy
• possible reduced risk of adiposity laterin childhood
• improved visual acuity andpsychomotor development, which maybe caused by polyunsaturated fattyacids in the milk, particularlydecosahexaenoic acid
• higher IQ scores, which may be theresult of factors present in the milk orof greater stimulation
• reduced malocclusion as a result ofbetter jaw shape and development.
7Dietary Guidelines for Children and Adolescents in Australia
1. ENCOURAGE AND SUPPORT BREASTFEEDING
promotion program based on the WHO–UNICEF Baby Friendly Hospitalinitiative. Compared with the control group, the infants from the interventiongroup were much more likely to be breastfed at 12 months and exclusivelybreastfed at three and six months. The intervention group also showed asignificant reduction in the risk of one or more gastrointestinal tract infections(9.1% vs 13.2%; adjusted OR:0.60; 95%CI: 0.40–0.91) and of atopic eczema (3.3%vs 6.3%; adjusted OR: 0.54; 95%CI: 0.31–0.95) but no significant reduction inepisodes of respiratory tract infection.
The psychological and behavioural aspects of breastfeeding are also important.Breastfeeding is largely a pleasurable and positive interaction between motherand baby. The maternal hormones prolactin and oxytocin stimulate thedevelopment of maternal behaviour and bonding and also reduce the responseto stress.37
Breastmilk has also been shown to be the most suitable way of feeding low-birthweight infants in a trial of 108 infants. The unique properties of human milkpromote an improved host defense and gastrointestinal function compared withinfant formula. The benefits of improved health (less sepsis and necrotisingenterocolitis) associated with feeding of fortified breastmilk outweighed theslower rate of growth observed, suggesting that feeding of fortified breastmilkshould be actively promoted in premature infants.38 Other types of human milkfortifier can enhance growth rates.39
Figure 1.1 Odds ratio for not breastfeeding: all mortality and mortality from infection, by age
8 Dietary Guidelines for Children and Adolescents in Australia
1. ENCOURAGE AND SUPPORT BREASTFEEDING
Pre-lacteal feeds are commonly given in some cultures. Best practice in Australiais to place the infant at the breast as soon as practicable after delivery and tooffer it colostrum. Although respect is always due to other cultures, an infant hasno need for any other solid or liquid for around six months.
Factors affecting the initiation and duration of breastfeeding
An extensive review of the literature has documented the demographic, socialand economic factors associated with breastfeeding.40 There is a higherprevalence and a longer duration of breastfeeding among mothers from highersocio-economic groups who are better educated, are older, and have previouslybreastfed.10,41–45 In the Australian studies, age was not found to increasebreastfeeding in the rural sample.46
In a longitudinal study, Scott, Aitken et al.11 confirmed the known demographicfactors (as just mentioned) that influence breastfeeding rates and duration.Among other factors that were found to have influenced a mother’s decision tobreastfeed and the duration of breastfeeding were the perceptions of partnersand other family members, the mother’s decision to breastfeed prior topregnancy, and the mother’s age and country of birth. Scott, Gowans et al.47 alsofound that a mother who had more than one child, intended to return to work orstudy within six months, or had an infant in a special care nursery was less likelyto breastfeed. In Australia, boys are breastfed for a shorter time than theirsisters.48 Further research is needed to understand the reasons for this.
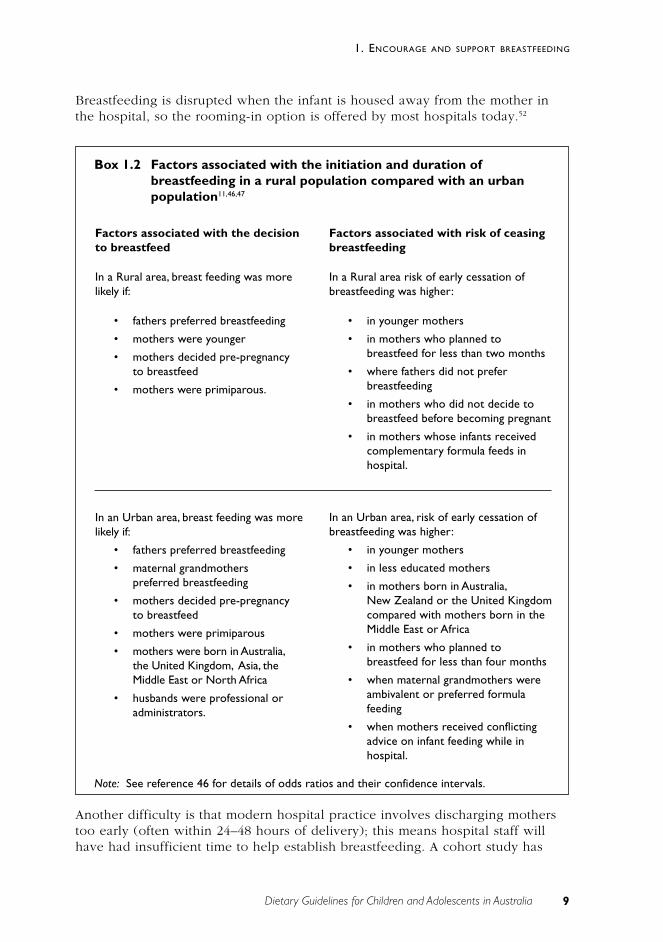
Box 1.2 summarises the factors involved in the initiation and duration ofbreastfeeding in the two Australian studies and that by Landers et al.46, which allused the same methodology (cohort studies with frequent interviews). Thestudies demonstrate the importance of family support, particularly from thefather, and of early parental education about the benefits of breastfeeding.McIntyre et al.49 analysed social support and found that social support forbreastfeeding—as provided by fathers, grandmothers and the generalcommunity—in a low socio-economic area is not strong, particularly in relationto breastfeeding in public, combining breastfeeding and work, and appropriatelymanaging breastfeeding.
Most women experience a number of other difficulties while breastfeeding (seethe Infant Feeding Guidelines for Health Workers). If appropriate advice andsupport are not given, a mother may prematurely terminate breastfeeding. Instudies in Australia and other developed countries, the main reason fortermination cited by women is a perceived insufficient milk supply.21 The actualnumber of mothers who may be physiologically incapable of providing sufficientmilk is, however, extremely low.50 For the remainder of women who prematurelyterminate breastfeeding, there are numerous causes—both biological andpsychological—the majority of which are temporary and can be resolved withexperienced advice or avoided by better preparation, hospital management orappropriate support. For example, rooming-in of infants while in hospitalfacilitates frequent feeding and thus the establishment of lactation.51
9Dietary Guidelines for Children and Adolescents in Australia
1. ENCOURAGE AND SUPPORT BREASTFEEDING
Breastfeeding is disrupted when the infant is housed away from the mother inthe hospital, so the rooming-in option is offered by most hospitals today.52
Another difficulty is that modern hospital practice involves discharging motherstoo early (often within 24–48 hours of delivery); this means hospital staff willhave had insufficient time to help establish breastfeeding. A cohort study has
Box 1.2 Factors associated with the initiation and duration ofbreastfeeding in a rural population compared with an urbanpopulation11,46,47
Factors associated with the decisionto breastfeed
In a Rural area, breast feeding was morelikely if:
• fathers preferred breastfeeding
• mothers were younger
• mothers decided pre-pregnancyto breastfeed
• mothers were primiparous.
Factors associated with risk of ceasingbreastfeeding
In a Rural area risk of early cessation ofbreastfeeding was higher:
• in younger mothers
• in mothers who planned tobreastfeed for less than two months
• where fathers did not preferbreastfeeding
• in mothers who did not decide tobreastfeed before becoming pregnant
• in mothers whose infants receivedcomplementary formula feeds inhospital.
In an Urban area, risk of early cessation ofbreastfeeding was higher:
• in younger mothers
• in less educated mothers
• in mothers born in Australia,New Zealand or the United Kingdomcompared with mothers born in theMiddle East or Africa
• in mothers who planned tobreastfeed for less than four months
• when maternal grandmothers wereambivalent or preferred formulafeeding
• when mothers received conflictingadvice on infant feeding while inhospital.
Note: See reference 46 for details of odds ratios and their confidence intervals.
In an Urban area, breast feeding was morelikely if:
• fathers preferred breastfeeding
• maternal grandmotherspreferred breastfeeding
• mothers decided pre-pregnancyto breastfeed
• mothers were primiparous
• mothers were born in Australia,the United Kingdom, Asia, theMiddle East or North Africa
• husbands were professional oradministrators.
10 Dietary Guidelines for Children and Adolescents in Australia
1. ENCOURAGE AND SUPPORT BREASTFEEDING
demonstrated the importance of a supportive health system in successfulbreastfeeding.53 A review of negative hospital practices—such as distribution ofcommercial publicity packs—has shown that these can have a detrimental effecton breastfeeding.54 (See the Infant Feeding Guidelines for more details.)
Frequent stimulation and frequent emptying are required to maintain breastmilkproduction, which is a very good reason for discouraging the use ofcomplementary food or pacifiers (dummies). Feeding according to need—that is,feeding on demand—offers the best way of maintaining lactation, and if this isprevented by lack of facilities or social acceptance, lactation can be adverselyaffected.
The Australian Breastfeeding Association (formerly the Nursing MothersAssociation of Australia) and other similar organisations have an important roleto play within the health care system, providing the one-to-one support that isneeded to overcome transient problems with lactation, particularly after hospitaldischarge.55 The association also provides breastfeeding education classes, accessto a local network of mothers and group discussion meetings, and a variety ofpublications dealing with all aspects of breastfeeding. In addition, it has a rangeof strategies designed to promote breastfeeding in the community, among themthe following:
• community education sessions run by local groups all around Australia
• promotion of breastfeeding in local areas during Breastfeeding AwarenessMonth
• encouragement to the community to support breastfeeding through ‘BabyCare Room’ awards, ‘Mother Friendly Workplace’ accreditation, and‘Breastfeeding Welcome Here’ stickers
• participation in consultations relating to policies affecting breastfeeding
• access for the community and health professionals to comprehensive andreadily usable information and resources dealing with all aspects of humanlactation through the Lactation Resource Centre. <www.aba.asn.au>
Breastfeeding and paid employment need not be mutually exclusive, although insome cases work may be a reason for women not to commencebreastfeeding.21,56,57 A longitudinal study of 10 500 mothers found that planning toreturn to employment earlier than six weeks post-partum reduces the likelihoodof initiating breastfeeding.58 For successful lactation to continue after returning towork, supportive worksite health-promotion policies are required that provideeducation and facilitate either frequent feeding or frequent expression andstorage of breastmilk, as required. A recent publication provides helpfulinformation for mothers and employers (see Balancing Breastfeeding and Work<www.health.gov.au/hfs/pubhlth/strateg/brfeed/index>). Although it is not anideal situation, many mothers who return to work are unable to breastfeedexclusively and, rather than using expressed breastmilk, carers use infantformulae for some feeds. Although mothers should be supported in thisdecision—any breastfeeding is better than none—every effort should be made tochange the conditions of our society and so make exclusive breastfeeding
11Dietary Guidelines for Children and Adolescents in Australia
1. ENCOURAGE AND SUPPORT BREASTFEEDING
possible for working mothers. The message should be that many motherssuccessfully combine breastfeeding and paid employment.
Breastfeeding and special circumstances
[This subject is discussed in detail in the Infant Feeding Guidelines for HealthWorkers.]
There are few contra-indications to breastfeeding. Most medications a mothermight need are compatible with breastfeeding, but each drug should bespecifically checked in a reliable reference59 or with your GP.
Some disease situations—for example, if a mother has HIV or AIDS—can beabsolute contra-indications.60 Research is progressing rapidly, however, and thismay change. Studies have now shown that exclusive breastfeeding to six months,combined with the use of antiretroviral drugs, substantially reduces the risk ofHIV transmission.61
Exclusive breastfeeding for periods much beyond six months of age may result inunder-nutrition and micro-nutrient deficiency.6 Supplementation with solid foodsis necessary after about this time. In particular, beyond the age of six monthsadditional sources of iron are required, usually from iron-fortified cereals andpureed foods containing meat.62 Mothers who are vegans or strict vegetarians canbe at risk of vitamin B
12 and other nutrient deficiencies. (See Sections 3.2 and 3.3
for more information about this.)
Breastfeeding and community support
Community efforts associated with breastfeeding should focus on strategies andpolicies that will:
• influence the proportion of mothers who intend to breastfeed—the earlierthe decision is made, before or during the pregnancy, the greater thelikelihood of successful breastfeeding
• influence the intended duration of breastfeeding through education,example and support
• influence the attitudes and beliefs of the mother’s support network,particularly the father
• provide antenatal and postnatal education about the day-to-daypracticalities of breastfeeding
• promote breastfeeding as the social norm, with support and the provisionof adequate facilities in social situations and the workplace
• include the father and/or other support people in as much of the antenatalpreparation as possible
• provide post-discharge support for minor problems—from communityservices, the medical profession and support organisations
• enhance support for lactation in the workplace, to allow working mothersto continue to breastfeed.
12 Dietary Guidelines for Children and Adolescents in Australia
1. ENCOURAGE AND SUPPORT BREASTFEEDING
In a meta-analysis of postnatal support for mothers in the community, Sikorskiand Renfrew showed that ‘one more mother will breastfeed for two months ifsupport is provided for nine women and one more woman will breastfeedexclusively if support is given to nine women’.63
The media have an important role in portraying the importance of breastfeedingand in supporting it in the community as the norm. The Australian media oftenportray breastfeeding in a negative way.64 In the United Kingdom it was foundthat television and press coverage routinely implies that breastfeeding isproblematic, funny or embarrassing or associates it with ‘particular types ofwomen’. On the other hand, bottle-feeding is seen as ‘largely normalised,socially integrated, associated with “ordinary” and “normal” families andrepresented as being problem-free’.65
Provision of physical facilities that are adequate for breastfeeding is important;such facilities are often lacking in places mothers and their infants need tovisit—for example, shopping centres and other public places.66
Recent research has shown how important it is for fathers to encourage theinitiation and duration of breastfeeding. The fathers of infants who werebreastfed were found to have three particular characteristics:
• They had other children who had been breastfed.
• They attended antenatal classes.
• They discussed breastfeeding antenatally with their partner.
In general, however, fathers have poor knowledge about the practical aspects ofbreastfeeding11, and it is important to include them in discussion aboutbreastfeeding. Fathers also need to provide practical help—such as occupyingother children and doing household chores—and emotional support forbreastfeeding mothers. They should attend antenatal classes and learn about thenutritive and protective advantages of breastfeeding and some of the potentialpractical difficulties.
All health professionals need to constantly promote the benefits of breastfeeding.The benefits should be discussed with mothers (or potential mothers) at the earliestopportunity, such as the first antenatal visit. Health professionals should ensure thattheir patients know about the protective properties of breastmilk and the risksinvolved when infants do not receive it. They should also ensure that their activitiesdo not discourage mothers from breastfeeding. In a program to promote ‘baby-friendly doctors’ offices’, workshops were conducted for office staff and resulted inpositive changes in breastfeeding promotion. The changes were maintained at sixand 12 months after the intervention.67 In a controlled trial in an obstetrician’s office,the negative effect of exposure to formula-promotion materials was alsodemonstrated. Educational materials about infant feeding should unequivocallysupport breastfeeding as optimal nutrition for infants.68
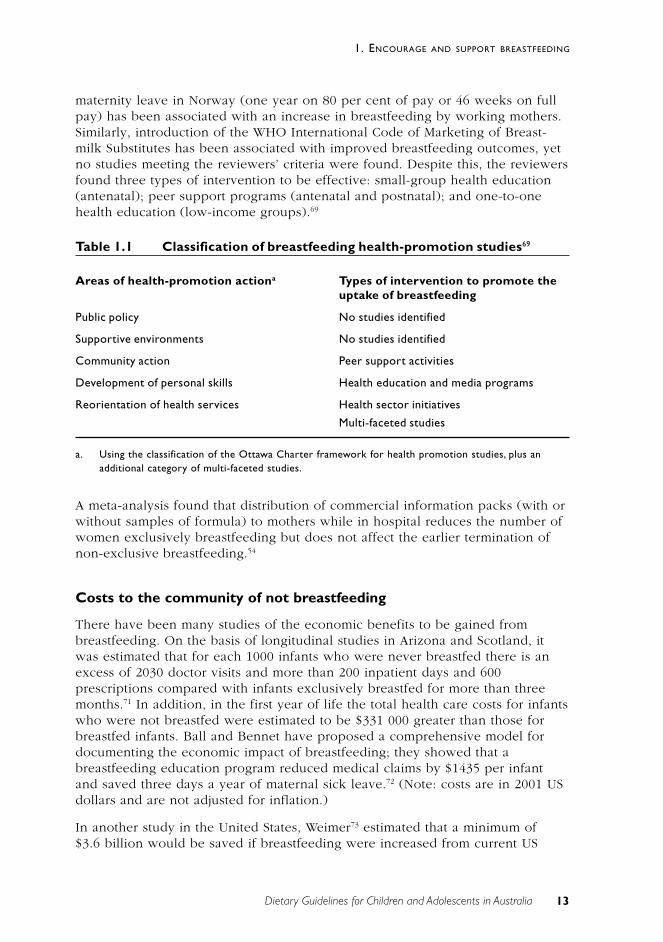
The Health Technology Assessment Program69 has undertaken a systematicreview of health promotion for breastfeeding (see Table 1.1). The reviewerswere very strict about inclusion criteria. For example, the introduction of paid
13Dietary Guidelines for Children and Adolescents in Australia
1. ENCOURAGE AND SUPPORT BREASTFEEDING
maternity leave in Norway (one year on 80 per cent of pay or 46 weeks on fullpay) has been associated with an increase in breastfeeding by working mothers.Similarly, introduction of the WHO International Code of Marketing of Breast-milk Substitutes has been associated with improved breastfeeding outcomes, yetno studies meeting the reviewers’ criteria were found. Despite this, the reviewersfound three types of intervention to be effective: small-group health education(antenatal); peer support programs (antenatal and postnatal); and one-to-onehealth education (low-income groups).69
Table 1.1 Classification of breastfeeding health-promotion studies69
Areas of health-promotion actiona Types of intervention to promote theuptake of breastfeeding
Public policy No studies identified
Supportive environments No studies identified
Community action Peer support activities
Development of personal skills Health education and media programs
Reorientation of health services Health sector initiatives
Multi-faceted studies
a. Using the classification of the Ottawa Charter framework for health promotion studies, plus anadditional category of multi-faceted studies.
A meta-analysis found that distribution of commercial information packs (with orwithout samples of formula) to mothers while in hospital reduces the number ofwomen exclusively breastfeeding but does not affect the earlier termination ofnon-exclusive breastfeeding.54
Costs to the community of not breastfeeding
There have been many studies of the economic benefits to be gained frombreastfeeding. On the basis of longitudinal studies in Arizona and Scotland, itwas estimated that for each 1000 infants who were never breastfed there is anexcess of 2030 doctor visits and more than 200 inpatient days and 600prescriptions compared with infants exclusively breastfed for more than threemonths.71 In addition, in the first year of life the total health care costs for infantswho were not breastfed were estimated to be $331 000 greater than those forbreastfed infants. Ball and Bennet have proposed a comprehensive model fordocumenting the economic impact of breastfeeding; they showed that abreastfeeding education program reduced medical claims by $1435 per infantand saved three days a year of maternal sick leave.72 (Note: costs are in 2001 USdollars and are not adjusted for inflation.)
In another study in the United States, Weimer73 estimated that a minimum of$3.6 billion would be saved if breastfeeding were increased from current US
14 Dietary Guidelines for Children and Adolescents in Australia
1. ENCOURAGE AND SUPPORT BREASTFEEDING
levels (64 per cent breastfed in hospital, 29 per cent breastfed at six months) tothe targets recommended by the US Surgeon General (75 per cent and 50 percent respectively). This figure of $3.6 billion is probably an underestimation ofthe total savings because it represents cost savings from the treatment of onlythree childhood illnesses—otitis media, gastroenteritis and necrotisingenterocolitis.
The health costs of weaning 30 per cent of infants onto infant formula by threemonths of age could be around $290 million a year in Australia; this is based onan analysis of just five illnesses for which breastfeeding is proven to haveprotective effects.74
The total value of breastfeeding to the community makes it one the most cost-effective primary prevention measures available and well worth the support ofthe entire community.
R E L AT I O N S H I P TO OT H E R G U I D E L I N E S
The Infant Feeding Guidelines for Health Workers, provide detailed advice onadolescent pregnancy and breastfeeding; indications for the introduction ofsolids; breastfeeding initiation and management; problems encountered inbreastfeeding; health professionals’ responsibilities under the WHO Code; andthe use of infant formula.
C O N C L U S I O N
Breastfeeding is very important for infant nutrition. Exclusive breastfeeding untilaround six months should be the aim for every infant. If that is not possible,mothers should be encouraged to breastfeed as much, and for as long, as theycan. Breastfeeding beyond six months is of continuing value to baby and mother,although the maximum benefits of breastfeeding are in the earliest months oflife.
Promotion of breastfeeding is an important public health strategy. Support andencouragement at all levels of the community are essential to maintaining andimproving initiation rates and the duration of breastfeeding by Australianwomen, particularly those who are disadvantaged. Breastfeeding is included inboth the Dietary Guidelines for Australian Adults and for Children andAdolescents because it will contribute to the health of all Australians from birth.
E V I D E N C E
There are three relevant Cochrane reviews24,54,63 which support this guideline andfurther National Technology Centre reviews of health education forbreastfeeding.
15Dietary Guidelines for Children and Adolescents in Australia
1. ENCOURAGE AND SUPPORT BREASTFEEDING
For ethical reasons, it is not possible to do randomised control trials ofbreastfeeding.
There is Level III and Level IV for the following:
• the effect of early, as opposed to delayed, initiation of breastfeeding(reference 24)
• the effect of commercial hospital discharge packs for breastfeeding women(reference 54)
• community support for breastfeeding (reference 63)
• the biological suitability of breastmilk (reference 5)
• exclusive breastfeeding to about six months (reference 6)
• the role of breastfeeding in prevention of infant mortality in lessdeveloped countries (reference 35)
There is Level III evidence for the effect of baby-friendly initiatives(reference 67); for the effect of prenatal advertising of formula (reference 68);and for factors associated with breastfeeding in women in Australia(references 11, 47 and 48).
R E F E R E N C E S
1. World Health Organization. International Code of Marketing of Breast-milkSubstitutes. Geneva: WHO, 1981.
2. Scott JA, Binns CW. Breastfeeding in Perth—recent trends. Aust J Publ Hlth1996;20(2):210–11.
3. Royal Australian College of General Practitioners Council. RACGPbreastfeeding position statement. Melbourne: RACGP Council, 2000.
4. American Academy of Pediatrics. Breastfeeding and the use of human milk.Pediatrics 1997;100:1035–9.
5. Michaelsen KF, Weaver L, Branca F, Robertson A. Feeding and nutrition ofinfants and young children: guidelines for the WHO European region, withemphasis on the former Soviet countries. Copenhagen: WHO RegionalOffice for Europe, 2000.
6. World Health Organization. The optimal duration of exclusivebreastfeeding. Geneva: WHO, 2001.
7. Dettwyler K. A time to wean. In: Stuart-Macadam P, Dettwyler K, eds.Breastfeeding: biocultural perspectives. New York: Aldine de Gruytyer, 1995.
8. Binns CW. Food, sickness and death in children of the highlands of PapuaNew Guinea. J Trop Pediatr Environ Child Hlth 1976;22(1):9–11.
9. Binns CW. Infant feeding and growth. In: Ulijaszek SJ, Johnston FE, PreeceMA, eds. Cambridge encyclopedia of human growth and development.Cambridge, UK: University of Cambridge Press, 1998.
16 Dietary Guidelines for Children and Adolescents in Australia
1. ENCOURAGE AND SUPPORT BREASTFEEDING
10. Donath S, Amir LH. Rates of breast feeding in Australia, by state andsocioeconomic status: evidence from the 1995 National Health Survey. JPaediatr Child Hlth 2000;36(2):164–8.
11. Scott JA, Aitkin I, Binns CW, Aroni RA. Factors associated with the durationof breastfeeding amongst women in Perth, Australia. Acta Paediatr Scand1999;88(4):416–21.
12. Brundtland GH. WHO Director-General’s speech on infant feeding. Geneva:WHO, 2000.
13. Redman S, Watkins J, Evans L, Lloyd D. Evaluation of an Australianintervention to encourage breast feeding in primiparous women. HlthProm Int 1995;10(2):101–13.
14. Hitchcock NE. Infant feeding in Australia: an historical perspective. Part2: 1900–1988. Aust J Nutr Diet 1989;46(4):102–8.
15. Lund-Adams M, Heywood P. Breastfeeding in Australia. Wld Rev Nutr Diet1995;78:74–113.
16. Lester I. Australia’s food and nutrition. Canberra: Australian GovernmentPublishing Service, 1994.
17. Palmer N. Breastfeeding: the Australian situation. J Food Nutr 1985;42:13–18.
18. Hitchcock NE, Coy JF. Infant feeding practices in Western Australia andTasmania: a joint survey, 1984–1985. Med J Aust 1988;148:114–17.
19. English R (comp.). Towards better nutrition for Australians: report of theNutrition Taskforce of the Better Health Commission. Canberra: AustralianGovernment Publishing Service, 1987.
20. Hartmann P, Sherriff J, Kent J. Maternal nutrition and the regulation of milksynthesis. Proc Nutr Soc 1995;54(2):379–89.
21. Simopoulos AP, Dutra de Oliveira JE, Desai ID, eds. Behavioral andmetabolic aspects of breastfeeding. Basel: Karger, 1995.
22. Department of Health and Social Security. Present day practice in infantfeeding: third report. Report of a working party of the Panel on ChildNutrition, Committee on Medical Aspects of Food Policy. London: HMSO,1988.
23. Ogle KS, Alfano MA. Common problems of initiating breast-feeding. Thephysician’s role in encouraging success for the ‘nursing’ couple. PostgradMed 1987;82(6):159–62, 165–7.
24. Renfrew MJ, Lang S, Woolridge MW. Early versus delayed initiation ofbreastfeeding (Cochrane Review). Oxford: Cochrane Library, 2000.
25. Akre J, ed. Infant feeding: the physiological basis. Bull Wld Hlth Org1989;67(suppl.):S1–S108.
26. National Health and Medical Research Council. Food Standards Code.Canberra: Australian Government Publishing Service, 1990.
17Dietary Guidelines for Children and Adolescents in Australia
1. ENCOURAGE AND SUPPORT BREASTFEEDING
27. National Health and Medical Research Council. Recommended dietaryintakes for use in Australia. Canberra: Australian Government PublishingService, 1991.
28. Newburg D, Street J. Bioactive materials in human milk: milk sugarssweeten the argument for breast-feeding. Nutr Today1997;32(5):September–October.
29. Cox SE. The fetal origins hypothesis: an overview and implications. NutrAbs Revs 1999;69(10):929–37.
30. Robinson R. The protective effect of childhood infections. BMJ2001;322:376–7.
31. Michaelsen KF, Weaver L, Branca F, Robertson A. Feeding and nutrition ofinfants and young children: guidelines for the WHO European region.Copenhagen: World Health Organization, 2000.
32. Heinig MJ, Dewey KG. Health advantages of breastfeeding for infants: acritical review. Nutr Res Rev 1996;9:89–110.
33. Heinig MJ, Dewey KG. Health effects of breastfeeding for mothers: acritical review. Nutr Res Rev 1997;10:35–56.
34. Oddy W, Holt P, Sly P, Read A, Landau L, Stanley F et al. Associationbetween breastfeeding and asthma in 6 year old children: findings of aprospective birth cohort study. BMJ 1999;319:815–19.
35. WHO Collaborative Study Team on the Role of Breastfeeding in thePrevention of Infant Mortality. Effect of breastfeeding on infant and childmortality due to infectious diseases in less developed countries: a pooledanalysis. Lancet 2000;355(February):451–5.
36. Kramer M, Chalmers B, Hodnett E, Sevkovskaya E, Dzihovich I, Shapiro Set al. The Promotion of Breastfeeding Intervention Trial (PROBIT): arandomized trial in the Republic of Belarus. JAMA 2001;285(4):413–20.
37. Unvas-Moberg K, Eriksonn M. Breastfeeding: physiological, endocrine andbehavourial adaptions caused by oxytocin and local neurogenic activity inthe nipple and mammary gland. Acta Paediatr Scand 1996;85:525–30.
38. Schanler R, Shulman R, Lau C. Feeding strategies for premature infants:beneficial outcomes of feeding fortified human milk versus pretermformula. Pediatrics 1999;103(6):1150–7.
39. Reis B, Hall R, Schanler R, Berseth C, Chan G, Ernst J et al. Enhancedgrowth of preterm infants fed a new powdered human milk fortifier: arandomized, controlled trial. Pediatrics 2000;106(3):581–8.
40. Scott JA, Binns CW. Factors associated with the initiation and duration ofbreast feeding. Aust J Nut Diet 1998;55(2):51–61.
41. Hartmann PE. Lactation and reproduction in Western Australian women. JReprod Med 1987;32(7):543–7.
18 Dietary Guidelines for Children and Adolescents in Australia
1. ENCOURAGE AND SUPPORT BREASTFEEDING
42. Hitchcock NE, Coy JF. The growth of healthy Australian infants in relationto infant feeding and social group. Med J Aust 1989;150:306–11.
43. Kocturk T, Zetterstrom R. Breastfeeding and its promotion. Acta PaediatrScand 1988:183–90.
44. Milligan RA, Pugh LC, Bronner YL, Spatz DL, Brown LP. Breastfeedingduration among low income women. J Midwif Women’s Hlth2000;45(3):246–52.
45 Simopoulos AP, Grave GD. Review of research on the factors associatedwith choice and duration of infant feeding practice. Pediatrics1984;74:S603–S614.
46. Landers M, Hughes RM, Graham K. The Darling Downs BreastfeedingStudy. Toowoomba, Qld: Darling Downs Public Health Unit, 1998.
47. Scott JA, Gowans MC, Hughes RM, Binns CW. Psychosocial factorsassociated with breastfeeding at discharge and duration of breastfeedingamongst two populations of Australian women. Proc Nut Soc Aust2000;25:240.
48. Scott JA, Binns CW. Breastfeeding: are boys missing out? Birth1999;26:276–7.
49. McIntyre E, Hiller JE, Turnbull D. Attitudes towards infant feeding amongadults in a low socioeconomic community: what social support is there forbreastfeeding? Breastfeeding Rev 2001;9(1):13–24.
50. Baghurst KI. Infant feeding: public health perspectives. Med J Aust1988;148(2):112–13.
51. Yamauchi Y, Yamanouchi I. The relationship between rooming-in/notrooming-in and breastfeeding variables. Acta Paediatr Scand1990;79:1017–22.
52. Auerbach KG. Evidence-based care and the breastfeeding couple: keyconcerns. J Midwif Women’s Hlth 2000;45(3):205–11.
53. Kuan L, Britto M, Decolongon J, Schoettker P, Atherton H, Kotagal U.Health system factors contributing to breastfeeding success. Pediatrics1999;104(3):e28.
54. Donnelly A, Snowden HM, Renfrew MJ, Woolridge MW. Commercialhospital discharge packs for breastfeeding women (Cochrane Review).Oxford: Cochrane Library, 2000.
55. Kyenkya-Isabirye M, Magalheas R. The mothers’ support group role in thehealth care system. Int J Gynecol Obstet 1990;31(suppl. 1):S85–S90.
56. Barber-Madden R, Petschek MA, Pakter J. Breastfeeding and the workingmother: barriers and intervention strategies. J Publ Hlth Policy1987;8(4):531–41.
19Dietary Guidelines for Children and Adolescents in Australia
1. ENCOURAGE AND SUPPORT BREASTFEEDING
57. James J. Working and breastfeeding: a contemporary workplace dilemma.Aust Coll Midwives 1999;12(4):8–11.
58. Noble S, Team TAS. Maternal employment and the initiation ofbreastfeeding. Acta Paediatr 2001;90:423–8.
59. Ito S. Drug therapy for breast-feeding women. N Engl J Med 2000;343:118–28.
60. American Academy of Pediatrics. Human milk, breastfeeding, andtransmission of human immunodeficiency virus in the United States.Pediatrics 1995;96:977–9.
61. Coutsoudis A. Promotion of exclusive breastfeeding in the face of the HIVpandemic. Lancet 2000;356:1620–1.
62. Calvo EB, Galindo AC, Aspres NB. Iron status in exclusively breastfedinfants. Pediatrics 1992;90:375–9.
63. Sikorski J, Renfrew MJ. Support for breastfeeding mothers. In: Cochranedatabase of systematic reviews, 2000. <www.cochrane.org/cochrane/revabftr/mainindex.htm>.
64. Henderson AM. Mixed messages about the meanings of breast-feedingrepresentations in the Australian press and popular magazines. Midwifery1999;15(1):24–31.
65. Henderson L, Kitzinger J, Green J. Representing infant feeding: contentanalysis of British media portrayals of bottle feeding and breastfeeding.BMJ 2000;321(7270):1196–8.
66. McIntyre E, Turnbull D, Hiller JE. Breastfeeding in public places. J HumLact 1999;15(2):131–5.
67. Shariff F, Levitt C, Kaczorowski J, Wakefield J, Dawson H, Sheehan D et al.Workshop to implement the baby-friendly office initiative: effect oncommunity physicians’ offices. Canad Fam Phys 2000;46(May):1090–7.
68. Howard C, Howard F, Lawrence R, Andresen E, De Blieck E, Weitzman M.Office prenatal formula advertising and its effect on breast-feedingpatterns. Obstet Gynecol 2000;95:296–303.
69. Fairbank L, O’Meara S, Renfrew MJ, Woolridge M, Sowden AJ, Lister-Sharp D.A systematic review to evaluate the effectiveness of interventions to promotethe initiation of breastfeeding. Hlth Technol Assess 2000;4(25):1–171.
70. World Health Organization. Ottawa Charter for Health Promotion. HealthPromotion 1987;1:3–4.
71. Ball T, Wright A. Health care costs of formula feeding in the first year oflife. Pediatrics 1999;103:870–6.
72. Ball T, Bennett D. The economic impact of breastfeeding. Pediatr Clin NthAmer 2001;48(1):253–69.
73. Weimer J. The economic benefits of breastfeeding: a review and analysis.Food Assistance and Nutrition Research Report no.13. Washington, DC:Department of Agriculture, 2001.
74. Smith J. Mother’s milk, money and markets. Ann Congress Perinatal SocAust NZ 2001.
21Dietary Guidelines for Children and Adolescents in Australia
2. CHILDREN & ADOLESCENTS NEED SUFFICIENT NUTRITIOUS FOODS TO GROW AND DEVELOP NORMALLY
2 C H I L D R E N A N D A D O L E S C E N T S N E E DS U F F I C I E N T N U T R I T I O U S F O O D S TOG R OW A N D D E V E L O P N O R M A L LY
• G r o w t h s h o u l d b e c h e c k e d r e g u l a r l y f o r y o u n gc h i l d r e n
• P h y s i c a l a c t i v i t y i s i m p o r t a n t f o r a l l c h i l d r e na n d a d o l e s c e n t s
C o l i n B i n n s , G e o f f D a v i d s o n a n d D a v i d F o r b e s
T E R M I N O L O G Y
Growth
Growth refers to the acquisition of tissue and the consequent increase in bodysize.
Development
Development refers to the increased ability of the body to function physically andintellectually. Physical and intellectual development proceed at different rates indifferent individuals.
Age ranges
As noted in the preface, the terminology used for the various age ranges is asfollows:
• infant—up to 12 months
• toddler—1 to 2 years
• preschool child—3 to 5 years
• young child—1 to 5 years
• primary school age—6 to 11 years
• adolescent—12 to 18 years.
CDC growth reference
The CDC growth reference is a data set based on several US studies. It has beenadopted by the World Health Organization and in Australia by the NationalHealth and Medical Research Council.
22 Dietary Guidelines for Children and Adolescents in Australia
2. CHILDREN & ADOLESCENTS NEED SUFFICIENT NUTRITIOUS FOODS TO GROW AND DEVELOP NORMALLY
B A C K G R O U N D
Weight gain and an increase in body size are integral parts of normal growth anddevelopment during childhood and adolescence. At this life stage the focus is onmaintaining a rate of physical growth that is consistent with the expected normsfor age, sex and stage of physiological maturity. Physical growth is best assessedby the conventional measures of weight, length or height, and headcircumference. Maintenance of a positive energy and nutrient balance is criticalin achieving and sustaining normal growth and development. During periods ofrapid growth, any intentional restriction of weight gain—through dieting, forexample—is usually inappropriate.
In recent years there has been increasing awareness of the importance ofperinatal nutrition in terms of the development of disease in adulthood; this isknown as the foetal origins of disease or Barker hypothesis3,4—see part A of the‘Special considerations’ section. In addition, there is increasing evidence of theimportance of growth and nutrition in relation to cognitive development.5,6
Growth during infancy also influences future bone mass.7
S C I E N T I F I C B A S I S
Growth
Between birth and 18 years of age, a person’s body weight increases abouttwenty-fold. During early childhood, the rate of increase in weight and length isessentially linear: the rate of increase in weight generally keeps pace with therate at which length increases. During infancy and adolescence, however, therate of growth changes rapidly over time; for example, it decelerates rapidlyduring the first year of life, while during adolescence it first accelerates over aperiod of one to three years and then decelerates rapidly until growth in heightceases at about 16 years of age in girls and 18 years in boys. Secular changes ingrowth and maturation have been well documented in many countries, andAustralia is no exception. Loesch et al.8 compared the data on height and bodyweight obtained in 1992 to 1993 from 1804 Melbourne school students aged 5to17 years with historical data collected from white Australians during the last100 years. Australians have been getting taller every decade and, although theincrease in height has significantly slowed down during the last two decades, theincrease in body weight is continuing and is more pronounced in females.
Children
[For information about infants and nutrition, see Chapter 1.]
Children between the ages of 1 and 5 years are still considered nutritionallyvulnerable, although their growth rate is slower than in infancy and theirnutritional needs in relation to their body size are proportionally reduced.Relative to their body weight, however, children’s nutrient and energyrequirements are still greater than those of adults.9
23Dietary Guidelines for Children and Adolescents in Australia
2. CHILDREN & ADOLESCENTS NEED SUFFICIENT NUTRITIOUS FOODS TO GROW AND DEVELOP NORMALLY
Compared with adults, young children are unable to exert as much control overwhat they eat. Too little or too much food, or an imbalance of nutrients orenergy over a period, can alter the natural progress of physical growth. A child’srate of growth is a fundamental indicator of dietary adequacy and health, andparents and other carers must be aware of and responsive to the developmentaland nutritional needs of children. Growth is the most important indicator of goodnutrition. In Australia, if a child’s growth follows expected norms it is unlikelythat nutrition is a problem.
Childhood is a period of continuous education about eating and good nutrition,and appropriate use of food is important in establishing lifetime nutritionpractices. Food intake may drop off during the second year of life, and parents’skills of encouragement and example will be needed. After starting school,children are subject to an increasing array of influences from outside the home.They experience peer pressure in many areas, including food, and groupbehaviour becomes the norm.
Adolescents
During adolescence there is a marked increase in the rate of gain in both weightand length—referred to as the adolescent growth spurt. The spurt in heightbegins on average at 10 to 11 years in girls and at 12 to 13 years in boys,although there is wide variation in this. During the adolescent growth spurt boysgain an average of 20 centimetres in height and 20 kilograms in weight and girlsaround 16 centimetres and 16 kilograms respectively.2 The peak velocity forweight gain tends to occur about three months after that for height. In girls, theonset of menstruation generally occurs after the peak in height velocity; in boys,the development of secondary sexual characteristics is less closely related to theadolescent growth spurt.
Adolescence is an important period for calcium absorption and the optimumperiod for gaining bone density, particularly for girls.10 The efficiency of calciumabsorption increases during puberty, and the majority of bone formation occursat this time. Data from balance studies suggest that for most healthy adolescentsthe maximal net calcium balance (plateau) is achieved with intakes of between1200 and 1500 milligrams a day11; that is, at intake levels above this almost allthe additional calcium is excreted and not used.
In the United States adolescents’ milk consumption declined by 36 per centbetween 1965 and 199612, being replaced by increased consumption of softdrinks and juices. A similar decline has occurred in Australia.13,14 The increasedphosphorus excretion associated with this change in diet may compromise bonebuilding and maintenance.15,16
Assessment of body weight and growth rate
The most practical measures of nutritional status in childhood are comparisonswith reference growth charts that show the normal ranges for weight for age,height for age and weight for height, by sex. When only a single measurement of
24 Dietary Guidelines for Children and Adolescents in Australia
2. CHILDREN & ADOLESCENTS NEED SUFFICIENT NUTRITIOUS FOODS TO GROW AND DEVELOP NORMALLY
weight and height is available, the traditional method has been to establish thepercentile of the growth reference. In some situations it is more appropriate touse the Z scores (standard deviations above or below the mean), and growthreference charts are available in both formats or a calculator is available on theinternet.17,18 If weight and height are measured on several occasions, themeasurements are most usefully interpreted by plotting them on referencegrowth charts.19 In Australia, the US National Center for Health Statistics (NCHS)growth charts are recommended for this purpose for all ethnic groups. The chartsare included in the personal health records produced by various organisations foruse as a continuing record of a child’s health. The US Centers for Disease Controlrecently revised the growth reference to eliminate some minor anomalies around2 years of age2,20—see part B of the ‘Special considerations’ section.
The suitability of the WHO–NCHS values for use as an international standard hasbeen debated because many of the children on whom the values were basedwere not breastfed. In an international study, which included Australian children,the growth of breastfed infants was slightly below the WHO–NCHS reference. In1993 the World Health Organization established a working group to develop newinternationally applicable standards based on the growth of infants who werebreastfed according to the WHO protocol.21,22 In Australia, however, the growthrate for Indigenous infants who are exclusively breastfed follows the WHO–NCHS reference until 6 months of age then begins to fall away.23,24 This suggeststhat the difference between breastfed infants and the CDC–WHO reference is notvery significant for Australia, particularly if it is used as a reference formonitoring growth and not as a standard.
Generally, if a child is growing normally the lines connecting the plotted valueswill proceed along or parallel to one of the percentile lines on the charts. If theplotted values show a markedly irregular pattern, this could signify a problem,although some of the measurements might have been inaccurate or the datamight have been plotted incorrectly. This possibility should always be checked atthe first opportunity. The extent to which serial data for a child can deviate froma given percentile range before concern is warranted depends on the age of thechild, the child’s position in the percentile range, the length of time for whichthe rate of growth deviates from the norm, and the coexistence of any medicalcondition. In general, the more pronounced the change in growth rate, theyounger the child and the more extreme the percentile, the greater is theconcern.
Skinfold measurements—a measure of the amount of fat in the subcutaneouscompartment—is another index of under- or over-nutrition, although generationof reliable measurements depends to a large extent on the use of trainedoperators and calibrated instruments, and not all are reliable. DEXA (dual energyX-ray absorptiometry) and ultrasound provide the most accurate measurements,but cost limits their application to experimental use and to clinical settings wheremore accurate diagnosis is required for management. Measurement and recordingof weight and height at regular intervals remain the best way of monitoringgrowth.
25Dietary Guidelines for Children and Adolescents in Australia
2. CHILDREN & ADOLESCENTS NEED SUFFICIENT NUTRITIOUS FOODS TO GROW AND DEVELOP NORMALLY
Body mass index—weight (kg) / height (m)2—is the most common measurementused to define overweight and obesity in adults, and centile charts for childrenare now available.25 In children, BMI has now become accepted as a useful toolfor identification and monitoring of obesity.26 Deitz and Bellizzi26 suggested usingthe common adult cut-off points of 25 (overweight) and 30 (obese) as the cut-offpoints for children. However, Cole et al.27 used pooled data on 192 727 subjectsaged from birth to 25 years from a number of countries to develop for each agecut-off points that reflect the changes in BMI with age and correspond with theadult levels of overweight and obesity. These cut-off points are a bigimprovement on current alternatives and should help to provide internationallycomparable prevalence rates for overweight and obesity in children (seeTable B.2 in the ‘Special considerations’ section). The results of three studies ofAustralian children and adolescents (a total of about 11 000 subjects) were re-analysed using the Cole criteria28, and the prevalence of overweight and obesitywas found to be between 19 and 23 per cent. BMI has not been validated in theassessment of under-nutrition in children and adolescents but may prove a usefulscreening measure.29,30
Physical activity
Physical activity is a normal component of everyday life for children andadolescents, including those with physical and other handicaps. It plays animportant part in physical growth and the development of a wide range of skills,and it provides a mechanism for balancing energy intake and energy output.Physical activity in girls is related to subsequent bone density in adulthood.31 TheWestern Australian Child Health Survey found a cross-sectional associationbetween mental health and physical activity in children and adolescents.32
In sedentary societies, obesity that develops during childhood or adolescence isoften thought to be a consequence of a high energy intake in association withreduced energy expenditure, although there is relatively little evidence thatobese children as a group consume more energy than their non-obese peers.There is, however, evidence that obese children are less active than leanchildren and that inactivity is associated with an increased prevalence ofobesity.33,34
Between the ages of 12 and 18 years the average amount of regular physicalactivity decreases by 50 per cent; boys are consistently more active and fitterthan girls.35 A similar pattern of fitness was evident in the Health and FitnessSurvey of Australian Schoolchildren in 1985: when compared with boys, girls hada significantly lower mean level of aerobic fitness, and 15-year-old girls were theleast fit of all.36 Activity patterns that develop during childhood and adolescencecarry over to later life and affect morbidity and longevity.37,38 It is obviouslyimportant to ensure that children and those who interact with them are aware ofthe role that regular physical activity can play—not only in terms of ‘fitness’ and‘fatness’ in childhood and adolescence but also in terms of later susceptibility tochronic diseases.
26 Dietary Guidelines for Children and Adolescents in Australia
2. CHILDREN & ADOLESCENTS NEED SUFFICIENT NUTRITIOUS FOODS TO GROW AND DEVELOP NORMALLY
The US Surgeon General reached the following conclusions about the importanceof physical activity:
Children become far less active as they move through adolescence. Obesityis increasing among children, at least in part related to physical inactivity.Data indicate that obese children and adolescents have a high risk ofbecoming obese adults, and obesity in adulthood is related to coronaryartery disease, hypertension, and diabetes. Thus, the prevention ofchildhood obesity has the potential of preventing cardiovascular disease inadults.39
The Surgeon General also made the point that all children, adolescents andyoung adults—both male and female—benefit from physical activity.
Physical activity does not need to be strenuous to be beneficial. A moderateamount of daily physical activity is recommended for everyone. This amount canbe attained in longer sessions of moderately intense activities (such as briskwalking for 30 minutes)39 or in shorter sessions of more intense activities (suchas jogging or playing basketball for 15 to 20 minutes).39 The Physical ActivityGuidelines for Australians <www.health.gov.au/hfs/pubhlth/strateg/active/index.htm> make the following recommendations:
• Think of movement as an opportunity, not an inconvenience.
• Be active every day in as many ways as possible.
• Put together at least 30 minutes of moderate-intensity physical activity onmost, preferably all, days.
• If possible, also enjoy some regular, vigorous exercise for extra health andfitness. (Children and teenagers under 18 should follow this guidelineroutinely.)
The guidelines also emphasise the importance of maintaining a physicalenvironment where it is convenient and safe for children to exercise: ‘Encourageopportunities for children to be physically active out of school hours bysupporting the development and maintenance of safe school routes and parks’.40
Physical activity and the impact of television, computers and videogames
A study of Geelong adolescents41 found that the average number of hours oftelevision viewing per week (16 hours for boys and 18 for girls) greatlyexceeded the number of hours spent in physical activity, although the time spentwatching television was not as high as that reported for 11–12 year olds inPennsylvania.42 Williams and Handford43 noted a direct inverse relationshipbetween the time spent watching television and the time spent engaged in activesport, while Tucker44 found that adolescent boys who watched television for lessthan two hours a day had significantly greater cardiovascular fitness than theirpeers who watched more than four hours of television daily. In a study of 4069children in the United States, the prevalence of obesity was found to be lowest
27Dietary Guidelines for Children and Adolescents in Australia
2. CHILDREN & ADOLESCENTS NEED SUFFICIENT NUTRITIOUS FOODS TO GROW AND DEVELOP NORMALLY
in children watching one hour or less of television a day and highest amongthose watching four hours or more a day. In girls, television watching waspositively associated with obesity, even after controlling for age, race/ethnicity,family income, weekly physical activity, and energy intake.45 A randomisedcontrolled trial of reducing children’s television and video watching—which didnot specifically target physical activity—found a reduction in BMI and otherindices.46
The American Academy of Pediatrics has recently reviewed the role of televisionfrom the paediatrics perspective, including its impact on the nutritional status ofchildren and adolescents.47 It concluded, ‘Research has shown primary negativehealth effects on violence and aggressive behaviour; sexuality; academicperformance; body concept and self-image; nutrition, dieting, and obesity; andsubstance use and abuse patterns.’ The academy makes a number ofrecommendations for health care workers and parents, among them limitingtelevision viewing to one to two hours a day, which is less than half currentviewing patterns in the United States. The increasing prevalence of computersand video games in the home also has an impact on children’s activity levels.
Overweight and obesity
Australia is part of a worldwide obesity epidemic, which is affecting children ofall ages as well as adults. Detailed comparisons of obesity rates in children areoften difficult to obtain because different criteria have been used to defineoverweight and obesity in different age groups and different growth referenceshave been used. Lazarus et al.48 compared data from two population-basedsurveys (in 1985 and 1997) of 7–12 year old children in Victoria; they found thatthe children had become more obese in the 12 years between the surveys and,of particular concern, that the increase in BMI was most marked at the heavierend of the distribution. Mean BMI increased by 1.03kg/m2 for boys and 1.04kg/m2 for girls. In the United States in the past two decades the prevalence ofoverweight has increased by 80 per cent in children and 100 per cent inadolescents.49 In the United Kingdom rates of overweight in children havedoubled over a similar period.50
Prevention remains very important because obesity is hard to treat and hasadverse physical and psychological outcomes. Overweight children are morelikely to become obese adults51, and an overweight school-aged child with anobese parent has more than a 70 per cent chance of being obese in youngadulthood.52
Metabolic consequences of obesity
Obese children and adolescents can show early signs of metabolic and clinicalconsequences—such as hyperinsulinaemia and hypertriglyceridaemia—that arewell recognised in obese adults.53 Additionally, obese children and adolescentshave been shown to have reduced exercise tolerance and so obtain reduced
28 Dietary Guidelines for Children and Adolescents in Australia
2. CHILDREN & ADOLESCENTS NEED SUFFICIENT NUTRITIOUS FOODS TO GROW AND DEVELOP NORMALLY
benefits from exercise.54 Non-alcoholic steatohepatitis is well recognised in adultsas a complication of obesity; it is now occurring in children and adolescents andis related to the increasing prevalence of obesity and associated insulinresistance.55
Psychological problems of obesity
The main ill-effects of obesity during childhood are social and emotional.54
Obese people are stigmatised and labelled with undesirable behaviouralcharacteristics ranging from social deviance to an inordinate desire for self-gratification.54 In 1967 Stunkard and Burt (cited by Johnston56) suggested that thedisturbance of body image reported among obese adults seems to have its originduring adolescence, when belittlement and peer pressure have particularlydeleterious effects.
Underweight, failure to thrive and dietary restriction
The most serious consequences of an inappropriate food intake in infancy andearly childhood are underweight and failure to thrive. In Australia, in recentyears, concern about the prevalence of underweight and failure to thrive ininfancy and childhood has largely focused on Indigenous communities, wherethe aetiology of the problem rests in a complex mix of social and economicfactors.57,58 Failure to thrive among other sections of the community is also mostcommonly a result of psychosocial factors, including poor living conditions.59
Psychosocial failure to thrive—which at its most extreme is a manifestation ofchild neglect—is the most common form of failure to thrive in both inpatient andoutpatient populations in the non-Indigenous community.60 The literatureprovides evidence that from time to time cases of failure to thrive also occur inmore affluent sections of the community as a consequence of parentsinappropriately restricting the dietary intake of young children because of fearsabout obesity and atherosclerosis or the development of ‘unhealthy’ dietaryhabits.61 Such cases are, however, relatively rare compared with the problem ofdietary restriction in older children and adolescents.62
Perception of body image
A Sydney study of 133 girls aged 12 to 14 years found that while 18 per centcould be classified as ‘underweight’ and 26 per cent as ‘overweight’, 37 per centthought they were too fat and 42 per cent were on a diet to lose weight.63 Datafrom the 1985 National Dietary Survey of Schoolchildren64 showed that girlsincreased their energy intake by less than 10 per cent between the ages of 10and 15 years, whereas over the same age range boys increased theirs by some45 per cent. Although the data probably exaggerate the real extent of the energyrestriction because of the tendency for reported dietary intakes to underestimatehabitual intakes65, the data do suggest that there is a need for information andsupport to combat the fear of weight gain in this age group. First, adolescents
29Dietary Guidelines for Children and Adolescents in Australia
2. CHILDREN & ADOLESCENTS NEED SUFFICIENT NUTRITIOUS FOODS TO GROW AND DEVELOP NORMALLY
need reassurance that appreciable weight gain, changes in body shape andincreases in food intake are quite normal at this time; second, they need to beaware that any extreme dietary practices that limit the intake of nutrients arehighly undesirable in relation to both their current and their longer term health.
Dieting and concerns about body size
Characteristics of disordered eating—such as restrained eating, binge eating, fearof fatness, purging and distortion of body image—are commonly reported inadolescents.66,67 There are also reports of children exhibiting similar weight-related behaviours.61 These characteristics are more prevalent in females thanmales. A Melbourne study of year 11 students found that 57 per cent of thefemales had dieted to lose weight, while only 18 per cent of the males had doneso.68 Another study of women aged 15 to 27 years found that most of the studypopulation had dieted at some time. Several strategies were adopted to loseweight; they ranged from exercising and not eating between meals to self-induced vomiting and abuse of laxatives and diuretics.69 Similar weight-controlpractices have been reported among 15-year-old New Zealand girls70 andAdelaide women aged 18 to 86 years.71 Abraham and Mira69 consider that mostadolescent females experience a phase of ‘disordered’ or ‘abnormal’ eatingbehaviour, which they attribute to the social pressure on young women to beslim and the association of slimness with health, happiness and attractiveness.This pressure is combined with the biological changes—widening of the hips anddeposition of fat on the hips and breasts—that females experience duringadolescence.
There are only limited estimates of the prevalence of anorexia nervosa andbulimia nervosa in Australia. These conditions are often described as affectinglarge numbers of adolescent girls and young women, although, in a study of theprevalence of anorexia nervosa in a population of 5705 South Australian girlsaged 12 to 18 years, Ben-Tovim and Morton72 found that true anorexia nervosawas a relatively rare disorder, with a prevalence of 1.05 cases per 1000 of thepopulation studied. This study adopted quite rigorous criteria for the definitionof anorexia nervosa and did not describe the prevalence of more general eatingdisorders that might lead to the development of anorexia nervosa or bulimianervosa. Nevertheless, the study lasted a year and the authors stated that none ofthe milder variants of anorexia nervosa in the study population became moresevere during the study period.
An earlier study, by Ben-Tovim et al.73, of the prevalence of bulimia nervosafound a similar situation. When the widely used criteria for the diagnosis ofbulimia (a syndrome of secretive and subjectively hard-to-control binge over-eating) were used with three community and two hospital populations in SouthAustralia, 13 per cent of females aged 16 to 45 years in the community samplescould be categorised as bulimic. In contrast, when the term was defined withreference to the behaviour of patients undergoing treatment for bulimia nervosa(who not only binge over-ate but also acted to prevent the weight gain causedby their overeating), a very different picture emerged: the prevalence of bulimiaamong females in the community samples was about 1 to 2 per cent.
30 Dietary Guidelines for Children and Adolescents in Australia
2. CHILDREN & ADOLESCENTS NEED SUFFICIENT NUTRITIOUS FOODS TO GROW AND DEVELOP NORMALLY
More recently, Patton et al.74 have reported that 3.3 per cent of femaleadolescents and 0.3 per cent of male adolescents in a Victorian cohort exhibitedfeatures of an eating disorder. Over the three-year study period the rate ofdevelopment of new eating disorders was 21.8 per 1000 person-years ofobservation in females and 6.0 in males. The most important predictors of thedevelopment of eating disorders were early dieting and psychiatric morbidity.Thus, it would appear that, although only a small proportion of the femalepopulation develops clinical eating disorders, a great many more displaydisrupted eating behaviour and weight-control problems. There are indicationsthat children also exhibit some characteristics of disordered eating and concernsabout body weight, so preventive action should be aimed at children and youngwomen. Such action would be designed to help young women to accept a widerange of weights and body shapes as normal and to develop mechanisms forcoping with the prevailing societal attitudes to weight and body shape69, as wellas dealing with more general matters relating to self-esteem, healthy familyfunction and recognition of the early features of psychiatric disability.69,75,76
P R A C T I C A L A S P E C T S O F T H I S G U I D E L I N E
Development
Children’s nutritional needs should be considered in the context of normalchildhood development. The following characteristics of normal childhooddevelopment are identified in the Canadian guidelines Promoting NutritionalHealth During the Preschool Years.1
Throughout early childhood, children are:
• rapidly changing, not only growing in stature but developing in abilityand personality.
• keenly curious and learning at a rapid rate. Exploring the environmentthrough play takes up a large part of the young child’s time.
• continually challenging the relationship with the primary caregiver,asserting independence while needing guidance and protection.
• gradually moving beyond the parent’s primary care to others in thefamily, community and society.
• exploring food as part of their development.
Boxes 2.1 and 2.2 summarise the developmental characteristics of toddlers andpreschoolers in relation to food.
31Dietary Guidelines for Children and Adolescents in Australia
2. CHILDREN & ADOLESCENTS NEED SUFFICIENT NUTRITIOUS FOODS TO GROW AND DEVELOP NORMALLY
How is normal development assessed?
Unlike growth, there are no simple measures of development. A range of testscan be used for assessing aspects of psychosocial development such asintelligence, personality and emotional adjustment, but they require specialtraining. Such assessment is done by primary health care workers, with referenceto developmental milestones or screening tests (see, for example, reference 78).Each child is unique, and this is reflected in individual rates of normaldevelopment. Development is a gradual process of growth and expansion ofskills, moving from a low level of complexity to a more advanced level. It isachieved through the processes of growth, maturation and learning.
Understanding how children and young people approach eating
The role of caregivers
The early years of life are critical in establishing food attitudes and habits.75
Caregivers can foster the formation of sound food habits by understanding eatingbehaviour as part of a child’s normal pattern of development. They play a centralrole in providing a safe environment that offers opportunities for exploration andlearning. The feeding and nutritional care of a child are an integral part of thecomplex interaction between the primary caregiver and the child and are vital tothe child’s physical and emotional development.1,77 Contemporary lifestylepatterns may mean that children have several different caregivers: goodcommunication between these caregivers helps to ensure that they can assessand respond to a child’s individual needs.
Box 2.1 Developmental characteristics of toddlers1,78
The toddler years bring:
• a time of exploration.Toddlers explore their surroundings by touching, seeing, listening,smelling and tasting. Food is of immense interest to most of them—but not always toeat
• greater autonomy but at the same time a fear of new experiences. Between 18 and 24months most toddlers can handle a spoon and cup for feeding themselves, although spillsoften occur. ‘No’ becomes a favourite word. Inconsistency is also a common feature: oneday they insist on feeding themselves and the next day they insist on being fed
• a need for a sense of security.The need for ritual and a sense of security is very strong intoddlers. A desire for the familiar—a special toy or food—often dictates their dailyroutine. This is an integral part of the normal transition from infancy to childhood
• a limited attention span. Easily distracted, toddlers may be unable to sit at the family tablefor the normal duration of a meal
• awareness of others. Although not skilled in cooperative play, 2- and 3-year-olds aregradually developing social skills. They often imitate people close to them. Watchinganother child or adult who enjoys the food is a powerful influence on the toddler’sacceptance of foods.
32 Dietary Guidelines for Children and Adolescents in Australia
2. CHILDREN & ADOLESCENTS NEED SUFFICIENT NUTRITIOUS FOODS TO GROW AND DEVELOP NORMALLY
Food intake
Caregivers often appear to be more concerned with the amount of foodconsumed rather than the type of food offered or even the feedingenvironment.79 But obviously a balance between the amount, type and variety offoods is necessary. Caregivers’ responsibility lies in buying the food, setting thetimes of meals and snacks, preparing meals, presenting foods in suitable forms,maintaining standards of behaviour at the table, and making meal times pleasant.The nutritional quality of the diet is important to ensure that the child receivesthe levels of nutrients specified in the recommended dietary intakes.9,80
The following are general characteristics of a child’s developing eating pattern:
• Small amounts of foods eaten frequently. Because their stomach capacity issmall, children tend to eat small amounts frequently throughout the day.
• Routine in daily life. Most children need some structure and routine totheir day. Generally, they prefer meals and snacks at regular times, asgoverned by the family’s lifestyle.
• Considerable variation in appetite. Children’s appetites normally fluctuatefrom day to day, depending on their rate of growth and level of physicalactivity. Many parents find their children eat better at certain times of theday. Tiredness and irritability can prevent children from eating, especiallyat the evening meal.
• A preference for simplicity. Many children like simply prepared, mild-tasting foods that they can easily identify. They prefer foods they canmanage—for example, cut-up vegetables they can eat with their fingersand soups they can drink from a cup.
Box 2.2 Developmental characteristics of preschoolers1,78
In general, in preschoolers there is:
• progressive acquisition of new skills. Preschoolers are striving for independence andgaining competence in such activities as tying their shoes, brushing their teeth andpouring milk. A preschooler’s oral motor development and manual dexterity should beconsidered so that foods of appropriate texture, consistency and ease of eating arechosen for them
• energy. Sitting still for more than a few minutes might be difficult. Preschoolers needplenty of time for active play and opportunities to develop gross motor coordination
• more effective communication. Language is important. Peers become increasinglyimportant. Most preschoolers enjoy sharing food with friends and carers
• a keen curiosity. ‘Why’ has usually replaced ‘no’ as the favourite spoken word. The kitchenprovides an opportunity for experiments, crafts, and participation in food preparation
• comfort with the familiar but willingness to try new challenges. Food fads are commonat this time. Preschoolers might insist on having a particular food prepared in aparticular way for several days then, once it has been experienced to the full, becomeinfatuated with another food. This has been called ‘fussiness’, but it is actuallycharacteristic of normal development. Although variety may be limited while the fadpersists, the preschooler is gradually expanding their food choices.
33Dietary Guidelines for Children and Adolescents in Australia
2. CHILDREN & ADOLESCENTS NEED SUFFICIENT NUTRITIOUS FOODS TO GROW AND DEVELOP NORMALLY
• An association of food with more than eating. Foods have specificmeanings determined by a child’s associations with them; for example,sweets may mean a reward for good behaviour in the supermarket.Caregivers should be aware that early impressions associated with varioususes of food affect food-related attitudes and practices that can lastthroughout life.
• Dawdling over meals. It is quite normal for children—who have noconcept of time—to lose interest in an activity very quickly.1
A number of strategies can be adopted to encourage good eating habits andmonitor food intake:
• Establish routines where the child and caregiver sit down together and talkduring meal times and snacks.
• Establish habits—such as milk with a meal and water at bedtime—that willhelp ensure variety and nutritional adequacy.
• Keep in the fridge or on the kitchen bench a ‘snack-box’—containinghealthy snack foods such as pieces of fruit, vegetables, cheese and smallsandwiches—that the child can either use independently or have offered tothem. This helps to monitor what the child is eating between meals.
• Introduce the practice of having the child at the table for meal times assoon as he or she is able to sit up and grasp foods.
• Do not give the child too large a serving. It is better to offer small amountsand have more available if they want it.
• Provide foods the child likes, plus a new food to try. Be accepting if thechild does not like particular foods, but remember that likes and dislikeschange over time. Do not avoid serving a food that the child dislikes butthat the rest of the family likes: continue to serve it, placing only a smallamount on the child’s plate, and accept it if they do not eat it.
‘Fussy eating’ is common among toddlers and often worries parents. Usually it isa stage in normal development, but it can be aggravated by parental response.When growth and development are normal and a variety of foods are offered tothe child, simple reassurance from the child’s parents may be all that is needed.81
An adequate intake of fluids is important at all ages. Children should beencouraged to drink as much water as possible, in preference to other fluids.Milk is an important source of calcium and, because it has a high proteincontent, has a greater satiating effect than other drinks.82
Food preferences
Parents and peers
Parental influences on food patterns are critical in the development of foodpreferences83, and parental pressure, even if it is positive, can affect a child’sfood acceptance.77 Using foods as rewards or presenting them paired with adultattention increases a child’s preference for that food (Birch, cited by Sigman-
34 Dietary Guidelines for Children and Adolescents in Australia
2. CHILDREN & ADOLESCENTS NEED SUFFICIENT NUTRITIOUS FOODS TO GROW AND DEVELOP NORMALLY
Grant79); when foods are simply presented at snack time or when they areoffered without a social context, food preferences do not appear to beinfluenced. Another influence on food preferences is the frequency with whichchildren see a particular food. It is important for caregivers to present new foodsfrequently: continued exposure promotes acceptance. Further, when childrenobserve adults consuming a food, it is more likely that the children will start toconsume the food.79 Peer influence can also affect children’s food preferences asthey age79; adolescents are particularly susceptible to peer pressure.84
Television advertising
In addition to its effects on physical activity, television exposes children tonumerous food advertisements. There has been much speculation in recent yearsabout the effects of that advertising, and of the media in general, on children’sfood preferences and intakes. Public health experts and nutrition educators haveexpressed concern that many of the food advertisements on television directed atchildren are for a narrow range of products that are high in fats, sugars and/orsalt and low in dietary fibre.85,86 Producers of basic foods such as vegetables andfruits and agencies involved in promoting healthy diets often lack the funds toadvertise and so provide some balance in the range of products promoted.
A US study found that television commercials were important influences on thetypes of food children ask their parents to buy and the foods they buy forthemselves.87 (Otherwise, why would advertisers bother?) Sweetened breakfastcereals, candy, desserts, low-nutrient beverages, and salty snack foods were theproducts most commonly advertised to children and are also the items mostfrequently requested of parents. Kraak and Pelletier suggest that buildingchildren’s and teenagers’ skills in processing consumer information is onestrategy—when combined with parental guidance and environmental support(including government–industry partnerships)—that can help young consumersmake ‘healthful’ dietary choices before undesirable dietary behaviours havedeveloped.
Table 2.1 outlines some typical physical and social/personal characteristicsrelated to the eating practices of preschool children.
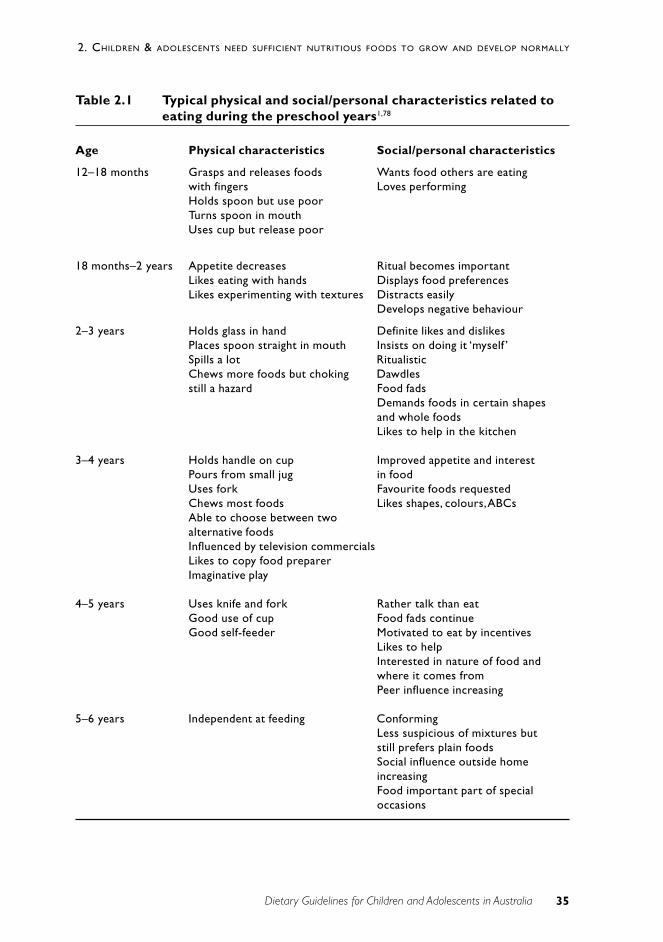
35Dietary Guidelines for Children and Adolescents in Australia
2. CHILDREN & ADOLESCENTS NEED SUFFICIENT NUTRITIOUS FOODS TO GROW AND DEVELOP NORMALLY
Table 2.1 Typical physical and social/personal characteristics related toeating during the preschool years1,78
Age Physical characteristics Social/personal characteristics
12–18 months Grasps and releases foods Wants food others are eatingwith fingers Loves performingHolds spoon but use poorTurns spoon in mouthUses cup but release poor
18 months–2 years Appetite decreases Ritual becomes importantLikes eating with hands Displays food preferencesLikes experimenting with textures Distracts easily
Develops negative behaviour
2–3 years Holds glass in hand Definite likes and dislikesPlaces spoon straight in mouth Insists on doing it ‘myself ’Spills a lot RitualisticChews more foods but choking Dawdlesstill a hazard Food fads
Demands foods in certain shapesand whole foodsLikes to help in the kitchen
3–4 years Holds handle on cup Improved appetite and interestPours from small jug in foodUses fork Favourite foods requestedChews most foods Likes shapes, colours, ABCsAble to choose between twoalternative foodsInfluenced by television commercialsLikes to copy food preparerImaginative play
4–5 years Uses knife and fork Rather talk than eatGood use of cup Food fads continueGood self-feeder Motivated to eat by incentives
Likes to helpInterested in nature of food andwhere it comes fromPeer influence increasing
5–6 years Independent at feeding ConformingLess suspicious of mixtures butstill prefers plain foodsSocial influence outside homeincreasingFood important part of specialoccasions
36 Dietary Guidelines for Children and Adolescents in Australia
2. CHILDREN & ADOLESCENTS NEED SUFFICIENT NUTRITIOUS FOODS TO GROW AND DEVELOP NORMALLY
Changing adolescents’ diets
Adolescents continue to eat diets that do not meet the dietary guidelines. Thefollowing factors are important determinants of adolescent eating behaviour:
• peer-group norms that devalue healthy eating behaviour
• participation in other risky behaviours
• low competency—actual and perceived—in sports, food selection and foodpreparation
• familial and cultural expectations.88
Management of obesity
The National Health and Medical Research Council’s Acting on Australia’sWeight89 provides information about recognising and managing different types ofobesity during childhood and adolescence and about preventing nutritionalobesity. It stresses the need for full assessment of all children who appear to beobese, in order to obtain a diagnosis that adequately explains the obesity anddetermines the most suitable management strategy.
Inappropriate advice—such as a recommendation to participate in weight-lossprograms designed for adults—is likely to be not only harmful but alsoineffective. The most successful weight-reduction programs are those thatcombine diet and exercise within a framework of behaviour modification.50
Children should be encouraged to reduce their consumption of sweetenedbeverages86 and eat fewer high-fat snacks. Programs designed to reduce theamount of time engaged in sedentary activity—television watching, forexample—have been successful in reducing weight gain and improvingfitness.90,91
Social change
Some social trends can also influence the food preferences and intakes ofchildren and adolescents:
• the increasing number of meals bought and consumed outside the home.Children and adolescents, either as part of the family or independently,buy and consume foods from a wide variety of outlets, including childcarecentres and school canteens—see Chapter 3 for more discussion of this
• the many foods and beverages that now come into the home in ready-to-eat or convenience form. Packages of snack foods, biscuits and drinks areall easily accessible in the home
• working parents, increased use childcare facilities and the diversity ofcuisines available (including packaged and ready-to-eat meals).
37Dietary Guidelines for Children and Adolescents in Australia
2. CHILDREN & ADOLESCENTS NEED SUFFICIENT NUTRITIOUS FOODS TO GROW AND DEVELOP NORMALLY
R E L AT I O N S H I P TO OT H E R G U I D E L I N E S
This guideline on growth and development relates to almost all of the otherguidelines: a balanced, nutritious diet is the basis of healthy growth anddevelopment.
Encourage and support breastfeeding
Chapter 1 discusses failure to thrive in breastfed infants.
Include milks, yoghurts, cheeses and/or alternatives
Section 3.4 discusses the importance of adequate intakes of calcium and ofphysical activity in achieving peak bone mass.
C O N C L U S I O N
An appropriate diet and plenty of physical activity are essential for growth anddevelopment that optimise health during childhood, adolescence and the lateryears of life.
E V I D E N C E
There is Level III evidence of the relationship between foetal and perinatal nutritionand adult type 2 diabetes (reference 4), heart disease (references 3 and 4) andcognition (reference 6). There is Level II (ref 10) and Level III evidence for theeffect of calcium intakes and exercise throughout the development period onsubsequent bone density (references 7, 15 and 16; see also ‘Evidence’ inSection 3.4). There is also Level III evidence of the relationship between bodyfatness, inactivity and selected dietary factors in children (references 45, 47 and 91).
R E F E R E N C E S
1. Network of the Federal/Provincial/Territorial Group on Nutrition &National Institute of Nutrition. Promoting nutritional health during thepreschool years: Canadian guidelines. 1989.
2. Centers for Disease Control and Prevention. CDC growth charts: UnitedStates. Advance data. No. 314. 2000;1–28.
3. Forsen T, Eriksson J, Tuomilehto J, Osmond C, Barker D. Growth in uteroand during childhood among women who develop coronary heart disease:longitudinal study. BMJ 1999;319:1403–7.
38 Dietary Guidelines for Children and Adolescents in Australia
2. CHILDREN & ADOLESCENTS NEED SUFFICIENT NUTRITIOUS FOODS TO GROW AND DEVELOP NORMALLY
4. Harding JE. The nutritional basis of the foetal origins of adult disease. Int JEpid 2001;30:15–23.
5. Makrides M. Early childhood nutrition and cognitive outcome. Proc NutrSoc Aust 1998;22:216–22.
6. Richards M, Hardy R, Kuh D, Wadsworth MEJ. Birth weight and cognitivefunction in the British 1946 birth cohort: longitudinal population basedstudy. BMJ 2001;322:199–203.
7. Cooper C, Fall C, Egger P, Hobbs R. Growth in infancy and bone mass inlater life. Ann Rheum Dis 1997;56:17–21.
8. Loesch DZ, Stokes K, Huggins RM. Secular trend in body height andweight of Australian children and adolescents. Am J Phys Anthrop2000;111:545–56.
9. National Health and Medical Research Council. Recommended dietaryintakes for use in Australia. Canberra: Australian Government PublishingService, 1991.
10. Bonjour JP, Carrie AL, Ferrari S, Clavien H, Slosman D, Theintz G et al.Calcium enriched foods and bone mass in prepubertal girls. J Clin Invest1997;99:1287–94.
11. American Academy of Pediatrics. Calcium requirements of infants, children,and adolescents. Pediatrics 1999;104:1152–7.
12. Cavadini C, Siega-Riz AM, Popkin BM. US adolescent food intake trendsfrom 1965 to 1996. Arch Dis Child 2000;83:18–24.
13. Australian Bureau of Statistics. National Nutrition Survey: selectedhighlights, Australia, 1995. Canberra: ABS, 1997.
14. Australian Bureau of Statistics. Apparent Consumption of Foodstuffs, 1997–98 and 1998–99, Australia. Canberra: ABS, 2000.
15. Wyshak G, Frisch RE. Carbonated beverages, dietary calcium, the dietarycalcium/phosphorus ratio, and bone fractures in girls and boys. J AdolescHealth 1994;15(3):210–15.
16. Wyshak G. Teenaged girls, carbonated beverage consumption, and bonefractures. Arch Pediatr Adolesc Med 2000;154(6):610–13.
17. Dibley MJ, Goldsby JB, Staehling NW, Trowbridge FL. Development ofnormalized curves for the international growth reference: historical andtechnical considerations. Am J Clin Nutr 1987;46:736–48.
18. WHO Working Group. Use and interpretation of anthropometric indicatorsof nutritional status. Bull Wld Hlth Org 1986;64:929–41.
19. Hamill PVV, Drizd TA, Johnson CL, Reed RB, Roche AF, Moore WM.Physical growth: National Centre for Health Statistics percentiles. Am J ClinNutr 1979;32:607–29.
39Dietary Guidelines for Children and Adolescents in Australia
2. CHILDREN & ADOLESCENTS NEED SUFFICIENT NUTRITIOUS FOODS TO GROW AND DEVELOP NORMALLY
20. Ogden C, Kuczmarski R, Flegal K, Mei Z, Guo S, Wei R et al. Centers forDisease Control and Prevention 2000 growth charts for the United States:improvements to the 1977 National Center for Health Statistics version.Pediatrics 2002;109(1):45–60.
21. Dewey KG, Peerson JM, Brown KH, Krebs NF, Michaelsen KF, Persson LAet al. Growth of breast-fed infants deviates from current reference data: apooled analysis of US, Canadian and European data sets. Pediatrics1995;96: 495–503.
22. WHO Working Group on the Growth Reference Protocol. WHO WorkingGroup on the Growth Reference Protocol and WHO Task Force onMethods for the Natural Regulation of Fertility Growth Patterns ofBreastfed Infants in Seven Countries. Acta Paediatr 2000;89(2):215–22.
23. Binns CW. Infant feeding and growth. In: Ulijaszek SJ, Johnston FE, PreeceMA, eds. Cambridge encyclopedia of human growth and development.Cambridge: Cambridge University Press; 1998:320–9.
24. Smith RM, Smith PA, McKinnon M, Gracey M. Birthweights and growth ofinfants in five Aboriginal communities. ANZ J Pub Hlth 2000;24:124–35.
25. Grummer-Strawn L, Garza C, Johnson CL. Childhood growth charts.Pediatrics 2002;109:141–2.
26. Dietz WH, Bellizzi MC. Introduction: the use of body mass index to assessobesity in children. Am J Clin Nutr 1999;70(suppl.):123S–125S.
27. Cole TJ, Bellizi MC, Flegal KM, Dietz WH. Establishing a standarddefinition for child overweight and obesity worldwide: internationalsurvey. BMJ 2000;320:1240–3.
28. Booth M, Wake M, Armstrong T, Chey T, Hesketh K, Mathur S. Theepidemiology of overweight and obesity among Australian children andadolescents. ANZ J Pub Hlth 2001;25:162–9.
29. Hebebrand J, Himmelmann GW, Heseker H, Schafer H, Remschmidt H. Use ofpercentiles for the body mass index in anorexia nervosa: diagnostic,epidemiological and therapeutic considerations. Int J Eat Dis 1996;19:359–69.
30. Turner J, Forbes D, Mcdermott B, Martin C, Potts J, Palmer L et al. Use ofbody mass index (BMI) in the assessment of medical complications of girlswith eating disorders. J Paediatr Ch Hlth 1997;33:A35.
31. Lloyd T, Chinchilli VM, Johnson-Rollings N, Kieselhorst K, Eggli DF, MarcusR. Adult female hip bone density reflects teenage sports-exercise patternsbut not teenage calcium intake. Pediatrics 2000;106(1):40–4.
32. Zubrick S, Silburn S, Garton A et al. Western Australian Child HealthSurvey: Developing Health and Well-being in the Nineties. Perth: AustralianBureau of Statistics & Institute for Child Health Research, 1995.
33. Dietz WH, Gortmaker SL. Do we fatten our children at the TV set?Television viewing and obesity in children and adolescents. Pediatrics1985;75:807–12.
40 Dietary Guidelines for Children and Adolescents in Australia
2. CHILDREN & ADOLESCENTS NEED SUFFICIENT NUTRITIOUS FOODS TO GROW AND DEVELOP NORMALLY
34. Garaulet M, Martinez A, Victoria F, Perez-Llamas F, Ortega R, Zamora S.Differences in dietary intake and activity level between normal-weight andoverweight or obese adolescents. J Pediatr Gastro 2000;30:253–8.
35. Meredith CN, Dwyer JT. Nutrition and exercise: effects on adolescenthealth. Ann Rev Nutr 1991;12:309–33.
36. Gliksman M, Dwyer T, Wlodarczyk J. Differences in modifiablecardiovascular disease risk factors in Australian schoolchildren: the resultsof a nation-wide survey. Prev Med 1990;19:291–304.
37. Must A, Jacques PF, Dallal G, Bajema CJ, Dietz WH. Long-term morbidityand mortality of overweight adolescents. A follow-up of the HarvardGrowth Study of 1922 to 1935. N Eng J Med 1992;327:1350–5.
38. Paffenbarger RS, Hyde RT, Wing AL, Hsieh CC. Physical activity, all-causemortality and longevity of college alumni. N Eng J Med 1986;314:605–13.
39. Department of Health and Human Services. Physical activity and health: areport of the Surgeon General. Atlanta, GA: DHHS, Centers for DiseaseControl and Prevention & National Center for Chronic Disease Preventionand Health Promotion, 1996.
40. Department of Health and Aged Care. Developing an active Australia: aframework for action for physical activity and health. Canberra: DHAC,1998.
41. Tienboon P, Rustihauser I, Wahlqvist M. A family study of coronary riskfactors in Geelong. Aust J Pub Hlth 1992;16:20–5.
42. Shannon B, Peacock J, Brown M. Body fatness, television viewing andcalorie intake of a sample of Pennsylvania sixth grade children. J Nut Educ1991;23:262–8.
43. Williams TM, Handford AG. Television and other leisure activities. In:Williams T, ed. The impact of television: a natural experiment in threecommunities. New York: Academic Press; 1986:87–142.
44. Tucker LA. The relationship of television viewing to physical fitness andobesity. Adolescence 1986;21:797–806.
45. Crespo CJ, Smit E, Troiano RP, Bartlett SJ, Macera CA, Andersen RE.Television watching, energy intake, and obesity in US children: resultsfrom the third National Health and Nutrition Examination Survey, 1988–1994. Arch Ped Adol Med 2001;155:360–8.
46. Robinson TN. Reducing children’s television viewing to prevent obesity: arandomised controlled trial. JAMA 1999;282:1561–7.
47. American Academy of Pediatrics. Children, adolescents, and television(Statement RE0043). Pediatrics 2001;107(2):423–6.
48. Lazarus R, Wake M, Hesketh K, Waters E. Change in body mass index inAustralian primary school children, 1985–1997. Int J Obes Relat MetabDisord 2000;24(6):679–84.
41Dietary Guidelines for Children and Adolescents in Australia
2. CHILDREN & ADOLESCENTS NEED SUFFICIENT NUTRITIOUS FOODS TO GROW AND DEVELOP NORMALLY
49. Field AE, Colditx GA. Overweight, central adiposity, and cardiovasculardisease risk patterns in children. J Pediatr 1999;135:409–10.
50. Fruhbeck G. Childhood obesity: time for action, not complacency. BMJ2000;320:328–9.
51. Baughcum AE, Chamberlin LA, Deeks CM, Powers SW, Whitaker RC.Maternal perceptions of overweight preschool children. Pediatrics2000;106:1380–6.
52. Whitaker RC, Wright JA, Pepe MS, Seidel KD, Dietz WH. Predicting obesityin young adulthood from childhood and parental obesity. N Engl J Med1997;337:869–73.
53. Court JM. The development of obesity in childhood. Med J Aust1979;2:248–50.
54. Mossberg HO. Forty year follow-up of overweight children. Lancet1989;1:491–3.
55. Manton NN, Lipsett J, Moore DJ, Davidson GP, Bourne AJ, Couper RT.Non-alcholic steatohepatitis in children and adolescents. MJA2000;173:476–9.
56. Johnston FE. Health implications of childhood obesity. Annals Intern Med1985;103:1068–72.
57. Gracey M, Murray H, Hitchcock NE, Murphy BP. The nutrition of AustralianAboriginal infants and young children. Nut Res 1983;3:133–47.
58. National Health and Medical Research Council. Statement on obesity inchildhood and adolescence. Canberra: NHMRC, 1986.
59. Oates RK, Yu JS. Children with non-organic failure to thrive—a communityproblem. Med J Aust 1971;2:199–203.
60. Oates RK. Non-organic failure to thrive. Aust Paed J 1984;20:95–100.
61. Pugliese MT, Weyman-Daum M, Moses N, Lifshitz F. Parental health beliefsas a cause of non-organic failure to thrive. Paediatrics 1987;80:175–82.
62. Gustafson-Larson A, Terry RD. Weight-related behaviors and concerns offourth-grade children. JADA 1992;92:818–22.
63. O’Dea J. Poor body image and women: what are the adverse effects? Paperpresented at Fat or Fiction? National Conference on Dieting, Body Imageand Women’s Health. Sydney, July 1992.
64. Department of Community Services and Health. National dietary survey ofschoolchildren (aged 10–15 years), 1985. No. 2: nutrient intakes. Canberra:AGPS, 1989.
65. Black AE, Goldberg GR, Jebb SA, Livingstone MBE, Cole TJ, Prentice AM.Critical evaluation of energy intake data using fundamental principles ofenergy physiology. 2: evaluation of the results of published surveys. Eur JClin Nutr 1991;45:583–99.
42 Dietary Guidelines for Children and Adolescents in Australia
2. CHILDREN & ADOLESCENTS NEED SUFFICIENT NUTRITIOUS FOODS TO GROW AND DEVELOP NORMALLY
66. Centers for Disease Control. Body-weight perceptions and selected weightmanagement goals and practices of high school students—United States.JAMA 1990;266:2811–12.
67. Mellin LM, Irwin CE, Scully S. Prevalence of disordered eating in girls: asurvey of middle-class children. JADA 1992;92:851–3.
68. Crawford M, Selwood T. The nutritional knowledge of Melbourne highschool students. J Food Nutr 1983;40:25–34.
69. Abraham S, Mira M. Hazards of attempted weight loss. Med J Aust1988;148:324–5.
70. Worsley A, Worsley AJ, McConnon S, Silva P. The weight control practicesof 15 year old New Zealanders. J Paediatr Ch Hlth 1990;26:41–5.
71. Crawford DA, Worsley A. Dieting and slimming practices of SouthAustralian women. Med J Aust 1990;148:325–7, 330–1.
72. Ben-Tovim DI, Morton J. The epidemiology of anorexia nervosa in SouthAustralia. ANZ J Psych 1990;24:182–6.
73. Ben-Tovim DI, Subbiah N, Sachets B, Morton J. Bulimia: symptoms andsyndromes in an urban population. ANZ J Psych 1989;23:73–80.
74. Patton GC, Selzer R, Coffey C, Carlin JB, Wolfe R. Onset of adolescenteating disorders: population based cohort study over 3 years. BMJ1999;318:765–8.
75. O’Dea JA, Abraham S. Improving the body image, eating attitudes, andbehaviors of young male and female adolescents: a new educationalapproach that focuses on self- esteem. Int J Eat Dis 2000;28:43–57.
76. Paxton SJ. A prevention program for disturbed eating and bodydissatisfaction in adolescent girls: a 1 year follow-up. Hlth Educ Res1993;8:43–51.
77. Satter LM. The feeding relationship. JADA 1986;86:353–6.
78. Kilham H, Isaacs D, eds. The New Children’s Hospital handbook.Westmead: New Children’s Hospital, 1999.
79. Sigman-Grant M. Feeding preschoolers: balancing nutritional anddevelopmental needs. Nutr Today 1992;27:13–17.
80. Lewis J, Pollard C, Miller M. Recommendations for nutritionally adequatefood for children one to five years in long day care centres. Perth: WAHealth Department & School of Public Health, Curtin University, 1999.
81. Thompson SM. Fussy eaters: advising parents of toddlers. Mod Med1999;42(3):18–22.
82. Bray G. Afferent signals regulating food intake. Proc Nut Soc 2000;59:373–84.
83. Klesges RC, Stein RJ, Eck LH, Isbell TR, Klesges LM. Parental influence onfood selection in young children and its relationships to childhood obesity.Am J Clin Nutr 1991;53:859–64.
43Dietary Guidelines for Children and Adolescents in Australia
2. CHILDREN & ADOLESCENTS NEED SUFFICIENT NUTRITIOUS FOODS TO GROW AND DEVELOP NORMALLY
84. Rolls B. Food beliefs and food choices in adolescents. Med J Aust1988;148(suppl.):S9–S13.
85. Byrd-Bredbenner C, Grasso D. Health, medicine, and food messages intelevision commmercials during 1992 and 1998. J School Hlth 2000;70:61–5.
86. Pincus G. Food advertisements and nutrition. Paper presented atconference Children and Advertising: a fair game? Sydney, July 1994.
87. Kraak V, Pelletier DL. The influence of commercialism on the foodpurchasing behavior of children and teenage youth. Family Ec Nutr Rev1998;11:15–23.
88. Adams LB. An overview of adolescent eating behavior barriers toimplementing dietary guidelines. Annals of the New York Academy ofSciences 1997;817:36–48.
89. National Health and Medical Research Council. Acting on Australia’sweight. Canberra: NHMRC, 1997.
90. Epstein LH, Paluch RA, Gordy CC, Dorn J. Decreasing sedantary behaviorsin treating pediatric obesity. Arch Pediatr Adolesc Med 2000;154:220–6.
91. Gortmaker S, Cheung L, Peterson K, Chomitz G, Cradle J, Dart H et al.Impact of a school-based interdisciplinary intervention on diet andphysical activity among urban primary school children. Arch PediatrAdolesc Med 1999;153:975–83.
Dietary Guidelines for Children and Adolescents in Australia 45
3. ENJOY A WIDE VARIETY OF NUTRITIOUS FOODS
3 E N J OY A W I D E VA R I E T Y O FN U T R I T I O U S F O O D S
C o l i n B i n n s a n d M i K y u n g L e e
T E R M I N O L O G Y
Food variety
Food variety can be defined in terms of foods that are biologically diverse orfoods that are nutritionally distinct from each other. Eating a variety of nutritiousfoods means consuming different food types in appropriate amounts—asillustrated by the Australian Guide to Healthy Eating (see Figure 3.1)—to obtainall the required nutrients without excess energy intake.1 Variety further refers tochoosing a range of items from within each food group, particularly from theplant-based food groups (vegetables, fruits and cereals). Although variety is animportant nutritional principle, the evolution of modern sedentary society meansthat if variety is to be maintained a reduction in serving sizes needs to beconsidered, particularly for more energy dense foods with limited nutrientcontent (see ‘Practical aspects of this guideline’).
Nutritious foods
The term nutritious foods is used to describe foods that make a substantialcontribution to providing a range of nutrients, have an appropriate nutrientdensity, and are compatible with the overall aims of the dietary guidelines. Thenutrients that are essential for human life are found in varying amounts in manydifferent foods, and a varied diet is essential to obtain sufficient quantities of allrequired nutrients (known and not yet known), to increase consumption ofprotective factors (phytochemicals), and to minimise exposure to toxicants.
Weaning
The word weaning can confuse because it is used in various contexts in theliterature. In this guideline the term introduction of solids is used instead.
B A C K G R O U N D
Eating a wide variety of nutritious foods is important in childhood, when growthand maturation are occurring and future eating habits are being established.Variety is a primary factor in the development of lifelong healthy eatingbehaviours. Consumption of a wide variety of foods makes it less likely thatexcessive or inadequate amounts of any particular nutrient or other food
46 Dietary Guidelines for Children and Adolescents in Australia
3. ENJOY A WIDE VARIETY OF NUTRITIOUS FOODS
component will be consumed. Adolescence is a period of rapid growth andlifestyle changes, but it is also an important period for maintaining optimalnutrition. The first word of this guideline is enjoy, and eating should be anenjoyable activity for all children. Childhood is a time when an appreciation ofthe pleasures of good food can be developed, in a context of healthy nutrition.
Good eating habits begin in childhood. Parents and other caregivers can set anexample for children by offering a wide variety of foods, setting regular mealpatterns, and providing sufficient ‘training’ to establish good dietary behaviour.The word mother is often used in this guideline when referring to infants andyoung children. In all cases other than in connection with breastfeeding, parentor caregiver could be substituted.
S C I E N T I F I C B A S I S
Infants
In infants up to the age of 6 months, breastmilk universally provides the idealfood, meeting all nutritional requirements (for scientific rationale, see Section 1of this document and the accompanying Infant Feeding Guidelines for HealthWorkers). There is no universal model of feeding for older infants, but a growingnumber of studies provide guiding principles. Different cultures introducedifferent foods at different ages.
Introduction of solid foods
The expression introduction of solids describes the process whereby an infant,having previously been fed solely milk, gradually becomes accustomed to avariety of other foods until he or she can deal with the general family diet. Theexpression is preferable to weaning because it more accurately conveys the ideathat the process does not involve cessation of breastfeeding.2
Four main questions arise in connection with the introduction of solid foods:
• At what age should solid foods be introduced?
• What foods should be introduced?
• How should foods be introduced?
• How can the risk of infection be reduced?
When should solid foods be introduced?
Breastfeeding provides sufficient nutrients until around the age of 6 months formost infants. There is almost universal agreement that solids should not bestarted before the age of 4 months and that they should not be delayed muchbeyond the age of 6 months. Resolutions from the World Health Assembly in1990 and 1992 advise ‘4–6 months’, while a 1994 resolution recommends ‘about6 months’. In several more recent publications from WHO and UNICEF both
47Dietary Guidelines for Children and Adolescents in Australia
3. ENJOY A WIDE VARIETY OF NUTRITIOUS FOODS
expressions have been used. In a 1992 WHO review, Lutter3 concluded that thescientific basis for recommending 4–6 months was not adequately documented;in a 1998 WHO report on complementary feeding in developing countries, it wasrecommended that full-term infants be exclusively breastfed to about 6 monthsof age.4 A number of observational studies and two randomised trials have notidentified any benefits from the introduction of solid foods before the age of 6months.4–6
The debate about the timing and extent of exposure to complementary foodsfocuses on immune function, the acquisition of immuno-tolerance, and thefunctional imprinting of intestinal function, its microflora and systemicmetabolism.7
In the past when the term 4–6 months has been used, some mothers may havefelt that their child was more advanced and introduced solids at an earlier age.Using 6 months promotes an improved public health outcome. In 1999 the WHOEuropean Region Division summarised the recent thinking thus:
All infants should be exclusively breastfed from birth to about 6 months ofage, and at least for the first 4 months of life. Breastfeeding shouldpreferably continue beyond the first year of life, and in populations withhigh rates of infection continued breastfeeding throughout the second yearand longer is likely to benefit the infant.8
In 2001 the report of a WHO Expert Consultation recommended exclusivebreastfeeding for about 6 months, with the introduction of complementary foodsand continued breastfeeding thereafter <www.who.int>. The 2001 World HealthAssembly brought together these various recommendations in one resolutionrecommending exclusive breastfeeding until 6 months of age.
Six months of age is a suitable time for most infants to begin to adapt todifferent foods, food textures and modes of feeding.9 Gradual inclusion of solidfoods allows an infant to become used to different foods and textures. Sixmonths of age has been identified as a time when:
• An infant’s appetite and nutritional requirements are generally no longersatisfied by breastmilk or infant formula alone.10,11 At this time stores ofseveral nutrients—for example, iron and zinc—are often falling inexclusively milk-fed infants (both breast- and formula-fed).11 Iron status isa particular concern; it is discussed in detail in Section 3.3.
• The development of feeding behaviour has progressed from sucking tobiting—and, by 7–9 months, chewing.10 This is attributable to thedisappearance of the tongue-extrusion reflex2,12 and the infant’s increasingability to sit without support, which allows greater manipulation of foodbefore swallowing, so that thicker foods can be handled.9,12,13
• The digestive system matures. An infant’s digestive system cannot copewith foods other than milk in the early months. Salivary amylases arepresent at birth, but it appears that pancreatic amylases are essentiallyabsent up to at least 3 months of age and remain inadequate up to 6
48 Dietary Guidelines for Children and Adolescents in Australia
3. ENJOY A WIDE VARIETY OF NUTRITIOUS FOODS
months. As a result, the ability to digest starches is limited, if not absent,until the middle of the first year of life.2
• Most infants have developed an interest in their environment, and thisprompts a willingness to accept new textures and flavours. It is useful toexploit this exploratory phase by gradually introducing new food tastesand textures.
Cultural, social and medical factors also appear to influence the age at whichsolids are introduced. Different cultures have their own traditions about whatfood is most suitable to begin with, and culturally appropriate foods andpreparation methods should be encouraged when they are nutritionallyadequate.
Introducing solid foods too soon can lead to several problems:
• If less time is spent on the breast, maternal milk production may declinebecause of reduced stimulation. In extreme cases under-nutrition couldresult.14
• If solid foods are introduced before an infant is developmentally ready—while the tongue-extrusion reflex is still strong—the infant will reject thespoon (a hard object). The mother might then feel that the infant isrejecting the food, when in fact it is rejecting the object placed in itsmouth. Early introduction of foods does not lead to earlier loss of thetongue-extrusion reflex: it just prolongs the length of introduction.
• Food allergies can develop.
• Exposure to pathogens present in foods can cause increased rates ofdiarrhoeal diseases and other problems.
Introducing solid foods too late can also cause problems:
• Growth can falter because breastmilk alone is insufficient after 6 months.
• Immune protection can be compromised.
• Micronutrient deficiencies—especially of iron and zinc—can developbecause of breastmilk’s inability to meet requirements.
• Optimal development of motor skills such as chewing can be delayed andthe infant may be unwilling to accept new tastes and textures.
Although exclusive breastfeeding to 6 months of age is recommended, moreexperience is needed to identify any subgroups that require earlier introductionof solids (but never before 4 months).15 Six months should be regarded as agroup recommendation.
A longitudinal study of 506 Swedish infants showed how long it can take tointroduce solid foods. Infants took a median of 28 days from the firstintroduction of solids to consumption of more than 10 millilitres daily; it was 46days before the infants ate 100 millilitres of solids in one day for the first time.Most infants in this study were given solids at ages between 4 and 6 months. Theyounger the infant was at the time of introduction of solids, the longer it took tointroduce them.16 Delaying the introduction of solids until 6 months willconsiderably shorten this period.
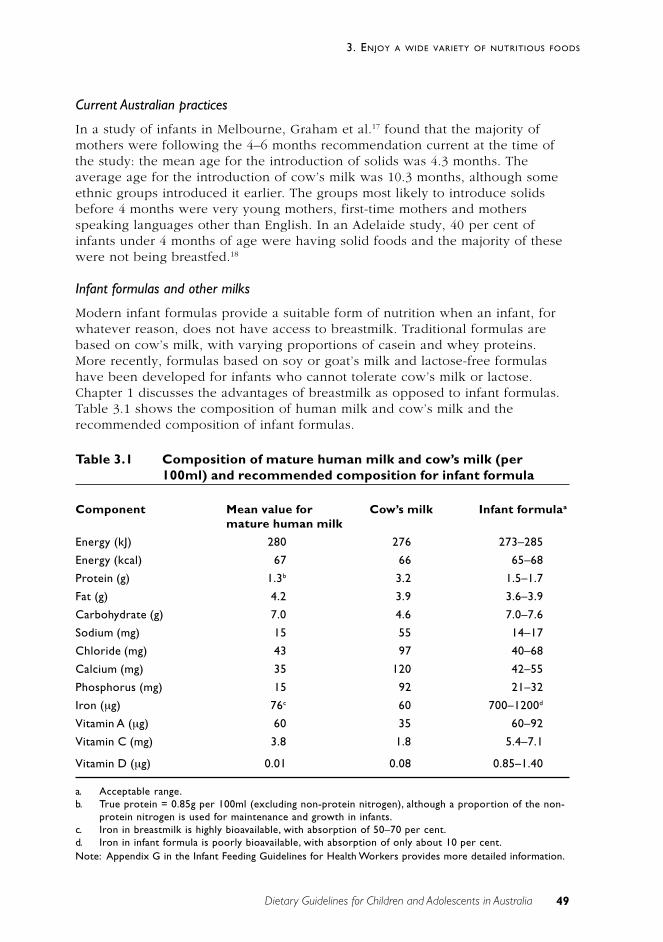
49Dietary Guidelines for Children and Adolescents in Australia
3. ENJOY A WIDE VARIETY OF NUTRITIOUS FOODS
Current Australian practices
In a study of infants in Melbourne, Graham et al.17 found that the majority ofmothers were following the 4–6 months recommendation current at the time ofthe study: the mean age for the introduction of solids was 4.3 months. Theaverage age for the introduction of cow’s milk was 10.3 months, although someethnic groups introduced it earlier. The groups most likely to introduce solidsbefore 4 months were very young mothers, first-time mothers and mothersspeaking languages other than English. In an Adelaide study, 40 per cent ofinfants under 4 months of age were having solid foods and the majority of thesewere not being breastfed.18
Infant formulas and other milks
Modern infant formulas provide a suitable form of nutrition when an infant, forwhatever reason, does not have access to breastmilk. Traditional formulas arebased on cow’s milk, with varying proportions of casein and whey proteins.More recently, formulas based on soy or goat’s milk and lactose-free formulashave been developed for infants who cannot tolerate cow’s milk or lactose.Chapter 1 discusses the advantages of breastmilk as opposed to infant formulas.Table 3.1 shows the composition of human milk and cow’s milk and therecommended composition of infant formulas.
Table 3.1 Composition of mature human milk and cow’s milk (per100ml) and recommended composition for infant formula
Component Mean value for Cow’s milk Infant formulaa
mature human milk
Energy (kJ) 280 276 273–285
Energy (kcal) 67 66 65–68
Protein (g) 1.3b 3.2 1.5–1.7
Fat (g) 4.2 3.9 3.6–3.9
Carbohydrate (g) 7.0 4.6 7.0–7.6
Sodium (mg) 15 55 14–17
Chloride (mg) 43 97 40–68
Calcium (mg) 35 120 42–55
Phosphorus (mg) 15 92 21–32
Iron (µg) 76c 60 700–1200d
Vitamin A (µg) 60 35 60–92
Vitamin C (mg) 3.8 1.8 5.4–7.1
Vitamin D (µg) 0.01 0.08 0.85–1.40
a. Acceptable range.b. True protein = 0.85g per 100ml (excluding non-protein nitrogen), although a proportion of the non-
protein nitrogen is used for maintenance and growth in infants.c. Iron in breastmilk is highly bioavailable, with absorption of 50–70 per cent.d. Iron in infant formula is poorly bioavailable, with absorption of only about 10 per cent.Note: Appendix G in the Infant Feeding Guidelines for Health Workers provides more detailed information.
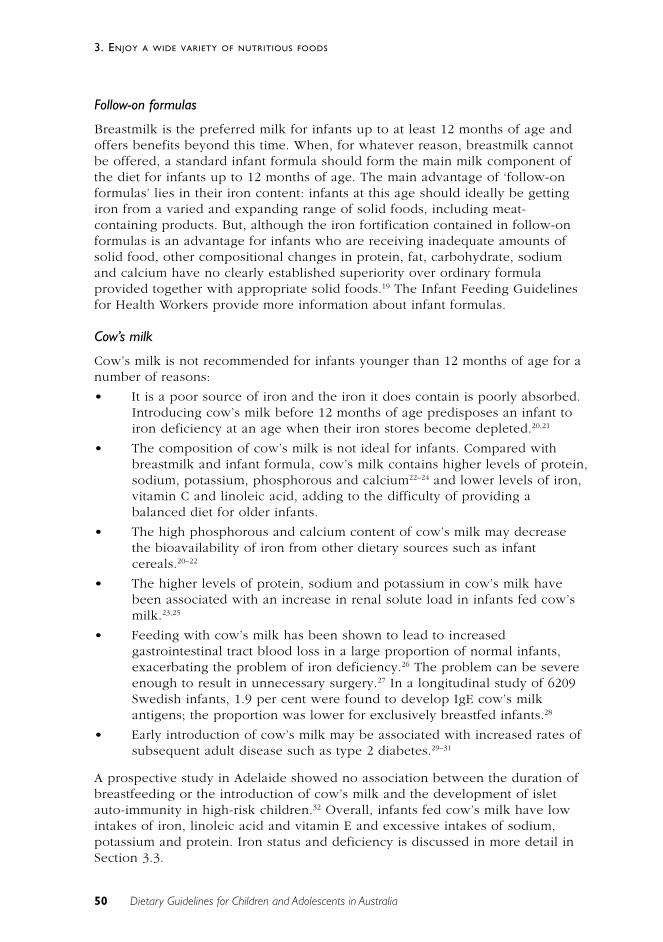
50 Dietary Guidelines for Children and Adolescents in Australia
3. ENJOY A WIDE VARIETY OF NUTRITIOUS FOODS
Follow-on formulas
Breastmilk is the preferred milk for infants up to at least 12 months of age andoffers benefits beyond this time. When, for whatever reason, breastmilk cannotbe offered, a standard infant formula should form the main milk component ofthe diet for infants up to 12 months of age. The main advantage of ‘follow-onformulas’ lies in their iron content: infants at this age should ideally be gettingiron from a varied and expanding range of solid foods, including meat-containing products. But, although the iron fortification contained in follow-onformulas is an advantage for infants who are receiving inadequate amounts ofsolid food, other compositional changes in protein, fat, carbohydrate, sodiumand calcium have no clearly established superiority over ordinary formulaprovided together with appropriate solid foods.19 The Infant Feeding Guidelinesfor Health Workers provide more information about infant formulas.
Cow’s milk
Cow’s milk is not recommended for infants younger than 12 months of age for anumber of reasons:
• It is a poor source of iron and the iron it does contain is poorly absorbed.Introducing cow’s milk before 12 months of age predisposes an infant toiron deficiency at an age when their iron stores become depleted.20,21
• The composition of cow’s milk is not ideal for infants. Compared withbreastmilk and infant formula, cow’s milk contains higher levels of protein,sodium, potassium, phosphorous and calcium22–24 and lower levels of iron,vitamin C and linoleic acid, adding to the difficulty of providing abalanced diet for older infants.
• The high phosphorous and calcium content of cow’s milk may decreasethe bioavailability of iron from other dietary sources such as infantcereals.20–22
• The higher levels of protein, sodium and potassium in cow’s milk havebeen associated with an increase in renal solute load in infants fed cow’smilk.23,25
• Feeding with cow’s milk has been shown to lead to increasedgastrointestinal tract blood loss in a large proportion of normal infants,exacerbating the problem of iron deficiency.26 The problem can be severeenough to result in unnecessary surgery.27 In a longitudinal study of 6209Swedish infants, 1.9 per cent were found to develop IgE cow’s milkantigens; the proportion was lower for exclusively breastfed infants.28
• Early introduction of cow’s milk may be associated with increased rates ofsubsequent adult disease such as type 2 diabetes.29–31
A prospective study in Adelaide showed no association between the duration ofbreastfeeding or the introduction of cow’s milk and the development of isletauto-immunity in high-risk children.32 Overall, infants fed cow’s milk have lowintakes of iron, linoleic acid and vitamin E and excessive intakes of sodium,potassium and protein. Iron status and deficiency is discussed in more detail inSection 3.3.
51Dietary Guidelines for Children and Adolescents in Australia
3. ENJOY A WIDE VARIETY OF NUTRITIOUS FOODS
Given all these factors, cow’s milk is not recommended for use as the mainsource of milk for infants aged less than 12 months. Small amounts of cow’s milkin foods such as breakfast cereal, yoghurt, cheese and custards that are preparedfor the rest of the family can, however, be given after about 9 months.
P R A C T I C A L A S P E C T S O F T H I S G U I D E L I N E
Infants
In terms of the practicalities of this guideline as it relates to infants, thequestions of what foods to introduce and how to introduce them arise.
What foods should be introduced?
Generally, in Australia the introduction of solid foods starts with iron-enrichedinfant cereals at about 6 months. Vegetables, fruits, meats, poultry and fish arethen added gradually. There are no set rules about the order in which the lattergroup should be introduced. Nutrient content is most important; anotherimportant determinant is the food’s texture. The foods that are introduced shouldbe of high nutrient density. Fruit and vegetable purees are of low energy density,and choices should be varied even at this early age to ensure adequate energyand nutrient supply. An increasing range and quantity of foods should be offeredas the infant moves towards 12 months of age. Table 3.2 shows examples offoods suited to an infant’s developmental stages.
Solid foods should provide an increasing proportion of the energy intakebecause infants continue to grow rapidly during this time. Variety is likely tomeet the need for most nutrients and provide a basis for healthy eating habits.By the end of the first year of life, an infant should be consuming a wide varietyof family foods, having progressed from pureed or mashed foods to foods thatare chopped into small pieces.2,12
52 Dietary Guidelines for Children and Adolescents in Australia
3. ENJOY A WIDE VARIETY OF NUTRITIOUS FOODS
Table 3.2 Developmental stages and examples of foods8,33
Age (months) Reflexes and skills Types of food Examples of foods thatcan be consumed
0–6 Suckling, sucking and Liquids Breastmilkswallowing
6–7 (if needed Appearance of early Pureed foods Start with gluten-freeearlier, not before chewing cereals (e.g. rice), then4 months) Increased strength of suck add other foods such
Movement of gag reflex as vegetable (e.g. carrot)from mid to posterior third and fruit (e.g. apple,
banana) purees, mashedpotato, and well-cookedpureed liver and meatToast fingers, rusks
8–12 Clearing spoon with lips Mashed or chopped Well-cooked fish, mincedBiting and chewing foods and finger foods liver and meatLateral movements of Interested in an Mashed cooked vegetablestongue and movement extended range of and fruitof food to teeth foods and textures Chopped raw fruit and
vegetables (e.g. banana,melon, tomato)Egg yolk, cereals (e.g. wheat,oats), bread, pasta, cheese,custards, yoghurt
From 12 months Rotary chewing Family foods Plain pasteurised milkmovementJaw stability
Note: Table shows the types of food that can be consumed and swallowed successfully; it does notnecessarily show precisely when they should be offered.
If there is a strong history of family allergy, introduction of cheese, yoghurt, ice-cream, fish and wheat cereal should be delayed until 12 months of age. If thereis a strong history of peanut allergy, peanut products (including peanut butter)should be avoided until after 3 years of age. Peanut allergy is common and canbe very severe. Peanut allergan can be found in breastmilk, and if there is afamily history of peanut allergy breastfeeding mothers should avoid peanuts.34
How should foods be introduced?
The following are general recommendations for the introduction of foods:
• Foods should be introduced individually, and no salt, sugar or otherflavourings should be added. Water, breastmilk or infant formula can bemixed with cereals. If cow’s milk is used at all, only small amounts of itshould be used for mixing with foods.2
• Initially, new foods should be offered no more often than each five to 10days, to avoid confusion and rule out the (remote) possibility of foodallergy or sensitivity.2,9,11
53Dietary Guidelines for Children and Adolescents in Australia
3. ENJOY A WIDE VARIETY OF NUTRITIOUS FOODS
• Once most foods have been successfully introduced, the types of foodsoffered should be changed frequently. This helps to ensure that the infantreceives a good balance of nutrients. It may also play a part in theirchoosing a broader range of foods later on. Using family foods will helpthe child become used to eating like the rest of the family.9
• Care should be taken early on to choose foods of a texture that is suitablefor the child’s age and stage of development.9 Small, hard pieces of food,such as nuts and seeds, should be avoided because they can be inhaledand cause choking.35 In the absence of allergy, however, nut pastes can begiven.
• Persistence may be required; in one study infants given 10 opportunities totry foods increased their acceptance.
The first foods introduced should be soft and smooth-textured. An infant willquickly learn to cope with foods of different textures and will accept food thathas been mashed with a fork or minced. It is important at this stage to encouragethe infant to chew. Once they are able to hold things, ‘finger foods’ such aspieces of fruit, vegetables and bread can be offered. Other foods, such as meats,can be chopped into small pieces. Feeding bottles are best used only forbreastmilk or infant formula. ‘Comfort sucking’ on a bottle can become a habitthat is hard to reverse. Feeding cups or lidded cups are preferred for liquidsother than breastmilk or formula from 6 months of age.
Foods that are unsuitable or that should be used with care
A number of foods are unsuitable for infants or should be used with care. Amongthem are honey, tea, nuts, fruit juices and reduced-fat milks.
Honey
Honey can contain the spores of Clostridium botulinum and—unless it has beencarefully sterilised during processing—has been prohibited in foods for infants inAustralia for many years. After the age of 12 months, children are lesssusceptible to this bacterium.37,38
Tea
Tea contains tannins and other compounds that bind iron and other minerals,thereby reducing their bioavailability. Furthermore, sugar is often added to tea,which increases the risk of dental caries.
Nuts
Foods such as nuts pose a problem for small children because of the risk ofinhalation and choking. In addition, peanuts present a risk of allergy: it isestimated that 0.6 per cent of the US population (that is, 1.6 million people)suffer from peanut allergy.34 Nut pastes are in common use, however, forchildren who do not come from atopic families.
54 Dietary Guidelines for Children and Adolescents in Australia
3. ENJOY A WIDE VARIETY OF NUTRITIOUS FOODS
Fruit juices
Fruit juices produced from compressed fruit contain all the nutrients present infruits but not the dietary fibre. Historically, fruit juices have been given tochildren to prevent vitamin C deficiency and scurvy.
An Adelaide study found that, in addition to milk, fruit juice and water were themain fluids given to infants aged less than 8 months.18 This was especially thecase for non-breastfed infants. Eighty-five per cent of the infants drinking juicehad started to do so by the age of 6 months.
In spite of this, fruit juice offers no nutritional benefits to infants under 6 monthsof age and its consumption may lead to a reduced nutrient intake frombreastmilk. After 6 months, consumption of whole fruit is recommendedinstead.39 Fruit juices are suitable for children in modest quantities, but excessiveconsumption by young children has been associated with gastrointestinalsymptoms, failure to thrive, decreased appetite and loose stools.40–42 If pure fruitjuice is given to infants, it can be diluted with an equal amount of water. Fruitjuices that are commercially prepared for infants and young children haveusually been already diluted to less than 4 per cent total sugars. For olderchildren and adolescents, questions about sugar-containing drinks and the risk ofobesity arise. Milk drinks or water are good substitutes.
The following recommendations apply to the use of fruit juice39:
• Juice should not be introduced into the diet of infants before 6 months ofage.
• Infants should not be given juice from bottles or easily transportablecovered cups that allow them to consume juice easily throughout the day.
• Infants should not be given juice at bedtime.
• For children aged 1 to 6 years, the intake of fruit juice should be limited toabout 150 millilitres a day. For children aged 7 to 18 years, juice intakeshould be limited to 240–360 millilitres a day (two servings a day).
• Children should be encouraged to eat whole fruits to meet theirrecommended daily fruit intake.
Reduced-fat milks
In Australia reduced-fat milks are recommended for older children and for alladults as part of a healthy diet. They are not generally recommended for veryyoung children. In the United Kingdom, for example, semi-skimmed milk is notnormally recommended before the age of 2 years, and fully skimmed milk is notrecommended until a child is more than 5 years old.43 (See Sections 3.4 and 3.6for a more detailed discussion.)
By the time children reach 2 years of age they can share in the reduced-fat dairyproducts consumed by the rest of the family.
55Dietary Guidelines for Children and Adolescents in Australia
3. ENJOY A WIDE VARIETY OF NUTRITIOUS FOODS
Summary
A number of recommendations have been made to help parents meet thenutritional needs of breastfed infants and young children aged 6 months to 2years:44
• Continue to breastfeed as often as the infant desires—to avoiddisplacement of breastmilk by complementary foods and to maximisenutrients and immunological benefits.
• Aim for a variety of complementary foods—fruit, vegetables, meat, fish,poultry and eggs. Iron-fortified infant cereals are good sources of iron.Iron in meat is bioavailable, and meat is also a good source of zinc andvitamin B
12.
• The best source of calcium is dairy products, although cow’s milk shouldgenerally be avoided before 12 months.
• Avoid too much fruit juice—a maximum of 120 millilitres a day before 12months and 240 millilitres a day after 12 months.
• Seek advice if the infant’s appetite, growth or developmental milestonesare impaired and further assessment is required.
• Infants eating a balanced, varied diet do not usually require nutritionalsupplements. Low-birthweight infants are an exception to this.
• Meals are to be enjoyed. Parents who model enjoyment of good dietarypractices set the scene for good nutrition throughout childhood andbeyond.
• Reduce the risk of infection. Attention to food hygiene is very importantwhen preparing foods for infants and children. See Chapter 4 for moredetails.
Children
Toddlers and preschoolers
As discussed in Chapter 2, the period between a child’s first and fifth birthdays isa time of rapid social, intellectual and emotional growth.45 It is also characterisedby a slowdown in the child’s growth rate, which may be reflected in a lessreliable appetite. In addition, at this age children are discovering theirindependence and testing their choice in food selection, and this can lead toreduced interest in eating what the rest of the family eats.
These factors combine to give the impression that some younger children are‘poor’, ‘difficult’ or ‘fussy’ eaters.45 Generally, this does not compromise normalgrowth or health, but if additional constraints are placed on the diet—such as theapplication of restrictive diets (including cholesterol-lowering diets) and theexclusion of particular foods for some reason—nutritional deficiencies can occur.
It is typical for children of this age to exhibit enormous variation in the amountof food they eat at different meal times. However, although their intake variesfrom meal to meal, their daily energy intake is relatively constant because they
56 Dietary Guidelines for Children and Adolescents in Australia
3. ENJOY A WIDE VARIETY OF NUTRITIOUS FOODS
adjust their energy intake at successive meals.46 Food intake also varies greatlybetween individuals.45
To grow normally, toddlers and preschoolers must regularly consume adequateamounts of energy. Caregivers should be reassured that a child’s perceived‘erratic’ eating behaviour is not unusual for this age and that the best way ofdealing with the situation is to offer and encourage consumption of a widevariety of foods. A number of diets that are recommended for and consumed byadults in the interest of good health may be unsuitable for young children. Thisapplies particularly to inadequate intakes of fat for this age group—seeSection 3.6 for details. Good eating habits begin at home, but considerationshould also be given to foods consumed outside the home.
Many children in this age group are being cared for outside the home in avariety of settings—by relatives or family friends or in day-care centres(including long day–care centres). In 1996, 177 700 children attended long day–care centres in Australia; when compared with the 113 100 children in 1990, thisis a 36 per cent increase.47,48
In two separate studies, weight records were used to determine whether longday–care centres were meeting the 50 per cent of the recommended dietaryintakes for nutrients advised by the New South Wales Department of Health.With the exception of energy, iron, calcium and zinc, both studies showed thatthe nutrient content of the food served in the centres met the department’sguidelines.49,50 A survey of all 330 long day–care centres in Western Australiaresulted in a series of recommendations to improve nutrition and food safety.51 Ina further study, involving children attending long day–care centres and a controlgroup of non-attending children, three-day weighed food intake records werecollected for each child in order to determine the nutrient intake provided byfood in the different care environments. The results showed no statisticallysignificant difference in the total daily intake of energy, protein andcarbohydrate between the two groups of children.52 The authors concluded thatthe current recommendation that children receive 50 per cent of therecommended dietary intakes at long day–care centres should stand.
School children
The period between a child’s fifth birthday and the onset of puberty ischaracterised by slow, steady growth. Thus, all a child’s nutritional needs shouldbe met by the continued consumption of a wide variety of foods, the amountsconsumed being increased gradually to meet increasing energy needs.
Two important considerations apply to this age group:
• School children select and consume food without supervision. Unlikepreschoolers, whose food consumption is determined and supervised bycaregivers, school children experience new-found independence in foodconsumption, and at times food selection, for at least one meal of the day.This is also an age at which children often earn pocket money, whichprovides them with the means to buy foods they find desirable. A variety
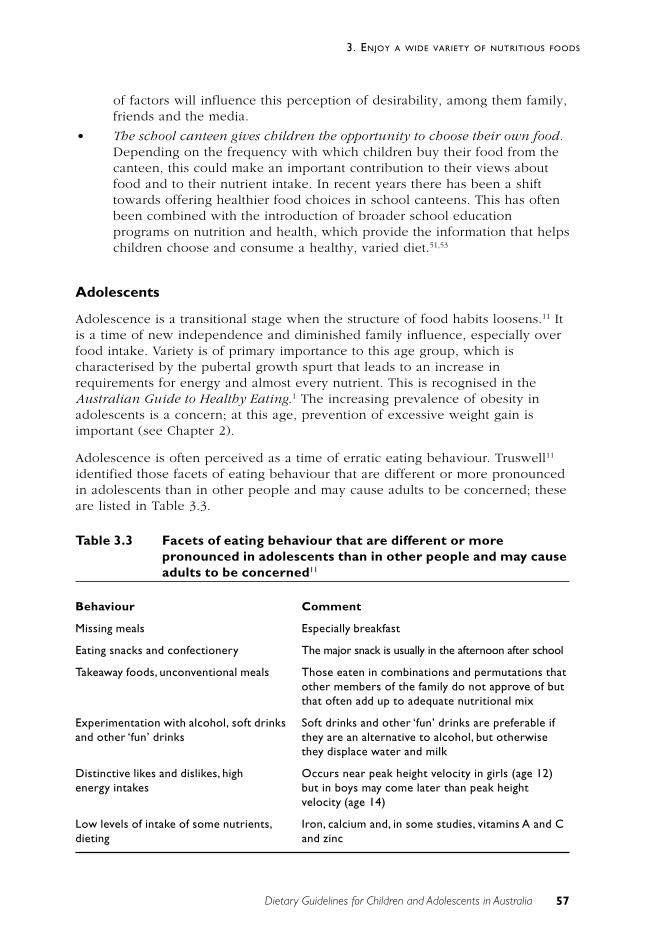
57Dietary Guidelines for Children and Adolescents in Australia
3. ENJOY A WIDE VARIETY OF NUTRITIOUS FOODS
of factors will influence this perception of desirability, among them family,friends and the media.
• The school canteen gives children the opportunity to choose their own food.Depending on the frequency with which children buy their food from thecanteen, this could make an important contribution to their views aboutfood and to their nutrient intake. In recent years there has been a shifttowards offering healthier food choices in school canteens. This has oftenbeen combined with the introduction of broader school educationprograms on nutrition and health, which provide the information that helpschildren choose and consume a healthy, varied diet.51,53
Adolescents
Adolescence is a transitional stage when the structure of food habits loosens.11 Itis a time of new independence and diminished family influence, especially overfood intake. Variety is of primary importance to this age group, which ischaracterised by the pubertal growth spurt that leads to an increase inrequirements for energy and almost every nutrient. This is recognised in theAustralian Guide to Healthy Eating.1 The increasing prevalence of obesity inadolescents is a concern; at this age, prevention of excessive weight gain isimportant (see Chapter 2).
Adolescence is often perceived as a time of erratic eating behaviour. Truswell11
identified those facets of eating behaviour that are different or more pronouncedin adolescents than in other people and may cause adults to be concerned; theseare listed in Table 3.3.
Table 3.3 Facets of eating behaviour that are different or morepronounced in adolescents than in other people and may causeadults to be concerned11
Behaviour Comment
Missing meals Especially breakfast
Eating snacks and confectionery The major snack is usually in the afternoon after school
Takeaway foods, unconventional meals Those eaten in combinations and permutations thatother members of the family do not approve of butthat often add up to adequate nutritional mix
Experimentation with alcohol, soft drinks Soft drinks and other ‘fun’ drinks are preferable ifand other ‘fun’ drinks they are an alternative to alcohol, but otherwise
they displace water and milk
Distinctive likes and dislikes, high Occurs near peak height velocity in girls (age 12)energy intakes but in boys may come later than peak height
velocity (age 14)
Low levels of intake of some nutrients, Iron, calcium and, in some studies, vitamins A and Cdieting and zinc
58 Dietary Guidelines for Children and Adolescents in Australia
3. ENJOY A WIDE VARIETY OF NUTRITIOUS FOODS
There are two matters of particular concern in adolescence: dieting and concernsabout body image (discussed in Chapter 2) and pregnancy.
Pregnancy in adolescence
Adolescence is a period of high nutrient needs, and dietary intakes below therecommended amounts are commonly reported for both pregnant and non-pregnant adolescent girls.54 Nutrient demands are higher and the consequencesof inadequate nutrition more serious for pregnant adolescents than they are forpregnant adults. In particular, pregnant adolescents face increased risks of pre-eclampsia, low-birthweight infants and perinatal infant death.55
Studies of the individual effects of maternal factors—socio-economic andbehavioural factors, reproductive maturity, maternal emotional stress, nutritionaldeficiencies, and so on—on birthweight indicate that maternal weight gain is oneof the most important indicators of infant birthweight, especially amongadolescents.56 It has been proposed that encouraging adolescents to gain moreweight than the standard recommendation of 9 to 14 kilograms during pregnancymay be one way of decreasing their risk of delivering low-birthweight infants.This proposal is based on an assumption that, compared with adult mothers,adolescent mothers may need to gain more weight during pregnancy becausethey might still be growing and have nutritional requirements that compete withand pre-empt those of the foetus. This concept is, however, controversial: it isnot known whether adolescents continue to grow during pregnancy.56
Deficient intakes of iron, calcium, zinc, vitamins A and C and folate arecommonly reported to be of concern in the diets of pregnant adolescents.56,57
This would appear to reflect inadequate intakes of fruit, vegetables, cereals anddairy products. Deficiencies of iron and folate increase the risk of anaemiaduring pregnancy and are associated with a higher risk of low birthweight.Additionally, the reported low intakes of folate are of concern given therelationship between low intakes of dietary folate and the higher risk of neuraltube defects such as spina bifida.58 Because these deficiencies have beenreported to occur with increased frequency in adolescent pregnancies, it hasbeen suggested that a safer and more appropriate way of reducing the incidenceof low-birthweight deliveries among adolescents would be to deal with thesespecific nutritional deficiencies rather than aim to increase total maternal weightgain.56
There is limited evidence to suggest that adolescents improve the quality of theirdiets during pregnancy. Skinner and Carruth54 compared dietary data fromdifferent groups of pregnant and non-pregnant adolescents and found that theformer group consumed more milk and dairy products, citrus fruits and juices; itwas suggested that these foods substituted for carbonated beverages and tea andcoffee. Pregnant adolescents also consumed more breads, cereals, vegetables andconfectionery. The study did not, however, measure the actual changes thatadolescents make to their diets once they become pregnant.
59Dietary Guidelines for Children and Adolescents in Australia
3. ENJOY A WIDE VARIETY OF NUTRITIOUS FOODS
Nutrition supplements
Vitamin and mineral supplements are not necessary for healthy, full-term infantsor children.9 The only exception to this may be fluoride for children living inareas without fluoridated water.
If infant formula is used, it is assumed that the formula will be prepared usingfluoridated water. Where fluoridated water is not available the fluoride contentof the formula is consequently lower. In the absence of fluoridated water or ifbottled water is used to prepare feeds, further supplementation will berequired.59
Special diets
Vegetarianism
A vegetarian diet that is adequate for adults is not necessarily suitable for infantsand young children, who face constraints such as limited stomach capacity andhigher needs for nutrients per unit weight.60 Each diet must be assessedseparately for its suitability for children; if the regimen is very restrictive in termsof the type and amount of animal proteins consumed, it is essential to plan a dietcarefully so as to avoid deficiencies.60 In general, lacto-vegetarian and lacto-ovo-vegetarian diets provide adequate nutrition if they are properly planned. Vegandiets pose a risk if care is not taken to ensure that the diet provides adequateenergy, vitamin B
12, protein and iron.60,61 Plant foods can provide some iron and
zinc, albeit with lower bioavailability, but vitamin B12 is found only in animal
products. Chapter 1 discusses the vitamin B12
status of vegan mothers and itseffect on the B
12status of breastfed infants.
Food allergy and intolerance
The subject of food and drink allergies in children has received widespreadattention in recent years. This has resulted in a number of misconceptions aboutthe manifestations and incidence of such disorders and the use of eliminationdiets.62 The National Health and Medical Research Council62 recommends asfollows:
• The diagnosis of a food or drink allergy can only be based on areproducible response to a controlled challenge with the suspectedallergen, following an adequate period of exclusion (at least 1 week).
• The relationship between behaviour and food allergies is unclear. Thereliance on dietary manipulation as an initial step in the management ofbehavioural problems may delay the use of more appropriate strategiesand exacerbate the problem.
• There are no laboratory tests on which to base a diagnosis of foodallergy. It is inappropriate to undertake the management of children onthe basis of laboratory test results alone without consideration of aproperly supervised clinical challenge with suspected foods.
• Foods should only be eliminated from the diet after these diagnosticprocedures have been carried out.
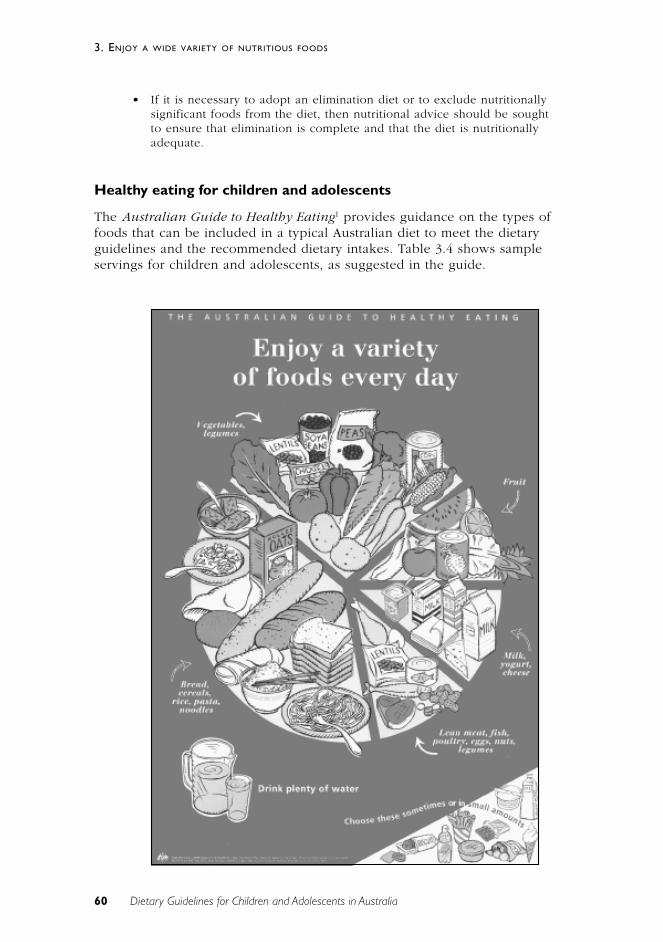
60 Dietary Guidelines for Children and Adolescents in Australia
3. ENJOY A WIDE VARIETY OF NUTRITIOUS FOODS
• If it is necessary to adopt an elimination diet or to exclude nutritionallysignificant foods from the diet, then nutritional advice should be soughtto ensure that elimination is complete and that the diet is nutritionallyadequate.
Healthy eating for children and adolescents
The Australian Guide to Healthy Eating1 provides guidance on the types offoods that can be included in a typical Australian diet to meet the dietaryguidelines and the recommended dietary intakes. Table 3.4 shows sampleservings for children and adolescents, as suggested in the guide.
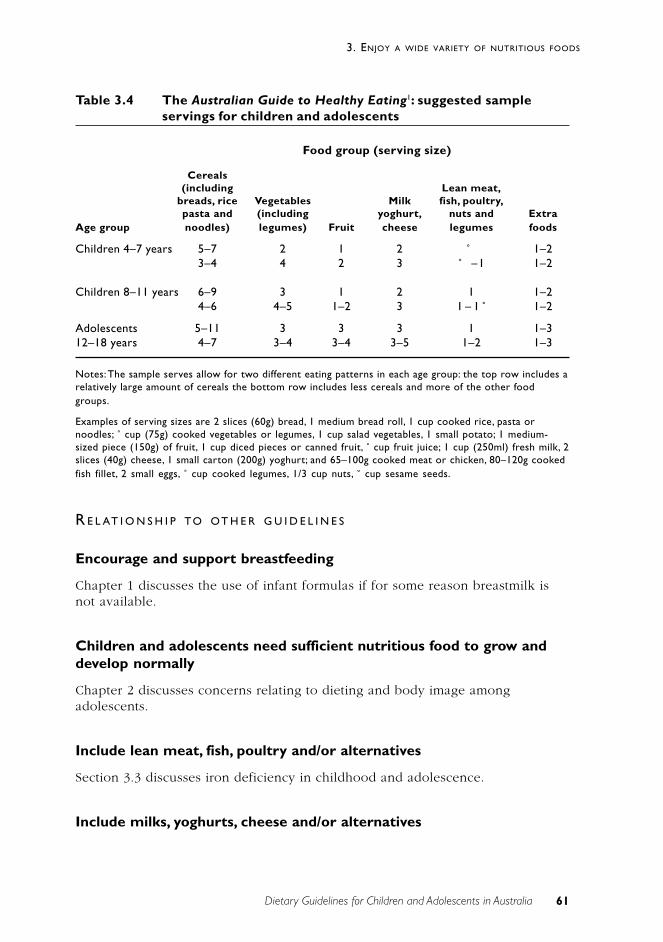
61Dietary Guidelines for Children and Adolescents in Australia
3. ENJOY A WIDE VARIETY OF NUTRITIOUS FOODS
Table 3.4 The Australian Guide to Healthy Eating1: suggested sampleservings for children and adolescents
Food group (serving size)
Cereals(including Lean meat,
breads, rice Vegetables Milk fish, poultry,pasta and (including yoghurt, nuts and Extra
Age group noodles) legumes) Fruit cheese legumes foods
Children 4–7 years 5–7 2 1 2 ˚ 1–23–4 4 2 3 ˚ –1 1–2
Children 8–11 years 6–9 3 1 2 1 1–24–6 4–5 1–2 3 1 – 1 ˚ 1–2
Adolescents 5–11 3 3 3 1 1–312–18 years 4–7 3–4 3–4 3–5 1–2 1–3
Notes: The sample serves allow for two different eating patterns in each age group: the top row includes arelatively large amount of cereals the bottom row includes less cereals and more of the other foodgroups.
Examples of serving sizes are 2 slices (60g) bread, 1 medium bread roll, 1 cup cooked rice, pasta ornoodles; ˚ cup (75g) cooked vegetables or legumes, 1 cup salad vegetables, 1 small potato; 1 medium-sized piece (150g) of fruit, 1 cup diced pieces or canned fruit, ˚ cup fruit juice; 1 cup (250ml) fresh milk, 2slices (40g) cheese, 1 small carton (200g) yoghurt; and 65–100g cooked meat or chicken, 80–120g cookedfish fillet, 2 small eggs, ˚ cup cooked legumes, 1/3 cup nuts, ˘ cup sesame seeds.
R E L AT I O N S H I P TO OT H E R G U I D E L I N E S
Encourage and support breastfeeding
Chapter 1 discusses the use of infant formulas if for some reason breastmilk isnot available.
Children and adolescents need sufficient nutritious food to grow anddevelop normally
Chapter 2 discusses concerns relating to dieting and body image amongadolescents.
Include lean meat, fish, poultry and/or alternatives
Section 3.3 discusses iron deficiency in childhood and adolescence.
Include milks, yoghurts, cheese and/or alternatives
62 Dietary Guidelines for Children and Adolescents in Australia
3. ENJOY A WIDE VARIETY OF NUTRITIOUS FOODS
Limit saturated fat and moderate total fat intake
Inappropriate restriction of fat in infancy and early childhood is discussed inSection 3.6.
The Dietary Guidelines for Australian Adults
The guideline discussed here should be read in conjunction with Chapter 1 inthe Dietary Guidelines for Australian Adults. A varied diet, in keeping with theAustralian Guide to Healthy Eating1 is the cornerstone of good nutrition. In earlychildhood it is important to establish patterns of eating that promote goodnutrition. These should then continue through to adulthood.
C O N C L U S I O N
Apart from infancy where exclusive breastfeeding is recommended until about 6months of age, variety in the diet is important for children and adolescents. InAustralia, a range of cuisines is available that add variety to the ‘traditional’Australian diet and have been associated with health gains. Recommending thatchildren and adolescents ‘enjoy a wide variety of nutritious foods’ will not onlyhelp ensure appropriate intakes of major dietary components such as protein,carbohydrates and fats but also help ensure adequate and appropriate intakes ofvitamins and minerals, individual fatty acids and amino acids. Enjoying a varietyof nutritious foods remains an important message for all age groups.Experimenting with other cuisines, and incorporating new and traditional foodswill encourage variety in the diet, help meet nutrient requirements, and providesome protection against non-communicable chronic diseases later in life. Servingsizes of more energy dense foods may need to be reduced to accommodatevariety (see the Dietary Guidelines for Australian Adults for a more detailedreview of the links to chronic disease patterns).
E V I D E N C E
For ethical reasons, randomised control trials cannot be undertaken in relation tobreastfeeding. For evidence levels related to the suitability of breastmilk as thenormal food for infants see Section 1. There is Level II evidence for the optimalage of introduction of complementary foods (references 5 and 6). and Level III(references 28 to 30) and Level IV (reference 26) evidence linking some infantfeeding practices with subsequent disease.
R E F E R E N C E S
1. Department of Health and Family Services. The Australian guide to healthyeating: background information for nutrition educators. Canberra: DHFS,1998.
63Dietary Guidelines for Children and Adolescents in Australia
3. ENJOY A WIDE VARIETY OF NUTRITIOUS FOODS
2. Birkbeck J. Weaning: a position statement. NZ Med J 1992;105:221–4.
3. Lutter C. Recommended length of exclusive breastfeeding, age ofintroduction of complementary foods and the weaning dilemma. Geneva:World Health Organization, 1992.
4. World Health Organization. Complementary feeding of young children indeveloping countries: a review of current scientific knowledge. Geneva:WHO, 1998
5. Cohen RJ, Brown KH, Canahuati J, Riviera LL, Dewey KG. Effect of age ofintroduction of complementary foods on infant breast milk intake, totalenergy intake, and growth: a randomised intervention study in Honduras.Lancet 1994;344:288–93.
6. Dewey KG, Cohen RJ, Brown KH, Riviera LL. Age of introduction ofcomplementary foods and growth of term, low-birth-weight, breast-fedinfants: a randomised intervention study in Honduras. Am J Clin Nutr1999;69:679–86.
7. Aggett P. Research priorities in complementary feeding: InternationalPaediatric Association (IPA) and European Society of PaediatricGastroenterology, Hepatology, and Nutrition (ESPGHAN) workshop.Pediatrics 2000;106(5S):1271.
8. WHO European Region Division. Infant nutrition. Geneva: WHO, 1999.
9. Hervada AR, Newman DR. Weaning: historical perspectives, practicalrecommendations, and current controversies. Current problems inpediatrics 1992;22:223–41.
10. Department of Health and Social Security. Present day practice in infantfeeding: report of a working party of the Panel on Child Nutrition,Committee on Medical Aspects of Food Policy. London: HMSO, 1988.
11. Truswell AS. ABC of nutrition. 2nd edn. London: BMJ, 1992.
12. Hendricks KM, Badruddin SH. Weaning recommendations: the scientificbasis. Nutr Rev 1992;50:125–33.
13. Kleinman R. Complementary feeding and neuromuscular development.Pediatrics 2000;106(suppl.):S1279.
14. Cunningham AS, Jelliffe D, Jelliffe EFP. Breast-feeding and health in the1980s: a global epidemiological review. J Pediatr 1991;118:659–66.
15. Lanigan J, Morgan J. New global strategy on infant feeding needs to beflexible. BMJ 2001;323:632.
16. Hornell A, Hofvander Y, Kylber E. Introduction of solids and formula tobreastfed infants: a longitudinal prospective study in Uppsala, Sweden.Acta Paediatr 2001;90:477–82.
17. Graham VA, Gibbons K, Marraffa C, Henry L, Myers J. Filling the gap:weaning practices of children aged 0-2 years in western metropolitanMelbourne. J Paediatr Ch Hlth 1998; 34(6):513–17.
64 Dietary Guidelines for Children and Adolescents in Australia
3. ENJOY A WIDE VARIETY OF NUTRITIOUS FOODS
18. Retallack SJ, Simmer K, Gibson RA. Infant weaning practices in Adelaide:the results of a shopping complex survey. J Paediatr Ch Hlth1994;30(1):28–32.
19. American Academy of Pediatrics Committee on Nutrition. Follow-up orweaning formulas. Pediatrics 1989;83(6):1067.
20. Canadian Paediatric Society Nutrition Committee. Meeting the iron needs ofinfants and young children: an update. Can Med Assoc J 1991;144:1451–4.
21. Dallman PR. Iron deficiency in the weanling: a nutritional problem on theway to resolution. Acta Paediatr Scand 1986;323(suppl.):59–67.
22. American Academy of Pediatrics Committee on Nutrition. The use of wholecow’s milk in infancy. Pediatrics 1992;89:1105–9.
23. Committee on Nutrition. Comment on the composition of cow’s milk basedfollow-up formulas. Acta Paediatr Scand 1990;79(suppl.):250–4.
24. Montalto MB, Benson JD, Martinez GA. Nutrient intakes of formula-fedinfants and infants fed cow’s milk. Pediatrics 1985;75:343–51.
25. Martinez GA, Ryan AS, Malec DJ. Nutrient intakes of American infants andchildren fed cow’s milk or infant formula. Am J Dis Child 1985;139:1010–18.
26. Ziegler EE, Fomon SJ, Nelson SE, Rebouche CJ, Edwards BB, Rogers RR etal. Cow milk feeding in infancy: further observations on blood loss fromthe gastrointestinal tract. J Pediatr 1990;116:11–18.
27. Willetts IE, Dalzell M, Puntis JW, Stringer MD. Cow’s milk enteropathy:surgical pitfalls. J Pediatr Surg 1999;34(10):1486–8.
28. Saarinen KM, Savilahti E. Infant feeding patterns affect the subsequentimmunological features in cow’s milk allergy. Clin Exper Allergy2000;30(3):400–6.
29. Hypponen E, Kenward MG, Virtanen SM, Piitulainen A, Virta-Autio P,Tuomilehto J et al. Infant feeding, early weight gain, and risk of type 1diabetes. Diab Care 1999;22(12):1961–5.
30. Pettitt DJ, Forman MR, Hanson RL, Knowler WC, Bennett PH. Breastfeedingand incidence of non-insulin-dependent diabetes mellitus in Pima Indians.Lancet 1997;350(9072):166–8.
31. Udall JNJ, Suskind RM. Cow’s milk versus formula in older infants:consequences for human nutrition. Acta Paediatr 1999;88(430)(suppl.):61–7.
32. Couper JJ, Steele C, Beresford S, Powell T, McCaul K, Pollard A et al. Lack ofassociation between duration of breast-feeding or introduction of cow’s milkand development of islet autoimmunity. Diab Care 1999;48(11):2145–9.
33. Ministry of Health. Food and nutrition guidelines for healthy infants andtoddlers (aged 0–2): a background paper. Wellington, NZ: Ministry ofHealth, 1999.
65Dietary Guidelines for Children and Adolescents in Australia
3. ENJOY A WIDE VARIETY OF NUTRITIOUS FOODS
34. Sicherer SH. New insights on the natural history of peanut allergy. AnnAllergy Asthma Immun 2000;85(Dec):435–7.
35. Kleinman RE. American Academy of Pediatrics recommendations forcomplementary feeding. Pediatrics 106(5S):1274.
36. Sullivan SA, Birch LL. Infant dietary experience and acceptance of solidfoods. Pediatrics 1994;93(2):271–7.
37. Australia New Zealand Food Authority. Proposal P215: foods for infantsand young children. Canberra: ANZFA, 1999.
38. National Center for Infectious Disease. Botulism in the United States.Atlanta, GA: Centers for Disease Control and Prevention, 1998.
39. American Academy of Pediatrics. The use and misuse of fruit juices inpediatrics. Pediatrics 2001;107:1210–13.
40. Hourihane J, Rolles C. Morbidity from excessive intake of high energyfluids: the squash drinking syndrome. Arch Dis Child 1995;72:141–3.
41. Lifshitz F, Ament ME, Kleinman RE, Klish W, Lebenthal E, Perman J et al.Role of juice carbohydrate malabsorption in chronic non-specific diarrhoeain children. J Pediatr 1992;120(5):825–9.
42. Smith MM, Lifshitz F. Excess fruit juice consumption as a contributingfactor in nonorganic failure to thrive. Pediatrics 1994;93:438–43.
43. Department of Health. Weaning and the weaning diet. Report of theWorking Group on the Weaning Diet, Committee on Medical Aspects ofFood Policy. Report no. 45. London: Department of Health, 1994.
44. Dewey KG. Nutrition, growth and complementary feeding of breastfedinfants. Pediatr Clin Nth Amer 2001;48(1):87–104.
45. Sigman-Grant M. Feeding preschoolers: balancing nutritional anddevelopmental needs. Nutr Today 1992;27:13–17.
46. Birch LL, Johnson MS, Andrensen G, Peters JC, Schulte MC. The variabilityof young children's energy intake. New Eng J Med 1991;324:232–5.
47. Australian Bureau of Statistics. Childcare, Australia, 1990. Canberra: ABS,1992.
48. Department of Health and Family Services. The development of a nationalplanning framework for childcare: discussion paper. Canberra: DHFS, 1996.
49. Gelissen IC, Wall PM, Lilburne A, Truswell AS. Dietary intake of Australianpreschool children at long day care centres. Aust J Nutr Dietet 1992;49:49–52.
50. Williams L, Bunney C, Bradley S, Bartl R. Caring for children-meeting theirnutritional needs during long day care. Proc Nutr Soc 1992;17:86.
51. Pollard C, Lewis J, Miller M. Food service in long day child care centres.ANZ J Pub Hlth 1999;23:606–10.
66 Dietary Guidelines for Children and Adolescents in Australia
3. ENJOY A WIDE VARIETY OF NUTRITIOUS FOODS
52. Soanes R, Miller M, Begley A. Nutrient intakes of 3 year-old children: acomparison between attenders and non-attenders of long day care centres.Aust J Nutr Diet 2001;58:114–20.
53. McVeagh P, Mortensen A, O'Loughlin EV. Growing healthy children.Melbourne: Longman Cheshire, 1992.
54. Skinner JD, Carruth BR. Dietary quality of pregnant and nonpregnantadolescents. JADA 1991;91:718–20.
55. Adelson PL, Frommer MS, Pym MA, Rubin G. Teenage pregnancy andfertility in New South Wales: an examination of fertility trends, abortionand birth outcomes. Aust J Pub Hlth 1992;16:238–44.
56. Stevens-Simon C, McAnarney ER. Adolescent maternal weight gain and lowbirth weight: a multifactorial model. Am J Clin Nutr 1988;47:948–53.
57. Cherry FF, Sandstead HH, Rojas P, Johnson LK, Batson HK, Wang XB.Adolescent pregnancy: associations among body weight, zinc nutriture,and pregnancy outcomes. Am J Clin Nutr 1989;50:945–54.
58. National Health and Medical Research Council. Statement on therelationship between dietary folic acid and neural tube defects such asspina bifida. Canberra: NHMRC, 1993.
59. National Health and Medical Research Council. The effectiveness of waterfluoridation. Canberra: AGPS, 1991.
60. Jacobs C, Dwyer JT. Vegetarian children: appropriate and inappropriatediets. Am J Clin Nutr 1988;48:811–18.
61. Sanders AB. Growth and development of British vegan children. Am J ClinNutr 1988;48:822–5.
62. National Health and Medical Research Council. Food allergies in children.Canberra: NHMRC, 1991.
Dietary Guidelines for Children and Adolescents in Australia 67
3.1 EAT PLENTY OF VEGETABLES, LEGUMES AND FRUIT
3 . 1 E AT P L E N T Y O F V E G E TA B L E S ,L E G U M E S A N D F RU I T S
I v o r D r e o s t i
T E R M I N O L O G Y
Vegetables
Vegetables includes all leafy green vegetables (for example, spinach, lettuce,silver beet and bok choi), members of the crucifer family (for example, broccoli,cabbages and brussels sprouts), all root and tuber vegetables (for example,carrots, yams and potatoes), edible plant stems (for example, celery andasparagus), gourd vegetables (for example, pumpkin and cucumber), alliumvegetables (for example onion, garlic and shallot) and corn, although this lastfood is usually regarded as a cereal. Some vegetables are eaten raw; others arebest cooked because this makes them more palatable and digestible.
Fruits
The term fruit generally applies to the sweet, fleshy edible portion of a plantthat arises from the base of the flower and surrounds the seeds; apples, oranges,plums, berries, tomatoes and avocados are examples. Most fruit is eaten raw,although in some cases cooking can offer a tasty alternative.
Legumes
Legumes refers also to pulses and includes all forms of prepared beans andpeas—dried, canned and cooked legumes, bean curd, tofu, and legume-flourproducts such as pappadams. Among the well-known edible legumes are butterbeans, haricot (navy) beans, red kidney beans, soybeans, mung beans, lentils,chick peas, snow peas and various other fresh green peas and beans. Legumesare generally cooked: this improves their nutritional value and reduces the riskof toxicity that occurs with some legumes because of the presence of heat-labiletoxins. Occasionally, however, they can be eaten raw; snow peas are anexample. Strictly speaking, legumes are specialised forms of fruit since the podsurrounds the seeds and arises from the base of the flower, as occurs with fruit.But, because the main food material in legumes is the seeds, they are generallyplaced in a separate category.
68 Dietary Guidelines for Children and Adolescents in Australia
3.1 EAT PLENTY OF VEGETABLES, LEGUMES AND FRUIT
B A C K G R O U N D
Each year in Australia about 40 per cent of all deaths can be attributed todiseases of the circulatory system and 27 per cent to cancer, accounting forannual health care costs of around $4 billion and $2 billion respectively.1
Scientific surveys of populations around the world have consistently providedgood epidemiological evidence that people who regularly eat diets high in fruitsand vegetables (including legumes) have substantially lower risks of coronaryheart disease2–4, stroke2,5, several major cancers6,7 and possibly hypertension8,9,type 2 diabetes mellitus10,11, cataract12,13, and macular degeneration of the eye.14,15
A large number of experimental studies with model systems have affordedfurther evidence of a protective effect of fruits and vegetables against these non-communicable chronic diseases and offer some clues about the actual substancesin these foods that may be protective as well as the mechanisms by which theymay act. Accordingly, a new term, phytochemicals, has been added to thevocabulary of nutritionists; it refers to the many different substances occurring inplant foods in small amounts (in addition to the well-established nutrients) andwhich appear to contribute significantly to reducing the risk of non-communicable chronic diseases.
The Australian Guide to Healthy Eating16 recognises the importance of fruits andvegetables in a healthy diet for all sections of the population and recommendsconsumption of between one and two servings of fruit and two to four ofvegetables each day for children aged 4–7 years; one to two servings of fruit andthree to five of vegetables each day for children aged 8–11 years; and three tofour servings of fruit and four to nine of vegetables each day for adolescents(12–18 years).
For older children and adolescents, this is generally in keeping with theminimum five servings of vegetables and two of fruit established by the corefood group analysis endorsed by the National Health and Medical ResearchCouncil.17 It should be noted, however, that average current fruit and vegetableconsumption in Australia falls significantly short of this recommendation, asshown in Table 3.1.1.
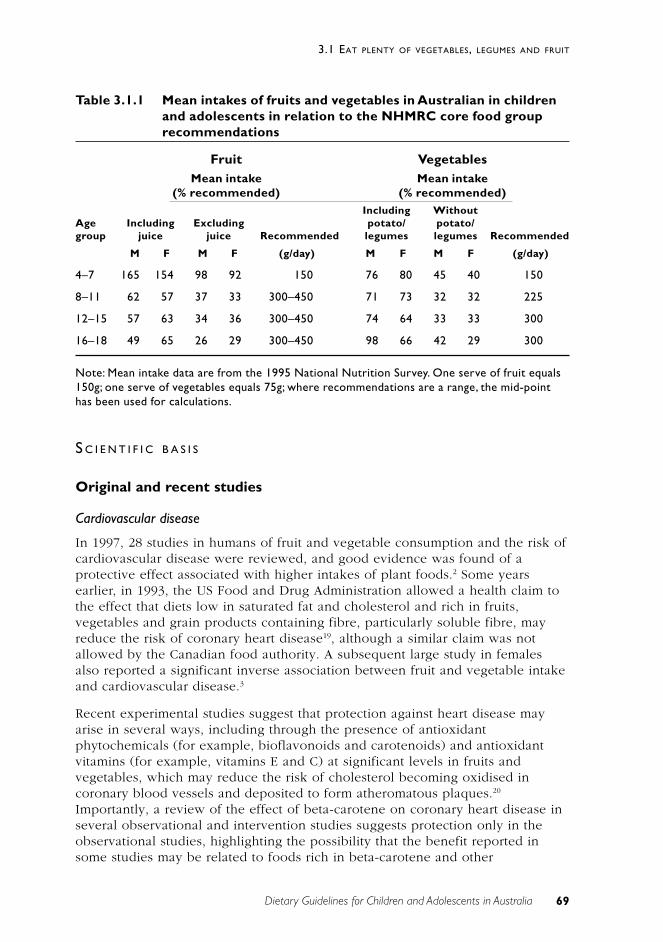
69Dietary Guidelines for Children and Adolescents in Australia
3.1 EAT PLENTY OF VEGETABLES, LEGUMES AND FRUIT
Table 3.1.1 Mean intakes of fruits and vegetables in Australian in childrenand adolescents in relation to the NHMRC core food grouprecommendations
Fruit VegetablesMean intake Mean intake
(% recommended) (% recommended)Including Without
Age Including Excluding potato/ potato/group juice juice Recommended legumes legumes Recommended
M F M F (g/day) M F M F (g/day)
4–7 165 154 98 92 150 76 80 45 40 150
8–11 62 57 37 33 300–450 71 73 32 32 225
12–15 57 63 34 36 300–450 74 64 33 33 300
16–18 49 65 26 29 300–450 98 66 42 29 300
Note: Mean intake data are from the 1995 National Nutrition Survey. One serve of fruit equals150g; one serve of vegetables equals 75g; where recommendations are a range, the mid-pointhas been used for calculations.
S C I E N T I F I C B A S I S
Original and recent studies
Cardiovascular disease
In 1997, 28 studies in humans of fruit and vegetable consumption and the risk ofcardiovascular disease were reviewed, and good evidence was found of aprotective effect associated with higher intakes of plant foods.2 Some yearsearlier, in 1993, the US Food and Drug Administration allowed a health claim tothe effect that diets low in saturated fat and cholesterol and rich in fruits,vegetables and grain products containing fibre, particularly soluble fibre, mayreduce the risk of coronary heart disease19, although a similar claim was notallowed by the Canadian food authority. A subsequent large study in femalesalso reported a significant inverse association between fruit and vegetable intakeand cardiovascular disease.3
Recent experimental studies suggest that protection against heart disease mayarise in several ways, including through the presence of antioxidantphytochemicals (for example, bioflavonoids and carotenoids) and antioxidantvitamins (for example, vitamins E and C) at significant levels in fruits andvegetables, which may reduce the risk of cholesterol becoming oxidised incoronary blood vessels and deposited to form atheromatous plaques.20
Importantly, a review of the effect of beta-carotene on coronary heart disease inseveral observational and intervention studies suggests protection only in theobservational studies, highlighting the possibility that the benefit reported insome studies may be related to foods rich in beta-carotene and other
70 Dietary Guidelines for Children and Adolescents in Australia
3.1 EAT PLENTY OF VEGETABLES, LEGUMES AND FRUIT
antioxidants and micro-nutrients—or indeed other confounding factors—ratherthan to the beta-carotene alone.21 Also important is the apparent capacity ofvegetable protein to reduce blood cholesterol levels in people habituallyconsuming an omnivorous diet.22
Particular emphasis is being focused at present on the importance of the vitaminfolate in reducing blood levels of the compound homocysteine, which is apossible risk factor for coronary heart disease.4,23 Especially noteworthy is thefact that a major source of dietary folate is green, leafy vegetables, and studiessuggest that many adults have folate intakes well below the level needed tominimise the risk associated with raised levels of homocysteine.24
Stroke
A systematic review of 14 studies including ecological, case-control and cohortstudies dealing with stroke and fruit and vegetables found strong evidence of aprotective effect associated with higher intakes of plant foods.2 The mechanismfor this apparent protection is not clear, but it appears to exist for strokes of bothhaemorrhagic and ischaemic origin.5 In one large study extending over eightyears, protection was associated with vegetable intake rather than fruit,25
although generally both types of plant food are considered to be likelyprotective agents.26
Hypertension
Because plant foods contribute significantly to the intake of potassium andmagnesium—both of which have been proposed to be associated with a lowerblood pressure—diets high in fruits and vegetables will increase the daily intakeof both minerals and may help prevent or control hypertension.6,27 In a studywith women in the United States, lowered blood pressure was found to beassociated with higher intakes of fruits and vegetables, fibre and magnesium8;more recently, data from the Dietary Approaches to Stop Hypertension (DASH)randomised clinical trial have indicated that diets rich in fruits and vegetables,with or without low-fat dairy products, significantly reduced ambulatory bloodpressure after an eight-week intervention period28, especially in African-Americans and people with hypertension.29 Similar results were found with USadolescents who had elevated blood pressures: blood pressure was lower inthose subjects with higher intakes of a combination of nutrients includingpotassium, calcium, magnesium and vitamins, as provided by diets rich in fruitsand vegetables and low-fat dairy products.30
Cancer
Health researchers have estimated that at least 30 per cent of many majorcancers have a strong dietary link and that the link may be even stronger forsome cancers.6 Among the dietary factors underlying this association aresubstances that may aggravate the development of cancer and, very importantly,substances that reduce cancer risk. Dietary components in the latter groupinclude fibre, fruits and especially vegetables. In fact, the association betweenfruits and vegetables is sufficiently widely recognised that the US Food and Drug
71Dietary Guidelines for Children and Adolescents in Australia
3.1 EAT PLENTY OF VEGETABLES, LEGUMES AND FRUIT
Administration has allowed a health claim to the effect that diets low in fat andrich in fruit and vegetables may reduce the risk of some cancers.19
Not surprisingly, the protective effect of fruit and vegetables has been notedespecially in relation to the oral cavity, oesophagus, stomach and large bowel,where local contact may be a factor, although significant risk reduction has alsobeen observed for cancers of the lung and possibly the breast, endometrium andpancreas.6,7 Many factors in fruit and vegetables have been proposed to accountfor the foods’ protective effect and many potential mechanisms suggested. Muchemphasis is currently placed on the many novel phytochemicals found in plantfoods (for example, carotenoids, bioflavonoids, isothiocyanates and indolecarbinols) and on several established vitamins and minerals (for example,vitamins C and E, folate, selenium and calcium). Proposed mechanisms rangefrom reduced formation of cancer-promoting substances in the gastrointestinaltract (through antioxidant activity) to the part played by phytochemicals andmicro-nutrients in detoxification of carcinogenic substances, and to functionsrelating to the containment and destruction of existing cancer cells by means of avariety of physiological processes and improved immunological activity againstcancer cells.6,7,31
In the 1997 World Cancer Research Fund and American Institute for CancerResearch (WCRF–AICR) global review of nutrition and cancer prevention7,prevention by fruit and vegetables was rated to be ‘convincing’ for cancers of themouth, pharynx, oesophagus, stomach, colon, rectum and lung; ‘probable’ forthe larynx, pancreas, breast and bladder; and ‘possible’ for the ovaries, cervix,endometrium, thyroid, liver, prostate and kidney. Since that report, datagenerally confirming these findings have become available from a number offurther case-control and cohort studies. In particular, lower risks of cancer haveagain been found for the oral cavity32,33, stomach34 and colon and rectum35 inrelation to higher vegetable and fruit intake, although a recent study found noevidence that one extra serving of fruit and vegetables provides any measurableadditional protection.36
Two recent studies on lung cancer also consistently indicate that a high intake offruit and vegetables is protective, particularly with respect to brassicaevegetables, tomatoes, lettuce and cabbage.37,38 Further suggestive evidence ofprotection by fruits and vegetables has been noted for cancer of the bladder39,40,breast41,42 and, to a lesser extent, prostate, notably in relation to the carotenoidlycopene.43,44
It should be noted, however, that although considerable emphasis has beenplaced on the WCRF–AICR review, attention should be paid to the study by theUK Department of Health Committee on the Medical Aspects of the Food Supply(COMA), which also reviewed the evidence concerning the potential protectionagainst cancer afforded by fruit and vegetables.45 The COMA study ranked theevidence into four categories, the top two being ‘strong’ and ‘moderate’. No‘strong’ association was found between fruit and vegetable consumption andcancer at any site, while a ‘moderate’ association was noted for cancers of thestomach, colon and rectum. In contrast, the WCRF–AICR rated as ‘convincing’ the
72 Dietary Guidelines for Children and Adolescents in Australia
3.1 EAT PLENTY OF VEGETABLES, LEGUMES AND FRUIT
evidence for an association for the mouth/pharynx, stomach, colon, rectum andlung.7 Convincing was defined to mean that the evidence of causal relationshipswas conclusive and sufficient for making dietary recommendations. Clearly,COMA’s interpretation of the data is more cautious than the WCRF–AICRinterpretation, but both bodies recognise the importance of these foods inreducing cancer risk. The WCRF–AICR is currently updating its analysis toincorporate studies published since 1997.
Type 2 diabetes mellitus
At the population level, an association has been noted between increasedconsumption of plant foods and lower incidence of obesity (which is a risk factorfor diabetes) and type 2 diabetes itself, although it is not clear at this stagewhether this apparent protection arises principally from a lower body weight. Inthe dietary control of type 2 diabetes, vegetables are likely to be of particularvalue because of their content of fibre and low–energy density carbohydratesand their possible hypoglycaemic activity.6,10 Recently, a cross-sectional study inthe United Kingdom revealed an inverse association between the risk of type 2diabetes and frequent consumption of vegetables throughout the year, althoughthe effect did not appear to be significant during the summer months.46
Cataract and macular degeneration of the eye
Several studies in humans have reported that the risk of developing ocularcataracts is significantly higher in people with low dietary intakes of fruit andvegetables, vitamins C and E, and beta-carotene.12,47 A similar increased risk wasobserved in people with low levels of vitamins C and E in their blood.Experimental studies with model systems have added further support to thenotion that above-average intakes of antioxidant nutrients may delay the onset ofsenile cataract.12 More recently, a modest protective effect against thedevelopment of cataracts has been observed for higher intakes of the carotenoidslutein and zeaxanthin.48
Age-related degeneration of the macula—the colour-sensitive yellow spot on theretina of the eye—is another serious cause of acute blindness in the elderly andis not reversible. Findings from a number of human studies suggest that peoplewith low levels of carotenoids and the antioxidant vitamins C and E in theirblood, and who smoke, are at increased risk of developing maculardegeneration. Experimental studies indicate that two carotenoids in particular—lutein and zeaxanthin—appear to be accumulated by the macula, and in a humanstudy when the dietary intake of carotenoids was analysed the sum of the intakeof lutein and zeaxanthin had the strongest protective effect against maculardegeneration. Taken together, these findings suggest that in many cases maculardegeneration may be prevented by eliminating smoking and ensuring anadequate intake of fruit and vegetables.14 Of particular interest are several recentreports that highlight the presence of lutein and zeaxanthin in precise butdifferent orientations in the membranes of the macula, which suggests that thesetwo carotenoids may serve a special role in reducing the risk of age-relatedmacular degeneration.49,50
73Dietary Guidelines for Children and Adolescents in Australia
3.1 EAT PLENTY OF VEGETABLES, LEGUMES AND FRUIT
P R A C T I C A L A S P E C T S O F T H I S G U I D E L I N E
For toddlers, the generally lower energy density of fruits and vegetables incomparison with cereal and animal products should be borne in mind: veryyoung children have a higher energy requirement than older children and theirstomach capacity is smaller. Nevertheless, development of healthy eating habitsneeds to be encouraged progressively in this age group.
For children and adolescents, fruits and vegetables each contribute about 7 percent to total energy and 14–22 per cent and 25 per cent respectively of dietaryfibre.51 Generally, fruit consumption increases with age—especially for boys—butthere is a tendency in this group to consume a high proportion of fruit juices,which are of lower nutritional value than the whole fruit. Young people shouldbe encouraged to eat salads, stir-fried vegetables and fruits because it is likelythat the protection afforded by these foods against the degenerative diseases ofadulthood begins at an early age.
A wide variety of fruits is recommended, including apples and pears, citrusfruits, melons, tomatoes, berries, grapes, bananas, and stone fruits such asapricots and peaches. The Australian Guide to Healthy Eating’srecommendations for fruit include raw, stewed or canned varieties, with ratherless emphasis on fruit juices and dried fruit since they tend to be lower in fibreand more energy dense respectively, although a modest intake of both (say, oneserving a day) is acceptable.
A variety of vegetables is also recommended, including dark green vegetablessuch as spinach and broccoli; orange or yellow vegetables such as pumpkin andcarrots; crucifers such as broccoli, cauliflower and cabbage; starchy vegetablessuch as potatoes, yams and the cereal food corn; and salad vegetables and fruitssuch as lettuce, tomato, cucumber and capsicum.
Vegetable consumption increases with age in children, but the dominance ofpotatoes as a source of vegetables in Australia—among both children andadults—is of some concern: they are not as rich in phytochemicals as many othervegetables and some of the more popular forms (such as French fries and chips)can also be relatively high in fat.
Where do nuts and seeds fit in ?
Many nuts and seeds are similar to fruits except that the seed is the main ediblecomponent and the whole structure becomes dry on maturing. Most nuts andseeds provide a wide range of nutrients and are generally pleasantly flavoured,so they can usefully be included with fruits and vegetables in plant-based dishesor other dishes such as stir-fries and in desserts. These foods are of particularvalue in providing significant levels of protein and essential fatty acids, both then-6 fatty acids and, in some cases (such as walnuts, canola and flaxseed), the n-3fatty acids.
74 Dietary Guidelines for Children and Adolescents in Australia
3.1 EAT PLENTY OF VEGETABLES, LEGUMES AND FRUIT
Whole nuts are not recommended for young children because of the possibilityof choking; they can, however, be fed as a paste.
Preparation of fruit and vegetables
Certain nutrients and phytochemicals in plant foods are damaged by cooking;others are not. In fact, in some cases the availability of a nutrient may beincreased by the cooking process; for example, carotenoids are absorbed betterfrom cooked tomatoes than raw ones. As a general rule, fruit and vegetables maybe eaten in the manner most palatable to the consumer, although a goodproportion should always be eaten raw.
When vegetables are cooked they should not be overcooked since this will causeloss of nutrients. Stir-frying is an effective method of cooking vegetables: it tendsto minimise nutrient loss and provides a tasty product with good texture. Lightmicrowaving and steaming are also better than deep-frying or prolonged boiling.Generally, when cooking vegetables it is useful to use a small amount of oilbecause this enhances absorption of the fat-soluble vitamins (for example,vitamins A and E) as well as other fat-soluble dietary components such as thecarotenoids.
It should be noted that eating the variety of fruits and vegetables recommendedin the Australian Guide to Healthy Eating will ensure an adequate intake ofsome of the less widely distributed dietary components—for example, greenleafy vegetables for folate; yellow and orange fruits and vegetables forcarotenoids; cruciferous vegetables for dithiolthiones and isothiocyanates, whichimprove the body’s detoxification capacity; the allium vegetable family for allylsulfides, which also improve detoxification processes; fruit for bioflavonoids,which appear to serve many beneficial functions in the body, including acting asantioxidants; and citrus fruit and capsicum for vitamin C. Where necessary,frozen and canned fruits and vegetables are acceptable since good levels ofnutrients are retained by both processes, especially freezing.
Vegetarians
The objective of the fruit and vegetable guideline is not to encourage people toeat only vegetarian meals; rather, it is to highlight the important health benefitsto be derived from regular consumption of plant-based meals together withindividual fresh and cooked fruits and vegetables. For vegetarians, however,particular emphasis should be given to regularly including legumes and nuts, inorder to increase the iron and protein intake from plant sources. It is alsoimportant that fruit juices or fruits be consumed in the same meal as cereals,legumes or other sources of iron, in order to provide vitamin C, which willincrease iron absorption.
75Dietary Guidelines for Children and Adolescents in Australia
3.1 EAT PLENTY OF VEGETABLES, LEGUMES AND FRUIT
R E L AT I O N S H I P TO OT H E R G U I D E L I N E S
Enjoy a wide variety of nutritious foods
In order to obtain optimal health benefits from fruit and vegetables, a widevariety of nutritious foods should be consumed.
Eat plenty of cereals (including breads, rice, pasta and noodles),preferably wholegrain
Apart from providing a good source of energy, cereal-based foods contribute anumber of protective factors to the diet, complementing and extending many ofthe benefits derived from fruit and vegetables.
Limit saturated fat and moderate total fat intake
Fruit and vegetables are low in saturated fat.
Choose foods low in salt
Fruits and vegetables are low in salt (sodium) but are good suppliers ofpotassium.
C O N C L U S I O N
Strong evidence now exists that many compounds in fruit and vegetables(phytochemicals) help to protect against a number of non-infectious degenerativediseases, among them cancer, cardiovascular disease, type 2 diabetes, andcataract and macular degeneration of the eye.
Children are encouraged to consume on average at least two helpings of fruitand five of vegetables each day; both the fruits and the vegetables should beselected from a wide variety of types and colours and be served cooked or raw,as appropriate.
E V I D E N C E
There is Level II evidence (reference 9) and Level III evidence (references 3, 4,8 and 27) in relation to the benefits of fruit and vegetable consumption andcoronary heart disease, hypertension and stroke. There is Level III evidence(references 29 to 41) in relation to fruit and vegetable consumption and cancerof various kinds.
76 Dietary Guidelines for Children and Adolescents in Australia
3.1 EAT PLENTY OF VEGETABLES, LEGUMES AND FRUIT
Although current evidence concerning the benefit of vegetables and fruit inprotecting against several degenerative diseases is strongly persuasive, it islargely based on retrospective observational studies. Further prospectiveintervention studies are needed, although it is recognised that these are difficult,and costly, to carry out. Nevertheless, a considerable number are already underway and they will provide invaluable information in the coming decade. Inaddition, more needs to be established concerning the roles of the variousphytochemicals in disease prevention, as well as their interaction with the rangeof genotypes found in the human population.
R E F E R E N C E S
1. Australian Parliament. National Health Priority Areas initiative. CurrentIssues Brief 18, 1999–2000. <www.aph.gov.au/library/pubs/cib/1999-2000cib18.htm>, viewed February 2002.
2. Ness AR, Powles JW. Fruit and vegetables, and cardiovascular disease: areview. Int J Epidemiol 1997;26:1–13.
3. Liu S, Manson JE, Lee IM, Cole SR, Hennekens CH, Willett WC et al. Fruitand vegetable intake and risk of cardiovascular disease: the Women’sHealth Study. Am J Clin Nutr 2000;72:922–8.
4. Law MR, Morris JK. By how much does fruit and vegetable consumptionreduce the risk of ischaemic heart disease? Eur J Clin Nutr 1998;52:549–56.
5. Gillman MW, Cupples LA, Gagnon D, Posner BM, Ellison RC, Castelli WP,Wolf PA. Protective effects of fruits and vegetables on development ofstroke in men. JAMA 1995;273:113–17.
6. Steinmetz KA, Potter JD. Vegetables, fruit and cancer prevention: a review.J Am Diet Assoc 1996;96:1027–39.
7. World Cancer Research Fund & American Institute for Cancer Research.Vegetables and fruits. In: Food, nutrition and the prevention of cancer: aglobal perspective. Washington, US: American Institute for Cancer Research1997;436–46.
8. Ascherio A, Hennekens C, Willett WC, Sacks F, Rosner B, Manson J et al.Prospective study of nutritional factors, blood pressure and hypertensionamong US women. Hypertension 1996;27:1065–72.
9. Moore TJ, Vollmer WM, Appel LJ, Sacks FM, Svetkey LP, Vogt TM et al.Effects of dietary patterns on ambulatory blood pressure: results from theDietary Approaches to Stop Hypertension (DASH) trial. Hypertension1999;34:472–7.
10. Platel K, Srinivasan K. Plant foods in the management of diabetes mellitus:vegetables as potential hypoglycaemic agents. Nahrung 1997;41:68–74.
77Dietary Guidelines for Children and Adolescents in Australia
3.1 EAT PLENTY OF VEGETABLES, LEGUMES AND FRUIT
11. Williams DE, Wareham DJ, Cox BD, Byrne CD, Hales CN, Day NE.Frequent salad vegetable consumption is associated with a reduction in therisk of diabetes mellitus. J Clin Epidemiol 1999;52:329–37.
12. Taylor A. Cataract: relationship between nutrition and oxidation. J Am CollNutr 1993;12:138–46.
13. Brown L, Rimm EB, Seddon JM, Giovannucci EL, Chasan-Taber L,Spiegelman D et al. A prospective study of carotenoid intake and risk ofcataract extraction in US men. Am J Clin Nutr 1999;70:517–24.
14. Snodderly DM. Evidence for protection against age-related maculardegeneration by carotenoids and antioxidant vitamins. Am J Clin Nutr1995;62:1448S–1461S.
15. Goldberg J, Flowerdew G, Smith E, Brody JA, Tso MO. Factors associatedwith age-related macular degeneration: an analysis of data from the firstNational Health and Nutrition Examination Survey. Am J Epidemiol1998;128:700–10.
16. Department of Health and Family Services. The Australian guide to healthyeating. Canberra: DHFS, 1998.
17. Cashel K, Jeffreson S. The core food groups. Endorsed by the NationalHealth and Medical Research Council. Canberra: Australian GovernmentPublishing Service, 1995;83.
18. Baghurst P, Beaumont-Smith N, Baghurst KI, Cox D. The relationshipbetween the consumption of fruits and vegetables and health status. Reportto Department of Health and Aged Care. Adelaide: CSIRO, 1999:75.
19. Kurtzweil P. Staking a claim to good health. FDA Consumer Magazine1998;Nov/Dec:1–7.
20. Hamilton CA. Low-density lipoprotein and oxidised low-densitylipoprotein: their role in the development of atherosclerosis. PharmacolTherapeut 1997;74:55–72.
21. Tavani A, LaVerchia C. Beta-carotene and risk of coronary heart disease: areview of observational and intervention studies. Biomed Pharmacother1999;53:409–16.
22. Jenkins DJ, Popovich DG, Kendall CW, Vidgen E, Tariq N, Ranson TP et al.Effect of a diet high in vegetables, fruit and nuts on serum lipids.Metabolism 1997;46:530–7.
23. Verhoef P, Stampfer MJ, Rimm EB. Folate and coronary heart disease.Current Opinion in Lipidology 1998;9:17–22.
24. Brussaard JH, Lowik MR, van der Berg H, Brants HA, Goldbohm RA. Folateintake and status among adults in the Netherlands. Europ J Clin Nutr1997;51(suppl. 3):S46–S50.
78 Dietary Guidelines for Children and Adolescents in Australia
3.1 EAT PLENTY OF VEGETABLES, LEGUMES AND FRUIT
25. Manson JE, Willett WC, Stampfer MJ, Colditz GA, Speizer FE, HennekensCH. Vegetable and fruit consumption and incidence of stroke in women.Circulation 1994;89:932.
26. Van Duyn MA, Pivonka E. Overview of the health benefits of fruit andvegetable consumption for the dietetics professional: selected literature. JAm Diet Assoc 2000;100:1511–21.
27. Kawano Y, Matsuoka H, Takashita S, Omae T. Effects of magnesiumsupplementation in hypertensive patients: assessment by office, home andambulatory blood pressures. Hypertension 1998;32:260–5.
28. Moore TJ, Vollmer WM, Appel JL, Sacks FM, Svetkey LP, Vogt TM et al.Effect of dietary patterns on ambulatory blood pressure: results from theDietary Approaches to Stop Hypertension (DASH) Trial CollaborativeResearch Group. Hypertension 1999;34:472–7.
29. Svetkey LP, Simons-Morton D, Vollmer WM, Appel LJ, Conlin PR, Ryan DHet al. effects of dietary patterns on blood pressure: subgroup analysis ofthe Dietary Approaches to Stop Hypertension (DASH) randomised clinicaltrials. Arch Intern Med 1999;159:285–93.
30. Falkner B, Sherif K, Michel S, Kushner H. Dietary nutrients and bloodpressure in urban minority adolescents at risk for hypertension. ArchPediat Adolesc Med 2000;154:918–22.
31. Dreosti IE. What do our guidelines do for cancer prevention? Cereals,vegetables including legumes and fruit guideline. Aust J Nutr Diet2000;57:221–2.
32. Franceschi S, Favero A, Conti E, Talamini R, Volpe R, Negri E et al. Foodgroups and oils and butter, and cancer of the oral cavity and pharynx. BritJ Cancer 1999;80:614–20.
33. Bosetti C, Negri E, Franceschi S, Conti E, Levi F, Tomei F et al. Risk factorsfor oral and pharyngeal cancer in women: a study from Italy andSwitzerland. Brit J Cancer 2000;82:204–7.
34. Ekstrom AM, Serafini M, Nyren O, Hansson LE, Ye W, Wolk A. Dietaryantioxidant intake and the risk of cardia cancer and non-cardia cancer inSweden. Int J Cancer 2000;87:133–40.
35. Franceschi S. Nutrients and food groups and large bowel cancer in Europe.Europ J Cancer Prev 1999;9:549–52.
36. Michels KB, Giovannucci E, Joshipura KJ, Rosner BA, Stampfer MJ, FuchsCS et al. Prospective study of fruit and vegetable consumption andincidence of colon and rectal cancer. J Nat Cancer Inst 2000;92:1740–52.
37. Voorrips LE, Goldbohm RA, Verhoeven DT, van Popper GA, Sturmans F,Herman RJ et al. Vegetable and fruit consumption and lung cancer risk inthe Netherlands cohort study on diet and cancer. Cancer Causes andControl 2000;11:101–15.
79Dietary Guidelines for Children and Adolescents in Australia
3.1 EAT PLENTY OF VEGETABLES, LEGUMES AND FRUIT
38. Michaud DS, Feskanich D, Rimm EB, Colditz GA, Speizer FG, Willett WC etal. Intake of specific carotenoids and risk of lung cancer in twoprospective US cohorts. Am J Clin Nutr 2000;72:990–7.
39. Steinmaus CM, Nunez S, Smith AH. Diet and bladder cancer: a meta-analysis of six dietary variables. Am J Epdiemiol 2000;151:693–703.
40. Nagano J, Kano S, Preston DL, Moriwaki H, Sharp GB, Koyama K et al.Bladder cancer incidence in relation to vegetable and fruit consumption: aprospective study of atomic bomb survivors. Int J Cancer 2000;86:132–8.
41. Ronco A, De Stefani E, Boffetta P, Deneo-Pellegrini H, Mendilaharsu M,Leborgne F. Vegetables fruits and related nutrients and risk of breastcancer: a case control study in Uruguay. Nutr & Cancer 1999;35:111–19.
42. Gandini S, Merzenich H, Robertson L, Boyle P. Meta-analysis of breastcancer risk and diet: the role of fruit and vegetable consumption and theintake of associated micronutrients. Europ J Cancer 2000;36:636–46.
43. Jain MG, Hislop GT, Howe GR, Ghadirian P. Plant foods, antioxidants andprostate cancer risk. Nutr and Cancer 1999;34:173–84.
44. Cohen JH, Kristal AR, Stanford JL. Fruit and vegetable intake and prostatecancer risk. J Nat Cancer Inst 2000;92:61–8.
45. UK Department of Health: Nutritional aspects of the development of cancer:report of the Working Group on Diet and Cancer of the Committee onMedical Aspects of Food and Nutrition Policy. Norwich, UK: The StationeryOffice, 1998.
46. Williams DE, Wareham NJ, Cox BD, Byrne CD, Hales CN, Day NE.Frequent salad vegetable consumption is associated with a reduction in therisk of diabetes mellitus. J Clin Epidemiol 1999;52:329–35.
47. Tavani A, Negri E, LaVecchia C. Food and nutrient intake and cataract. AnnEpidemiol 1996;6:41–6.
48. Brown L, Rimm EB, Seddon JM, Giovannucci EL, Chasan-Taber L,Spiegelman D et al. A prospective study of carotenoid intake and risk ofcataract extraction in US men. Am J Clin Nutr 1999;70:517–24.
49. Bone RA, Landrum JT, Friedes LM. Distribution of lutein and zeaxanthinstereoisomers in the human retina. Expl Eye Res 1997;64:211–18.
50. Sommerburg EG, Siems WG, Hurst JS, Lewis JW, Kliger DS, van Kuijktu.Lutein and zeaxanthin are associated with photoreceptors in the humanretina. Curr Eye Res 1999;19:491–5.
51. National Health and Medical Research Council. Recommended dietaryintakes for use in Australia. Canberra: Australian Government PublishingService, 1991.
81Dietary Guidelines for Children and Adolescents in Australia
3.2 EAT PLENTY OF CEREALS (INCLUDING BREADS, RICE, PASTA AND NOODLES), PREFERABLY WHOLEGRAIN
3 . 2 E AT P L E N T Y O F C E R E A L S( I N C L U D I N G B R E A D S , R I C E , PA S TAA N D N O O D L E S ) , P R E F E R A B LYW H O L E G R A I N
P e t e r W i l l i a m s
T E R M I N O L O G Y
Cereals
Cereals refers to the entire class of cereal foods, including whole or partiallyprocessed cereal grains (for example, rice, oats, corn and barley), breads,breakfast cereals, pasta, noodles, and other plain cereal products such as flour,polenta, semolina, burgul, bran and wheatgerm. It excludes cereal-basedproducts with a significant amount of added fat and sugar—cakes, pastries,biscuits, and so on.
Breads
Breads refers to leavened and unleavened wholemeal, white, mixed-grain, ryeand fruit breads, as well as rolls, bagels, English muffins, crispbreads, crumpetsand low-fat crackers.
Pasta and noodles
Pasta and noodles includes a wide range of Italian and Asian products based onsheets of dough made from flours—usually wheat or rice flour—and water,sometimes with egg added. Examples are plain spaghetti, lasagne, fettuccine,udon and Hokkien noodles, rice paper and wonton wrappers. The term excludessome instant noodles and flavoured pasta mixes with significant amounts ofadded fat and salt.
Wholegrain
Wholegrain refers to cereal foods that incorporate all the components of thenatural grain, including the bran and germ. Foods that contain at least 51 percent by weight of any combination of whole grains can be termed wholegrain.1
This definition includes such foods as wholemeal breads and crispbreads, manyhigh-fibre breakfast cereals, oatmeal, wholemeal pasta, brown rice and popcorn.
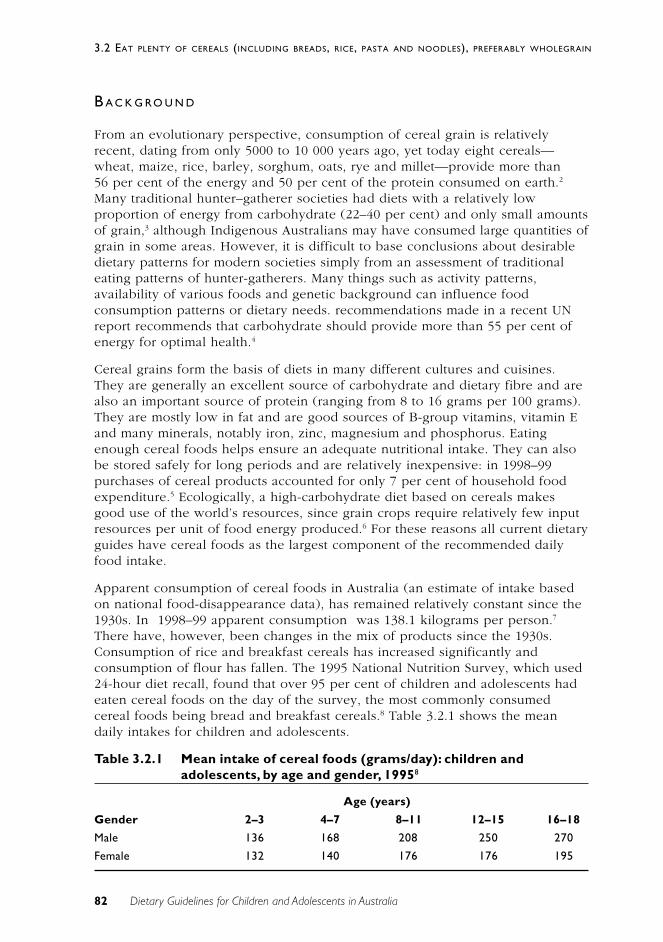
82 Dietary Guidelines for Children and Adolescents in Australia
3.2 EAT PLENTY OF CEREALS (INCLUDING BREADS, RICE, PASTA AND NOODLES), PREFERABLY WHOLEGRAIN
B A C K G R O U N D
From an evolutionary perspective, consumption of cereal grain is relativelyrecent, dating from only 5000 to 10 000 years ago, yet today eight cereals—wheat, maize, rice, barley, sorghum, oats, rye and millet—provide more than56 per cent of the energy and 50 per cent of the protein consumed on earth.2
Many traditional hunter–gatherer societies had diets with a relatively lowproportion of energy from carbohydrate (22–40 per cent) and only small amountsof grain,3 although Indigenous Australians may have consumed large quantities ofgrain in some areas. However, it is difficult to base conclusions about desirabledietary patterns for modern societies simply from an assessment of traditionaleating patterns of hunter-gatherers. Many things such as activity patterns,availability of various foods and genetic background can influence foodconsumption patterns or dietary needs. recommendations made in a recent UNreport recommends that carbohydrate should provide more than 55 per cent ofenergy for optimal health.4
Cereal grains form the basis of diets in many different cultures and cuisines.They are generally an excellent source of carbohydrate and dietary fibre and arealso an important source of protein (ranging from 8 to 16 grams per 100 grams).They are mostly low in fat and are good sources of B-group vitamins, vitamin Eand many minerals, notably iron, zinc, magnesium and phosphorus. Eatingenough cereal foods helps ensure an adequate nutritional intake. They can alsobe stored safely for long periods and are relatively inexpensive: in 1998–99purchases of cereal products accounted for only 7 per cent of household foodexpenditure.5 Ecologically, a high-carbohydrate diet based on cereals makesgood use of the world’s resources, since grain crops require relatively few inputresources per unit of food energy produced.6 For these reasons all current dietaryguides have cereal foods as the largest component of the recommended dailyfood intake.
Apparent consumption of cereal foods in Australia (an estimate of intake basedon national food-disappearance data), has remained relatively constant since the1930s. In 1998–99 apparent consumption was 138.1 kilograms per person.7
There have, however, been changes in the mix of products since the 1930s.Consumption of rice and breakfast cereals has increased significantly andconsumption of flour has fallen. The 1995 National Nutrition Survey, which used24-hour diet recall, found that over 95 per cent of children and adolescents hadeaten cereal foods on the day of the survey, the most commonly consumedcereal foods being bread and breakfast cereals.8 Table 3.2.1 shows the meandaily intakes for children and adolescents.
Table 3.2.1 Mean intake of cereal foods (grams/day): children andadolescents, by age and gender, 19958
Age (years)
Gender 2–3 4–7 8–11 12–15 16–18
Male 136 168 208 250 270
Female 132 140 176 176 195
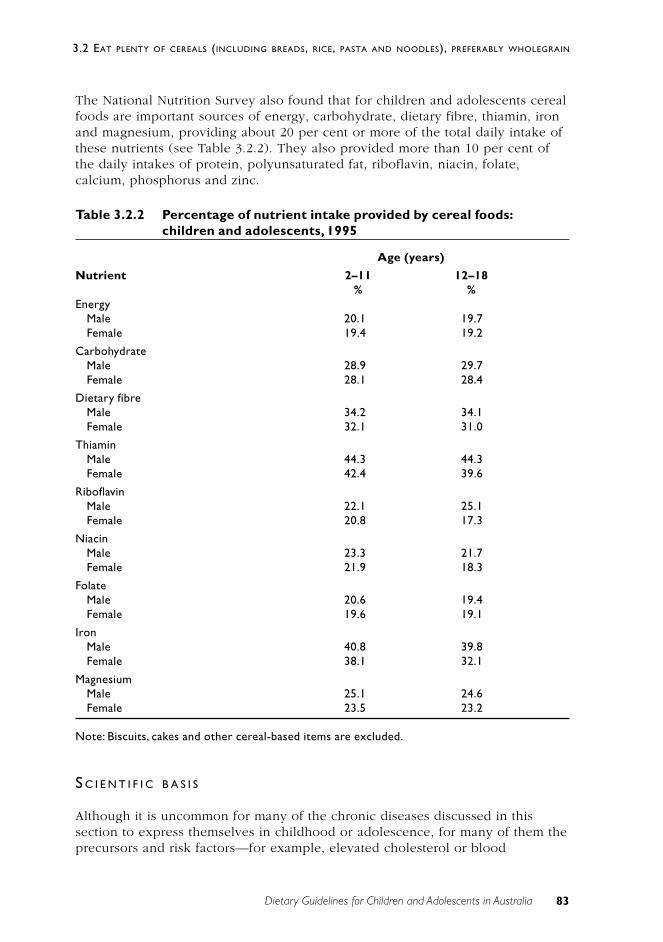
83Dietary Guidelines for Children and Adolescents in Australia
3.2 EAT PLENTY OF CEREALS (INCLUDING BREADS, RICE, PASTA AND NOODLES), PREFERABLY WHOLEGRAIN
The National Nutrition Survey also found that for children and adolescents cerealfoods are important sources of energy, carbohydrate, dietary fibre, thiamin, ironand magnesium, providing about 20 per cent or more of the total daily intake ofthese nutrients (see Table 3.2.2). They also provided more than 10 per cent ofthe daily intakes of protein, polyunsaturated fat, riboflavin, niacin, folate,calcium, phosphorus and zinc.
Table 3.2.2 Percentage of nutrient intake provided by cereal foods:children and adolescents, 1995
Age (years)
Nutrient 2–11 12–18% %
EnergyMale 20.1 19.7Female 19.4 19.2
CarbohydrateMale 28.9 29.7Female 28.1 28.4
Dietary fibreMale 34.2 34.1Female 32.1 31.0
ThiaminMale 44.3 44.3Female 42.4 39.6
RiboflavinMale 22.1 25.1Female 20.8 17.3
NiacinMale 23.3 21.7Female 21.9 18.3
FolateMale 20.6 19.4Female 19.6 19.1
IronMale 40.8 39.8Female 38.1 32.1
MagnesiumMale 25.1 24.6Female 23.5 23.2
Note: Biscuits, cakes and other cereal-based items are excluded.
S C I E N T I F I C B A S I S
Although it is uncommon for many of the chronic diseases discussed in thissection to express themselves in childhood or adolescence, for many of them theprecursors and risk factors—for example, elevated cholesterol or blood
84 Dietary Guidelines for Children and Adolescents in Australia
3.2 EAT PLENTY OF CEREALS (INCLUDING BREADS, RICE, PASTA AND NOODLES), PREFERABLY WHOLEGRAIN
pressure—can be identified at an early age. In addition, establishment of goodeating practices at an early age is recommended to avoid development orexpression of these conditions in later life.
There have been many experimental studies with individual nutritionalcomponents provided by cereal foods—such as dietary fibre, starch and vitaminE—but relatively few prospective studies or controlled experimental trials haveused whole foods to find support for this dietary guideline. It is difficult to gainpeople’s acceptance of long-term changes to the largest staple component oftheir diets—and generally impossible to do so in a double-blind manner. As aresult, most of the available evidence comes from ecological, cross-sectional,case-control and cohort studies. Even in these the dietary methodology is ofteninadequate for analysing the consumption of different types of cereals orquantifying dose-responses.
All recent reviews have supported the beneficial effects of cereal fibre andwhole grains in relation to decreased risk of coronary heart disease and somecancers1,10–13, and data from several countries suggest that higher intakes ofbreads and cereals help people achieve dietary targets for lower fatconsumption.14,15 Cereals are also a major source of resistant starch in the diet,which is important for colon health. In 1999 the US Food and DrugAdministration approved the health claim that ‘diets rich in whole-grain foodsand other plant foods and low in total fat, saturated fat and cholesterol mayreduce the risk of heart disease and certain cancers’.13
Coronary heart disease
The published results of over 200 human trials have led to the generalconclusion that foods rich in soluble fibre can lower plasma cholesterol.17–19 TheNational Heart Foundation of Australia has stated, ‘The consumption of dietaryfibre, especially cereal fibre, is associated with a lower risk of CHD’.20 Meta-analyses of intervention trials with two cereal foods, oats and psyllium, haveshown that these are particularly effective in reducing serum cholesterol.21,22 Bycontrast, controlled human trials with supplements of isolated wheat fibre haveconsistently shown no effect on plasma cholesterol.17
A large prospective study of male health professionals in the United States foundthat dietary fibre intake was strongly associated with reduced rates of myocardialinfarction and that cereal fibre was apparently more protective than fibre fromfruits or vegetables.23 The study reported a 29 per cent reduction in coronaryheart disease for every 10-gram increase in daily intake of cereal fibre. Otherstudies have also found a stronger association between cereal fibre and reducedrisk of coronary heart disease than with fibre from fruit or vegetables.24–26
Analysis of a prospective study of 31 284 post-menopausal women in Iowafound the relative risk of CHD was 0.76 (95%CI: 0.55–1.05) among women in thehighest quintile of dietary fibre intakes compared with the lowest.10
The principal mechanism is probably viscous polysaccharides acting in thegastrointestinal tract to decrease reabsorption of biliary cholesterol27, but other
85Dietary Guidelines for Children and Adolescents in Australia
3.2 EAT PLENTY OF CEREALS (INCLUDING BREADS, RICE, PASTA AND NOODLES), PREFERABLY WHOLEGRAIN
components may be involved in the protective effect of wholegrain cereals:vitamin E, folate, selenium, phytoestrogens and phytic acid may all beimportant.28 In the Nurses Health Study, wholegrain consumption was associatedwith significant reductions in risk of both CHD29 and ischaemic stroke.30
Dietary carbohydrates may also exert an influence on cardiovascular disease riskvia their effect on insulin response. High–glycaemic index (or high-GI)carbohydrates are characterised by rapid absorption and high post-prandialglucose and insulin responses and may result in decreased insulin sensitivity31, arisk factor for CHD.32 At least three cross-sectional studies have also found aninverse relationship between HDL cholesterol and the dietary glycaemic load.33–35
(The glycaemic index is discussed in detail in Appendix I to the DietaryGuidelines for Older Australians.)
Obesity
Although total energy intake and overall nutrient density appear to be the mostimportant factors affecting weight regulation, a high-fibre, low-fat diet isrecommended for maintenance of body weight and prevention of obesity.36–38
Obesity is associated with low fibre intake.39 When high-starch, high-sucrose andhigh-fat ad libitum diets were compared, energy intake was lowest on the high-starch, high-fibre diet.40 In children, strict diets or rigid fat restriction are notdesirable, but choosing lower fat foods and eating a wide variety of breads andcereals, fruits and vegetables is encouraged.41
There are several ways high-fibre cereals can reduce energy intake and helpmaintain weight: they take longer to eat; they decrease the energy density of ameal; and some fibres may slow gastric emptying and affect gastrointestinalhormones that influence food intake.42 Compared with low-GI choices,consumption of high-GI carbohydrates promotes a more rapid return of hungerand increases subsequent energy intake, and slower digestion of carbohydrate isassociated with higher satiety.43 Thus, consumption of wholegrain and lower GIcereals, instead of highly refined cereals, may help prevent excess weightgain.44,45
Diabetes
The joint WHO–FAO consultation on carbohydrates concluded that foods rich inslowly digested, or resistant, starch or high in soluble fibre might be protectiveagainst diabetes.4 Recent large prospective studies of men and women havefound cereal fibre intake was inversely associated with the risk of developingtype 2 diabetes and that the protective effect was even greater when combinedwith a low total glycaemic load.26,46
A large prospective study of adult women in the United States found that a lowerrisk of type 2 diabetes was associated with higher intakes of all cereal grains (RR0.75; 95%CI: 0.63–0.89) and wholegrains in particular (RR 0.73; 95%CI: 0.63–0.85), whereas a higher intake of refined grain was related to increased risk (RR
86 Dietary Guidelines for Children and Adolescents in Australia
3.2 EAT PLENTY OF CEREALS (INCLUDING BREADS, RICE, PASTA AND NOODLES), PREFERABLY WHOLEGRAIN
1.26; 95%CI: 1.08–1.46).47 The individual foods associated with the strongestprotective effects were wholegrain breakfast cereal, brown rice and bran.However, in that study refined grain included a wide range of higher fat cereal-based foods such as cakes, desserts and pizzas, and wholegrain foods includedsome that are relatively refined (such as couscous).
Cancer
Two major reviews of the relationship between cereal consumption and cancerprevention have been published.48,49 It is difficult to evaluate many studiesbecause of the paucity of biological markers; the inadequacy of many food-intake measurements, which often do not distinguish the degree of refinement ofcereal foods; and the low overall intakes of cereal fibre in many of the studiesfrom the United States. There is, however, emerging agreement on the probableprotective role of cereals in relation to some important cancer types. Inparticular, it appears that wholegrain intake confers benefits. In a review of 40case-control studies of 20 cancers, the pooled odds ratio for high versus lowwholegrain intake was 0.66 (95%CI: 0.60–0.72).50 Among the protectivecomponents in wholegrains may be fermentable carbohydrates, oligosaccharides,flavonoids, phenolics, phytoestrogens, lignans, protease inhibitors, saponins andselenium.51–53
Colorectal cancer
Prospective data from the large Health Professionals Follow-up Study suggestthat dietary fibre intake is inversely associated with the risk of colorectaladenoma in men, the relative risk in the highest versus the lowest quintile being0.36. All sources of dietary fibre were protective, but the effect was stronger forgrain sources than for fruit or vegetables.54 The World Cancer Research Fundreview concluded that diets high in both starch and dietary fibre could possiblydecrease the risk of colorectal cancer48, and a recent consensus statement fromthe European Cancer Prevention Organisation, based on a review of 58epidemiological studies, concluded, ‘A diet rich in high-fibre cereal is associatedwith a reduced risk of colorectal cancer’.49 This conclusion is supported by ameta-analysis of case-control studies of wholegrain intake and colorectal cancer,which calculated a pooled odds ratio of 0.79 (95%CI: 0.69–0.89) when high andlow intakes of wholegrains were compared.50
Resistant starch may also favourably affect some of the faecal markers of coloncancer risk, in a way similar to dietary fibre.16 Cereal foods are estimated toprovide 42 per cent of the resistant starch in the Australian diet.55
The most recent Cochrane Database systematic review of five interventionstudies concluded that there is currently no evidence from RCTs to suggest thatincreased dietary fibre intake will reduce the incidence of adenomatous polypswithin a two to four year period.56 However, most of the studies that wereconsidered used isolated dietary supplements rather than whole foods an theconsistent findings of a protctive association from high fibre diets in the case-
87Dietary Guidelines for Children and Adolescents in Australia
3.2 EAT PLENTY OF CEREALS (INCLUDING BREADS, RICE, PASTA AND NOODLES), PREFERABLY WHOLEGRAIN
control and cohort studies suggest that the mechanisms may not be fullyunderstood at this stage.
Breast cancer
Fibre may reduce the intestinal reabsorption of oestrogen, and bioactive cerealcomponents such as lignans may be protective through their action as weakphytoestrogens. A comparison of national consumption data from variouscountries suggests that energy from cereals is inversely related to breast cancerrisk57, and a meta-analysis of 12 case-control studies found a significant reductionin risk with increasing dietary fibre.58 The World Cancer Research Fund reportconcluded that dietary fibre possibly decreases the risk of breast cancer48 and theEuropean Cancer Prevention Organisation consensus meeting agreed that there isevidence to suggest cereal fibre provides protection against breast cancer49,although this is still uncertain.59
Stomach cancer
In relation to stomach cancer, the World Cancer Research Fund report concludedfrom the evidence of six case-control studies that there was a possible protectiveassociation for consumption of wholegrain cereals and cereal products but thatthe evidence for cereals as a whole was inconsistent and inconclusive.48
Other cancers
One large cross-national study has found that prostate cancer mortality isinversely associated with estimated consumption of cereals60, and case-controlstudies suggest that wholegrain foods are protective.59 A few case-control studiesreport a protective effect of wholegrain consumption on oral and pharyngealcancers61,62, but data from human intervention studies are not available for any ofthese cancers.
Constipation and diverticular disease
Constipation is a common clinical complaint in childhood.63 There is a strongcorrelation between dietary fibre intake and mean daily stool weight64, andcereal fibre has been found to improve bowel function by increasing faecal bulkand reducing transit time, resulting in softer, larger stools and more frequentbowel action.65–67 For children aged 2 years and over, a minimal dietary fibreintake of (age + 5) grams a day up to a maximum of (age + 10) grams a day hasbeen recommended.68 The mean intakes recorded in the 1995 National NutritionSurvey were at the upper end of this range69, but the lowest quartile of intakeswas below the minimum recommendation, especially for adolescents.9 Diets richin insoluble fibre—such as that present in wholegrain cereals and breads—areassociated with a low prevalence of constipation and diverticular disease.
88 Dietary Guidelines for Children and Adolescents in Australia
3.2 EAT PLENTY OF CEREALS (INCLUDING BREADS, RICE, PASTA AND NOODLES), PREFERABLY WHOLEGRAIN
Hypertension
Hypertension remains an important risk factor for cardiovascular andcerebrovascular morbidity and mortality, and a reduction in sodium intake is oneof the primary preventive measures. Cereals in their natural state are very low insalt and have a favourable potassium–sodium ratio, but processed cereal foods,especially bread, are major sources of salt in the Australian diet. Both dietaryfibre and magnesium may be protective against hypertension, and cereal foodsare important sources of both these nutrients; but fruit sources of fibre appearmore protective than cereal sources.70,71
Nutrient density
Two of the main cereal foods, breakfast cereals and breads, are often fortifiedwith vitamins and minerals that can be marginal in the diet. Children who eatbreakfast cereals generally have better overall nutrient intakes.72–76 Bread haslong been a useful staple for fortification, and some breads are now sources ofadditional fibre, iron, folate and omega-3 fats. Because they are generally low infat and energy but nutrient dense, cereal foods used as snacks are ideal forhelping to meet the higher energy needs of growing children and adolescents.78
P R A C T I C A L A S P E C T S O F T H I S G U I D E L I N E
Relationship to the Australian Guide to Healthy Eating
The Australian Guide to Healthy Eating recommends that breads, cereals, rice,pasta and noodles form the basis of a healthy diet, with the greatest proportionof food coming from this group.79 The recommended number of cereal servingsfor children aged 4–7 years is three to seven a day; for children aged 8–11 yearsit is four to nine; and for adolescents aged 12–18 years it is four to 11,depending on energy needs and the preferred pattern of eating. A servingequates to two slices of bread; one cup of cooked rice, pasta or noodles; onecup of porridge; one-and-a-third cups of breakfast cereal; or half a cup ofmuesli. Cereal-based foods such as cakes, biscuits and pastries—which can havehigh levels of added fats and sugars—are not included in this recommendationand should be regarded as occasional treats only.
There are some easy ways of achieving these recommended targets:
• consuming breads with each meal
• regularly using rice, couscous, pasta or noodles to accompany hot dishes
• eating breakfast cereals daily
• including wholegrain cereals as extenders to soups and casseroles
• using oats in crumble toppings on desserts
• choosing grain-based snacks such as low-fat cereal bars, muffins andpopcorn.
89Dietary Guidelines for Children and Adolescents in Australia
3.2 EAT PLENTY OF CEREALS (INCLUDING BREADS, RICE, PASTA AND NOODLES), PREFERABLY WHOLEGRAIN
Sodium intake
Bread is the most commonly consumed cereal food in Australia; it has a typicalsodium content of around 450 milligrams per 100 grams. The mean dailyconsumption of regular and fancy breads by children and adolescents reported inthe 1995 National Nutrition Survey ranged from 60 to 110 grams a day (seeTable 3.2.3), which would contribute from 271 to 496 milligrams of sodium—around 20 per cent of the recommended maximum sodium intake80; thiscompared with these foods’ contribution of only 10 per cent to the daily energyintake.9 Greater consumption of cereal foods with high salt levels could make itmore difficult for people to limit their sodium intake, but this is not a reason torecommend against plentiful consumption of cereals. Children and adolescentsseeking to increase their cereal intake should opt for cereals that are lower insalt—such as rice, oats, couscous, pasta, and many lower salt varieties ofbreakfast cereals and breads.
Table 3.2.3 Contribution of breads to sodium intake of children andadolescents, 19959
Age (years)
Intake 2–3 4–7 8–11 12–15 16–18
Mean bread intake (g/day) 60.3 79.1 96.6 100.1 110.2
Sodium (mg) from breads 271 356 435 451 496
RDI (mg/day) 320–1150 460–1730 600–2300 920–2300 920–2300
Sodium from breads as% of maximum RDI 24 21 19 20 22
Note: RDI = recommended dietary intake.
Glycaemic index
The glycaemic index of a food is a physiologically based classification ofcarbohydrate-containing foods according to their potential to raise blood glucose.Various factors can affect the GI value of a food, among them the particle size ofmilled grains; the ratio of amylose to amylopectin; the degree of starchgelatinisation; and the presence of other food components such as viscoussoluble fibres, fat, protein and organic acids. Lower GI diets may possibly beprotective against both diabetes and heart disease and low-GI diets may helpwith weight control.
Many processed starchy cereal foods—such as most breads, rices and breakfastcereals—tend to have high GI values. This does not mean that high-GI cerealfoods need to be avoided altogether: the glycaemic load of a diet can bebalanced by combining high- and low-GI carbohydrate sources in the same meal.Exchanging half the carbohydrate from high to low GI will lower the GI of theoverall diet by about 15 units, sufficient to bring about clinical improvements inglucose metabolism in people with diabetes.81
90 Dietary Guidelines for Children and Adolescents in Australia
3.2 EAT PLENTY OF CEREALS (INCLUDING BREADS, RICE, PASTA AND NOODLES), PREFERABLY WHOLEGRAIN
To achieve a lower GI diet, consumption of slowly digested cereal foods, such asgrainy breads, pasta, low-GI breakfast cereals and high-amylose rice, ispreferred. Choosing lower GI foods from wholegrain foods with low levels ofsaturated fat will also increase the protective cereal fibre and phytochemicalcontent of the diet.
R E L AT I O N S H I P TO OT H E R G U I D E L I N E S
In the 1995 edition of the Dietary Guidelines for Children and Adolescents, theguideline relating to cereal foods was ‘Eat plenty of breads and cereals(preferably wholegrain), vegetables (including legumes) and fruits’.82 The 2002guidelines make two separate recommendations, one relating to vegetables andfruit and one relating to cereals—to give both groupings greater prominence.The emphasis on ‘wholegrain’ has been retained because of the growingevidence of the health benefits of wholegrain cereal products as compared withrefined ones.
Enjoy a wide variety of nutritious foods
Different cereals provide differing amounts and types of dietary fibre, as well asdiffering levels of potentially active phytochemicals and nutritive antioxidants.83
The levels of some nutrients (such as selenium) in cereals vary considerablyaccording to the growing region: it is important to eat a wide variety of cerealfoods to maximise their nutritional benefits.
Limit saturated fat and moderate total fat intake
Cereals are naturally very low in saturated fat, so increased cereal consumptionis consistent with this guideline as long as the amount of fat added—in the formof fat spreads on bread, oil added to pasta, fried rice, and so on—is limited. Carealso needs to be taken to limit the intake of other cereal-based foods such asbiscuits, cakes and pastries and some instant noodles: they can contain highlevels of added saturated fat and are treated as ‘extra foods’ in the AustralianGuide to Healthy Eating.
Choose foods low in salt
Standard commercial breads and some breakfast cereals are major sources of saltin the diet. To cut down on salt intake, lower salt cereal products andunprocessed whole grains should be preferred.
91Dietary Guidelines for Children and Adolescents in Australia
3.2 EAT PLENTY OF CEREALS (INCLUDING BREADS, RICE, PASTA AND NOODLES), PREFERABLY WHOLEGRAIN
C O N C L U S I O N
All breads and cereals are economical foods that are an important source ofessential macro- and micro-nutrients. Wholegrain cereal choices, which generallyare higher in dietary fibre, and cereals with a lower glycaemic index should bepreferred. The words ‘eat plenty’ are used to encourage children and adolescentsto choose these foods liberally as the basis of their daily diet.
E V I D E N C E
There is Level I evidence of the cholesterol-lowering properties of oats andpsyllium (references 21 and 22), of the cholesterol-lowering properties of cerealfibres generally (reference 19) and of the preventive effect of dietary fibre onconstipation (reference 66).
There is Level III evidence for the following:
• low-GI diets and improved lipid profile and glycaemic control in diabetics(references 33 to 35 and 84 to 86)
• cereal fibre and reduction in risk factors for colorectal cancer (reference87)
• wholegrain cereal and reduced risk of coronary heart disease (references29, 30 and 88)
• wholegrain cereal and reduced risk of diabetes (reference 47)
• cereal fibre and reduced risk of coronary heart disease (references 10, 23to 25 and 46)
• cereal fibre and reduced risk of breast cancer (references 56, 57 and 89)
• wholegrain cereal and reduced risk of cancers (references 50, 54, 58 to 61and 90 to 92)
• cereal and weight control (references 40 and 93)
• dietary fibre and reduced risk of diverticular disease (reference 94).
R E F E R E N C E S
1. Jacobs D, Pereira M, Slavin J, Marquart L. Defining the impact of whole-grain intake on chronic disease. Cereal Foods World 2000;45:51–3.
2. Cordain L. Cereal grains: humanity’s double-edged sword. World Rev NutrDiet 1999;84:19–73.
3. Cordain L, Brand Miller J, Eaton S, Mann N, Holt S, Speth J. Plant–animalsubsistence ratios and macronutrient energy estimations in worldwidehunter–gatherer diets. Am J Clin Nutr 2000;71:682–92.
4. UN Food and Agriculture Organization. Carbohydrates in human nutrition:report of a joint FAO–WHO expert consultation. Rome: FAO, 1998.
92 Dietary Guidelines for Children and Adolescents in Australia
3.2 EAT PLENTY OF CEREALS (INCLUDING BREADS, RICE, PASTA AND NOODLES), PREFERABLY WHOLEGRAIN
5. Australian Bureau of Statistics. Household Expenditure Survey: detailedexpenditure items, Australia, 1998–99. Canberra: ABS, 2000.
6. Connor W. The benefits of a high-carbohydrate diet. In: Wardlaw G, ed.Perspectives in nutrition. Boston: McGraw-Hill, 1999:86–7.
7. Australian Bureau of Statistics. Apparent consumption of foodstuffs,Australia, 1997–98, 1998–99. Canberra: ABS, 2000.
8. McLennan W, Podger A. National Nutrition Survey: foods eaten, Australia,1995. Canberra: Australian Bureau of Statistics, 1999.
9. McLennan W, Podger A. National Nutrition Survey: nutrient intakes andphysical measurements, Australia, 1995. Canberra: Australian Bureau ofStatistics, 1998.
10. Kushi L, Meyer K, Jacobs D. Cereals, legumes, and chronic disease riskreduction: evidence from epidemiological studies. Am J Clin Nutr1999;70(suppl.):451S–458S.
11. Munoz de Chavez M, Chavez A. Diet that prevents cancer:recommendations from the American Institute for Cancer Research. Int JCancer 1998;11:85–9.
12. Truswell A. Cereal grains and coronary heart disease. Eur J Clin Nutr2002;56:1–14.
13. Anderson J, Hanna T, Peng X, Kryscio R. Whole grain foods and heartdisease. J Am Coll Nutr 2000;19:291S–299S.
14. Pryer J, Brunner E, Elliott P, Nichols R, Dimond H, Marmot M. Whocomplied with COMA 1984 dietary fat recommendations among anationally representative sample of British adults in 1986–87 and what didthey eat? Eur J Clin Nutr 1995;49:718–28.
15. Haraldsdottir J. Dietary guidelines and patterns of intake in Denmark. Br JNutr 1999;81(suppl. 2):S43–S48.
16. Topping D, Clifton P. Short chain fatty acids and human colonic functionroles of resistant starch and nonstarch polysaccharide. Physiol Rev2001;81:1031–64.
17. Truswell A. Dietary fibre and blood lipids. Curr Opin Lipidol 1995;6:14–19.
18. Glore S, van Treek D, Kneehams A, Guild M. Soluble fibre and serumlipids: a literature review. J Am Diet Assoc 1994;94:425–36.
19. Brown L, Rosner B, Willett W, Sacks F. Cholesterol-lowering effects ofdietary fibre: a meta-analysis. Am J Clin Nutr 1999;69:30–42.
20. National Heart Foundation. Dietary fibre: a policy statement prepared bythe Diet and Heart Disease Advisory Committee for the National HeartFoundation. Canberra: NHF, 1997.
21. Ripsin C, Keenan J, Jacobs D, Elmer P, Welch R, Van Horn L et al. Oatproducts and lipid lowering: a meta-analysis. JAMA 1992;267:3317–25.
93Dietary Guidelines for Children and Adolescents in Australia
3.2 EAT PLENTY OF CEREALS (INCLUDING BREADS, RICE, PASTA AND NOODLES), PREFERABLY WHOLEGRAIN
22. Olson B, Anderson S, Becker M, Anderson J, Hunninghake D, Jenkins D etal. Psyllium-enriched cereals lower blood total cholesterol and LDLcholesterol, but not HDL cholesterol in hypercholesterolemic adults: resultsof a meta-analysis. J Nutr 1997;127:1973–80.
23. Rimm E, Ascherio A, Giovannucci E, Spiegelman D, Stampfer M, Willett W.Vegetable, fruit, and cereal fibre intake and risk of coronary heart diseaseamong men. JAMA 1996;275:447–51.
24 Pietinen P, Rimm E, Korkohnen P, Hartmen A, Willett W, Albanes D et al.Intake of dietary fibre and risk of coronary heart disease in a cohort ofFinnish men. The a-Tocopherol, b-Carotene Cancer Prevention Study.Circulation 1996;94:2720–7.
25. Wolk A, Manson J, Sampfer M, Colditz G, Hu F, Speizer F et al. Long-termintake of dietary fiber and decreased risk of coronary heart disease. JAMA1999;281:1998–2004.
26. Salmeron J, Ascherio A, Rimm E, Colditz G, Spiegelman D, Jenkins D et al.Dietary fiber, glycaemic load and risk of NIDDM in men. Diab Care1997;20:545–50.
27. Van Horn L. Fiber, lipids, and coronary heart disease: a statement forhealthcare professionals from the Nutrition Committee, American HeartFoundation. Circulation 1997;95:2701–4.
28. Anderson J, Hanna T. Whole grains and protection against coronary heartdisease: what are the active components and mechanisms? Am J Clin Nutr1999;70:307–8.
29 Liu S, Stampfer M, Hu F, Giovannucci E, Rimm E, Manson J et al. Whole-grain consumption and risk of coronary heart disease: results from theNurses’ Health Study. Am J Clin Nutr 1999;70:412–19.
30. Liu S, Manson J, Stampfer M, Rexrode K, Hu F, Rimm E et al. Whole grainconsumption and risk of ischemic stroke in women: a prospective study.JAMA 2000;284:1534–40.
31. Wolever T. The glycemic index. World Rev Nutr Diet 1990;62:120–85.
32. Despres J, Lamarache B, Mauriege P, Cantin B, Dagenais G, Mooranji S etal. Hyperinsulinemia as an independent risk factor for ischemic heartdisease. New Engl J Med 1996;334:952–7.
33. Frost G, Leeds A, Dore C, Madeiros S, Brading S, Dornhorst A. Glycaemicindex as a determinant of serum HDL-cholesterol concentration. Lancet1999;353:1045–8.
34 Buyken A, Toeller M, Heitkamp G, Karamanos B, Rottiers R, Muggeo M etal. Glycemic index in the diet of European outpatients with type 1diabetes: relations to glycated hemoglobin and serum lipids. Am J ClinNutr 2001;73:574–81.
35. Liu S, Manson J, Stampfer M, Holmes M, Hu F, Hankinson S et al. Dietaryglycemic load assessed by food-frequency questionnaire in relation to
94 Dietary Guidelines for Children and Adolescents in Australia
3.2 EAT PLENTY OF CEREALS (INCLUDING BREADS, RICE, PASTA AND NOODLES), PREFERABLY WHOLEGRAIN
plasma high-density-lipoprotein cholesterol and fasting plasmatriacylglycerols in postmenopausal women. Am J Clin Nutr 2001;73:560–6.
36. Rolls B, Hill J. Carbohydrates and weight management. Washington, DC:ILSI Press, 1998.
37. Franklin J, Caterson I. Setting the record straight—the role of carbohydratesin weight control. Sydney: Grains Research and Development Corporation& BRI Australia, 1999.
38. Yao M, Roberts S. Dietary energy density and weight regulation. Nutr Rev2001;59:247–58.
39. Alfieri M, Pomerleau J, Grace D, Anderson L. Fiber intakes of normalweight, moderately obese and severely obese subjects. Obes Res1995;3:541–7.
40. Raben A, Macdonald I, Astrup A. Replacement of dietary fat by sucrose orstarch: effects of a 14d ad libitum energy intake, energy expenditure andbody weight in formerly obese and never-obese subjects. Int J Obes1997;21:846–59.
41. Gibbons K. What is the most useful eating style for children to promotehealth and to prevent weight gain? Med J Aust 2000;173:S10.
42. Levine A, Billington C. Dietary fiber: does it affect food intake and bodyweight? In: Fernstrom J, Miller G, eds. Appetite and body weight regulation:sugar, fat and macronutrient substitutes. Boca Raton, FL: CRC Press, 1994.
43. Holt S, Brand Miller J. Particle size, satiety and the glycaemic response.Eur J Clin Nutr 1994;48:496–502.
44. Roberts D. High glycemic index foods, hunger and obesity: is there aconnection? Nutr Rev 2000;58:163–9.
45. Astrup A, Ryan L, Grunwals G, Storgaard M, Saris W, Melanson E et al. Therole of dietary fat in body fatness: evidence from a preliminary meta-analysis of ad libitum low-fat dietary intervention studies. Br J Nutr2000;83:S25–S32.
46. Salmeron J, Manson J, Stampfer M, Colditz G, Wing A, Willett W. Dietaryfiber, glycaemic load, and risk of non-insulin-dependent diabetes mellitusin women. JAMA 1997;277:472–7.
47. Liu S, Manson J, Stampfer M, Hu F, Giovannucci E, Colditz G et al. Aprospective study of whole-grain intake and risk of type 2 diabetesmellitus in US women. Am J Pub Hlth 2000;90:1409–15.
48. World Cancer Research Fund & American Institute for Cancer Research.Food, nutrition and the prevention of cancer: a global perspective.Washington, DC: American Institute for Cancer Research, 1997.
49. European Cancer Prevention Organisation Consensus Panel on Cereals andCancer. Consensus statement on cereals, fibre and colorectal and breastcancers. Eur J Cancer Prev 1998;7(suppl. 2):S1–S2.
95Dietary Guidelines for Children and Adolescents in Australia
3.2 EAT PLENTY OF CEREALS (INCLUDING BREADS, RICE, PASTA AND NOODLES), PREFERABLY WHOLEGRAIN
50. Jacobs D, Marquart L, Slavin J, Kushi L. Whole-grain intake and cancer: anexpanded meta-analysis. Nutr Cancer 1998;20:85–96.
51. Slavin J, Martini M, Jacobs D, Marquart L. Plausible mechanisms for theprotectiveness of whole grains. Am J Clin Nutr 1999;70(suppl.):459S–463S.
52. Slavin J, Marquart L, Jacobs D. Consumption of whole-grain foods anddecreased risk of cancer: proposed mechanisms. Cereal Foods World2000;45:54–8.
53. Slavin J. Mechanisms for the impact of whole grain foods on cancer risk. JAm Coll Nutr 2000;19:300S–307S.
54. Giovannucci E, Stampfer M, Colditz G, Rimm E, Willett W. Relationship ofdiet to risk of colorectal adenoma in men. J Nat Cancer Inst 1992;84:91–8.
55. Baghurst P, Baghurst K, Record S. Dietary fibre, non-starch polysaccharidesand resistant starch: a review. Food Aust 1996;48:S1–S36.
56. Asano T, McLeod RS. Dietary fibre for the prevention of colorectaladenomas and carcinomas. Cochrane Database of Systematic Reviews2002. Issue 4.
57. Caygill C, Charlett A, Hill M. Relationship between intake of high-fibrefoods and energy and the risk of cancer of the large bowel and breast. EurJ Cancer Prev 1998;7(suppl. 2):S11–S17.
58. Howe G, Hirohata T, Hislop T, Iscovich J, Yuan J, Katsouyanni E. Dietaryfactors and risk of breast cancer: combined analysis of 12 case-controlstudies. J Nat Cancer Inst 1990;82:561–9.
59. La Vecchia C, Chatenoud L. Fibres, whole-grain foods and breast and othercancers. Eur J Cancer Prev 1998;7(suppl. 2):S25–S28.
60. Herbert J, Hurley T, Olendzki B, Teas J, Ma Y, Hampl J. Nutritional andsocioeconomic factors in relation to prostate cancer mortality: a cross-national study. J Nat Cancer Inst 1998;90:1637–47.
61. McGlaughlin J, Gridley G, Block G, Winn D, Preston-Martin S, SchoenbergJ et al. Dietary factors in oral and pharyngeal cancer. J Nat Cancer Inst1988;80:1237–43.
62. Bosetti C, Negri E, Franceschi A, Conti E, Levi F, Tomel F et al. Risk factorsfor oral and pharyngeal cancer in women: a study from Italy andSwitzerland. Br J Cancer 2000;82:204–7.
63. McClung H, Boyne L, Heitling L. Constipation and dietary fibre intake inchildren. Pediatrics 1995;96:999–1001.
64. Cummings J, Bingham S, Heaton K, Eastwood M. Fecal weight, coloncancer risk, and dietary intake of nonstarch polysaccharides (dietary fiber).Gastroenterology 1992;103:1783–9.
65. Trowell H. Dietary fiber and hypothesis that it is a protective factor incertain disease. Am J Clin Nutr 1978;29:417–27.
96 Dietary Guidelines for Children and Adolescents in Australia
3.2 EAT PLENTY OF CEREALS (INCLUDING BREADS, RICE, PASTA AND NOODLES), PREFERABLY WHOLEGRAIN
66. Muller-Lissner S. Effect of wheat bran on weight of stool andgastrointestinal transit time: a meta-analysis. BMJ 1988;296:615–17.
67. Cummings J. Non-starch polysaccharides (dietary fibre) including bulklaxatives in constipation. In: Kamm M, Lennard-Jones J, eds. Constipation.Petersfield, UK: Wrightson Biomedical Publishing, 1994:307–14.
68. Williams C, Bollella M, Wynder E. A new recommendation for dietary fibrein childhood. Pediatrics 1995;96:985–8.
69. McLennan W, Podger A. National Nutrition Survey: selected highlights,Australia, 1995. Canberra: Australian Bureau of Statistics, 1997.
70. Ascherio A, Rimm E, Giovannucci E, Colditz G, Rosner B, Willett W. Aprospective study of nutritional factors and hypertension among US men.Circulation 1992;86:1475–84.
71. Ascherio A, Hennekens C, Willett W, Sacks F, Rosner B, Manson J et al.Prospective study of nutritional factors, blood pressure and hypertensionamong US women. Hypertens 1996;27:1065–72.
72. Gibson S, O’Sullivan K. Breakfast cereal consumptiuon patterns andnutrient intakes of British schoolchildren. J Roy Soc Hlth 1995;115:336–70.
73. Morgan L, Zabik M, Leveille G. The role of breakfast in the nutrient intakeof 5 to 12 year old children. Am J Clin Nutr 1981;34:1418–27.
74. Zabik M. Impact of ready-to-eat cereal consumption on nutrient intake.Cereal Foods World 1987;32:234–9.
75. Preziosi P, Galan P, Deheeger M, Yacoub N, Drewnowski A, Hercberg S.Breakfast type, daily nutrient intakes and vitamin and mineral status ofFrench children, adolescents and adults. J Am Coll Nutr 1999;18:171–8.
76. Ortega R, Requejo A, Redondo R, Lopez-Sobaler A, Andres P, Ortega A etal. Influence of the intake of fortified breakfast cereals on the dietaryhabits and nutritional status of Spanish schoolchildren. Annls Nutr Metab1996;40:146–56.
77. Pearn J. Panis populi—bread and public health in Australia. ANZ J PublHlth 1998;22:282–5.
78. Gibbons K. Should snacking be encouraged in children? Med J Aust2000;173:S5.
79. Department of Health and Family Services. The Australian guide to healthyeating: background information for nutrition educators. Canberra: DHFS,1998.
80. National Health and Medical Research Council. Recommended dietaryintakes for use in Australia. Canberra: Australian Government PublishingService, 1991.
81. Brand J, Colagiuri S, Crossman S, Allen A, Roberts D, Truswell A. Lowglycaemic index foods improve long term glycaemic control in NIDDM.Diab Care 1991;14:95–101.
97Dietary Guidelines for Children and Adolescents in Australia
3.2 EAT PLENTY OF CEREALS (INCLUDING BREADS, RICE, PASTA AND NOODLES), PREFERABLY WHOLEGRAIN
82. National Health and Medical Research Council, Dietary guidelines forchildren and adolescents. Canberra: Australian Government PublishingService, 1995.
83. Andlauer W, Furst P. Antioxidant power of phytochemicals with specialreference to cereals. Cereal Foods World 1998;43:356–60.
84. Jarvi A, Karlstrom B, Granfeldt Y, Bjorck I, Asp N, Vessby B. Improvedglycemic control and lipid profile and normalized fibrinolytic activity on alow-glycemic index diet in type 2 diabetic patients. Diab Care 1999;22:10–18.
85. Luscombe N, Noakes M, Clifton P. Diets high and low in glycemic indexversus high monounsaturated fat diets: effects on glucose and lipidmetabolism in NIDDM. Eur J Clin Nutr 1999;53:473–8.
86. Clapp J. Effect of dietary carbohydrate on the glucose and insulin responseto mixed caloric intake and exercise in both nonpregnant and pregnantwomen. Diab Care 1998;21(suppl. 2):B107–B112.
87. Grasten S, Juntunen K, Poutanen K, Gylling H, Miettinen T, Mykkanen H.Rye bread improves bowel function and decreases concentrations of somecompounds that are putative colon cancer risk markers in middle-agedwomen and men. J Nutr 2000;130:2215–21.
88. Jacobs D, Meyer K, Kushi L, Folsom A. Whole-grain intake may reduce therisk of ischemic heart disease death in post-menopausal women: the IowaWomen’s Health Study. Am J Clin Nutr 1998;68:248–57.
89. Saxe G, Rock C, Wicha M, Schottenfeld D. Diet and risk of breast cancerrecurrence and survival. Breast Cancer Research and Treatment1999;53:241–53.
90. Levi F, Pasche C, Lucchini F, Chatenoud L, Jacobs D, La Vecchia C. Refinedand whole grain cereals and the risk of oral, oesophageal and laryngealcancer. Eur J Clin Nutr 2000;54:487–9.
91. Chatenoud L, La Vecchia C, Franceschi A, Tavani A, Jacobs D, Parpinel Met al. Refined-cereal intake and risk of selected cancers in Italy. Am J ClinNutr 1999;70:1107–10.
92. Fuchs C, Giovannucci E, Colditz G, Hunter D, Stampfer M, Rosner B et al.Dietary fibre and the risk of colorectal cancer and adenoma in women.New Eng J Med 1999;340:169–76.
93. Brunner E, Wunsch H, Marmot M. What is an optimal diet? Relationship ofmacronutrient intake to obesity, glucose tolerance, lipoprotein cholesterollevels and the metabolic syndrome in the Whitehall II Study. Int J Obes2001;25:45–53.
94. Aldoori W, Giovannucci E, Rockett H, Sampson L, Rimm E, Willett W.A prospective study of dietary fiber types and symptomatic diverticulardisease. J Nutr 1998;128:714–19.
99
3.3 INCLUDE LEAN MEAT, FISH, POULTRY AND/OR ALTERNATIVES
Dietary Guidelines for Children and Adolescents in Australia
3 . 3 I N C L U D E L E A N M E AT, F I S H , P O U LT RYA N D / O R A LT E R N AT I V E S
K a t r i n e B a g h u r s t
T E R M I N O L O G Y
Meat
Meat includes all or part of the carcass of any cattle, sheep, goat, buffalo,kangaroo, camel, deer, goat, pig or rabbit. For the purpose of this guideline, theterm refers to the muscle component only; it excludes offal such as liver andkidney.
Red meat
For the purpose of this guideline, red meat refers to the muscle meat from cattle,sheep, goat and kangaroo. It does not include pork, ham or bacon; in other partsof the world—such as the United States, the United Kingdom and Europe—redmeat includes pig meat.
Poultry
Poultry refers to chicken, duck, turkey and all other avian foods except eggs.
Alternatives
Alternatives refers to other protein-rich foods, such as eggs, liver and kidney,shellfish, legumes, nuts and nut pastes, and certain seeds, such as sunflower andsesame seeds.
Anaemia
There are a number of forms of anaemia. Microcytic anaemia (referring to smallred blood cells) is a deficiency of red blood cells or their haemoglobin; it isoften, but not always, related to iron deficiency. Macrocytic anaemia (referring tolarge red blood cells) is prevalent in some groups (such as IndigenousAustralians) and may in some cases be associated with deficiencies of othernutrients, especially folate and vitamin B
12.
100 Dietary Guidelines for Children and Adolescents in Australia
3.3 INCLUDE LEAN MEAT, FISH, POULTRY AND/OR ALTERNATIVES
Iron deficiency
Iron deficiency refers to a condition of low body iron, which may manifest itselfas low serum iron, low serum ferritin, high serum iron–binding capacity, areduced transferrin saturation index and/or high–free erythrocyte protoporphyrin.It can cause fatigue, listlessness and pallor and may progress to anaemia. It canalso have widespread non-haematological effects on behaviour, cognition andmotor development, physical work performance, and body temperatureregulation.
B A C K G R O U N D
Meats, fish, poultry and their alternatives contribute a number of importantnutrients, some of which are marginal in the Australian diet. The foods in thisfood group are very valuable sources of protein as well as being a major sourceof a number of minerals and vitamins, such as iron, zinc, vitamin B
12(see Table
3.3.1) and, in the case of fish, n-3 fats.
Red meats
Red meats are a valuable source of dietary protein and the best source ofbioavailable iron in the Australian diet. They provide substantial amounts of zincand vitamin B
12 and the lean varieties provide from 2 to 5 grams per 100 grams
of dietary fat, with almost equal contributions from saturated and mono-unsaturated fats and a small amount of polyunsaturated fat.
Pork and poultry
Pork and poultry contain amounts of protein equivalent to those in red meats—about 20 grams per 100 grams. They are also valuable sources of bioavailableiron and zinc, but their content of these minerals is less than half that of the redmeats per unit weight. Their vitamin B
12content is also substantially less (see
Table 3.3.1). The fat content of lean pork and skinless chicken is in the samerange as that for lean red meats; lean pork has equal amounts of saturated andmono-unsaturated fats but a higher proportion of polyunsaturated fats comparedwith lean red meats. Skinless chicken has a higher proportion of both mono-unsaturates and polyunsaturates compared with the other meats.
Fish
Fish contain amounts of protein equivalent to those in red meats, pork andpoultry. They also provide bioavailable iron and zinc, but at markedly lowerlevels than red meats. In contrast, the vitamin B
12 level of fish is similar to that of
red meat or even higher, depending on the species. Fish are also a valuablesource of iodine, which is in marginal supply in some areas of Australia. The fat
101
3.3 INCLUDE LEAN MEAT, FISH, POULTRY AND/OR ALTERNATIVES
Dietary Guidelines for Children and Adolescents in Australia
content of fish is variable (see Table 3.3.1), ranging from 1 per cent to 10 percent or more by weight for oily fish. Fish, particularly the oily fish, are a veryrich source of n-3 polyunsaturated fats, which are also found in some othermuscle meats but at very much lower levels. These n-3 fats have been shown toprovide specific health benefits, notably in relation to brain development andfunction and cardiovascular health (see ‘Scientific basis’ in this guideline andSection 3.6).
Alternatives
A number of foods can provide some of the key nutrients found in meats, fishand poultry, among them eggs, liver and kidney, shellfish, and plant foods suchas legumes, nuts and some seeds. These foods are generally good sources ofprotein but have highly variable amounts of bioavailable iron, zinc and vitaminB
12. Consumption of legumes, nuts and seeds is encouraged for everyone; for
vegetarians, additional serves of these foods, together with cereals, can alsocontribute many of the nutrients provided by meats, poultry and fish in anomnivore diet.
Eggs
Eggs have slightly lower protein content than the muscle meats. They are a goodsource of vitamin B
12and provide substantial amounts of iron and zinc, although
the iron is not as bioavailable. They also contain substantial amounts ofcholesterol, which might be important for some individuals, but they represent avaluable occasional protein alternative to muscle foods.
Shellfish
Shellfish have a nutrient profile similar to that of eggs, although the cholesterolcontent is variable, with prawns and squid having relatively high levels, mussels,crab and lobster being intermediate, and scallops having low levels.
Liver and kidneys
Liver and kidneys are also good protein sources, very high in bioavailable ironand zinc and particularly high in vitamin B
12; they are, however, somewhat high
in cholesterol.
Legumes, nuts and certain seeds
Legumes, nuts and certain seeds are also valuable sources of protein and, to alesser degree, iron and zinc. Whole nuts are not suitable for young childrenbecause of potential problems with choking, but they can be fed in paste form.Iron and zinc from plant sources are less bioavailable than they are from animalsources. Legumes, nuts and certain seeds, along with other plant foods, havebeen shown to offer specific health benefits (see Section 3.1) and their inclusionin the diet is recommended for everyone. They are particularly valuable in avegetarian diet as an alternative source of protein and other important nutrients.
102 Dietary Guidelines for Children and Adolescents in Australia
3.3 INCLUDE LEAN MEAT, FISH, POULTRY AND/OR ALTERNATIVES
Other health benefits are thought to relate to their glycaemic properties(legumes), their phytoestrogen content (soybeans) or their fatty acid profile (nutsand certain seeds). The plant-based alternatives to meat, fish and poultry do notnaturally provide any vitamin B
12, but fortified products are available. For
vegetarians, these foods, together with cereal foods, can provide most (but notall) of the nutrients provided by meats, fish and poultry. Other key nutrients,such as vitamin B
12and n-3 fatty acids, may need to be obtained through
fortified foods or supplements.
Current intakes of of meat, fish, poultry and alternatives
The Australian Guide to Healthy Eating1—which is based on the NHMRC’s corefood group model2—recommends between a half and one serving of this foodgroup a day for children aged 4–7 years, depending on the pattern of intake ofother foods; one to one-and-a-half servings for 8–11 year olds; and one to twoservings for adolescents. A sample serve equates to 65–100 grams of cookedmeat or chicken; half a cup (cooked) of dried beans, lentils, chick peas, splitpeas or canned beans; 80–120 grams of cooked fish fillet; two small eggs; one-third of a cup of almonds or peanuts; or a quarter of a cup of sunflower orsesame seeds.
The Australian Guide to Healthy Eating recommends that red meat be eatenthree to four times a week; less than this and high-iron replacement foods willbe required. The guide adds that this is especially important for girls, women,vegetarians and athletes.
The National Nutrition Survey of 19953 showed that children aged 2–7 years wereconsuming 60–80grams/day of meat, poultry and game products and dishes withthis rising to about 108 g/day at 8–11yrs, 130g/day at 12–15 yrs and 160 g/day at16–18yrs. Of this, muscle meat contributed 10–15g in 2–7 yr olds, 25g in 8–11yrolds and about 40g/day in 12–18yr olds. Poultry ranged from 8–10 g/day in 2–11yr olds, to 18g/day in 12–15 yr olds and 31g/day in 16-18yr olds. Sausagesand processed meats combined, ranged from 13–17g/day at all ages.
Fish and seafood products and dishes intake averaged 6.7g/day in 2–3yr olds,12–13g/day in 4–11yr olds and 16–18g/day in 12–18yr olds with eggs averaging4–6g/day in 2–15 yr olds and 8g/day in 16–18yr olds. Legumes and pulseproducts and dishes averaged about 7g/day in 2–7yr olds, 4g/day in 8–11yr oldsand 10–13g/day in 12–18yr olds.
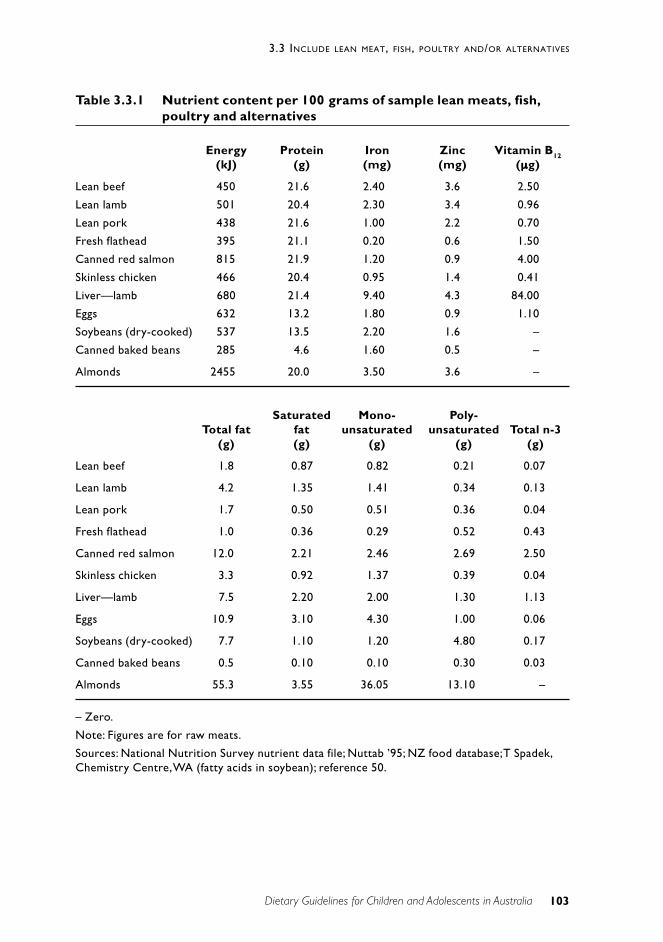
103
3.3 INCLUDE LEAN MEAT, FISH, POULTRY AND/OR ALTERNATIVES
Dietary Guidelines for Children and Adolescents in Australia
Table 3.3.1 Nutrient content per 100 grams of sample lean meats, fish,poultry and alternatives
Energy Protein Iron Zinc Vitamin B12
(kJ) (g) (mg) (mg) (µµµµµg)
Lean beef 450 21.6 2.40 3.6 2.50
Lean lamb 501 20.4 2.30 3.4 0.96
Lean pork 438 21.6 1.00 2.2 0.70
Fresh flathead 395 21.1 0.20 0.6 1.50
Canned red salmon 815 21.9 1.20 0.9 4.00
Skinless chicken 466 20.4 0.95 1.4 0.41
Liver—lamb 680 21.4 9.40 4.3 84.00
Eggs 632 13.2 1.80 0.9 1.10
Soybeans (dry-cooked) 537 13.5 2.20 1.6 –
Canned baked beans 285 4.6 1.60 0.5 –
Almonds 2455 20.0 3.50 3.6 –
Saturated Mono- Poly-Total fat fat unsaturated unsaturated Total n-3
(g) (g) (g) (g) (g)
Lean beef 1.8 0.87 0.82 0.21 0.07
Lean lamb 4.2 1.35 1.41 0.34 0.13
Lean pork 1.7 0.50 0.51 0.36 0.04
Fresh flathead 1.0 0.36 0.29 0.52 0.43
Canned red salmon 12.0 2.21 2.46 2.69 2.50
Skinless chicken 3.3 0.92 1.37 0.39 0.04
Liver—lamb 7.5 2.20 2.00 1.30 1.13
Eggs 10.9 3.10 4.30 1.00 0.06
Soybeans (dry-cooked) 7.7 1.10 1.20 4.80 0.17
Canned baked beans 0.5 0.10 0.10 0.30 0.03
Almonds 55.3 3.55 36.05 13.10 –
– Zero.
Note: Figures are for raw meats.
Sources: National Nutrition Survey nutrient data file; Nuttab ’95; NZ food database; T Spadek,Chemistry Centre, WA (fatty acids in soybean); reference 50.
104 Dietary Guidelines for Children and Adolescents in Australia
3.3 INCLUDE LEAN MEAT, FISH, POULTRY AND/OR ALTERNATIVES
S C I E N T I F I C B A S I S
Although this food group is a major provider of a number of importantnutrients—protein, zinc, vitamin B
12and, for fish, n-3 fatty acids—it is as a
source of bioavailable iron that it plays its most unique public health role.
Iron
The effects of anaemia and iron deficiency on brain development in infancy andvery early childhood are well documented4–7; randomised trials are alsoproducing evidence of their effects on cognitive processes—verbal learning andmemory—in adolescence.8 Iron deficiency in childhood and adolescence mayalso be associated with reduced work capacity, a less efficient response toexercise, and impaired immune function.9,10
As part of the haemoglobin in red blood cells, iron helps to transport oxygenaround the body. As part of the enzymes of the electron transport chain, it isnecessary for the production of energy from glucose, the main fuel for both thebrain and the rest of the body. Iron is also a vital component of enzymesresponsible for brain development and essential for the synthesis of keyneurotransmitters required for normal brain function.11 Low iron intakes—coupled with increased requirements among population subgroups such asadolescent girls, vegetarians and pregnant women—make iron deficiency asignificant public health concern.
Infancy and early childhood
From birth to the age of 6 months, iron stores are heavily influenced by themother’s iron status during pregnancy. Between the ages of 6 and 12 months, astage of rapid psychomotor development, poor feeding practices place manyinfants at risk of iron deficiency. The effects of anaemia and iron deficiency onbrain development in infancy and very early childhood are well documented.4–7
Toddlers and preschoolers often have limited food habits, yet their energy andiron demands for growth are high. Iron stores can be affected by the duration ofexclusive breastfeeding, delayed introduction of solids, and excessive use ofcow’s milk.
Iron intakes appear to be low in the diets of very young children in Australia:the 1995 National Nutrition Survey found that one in three 2–3 year olds hadintakes below the recommended dietary intake on the day of the survey and onein 10 were below 70 per cent of the RDI. About 50 per cent of adolescent girlsand 20 per cent of adolescent boys also did not meet the RDI for iron on the dayof the survey; further, some 25 per cent of the girls and 6–8 per cent of the boyshad intakes below 70 per cent of the RDI.12
Studies of the extent of the problem of iron deficiency in children andadolescents in Australia have been done only on relatively small groups ofchildren to date, but the results suggest that significant numbers of children (upto 35 per cent), particularly young children, may be iron-depleted. Aboriginal
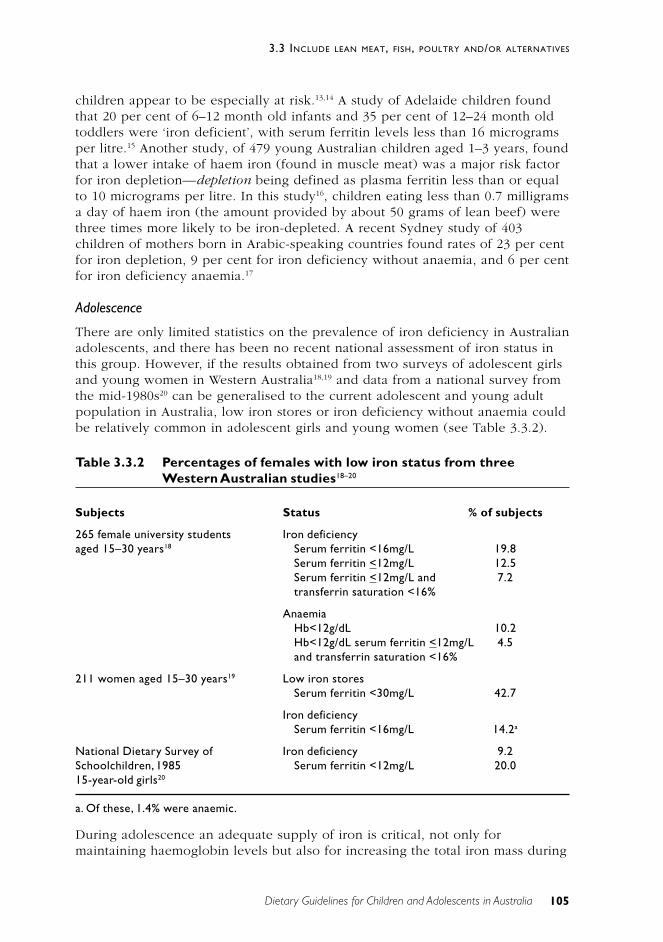
105
3.3 INCLUDE LEAN MEAT, FISH, POULTRY AND/OR ALTERNATIVES
Dietary Guidelines for Children and Adolescents in Australia
children appear to be especially at risk.13,14 A study of Adelaide children foundthat 20 per cent of 6–12 month old infants and 35 per cent of 12–24 month oldtoddlers were ‘iron deficient’, with serum ferritin levels less than 16 microgramsper litre.15 Another study, of 479 young Australian children aged 1–3 years, foundthat a lower intake of haem iron (found in muscle meat) was a major risk factorfor iron depletion—depletion being defined as plasma ferritin less than or equalto 10 micrograms per litre. In this study16, children eating less than 0.7 milligramsa day of haem iron (the amount provided by about 50 grams of lean beef) werethree times more likely to be iron-depleted. A recent Sydney study of 403children of mothers born in Arabic-speaking countries found rates of 23 per centfor iron depletion, 9 per cent for iron deficiency without anaemia, and 6 per centfor iron deficiency anaemia.17
Adolescence
There are only limited statistics on the prevalence of iron deficiency in Australianadolescents, and there has been no recent national assessment of iron status inthis group. However, if the results obtained from two surveys of adolescent girlsand young women in Western Australia18,19 and data from a national survey fromthe mid-1980s20 can be generalised to the current adolescent and young adultpopulation in Australia, low iron stores or iron deficiency without anaemia couldbe relatively common in adolescent girls and young women (see Table 3.3.2).
Table 3.3.2 Percentages of females with low iron status from threeWestern Australian studies18–20
Subjects Status % of subjects
265 female university students Iron deficiencyaged 15–30 years18 Serum ferritin <16mg/L 19.8
Serum ferritin <12mg/L 12.5Serum ferritin <12mg/L and 7.2transferrin saturation <16%
AnaemiaHb<12g/dL 10.2Hb<12g/dL serum ferritin <12mg/L 4.5and transferrin saturation <16%
211 women aged 15–30 years19 Low iron storesSerum ferritin <30mg/L 42.7
Iron deficiencySerum ferritin <16mg/L 14.2a
National Dietary Survey of Iron deficiency 9.2Schoolchildren, 1985 Serum ferritin <12mg/L 20.015-year-old girls20
a. Of these, 1.4% were anaemic.
During adolescence an adequate supply of iron is critical, not only formaintaining haemoglobin levels but also for increasing the total iron mass during
106 Dietary Guidelines for Children and Adolescents in Australia
3.3 INCLUDE LEAN MEAT, FISH, POULTRY AND/OR ALTERNATIVES
this period of rapid growth. Iron requirements for boys increase during the‘growth spurt’ as new muscle is laid down; with the slowing of growth at the endof puberty, iron requirements decline. Although girls develop less extra muscletissue than boys, the onset of menstruation increases the need for iron and thisincreased need continues throughout reproductive life.21 Adolescent girls aretherefore at risk of developing iron deficiency as a consequence of the combinedeffects of continuing growth, menstrual iron losses, and a low intake of dietaryiron.
A South Australian study has shown that adolescent girls have a tendency torestrict their intake of meat—a major source of bioavailable iron—or avoid italtogether, often because of an interest in vegetarianism, environmentalism,fashion or body appearance. The study showed that up to 37 per cent of teenagegirls restricted their intake of meat, particularly beef and lamb.22
Sources of iron, promotors, inhibitors and bioavailability
Western mixed diets contain 1.0 to 1.4 milligrams of iron per 1000 kilojoules.23
Hence most adults will ingest over 10 milligrams of iron daily, which,theoretically, should be sufficient to meet the needs of most of the population.24
But only a small, and variable, proportion (5–20 per cent) of dietary iron isabsorbed. Haem iron is approximately 25 per cent absorbed, and non-haem iron(found in plants) is about 15 per cent absorbed.25 Consumption of meat, fish orpoultry increases absorption of haem iron and, even in relatively small amounts(50–75 grams) in a mixed meal, can increase absorption from the plant foods inthe meal up to twofold.26 Non-tissue animal foods such as eggs and milk do notappear to enhance iron absorption and can decrease non-haem iron absorption.27
Addition of foods rich in vitamin C or fruit juices to a meal can also greatlyincrease the absorption of iron from that meal in a dose-dependent manner—afactor of five or greater.28
Conversely, certain plant foods can contain inhibitors to absorption. Bothwell etal.29 have extensively reviewed the bioavailability of iron from various naturalplant sources. Polyphenols (such as tannins), which are a component of all planttissue, have an inhibitory action29,30, the degree of inhibition correlating well withthe polyphenol content of individual vegetables. Tea and, to a lesser extent,coffee also profoundly inhibit iron absorption by binding the iron to forminsoluble compounds with tannins.31 Whilst most alcoholic drinks appear to assistiron absorption, this does not apply to some red wines, because of the tannincontent.26,31 Phytates are also inhibitory and are present in substantial quantitiesin many cereals and legumes; the quantitative relation between these compoundsand iron absorption is, however, less clear cut.29
Calcium supplements have been shown to inhibit iron absorption32, and somepractitioners recommend consumption of primary iron and calcium sources ondifferent meal occasions to optimise absorption. However, addition of milk to acereal-based meal has been shown to have no effect on iron absorption in agroup of young women33, and long-term calcium supplementation has beenshown not to lower plasma ferritin concentration in human subjects.34
107
3.3 INCLUDE LEAN MEAT, FISH, POULTRY AND/OR ALTERNATIVES
Dietary Guidelines for Children and Adolescents in Australia
Where the plant-based foods from this category are preferred, care is thereforenecessary, so that iron intake is sufficient to overcome the lower bioavailabilityand the inhibitory components in plant foods. A wide range of iron-fortified foodproducts are now available—with varying, but often unknown, ironbioavailability.
Recommended intakes and current consumption of iron
The current Australian recommended dietary intakes of iron24 for infants, childrenand adolescents range from 0.5 milligrams a day for breastfed infants to 3mg/dayfor formula-fed infants, 9mg/day for 7–12 month olds, 6–8mg/day for 1–11 yearolds, and 10–13mg/day for 12–18 year olds.
The recent review of the US recommended dietary allowances (RDAs) set anadequate intake for iron of 0.27mg/day for infants aged 0–6 months because itwas felt that sufficient data were not available to set an estimated averagerequirement (EAR) or RDA. The review set an EAR of 6.9mg/day and an RDA(EAR+2SD) of 11mg/day for infants aged 7–12 months; an EAR of 3mg/day andan RDA of 7.0mg/day for children aged 1–3 years; an EAR of 4.1mg/day and anRDA of 10.0mg/day for 4–8 year olds; EARs of 5.9mg/day for boys aged 9–13years and 5.7mg/day for girls of that age and, for both genders, an RDA of8.0mg/day; an EAR of 7.7mg/day and an RDA of 11.0mg/day for boys aged 14–19 years and an EAR of 7.9mg/day and an RDA of 15.0mg/day for girls of thatage. The US recommended dietary allowance for vulnerable adolescent girls isthus considerably higher than the current Australian recommended dietary intakefor iron.
The US review also set recommended dietary allowances for vegetarians, atalmost double those for omnivores because of the lower bioavailability of ironfrom plant sources.
In the 1995 National Nutrition Survey in Australia35, the ‘meat, poultry, game,products and dishes’ category provided 14–19 per cent of the iron in the diets ofchildren and adolescents, depending on age and gender, and fish and seafoodprovided an additional 1–2 per cent. Red meats were the main contributor, andthey also contributed over 55 per cent to haem iron.12 The other importantcontributor to iron intake (mostly non-haem iron) was the ‘cereal and cerealproducts’ category (at about 40 per cent); vegetables contributed 8–12 per cent.
Zinc
Zinc is important in a number of major metabolic processes, among them thesynthesis of protein and nucleic acid and the synthesis and action of insulin. It isinvolved in immune function and cell growth and repair. The long-term effects ofmild zinc deficiency are unclear but may include delayed wound healing,impaired immune function, and problems with taste and smell acuity.36
Strong homeostatic mechanisms regulate zinc, and this, together with a lack ofsensitive indicators of zinc status, means it is difficult to determine the
108 Dietary Guidelines for Children and Adolescents in Australia
3.3 INCLUDE LEAN MEAT, FISH, POULTRY AND/OR ALTERNATIVES
prevalence of zinc deficiency in a community and to set recommended intakes.Furthermore, the bioavailability of zinc varies markedly between foods and, aswith iron, is affected by the composition of the diet. Zinc from animal sources,including eggs, is generally better absorbed than zinc from plant foods. Forexample, 21–26 per cent of the zinc in beef is absorbed, compared with 11–14 per cent of the zinc in wholemeal bread.37 Absorption of zinc is reduced byphytate in plant foods such as peanuts and soybeans.38 While calcium and ironcan potentially reduce zinc absorption, the effect caused by food intake of theseminerals is likely to be relatively small.39
Recommended and current intakes of zinc
The Australian recommended dietary intake for zinc24 ranges from 3.0 milligramsa day for breastfed infants and 3–6mg/day for formula-fed infants to 4–5mg/dayfor children aged from 7 months to 3 years, 6.0mg/day for 4–7 year olds, 9.0mg/day for 8–11 year olds, and 12.0mg/day for 12–18 year olds.
The recent review of the US recommended dietary allowances concluded thatonly an estimate could be made of the adequate intake for infants aged to 6months; this was set at 2.0mg/day. For infants and young children aged 7 monthsto 3 years, an EAR of 2.2mg/day and an RDA of 3.0mg/day were set; for childrenaged 4–8 years, an EAR of 4.0mg/day and an RDA of 5.0mg/day were set; for 9–13 year olds, the EAR was 7.0mg/day and the RDA 8.0mg/day; and for 14–18year olds, an EAR of 8.5mg/day and an RDA of 11mg/day were set for boys andan EAR of 7.5mg/day and an RDA of 9.0mg/day were set for girls. In contrast tothe iron recommendations, the US recommended dietary allowances foradolescent girls are markedly lower than the current Australian recommendeddietary intake for zinc and slightly less for adolescent boys.
The 1995 National Nutrition Survey35 showed that nearly three-quarters ofadolescent girls and women had zinc intakes less than the recommended dietaryintake of 12.0mg/day and almost half had intakes below 70 per cent of the RDIon the day of the survey. For 2–3 year olds, 8 per cent of boys and 7 per cent ofgirls had intakes less than 70 per cent of the RDI, and the proportion rosesteadily up to the age of 12–15 years, where 24 per cent of boys and 56 per centof girls consumed less than 70 per cent of the RDI on the day of the survey.
It is of interest to note that the new US recommended dietary allowance of zincfor women (8.0mg/day) is one-third lower than the current Australianrecommended dietary intake for women (12mg), which was set in 1991. Thefigures for men are about the same—11.0mg in the United States and 12.0mg inAustralia. It is therefore possible that the large proportion of women in Australiaapparently at risk of low zinc intake might, in part, be due to an overestimate ofrequirements as a consequence of the limited data available at the time of settingthe Australian RDIs.
In the National Nutrition Survey12,35, the ‘meat, poultry and game products anddishes’ category provided 28–35 per cent of the zinc in the diets of children andadolescents. Muscle meats provided 10–15 per cent; poultry, 2–3 per cent; andfish and seafood, 1–2 per cent. The proportion of the population recording a low
109
3.3 INCLUDE LEAN MEAT, FISH, POULTRY AND/OR ALTERNATIVES
Dietary Guidelines for Children and Adolescents in Australia
zinc intake in the survey was inversely related to red meat consumption on theday of the survey.12
Vitamin B12
Vitamin B12
plays an important biochemical role in the maintenance of myelin inthe nervous system and, in conjunction with folate, in the synthesis of DNA.CSIRO research has demonstrated the importance of vitamin B
12in maintaining
genetic stability: chromosome damage was shown to be lower with higherplasma vitamin B
12 levels and lower plasma homocysteine levels.
Supplementation with folate and vitamin B12 (at 3.5 to 10 times the
recommended dietary intake) can also reduce such chromosome damage.40 It isnot clear, however, what the overall health implications are in relation to theassociations seen between vitamin B
12and genetic damage.
Another CSIRO study demonstrated that non-vegetarian males aged 20–40 yearshad a significantly lower rate of genetic damage than vegetarian males of thesame age.41 This is thought to be a result of the protective effects of vitamin B
12
in the diet of non-vegetarians.
The main forms of vitamin B12
available to humans come from animal productsin which the vitamin has accumulated from bacterial synthesis. Althoughoccasional contamination of soil or water with microbes that produce vitamin B
12
occurs, plant foods are usually devoid of the active form of the vitamin. Becauseof the importance of animal foods as a source of this vitamin, dietary vitamin B
12
deficiency can be a problem in vegetarians.42
The most prevalent deficiency of vitamin B12 is sub-clinical deficiency,
recognised by changes in biochemical levels in the blood. The normal serumvitamin B
12 is usually taken as 200 picograms per millilitre (or 150 picomoles per
litre). Low vitamin B12 levels (as well as low folate and low B
6) have been shown
to correlate with raised plasma homocysteine43,44, which is a risk factor forcardiovascular disease. However, the importance of dietary intake of vitamin B
12
in prevention (or correction) of raised plasma homocysteinuria is not clear.
In one Melbourne study, Mann et al. measured serum vitamin B12, homocysteine
and folate in healthy men aged 20–55 years45 eating a wide range of diets, fromhigh-meat to vegan, and found a strong negative correlation (r = –0.37) betweenserum vitamin B
12and plasma homocysteine in the combined subjects of the four
groups. All meat-eaters in the study had serum vitamin B12
in the normal range(200–1100pg/ml), but 23 per cent of the lacto-ovo-vegetarians and 65 per cent ofthe vegans had serum vitamin B
12below 200pg/ml. It is not certain how
representative these figures might be of the sub-populations involved since theywere based on 18 vegans, 43 lacto-ovo-vegetarians, 60 meat-eaters and 18 highmeat-eaters, but they do indicate marked differences across eating styles. Ifhomocysteine levels are higher in vegetarians or vegans as a result of lower B
12
levels, it is unclear whether normalising this would bring them cardiovascularbenefits additional to those sometimes seen with vegetarian diets.
110 Dietary Guidelines for Children and Adolescents in Australia
3.3 INCLUDE LEAN MEAT, FISH, POULTRY AND/OR ALTERNATIVES
Low vitamin B12
status has also been associated with impaired cognitivefunction46 in relation to fluid intelligence (the ability to assimilate and use newinformation) in adolescents who had previously been long-term vegans, and inrelation to memory performance in adult women from the Australian population.There are, however, only limited data on the vitamin B
12status of Australian
children and adolescents.
Recommended and current intakes of vitamin B12
The Australian recommended dietary intake of vitamin B12
is 0.3 micrograms aday for breastfed and formula-fed infants, 0.7µg/day for infants aged 7–12months, 1.0µg/day for 1–3 year olds, 1.5µg/day for 4–11 year olds, and 2.0µg/day for 12–18 year olds.24
The recent review of the US recommended dietary allowances48 established anadequate intake of 0.4µg/day for infants aged to 6 months and 0.5µg/day forinfants aged 7–12 months. An estimated average requirement of 0.7µg/day andan RDA of 0.9µg/day were set for 1–3 year olds; for 4–8 year olds the EAR wasset at 1.0µg/day and the RDA at 1.2µg/day; for 9–13 year olds the EAR was set at1.5µg/day and the RDA at 1.8µg/day; and for 14–18 year olds the EAR was set at2.0µg/day and the RDA at 2.4µg/day.
An analysis of the 1995 National Nutrition Survey12, using the vitamin B12
fooddatabase from the United States, gave an estimated daily intake of 3.0µg for 2–3year olds, 2.8µg for 4–7 year olds, 3.6µg for 8–11 year olds, 4.3µg for 12–15 yearolds, and 4.6µg for 16–18 year olds.
Protein
Proteins are the fundamental structural compounds of cells, antibodies, enzymesand many hormones. An adequate intake of protein containing all the essentialamino acids is therefore crucial for optimal growth and development in childrenand adolescents. Protein may also play a role in satiety, and it constitutes almostthe sole form in which humans can replace nitrogen. Twenty-three amino acidsare used to construct proteins; of these, eight are classified as essential sincethey must be supplied in food.
Proteins vary in their digestibility. The protein from meats, fish and poultry ishighly digestible (90 per cent or more); this compares with a digestibility of78 per cent in beans and 86 per cent in whole wheat.49
Net protein utilisation50 is generally higher for animal protein sources (NPU 0.75–0.8) compared with many, but not all, plant foods (NPU 0.5–0.6).
Recommended and current intakes of protein
Protein recommendations for children and adolescents must take account ofmaintenance requirements as well as the increasing assimilation requirements ofyoung children and the growth spurts of older children and adolescents. There isno recommended intake for breastfed infants aged less than 6 months, but for
111
3.3 INCLUDE LEAN MEAT, FISH, POULTRY AND/OR ALTERNATIVES
Dietary Guidelines for Children and Adolescents in Australia
formula-fed infants the RDI is 2.0 grams per kilogram of body weight and for allinfants aged 7–12 months it is 1.6g/kg. By 1–3 years of age, the RDI is 14–18 grams per day, rising to 18–24g/day at 4–7 years, 27–39g/day at 8–11 years,42–60g/day for boys aged 12–15 years and 44–55g/day for girls of this age, and64–70g/day for 16–18 year old boys and 57g/day for girls of this age. TheAustralian RDI was developed in the late 1980s.24 The US review set an adequateintake figure of 9.1g/day or 1.52g/kg/day for infants aged 0–6 months; an RDAof 1.5g/kg/day for infants aged 7–12 months; and an RDA of 13g/day forchildren aged 1–3 years, 19g/day for those aged 4–8 years, and 34g/day forthose aged 9–13 years. For boys aged 14–18 years, an RDA of 52g/day was set,and for girls of that age the RDA was set at 46g/day.
According to the 1995 National Nutrition Survey35, 2–3 year olds were consumingon average 55 grams of protein a day; 4–7 year olds some 64g/day; 8–11 yearolds 82g/day; 12–15 year old boys 88g/day and girls that age 74g/day; and 16–18year old boys 101g/day and girls of that age 80g/day. The survey found that the‘meat, poultry and game products and dishes’ category provided a mean of25 per cent of the protein in 2–11 year olds and just over 30 per cent in 12–18year olds. Other major sources were the dairy group (25 per cent in 2–11 yearolds and 19 per cent in 12–18 year olds), and cereal and cereal products (18 percent in 2–11 year olds and 16 per cent in 12–18 year olds).
Total and saturated fats
Meats are often perceived as a major source of dietary fat and saturated fat.However, although some individual cuts or products can be relatively high in fat,an analysis of the 1995 National Nutrition Survey showed that meats do notcontribute as much fat as is commonly believed. For instance, the analysisshowed that red meat per se contributes an average of only 6 per cent of thetotal fat in adults’ diets, 9 per cent of the saturated fat, 12 per cent of theunsaturated fats (mainly mono-unsaturated), and 17 per cent of the cholesterol.12
Changes in both the meat supply and consumer preferences in Australia areaffecting the contribution of meats to fat and saturated fat intakes.
Excess dietary fat (and saturated fat) intake has been linked to a number ofadverse health outcomes (see Chapter 2 and Section 3.6). However, theconfounding of fat intake with the intake of certain components of this foodgroup, notably meats, has led to some confusion in interpretation ofepidemiological data linking dietary components to chronic disease outcomes,particularly in relation to cancer. In the United States, where much of theepidemiological research data comes from, the fat content of meat isconsiderably higher than in Australia52–54, and meats contribute more markedly tooverall fat and saturated fat intake.
An important 1997 publication claimed a role for fat and meat in colon cancer55,but the recent European Conference on Nutrition and Cancer56 concluded therewas no association between fresh red meat and colorectal cancer. In addition,three recent Australian reviews of the cancer epidemiology literature have largely
112 Dietary Guidelines for Children and Adolescents in Australia
3.3 INCLUDE LEAN MEAT, FISH, POULTRY AND/OR ALTERNATIVES
exonerated fresh meats per se from a role in cancer causation and, in particular,colon cancer. An expert panel review of the role of red meat in colon cancerconcluded that the balance of epidemiological evidence indicates that prevailinglevels of lean red meat consumption in Australia are not linked with thedevelopment of cancer.57 This conclusion is consistent with that of the NationalHealth and Medical Research Council concerning diet and colorectal cancer—which recommends a reduction in total fat intake but makes no recommendationabout meat intake58—and with that of an earlier review of red meat and variouscancers.59 The Cancer Council of Australia’s National Cancer Prevention Policy2001–2003 also supports this view.60 Recent research in Europe suggests,however, that caution may still be necessary in connection with certain food-preparation techniques and the consumption of cured and smoked meats56,although the Cancer Council of Australia concluded that there was insufficientevidence at present to support a causal relationship.60
An expert review of red meat and health also concluded that diets rich in leanred meat could still be low in fat and saturated fat and not adversely affectplasma cholesterol levels and that lean red meat could be included inmanagement strategies for the prevention and treatment of obesity.61 Theconclusions of the review concur with nutrition statements from the NationalHeart Foundation of Australia and have the support of the Dietitians Associationof Australia as a useful summary of the contribution of red meat to healthyeating.
n-3 fats
Found predominantly in fish, n-3 fats appear to have a number of beneficialactions, notably in relation to brain development and function and cardiovascularhealth. (The role of n-3 fats in the diet is discussed in more detail inSection 3.6.) Australians’ intake of long-chain n-3 fatty acids has been estimatedto be less than 200 milligrams a day (an average of about 100mg), and mostauthorities recommend an intake of 214–650mg/day.63 Fish and seafood are byfar the richest sources of n-3 fats. However, Ollis et al.64 found in a study of 83healthy Australian adults that meat was also a major contributor to the dietaryintake of very long chain n-3 fats—contributing 29 per cent of the total. Theyattributed this to what they called the ‘relatively high’ meat intake of the group,which averaged 164 grams a day. The principle n-3 fatty acid from vegetables isalpha-linolenic acid. Vegetarians have significantly lower plasma and platelet n-3levels65,66 since alpha-linolenic acid is not as effective a source of long-chain n-3fatty acids as is the direct consumption of eicosapentaenoic acid (EPA),docosapentaenoic acid (DPA) and decosahexaenoic acid (DHA)66 from fish andmeat. There is, however, no evidence that this results in higher cardiovascularrisk in vegetarians: other beneficial dietary factors might offset the low n-3levels.
113
3.3 INCLUDE LEAN MEAT, FISH, POULTRY AND/OR ALTERNATIVES
Dietary Guidelines for Children and Adolescents in Australia
Special groups
Adolescent girls
In comparison with boys, men and post-menopausal women, menstrual lossvirtually doubles the iron requirement of adolescent girls.24 Adolescents have theadded demands of growth. Iron balance in these circumstances is problematicand requires a substantial food intake, as well as an appropriate composition ofmeals. The National Nutrition Survey data35 suggest that some females may belimiting their overall food intake, possibly because of concerns about bodyweight. Increased activity would allow greater food intake, thus increasing thelikelihood of adequate iron intake whilst maintaining a desirable body weight.
Pregnancy in adolescence
Pregnancy places females at higher risk of inadequate iron and zinc intakebecause of their increased needs and the potential for morning sickness toreduce nutrient availability. Pregnant adolescents are at additional risk becauseof their own growth needs.67
Infants born to women with low iron stores will themselves have low iron storesand, if exclusively breastfed for a prolonged period68, will be more likely todevelop anaemia. In addition, low iron status in early pregnancy is more likelyto result in premature birth and low birthweight.69,70
Low maternal serum zinc levels have been associated with congenitalmalformations, prematurity, foetal growth retardation (leading to low-birthweightbabies) and maternal morbidity.36 However, the results have not always beenconsistent.
Vegetarians
With the exception of vitamin B12, a balanced vegetarian diet can be adequate in
all nutrients; indeed, some vegetarian communities have been shown to havehealth advantages over the general population—notably in the cardiovasculararea, with reductions in risk factors such as plasma cholesterol, antioxidantstatus, clotting factors and blood pressure.71–81 It is thus possible to have ahealthy diet without using foods derived from animal sources. There are,however, several micro-nutrients for which meat, fish and poultry are thedominant and most bioavailable source and, as discussed, care needs to be takenif these foods are excluded. The American Dietetic Association recommends thatvegetarians regularly consume B
12-fortified food products. Protein from diverse
sources—legumes, nuts, cereals and dairy (if eaten)—should be included toattain the appropriate mix of amino acids and give variety.
Legumes are a valuable source of protein, fibre and micronutrients—not only forvegetarians but also for the wider community. Included in the legume categoryare beans such as soybeans, kidney beans, broad beans and haricot beans, aswell as mature dried peas, lentils and chick peas, and foods made from thisproduce; for example, hummus, falafel, bean burrito, soy and lentil burgers, soy
114 Dietary Guidelines for Children and Adolescents in Australia
3.3 INCLUDE LEAN MEAT, FISH, POULTRY AND/OR ALTERNATIVES
schnitzels, vegetarian sausages, soy slices, nutmeat, textured vegetable protein,baked beans and tofu. The evidence of potential benefits for cardiovascular andbone health conferred by isoflavones (found in soybeans) has recently beenreviewed by Messina82, but there has been very little research on children andadolescents.
Nuts and certain seeds also provide some protein and other nutrients and canhelp improve the unsaturated–saturated fat ratio in the diet. Because of theirfatty acid profile, nut consumption has been investigated in relation to thepotential to promote heart health. Several large prospective cohort studies haveexamined the relationship between nut consumption and the risk of coronaryheart disease, and all found an inverse relationship.83–85 These findings andrelated epidemiological and clinical studies have been reviewed by Sabate86 andHu and Stampfer.87 Nuts and seeds are, however, energy dense, so should beconsumed in moderate amounts. Whole nuts should not be given to youngchildren because of the risk of choking.
Athletes
Recent heightened interest in the relationship between iron status and athletes’performance has revealed an increased requirement for iron in that group,mainly because of increased intestinal losses.88,89 Because of their overallrequirements, female athletes are particularly vulnerable.
P R A C T I C A L A S P E C T S O F T H I S G U I D E L I N E
This guideline specifically refers to the inclusion of lean cuts of meat andpoultry. Some meats and some meat and poultry products or dishes that arepopular in Australia—such as pies; sausages; crumbed and fried meats, fish orpoultry; and mettwurst and salami—can contain significant amounts of saturatedfat, either from the ingredients themselves (including non-meat components suchas pastry or fillers) or from added cooking fats. These foods can be includedoccasionally in a balanced diet, but care does need to be taken with the rest ofthe diet, so as to avoid overconsumption of saturated fats. In addition, thesetypes of products do not provide the same level of iron, zinc and vitamin B
12as
the lean cuts. Selection of lean mince and removal of visible fat from meat andpoultry cuts before cooking can also help to limit fat intake.
Whilst consumption of a variety of foods from this food group is encouraged, theAustralian Guide to Healthy Eating1 recommends inclusion of red meat three tofour times a week; otherwise, high-iron replacement foods will be needed. Thisis especially the case for females and athletes. One Australian study90 showedthat in young female students an intake of 1.6 milligrams of haem iron a day (theamount in about 100 grams of lean beef) reduced the odds of having low ironstores in the body by 60 per cent. There was no relationship between iron statusand total iron intake.
115
3.3 INCLUDE LEAN MEAT, FISH, POULTRY AND/OR ALTERNATIVES
Dietary Guidelines for Children and Adolescents in Australia
Inclusion of two to three meals a week of fish high in n-3 fats—pilchards,sardines, salmon, tuna, herring, mackerel, and so on—has also beenrecommended by some health authorities. However, with limited fish supplies,this recommendation may not be attainable, or sustainable, at a population level,and n-3 fatty acid intake may have to be achieved through foods fortified with n-3 fats, in addition to natural fish sources.
Vegetarians should choose from a variety of legumes, nuts and seeds to obtainprotein, iron and zinc. Wholegrain or wholemeal cereals are also good sourcesof zinc and iron, and supplemented varieties are available. Drinking fruit juice oreating fruit at the same meal increases absorption of iron and zinc.
R E L AT I O N S H I P TO OT H E R G U I D E L I N E S
Earlier editions of the dietary guidelines included a guideline encouraging theconsumption of ‘iron-rich foods’. In this revision—to more clearly define theconcept of variety, to provide advice consistent with the Australian Guide toHealthy Eating, and to take a more consistent food-based approach—thisguideline has been replaced by one encouraging inclusion of lean meats andfish, poultry or their alternatives, with an emphasis on these foods’ value as asource of dietary iron, zinc and B
12as well as protein.
Physical activity is important for all children and adolescents
Obesity is increasing in many countries. Although many genetic, environmentaland lifestyle factors contribute to this, dietary fat intake can also be a majorfactor in the development of obesity through its effect on the energy density ofthe diet.91 A CSIRO analysis of the National Nutrition Survey showed a highcorrelation between energy density and fat content of the diet on the day ofsurvey, with dietary fat (both grams per day and percentage of fat) being a majordeterminant of energy density. Choosing low-fat varieties and low-fat cookingtechniques is therefore encouraged.
Limit saturated fat and moderate total fat intake
Lean meats and poultry and low-fat cooking methods are recommended.Australian red meat cuts are generally much leaner than their equivalents fromcountries such as the United States.
Care for your child’s food: prepare and store it safely
Illness caused by food-borne bacteria is a public health concern. All foods arepotential vectors of pathogens. In Australia the risk of food-borne illness inprimary food industries is managed across the food chain, with industry,government and consumers sharing responsibility for the delivery ofmicrobiologically safe products. Nevertheless, some foods from the meat, fish
116 Dietary Guidelines for Children and Adolescents in Australia
3.3 INCLUDE LEAN MEAT, FISH, POULTRY AND/OR ALTERNATIVES
and poultry group have been implicated in outbreaks of food-borne disease92,93,and constant vigilance is required.
C O N C L U S I O N
Inclusion of lean meats, fish, poultry and alternatives in the daily diet will helpto ensure adequate iron, zinc and vitamin 12 intake as well as providing avaluable source of protein. Lean red meats are a particularly valuable source ofiron, zinc and B
12and fish is a particularly good source of omega-3 fats. Whilst
well planned vegetarian diets can provide both iron and zinc in adequateamounts, care needs to be taken to ensure intake of adequate iron and zinc fromthe less bioavailable plant sources and particular attention has to be paid toalternative vitamin B
12sources.
E V I D E N C E
The scientific rationale for this guideline is based on a variety of evidencesources, among them the following:
• two well-designed randomised controlled trials (Level IIIevidence) relatingto iron supplementation and cognition (references 8,8)
• a meta-analysis of case-control and cohort studies (Level III evidence)assessing the effects of red meat on cancer (reference 59); of irondeficiency on cognition (reference 6); of vitamin B
12on cognition
(reference ); of red meat consumption on cardiovascular disease riskfactors (reference 74); of nut consumption on cardiovascular disease(references 83 and 85-87); of various foods, drinks or nutrients on iron orzinc bioavailability and absorption (references 28,31–34, 37,39); and ofdiet on homocysteine status (references 43 to 45).
Evidence was also obtained from a number of cross-sectional population studies,as well as human experimentation relating to bioavailability and nutrientrequirements and intakes, and expert reviews of selected issues.
R E F E R E N C E S
1. Children’s Health Development Foundation & Deakin University. TheAustralian guide to healthy eating. Canberra: Australian GovernmentPublishing Service, 1998.
2. Cashel K, Jefferson S. The core food groups. the scientific basis fordeveloping nutrition education tools. Canberra: Australian GovernmentPublishing Service, 1995.
3 Australian Bureau of Statistics. National Nutrition Survey. Foods Eaten.Australia 1995. ABS Canberra , Australian Bureau of Statistics, 1999
117
3.3 INCLUDE LEAN MEAT, FISH, POULTRY AND/OR ALTERNATIVES
Dietary Guidelines for Children and Adolescents in Australia
4. Walter T, Kovalsky SJ, Stekel A. Effect of a mild iron deficiency on infantmental development scores. J Paediat 1983;102:519–22.
5. Lozoff B, Brittenham GM, Wolf AW, McClish DK, Kuhnert PM, Jimenez E etal. Iron deficiency anaemia and iron therapy effects on infant developmenttest performance. Paediatrics 1987;79:981–95.
6. De Andraca I, Walter T, Castillo M, Pino P, Rivera P, Cobo C. Irondeficiency anaemia and its effects upon psychological development atpreschool age: a longitudinal study. Nestle Foundation annual report,1990;53–62.
7. Lozoff B, Jimenez E, Wolf AW. Long term developmental outcome ofinfants with iron deficiency. New Engl J Med 1991;325(10):687–94.
8. Bruner AB Joffe A,Duggan AK,Casella JF, Brandt J. Randomised study ofcognitive effects of iron supplementation in non-anaemic, iron-deficientadolescents Lancet 1996;348:992–996.
9. Dallmann PR. Iron deficiency: does it matter? J Int Med 1982;226:367–72.
10. Sherman AR. Zinc, copper and iron nutriture and immunity. J Nutr1992;122:604–9.
11. Shoham S, Glinka Y, Tanne Z, Youdim MBH. Brain iron: function anddysfunction in relation to cognitive processes. In: Hallberg L, Asp NG, eds.Iron nutrition in health and disease. London: John Libbey & Co.,1996:205–17.
12. Baghurst KI, Record SJ, Leppard P. Red meat consumption in Australia:intakes, nutrient contribution and changes over time. Aust J Nutr Diet2000;57(4)(suppl.):S1–S36.
13. Harris MF, Cameron B, Florin S. Iron deficiency in Bourke children. AustPaediatr J 1988;24:45-7.
14. Holt AR, Spargo RM, Iveson JB, Faulkner GS, Cheek DB. Serum andplasma zinc, copper and iron concentrations in Aboriginal communities ofnorth western Australia. Am J Clin Nutr 1980;33:119-32.
15. Oti-Boateng P, Seshadri R, Petrick S, Gibson RA, Simmer K. Iron status anddietary iron intake of 6-24-month-old children in Adelaide. J Paediatr ChildHlth 1998;34(3):250–3.
16. Mira M, Alperstein G, Karr M, Ranmuthugala G, Causer J, Niec A et al.Haem iron intake in 12–36 month old children depleted in iron: case-control study. BMJ 1996;312:881–3.
17. Karr MA, Mira M, Alperstein G, Labib S, Webster BH, Lammi AT et al. Irondeficiency in Australian-born children of Arabic background in centralSydney. Med J Aust 2001;174:165–8.
18. Rangan AM, Blight GD, Binns CW. Factors affecting iron status in 15–30year old female students. Asia Pacific J Clin Nut 1997;6(4):291–5.
118 Dietary Guidelines for Children and Adolescents in Australia
3.3 INCLUDE LEAN MEAT, FISH, POULTRY AND/OR ALTERNATIVES
19. Sadler S, Blight G. Iron status and dietary iron intake of young women.Proc Nut Soc Aust 1996;20:216.
20. English RM, Bennett SA. Iron status of Australian children. Med J Aust1990;152:582–6.
21. Wharton B, Wharton P. Nutrition in adolescence. Nutrition and Health1978;4:195–203.
22. Worsley A, Skrzypiec G. Teenagers’ social attitudes and red meatconsumption. Proc Roy Soc NZ, Miscellaneous series 36, Wellington, May1996.
23. UN Food and Agriculture Organization. Apparent consumption data: ironin western diets. Rome: FAO.
24. National Health and Medical Research Council. Recommended dietaryintakes for use in Australia. Canberra: AGPS, 1991.
25. Hulten L, Gramatkowski E, Gleerup A, Halberg L. Iron absorption from thewhole diet: relation to meal composition, iron requirements and ironstores. Eur J Clin Nutr 1995;49:794–808.
26. Hurrel LRF. Bioavailability of different iron compounds used to fortifyformulas and cereals: technological problems. In: Stekel A, ed. Ironnutrition in infancy and childhood. New York: Raven Press, 1984:158–65.
27. Rossander L. Hallberg L, Bjorn-Rasmussen E. Absorption of iron frombreakfast meals. Am J Clin Nutr 1979;32:2484–9.
28. Ballot D, Baynes RD, Bothwell TH, Gillooly M, MacFarlane BJ, MacPhailAP et al. The effects of fruit juices and fruits on the absorption of ironfrom a rice meal. Brit J Nutr 1987;57:331–43.
29. Bothwell TH, Baynes RD, MacFarlane BJ, Macphail AP. Nutritional ironrequirements and food iron absorption. J Int Med 1989;226:357–65.
30. Brune M, Rossander L, Hallberg L. Iron absorption and phenoliccompounds: importance of different phenolic structures. Eur J Clin Nutr1989;43:547–58.
31. Hallberg L, Rossander L. Effect of different drinks on the absorption of non-heme iron from composite meals. Hum Nutr: Appl Nutr 1982;36a:116–23.
32. Cook JD, Dassenko SA, Whitaker P. Calcium supplementation: effect oniron absorption Am J Clin Nutr 1991;53:106–11.
33. Kretsch MJ, Keys WR, Shah AG. Milk’s effect on the bioavailability of ironfrom cereal-based diets in young women by use of in vitro and in vivomethods. Am J Clin Nutr 1990;52:373–8.
34. Minihane AM, Fairweather-Tait SJ. Effect of calcium supplementation ondaily nonheme iron absorption and long term iron status. Am J Clin Nutr1998;68(1):96–102.
35. Australian Bureau of Statistics. National Nutrition Survey: nutrient intakesand physical measurements, Australia, 1995. Cat. no. 4805.0. Canberra:ABS, 1998.
119
3.3 INCLUDE LEAN MEAT, FISH, POULTRY AND/OR ALTERNATIVES
Dietary Guidelines for Children and Adolescents in Australia
36. King JC, Keen CL. Zinc. In: Shils ME, Olson JA, Shike M, eds. Modernnutrition in health and disease. Philadelphia PA: Lea and Febiger,1994:214–30.
37. Sandstrom B, Kivisto B, Cederblad A. Absorption of zinc from soy proteinmeals in humans. Nutr 1987;117:321–7.
38. Gibson RS. Content and bioavailability of trace elements in vegetariandiets. Am J Clin Nutr 1994;59:1223S–1232S.
39. Wood R, Zheng J. Calcium supplementation reduces intestinal zincabsorption and balance in humans. FASEB Journal 1995;9:A1640.
40. Fenech M, Aitken C, Rinaldi J. Folate, vitamin B12, homocysteine status and
DNA damage in young Australian adults. Carcinogenesis 1998;19(7):1163–71.
41. Fenech M, Rinaldi J. A comparison of lymphocyte micronuclei and plasmamicronutrients in vegetarians and non-vegetarians. Carcinogenesis1995;16(2):223–30.
42. Immerman AM. Vitamin B-12 status on a vegetarian diet: a critical review.World Rev Nutr and Diet 1981;37:38–54.
43. Verhoef P, Stampfer MJ, Buring JE, Gaziano JM, Allen RH, Stabler SP et al.Homocysteine metabolism and risk of myocardial infarction: relation withvitamins B
6and B
12and folate. Am J Epid 1996;143:845–59.
44. Ubbink JB, van der Merwe A, Vermaak WJH, Delport R.Hyperhomocysteinuria and the response to vitamin supplements. ClinInvestig 1993;71:993–8.
45. Mann NJ, Li D, Sinclair AF, Dudman NPB, Guo XW, Wilson AK et al. Theeffect of diet on plasma homocysteine concentrations in healthy malesubjects. Eur J Clin Nutr 1999;53:895–9.
46. Li D, Sinclair AJ, Mann NJ, Turner A, Ball MJ. Selected micro-nutrientintake and status in men with differing meat intakes, vegetarians andvegans. Asia Pac J Clin Nutr 2000;9:18–23.
47. Louwman MW, van Dusseldorp M, van de Vijver FJ, Thomas CM, SchneedeJ, Ueland PM et al. Signs of impaired cognitive function in adolescentswith marginal cobalamin status. American Journal of Clinical Nutrition2000;72:762–9.
48. Institute of Medicine. Dietary reference intakes for thiamine,riboflavin,niacin,vitamin B6, folate, vitamin B12, pantothenic acid, biotinand choline. Washington DC: National Academy Press, 1998:306–56.
49. Bhutta ZA. Protein: digestibility and availability. In: Sadler MJ, Strain JJ,Caballero B, eds. Encyclopedia of human nutrition. San Diego: AcademicPress, 1999:1646–54.
50. Bender A. Meat and meat products in human nutrition in developingcountries. Food and Nutrition paper 53. Rome: Food Policy and NutritionDivision, 1992.
120 Dietary Guidelines for Children and Adolescents in Australia
3.3 INCLUDE LEAN MEAT, FISH, POULTRY AND/OR ALTERNATIVES
51 Institute of Medicine. Dietary reference Intakes for energy, carbohydrate,fiber, fat, fatty acids, cholesterol, protein and amino acids. Washington DC:National Academy Press, 2002
52. USDA Nutrient Database for Standard Reference. <www.nal.usda.gov/fnic/cgi-bin/nut_search.pl> February 2002.
53. Sadler MF, Lewis JL, Buick DR. Composition of trim lamb. Food Australia1993;45:S3–S12.
54. Watson MA, Mann NJ, Sinclair AJ, O’Dea K. Fat content of untrimmed beefand lamb cuts. Food Australia 1992;44:511–14.
55. World Cancer Research Fund & American Institute for Cancer Research.Food, nutrition and the prevention of cancer: a global perspective.Washington, DC: American Institute for Cancer Research, 1997.
56. Riboli E. Meat, processed meat and colorectal cancer. Presentation atEuropean Conference on Nutrition and Cancer. Lyon, France, 2001.
57. Truswell AS. Report of an expert workshop on meat intake and colorectalcancer risk convened in December 1998 in Adelaide, South Australia. Eur JCancer Prev 1999;8:175–81.
58. National Health and Medical Research Council. Guidelines for theprevention, early detection and management of colorectal cancer: a guidefor patients, their families and friends. Canberra: NHMRC, 1999.
59. Baghurst PA. Does red meat cause cancer? Aust J Nutr Diet 1997;54(4):S1–S44.
60. Cancer Council of Australia. National Cancer Prevention Policy 2001–2003.Sydney: Cancer Council of Australia, 2001.
61. Expert Panel on Red Meat and Health. The role of red meat in a healthydiet. Sydney: Meat and Livestock Australia, 2001.
62. Sinclair AJ, Vingrys AJ. Estimation of the long chain n-3 fatty acid status ofAustralians. Proc Nutr Soc Aust 1998;22:196.
63. Simpopoulos AP, Leaf A, Salem Jnr N. Workshop statement on theessentiality of and recommended dietary intakes for omega 6 and omega 3fatty acids. Prostaglandins, leucotrienes and essential fatty acids2000;63:119–21.
64. Ollis TE, Meyer B, Howe PRC. Food sources and intakes of omega-6 andomega-3 polyunsaturated fatty acids consumed by adults in the Illawarraregion of NSW. Proc 2nd South West Pacific Nutrition and DieteticConference. Auckland, New Zealand, 1999.
65. Conquer JA, Holub BJ. Dietary docosahexaenoic acid as a source ofeicosapentaenoic acid in vegetarians and omnivores. Lipids 1997;32:341–5.
66. Li D, Sinclair AJ, Wilson A, Nakkote S, Kelly F, Abedin L et al. Effect ofdietary alpha-linolenic acid intake on thrombotic risk factors in vegetarianmen. Am J Clin Nutr 1999;69:872–82.
121
3.3 INCLUDE LEAN MEAT, FISH, POULTRY AND/OR ALTERNATIVES
Dietary Guidelines for Children and Adolescents in Australia
67. Australian Iron Status Advisory Panel. Iron and pregnancy: recommendedguidelines. Sydney: AISAP, 1997.
68 Institute of Medicine. Dietary reference intakes for vitamin A, vitamin K,arsenic, boron, chromium, copper, iodine, iron, manganese, molybdenum,nickel, silicon, vanadium and zinc.. Washington DC: National AcademyPress, 2001; 290-393
69. Kim I, Hungerford DW, Yip R, Kuester SA, Zyrkowski C, Trowbridge FL.Pregnancy nutrition surveillance system: United States, 1979–1990. MMWRCDC Surveillance Summaries 1992;41:25–41.
70. Scholl TO, Hediger ML, Fischer RL, Shearer JW. Anaemia vs irondeficiency: increased risk of preterm delivery in a prospective survey. AmJ Clin Nutr 1992;55:985–8.
71. Burr ML, Butland BK. Heart disease in British vegetarians. Am J Clin Nutr1988;48:830–2.
72. Fonnebo V. The Tromso heart study: diet, religion and risk factors for heartdisease. Am J Clin Nutr 1988;48:826–9.
73. Fraser GE. Determinants of ischaemic heart disease in Seventh DayAdventists. Am J Clin Nutr 1988;48:833–6.
74. Kestin M, Rouse IL, Correll R, Nestel PJ. Cardiovascular disease risk factorsin free-living men: comparison of two prudent diets, one based onovolacto-vegetarianism and the other allowing red meat. Am J Clin Nutr1989;50:280–7.
75. Reddy S, Sanders TAB. Lipoprotein risk factors in vegetarian women of Indiandescent are unrelated to dietary intake. Atherosclerosis 1992;95:223–9.
76. Pronczuk A, Kipervarg Y, Hayes KC. Vegetarians have higher plasmaalpha-tocopherol relative to cholesterol than do non-vegetarians. J Am CollNutr 1992;11:50–5.
77. Prasad K, Reddy S, Sanders TAB. Plasma ubiquinone (Q10) concentrationsin female vegetarians and omnivores. Proc Nutr Soc 1993;52:332A.
78. Haines AP, Chakraharti R, Fisher D, Meade TW, North WR, Stirling Y.Haemostatic variables in vegetarians and non vegetarians. Thromb Res1980;19:139–48.
79. Sanders TAB, Key TJA. Blood pressure, plasma rennin activity andaldosterone concentrations in vegans and omnivore controls. Hum Nutr:Appl Nutr 1987;41:101–8.
80. Armstrong BK, Clarke H, Martin C, Ward W, Norman N, Masarei J. Urinarysodium and blood pressure in vegetarians. Am J Clin Nutr 1979;32:2472–6.
81. Margetts BM, Beilin LJ, Vandongen R, Armstrong BK. Vegetarian diet inmild hypertension: a randomised controlled trial. BMJ 1986;293:129–33.
82. Messina MJ. Legumes and soybeans: an overview of their nutritionalprofiles and health effects. Am J Clin Nutr 1999;70(suppl.):439S–450S.
122 Dietary Guidelines for Children and Adolescents in Australia
3.3 INCLUDE LEAN MEAT, FISH, POULTRY AND/OR ALTERNATIVES
83. Fraser GE, Sabate J, Beeson WL, Strahan TM. A possible protective effectof nut consumption on risk or coronary heart disease: the Adventist HealthStudy. Arch Intern Med 1992;152:1416–24.
84. Kushi LH, Folsom AR, Prineas RJ, Mink PJ, Wu Y, Bostick RM. Dietaryantioxidant vitamins and death from coronary heart disease in postmenopausal women. N Engl J Med 1996;334:1156–62.
85. Hu FB, Stampfer MJ, Manson JE, Rimm EB, Colditz GA, Rosner BA et al.Frequent nut consumption and risk of coronary heart disease: prospectivecohort study. BMJ 1998;317:1341–5.
86. Sabate J. Nut consumption, vegetarian diets, ischaemic heart disease riskand all-cause mortality: evidence from epidemiologic studies. Am J ClinNutr 1999;70(suppl.):500S–503S.
87. Hu FB, Stampfer MJ. Nut consumption and risk of coronary heart disease: areview of epidemiologic evidence. Current Athero Rep 1999:1:205–10.
88. Snyder AC, Dvorak LL, Roepke JB. Influence of dietary source on measuresof iron status among female runners. Med Sci Sports Exerc 1989;21:7–10.
89. Haymes EM, Lamanca JJ. Iron loss in runners during exercise: implicationsand recommendations. J Sports Med 1989;7:277–85.
90. Australian Institute of Health and Welfare. Australia’s food and nutrition.Canberra: AGPS, 1994.
91. Lissner L, Heitman BL. Dietary fat and obesity: evidence fromepidemiology. Eur J Clin Nutr 1995;49:79–90.
92. Riley LW, Remis RS, Helgerson SD, McGee HB, Wells JG, Davis BR et al.Hemorrhagic colitis associated with a rare Escherichia coli serotype. NewEngl J Med 1983;308:681–5.
93. Centers for Disease Control and Prevention. Community outbreak of hemolyticuremic syndrome attributable to Escherichia coli 0111:NM—South Australia,1995. Morbidity and Mortality Weekly Report 1995;44:157–60.
94. Bryan J, Calvaresi E, Hughes D. The effect of short term folate, B12 and B6supplementation and dietary intake on cognition and mood in women. JGeront: Psych Sci 2001 (in press).
Dietary Guidelines for Children and Adolescents in Australia 123
3.4 INCLUDE MILKS, YOGHURTS, CHEESES AND/OR ALTERNATIVES
3 . 4 I N C L U D E M I L K S , YO G H U RT S ,C H E E S E S A N D / O R A LT E R N AT I V E S
• R e d u c e d - f a t v a r i e t i e s s h o u l d b e c h o s e n w h e r ep o s s i b l e
• R e d u c e d - f a t m i l k s a r e n o t s u i t a b l e f o r y o u n gc h i l d r e n u n d e r 2 y e a r s , b e c a u s e o f t h e i r h i g he n e r g y n e e d s , b u t r e d u c e d - f a t v a r i e t i e s s h o u l db e e n c o u r a g e d f o r o l d e r c h i l d r e n a n da d o l e s c e n t s
K a t r i n e B a g h u r s t
T E R M I N O L O G Y
Milks, yoghurts and cheeses
The term milks, yoghurts and cheeses, as used in this guideline, generally refersto cow’s milk and the yoghurt and cheese produced from it but can also includemilks, yoghurts and cheeses from goat and sheep milks. Goat and sheep milkshave overall nutrient profiles that are similar to that of cow’s milk, althoughgoat’s milk is slightly more ‘watery’ (less nutrient dense), whereas sheep’s milk isalmost twice as concentrated as cow’s milk, containing more calcium per unitweight but also more fat and energy. In addition, goat and sheep milks aregenerally not pasteurised and can constitute a health risk. Milks, and productsmade from them, are good sources of a number of nutrients—for example,protein, riboflavin and vitamin B
12—but notably calcium.
Alternatives
Inclusion in the ‘alternative’ category is based primarily on calcium content,although most of the alternatives also provide substantial amounts of protein.Alternatives includes milk-based custards, ice-creams and evaporated milks, aswell as fortified soy milk and derivatives. Sardines and other fish whose bonesare eaten, and certain nuts (such as almonds), also contain moderate to goodamounts of calcium and protein and in this respect can be considered occasional‘alternatives’. Table 3.4.1 shows the calcium content and the content of other keynutrients for a selection of milks, yoghurts, cheeses and alternatives.
Milk foods
For the purposes of this guideline, where milk foods is used it generally refers tocow’s milk (fresh, long-life, reconstituted dried and evaporated) and productsmade from it, such as yoghurts, ice-creams, cheeses and milk-based custards,
124
3.4 INCLUDE MILKS, YOGHURTS, CHEESES AND/OR ALTERNATIVES
Dietary Guidelines for Children and Adolescents in Australia
which are good sources of calcium as well as a range of other nutrients. The‘milk foods’ category is a major source of saturated fat in children’s andadolescents’ diets, so—with the exception of children aged less than 2 years—reduced-fat varieties are encouraged. In the 1995 National Nutrition Survey, acategory called ‘milk products and dishes’ was used; this category included thefoods listed here as ‘milk foods’ as well as cream and soy alternatives such assoy milks and cheeses.
Reduced-fat products
Reduced-fat milks, yoghurts and cheeses generally contain 75 per cent (or less)of the fat in the equivalent full-fat product. It is important to note that softcheeses such as cottage cheese and ricotta, whilst low in fat, contain very littlecalcium.
Reduced-fat milks are not suitable for children aged less than 2 years: milk is amajor energy source in these children, who are in a period of rapid growth.Reduced-fat milks are, however, recommended for older children andadolescents when the diet has diversified.
Osteoporosis
Osteoporosis, a condition of low bone mass, can lead to bone fragility andincreased risk of fractures. Most fractures in older adults are related toosteoporosis; in young adults, trauma is the primary cause of fractures.1
Clinically, osteoporosis is measured in terms of bone mineral density that isbelow the age-adjusted reference range. Individuals are considered osteoporoticif their bone mineral density is 2.5 SD or more below the young adult mean.2
This criterion identifies about 30 per cent of all post-menopausal women ashaving osteoporosis and, of these, more than 50 per cent will have suffered aprevious fracture.2
Clinical expression of osteoporosis is not generally seen in childhood oradolescence, but inadequate development of peak bone mass during this periodis a primary risk factor.
B A C K G R O U N D
Milk foods are a major source of nutrients in the Australian diet. Milk itself is oneof the most complete of all foods, containing nearly all the constituents ofnutritional importance to humans. Milk foods are a key source of protein,calcium, vitamin A, riboflavin, vitamin B
12 and zinc. They do, however, also
provide about one-third of the saturated fat in the diet of children andadolescents3; milk itself provides about 20 per cent of the saturated fat inchildren and 14 per cent in adolescents, and cheeses provide a further 6–7 percent in both children and adolescents. For this reason—and with the exceptionof children under 2 years of age—reduced-fat varieties are recommended.
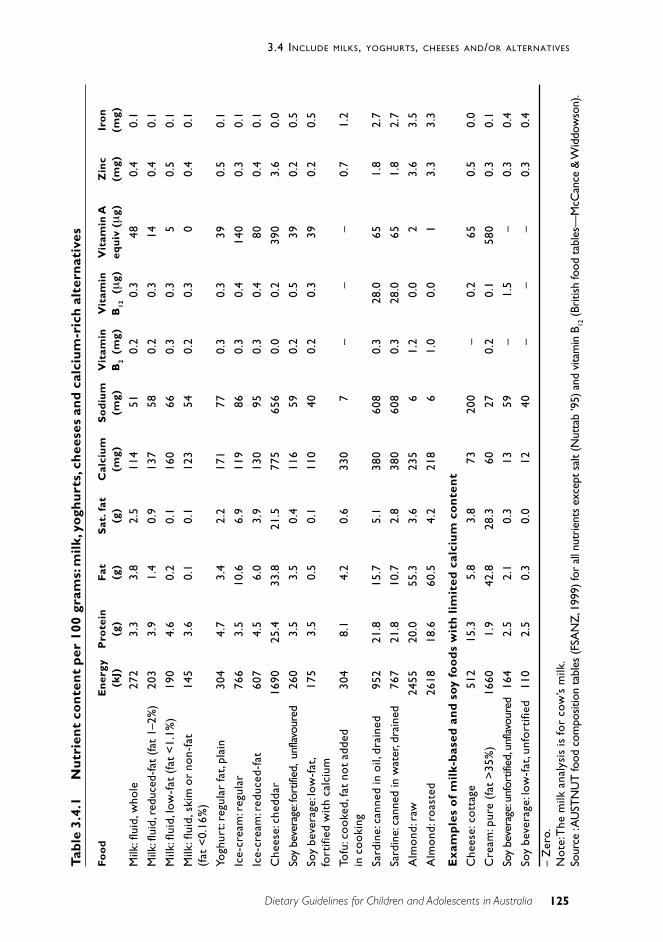
125
3.4 INCLUDE MILKS, YOGHURTS, CHEESES AND/OR ALTERNATIVES
Dietary Guidelines for Children and Adolescents in Australia
Tab
le 3
.4.1
Nu
trie
nt
con
ten
t p
er 1
00gr
ams:
mil
k, y
ogh
urt
s, c
hee
ses
and
cal
ciu
m-r
ich
alt
ern
ativ
es
Fo
od
En
ergy
Pro
tein
Fat
Sat
. fat
Cal
ciu
mS
od
ium
Vit
amin
Vit
amin
Vit
amin
AZ
inc
Iro
n(k
J)(g
)(g
)(g
)(m
g)(m
g)B
2 (
mg)
B12
(µ
g)eq
uiv
(µ
g)(m
g)(m
g)
Milk
: flu
id, w
hole
272
3.3
3.8
2.5
114
510.
20.
348
0.4
0.1
Milk
: flu
id, r
educ
ed-f
at (
fat
1–2%
)20
33.
91.
40.
913
758
0.2
0.3
140.
40.
1
Milk
: flu
id, l
ow-f
at (
fat
<1.
1%)
190
4.6
0.2
0.1
160
660.
30.
35
0.5
0.1
Milk
: flu
id, s
kim
or
non-
fat
145
3.6
0.1
0.1
123
540.
20.
30
0.4
0.1
(fat
<0.
16%
)
Yogh
urt:
regu
lar
fat,
plai
n30
44.
73.
42.
217
177
0.3
0.3
390.
50.
1
Ice-
crea
m: r
egul
ar76
63.
510
.66.
911
986
0.3
0.4
140
0.3
0.1
Ice-
crea
m: r
educ
ed-f
at60
74.
56.
03.
913
095
0.3
0.4
800.
40.
1
Che
ese:
che
ddar
1690
25.4
33.8
21.5
775
656
0.0
0.2
390
3.6
0.0
Soy
beve
rage
: fort
ified
, un
flavo
ured
260
3.5
3.5
0.4
116
590.
20.
539
0.2
0.5
Soy
beve
rage
: low
-fat
,17
53.
50.
50.
111
040
0.2
0.3
390.
20.
5fo
rtifi
ed w
ith
calc
ium
Tofu
: coo
ked,
fat
not
adde
d30
48.
14.
20.
633
07
––
–0.
71.
2in
coo
king
Sard
ine:
can
ned
in o
il, d
rain
ed95
221
.815
.75.
138
060
80.
328
.065
1.8
2.7
Sard
ine:
can
ned
in w
ater
, dra
ined
767
21.8
10.7
2.8
380
608
0.3
28.0
651.
82.
7
Alm
ond:
raw
2455
20.0
55.3
3.6
235
61.
20.
02
3.6
3.5
Alm
ond:
roa
sted
2618
18.6
60.5
4.2
218
61.
00.
01
3.3
3.3
Exa
mp
les
of
mil
k-b
ased
an
d s
oy f
oo
ds
wit
h li
mit
ed c
alci
um
co
nte
nt
Che
ese:
cot
tage
512
15.3
5.8
3.8
7320
0–
0.2
650.
50.
0
Cre
am: p
ure
(fat
>35
%)
1660
1.9
42.8
28.3
6027
0.2
0.1
580
0.3
0.1
Soy
beve
rage
: unf
ortif
ied,
unf
lavou
red
164
2.5
2.1
0.3
1359
–1.
5–
0.3
0.4
Soy
beve
rage
: low
-fat
, unf
orti
fied
110
2.5
0.3
0.0
1240
––
–0.
30.
4
– Z
ero.
Not
e: T
he m
ilk a
naly
sis
is fo
r c o
w’s
milk
.So
urce
: AU
STN
UT
food
com
posit
ion
tabl
es (F
SAN
Z, 1
999)
for
all n
utri
ents
exc
ept
salt
(Nut
tab
’95)
and
vita
min
B12
(Bri
tish
food
tab
les—
McC
ance
& W
iddo
wso
n).
126
3.4 INCLUDE MILKS, YOGHURTS, CHEESES AND/OR ALTERNATIVES
Dietary Guidelines for Children and Adolescents in Australia
In particular, milk foods are the richest source of calcium in the Australian diet3;few other foods provide such a readily absorbable and convenient source of thisnutrient. Calcium is required for the normal development and maintenance of theskeleton.4 It is stored in the teeth and bones, where it provides structure andstrength. In western cultures low intakes of calcium have been associated withosteoporosis, which often results in bone fracture and is one of the main causesof morbidity among older Australians, particularly women. It is worth noting,however, that osteoporosis has its origins in childhood and adolescence.
In the light of the ageing of Australia’s population, in 1986, it was estimated thatby 2011 hospital admissions for osteoporotic fractures would increase by 84 percent.5 The Dubbo Osteoporosis Epidemiology Study found that, after the age of60 years, about 60 per cent of women and 30 per cent of men sufferosteoporotic fractures.6 The most common fracture sites related to the conditionare the hip, vertebrae and wrist; hip fractures have the greatest overall publichealth impact. Considerable morbidity and mortality are associated with hipfractures, and they lead to a substantial decline in physical function.7 In 2001 itwas estimated that the cost of osteoporosis in Australia was $1.9 billion in directhealth care costs and a further $5.6 billion in indirect costs associated with lossof earnings, volunteer carers, modifications and equipment.8
Current intake of milk and milk foods
The 1995 National Nutrition Survey used a 24-hour recall techniquesupplemented by a qualitative food-frequency questionnaire. The survey had acategory of consumption called ‘milk products and dishes’, which includes itemssuch as milks, yoghurts, cheese, cream, ice-cream and milk-based custards, aswell as milk substitutes such as soy milks and soy cheeses. On the day of thesurvey, about 30 per cent of participating children and adolescents aged 2 to 18years consumed less than one serve of milk products and dishes (where a serveis equivalent to one cup of milk, 35 grams of cheese, 200 grams of yoghurt, orthe calcium equivalent). A further 51 per cent consumed between one and threeserves, and 20 per cent consumed three or more serves. Intakes were particularlylow in 16–18 year old girls, where some 44 per cent consumed less than oneserve on the day of the survey and only 12 per cent consumed three serves ormore. The Australian Guide to Healthy Eating9—which is based on the NHMRCcore food groups analysis10—recommends two to three serves a day for childrenaged 4–11 years and three to five for adolescents, depending on their preferredeating patterns.
S C I E N T I F I C B A S I S
Although milk foods are valuable sources of a number of nutrients, includingprotein, retinol, riboflavin, vitamin B
12and zinc11, the primary rationale for
including this food group in the dietary guidelines lies in its role as a rich sourceof calcium.
127
3.4 INCLUDE MILKS, YOGHURTS, CHEESES AND/OR ALTERNATIVES
Dietary Guidelines for Children and Adolescents in Australia
The scientific basis for this guideline thus centres on the role of the milk foodsas a key source of readily absorbable dietary calcium and the role of calcium (inconjunction with a number of other factors) in attaining peak bone mass and inpreventing osteoporosis in later life.
The role of human milk, cow’s milk and milk substitutes in infant nutrition iscovered in the Infant Feeding Guidelines for Health Workers, so is not discussedhere.
The importance of peak bone mass
The skeleton is in a phase of rapid growth throughout childhood andadolescence. Between birth and puberty it increases in mass about seven-foldand a further three-fold during adolescence.12 Studies of factors influencing theaccumulation of bone mass in childhood and adolescence have been summarisedin a recent review by Zhu et al.13; among these factors are racial and geneticinheritance, body weight, physical activity, nutritional intake (including calcium)and endocrine factors.
The best protection against age-related bone loss and consequent fracture risk isthe attainment of a high peak bone mass at skeletal maturity, between 19 and 30years of age, after which bone mass gradually declines, at a rate that varies fromperson to person. Calcium seems to be the pre-eminent nutritive factordetermining peak bone mass in young adults.4,12
Because approximately 60 per cent of the weight of mature bone is mineral(mainly in the form of calcium phosphate), and because mineralisation occurs asbone matrix is laid down, a continuous supply of calcium in amountsappropriate to the changing needs of growth is essential for healthy bonedevelopment during childhood and adolescence.12
It is important to achieve a high peak bone mass: the greater the mass beforeage-related loss begins the less likely it is that the mass will decrease to levelswhere fractures may occur.1,4 During the adolescent growth spurt, the requiredcalcium retention is two to three times greater than the average level requiredfor the development of peak bone mass.14 It is particularly important thereforethat an adequate diet is consumed during this period Restricted food intakes atthis age are therefore of particular concern, and young girls with very heavyexercise regimes and who restrict their total food intake are at heightened risk ofdeveloping an inadequate peak bone mass. During the period that peak bonemass is developing, it is necessary to ingest sufficient calcium to maintainpositive balance. This quantity will vary from person to person, depending onindividual efficiency of intestinal calcium absorption. Once peak bone mass isachieved, it is maintained without much change for 10 to 20 years.
128
3.4 INCLUDE MILKS, YOGHURTS, CHEESES AND/OR ALTERNATIVES
Dietary Guidelines for Children and Adolescents in Australia
Calcium balance and bone mass
On balance, evidence suggsts that calcium intake in childhood can have longlasting effects on bone mass but also suggest that adequate intakes must bemaintained throughout the period of peak bone mass accretion.
Intervention trials in which children were randomised to different calciumintakes have shown short-term changes in bone mineral content. In one trial, intwins averaging 7 years of age, a significant increase in bone mineral densitywas seen in the radius and lumbar spine after three years of treatment. Thecontrols ingested approximately 900 milligrams a day on average and their twinsingested 1600 milligrams.15 This higher level was, however, not sustained whenthey returned to their previous diets.16 Lee17 found a similar result in 7-year-oldChinese children receiving a 300-milligram calcium supplement as opposed to aplacebo. In this case, there was a significant increase in bone mineral content atmid-shaft radius after 18 months of treatment, but the gain disappeared after an18-month follow-up period without supplementation.18 Similar improvementswith supplementation have been reported in pre-pubertal children.19,20 There is,however, mounting evidence from randomised clinical trials that the bone massgained in childhood and adolescence through calcium or milk supplementation isnot retained after such intervention16,18,21 and that optimal calcium intakes need tobe retained throughout the period of attainment of peak bone mass.
Several retrospective studies do suggest that higher calcium intakes throughoutchildhood are associated with greater bone mass in adulthood.22–25
Most cross-sectional studies of children and adolescents have also shown apositive correlation between dietary calcium and bone mass density26–33, butsome have found little or no relationship.34–41 It has been proposed that thesediscrepancies may relate to a threshold below which calcium intake willinfluence accumulation of bone mass and above which it will not. It has beenclaimed that for children aged 9–17 years this threshold might be around1500 milligrams a day.42
Studies in adults also confirm the link between calcium and bone mass. A meta-analysis of 27 cross-sectional, two longitudinal and four intervention studiesassessing the effect of calcium intake on bone mass in young and middle-agedfemales and males43 concluded that overall there was evidence that calciumintakes were positively associated with bone mass in pre-menopausal women,although calcium intake alone accounted for only a small part of the variance inbone mass.
Consequences of low bone density
The consequences of low bone density are mostly expressed at older ages.However, in a 1998 study in New Zealand, Goulding et al.44 showed that lowbone density was more common throughout the skeleton in girls with forearm
129
3.4 INCLUDE MILKS, YOGHURTS, CHEESES AND/OR ALTERNATIVES
Dietary Guidelines for Children and Adolescents in Australia
fractures than in those who had never broken a bone; this supports the view thatlow bone density may also contribute to the risk of fracture in childhood.
Low bone density in adults is associated with an increased risk of fracture: thelower the bone density, the greater the risk. There is evidence that a highcalcium intake at older ages slows the rate of bone loss and may reduce the riskof fracture. A number of randomised trials have shown that calcium supplementsare effective in slowing bone loss in older women45–48 but a meta-analysis of ninerandomised controlled trials of the effect of calcium supplementation on bonedensity in post-menopausal women49 concluded that, whilst the rate of bone losswas less in supplemented women in the first year of treatment, in the secondyear it was not. Only a limited number of randomised controlled trials of calciumsupplementation have used fracture end-points50–53; these studies have, however,consistently shown a reduction in risk, albeit ranging from 26 to 70 per cent. Asystematic review of 14 studies—randomised and non-randomised controlledtrials, case-control studies and cohort studies—also concluded that calciumsupplements and dietary calcium probably reduce the risk of osteoporoticfractures in women.54
Milk consumption in childhood and adolescence and adult bone massdensity
A number of retrospective studies have shown that milk consumption in earlylife has positive effects on adult bone mass density25,55–59, although a study byUlrich et al. showed no effect.60 A study by Du et al.61, in Chinese girls aged 12–14 years, showed that the intake of milk and milk products was a determinant ofbone mineral content—independent of protein, calcium or vitamin D intake—butthe significance of this finding in the Australian context is unclear.
Some factors affecting calcium needs
Bioavailability
For food sources of calcium, content is of greater importance than bioavailability.Calcium absorption efficiency is similar from most foods, but it may be poorfrom foods rich in oxalic acid (for example, spinach, rhubarb and beans) andphytic acid (seeds, nuts, grains, raw beans and soy isolates). Soybeans have largeamounts of phytate but absorption of calcium is still quite high.62 Compared withmilk, calcium absorption from dried beans is about half; from spinach it is aboutone-tenth. Bioavailability from non-food sources such as supplements dependson the dose and whether taken with a meal. In standardised studies of 250-milligram calcium supplements given with a breakfast meal, calcium citratemalate gave a fractional absorption rate of 35 per cent, calcium carbonate 27 percent, and tricalcium phosphate 25 per cent; this compares with a rate of 29 percent for calcium from milk.63–66 Efficiency of absorption of calcium fromsupplements is greatest at doses of 500 milligrams.67,68
130
3.4 INCLUDE MILKS, YOGHURTS, CHEESES AND/OR ALTERNATIVES
Dietary Guidelines for Children and Adolescents in Australia
Physical activity
It is generally accepted that weight-bearing exercise determines the strength,shape and mass of bone69, although the mechanisms are still not clear. It is alsounclear whether calcium intake influences the benefit gained from exercise. Withcomplete immobilisation, rapid bone loss occurs despite a high calcium intake.70
In an intervention study in children, calcium and exercise both affected bonemineralisation but the effects appeared to be independent.71 A review of 16studies in adults, mostly women, concluded that high calcium intakes (over1000 milligrams) enhanced the bone mineral density benefits of exercise todifferent degrees in various parts of the skeleton.72 The review of calciumrequirements undertaken for development of the US dietary reference values73
concluded there was insufficient evidence to justify different calciumrequirements for people with different activity levels.
Sodium
Sodium and calcium excretion are linked in the kidney tubules. A high saltintake increases urinary sodium, resulting in increased obligatory loss of urinarycalcium. In post-menopausal women, 500 milligrams of excreted sodium draws10 milligrams of calcium into the urine.74 In children and adolescents, urinarysodium is an important determinant of urinary calcium excretion75,76, but noassociation has been shown between salt intake or excretion and skeletaldevelopment in children. One longitudinal study in post-menopausal women did,however, show a link between high urinary sodium and increased hip boneloss.77 No study has yet shown a direct link between sodium intake and boneloss or fracture rates. The US dietary reference intakes committee examiningcalcium requirements73 concluded that, despite the relatively high salt intake inthe United States, the available evidence did not warrant the setting of differentcalcium requirements for people with different sodium intakes.
Protein
Protein increases urinary calcium excretion but its effect on calcium retention isunclear. Walker and Linkswiler78 found that urinary calcium increased by about0.5 milligrams for each gram of dietary protein over about 47 grams a day; thedata for children are limited. The US review of calcium requirements73 concludedthat evidence of the effect of protein intake on calcium requirement was notsufficient to recommend different calcium intakes for different intakes of protein.
Requirements and recommended intakes for calcium
Calcium requirements are largely determined by skeletal needs, which increaseduring periods of rapid growth (such as childhood and adolescence), duringpregnancy and lactation, and in later life. Needs can be assessed in a number ofways, among them balance studies, a factorial estimate approach, and changes inbone mineral density or content.79
131
3.4 INCLUDE MILKS, YOGHURTS, CHEESES AND/OR ALTERNATIVES
Dietary Guidelines for Children and Adolescents in Australia
In Australia the calcium requirement has been used to estimate therecommended dietary intake, which is traditionally set to meet the requirementsof the majority of the population.80 The NHMRC’s current recommended intake ofdietary calcium, which was set over a decade ago, in 1991, increases from700 milligrams a day in 1–3 year old boys, to 800mg/day in boys aged 4–11years, 1200mg/day in boys aged 12–15 years and 1000mg/day in boys aged 16–18 years. For girls, the recommended intakes are set at 700mg/day at 1–3 yearsof age, 800mg/day at 4–7 years, 900mg/day at 8–11 years, 1000mg/day at 12–15years and 800mg/day at 16–18 years.
The continuing revision of the US recommended dietary allowances, or RDAs, isbeing undertaken by a group of committees under the auspices of the Institute ofMedicine.73 A new multi-stage form of expression for the recommendations isbeing used, similar to that first used in the United Kingdom in the early 1990s.81
This includes an evidence-based determination of an ‘estimated averagerequirement’, or EAR, for individuals, the mean and variance of which is used toderive the more familiar recommended dietary allowance for individuals (RDA =EAR + 2SD
EAR).
The committee assessing calcium concluded that there was insufficient evidenceto establish an evidence-based estimated average requirement for calcium, forany age or gender group. As a result, it did not produce recommended dietaryallowances for calcium but instead estimated what it called an ‘adequate intake’(AI) figure for each age and gender group. An AI for a nutrient is set as analternative to the RDA where the data are considered insufficient (or not certainenough) to develop a reliable variance estimate for the population. The AI isbelieved to cover the needs of most people in the population, although thepercentage of the population covered by this recommended intake level cannotbe specified with confidence.
The AI for calcium for infants aged to 6 months was set at 210 milligrams a day;for infants aged 7–12 months it was set at 270mg/day, for children aged 1–3years it was 500mg/day, and for children aged 4–8 years it was 800mg/day. Forboth boys and girls aged 9–18 years the AI was set at 1300mg/day, a figureconsiderably higher than the current Australian recommended dietary intake, setin 1991.
One group in Australia that may need to pay particular attention to calciumrequirements is recent migrants from countries where the background diet istraditionally lower in protein and salt than in Australia and where everydayphysical activity may be greater—for example, some Asian countries. If thesemigrants and their children adopt Australian dietary and lifestyle patterns, theircalcium requirement will increase. This group may be at particular risk ofdeveloping osteoporosis in the future.
132
3.4 INCLUDE MILKS, YOGHURTS, CHEESES AND/OR ALTERNATIVES
Dietary Guidelines for Children and Adolescents in Australia
Current intakes of calcium and other nutrients
The National Nutrition Survey found that the mean daily intake of calcium in 2–3year olds was 834 milligrams; from this, the intake fell to 769mg at age 4–7years, then rose to 868mg at age 8–11 years, 943mg at 12–15 years and 1047mgat 16–18 years. There was, however, a large differential in the intakes of boysand girls, particularly in adolescence, when girls’ intake was about two-thirdsthat of boys. Milk products and dishes provided two-thirds of the calcium intakeof children and adolescents; milk itself provided about 43 per cent of the intakein 2–11 year olds and 35 per cent in adolescents.
In addition, the National Nutrition Survey found that, apart from their role as asource of calcium, milk products and dishes provided some 18 per cent ofdietary energy in children aged 2–11 years and 15 per cent in adolescents,25 per cent of protein in children and 19 per cent in adolescents, 28 per cent ofvitamin A in children and 21 per cent in adolescents, 41 per cent of riboflavin(vitamin B
2) in children and 35 per cent in adolescents, 52 per cent of vitamin
B12
in children and 45 per cent in adolescents82 and 24 per cent of zinc inchildren and 18 per cent in adolescents.
The importance of protein, zinc and vitamin B12
in the diet is discussed in moredetail in relation to Section 3.3. Retinol is the preformed form of vitamin A; it isfound only in foods of animal origin, although beta-carotene from plant sourcescan be converted in the body to retinol. It is essential for maintaining epithelialintegrity: deficiency can lead to a variety of eye conditions, ranging frominability to see in dim light to conditions causing blindness. Riboflavin is a Bvitamin that is important in cell respiration. Deficiency can lead to oedema of thepharynx and oral mucosa, cheliosis, glossitis, angular stomatitis, conjunctivitis,corneal vascularisation and some forms of anaemia. Deficiency has beendocumented in both industrialised and developing nations and across varyingdemographic groups.83,84
The National Nutrition Survey found that on the day of the survey the ‘milkproducts and dishes’ category accounted for 26 per cent of total fat in children’sdiets and 22 per cent in adolescents, as well as 38 per cent of saturated fat inchildren and 33 per cent in adolescents, emphasising the need to promote thelow- or reduced-fat varieties. Dairy milk itself provided some 14 per cent of totalfat for children and 21 per cent of their saturated fat; for adolescents it provided9 per cent of total fat and 14 per cent of saturated fat. Cheeses provided 5 percent of total fat and 6–7 per cent of saturated fat in both children andadolescents. Section 3.6 provides more information on dietary fats and theirhealth effects.
133
3.4 INCLUDE MILKS, YOGHURTS, CHEESES AND/OR ALTERNATIVES
Dietary Guidelines for Children and Adolescents in Australia
Special groups
Adolescent girls
Because of the importance of attaining a good peak bone mass, it is essentialthat intakes of calcium in adolescence are maintained. As already noted,however, data from the 1995 National Nutrition Survey show that substantialnumbers of adolescent girls consumed less than one serving of calcium on theday of the survey; this compares with a recommendation of three to five servingsfor adolescents.
Vegetarians
Vegetarian children and adolescents who do not drink milk or consume calcium-fortified soy products should seek advice about whether they need to takecalcium supplements. Adherence to a vegetarian diet can influence calciumneeds because of the diet’s relatively high oxalate and phytate content. Recentshort-term studies have, however, indicated that isoflavone-rich soy protein mayhave a beneficial effect in terms of bone loss.85 More research is needed in thisarea to establish whether there are in fact any long-term benefits for bone healthin humans. On balance, lacto-ovo-vegetarians appear to have calcium intakessimilar to those of omnivores86–88 and similar urinary excretion.89,90 One five-yearstudy in post-menopausal lacto-ovo-vegetarians and omnivores with similarcalcium intakes showed that these groups lost radius bone mineral density atsimilar rates.88 Data on the bone health of strict vegetarians are not available.
Children and adolescents with lactose intolerance
Lactose intolerance is high in Asian communities (at 80–90 per cent) butrelatively low in Caucasians (at 10–20 per cent). A 1994 review found limiteddata available on the extent of lactose intolerance in Australians.91 At that time,most studies of adult Caucasians showed a rate of 17–20 per cent for lactosemaldigestion, with one study showing a rate of only 4 per cent. Data forAboriginal adults showed rates of 80 per cent or more; for Asian-Australianadults the figure was 80–90 per cent. For children, figures of 3–9 per cent wereobtained for Caucasians, 50–90 per cent for various studies in Aboriginalchildren, and about 50 per cent for children of Mediterranean background. Studynumbers for both adults and children were, however, generally very limited.
Small amounts of milk or dairy foods can often be tolerated by people withlactose intolerance, but lactose-free dairy products are available now. Lactose-intolerant people often avoid milk products, although this may not be necessary.Fortified soy milks can also be used for people with lactose intolerance.
Adolescent girls with amenorrhea
Amenorrhea resulting from anorexia is associated with lowered calciumabsorption, higher urinary calcium excretion, and a lower rate of boneformation.92 Exercise-induced amenorrhea results in reduced calcium retentionand lower bone mass.93,94
134
3.4 INCLUDE MILKS, YOGHURTS, CHEESES AND/OR ALTERNATIVES
Dietary Guidelines for Children and Adolescents in Australia
P R A C T I C A L A S P E C T S O F T H I S G U I D E L I N E
As noted, although milk foods are rich in calcium, they are also high in saturatedfat, so it is recommended that reduced-fat varieties and reduced-fat alternativesbe encouraged for older children and adolescents. In the case of children agedless than 2 years, reduced- or low-fat milk is not recommended: milk usuallyforms a much higher proportion of their diet and is a major energy source duringthis period of rapid growth. As the child grows older and relies less heavily onmilk as a source of energy and nutrients, reduced-fat varieties can be introduced,as appropriate.
A variety of calcium-enriched milks that are low in fat are readily available. Low-and reduced-fat yoghurts and cheeses are also available, but low-fat soft cheesessuch as cottage cheese and ricotta have very little calcium and cannot becounted as a ‘serving’, even though they may add variety to a low-fat diet.
Low-lactose milks and milk products are now available for people with lactoseintolerance. However, children and adolescents who are lactose intolerant canusually consume a sufficient amount of milk, yoghurt and cheese productswithout developing significant symptoms. If children and adolescents do notwant to, or cannot, eat milk foods, the following are examples of what can besubstituted in terms of calcium equivalents:
• a cup of calcium- (and vitamin B12–) fortified soy beverage containing
100 milligrams of calcium per 100 millilitres—non-fortified soy beveragesdo not provide sufficient calcium
• a cup of almonds—although not suitable for young children because of therisk of choking
• five sardines or half a cup of pink salmon (with bones)
• a cup of calcium-fortified breakfast cereal.
Among other ways of encouraging calcium consumption are using milk orcalcium-fortified alternatives on breakfast cereals; offering milk-based desserts(puddings, custards or yoghurts), adding skim-milk powder to mashed potatoesand other vegetables; adding milk-based sauces to casseroles and pasta dishes;sprinkling grated cheese on mashed potato, cauliflower, and other vegetables;and substituting cheese spread or plain fromage frais for other fat spreads insandwiches and on dry biscuits, savoury muffins and toast.
R E L AT I O N S H I P TO OT H E R G U I D E L I N E S
In the earlier dietary guidelines—for adults, children and older Australians—there was one guideline dealing with variety in food choice and othersencouraging consumption of calcium-rich and iron-rich foods.
135
3.4 INCLUDE MILKS, YOGHURTS, CHEESES AND/OR ALTERNATIVES
Dietary Guidelines for Children and Adolescents in Australia
For this revision of the dietary guidelines, it was felt that the previous ‘variety’guideline should be more closely linked to the Australian Guide to HealthyEating, which recommends daily consumption of a variety of foods from fivebasic food groups:
• vegetables and legumes
• fruit
• breads, cereals and grain
• milk, yoghurt, cheese and alternatives
• meats, fish, poultry and alternatives.
Guidelines on consumption of vegetables (including legumes) and fruit and ofbreads, cereals and grains were included in earlier guidelines. In this revision,guidelines are included for milks, yoghurts, cheeses and alternatives and formeats, fish, poultry and alternatives. It was also felt that a food-based—ratherthan a nutrient-based—approach to the guidelines would be more consistentwith international trends in the setting of dietary guidelines. As a consequence,calcium-rich foods are included in the milks, yoghurts, cheeses and alternativesguideline and iron-rich foods are included in the meat, fish, poultry andalternatives guideline.
Physical activity is important for all children and adolescents
Regular weight-bearing exercise is an important factor in bone mineralisation.Participation in regular physical activity from early childhood will contribute notonly to a healthy body weight but also to the attainment of peak bone mass.
Enjoy a wide variety of nutritious foods
Milks, yoghurts, cheeses and alternatives are recommended as part of a varieddiet to achieve the balance of nutrients required for optimal health. TheNHMRC’s core food group analysis10 confirms a central role for these foods in theAustralian diet in this context. As noted, the Australian Guide to Healthy Eatingincludes the milk group as one of its five core food groups.9
Limit saturated fat and moderate total fat intake
The 1995 National Nutrition Survey3 found that milk products and dishescontributed some 17 per cent of total fat and 27 per cent of saturated fat to thediet. But these foods are valuable sources of other nutrients, so it is appropriateto choose low- or reduced-fat varieties rather than reducing overall intake inorder to limit fat intake. Serves of full-fat cheeses should be limited to three orfour times a week. Children under 2 years of age should not be given reduced-or low-fat milks.
136
3.4 INCLUDE MILKS, YOGHURTS, CHEESES AND/OR ALTERNATIVES
Dietary Guidelines for Children and Adolescents in Australia
Choose foods low in salt
There is evidence that high intakes of sodium increase urinary calcium loss.Conservation of calcium is thus an additional reason for following the saltguideline. This is more important for older people, whose ability to absorbdietary calcium may be impaired.
C O N C L U S I O N
The health costs associated with hospital admissions for osteoporotic fracturesare high in Australia. An adequate intake of calcium during childhood andadolescence will help attain peak bone mass and delay bone loss and the onsetof osteoporosis, consequently reducing the number of related fractures in olderpeople. Milk, yoghurt and cheeses are the most reliable sources of calcium andare readily available and convenient to use. They are also valuable sources ofprotein, riboflavin, vitamin A, vitamin B
12and zinc. If foods that are high in
calcium are part of children’s and adolescents’ daily diet, the physiological,financial and social costs associated with a low-calcium diet will be reduced.
E V I D E N C E
The scientific rationale for this guideline is based on a variety of evidencesources, among them the following:
• meta-analyses of randomised controlled trials (Level I evidence) relatingcalcium supplementation to bone density (reference 46)
• well-designed, individual randomised controlled trials (Level II evidence)relating calcium supplementation to bone loss and bone density or fracture(references 34 to 40, 42 to 45 and 48 to 50)
• Level III evidence—a meta-analysis of case-control and cohort studiesrelating calcium intake to bone mass (reference 41) and a longitudinalstudy relating sodium and calcium and bone density (reference 75).
Evidence was also obtained from a number of cross-sectional and populationstudies, as well as human experimentation relating to bioavailability and nutrientrequirements and intakes.
R E F E R E N C E S
1. Geelhoed EA, Criddle A, Prince RL. The epidemiology of osteoporoticfracture and its causative factors. Clin Biochem Rev 1994;15:173–8.
2. World Health Organization. Assessment of fracture risk and its applicationto screening for postmenopausal osteoporosis. Technical Report Series no.843. Geneva: WHO, 1994.
137
3.4 INCLUDE MILKS, YOGHURTS, CHEESES AND/OR ALTERNATIVES
Dietary Guidelines for Children and Adolescents in Australia
3. Australian Bureau of Statistics. National Nutrition Survey: nutrient intakesand physical measurements, Australia, 1995. Cat. no. 4805.0. Canberra:ABS, 1998.
4. Heaney RP. Nutrition and risk for osteoporosis. In: Marcus R, Feldman D,Kelsey J, eds. Osteoporosis. San Diego: Academic Press, 1996:483–509.
5. Lord SR, Sinnett PF. Femoral neck fractures: admissions, bed use, outcomeand projections. Med J Aust 1986;145:493–6.
6. Eisman JA. Symptomatic fracture incidence in elderly men and women: theDubbo Osteoporosis Epidemiology Study (DOES). Osteoporosis Int1994;4:277–82.
7. Marottoli RA, Berkman LF, Cooney LM. Decline in physical functionfollowing hip fracture. J Am Geriatr Soc 1992;40:861–6.
8. Access Economics. The burden of brittle bones: costing osteoporosis inAustralia. Report prepared for Osteoporosis Australia. Canberra: AccessEconomics, 2001.
9. Children’s Health Development Foundation & Deakin University. TheAustralian guide to healthy eating. Canberra: AGPS, 1998.
10. Cashel K, Jefferson S. The core food groups: scientific basis for developingnutrition education tools. Canberra: AGPS, 1995.
11. ANZFA. Australian Food and Nutrient Database 1999. Canberra 1999.
12. Peacock M. Calcium absorption efficiency and calcium requirements inchildren and adolescents. Am J Clin Nutr 1991;54(suppl.)261S–265S.
13. Zhu K, Greenfield H, Du X, Fraser D. Improvement of bone health inchildhood and adolescence. Nutr Res Rev 2001;14:119–51.
14. Nordin BEC, Horseman A, Marshall DH, Simpson M, Waterhouse GM.Calcium requirement and calcium therapy. Clin Orthop 1979;140:216–46.
15. Johnston CC Jr, Miller JZ, Slemenda CW, Reister TK, Hui S, Christian JC etal. Calcium supplementation and increases in bone mineral density inchildren. N Eng J Med 1992;327:82–7.
16. Slemender CW, Peacock M, Hui S, Zhou IO, Johnston CC. Reduced rates ofskeletal remodelling are associated with increased bone mineral densityduring the development of peak skeletal mass. J Bone Miner Res1997;12:676–82.
17. Lee WT, Leung SS, Wang SH, Xu YC, Zeng WP, Lau J et al. Double blindcontrolled calcium supplementation and bone mineral accretion in childrenaccustomed to a low calcium diet. Am J Clin Nutr 1994;60:744–50.
18. Lee WT, Leung SS, Leung DM, Cheng JC. Follow up study on the effects ofcalcium supplement withdrawal and puberty on bone acquisition ofchildren. Am J Clin Nutr 1996;64:671–7.
138
3.4 INCLUDE MILKS, YOGHURTS, CHEESES AND/OR ALTERNATIVES
Dietary Guidelines for Children and Adolescents in Australia
19. Lloyd T, Andon MB, Rollings N, Martel JK, Landis JR, Demers LM et al.Calcium supplementation and bone mineral density in adolescent girls. JAm Med Assoc 1993;270:841–4.
20. Chan GM, Hoffman K, McMurray M. Effects of dairy products on bone andbody composition in pubertal girls. J Pediatr 1995;126:527–56.
21. Fehily AM, Coles RJ, Evans WD, Elwood PC. Factors affecting bone densityin young adults. Am J Clin Nutr 1992;.56:579–86.
22. Halioua I, Anderson JJ. Lifetime calcium intake and physical activity habits:interdependent and combined effects on the radial bone of healthypremenopausal Caucasian women. Am J Clin Nutr 1989;49:534–41.
23. Matkovic V, Jelic T, Wardlaw GM, Ilich JZ, Goel PK, Wright JK et al. Timingof peak bone mass in Caucasian females and its implications for theprevention of osteoporosis J Clin Invest 1994;93:799–808.
24. Nieves JW, Golden AL, Sirs E, Kelsey JL, Lindsay R. Teenage and currentcalcium intake are related to bone mineral density of the hip and forearmin women aged 30–39 years. Am J Epid 1995;141:342–51.
25. Sandler RB, Slemenda CW, LaPorte RE, Cauley JA, Schramm MM, BarresiML et al. Postmenopausal bone density and milk consumption in childhoodand adolescence Am J Clin Nutr 1985;42:270–4.
26. Sentipal JM, Wardlaw GM, Mahan J, Matkovic V. Influence of calciumintake and growth indexes on vertebral bone mineral density in youngfemales Am J Clin Nutr 1991;54:425–8.
27. Fehily AM, Coles RJ, Evans WD, Elwood PC. Factors affecting bone densityin young adults. Am J Clin Nutr 1992;56:579–86.
28. Turner JG, Gilchrist NL,Ayling AM, Hooke EA, Sadler WA. Factors affectingbone mineral density in high school girls NZ Med J 1992:105Z:95–6.
29. Rubin K, Schuirduan V, Gendreau P, Sarfarazi M, Mendola R, Dalsky J.Predictors of axial and peripheral bone mineral density in healthy childrenand adolescents, with special attention to the role of puberty. J Pediatrics1993;123:863–70.
30. Gunnes M. Bone mineral density in the cortical and trabecular distal forearmin healthy children and adolescents Acta Paediatrica 1994;83:463–7.
31. Ruiz JC, Mandel C, Gartabedian M. Influence of spontaneous calciumintake and physical exercise on the vertebral and femoral bone mineraldensity of children and adolescents. J Bone Min Res 1995;10:675–82.
32. Pettifor HM, Moodley JP. Appendicular bone mass in children with a highprevalence of low dietary calcium intakes J Bone Min Res 1997;12;1824–32.
33. Illich JZ, Skuger M, Hangartner T, Baoshe A, Matkovic V. Relation ofnutrition, body composition and physical activity to skeletal development:a cross-sectional study in preadolescent females. J Am Coll Nutr1998;17:136–47.
139
3.4 INCLUDE MILKS, YOGHURTS, CHEESES AND/OR ALTERNATIVES
Dietary Guidelines for Children and Adolescents in Australia
34. Kristinsson Jo, Valdimarsson O, Sigurdsson G, Franzson L, Olafson I,Steingrimsdottir L. Serum 25-hydroxyvitamin D levels and bone mineraldensity in 16–20 year old girls: lack of association. J Int Med 1998;243:381–8.
35. Kardinaal A, Ando S, Charles P, Charzewska J et al. Dairy calcium andbone density in adolescent girls and young women in Europe. J Bone MinRes 1999;14:583–92.
36. Kardinaal A, Ando S, Charles P, Charzewska J, Rotily M, Vaanenen K et al.Determinants of bone mass and bone geometry in adolescent and youngadult women Cal Tiss Int 2000;66:81–9.
37. Glastre C, Braillon P, David L, Cochat P, Meunier PJ, Delmas PD et al.Measurement of bone mineral content of the lumbar spine by dual energyX ray absorbtiometry in normal children: correlations with growthparameters. J Clin Endo Metab 1990;70:1330–3.
38. Katzman DK, Bachrach LK, Carter DR, Marcus R. Clinical andanthropometric correlates of bone mineral acquisition in healthyadolescent girls. J Clin Endo Metab 1991;73:1332–9.
39. Lonzer MD, Imrie R, Rogers D, Worley D, Licata A, Secic M. Effects ofheredity, age, weight, puberty, activity and calcium intake on bonemineral density in children. Clin Pediatrics 1996;35:185–9.
40. Uusi-Rasi K, Haapasalo H, Kanmus P, Pasanen M, Sievanen H, Oja P et al.Determinants of bone mineralization in 8–20 year old Finnish females.Europ J Clin Nutr 1997;51:54–9.
41. Bonofiglio D, Maggiolini M, Catalano S, Marsic S, Aquilina S et al.Parathyroid hormone is elevated but bone markers and density are normalin young female subjects who consume inadequate dietary calcium Br JNutr 2000;84:111–16.
42. Matkovic V, Heaney RP. Calcium balance during human growth: evidencefor threshold behaviour. J Clin Nut 1992;55:992–6.
43. Welken DC, Kemper HC, Post GB, van Staveren,W. A meta-analysis of theeffect of calcium intake on bone mass in young and middle-aged femalesand males. J Nutr 1995;125(11):2802–13.
44. Goulding A, Cannan R, Williams SM, Gould EJ, Taylor RW, Lewis-BarnedNJ. Bone mineral density in girls with forearm fractures. J Bone Res1998;13:143–8.
45. Prince R, Devine A, Dick I, Criddle A, Kerr D, Kent N et al. The effects ofcalcium supplementation (milk powder or tablets) and exercise on bonedensity in postmenopausal women. J Bone Miner Res 1995;10:1068–75.
46. Elders PJM, Lips P, Netelenbos JC, van Ginkel FC, Khoe E, van der VijghWJF et al. Long-term effect of calcium supplementation on bone loss inperimenopausal women. J Bone Miner Res 1994;9:963–70.
140
3.4 INCLUDE MILKS, YOGHURTS, CHEESES AND/OR ALTERNATIVES
Dietary Guidelines for Children and Adolescents in Australia
47. Dawson-Hughes B, Dallal GE, Krall EA, Sadowski L, Sahyoun N,Tannenbaum S. A controlled trial of the effect of calcium supplementationon bone density in postmenopausal women. N Engl J Med 1990;323:878–83.
48. Reid IR, Ames RW, Evans MC, Gamble GD, Sharpe SJ. Effect of calciumsupplementation on bone loss in postmenopausal women. N Engl J Med1993;328:460–4.
49. Mackerras D, Lumley T. First and second year effects in trials of calciumsupplementation on loss of bone density in postmenopausal women. Bone1997;21(6):527–33.
50. Chapuy MC, Arlot ME, Dubeoeuf F, Brun J, Crouzet B, Arnaud S et al.Vitamin D and calcium to prevent hip fractures in elderly women. N Engl JMed 1992;327:1637–42.
51. Reid IR, Ames RW, Evans MC, Gamble GD, Sharpe SJ. Long-term effects ofcalcium supplementation on bone loss and fractures in postmenopausalwomen: a randomized controlled trial. Am J Med 1995;98:331–5.
52. Chevalley T, Rozzoli R, Nydegger V, Slossman D, Rapin CH, Michel JP etal. Effects of calcium supplements on femoral bone mineral density andvertebral fracture rate in vitamin-D-replete elderly patients. Osteopor Int1994;4:245–52.
53. Recker R, Hinders S, Davies KM, Heaney RP, Stegman MR, Lappe JM et al.Correcting calcium nutritional deficiency prevents spine fractures in elderlywomen. J Bone Min Res 1996;11:1961–6.
54. Cumming RG, Nevitt MC. Calcium for prevention of osteoporotic fracturein postmenopausal women. J Bone Min Res 1987;12(9):1321–9.
55. Stracke H, Renner E, Knie G, Leidig G, Minne H, Federlin K. Osteoporosisand bone metabolic parameters in dependent upon calcium intake throughmilk and milk products. Europ J Clin Nutr 1993;47:617–22.
56. Murphy S, Khaw KT, May H, Compston JE. Milk consumption and bonemineral density in middle aged and elderly women. Br Med J1994;308:939–41.
57. Renner E. Dairy calcium, bone metabolism and prevention of osteoporosis.J Dairy Res 1994;77:3489–505.
58. New SA, Bolton-Smith C, Grubb D, Reid D. Nutritional influences on bonemineral density; a cross-sectional study in premenopausal women. Am JClin Nutr 1997;65:1831–9.
59. Teegarden D, Lylke RM, Proulx W, Johnston C, Weaver C. Previous milkconsumption is associated with greater bone density in young women. AmJ Clin Nutr 1999;69:1014–17.
60. Ulrich CM, Georgiou CC, Snow-Harter CM, Gillis DE. Bone mineral densityin mother–daughter pairs: relations to lifetime exercise, lifetime milkconsumption and calcium supplements. Am J Clin Nutr 1996;63:72–9.
141
3.4 INCLUDE MILKS, YOGHURTS, CHEESES AND/OR ALTERNATIVES
Dietary Guidelines for Children and Adolescents in Australia
61. Du X, Greenfield H, Fraser DR, Ge KY. Food intake and bone mineralstatus of Beijing adolescent girls. Proc Nut Soc Aust 1998;57:125A.
62. Heaney RP, Weaver CM, Fitzsimmons ML. Soybean phytate: content effecton calcium absoption. Am J Clin Nutr 1991;53:745–7.
63. Heaney RP, Recker RR, Stegman MR, Moy AJ. Calcium absorption inwomen: relationship to calcium intake, oestrogen status and age. J BoneMin Res 1989;4:469–75.
64. Heaney RP, Recker RR, Weaver CM. Absorbability of calcium sources: thelimited role of solubility. Calcif Tissue Int 1990;46:300–4.
65. Miller JZ, Smith DL, Flora L, Slenda C, Jiang X, Johnston CC. Calciumabsorption from calcium carbonate and a new form of calcium in healthymale and female adolescents. Am J Clin Nutr 1988;138:225–36.
66. Smith KT, Heaney RP, Flora L, Hinders SM. Calcium absorption from a newcalcium delivery system. Calcif Tissue Int 1987;41:351–2.
67. Heaney RP, Saville PD, Recker RR. Calcium absorption as a function ofcalcium intake. J Lab Clin Med 1975;85:881–90.
68. Heaney RP, Recker RR, Hinders SM. Variability of calcium absorption. Am JClin Nutr 1988;47:262–4.
69. Frost HM. The mechanostat: a proposed pathogenic mechanism ofosteoporosis and the bone mass effects of mechanical and nonmechanicalagents. Bone Min 1987;2:73–85.
70. LeBlanc A, Schneider V, Spector E, Evans H, Rowe R, Lane H et al.Calcium absorption, endogenous excretion, and endocrine changes duringand after long bed rest. Bone 1995;16:301S–304S.
71. Slemenda CW, Reister TK, Hui SL, Miller JZ, Christian JC, Johnston CC.Influences on skeletal mineralisation in children and adolescents: evidencefor varying effect of sexual maturation and physical activity. J Paediat1994;125:201–7.
72. Specker BL. Evidence for an interaction between calcium intake andphysical activity on changes in bone mineral density. J Bone Min Res1996;11:1539–44.
73. Institute of Medicine. Dietary reference intakes for calcium, phosphorus,magnesium, vitamin D and fluoride. Washington, DC: National AcademyPress, 1997.
74. Nordin BEC, Polley KJ. Metabolic consequences of the menopause: a cross-sectional, longitudinal and intervention study on 557 normalpostmenopausal women. Calcif Tissue Int 1987;41:S1–S59.
75. Matkovic V, Illich JZ, Andon MB, Hseih LC, Tzagournis MA, Lagger BJ etal. Urinary calcium, sodium, and bone mass of young females. Am J ClinNutr 1995;62:417–25.
142
3.4 INCLUDE MILKS, YOGHURTS, CHEESES AND/OR ALTERNATIVES
Dietary Guidelines for Children and Adolescents in Australia
76. O’Brien KO, Abrams SA, Stuff JE, Liang LK, Welch TR. Variables related tourinary calcium excretion in young girls. J Paed Gastro Nutr 1996;23:8–12.
77. Devine A, Criddle RA, Dick IM, Kerr DA, Prince RL. A longitudinal study ofthe effect of sodium and calcium intakes on regional bone density inpostmenopausal women. Am J Clin Nutr 1995;62:740–5.
78. Walker RM, Linkswiler HM. Calcium retention in the adult human male isaffected by protein intake. J Nutr 1972;102:1297–1302.
79. Bullmore JR, Gallagher JC, Wilkinson R, Nordin BEC. Effect of age oncalcium absorption. Lancet 1970;2:535–7.
80. National Health and Medical Research Council. Recommended dietaryintakes for use in Australia. Canberra: AGPS, 1991.
81. Committee on Medical Aspects of Food and Nutrition Policy. Dietaryreference values for food energy and nutrients for the United Kingdom:report of the panel on dietary reference values. London: HMSO, 1991.
82. Cobiac L, Record S, Syrette J. Dairy foods in the Australian diet: resultsfrom the 1995/6 National Nutrition Survey. Adelaide: CSIRO, 1999.
83. Komindr S, Nichoalds GE. Clinical significance of riboflavin deficiency. In:Brewster MA, Naito HK, eds. Nutritional elements and clinicalbiochemistry. New York: Plenum Press, 1980;15–68.
84. Nichoaulds GE. Riboflavin. In: Labbae RF, ed. Symposium on laboratoryassessment of nutritional status clinics in laboratory medicine series. Vol.1. Philadelphia: WB Saunders, 1981:685–98.
85. Alekel DL, Germain AS, Peterson CT, Hanson KB, Stewart JW, Toda T.Isoflavone-rich soy protein isolate attenuates bone loss in the lumbar spineof perimenopausal women. Am J Clin Nutr 2000;72(3):844–52.
86. Marsh AG, Sanchez TV, Midkelsen O, Keiser J, Mayor G. Cortical bonedensity in adult lacto-ovo-vegetarian and omnivorous women. J Am DietAssoc 1980;76:148–51.
87. Pedersen AB, Bartholomew MJ, Dolence IA, Aljadir LP, Netteburg KL, LloydT. Menstrual differences due to vegetarian and nonvegetarian diets. Am JClin Nutr 1991;53:879–85.
88. Reed JA, Anderson JJ, Tylavsky FA, Gallagher PN. Comparative changes inradial bone density of elderly female lacto-ovo-vegetarians and omnivores.Am J Clin Nutr 1994;59:1197S–1202S.
89. Lloyd T, Schaeffer JM, Walker MA, Demers LM. Urinary hormonalconcentrations and spinal bone densities of premenopausal vegetarian andnon vegetarian women. Am J Clin Nutr 1991;54:1005–10.
90. Tesar R, Notelowitz M, Shim E, Kauwell G, Brown J. Axial and peripheralbone density and nutrient intakes of postmenopausal vegetarian andomnivorous women. Am J Clin Nutr 1992;56:699–704.
143
3.4 INCLUDE MILKS, YOGHURTS, CHEESES AND/OR ALTERNATIVES
Dietary Guidelines for Children and Adolescents in Australia
91. Cobiac L. Lactose: a review of intakes and of importance to health ofAustralians and New Zealanders. Food Australia 1994;46(7)(suppl.):S1–S28.
92. Abrams SA, Silber TJ, Esteban NV, Vierira NE, Stuff JE, Meyers R et al.Mineral balance and bone turnover in adolescents with anorexia nervosa. JPaediat 1993;123:326–31.
93. Drinkwater B, Bruemner B, Chestnut C. Menstrual history as a determinantof current bone density in young athletes. JAMA 1990;263:545–8.
94. Marcus RT, Cann C, Madvig P, Minkoff J, Goddard M, Bayer M et al.Menstrual function and bone mass in elite women distance runners:endocrine and metabolic features. Ann Intern Med 1985;102:158–63.
145
3.5 CHOOSE WATER AS A DRINK
Dietary Guidelines for Children and Adolescents in Australia
3 . 5 C H O O S E WAT E R A S A D R I N K
A l c o h o l i s n o t r e c o m m e n d e d f o r c h i l d r e n
K i r s t i M c Va y a n d S u e J e f f r e s o n
B A C K G R O U N D
Water is an essential nutrient for life. All biochemical reactions occur in it. It fillsthe spaces in and between cells and helps form structures of large moleculessuch as protein and glycogen. Water is also required for digestion, absorptionand transportation and as a solvent for nutrients, and for elimination of wasteproducts and thermoregulation.
Fluid requirements depend on body size. In the Australian climate very youngchildren (and older adults are at particular risk of dehydration. Solid foodscontribute some water; an additional amount comes from the water produced bythe body’s metabolism (water of oxidation). The remainder needs to come fromfree water or other fluids, or both.
A balance between fluid intake and output is essential for effective bodyfunction and for the maintenance of good health. In the Australian climate,children—particularly young children—are often at risk of dehydration. A child’sfluid needs are best met by water and milk, although fruit juice in limitedquantities is good and can provide valuable nutrients. Excessive consumption offruit juice and soft drinks should be discouraged: these liquids have a high sugarand energy content, which may displace other nutrients in the diet andcontribute to dental caries.
Beverage consumption among Australian children and adolescents
The 1995 National Nutrition Survey1,2, which used a 24-hour recall method,collected information about food and beverage consumption from 13 858respondents aged over 2 years. Table 3.5.1 shows the results for consumption ofbeverages (excluding fluids consumed as ingredients of other foods) amongchildren and adolescents.
In all age groups from 2 to 18 years, mineral waters and water (mainlyconsumed as plain drinking water) made the greatest contribution to fluid intakeand contributed at least 50 per cent to the mean daily intake of non-alcoholicbeverages. Consumption of other beverages varied by age. Milk consumptionwas greatest in the 2–3 years age group, whereas soft drink consumption wasgreatest in the 16–18 years group.
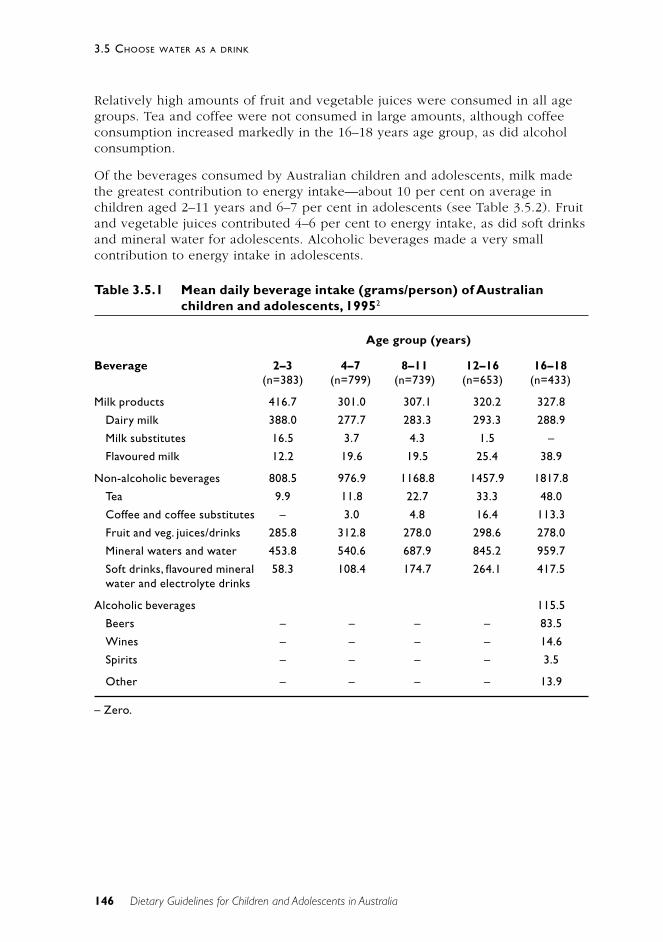
146
3.5 CHOOSE WATER AS A DRINK
Dietary Guidelines for Children and Adolescents in Australia
Relatively high amounts of fruit and vegetable juices were consumed in all agegroups. Tea and coffee were not consumed in large amounts, although coffeeconsumption increased markedly in the 16–18 years age group, as did alcoholconsumption.
Of the beverages consumed by Australian children and adolescents, milk madethe greatest contribution to energy intake—about 10 per cent on average inchildren aged 2–11 years and 6–7 per cent in adolescents (see Table 3.5.2). Fruitand vegetable juices contributed 4–6 per cent to energy intake, as did soft drinksand mineral water for adolescents. Alcoholic beverages made a very smallcontribution to energy intake in adolescents.
Table 3.5.1 Mean daily beverage intake (grams/person) of Australianchildren and adolescents, 19952
Age group (years)
Beverage 2–3 4–7 8–11 12–16 16–18(n=383) (n=799) (n=739) (n=653) (n=433)
Milk products 416.7 301.0 307.1 320.2 327.8
Dairy milk 388.0 277.7 283.3 293.3 288.9
Milk substitutes 16.5 3.7 4.3 1.5 –
Flavoured milk 12.2 19.6 19.5 25.4 38.9
Non-alcoholic beverages 808.5 976.9 1168.8 1457.9 1817.8
Tea 9.9 11.8 22.7 33.3 48.0
Coffee and coffee substitutes – 3.0 4.8 16.4 113.3
Fruit and veg. juices/drinks 285.8 312.8 278.0 298.6 278.0
Mineral waters and water 453.8 540.6 687.9 845.2 959.7
Soft drinks, flavoured mineral 58.3 108.4 174.7 264.1 417.5water and electrolyte drinks
Alcoholic beverages 115.5
Beers – – – – 83.5
Wines – – – – 14.6
Spirits – – – – 3.5
Other – – – – 13.9
– Zero.
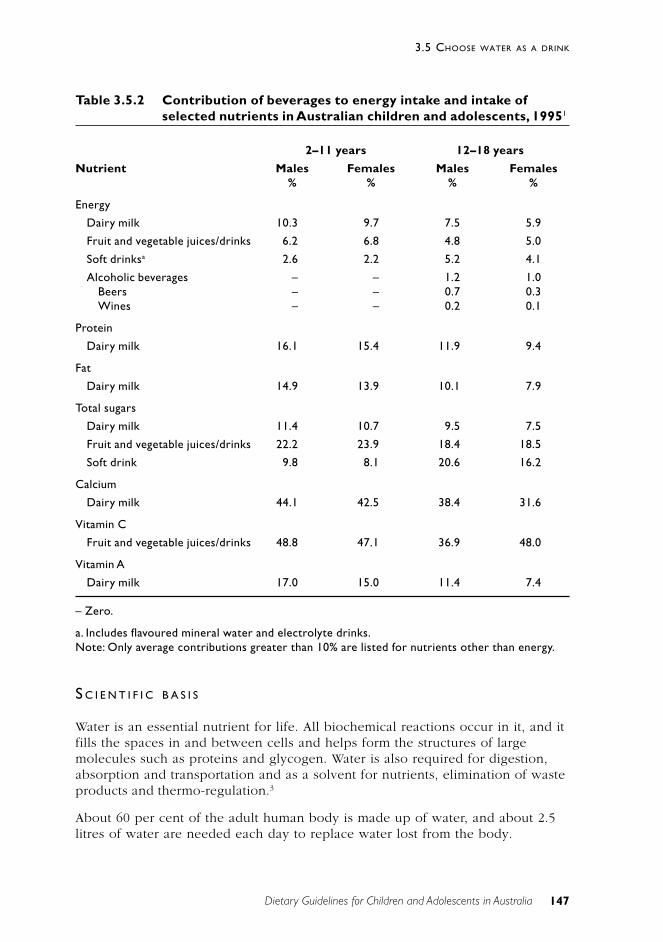
147
3.5 CHOOSE WATER AS A DRINK
Dietary Guidelines for Children and Adolescents in Australia
Table 3.5.2 Contribution of beverages to energy intake and intake ofselected nutrients in Australian children and adolescents, 19951
2–11 years 12–18 years
Nutrient Males Females Males Females% % % %
Energy
Dairy milk 10.3 9.7 7.5 5.9
Fruit and vegetable juices/drinks 6.2 6.8 4.8 5.0
Soft drinksa 2.6 2.2 5.2 4.1
Alcoholic beverages – – 1.2 1.0Beers – – 0.7 0.3Wines – – 0.2 0.1
Protein
Dairy milk 16.1 15.4 11.9 9.4
Fat
Dairy milk 14.9 13.9 10.1 7.9
Total sugars
Dairy milk 11.4 10.7 9.5 7.5
Fruit and vegetable juices/drinks 22.2 23.9 18.4 18.5
Soft drink 9.8 8.1 20.6 16.2
Calcium
Dairy milk 44.1 42.5 38.4 31.6
Vitamin C
Fruit and vegetable juices/drinks 48.8 47.1 36.9 48.0
Vitamin A
Dairy milk 17.0 15.0 11.4 7.4
– Zero.
a. Includes flavoured mineral water and electrolyte drinks.Note: Only average contributions greater than 10% are listed for nutrients other than energy.
S C I E N T I F I C B A S I S
Water is an essential nutrient for life. All biochemical reactions occur in it, and itfills the spaces in and between cells and helps form the structures of largemolecules such as proteins and glycogen. Water is also required for digestion,absorption and transportation and as a solvent for nutrients, elimination of wasteproducts and thermo-regulation.3
About 60 per cent of the adult human body is made up of water, and about 2.5litres of water are needed each day to replace water lost from the body.
148
3.5 CHOOSE WATER AS A DRINK
Dietary Guidelines for Children and Adolescents in Australia
Beverages are the main source of this water, although water is also obtainedfrom a range of other foods, such as fruit and vegetables.2
Water lost from the lungs and skin is responsible for half of the total waterturnover; the remainder is lost in urine and faeces. The normal daily turnover ofwater is about 4 per cent of body weight in adults and 15 per cent in infants.Dehydration is defined as a 1 to 2 per cent loss of body weight caused by fluidlosses. Among the factors contributing to dehydration are a poor thirstmechanism, dissatisfaction with the taste of water, and increased fluid losses as aresult of alcohol and caffeine consumption, exercise, and environmentalconditions such as high altitude and low humidity.3
Infants are especially susceptible to dehydration because of the high proportionof their body weight that is water, the high rate of turnover, their relatively largesurface area, and their poor thirst mechanism.3 Dehydration can occur informula-fed infants, particularly when over-concentrated formula has been used.In breastfed infants, however, dehydration is rare—even in very hot weather—provided that the infant has free access to breastfeeding.4
Children who are very physically active are more prone to dehydration thanadults because they have a relatively low circulating blood volume and a poorthirst mechanism. Any fluids lost through perspiration should be promptlyreplaced.5
Dehydration has been shown to link to a number of health outcomes such asincreased risk of kidney stones, increased risk of urinary tract and colon cancer,diminished physical and mental performance as well as increased risk ofchildhood obesity. Details of these studies are given in the accompanyingDietary Guidelines for Australian Adults.
P R A C T I C A L A S P E C T S O F T H I S G U I D E L I N E
Different beverage types and their importance for the nutritionalhealth of children and adolescents
Water
Sports Medicine Australia6 has recommended that children consume 150–200 millilitres (and adolescents 300–400ml) of fluid 45 minutes before exerciseand 75–100ml (and adolescents 150–200ml) each 20 minutes whilst exercising.
Although plain water is considered the most economical source of fluid,flavoured drinks or sports drinks may be more palatable and facilitate fluidreplacement. A study by Meyer et al.7 found that sufficient fluid intake to offsetsweat losses in children aged 9 to 13 years occurred only when flavoured drinkswere ingested. The children in the study preferred grape- and orange-flavoureddrinks over apple flavour. The management of diarrhoeal disease—which is still
149
3.5 CHOOSE WATER AS A DRINK
Dietary Guidelines for Children and Adolescents in Australia
a common cause of mortality and morbidity in children—has been revolutionisedby the use of oral rehydration fluids containing both water and electrolytes.
Guidelines have been developed to cover the safety and quality of drinkingwater in Australia. The water must meet microbiological, physical, chemical andradiological standards to ensure that it satisfies public health requirements.8
Milk
Milk is an excellent source of many nutrients, particularly calcium, protein,riboflavin and vitamin B
129, Calcium-fortified soy beverages can be used as
alternatives to dairy milk. Dietary calcium is important for skeletal growth and inthe attainment of peak bone mass in adolescence.10 Attainment of a high peakbone mass at skeletal maturity is considered the best protection against age-related bone loss and fracture. Section 3.4 provides detailed information aboutcurrent intakes of dairy foods, calcium and other key nutrients in dairy foods andabout the importance of dietary calcium.
During the first year of life in non-breastfed infants, infant formula should begiven as the main source of milk. Cow’s milk is not recommended for infants.Skim milk and reduced-fat milk should not be used for children aged less than2 years because these children have higher energy requirements from fat.Between the ages of 2 and 5 years, there is a gradual reduction in the energyrequirement from fat, so reduced-fat milks are suitable; skim milk should,however, not be given (see Chapter 2 and Section 3.6). Section 3.6 discussesrecommended fat intakes during infancy, childhood and adolescence.
The Australian Guide to Healthy Eating9 recommends that children andadolescents consume two to three servings daily from the dairy group. One glassof milk (250ml) represents one serving.
Soft drinks
Soft drinks have minimal nutritional value and contain large amounts of sugarand energy.11 They come within the ‘extra foods’ category, as defined in theAustralian Guide to Healthy Eating.9 ‘Extra foods’ should be consumed onlysometimes or in small amounts.
Trends in beverage consumption among children and adolescents over the pastfew decades suggest that the consumption of soft drinks is increasing and maybe replacing more nutritious beverages such as milk and possibly fruit juices.12 Inthe United States, 12–19 year old females have doubled, and males have tripled,their consumption of soft drinks and have reduced their consumption of milk bymore than 40 per cent.
Consumption of cola beverages, in particular, has been associated with bonefractures in physically active girls attending a US high school (mean age 15years); this may be because of the high phosphoric acid content in cola drinks.13
In addition, caffeine increases the rate of elimination of calcium from the body.14
150
3.5 CHOOSE WATER AS A DRINK
Dietary Guidelines for Children and Adolescents in Australia
A low ratio of calcium to phosphorus in the diet may adversely affect calciumbalance and increase the risk of bone fractures and osteoporosis in later life.15
A study by Harnack et al.12 found that energy intake was positively associatedwith consumption of non-diet soft drinks in children and adolescents. This hasimplications for childhood obesity. The authors also suggested that soft drinksdisplace milk and fruit juice and the nutrients concentrated in these beverages.The intake of some nutrients in milk (calcium, riboflavin, vitamin A andphosphorus) and fruit juices (folate and vitamin C) tended to be lower amongadolescents in the highest category of soft drink consumption compared withthose in the lower categories.
Obesity rates have risen in conjunction with the increase in soft drinkconsumption.11 A two-year prospective study of 548 school children (mean age11.7 years) of diverse ethnic background suggested a positive relationshipbetween increased soft drink consumption and obesity. It is possible that theadditional energy obtained from drinks does not displace energy obtained fromsolid foods at subsequent meals. The authors also showed that consumption ofdiet soft drinks was inversely associated with obesity.16
Fruit juice
Fruit juice is an important part of the diet of young children.17 It is a good sourceof vitamins such as vitamin C and folate and also provides carbohydrates,particularly natural sugars. Some varieties of fruit juice contribute small amountsof fibre.9 If fruit juice is consumed in excess, however, it can detract from a well-balanced diet and/or lead to problems such as obesity18, failure to thrive19, dentalerosion20 and dental caries.21
Malabsorption of carbohydrate from juice can contribute to chronic non-specificdiarrhoea in children.22 The main carbohydrates present in fruit juice arefructose, glucose and sorbitol. A higher ratio of fructose to glucose and thepresence of sorbitol in juice—compared with juices that lack sorbitol and containequal amounts of fructose and glucose—have been implicated in decreasedcarbohydrate absorption. Apple juice contains less sorbitol and is better absorbedthan grape juice, despite a similar fructose–glucose relationship, suggesting thatsorbitol may be the most important component associated with malabsorption.17
Excess fruit juice consumption can lead to several outcomes depending onwhether the fruit juice displaces other foods or is consumed in addition to anadequate diet. Excess fruit juice consumption has been associated with poorappetite, poor weight gain and loose stools (the ‘squash-drinking syndrome’)22
and with failure to thrive in early childhood.19 The latter study (1994) suggeststhat large intakes of apple juice—12–30 ounces a day (about 350–850ml)—maydisplace foods that are more energy and nutrient dense and/or contribute tomalabsorption of carbohydrates or sugars. Both these factors could adverselyaffect growth, contributing to the development of decreased weight or height, orboth. However, a more recent study did not find a higher prevalence of obesityor stunted stature in children consuming 12 ounces or more of fruit juice daily.23
151
3.5 CHOOSE WATER AS A DRINK
Dietary Guidelines for Children and Adolescents in Australia
In another study, excessive fruit juice consumption has been linked to obesity intoddlers: 2-year-olds consuming excessive amounts of fruit juice (more than350ml/day) were shown to have a higher energy intake, which was associatedwith excessive weight gain.18
The Australian Guide to Healthy Eating9 recommends that children andadolescents consume approximately two serves daily from the fruit group. Half acup of juice supplies one serve from this group. It is important to note, however,that, because of their lower fibre content and their added sugars, fruit juicesshould not be used as a substitute for fresh fruit.
Caffeine
Caffeine is a naturally occurring substance found in many plant species. It isknown to stimulate the central nervous system and at high doses can causenervousness, irritability, anxiety, and disturbances of heart rate and rhythm.Effects on blood pressure, coronary circulation, urine production and secretion ofgastric acids have also been documented.24
Caffeine is found in beverages and foods such as tea, coffee, chocolate, cola-type soft drinks and ‘energy drinks’. Coffee contains about three or four times asmuch caffeine as an equal volume of cola soft drink. The main dietary source ofcaffeine in Australian children aged 2–12 years is cola-type soft drinks; inadolescents it is coffee. Cola soft drinks may contain added caffeine up to145 milligrams per kilogram, or 54 milligrams per 375-millilitre can.24
A review of caffeine consumption found that mean daily caffeine consumptionamong Australian children aged 10–15 years was 1.3 milligrams per kilogram ofbody weight per day, of which 0.8mg was obtained from soft drinks.24 This iswell within the level of 95mg (3mg/kg/day) at which behavioural changes suchas decreased reaction times, increased motor activity and increased restlessnesshave been observed in children aged 5–12 years. More recent studies have,however, indicated that the earlier studies suffered from methodologicalproblems and used dose levels that were far greater than doses of caffeineconsumed by children. Overall, the evidence to suggest that caffeine has adversebehavioural effects on children at current intake levels is inconclusive.24
Energy drinks
The term energy drinks refers to a group of non-alcoholic water-based beveragescharacterised by the addition of ‘energy-enhancing’ ingredients. Among theseingredients are a number of water-soluble B vitamins, amino acids and othersubstances, and caffeine. Most energy drinks contain caffeine levels of up to80mg/250ml, the equivalent of a strong cup of coffee.25
Energy drinks are a relatively new product in the marketplace in Australia,although they are well established in Europe and the United States. Theirmarketing is not directed specifically at children, but there is evidence thatyounger consumers are becoming aware of the product and are attracted to it bythe image portrayed.25
152
3.5 CHOOSE WATER AS A DRINK
Dietary Guidelines for Children and Adolescents in Australia
Current data on the consumption of energy drinks in Australia are limited. OneAustralian survey assessed the prevalence of consumption during a two-weekperiod in 1999 but it did not record the quantities consumed or the frequency ofconsumption.26 The survey found as follows:
• Of the sample of 141 males and females aged 8–12 years, 27 per cent ofmales and 12 per cent of females had consumed energy drinks.
• Of the sample of 240 males and females aged 12–18 years, 24 per cent ofmales and 20 per cent of females had consumed energy drinks.
Energy drinks are not considered suitable for children, primarily because of theirhigh caffeine content. At high consumption levels, caffeine and other biologicallyactive substances may exceed known safety levels in children.25
Drinks and dental health
Dental caries, or tooth decay, is the result of repeated acid attacks by bacteria indental plaque. Fermentable carbohydrates in food and drinks provide thenecessary substrate for acid production by bacteria. Acidic drinks such as citrus-based and other juices, carbonated and uncarbonated drinks, sports drinks andherbal teas are likely to exacerbate dental erosion, particularly when associatedwith habits such as slow sipping and swishing and swilling before swallowing,which cause prolonged contact of acid with tooth surfaces.27,28 Drinking practicesthat minimise beverages’ contact with the teeth—such as using a straw orsqueeze bottle and rapid ingestion—may be important in avoiding the potentialerosive effects of these beverages.28
Early childhood caries, a recognised problem in infants and toddlers, ischaracterised by extensive and rapid tooth decay. Prolonged sessions of bottlefeeding in infants and toddlers are generally thought to provide the carbohydratesubstrate that enables high acid production by bacteria. Liquids containingsucrose are the most cariogenic; the potential cariogenicity of milk and infantformula is unclear.29 Infants and toddlers should therefore not be allowedprolonged access, during the day or night, to a bottle containing anything otherthan water.30
The relationship between optimal fluoride intake and improved dental health iswell established.31 Recent Australian data indicate that exposure to fluoridatedwater during childhood confers significant benefits in preventing dental caries inboth deciduous and permanent teeth. There is no evidence of adverse healtheffects caused by drinking fluoridated water at current optimal levels.32
Children and adolescents and alcohol
Alcohol is a powerful drug and is not recommended for children. Excessive,long-term alcohol consumption is associated with a variety of adverse healtheffects. Alcohol consumption among adolescents has increased, and moreadolescents are drinking at harmful levels. The National Alcohol Action Plan
153
3.5 CHOOSE WATER AS A DRINK
Dietary Guidelines for Children and Adolescents in Australia
1999–2000 to 2002–03 identifies a range of strategies to help reduce alcohol-related harm in high-risk groups, including young people.
The effect of alcohol on childhood and adolescent morbidity and mortality
Alcohol is high in energy—at 29 kilojoules per gram—but is deficient inimportant nutrients such as vitamins and minerals.9 High alcohol consumptioncan depress the appetite, displace other foods from the diet, and interfere withdigestion and absorption of nutrients, leading to nutritional deficiencies.33
Long-term alcohol consumption is associated with a variety of adverse healthconsequences, among them cirrhosis of the liver, mental illness, cancer, obesity,and foetal growth retardation. The acute and chronic effects of excess alcoholconsumption are described in Section 1.8 of the Dietary Guidelines forAustralian Adults. Among the adverse social effects related to excess alcoholconsumption are drink-driving injuries and fatalities, aggressive behaviour, familydisruption and reduced productivity.34
Children are more vulnerable to alcohol than adults for a variety of reasons.Because of their smaller physique they metabolise alcohol more slowly. Theyalso lack experience of drinking alcohol and its effects and so have a lowertolerance. This, coupled with increased risk-taking behaviour, can considerablyheighten the potential for harm associated with alcohol consumption inadolescents.35
Young people, particularly females, are most likely to consume alcohol in ahazardous and harmful way. In 1998 two-thirds of young women aged less than25 years who drank alcohol reported consuming, on average, more than twoglasses a day.34 Regular and excessive alcohol consumption in the early monthsof pregnancy can cause foetal alcohol syndrome, which results in intellectual andphysical irregularities in the foetus.34 If they are consuming alcohol, femalesshould also be aware of the possibility of drinks being contaminated with othersubstances for the purpose of inducing stupor and should ensure that they arenot put at risk in social situations.
Alcohol consumption at all levels in younger age groups is associated withincreased mortality, predominantly through violence and accidental injury.34 Ithas been estimated that, in people aged 15 to 34 years, 47 per cent of alcohol-related deaths were the result of road injuries.36
Alcohol consumption is often associated with drug use; in these situations theeffects of the alcohol or other drug(s) can be exaggerated or moderated.34
Adolescents have reported that alcohol removes their inhibitions and alters theirjudgment, increasing their likelihood of experimenting with other drugs.37 In1998, 47 per cent of 14–19 year old recent drinkers also smoked marijuana; thiswas the highest proportion across all age groups.38
154
3.5 CHOOSE WATER AS A DRINK
Dietary Guidelines for Children and Adolescents in Australia
Young Australians’ alcohol consumption
Alcohol plays a fundamental role in adolescent culture and features strongly inmost social and recreational activities. Although levels of alcohol consumptionamong Australian adults have decreased in the last 10 years, more young peopleare drinking alcohol, drinking at an earlier age, and drinking at higher levels.35
The 1998 National Drug Strategy Household Survey found that over two-thirds ofadolescents aged 14–19 years were recent drinkers (that is, had consumedalcohol in the past 12 months). Of these, 30 per cent were regular drinkers(consumed alcohol at least once a week) and 41 per cent were occasionaldrinkers (consumed alcohol less than weekly). More adolescent males (33 percent) than females (27 per cent) were regular drinkers.38
Adolescents do not necessarily view drunkenness as harmful and are the groupmost likely to consume alcohol in a hazardous or harmful way or to deliberatelydrink to the point of intoxication. Binge drinking is common among under-agedrinkers.37 In 1998 one in 10 teenagers who were regular drinkers drank morethan 12 standard drinks in a typical day, and this was more common amongmales (14 per cent) than females (6 per cent).38
The type of alcohol consumed varies between males and females. In 1998,among adolescent males the most popular alcoholic beverage was regular beer(67 per cent), whilst bottled spirits were the beverage of choice for females(63 per cent); low-alcohol beer was the least favoured beverage (9 per cent).38
Influences on alcohol consumption
Peer-group norms are an important influence on the use of alcohol inadolescence.37 Under-age adolescent drinkers are most commonly introduced totheir first alcoholic drink by a friend or acquaintance.38 Other factors contributingto alcohol consumption during adolescence are the perceived benefits, such asalcohol’s relaxant qualities, enjoyment, to gain confidence, to bond with a peeror social group, to experiment, to lose control, and to get drunk.37
Family life in early childhood is believed to be an influential factor in theestablishment of alcohol misuse in later life. Among the risk factors are parents’substance abuse, ineffective parenting, inconsistent or harsh discipline, lack ofsupport, and lack of mutual attachments and nurturing.34 Exposure to alcoholbefore the age of 6 years and lax parental attitudes to alcohol may also increasevulnerability to frequent heavy drinking in adolescence.39
Research has shown that, in cultures where alcohol is introduced to youngpeople in a supportive family setting, alcohol-related problems tend not to arisein adolescence; this contrasts with countries where alcohol is officially notavailable.35
Public health strategies
The National Alcohol Action Plan 1999–2000 to 2002–03 identifies key strategyareas for helping to reduce alcohol-related harm.
155
3.5 CHOOSE WATER AS A DRINK
Dietary Guidelines for Children and Adolescents in Australia
Young people are seen as one of a number of groups in the Australiancommunity who are at higher risk of harm caused by alcohol consumption. As aresult, young people drinking is the focus of a number of harm-minimisationeducational initiatives, such as the National Alcohol Campaign. The campaignwas developed through qualitative and quantitative research, involving detailedexamination of prevailing attitudes, perceptions and behaviours amongadolescents. Other National Alcohol Action Plan strategies that are directed atyoung people are alcohol education programs in schools and tertiary institutions,drink-driving campaigns, and the development of guidelines for ‘responsible’drinking behaviour. The National Health and Medical Research Council hasrecently reviewed the 1992 Responsible Drinking Guidelines35 to providepopulation groups with up-to-date guidance on safe levels of alcoholconsumption.
Among the action plan’s other strategies for reducing alcohol-related harm inadolescents are the use of identity cards providing proof of age; controlling theprice, availability and advertising of alcohol; labelling alcoholic beverages withalcohol-content information; and devotion of resources to discouraging drink-driving.34
R E L AT I O N S H I P TO OT H E R G U I D E L I N E S
Children and adolescents need sufficient nutritious foods to grow anddevelop normally
A balance of nutrients and energy is important for appropriate growth in childrenand adolescents. Excessive consumption of soft drinks and fruit juice cancontribute significantly to energy intake and detract from a well-balanced diet,leading to an increased risk of obesity or underweight.
Enjoy a wide variety of nutritious foods
Food contains water. A varied diet contributes to meeting water requirements inchildren and adolescents.
Eat plenty of vegetables, legumes and fruits
Fruit juice should not be consumed as a substitute for fresh fruit. Fresh fruit is agood source of dietary fibre and is of higher nutritional value than fruit juice.
Include milks, yoghurts, cheese and/or alternatives
Dairy foods and their alternatives (such as calcium-fortified soy drinks) are a richsource of calcium, protein, riboflavin and vitamin B
12. Calcium is important in the
attainment of peak bone mass during adolescence and in the prevention ofosteoporosis. Reduced-fat milks are not suitable for children aged less than2 years.
156
3.5 CHOOSE WATER AS A DRINK
Dietary Guidelines for Children and Adolescents in Australia
Limit saturated fat and moderate total fat intake
Cow’s milk is unsuitable for children aged less than 12 months. Skim milk andreduced-fat milk should not be given to children aged less than 2 years; overthat age, reduced-fat milks are appropriate.
Consume only moderate amounts of sugars and foods containingadded sugars
Excessive consumption of sugar-sweetened beverages can contribute to obesityand dental caries in children. Prolonged sucking from a bottle containingcarbohydrate-rich fluids is a possible risk factor for caries in infants and toddlers.Flavoured carbohydrate drinks such as sports drinks may be more palatable andpromote higher fluid intakes in exercising children.
C O N C L U S I O N
Adequate fluid consumption is an integral component of a healthy diet. Water isa good source of fluids as it can hydrate without adding additional energy to thediet. Nevertheless other drinks such as milks, fruit juices, low energy soft drinksbeverages can add variety and in some cases (eg milks and juices) can addvaluable nutrients to the diet. Intakes of fluids containing substantial amounts ofadded sugars should be moderated. Alcohol is not suitable for children.
E V I D E N C E
There is Level III evidence of the effect of hydration on thirst and on drinkpreference (reference 7); of the effect of carbonated beverages on bone fracturein adolescence (references 13 and 15); of a link between sugar-sweetened drinksand childhood obesity (reference 16); and of excessive fruit juice consumption inpreschoolers compromising stature and obesity (reference 18) and causing failureto thrive (references 19 and 22), although one recent study (reference 23)showed no relationship to childhood growth.
Some of the other consequences of low fluid intakes have been studied primarilyin adults; the evidence for this is discussed in the Dietary Guidelines forAustralian Adults and the Dietary Guidelines for Older Australians. Evidencerelating to health effects of alcohol is discussed in the Dietary Guidelines forAustralian Adults.
R E F E R E N C E S
1. Australian Bureau of Statistics & Department of Health and Aged Care.National Nutrition Survey: nutrient intakes and physical measurements,Australia, 1995, Canberra: ABS, 1998.
157
3.5 CHOOSE WATER AS A DRINK
Dietary Guidelines for Children and Adolescents in Australia
2. Australian Bureau of Statistics & Department of Health and Aged Care.National Nutrition Survey: foods eaten, Australia, 1995. Canberra: ABS,1999.
3. Kleiner SM. Water: an essential but overlooked nutrient. JADA1999;99(2):200–6.
4. Brobribb W ed. Breastfeeding management in Australia, Melbourne:Nursing Mothers Association of Australia, 1997.
5. Watson AS. Children in sport. In: Bloomfield J, Fricker PA, Fitch KD eds.Science and medicine in sport, 2nd edn. Melbourne: Blackwell Science,1995:497.
6. Sports Medicine Australia. Safety guidelines for children in sport andrecreation. Canberra: Sports Medicine Australia, 1997.
7. Meyer F, Bar-Or O, Salsberg A, Passe D. Hypohydration during exercise inchildren: effect on thirst, drink preferences and rehydration. Int J SportsNutr 1994;4:22–35.
8. National Health and Medical Research Council & Agriculture and ResourceManagement Council of Australia and New Zealand. Australian drinkingwater guidelines. Canberra: AGPS, 1996.
9. Department of Health and Family Services. The Australian guide to healthyeating. Canberra: DHFS, 1998.
10. Halioua L, Anderson JJ. Lifetime calcium intake and physical activityhabits: independent and combined effects on the radial bone of healthypremenopausal Caucasian women. Am J Clin Nutr 1989;49:534–41.
11. Jacobson MF. Liquid candy: how soft drinks are harming Americans’health. Washington DC: Center for Sciences in the Public Interest, 1998.
12. Harnack, L, Stang, J, Story, R. Soft drink consumption among US childrenand adolescents: nutritional consequences. JADA 1999;99(4):436–41.
13. Wyshak G. Teenaged girls, carbonated beverage consumption, and bonefractures. Arch Pediatr Adolesc Med 2000;154:610–13.
14. Smith PF, Smith A, Miners J, McNeil J, Proudfoot A. Report from the ExpertWorking Group on the Safety Aspects of Dietary Caffeine. Canberra:Australia New Zealand Food Authority, 2000.
15. Wyshak G, Frisch RE. Carbonated beverages, dietary calcium, the dietarycalcium/phosphorus ratio, and bone fractures in girls and boys. J AdolescHlth 1994;15:210–15.
16. Ludwig DS, Peterson KE, Gortmaker SL. Relation between consumption ofsugar-sweetened drinks and childhood obesity: a prospective,observational analysis. Lancet 2001;357:505–8.
17. Nobigrot T, Chasalow FI, Lifshitz MD. Carbohydrate absorption from oneserving of fruit juice in young children: age and carbohydrate compositioneffects. J Amer Coll Nutr 1997;16(2):152–8.
158
3.5 CHOOSE WATER AS A DRINK
Dietary Guidelines for Children and Adolescents in Australia
18. Dennison B, Rockwell HL, Baker SL. Excess fruit juice consumption bypreschool-aged children is associated with short stature and obesity.Pediatrics 1997;99(1):15–22.
19. Smith MM, Lifshitz F. Excess fruit juice consumption as a contributingfactor in nonorganic failure to thrive. Pediatrics 1994;93(3):438–43.
20. O’Sullivan EA, Curzon MEJ. A comparison of acidic dietary factors inchildren with and without dental erosion. J Dent Children 2000;67:187–92.
21. Seow K. Biological mechanisms of early childhood caries. Comm Dent OralEpidem 1998;26(suppl. 1):8–27.
22. Hourihane JO’B, Rolles CJ. Morbidity from excessive intake of high energyfluids: the ‘squash drinking syndrome’. Arch Dis Child 1995;72:141–3.
23. Skinner JD, Carruth BR, Moran J, Houck K, Coletta F. Fruit juice intake isnot related to children’s growth. Pediatrics 1999;103(1):58–64.
24. Australia New Zealand Food Authority. Application A344—caffeine in non-alcoholic beverages: full assessment report and regulation impactstatement. Canberra: ANZFA, 1999.
25. Australia New Zealand Food Authority. Application A394—formulatedcaffeinated beverages: full assessment report and regulation impactstatement. Canberra: ANZFA, 2000.
26. O’Dea J, Rawstone, P. Consumption of dietary supplements and energydrinks by schoolchildren. Med J Aust 2000;173:389.
27. Sank L. Dental nutrition. Nutr Issues Abs 1999;19:1–2.
28. Murray R, Drummond B. Are there risks to dental health with frequent useof carbohydrate foods and beverages? Aust J Nutr Diet1996;53(suppl. 4):S47.
29. Tinanoff N, O’Sullivan DM. Early childhood caries: overview and recentfindings. Pediatr Dent 1997;19:12–16.
30. Whitney EN, Rolfes SR. Understanding nutrition, 7th edn. St Paul: WestPublishing Company, 1996:585.
31. Wei, P. Diet and dental caries. Asia Pac J Clin Nutr 1995; 4(suppl. 1):S45–S50.
32. Ahokas JT, Demos L, Donohue DC, Killalea S, McNeil J, Rix CJ. Review ofwater fluoridation and fluoride intake from discretionary fluoridesupplements : report to NHMRC. Melbourne: Key Centre for Applied andNutritional Toxicology & Department of Applied Chemistry, RMIT, &Department of Epidemiology and Preventive Medicine, Monash University,1999.
33. Lieber CS. Alcohol and nutrition. Alcohol Hlth Res Wld 1989;13(3):197–203.
34. National Expert Advisory Committee on Alcohol. Alcohol in Australia:issues and strategies. Consultation draft. Canberra: NEACA, 2000.
159
3.5 CHOOSE WATER AS A DRINK
Dietary Guidelines for Children and Adolescents in Australia
35. National Health and Medical Research Council. Australian alcoholguidelines: health risks and benefits. Canberra: NHMRC, 2001.
36. Australian Institute of Health and Welfare. Statistics on drug use inAustralia, 1998. Canberra: AIHW, 2000.
37. Shanahan P, Hewitt N. Developmental research for a national alcoholcampaign. Canberra: Department of Health and Aged Care, 1999.
38. Australian Institute of Health and Welfare. 1998 National Drug StrategyHousehold Survey: detailed findings. Canberra: AIHW, 2000.
39. Fergusson DM, Lynskey MT, Horwood LJ. Childhood exposure to alcoholand adolescent drinking patterns. Addiction 1994;89:1007–16.
161
3.6 LIMIT SATURATED FAT AND MODERATE TOTAL FAT INTAKE
Dietary Guidelines for Children and Adolescents in Australia
3 . 6 L I M I T S AT U R AT E D FAT A N DM O D E R AT E TOTA L FAT I N TA K E
L o w - f a t d i e t s a r e n o t s u i t a b l e f o r i n f a n t s
G e o f f r e y D a v i d s o n
T E R M I N O L O G Y
Fats
Chemically, most of the fats in foods are triglycerides, made up of a unit ofglycerol (glycerine) combined with three fatty acids, which may be the same ordifferent. The differences between one fat and another are largely a consequenceof the fatty acids they contain, which together make up 90 per cent of the weightof the molecule. Fats in the diet can be ‘visible’ or ‘invisible’. Among the visiblefats are butter, margarine, cooking oils, and the fat on meat. Invisible fats occurin foods such as cheese, sauces, mayonnaise, biscuits, cakes, pastries and nuts.In most diets, about half the fats are visible and half invisible.
Fats are the most concentrated form of energy—37 kilojoules per gram. They arethe chemical form in which most of the energy reserve of animals and someseeds is stored.
Saturated fats
In saturated fats the majority of the fatty acids, in chemical terms, contain nodouble bond; that is, they are fully saturated with hydrogen. Saturated fats areusually solid at room temperature. They are the main type of fat in milk, cream,butter and cheese, in some meats (most of the land animal fats), and in palm oiland coconut oil. Most predominantly saturated fats contain one or more of thefatty acids palmitic (16:0), myristic (14:0) and lauric (12:0). When thesepredominate in dietary fat, they tend to raise plasma cholesterol.
Mono-unsaturated fats
In mono-unsaturated fats the main fatty acid is oleic acid (18:1), which has one(mono) double (unsaturated) bond. Olive, canola and peanut oils are rich inoleic acid.
162
3.6 LIMIT SATURATED FAT AND MODERATE TOTAL FAT INTAKE
Dietary Guidelines for Children and Adolescents in Australia
Polyunsaturated fats
In polyunsaturated fats the main fatty acid contains two or more (poly) double(unsaturated) bonds. These fats are liquid at room temperature; that is, they areoils. The most common polyunsaturated fatty acid is linoleic acid (18:2); itsdouble bonds are in the n-6 position, and it occurs in seed oils—for example,sunflower oil, safflower oil and corn oil. Smaller amounts of polyunsaturatedfatty acids with double bonds in the n-3 position also occur in the diet; bestknown are those in fatty fish, their names abbreviated to EPA (20:5eicosapentaenoic) and DHA (22:6 docosahexaenoic). Another n-3polyunsaturated fatty acid, ALA (18:3 alpha linolenic), occurs in small amounts inleafy vegetables; there is more of it in canola oil and most in flaxseed oil.
B A C K G R O U N D
Fat is the nutrient that provides the most concentrated source of energy and is anessential source of fat-soluble vitamins and essential fatty acids. The guideline onfat intake for the adult population is not suitable for young children, particularlychildren to the age of 2 years. Restriction of the fat intake of children aged up to2 years may interfere with optimal energy intake and reduce the supply ofessential fatty acids needed by developing nervous tissue, thus adverselyaffecting growth and development.
Neurological development is particularly rapid in the first two years of life.Growth and tissue replacement require 30 per cent of energy intake in infants,compared with only 5 per cent in adults. Thus even a small energy deficit duringthis period of rapid growth may affect growth.1
As children grow older, however, another problem emerges—the increasingprevalence of overweight and obesity in our community. There is evidence of asignificant increase in overweight and obesity in the 2–6 year age group.2 Ahigh-fat diet is very energy dense, contributing to an excess energy intake andthe development of obesity. Even at a young age, a diet high in saturated fatsmay predispose to the development of cardiovascular disease later in life.
A 1997 Finnish randomised prospective clinical trial showed that in the under 2age group a fat intake of less than 30 per cent of total calories did notcompromise nutrient intake or lead to an increased sucrose intake.3 The studyalso suggests that current recommendations for fat intake in the first two years oflife are an overstatement. The total fat intake data were similar to those forAustralian children.2 These new guidelines do not recommend a change for theunder 2 age group, but in the 2–5 year age group a lower fat intake isrecommended.
Another important factor in recommending change concerns the educationalprocess. Optimal dietary habits should be inculcated early in life. A 1995Australian study found no difference in the relative amount of fat in the diet ofchildren aged 3 months to 8 years.4 Evidence from the Finnish study that a
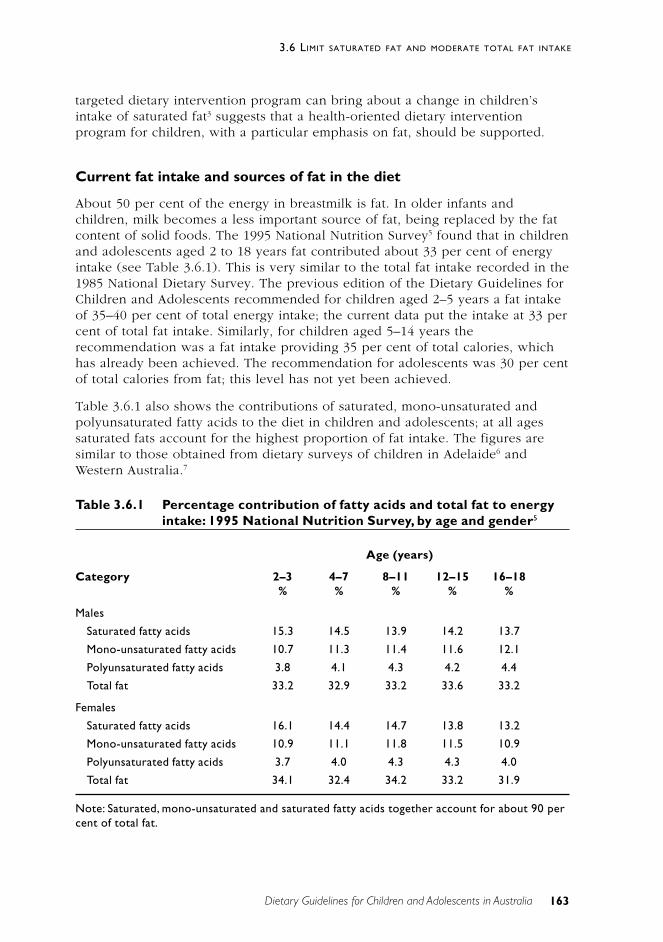
163
3.6 LIMIT SATURATED FAT AND MODERATE TOTAL FAT INTAKE
Dietary Guidelines for Children and Adolescents in Australia
targeted dietary intervention program can bring about a change in children’sintake of saturated fat3 suggests that a health-oriented dietary interventionprogram for children, with a particular emphasis on fat, should be supported.
Current fat intake and sources of fat in the diet
About 50 per cent of the energy in breastmilk is fat. In older infants andchildren, milk becomes a less important source of fat, being replaced by the fatcontent of solid foods. The 1995 National Nutrition Survey5 found that in childrenand adolescents aged 2 to 18 years fat contributed about 33 per cent of energyintake (see Table 3.6.1). This is very similar to the total fat intake recorded in the1985 National Dietary Survey. The previous edition of the Dietary Guidelines forChildren and Adolescents recommended for children aged 2–5 years a fat intakeof 35–40 per cent of total energy intake; the current data put the intake at 33 percent of total fat intake. Similarly, for children aged 5–14 years therecommendation was a fat intake providing 35 per cent of total calories, whichhas already been achieved. The recommendation for adolescents was 30 per centof total calories from fat; this level has not yet been achieved.
Table 3.6.1 also shows the contributions of saturated, mono-unsaturated andpolyunsaturated fatty acids to the diet in children and adolescents; at all agessaturated fats account for the highest proportion of fat intake. The figures aresimilar to those obtained from dietary surveys of children in Adelaide6 andWestern Australia.7
Table 3.6.1 Percentage contribution of fatty acids and total fat to energyintake: 1995 National Nutrition Survey, by age and gender5
Age (years)
Category 2–3 4–7 8–11 12–15 16–18% % % % %
Males
Saturated fatty acids 15.3 14.5 13.9 14.2 13.7
Mono-unsaturated fatty acids 10.7 11.3 11.4 11.6 12.1
Polyunsaturated fatty acids 3.8 4.1 4.3 4.2 4.4
Total fat 33.2 32.9 33.2 33.6 33.2
Females
Saturated fatty acids 16.1 14.4 14.7 13.8 13.2
Mono-unsaturated fatty acids 10.9 11.1 11.8 11.5 10.9
Polyunsaturated fatty acids 3.7 4.0 4.3 4.3 4.0
Total fat 34.1 32.4 34.2 33.2 31.9
Note: Saturated, mono-unsaturated and saturated fatty acids together account for about 90 percent of total fat.
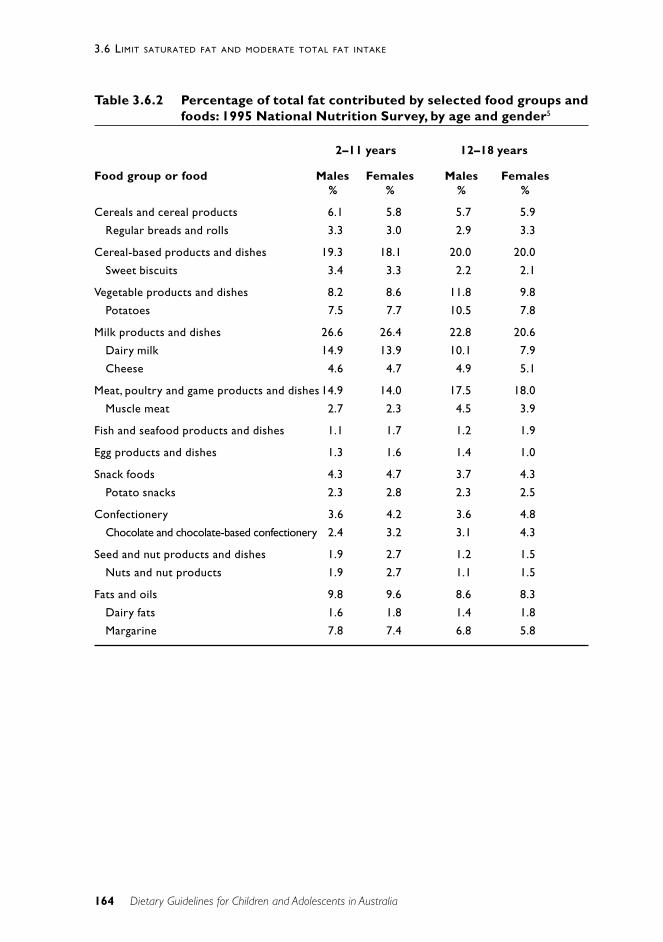
164
3.6 LIMIT SATURATED FAT AND MODERATE TOTAL FAT INTAKE
Dietary Guidelines for Children and Adolescents in Australia
Table 3.6.2 Percentage of total fat contributed by selected food groups andfoods: 1995 National Nutrition Survey, by age and gender5
2–11 years 12–18 years
Food group or food Males Females Males Females% % % %
Cereals and cereal products 6.1 5.8 5.7 5.9
Regular breads and rolls 3.3 3.0 2.9 3.3
Cereal-based products and dishes 19.3 18.1 20.0 20.0
Sweet biscuits 3.4 3.3 2.2 2.1
Vegetable products and dishes 8.2 8.6 11.8 9.8
Potatoes 7.5 7.7 10.5 7.8
Milk products and dishes 26.6 26.4 22.8 20.6
Dairy milk 14.9 13.9 10.1 7.9
Cheese 4.6 4.7 4.9 5.1
Meat, poultry and game products and dishes 14.9 14.0 17.5 18.0
Muscle meat 2.7 2.3 4.5 3.9
Fish and seafood products and dishes 1.1 1.7 1.2 1.9
Egg products and dishes 1.3 1.6 1.4 1.0
Snack foods 4.3 4.7 3.7 4.3
Potato snacks 2.3 2.8 2.3 2.5
Confectionery 3.6 4.2 3.6 4.8
Chocolate and chocolate-based confectionery 2.4 3.2 3.1 4.3
Seed and nut products and dishes 1.9 2.7 1.2 1.5
Nuts and nut products 1.9 2.7 1.1 1.5
Fats and oils 9.8 9.6 8.6 8.3
Dairy fats 1.6 1.8 1.4 1.8
Margarine 7.8 7.4 6.8 5.8
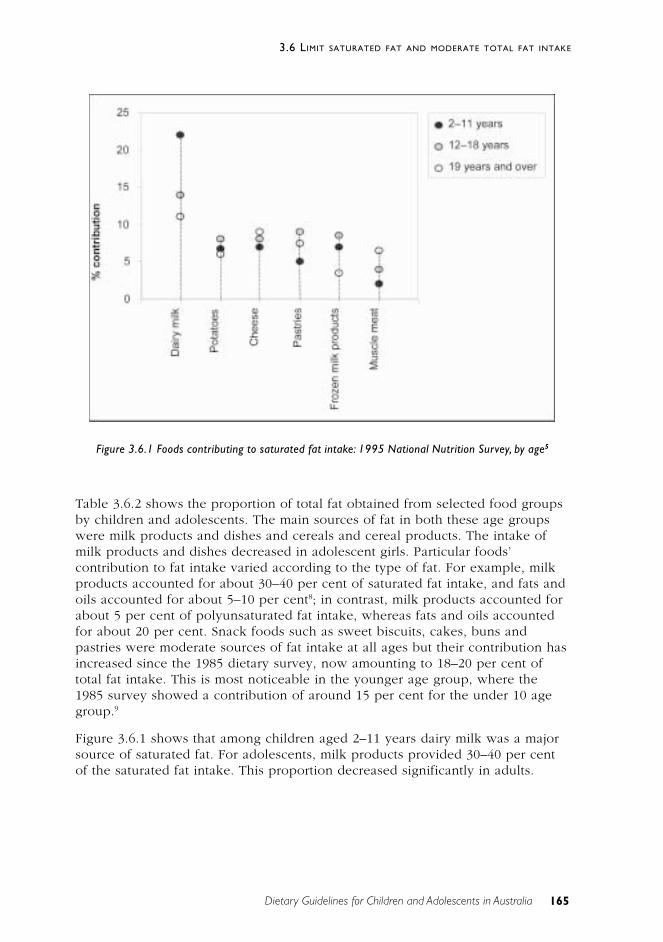
165
3.6 LIMIT SATURATED FAT AND MODERATE TOTAL FAT INTAKE
Dietary Guidelines for Children and Adolescents in Australia
Table 3.6.2 shows the proportion of total fat obtained from selected food groupsby children and adolescents. The main sources of fat in both these age groupswere milk products and dishes and cereals and cereal products. The intake ofmilk products and dishes decreased in adolescent girls. Particular foods’contribution to fat intake varied according to the type of fat. For example, milkproducts accounted for about 30–40 per cent of saturated fat intake, and fats andoils accounted for about 5–10 per cent8; in contrast, milk products accounted forabout 5 per cent of polyunsaturated fat intake, whereas fats and oils accountedfor about 20 per cent. Snack foods such as sweet biscuits, cakes, buns andpastries were moderate sources of fat intake at all ages but their contribution hasincreased since the 1985 dietary survey, now amounting to 18–20 per cent oftotal fat intake. This is most noticeable in the younger age group, where the1985 survey showed a contribution of around 15 per cent for the under 10 agegroup.9
Figure 3.6.1 shows that among children aged 2–11 years dairy milk was a majorsource of saturated fat. For adolescents, milk products provided 30–40 per centof the saturated fat intake. This proportion decreased significantly in adults.
Figure 3.6.1 Foods contributing to saturated fat intake: 1995 National Nutrition Survey, by age5
166
3.6 LIMIT SATURATED FAT AND MODERATE TOTAL FAT INTAKE
Dietary Guidelines for Children and Adolescents in Australia
S C I E N T I F I C B A S I S
Role of fat in the diet
Fat is an integral part of the diet. It provides a concentrated form of energy forgrowth and development and constitutes about 50 per cent of energy intake inearly infancy. It also provides essential fatty acids, particularly the n-3polyunsaturated fatty acids required by the body for cell structure, membranefunction and the development of the central nervous system. Further, it is asource of precursors for eicosanoid synthesis—for example, prostaglandins,thromboxanes and leukotrienes—and a vehicle for transporting fat-solublevitamins. In addition to these nutritional functions, fat contributes to the taste,texture and palatability of foods.10
There is some evidence that an adequate intake of cholesterol during the growthperiod is important for cholesterol metabolism later in life and for myelinisationof the nervous system, neurologic development in general, the formation ofhormones essential for growth and sexual maturation, and the production of bileacids.11,12 However, this largely ignores the fact that the human body is capableof synthesising sufficient cholesterol for all its metabolic needs.13,14 It is also wellestablished that the cholesterol-elevating effect of dietary cholesterol is ratherless than that of saturated fats.15
Overweight and obesity in children and adolescents: prevalence andcontributing factors
Excess body weight is the most common medical problem in Australia.2 It is alsoa major global public health concern.3,16
The most practical way of measuring obesity and overweight in clinical practiceis to use the body mass index—weight (kilograms)/height (metres)2. Inchildhood, BMI changes with age, so age-related reference charts are needed.This complicating factor has recently been addressed by the InternationalObesity Task Force, which has published BMI-for-age reference values settingthe childhood percentile for overweight and obesity on the basis of adult BMIranges.17 As a result, national data can now be analysed to determine pointprevalence, identify secular trends, and allow meaningful internationalcomparisons.
According to the most recent National Health and Nutrition Examination Surveyin the United States, approximately 25 per cent of children in that country areoverweight or obese.18 In Australia, there is evidence that the prevalence ofobesity in children is increasing2,19,20, although current national prevalence figuresare not available. Ethnicity21 and socio-economic status22 are important factorscontributing to obesity in Australian children. In a recently published review ofthe prevalence of overweight and obesity in Australian children and adolescents,data from two national samples taken 10 years apart were reviewed and the newInternational Obesity Task Force definition applied.2 Depending on age, 13–26 per
167
3.6 LIMIT SATURATED FAT AND MODERATE TOTAL FAT INTAKE
Dietary Guidelines for Children and Adolescents in Australia
cent of boys aged 2–18 years and 19–23 per cent of girls of that age areoverweight or obese, the prevalence peaking at 12–15 years in boys and 7–11years in girls. These rates, for both overweight and obesity, are higher than thosefor all the international reference populations and considerably higher than thosein Australia in 1985.2
Overweight and obesity in childhood constitute a risk factor for a range ofimmediate and long-term problems, among them diabetes, high cholesterollevels, hypertension, sleep apnoea, musculoskeletal problems, liver disease23 andpsychological problems (particularly in girls).24 Children who are overweightbeyond the age of 7 years are at greater risk of obesity and cardiovasculardisease in adulthood.25 The global epidemic of increasing overweight and obesityis attributed to changing lifestyle—decreasing activity26, increasing inactivity andincreasing food energy intake.
Management of childhood obesity is difficult and relies heavily on the parentsand a lifestyle change, particularly a change in the whole family’s eating habits,increased habitual physical activity, and decreased inactivity.27 A recent Adelaidestudy suggests that parents or guardians of overweight or obese children may notperceive the children as having a fat or obese body shape, and nor might thechildren themselves.28 This has implications in terms of families seeking adviceabout management of overweight or obese children.
Recommendations on children’s fat intakes
Although there is concern that limiting fat in the diet of young children maycompromise growth and development—which seems unlikely29—the mostcontroversial area in this regard concerns fat’s connection with the developmentof coronary heart disease in adulthood. There is, however, good evidence thatoverweight and obese children and adolescents are at greater risk of obesity inadulthood.30
A number of overseas organisations have recommended a general decrease in fatintake—to between 30 and 35 per cent of energy intake—for adults and forchildren over 2 years of age. Among those making this recommendation are theCanadian Paediatric Society31, the American Heart Association32, the AmericanHealth Foundation13, the National Cholesterol Education Program Expert Panel onBlood Cholesterol Levels in Children and Adolescents33 and the NationalInstitutes of Health Consensus Development Panel.34 The basis for therecommendation can be summarised as follows:
• Compared with their counterparts in many other countries, US children andadolescents have higher blood cholesterol levels and higher intakes ofsaturated fatty acids and cholesterol, and adults have higher bloodcholesterol levels and higher rates of morbidity and mortality fromcoronary heart disease.33,34
• Autopsy studies show that early coronary atherosclerosis or its precursorsoften begin in childhood and adolescence.13,33
168
3.6 LIMIT SATURATED FAT AND MODERATE TOTAL FAT INTAKE
Dietary Guidelines for Children and Adolescents in Australia
• High serum total low-density lipoprotein and very low density lipoproteincholesterol levels and low high-density lipoprotein cholesterol levels arecorrelated with the extent of early atherosclerotic lesions in adolescentsand young adults.33
• Children and adolescents with elevated serum cholesterol, particularly LDL,often come from families in which there is a high incidence of coronaryheart disease among adult members.33
• High blood cholesterol aggregates in families as a result of both sharedenvironments and genetic factors.33
• Children and adolescents with high cholesterol levels are more likely thanthe general population to have high cholesterol levels as adults.13,33
• Dietary behaviour—the principal modifiable contributor toatherosclerosis—particularly an excessive intake of saturated fats,originates in childhood and probably has an impact, physiologically andbehaviourally, early in life.13
• The importance of plasma cholesterol in coronary heart disease has beenconfirmed by many trials with cholesterol-lowering drugs, even in peoplewith average US plasma cholesterol levels.35
On the other hand, a number of individuals and other organisations—such as theAmerican Academy of Paediatrics Committee on Nutrition, the DietitiansAssociation of Australia, the Australian College of Paediatrics, and the UKCommittee on Medical Aspects of Food Policy—advocate a more cautiousapproach in applying adult fat-intake guidelines to children and adolescents.11,36–39
Australian recommendations also support caution because many foods with asignificant fat content are rich in nutrients and are important components of ahealthy diet.40
The following views have been expressed about adoption of the dietrecommended by the American Heart Association and other groups:
• Epidemiological studies are not of themselves sufficient to establish cause-and-effect relationships.11
• In diseases of multiple aetiology involving genetic factors, it is necessaryto understand the extent to which dietary intervention and individualresponses are related.11
• Successful implementation of a public health nutrition program requiresthe active support of the health-related professions.11
• The safety of diets that are designed to decrease consumption of fat andcholesterol has not been established for growing children.11–13
• It has not been demonstrated directly, by appropriately controlled studies,that dietary modification in children will alter the incidence of coronaryheart disease in later life.34,36–38,41,42
• Children who have cholesterol levels in the high range will not necessarilyhave levels in the same range when they reach adulthood.42
169
3.6 LIMIT SATURATED FAT AND MODERATE TOTAL FAT INTAKE
Dietary Guidelines for Children and Adolescents in Australia
On balance, however, the accumulating evidence of the increased incidence ofoverweight and obesity in our community2, suggests that recommendationsshould now be made about taking care with children’s fat intakes. The evidencesupports giving advice on fat intakes at an early age, and certainly under5 years.2,4 There is also evidence that introducing healthy eating patterns in earlychildhood influences dietary patterns in later childhood.3 Previous discussionshave targeted cholesterol and the potential hazards of cholesterol-lowering diets,but the aim of this guideline is to reduce total fat, particularly saturated fat, inthe diet.
Implications of the recommendations on children’s fat intakes
Unsupervised restriction of infants’ and young children’s dietary fat intake canlead to growth failure12,41,43–45 and chronic non-specific diarrhoea.46 A highproportion of hypercholesterolaemic patients who were advised to eat a low-fatdiet chose diets that would not sustain normal pubertal growth and weightgain46; for example, they consumed too little milk, other dairy products, meatand eggs. Additionally, the diets often provided insufficient energy andinappropriate quantities of the vitamins and minerals that are essential fornormal growth and development. The findings of these studies have beenattributed to inadequate consumption of energy36 or inadvertent starvation ofchildren by misinformed parents.45 The reports highlight the need to distinguishbetween two particular situations: a clinical need to reduce fat intake because ofpotential risk in a known disease state; and dietary recommendations for anotherwise healthy group of individuals who are overweight or obese.
In older children with a strong family history of cardiovascular disease or familialhypercholesterolaemia, where treatment is indicated the diet should aim toreduce total and saturated fat, substitute polyunsaturated and mono-unsaturatedfats for saturated fat, and decrease dietary cholesterol. Carbohydrate can replacesome of the energy from fat, but an experienced dietitian and a paediatricianmust carefully monitor the children’s growth and development.29,40,41
Low-fat diets and the need for supervision
When restricting fat in children’s diets, careful attention needs to be paid toeducating parents about the importance of a well-balanced diet, taking accountof the alterations needed for adequate intakes of nutrients. Children should bemonitored to ensure that they are consuming a suitable diet.12,14,29,40,42,44,45
Recommended targets for fat intakes during infancy, childhood andadolescence
The recommendations that follow propose a further drop in the total fat contentof young children’s and adolescents’ diets. This can be justified on the basis ofthe increasing incidence of overweight and obesity and the role played by high-
170
3.6 LIMIT SATURATED FAT AND MODERATE TOTAL FAT INTAKE
Dietary Guidelines for Children and Adolescents in Australia
fat foods. The Finnish study3 also showed that many children obtain less than30 per cent of total calories from fat without detrimental effects.29
The following guidelines cover the paediatric age periods of birth to 2 years, 2to 5 years, 5 to 14 years, and adolescence.
A. Birth to 2 years
In the first six months of life fat is an important source of energy. In breastfedand formula-fed infants, fat intake should make up approximately 50 per cent ofenergy intake.
For non-breastfed infants, infant formula—not cow’s milk—should be the primarymilk feed in the first year of life. This is because formula has a higher ironcontent and a complete nutrient profile (see Chapter 3 for further discussion). Inthe latter part of the first year of life and during the second year of life, thetarget should be approximately 40 per cent of energy as fat.
The fat content of milk becomes less important with age because other foodsthat contribute fats and oils are eaten. However, skim milk (less than 0.5 percent fat) and reduced-fat milk (1.5–2.5 per cent fat) should not be used inchildren aged less than 2 years.
B. Two to 5 years
Between the ages of 2 and 5 years there will be a gradual increase in theproportion of energy derived from carbohydrate and a gradual reduction in theproportion of energy from fat. Children in this age group are already consuminga diet containing 33 per cent fat, so a target of 30 per cent is recommended—with no more than 10 per cent from saturated fat. Reduced-fat milks should beused but skim milk should not be used for children aged less than 5 years.47 Thisshould not prevent its use, however, in family meals—for example, in custardand ice-cream.
C. Five to 14 years
For children between the ages of 5 and 14 years, approximately 30 per cent ofenergy intake as fat—with no more than 10 per cent coming from saturated fat—is appropriate. This will have no deleterious effects on nutrition or growth.48 Theuse of skim milk as a major dairy source is appropriate in this age group.
D. Adolescence
For adolescents, approximately 30 per cent of energy intake as fat—with nomore than 10 per cent coming from saturated fat—is desirable. This should beaccompanied by emphasis on physical activity and a balanced nutrient intake.Section 1.6 of the Dietary Guidelines for Australian Adults is relevant toadolescents.
171
3.6 LIMIT SATURATED FAT AND MODERATE TOTAL FAT INTAKE
Dietary Guidelines for Children and Adolescents in Australia
P R A C T I C A L A S P E C T S O F T H I S G U I D E L I N E
For infants under the age of 6 months, breastmilk provides a suitable amountand type of fat.
When solid foods are introduced, the advice given in Chapters 2 and 3 hereshould be followed.
Reduced-fat milk may be used from the age of 2 years, when milk plays a lessdominant role in the diet of the child.
Strategies for modifying the type and amount of fat consumed, as outlined inSection 1.6 of the Dietary Guidelines for Australian Adults, are important forolder children and adolescents. Reid et al. offer a number of suggestions forfostering positive attitudes and practices in relation to moderating fat intake:
• Encourage children to be moderate in their use of high-fat sauces, saladdressings, and spreads such as butter and margarine.
• Trim visible fat from children’s meat.
• Limit the use of processed meats such as hot dogs, luncheon meats andsausages.
• Limit fried foods such as French fries and fried fish or chicken to veryoccasional use, and use polyunsaturated and mono-unsaturated cookingoils when preparing them.
• Choose lower fat foods when eating at fast-food restaurants—for example,milk instead of milkshakes, single meat patties and pasta instead of pizza.
• Provide fruit and vegetables or bread as snacks, rather than potato crisps,biscuits or pastries. Use crisps and pastries as ‘treat foods’ only.
• Use reduced-fat or low-fat dairy foods for all children over the age of5 years.
R E L AT I O N S H I P TO OT H E R G U I D E L I N E S
Children and adolescents need sufficient nutritious foods to grow anddevelop normally• Growth should be checked regularly
• Physical activity is important for all children and adolescents
Activity has a positive effect on weight control, and obesity is often related toovereating, including overeating of high-fat foods.
172
3.6 LIMIT SATURATED FAT AND MODERATE TOTAL FAT INTAKE
Dietary Guidelines for Children and Adolescents in Australia
Include milks, yoghurts, cheese and/or alternatives
Section 3.4 highlights the point that dairy foods are a major contributor of bothtotal fat and saturated fat. But dairy foods are also a valuable source of othernutrients—particularly calcium—so it is important for older children andadolescents to choose low- or reduced-fat products where possible. Reduced-fatmilks are not suitable for children aged less than 2 years.
C O N C L U S I O N
In the first six months of life fat is an important source of energy. In breastfedand formula-fed infants, fat intake should make up approximately 50 per cent ofenergy intake. Between the ages of 2 and 5 years there will be a gradualincrease in the proportion of energy derived from carbohydrate and a gradualreduction in the proportion of energy from fat. For children above the age of 5yrs and for adolescents approximately 30 per cent of energy intake as fat—withno more than 10 per cent coming from saturated fat—is desirable.
E V I D E N C E
The evidence for chronic disease outcomes related to high intakes of saturatedfat is discussed in Section 1.6 of the Dietary Guidelines for Australian Adults.
In addition, there is also Level III evidence that overweight or obesity inchildhood increases the risk of obesity and cardiovascular disease in adulthood(references 25 and 30). There is Level IV evidence of a relationship betweenobesity and liver disease (reference 23) and psychological problems(reference 24) in children and Level IV evidence that growth failure can resultfrom low-fat, low-cholesterol diets in young children (reference 12). Because ofconcerns about maintaining adequate growth and development in earlychildhood, it is not possible to conduct randomised trials dealing with intakes offat and saturated fat in early childhood. There are, however, several Level IIIstudies from Finland (references 3 and 29) showing no deleterious effects ongrowth or neurological development of limiting fat intake in children followedfrom age 7 months to 5 years.
R E F E R E N C E S
1. Suskind RM, LeWinter-Suskind L eds. Textbook of paediatric nutrition, 2ndedn. New York: Raven Press, 1993.
2. Magarey AM, Daniels LA, Boulton TJC. Prevalence of overweight andobesity in Australian children and adolescents: reassessment of 1985 and1995 data against new standard international definitions. Med J Aust2001;174:561–4.
173
3.6 LIMIT SATURATED FAT AND MODERATE TOTAL FAT INTAKE
Dietary Guidelines for Children and Adolescents in Australia
3. Lagstrom H, Jokinen E, Seppanen R, Rönnemaa T, Viikari J, Välimäki I etal. Nutrient intakes by young children in a prospective randomised trial ofa low–saturated fat, low-cholesterol diet. Arch Pediatr Adolesc Med1997;151:181–8.
4. Boulton TJC, Magarey AM. Effects of differences in dietary fat on growth,energy and nutrient intake from infancy to eight years of age. ActaPaediatr 1995;84:146–50.
5. McLennan W, Podger A. National Nutrition Survey: nutrient intake andphysical measurements. Canberra: Australian Bureau of Statistics, 1997.
6. Magarey A, Nichols J, Boulton TJC. Food intake at age 8: energy, macro-and micronutrients. Aust Paediatr J 1987;23:173–8.
7. Jenner DA, Miller MR. Intakes of selected nutrients in year 7 WesternAustralian children: comparison between weekdays and weekend days andrelationships with socio-economic status. Aust J Nutr Dietet 1991;48:50–5.
8. McLennan W, Podger A. National Nutrition Survey: selected highlights,Australia, 1995. Canberra: Australian Bureau of Statistics, 1997.
9. Department of Community Services and Health. National dietary survey ofschool children (aged 10–15 years), 1985. No. 2: nutrient intakes.Canberra: AGPS, 1989.
10. National Health and Medical Research Council. The role of polyunsaturatedfats in the Australian diet. Canberra: AGPS, 1992.
11. American Academy of Pediatrics Committee on Nutrition. Toward aprudent diet for children. Pediatrics 1983;71:78–80.
12. Lifshitz F, Moses N. Growth failure: a complication of dietary treatment ofhypercholesterolaemia. Am J Dis Child 1989;143:537–42.
13. American Health Foundation. Coronary artery disease prevention. Prev Med1989;18:324–409.
14. Nicklas TA, Webber LS, Koschak M, Berenson CS. Nutrient adequacy oflow fat intakes for children: the Bogalusa Heart Study. Pediatrics1992;89:221–8.
15. Beynen AC, Katan MB. Impact of dietary cholesterol and fatty acids onserum lipids and lipoproteins in man. In: Vergroesen AJ, Crawford M eds.The role of fats in human nutrition. 2nd edn. London: Academic Press,1989:237–84.
16. World Health Organization. Obesity—preventing and managing the globalepidemic: report of a WHO consultation on obesity, Geneva, 3–5 June 1996.Geneva: WHO, 1998.
17. Cole TJ, Bellizzi MC, Flegal KM, Dietz WH. Establishing a standarddefinition for child overweight and obesity worldwide: internationalsurvey. BMJ 2000;320:1240–43.
174
3.6 LIMIT SATURATED FAT AND MODERATE TOTAL FAT INTAKE
Dietary Guidelines for Children and Adolescents in Australia
18. Triano RP, Flegal KM. Overweight children and adolescents: descriptionepidemiology and demographics. Pediatrics 1998;101:497–504.
19. Wake M, Lazarus R, Hasketh R, Waters E. Are Australian children gettingfatter? J Pediat Child Hlth 1999;35–47(abstract).
20. Booth ML, Wake M, Armstrong T, Chey T, Hesketh K, Mathur S. Theepidemiology of overweight and obesity among Australian children andadolescents, 1995–1997. Aust NZ J Pub Hlth 2001;25:162–9.
21. Booth ML, Macaskill P, Lazaras R, Baur LA. Socio demographic distributionof measures of body fatness among children and adolescents in New SouthWales, Australia. Int J Obes Relat Metab Disord 1999;23:456–72.
22. Lynch J, Wang XL, Wilcken DEL. Body mass index in Australian children:recent changes and relevance of ethnicity. Arch Dis Child 2000;52:16–20.
23. Manton ND, Lipsch J, Moore DJ, Davidson GP, Bourne AJ, Couper RTL.Non-alcoholic steatohepatitis in children and adolescents. Med J Aust2000;173:476–9.
24. Hill AJ, Lissau I. Psychosocial factors and consequences of child obesity.In: Burniat WT, Cole TJ, Lissau I eds. The obese and overweight child.Cambridge, UK: Cambridge University Press, in press.
25. Dietz WH. Childhood weight affects adult morbidity and mortality. J Nutr1998;128(suppl.):5411–14.
26. Dollman J, Olds T, Norton K, Stuart D. The evaluation of fitness andfatness in 10–11 year old Australian children: changes in distributionalcharacteristics between 1985 and 1997. Pediatr Exer Sci 1999;11:108–21.
27. Smith A, Kellett E, Schmerlaib Y. The Australian guide to healthy eating.Canberra: Department of Health and Family Services, 1998.
28. Moore D, Stratton J, Wilson K, Bahurst P, Couper J, Jureidini J et al.Perception of body shape in overweight/obese children attending apaediatric outpatient department. J Gastroenterol Hepatol2000;15:J76(abstract).
29. Rask-Nissila L, Jokinen E, Terho P, Tammi A, Lapinleimu H, Ronnemaa T etal. Neurological development of 5-year-old children receiving a low–saturated fat, low-cholesterol diet since infancy: a randomized controlledtrial. JAMA 2000;284:993–1000.
30. Power C, Lake JK, Cole TJ. Measurements of long term health risks of childand adolescent fatness. Int J Obes Relat Metab Disord 1997;21:507–26.
31. Nutrition Committee of the Canadian Pediatric Society. Children’s diet andatherosclerosis. Can Med Assoc J 1981;124:1545–8.
32. Weidman W, Kwiterovich P, Jesse MJ, Nugent E. Diet in the healthy child:Task Force of the Nutrition Committee and Cardiovascular Disease in theYoung Council of the American Heart Association. Circulation1983;67:1411A–1414A.
175
3.6 LIMIT SATURATED FAT AND MODERATE TOTAL FAT INTAKE
Dietary Guidelines for Children and Adolescents in Australia
33. Expert Panel on Blood Cholesterol Levels in Children and Adolescents.National Cholesterol Education Program: report. Pediatrics1992;89(suppl.):525–83.
34. National Institutes of Health. Lowering blood cholesterol to prevent heartdisease. JAMA 1985;253:2080–6.
35. Sacks FM, Pfeffer MA, Moye LA, Rouleau JL, Rutherford JD, Cole TG et al.The effect of pravastatin on coronary events after myocardial infarction inpatients with average cholesterol levels. N Engl J Med 1996;335:1001–9.
36. American Academy of Pediatrics Committee on Nutrition. Prudent life-stylefor children: dietary fat and cholesterol. Pediatrics 1986;78:521–5.
37. Magarey AM, Boulton TJC, Daniels L, Davidson GP. Recommendations fordietary intervention in the prevention and treatment of hyperlipidaemia inchildhood: a consensus statement from the Dietitians Association ofAustralia and the Australian College of Paediatrics. Aust J Nutr Diet1994;51:191–8.
38. Taitz LS. Diet of young children and cardiovascular disease. BMJ1987;294:912–17.
39. Department of Health and Social Security Committee on Medical Aspects ofFood Policy. Diet and cardiovascular disease. London: HMSO, 1984.
40. Magarey AM, Daniels LA, Boulton TJC. Reducing the fat content ofchildren’s diets: nutritional implications and practical recommendations.Aust J Nutr Diet 1993;50:69–74.
41. Kaplan RM, Toshima MT. Does a reduced fat diet cause retardation in childgrowth? Prev Med 1992;21:33–52.
42. Finberg L. Dietary advice: responsibility for monitoring. Am J Dis Child1989;143:531.
43. Holtzman NA. The great god cholesterol. Pediatrics 1991;87:943–5.
44. Tarlow MJ. Cholesterol and diet. Arch Dis Child 1989;64:647–8.
45. Pugliese MT, Weyman-Daum M, Moses N, Lifshitz F. Parental health beliefsas a cause of non organic failure to thrive. Pediatrics 1987;80:175–82.
46. Cohen SA, Hendricks K, Mathis R, Laramee S, Walker WA. Chronic non-specific diarrhoea: complication of dietary fat restriction. Pediatrics1979;64:402–7.
47. Fomon SJ, Filer LJ, Ziegler EE, Bergmann KE, Bergmann Rl. Skim milk ininfant feeding. Acta Paediatr Scand 1979;65:17–30.
48. Gleuck CJ, Mellies MJ, Dine M, Perry T, Laskarszewski P. Safety andefficiency of long term diet and diet plus bile acid binding resincholesterol lowering therapy in 73 children heterozygous for familialhypercholesterolaemia. Pediatrics 1986;78:338–48.
49. Reid J, George J, Pears R. Fat. In: Food and nutrition guidelines forchildren aged 2–12 years. Wellington, NZ: Department of Health, 1992.
177
3.7 CHOOSE FOODS LOW IN SALT
Dietary Guidelines for Children and Adolescents in Australia
3 . 7 C H O O S E F O O D S L OW I N S A LT
M a l c o l m R i l e y a n d T r e v o r B e a r d
T E R M I N O L O G Y
Salt and sodium
Dietary salt is an inorganic compound consisting of sodium and chloride ions. Itis found naturally in many foods, but it is also added to many foods because ofits preservative and flavouring characteristics. Research has shown that both thesodium and the chloride can be detrimental to health when consumed in excess.1
About 90 per cent of all the sodium added to food is sodium chloride, so dietaryintake of sodium represents intake of sodium chloride for practical purposes.Sodium in the diet of Australian adults comes mostly from processed foods,although sodium added in cooking, at the table, in medications and naturallypresent in foods can contribute to the total dietary intake.
Recommended intake for sodium
The current National Health and Medical Research Council recommendations forsodium intakes among Australian children and adolescents are 140–280 milligrams aday for infants, 460–1730mg/day for 1–3 year olds, 600–2300mg/day for 4–7 yearolds, and 920–2300mg/day for children aged 8 years and over and for adolescents.2
This last amount is the same as the recommendation for adults.
One thousand milligrams of sodium is contained in about 3 grams of commonsalt, or just over half a teaspoon.
Low-salt food
Food Standards Australia New Zealand defines a low-salt food as a food with asodium concentration of up to 120 milligrams per 100 grams (Joint Australia andNew Zealand Food Code, clause 17 of Standard 1.2.8).
The following are the conversion factors for the units used to express the sodiumcontent of food:
1mmol = 23 milligrams1 gram = 43mmol
One gram of sodium chloride (NaCl) contains 17mmol, or 391 milligrams, ofsodium.
178
3.7 CHOOSE FOODS LOW IN SALT
Dietary Guidelines for Children and Adolescents in Australia
B A C K G R O U N D
Cardiovascular disease is the largest cause of premature death and death overallin Australia; it accounted for 50 797 deaths, or 40 per cent of all deaths, in 1998.3
Most of these deaths are caused by coronary heart disease (55 per cent),followed by stroke (24 per cent). Each year about 40 000 Australians have astroke; 70 per cent of these are first-ever strokes. Stroke is the cause of nearly25 per cent of all chronic disability in Australia.4 Hypertension is the problemmost frequently seen by general practitioners, accounting for 5.7 per cent of allproblems they see.5 In 1995 an estimated 2.8 million Australians aged 18 yearsand over reported a recent and/or long-term cardiovascular condition. Highblood pressure was the most common condition for both males and females.6
The prevalence of cardiovascular conditions increased with age, reaching 61 percent among people aged 75 years and over.
Although male and female death rates from cardiovascular disease in Australiadeclined by about 3.6 per cent a year between 1985 and 1996, the number ofpeople with the disease is expected to increase in the next few decades as thenumber of older people increases and life-sustaining treatments improve. Thetotal direct costs to Australia of cardiovascular disease were estimated to be$3719 million in 1993–94, which represents 12 per cent of total health care costsfor all diseases.7
It is now well accepted that a reduction in dietary sodium intake will decreasethe mean population blood pressure and reduce the prevalence of hypertension.It has not yet been conclusively demonstrated that a mean dietary sodium intakewithin the range recommended for Australian adults will result in lowermorbidity and mortality rates than at present8, but the balance of evidencesuggests it will. Similarly, it has not been demonstrated that maintaining a meandietary sodium intake within the range recommended for Australian adults willresult in a lower incidence of hypertension—that is, prevent the occurrence ofhypertension—but, again, the balance of evidence suggests it will. It has beensaid that ‘few measures in preventive medicine are as simple and economicaland yet can achieve so much’.9 There is strong evidence that other componentsof the diet also influence blood pressure; this guideline focuses, however, on theindependent influence of sodium.
The risk of stroke and ischaemic heart disease increases continuously with bloodpressure, as shown by nine major prospective cohort studies.10 Within the rangeof diastolic blood pressure studied (about 70–110mmHg), there is no evidence ofa threshold below which the relationship alters. If dietary salt were decreased byan average of 3 grams (50mmol sodium) a day, the average systolic bloodpressure of people aged over 50 years of age would be expected to fall by about5mmHg; diastolic blood pressure would be lowered by about half as much. Theminority who are hypertensive would experience a greater average bloodpressure fall, but the reduction in the number of new cases of cardiovasculardisease would be greatest for the large proportion who are close to averageblood pressure. It has been estimated that a reduction in dietary salt by anaverage of 3 grams a day in an entire western population would reduce age-
179
3.7 CHOOSE FOODS LOW IN SALT
Dietary Guidelines for Children and Adolescents in Australia
specific stroke mortality by about 22 per cent and ischaemic heart diseasemortality by about 16 per cent.9,11
A recent review12 has pointed to a number of health conditions other than raisedblood pressure that are associated with excess sodium intake. Among them areany condition exacerbated by water retention (including heart failure, cirrhosis,nephrotic syndrome, and idiopathic and cyclical oedema), stroke (independentlyof blood pressure), gastric cancer and left ventricular hypertrophy. Excesssodium intake also increases the rate of deterioration in kidney function inpatients with renal disease, is associated with urinary stones, and may aggravateasthma13 and osteoporosis. Excretion of sodium is associated with an obligatoryloss of calcium as a result of interference with the tubular reabsorption ofcalcium. Calcium is conserved on low salt intakes and wasted on high saltintakes. This has relevance to calcium stones of the urinary tract (the commonestvariety of stone) and osteoporosis.
For infants, ingestion of foods high in sodium can lead to death because thekidneys are not fully developed until many months after birth. In July 1999 thepress reported that a British coroner had heard, from two paediatricians atSheffield Children’s Hospital, evidence that a 3-month-old baby boy had died ofhypernatraemia after an attempt at weaning him onto solid foods containing toomuch salt. The parents found the recommended baby food too expensive, soused a standard (adult) breakfast cereal plus instant mashed potatoes and gravy.The gravy was made with ordinary commercial gravy granules, which are veryhigh in sodium.
Weaning is not recommended until 6 months of age, and most makers of cannedbaby foods offer them for use from this age. The new Food Standards Code forAustralia and New Zealand stipulates the total amount of sodium allowed infoods for infants (Standard 2.9.2). The maximum amount is 100 milligrams per100 grams in flours, pasta and ready-to-eat foods, but the limitations ofcontemporary food technology are at present being accommodated by anallowance of 300mg/100g for biscuits and 350mg/100g for teething rusks. Incomparison, the sodium content of breastmilk is 18mg/100g.
Little is known about cuirrent intakes of salt in Australian children andadolescents.
S C I E N T I F I C B A S I S
It is uncommon for high blood pressure to express itself in children andadolescents, although the precursors of and risk factors for the condition can beidentified from an early age. It is recommended that good eating practices beestablished at an early age, so as to avoid the development or expression of highblood pressure in later life.
Food preferences seem to emerge early in life, although the nature of theprogression of these preferences to adulthood is not clear.14 Children’s food
180
3.7 CHOOSE FOODS LOW IN SALT
Dietary Guidelines for Children and Adolescents in Australia
preferences are influenced by food exposure, parents’ food preferences, parentalrole modelling, family approaches to food buying and cooking, media exposure,and parent–child interaction regarding food.15
Breastmilk contains about 8mmol per litre of sodium14, so breastfed infantsreceive about 7mmol of sodium each day. Infants’ immature kidneys havedifficulty excreting an overload of salt, and their diet needs to comply with theadult dietary guideline to choose low-salt foods, which are defined in the FoodStandards Code as foods with a sodium content up to 120 milligrams per100 grams. Compliance with the adult guideline would also help prevent youngchildren from becoming habituated to the taste of foods with a high salt content;this habituation develops within a few weeks of exposure.16
Studies of the association between sodium intake and blood pressure are morecommon in adults than children, but at least one study suggests that earlyexposure to dietary sodium may have lasting effects. In a six-month randomisedtrial of almost 500 bottle-fed newborns, the group whose sodium intake wasreduced by 50 per cent had a 2.1mmHg lower systolic blood pressure than thecontrol group.17 Of the 35 per cent of subjects who could be traced 15 yearslater, those originally receiving the low-sodium formula had a blood pressurethat was on average 3.6mmHG (systolic) and 2.2mmHg (diastolic) lower.18
The evidence that dietary sodium is associated with blood pressure in childrenis, however, inconsistent. A cohort study19 of 233 children examined theassociation between sodium and potassium intakes and change in bloodpressure. The subjects were followed for an average of seven years, eachproviding at least six annual, timed overnight urine collections. Urinary sodiumwas found to be unrelated to change in blood pressure over time; urinarypotassium and the urinary sodium–potassium ratio were related to a rise insystolic blood pressure.
Adolescents are particularly prone to an increased sodium intake because theirenergy needs increase greatly, resulting in a commensurate increase in foodintake, and their increased independence and disposable income encourage agreater intake of foods prepared outside the home, which may be more heavilysalted than foods prepared at home.
Increased excretion of calcium in response to a higher intake of sodium may bemore important in childhood and adolescence than in adulthood because of theneed to develop the highest possible peak bone mass during adolescence. Peakbone mass is one of the determinants of the development of osteoporosis in laterlife.
The scientific literature relating dietary sodium intake to blood pressure isextensive and dates back more than 100 years.20 Here it is possible only tosummarise the state of current knowledge, highlight important studies, and drawattention to important considerations. The literature provides evidence thatdifferent commentators can interpret similar scientific results quite differently,but there is general consensus on most issues.
181
3.7 CHOOSE FOODS LOW IN SALT
Dietary Guidelines for Children and Adolescents in Australia
It is generally agreed that the extent to which a reduction in dietary sodiumintake reduces blood pressure depends on age and initial blood pressure; it isgreater with age and at higher blood pressures.21,22 Law et al.22 found that the fulleffect of dietary sodium reduction on blood pressure is not seen for at least fiveweeks after the dietary change.
Among the major original studies are animal studies and human studies.Controlled experiments in chimpanzees have shown an important effect ofdietary salt reduction on blood pressure23, consistent with earlier experiments onrats.24 For chimpanzees that were allocated a high-sodium diet for only twoyears, up to six months of a return to their normal low-sodium diet was requiredbefore blood pressure lowering had reached its greatest extent.
In relation to human populations, three recent reviews8,11,25 are in agreement thatdietary sodium reduction is associated with reduction in blood pressure. Kuller25
and Law11 have called for a public health approach to lowering salt in the diet—that is, for the average salt intake of the population to be lowered throughreducing the amount of salt entering the food supply. Alderman8, however, callsfor randomised controlled studies of the long-term health benefits and safety ofdietary sodium reduction and concludes, ‘Without knowledge of the sum of themultiple effects of a reduced sodium diet, no single universal prescription forsodium intake can be scientifically justified’. The mass addition of salt to thefood supply depends on technology, however, and is a relatively recentphenomenon; further, it has never been scientifically justified. Societies withoutthe necessary technology for mass addition of salt to the food supply still exist—and their members are all normotensive throughout life, with little, if any,increase in blood pressure with age.26
Meta-analyses of sodium and hypertension trials
Law et al. took an approach that differs from a standard meta-analysis. Theyanalysed cross-sectional data from 24 communities worldwide, involving morethan 47 000 people22, and derived relationships between dietary sodium intakeand blood pressure that depended on age, centile in the blood pressuredistribution, and the level of development of the community. They tested therelationships on 14 studies examining the association of blood pressure withsodium intake within populations—importantly, after adjusting for the largeeffect of regression dilution bias.27 They found that the within-populationassociations were consistent with the relationships estimated using between-population data. Finally, they examined how closely the results from 68crossover trials and 10 randomised controlled trials conformed to therelationships they originally estimated from the between-population studies.9
They found that, for the 33 trials lasting five weeks or more, the observedreductions in blood pressure were similar to the predicted values (within a95 per cent confidence interval for 30 of the trials). For trials lasting less thanfive weeks, they found that the predicted fall in blood pressure was less than theobserved fall, which led them to conclude that dietary sodium reduction doesnot have its full effect on blood pressure until at least five weeks after
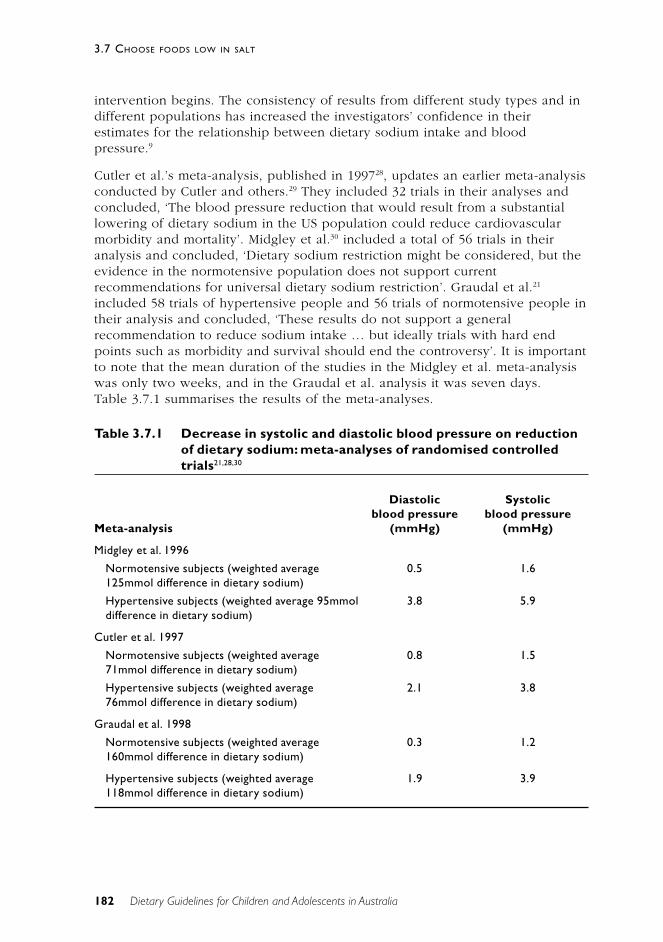
182
3.7 CHOOSE FOODS LOW IN SALT
Dietary Guidelines for Children and Adolescents in Australia
intervention begins. The consistency of results from different study types and indifferent populations has increased the investigators’ confidence in theirestimates for the relationship between dietary sodium intake and bloodpressure.9
Cutler et al.’s meta-analysis, published in 199728, updates an earlier meta-analysisconducted by Cutler and others.29 They included 32 trials in their analyses andconcluded, ‘The blood pressure reduction that would result from a substantiallowering of dietary sodium in the US population could reduce cardiovascularmorbidity and mortality’. Midgley et al.30 included a total of 56 trials in theiranalysis and concluded, ‘Dietary sodium restriction might be considered, but theevidence in the normotensive population does not support currentrecommendations for universal dietary sodium restriction’. Graudal et al.21
included 58 trials of hypertensive people and 56 trials of normotensive people intheir analysis and concluded, ‘These results do not support a generalrecommendation to reduce sodium intake … but ideally trials with hard endpoints such as morbidity and survival should end the controversy’. It is importantto note that the mean duration of the studies in the Midgley et al. meta-analysiswas only two weeks, and in the Graudal et al. analysis it was seven days.Table 3.7.1 summarises the results of the meta-analyses.
Table 3.7.1 Decrease in systolic and diastolic blood pressure on reductionof dietary sodium: meta-analyses of randomised controlledtrials21,28,30
Diastolic Systolicblood pressure blood pressure
Meta-analysis (mmHg) (mmHg)
Midgley et al. 1996
Normotensive subjects (weighted average 0.5 1.6125mmol difference in dietary sodium)
Hypertensive subjects (weighted average 95mmol 3.8 5.9difference in dietary sodium)
Cutler et al. 1997
Normotensive subjects (weighted average 0.8 1.571mmol difference in dietary sodium)
Hypertensive subjects (weighted average 2.1 3.876mmol difference in dietary sodium)
Graudal et al. 1998
Normotensive subjects (weighted average 0.3 1.2160mmol difference in dietary sodium)
Hypertensive subjects (weighted average 1.9 3.9118mmol difference in dietary sodium)
183
3.7 CHOOSE FOODS LOW IN SALT
Dietary Guidelines for Children and Adolescents in Australia
The question is how to interpret the different conclusions between meta-analyses. The first point to be made is that the estimated effects are not greatlydifferent from one another. The overall effects are lower than what might beexpected with full dietary compliance because the inclusion of all randomisedsubjects (‘intention to treat’ analysis) dilutes the number of subjects actuallycomplying with the intervention treatment. In determining the extent to whichchange in dietary sodium will change blood pressure, there are four effect-modifying factors: the magnitude of the change in sodium intake; the age of thesubjects; the initial blood pressure of the subjects; and the duration of theintervention. Ideally, one would like to conduct meta-analyses at different levelsof these factors, as has been done for normotension versus hypertension.
Many of the studies included in the meta-analyses were of short duration andconducted on young people. This would tend to decrease the effect observed.The studies involving larger reductions in dietary sodium also tended to be theshorter ones because of the current difficulty in maintaining a free-livingpopulation at a low sodium intake for a long period. In addition, technicalfactors—such as how to weight individual trials and how to construct a summaryregression line—differed between meta-analyses. The choice of methodologyalters the summary estimates considerably.
In effect, the meta-analyses indicate what might be expected from a dietarysodium reduction intervention undertaken in the current food environment,where avoiding dietary sodium is relatively difficult. Even under thesecircumstances, there is a fall in blood pressure for both hypertensive andrelatively young normotensive subjects.
No randomised controlled trials have been conducted to test the effectiveness ofdietary sodium reduction for primary prevention of hypertension. Furthermore,there is little information from randomised controlled trials about the effect ofdietary sodium reduction on mortality or morbidity from cardiovascular disease.8
Two large randomised controlled trials whose results were published after themeta-analyses—the DASH-Sodium trial31 and the TONE study32—warrantdiscussion.
DASH-Sodium was a sequel to the first DASH (Dietary Approaches to StopHypertension) study.33 Both were multi-centre randomised controlled trials for adietary period of 30 days. The first study held sodium constant at 130mmol/dayand compared the standard American diet with an ‘ideal’ diet that emphasisedfruits, vegetables, low-fat dairy foods, fish, legumes, nuts, and lean meat andpoultry; DASH-Sodium repeated the experiment at three sodium levels—104mmol/day (approximately the US guideline) plus or minus 39mmol/day (thatis, 143, 104 and 65mmol/day). The first DASH study observed a highly significantfall in blood pressure with the ‘ideal’ diet, indicating the benefits of a diet thatdecreased total and saturated fat and cholesterol and increased dietarypotassium, calcium, magnesium, fibre and protein in relation to the standardAmerican diet. The DASH-Sodium study demonstrated incremental further falls in
184
3.7 CHOOSE FOODS LOW IN SALT
Dietary Guidelines for Children and Adolescents in Australia
blood pressure at 104mmol/day and 65mmol/day of sodium, confirming that anotherwise ideal diet is more effective when it includes a sodium-reductionguideline. All the food was provided to the participants, thus enabling bettercontrol of the important confounding variable of dietary compliance; this is animportant difference between DASH-Sodium and previous sodium studies.
The mean decrease in systolic blood pressure when changing from 143mmol/dayon the control diet to 65mmol/day on the DASH diet was 7.1mmHg innormotensives and 11.5mmHg in hypertensives, the latter deriving as muchbenefit as they might expect from antihypertensive medication.34 While on thecontrol diet only and changing from 143mmol/day to 65 mmol/day, the changein systolic blood pressure was 9.8mmHg for African-Americans with hypertensionand 6.8mmHg for other racial groups with hypertension. The mean decrease indiastolic blood pressure between the high and low sodium intakes was –3.5mmHg(95%CI: –2.6 to –4.3) on the control diet and –1.6mmHg (95%CI: –0.8 to –2.5) onthe DASH diet. The combined effects on blood pressure of low sodium intakeand the DASH diet were greater than the effects of either intervention alone andwere substantial.
The first DASH trial was widely misinterpreted as having negated the importanceof other factors in hypertension such as overweight, alcohol and sodium intake31,but the design of the first study deliberately omitted the well-established factorsin order to test the other general dietary guidelines.34 Long-term health benefitsof the DASH-Sodium diet remain to be demonstrated, but this large randomisedcontrolled trial with high subject retention rates and excellent compliance withdietary protocols has provided compelling evidence that true reduction of dietarysodium has a substantial effect on blood pressure. The effect on normotensiveswas enough to justify it as a guideline for the whole population and to predict asubstantial effect at the population level.34,35
The TONE study was a randomised controlled trial of reduced sodium intake orweight loss in hypertensives aged 60 to 80 years.32 Of the 975 subjects, 585 wereobese and 390 were not. Withdrawal of hypertensive medication was a goal forall subjects. Follow-up visits at nine, 12 and 30 months had attendance rates of91, 86 and 86 per cent respectively.
The sodium-reduction group reduced their intake by a mean of only 46.6mmol/day at nine months, 49.3mmol/day at 18 months, and 39.5mmol/day at 30months. The goal for sodium reduction was a total intake of 80mmol/day or less,and only about 38 per cent of the subjects met this target at each visit, comparedwith about 11 per cent in the control groups. This modest compliance rateresulted in about a 30 per cent decrease in the need for antihypertensivemedication in the sodium-reduction group and a better result in subjects whocombined weight loss with sodium reduction. The modest dietary sodiumreduction of about 40mmol/day was well tolerated and sustained, and thesubjects reported no adverse effects.32
185
3.7 CHOOSE FOODS LOW IN SALT
Dietary Guidelines for Children and Adolescents in Australia
Special groups
Children of hypertensives
The children of a hypertensive person are at particular risk because of thegenetic link and/or shared environment. From earliest childhood and throughoutlife they have a heightened need for low-salt foods that comply with the adultdietary guideline for salt. Such an eating pattern is easier to maintain when thewhole family has the same diet.
Specific population groups
Mortality from cardiovascular disease is higher among Indigenous Australians, inrural areas and among socio-economically disadvantaged groups.7 Littleinformation is available on the salt intake of Indigenous Australians. A survey ofthe food habits of adults living in Victoria36 found that Indigenous Australians—whether living in the city or in rural towns—were much more likely thanEuropean Australians to add salt to cooked food.
P R A C T I C A L A S P E C T S O F T H I S G U I D E L I N E
Relationship to the Australian Guide to Healthy Eating
The Australian Guide to Healthy Eating37 focuses on food and food selection.Individuals should avoid choosing higher salt foods and replace them with foodsin the same group that are lower in salt. Much of the salt intake of Australianscomes from recommended foods—such as bread, cereals and cheese—and otherfrequently consumed foods such as butter, margarine and snack foods. Althoughequivalent studies have not been conducted in Australia, it has become apparentthat the source of most dietary sodium in western countries is not discretionarysalt.38–42 In particular, cooking salt is a much less important source than was oncethought. James et al.38 used lithium as a marker and found that only a quarter ofcooking salt actually enters the consumed food: the rest is discarded with thecooking water. Table 3.7.2 shows the origin of dietary sodium as measured inthe two studies.
Although it is important to advise people to consume less salt and to buy low-salt foods, the widespread use of salt in processed food and food prepared awayfrom home is a major barrier to achieving any meaningful reduction in dietarysodium intake. If the important public health objective of reducing the meanintake of sodium for all people to at least the top end of the recommendeddietary intake range42 is to be achieved, far-reaching action is necessary. Realisticmedium-term policy objectives would include a gradual reduction in the amountof salt added to processed food and consumer-friendly labelling showing thesodium content of food.
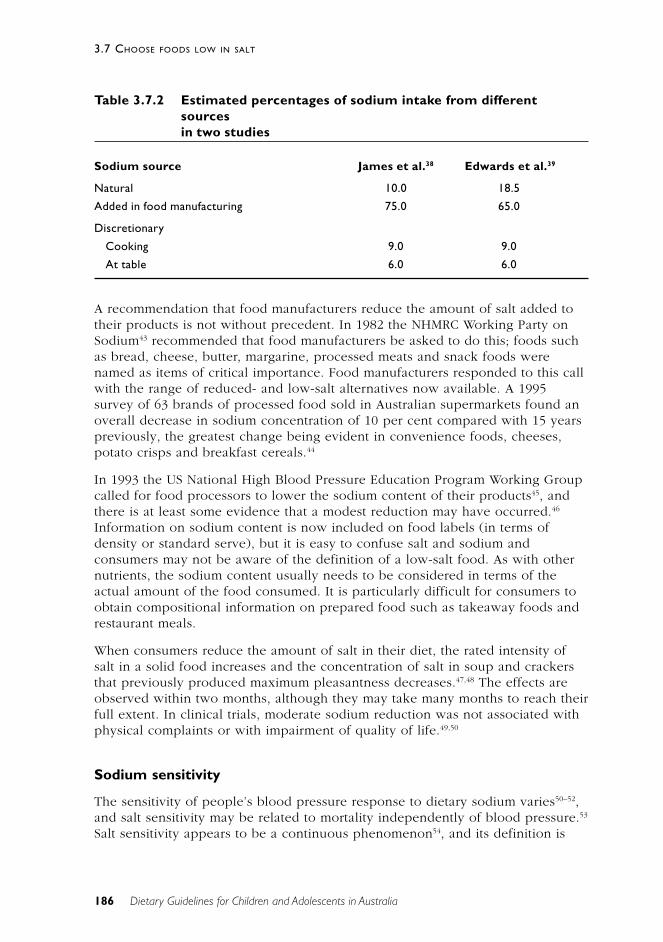
186
3.7 CHOOSE FOODS LOW IN SALT
Dietary Guidelines for Children and Adolescents in Australia
Table 3.7.2 Estimated percentages of sodium intake from differentsourcesin two studies
Sodium source James et al.38 Edwards et al.39
Natural 10.0 18.5
Added in food manufacturing 75.0 65.0
Discretionary
Cooking 9.0 9.0
At table 6.0 6.0
A recommendation that food manufacturers reduce the amount of salt added totheir products is not without precedent. In 1982 the NHMRC Working Party onSodium43 recommended that food manufacturers be asked to do this; foods suchas bread, cheese, butter, margarine, processed meats and snack foods werenamed as items of critical importance. Food manufacturers responded to this callwith the range of reduced- and low-salt alternatives now available. A 1995survey of 63 brands of processed food sold in Australian supermarkets found anoverall decrease in sodium concentration of 10 per cent compared with 15 yearspreviously, the greatest change being evident in convenience foods, cheeses,potato crisps and breakfast cereals.44
In 1993 the US National High Blood Pressure Education Program Working Groupcalled for food processors to lower the sodium content of their products45, andthere is at least some evidence that a modest reduction may have occurred.46
Information on sodium content is now included on food labels (in terms ofdensity or standard serve), but it is easy to confuse salt and sodium andconsumers may not be aware of the definition of a low-salt food. As with othernutrients, the sodium content usually needs to be considered in terms of theactual amount of the food consumed. It is particularly difficult for consumers toobtain compositional information on prepared food such as takeaway foods andrestaurant meals.
When consumers reduce the amount of salt in their diet, the rated intensity ofsalt in a solid food increases and the concentration of salt in soup and crackersthat previously produced maximum pleasantness decreases.47,48 The effects areobserved within two months, although they may take many months to reach theirfull extent. In clinical trials, moderate sodium reduction was not associated withphysical complaints or with impairment of quality of life.49,50
Sodium sensitivity
The sensitivity of people’s blood pressure response to dietary sodium varies50–52,and salt sensitivity may be related to mortality independently of blood pressure.53
Salt sensitivity appears to be a continuous phenomenon54, and its definition is
187
3.7 CHOOSE FOODS LOW IN SALT
Dietary Guidelines for Children and Adolescents in Australia
arbitrary; however, it appears to be reproducible in individuals.55 A clinicallypractical means of identifying salt sensitivity is yet to be found.52 It has beenshown that the prevalence of sensitivity increases with age54, raising doubtsabout the persistence of a determination of being ‘insensitive’ to dietary salt. Saltsensitivity is also associated with defective endothelial-dependent vasodilation inpeople with hypertension56, although the reason for this is not understood. Saltsensitivity is an area of active research, and a better understanding of themechanisms involved will probably improve our understanding of the healtheffects of dietary salt intake.
Changes needed to current diet
The recommended dietary intake for Australian adults for sodium is 40–100mmol/day (920–2300mg), with no extra recommendation for pregnancy orlactation.42 The following are the recommendations for children and adolescents:
• for children aged to 6 months, 6–12mmol (140–280mg) per day
• for children aged 7–12 months, 14–25mmol (320–580mg) per day
• for 1–3 year olds, 20–75mmol (460–1730mg) per day
• for 4–7 year olds, 26–100mmol (600–2300mg) per day
• for 8–18 year olds, 40–100mmol (920–2300mg) per day—the same as foradults.
To achieve this intake, children and adolescents should consume fresh food,foods normally processed without salt, and low-salt or no-added-salt groceries,and they should avoid adding salt to food.57 Among the substitutes for salt areacidic ingredients such as vinegar, lemon, lime, plum and other fruit juices; curryspices; garlic and onion; and herbs.57 These flavour substitutes may, however, beinappropriate for children who have never been habituated to salt: parentsshould take care not to rely on their own taste perception of salt whenflavouring food for their children.
Sodium intake is poorly measured by many dietary survey methods that are usedto measure other food components because foods of similar type vary widely intheir sodium content (for example, breakfast cereals) and dietary addition can bediscretionary but not easily quantifiable (for example, adding salt when cookingand at meals). Measuring sodium output in urine over a 24-hour period is anaccurate way of estimating sodium intake: about 93 per cent of dietary sodium isrecovered in the urine.38 Day-to-day variation in sodium intake is high26,58, sointake for a single day generally does not accurately reflect a person’s usuallong-term intake.
The sodium intake of Australian children and adolescents has not been measuredin large population surveys. As a consequence, the extent to which thispopulation group meets the recommended intake for each age is not known. Butit is known that most adults overconsume salt by a large amount—as discussedin the Dietary Guidelines for Adult Australians—and it is likely that the sameapplies to children and adolescents.
188
3.7 CHOOSE FOODS LOW IN SALT
Dietary Guidelines for Children and Adolescents in Australia
People wanting to achieve a low sodium intake should choose low-salt foods—that is, with a sodium content up to 120 milligrams per 100 grams. Fresh foodssuch as fruit, vegetables, meat, milk and yoghurt are well under the sodium limitbut most manufactured foods are well over it.59 Breads have a sodium contenttypically as high as 400–725 milligrams per 100 grams. ‘Salt-free’ bread can bedifficult to find, but it (and other low-salt products) should be sought out. Peopleused to a higher salt intake will at first miss the taste of salt when they begin alower salt intake. But the palate adapts to lower sodium levels, and people willfind that the intensity of salt in food increases and their ‘preferred saltiness’ offood reduces.47,48 Changes will be noticed within a week and taste change willcontinue for many months.
Salt in relation to prevention of iodine deficiency
Iodine deficiency disorders were once common in several Australian states, anda traditional control measure has been the sale of iodised salt. Only table salt isiodised, however, and its use has declined to the point where in a Hobart surveyin 1995 over 50 per cent of both sexes stated that they neither cooked with saltnor used it at the table.60 Mild iodine deficiency is now regarded as an importantcause of preventable mental retardation, and it is alarming that urinary excretionhas revealed moderate to severe iodine deficiency, even in a survey ofoutpatients (including pregnant women) at a metropolitan hospital in Sydney.61
Adherence to the salt guideline reduces salt’s availability as a vehicle for iodine,and iodine fortification of one or more staple foods, such as bread, may need tobe considered.
R E L AT I O N S H I P TO OT H E R G U I D E L I N E S
The first edition of the Dietary Guidelines for Children and Adolescents2
contained the guideline ‘Choose low-salt foods’. This current review concurs thatthe most rational way of achieving a lower sodium intake is through choosinglow-salt foods, but the wording of the guideline has been changed slightly toemphasise that many foods are naturally low in salt and that consumption ofspecially manufactured ‘low-salt’ foods is not the only way to limit one’s saltintake. Although discretionary use of salt is an important source of dietarysodium for many people, a single-focus, simple message is considered animportant priority for this guideline.
This dietary guideline is consistent with each of the other guidelines presentedhere. Many manufactured foods have a large amount of salt added: these shouldbe avoided while maintaining (or attaining) a healthy intake of breads andcereals and fruit and vegetables. A lower dietary sodium intake would be muchmore easily achieved if manufacturers in general were to decrease the amount ofsalt added to their products—following the lead that some manufacturers haveset—and consumers were easily able to assess the sodium content ofmanufactured food.
189
3.7 CHOOSE FOODS LOW IN SALT
Dietary Guidelines for Children and Adolescents in Australia
Many diet-related factors are likely to be helpful in treating hypertension andlimiting the risk of developing the condition. Among these are maintaining ahealthy body weight, a moderate alcohol intake, and a relatively high potassiumintake, and opting for a diet high in fruits and vegetables and low-fat dairyproducts (the DASH diet).
C O N C L U S I O N
The past decade has seen the emergence of international consensus that amodest reduction in dietary sodium intake for people with normal and raisedblood pressure has a sufficiently large effect on blood pressure (and thereforehealth) to justify a guideline advising restraint for the entire population.62 Thisconsensus is strongly supported by a large and well-conducted randomisedcontrolled trial27 in which subject retention was high and dietary compliance wasoptimised by providing all of the food throughout the trial period.
The proportion of the population who would benefit at older ages from a lowerintake of dietary sodium is becoming increasingly large, yet salt in foods isdifficult to avoid, mainly because of the large amount added by foodmanufacturers. A lifelong intake of dietary sodium within the recommendedrange would obviate the often-stated difficulty of reducing dietary sodium intakein later life. The Australian diet contains an unnecessarily large amount of salt,and a gradual reduction will certainly benefit the large numbers of peoplecurrently destined to develop hypertension; it would probably also benefit asubstantial proportion of people who will otherwise develop disease—inparticular, cardiovascular disease.
Primary prevention of hypertension poses one of the greatest challenges forpublic health in the 21st century, and reducing dietary salt is a leadingpopulation health strategy for achieving this goal.
E V I D E N C E
There is strong evidence that reducing dietary sodium reduces average bloodpressure in groups of people whose blood pressure is raised. The evidencecomes from well-conducted randomised controlled trials and is supported bymeta-analyses of these—Level I evidence (references 21 and 28 to 30). The sizeof the effect is clinically important and is larger for older individuals and athigher blood pressures. The effect appears to be evident for ‘high-normal’ bloodpressure; that is, when blood pressure is not high enough to be categorised‘hypertensive’. The evidence is relevant even though randomised controlled trialshave not been conducted to assess mortality or morbidity outcomes other thanchange in blood pressure.
There is also Level II evidence (references 9, 24, 31 to 33, 47 and 48), Level IIIevidence (references 10, 20 and 52) and Level IV evidence (reference 49) of therelationship between blood pressure and salt reduction. Further, there is Level II
190
3.7 CHOOSE FOODS LOW IN SALT
Dietary Guidelines for Children and Adolescents in Australia
evidence of a relationship between sodium intake and blood pressure in infants(references 17 and 18) and Level III evidence that urinary sodium–potassiumratios relate to rising blood pressure in children (reference 18).
The evidence that reducing dietary sodium levels to the recommended intake of40–100mmol (920-2300 mg) a day causes adverse health effects is weak. Adversehealth effects have not been observed in the randomised controlled trialsconducted to date. Adverse health effects that become apparent over longperiods seem unlikely, given the low dietary sodium intake observed in manypopulations without apparent specific ill-effect and the presumed low dietarysodium intake by humans—by analogy with other terrestrial mammals—overmuch of their history.
R E F E R E N C E S
1. Kurtz TW, Al-Bander H, Morris RC. ‘Salt-sensitive’ essential hypertension inman. Is the sodium ion alone important? New Engl J Med 1987;317:1043–8.
2. National Health and Medical Research Council. Dietary guidelines forchildren and adolescents. Canberra: Australian Government PublishingService, 1995.
3. Australian Institute of Health and Welfare. Australia’s health 2000: theseventh biennial health report of the Australian Institute of Health andWelfare. Canberra: AIHW, 2000.
4. National Health and Medical Research Council. Clinical practice guidelines:prevention of stroke—the role of anticoagulants, antiplatelet agents andcarotid endoarterectomy. Canberra: AGPS, 1997.
5. Britt H, Sayer GP, Miller GC, Charles J, Scahill S, Horn F et al. Generalpractice activity in Australia, 1998–99. General Practice Series no. 2. Cat.no. GEP2. Canberra: Australian Institute of Health and Welfare, 1999.
6. Australian Institute of Health and Welfare. Heart, stroke and vasculardiseases: Australian facts. Cardiovascular Disease Series no. 10. Cat. no.CVD 7. Canberra: AIHW, National Heart Foundation of Australia & NationalStroke Foundation of Australia, 1999.
7. Department of Health and Aged Care & Australian Institute of Health andWelfare. National health priority areas report: cardiovascular health,1998—summary. AIHW cat. no. PHE 12. Canberra: DHAC & AIHW, 1999.
8. Alderman MH. Salt, blood pressure and human health. Hypertension2000;36:890–3.
9. Law MR, Frost CD, Wald NJ. By how much does dietary salt reductionlower blood pressure? III. Analysis of data from trials of salt reduction. BMJ1991;302:819–24.
191
3.7 CHOOSE FOODS LOW IN SALT
Dietary Guidelines for Children and Adolescents in Australia
10. MacMahon S, Peto R, Cutler J, Collins R, Sorlie P, Neaton J et al. Bloodpressure, stroke and coronary heart disease. Part 1. Prolonged differencesin blood pressure: prospective observational studies corrected for theregression dilution bias. Lancet 1990;335:765–74.
11. Law MR. Epidemiologic evidence on salt and blood pressure. Am JHypertens 1997;10:42S–45S.
12. MacGregor GA. Salt—more adverse effects. Am J Hypertens 1997;10:37S–41S.
13. Carey OJ, Locke C, Cookson JB. Effect of alterations of dietary sodium onthe severity of asthma in men. Thorax 1993;48:714–18.
14. Worthington-Roberts BS, Williams SR eds. Nutrition throughout thelifecycle. 4th edn. New York: McGraw-Hill, 2000.
15. Campbell K, Crawford D. Family food environments as determinants ofpreschool-aged children’s eating behaviours: implications for obesityprevention policy—a review. Aust J Nutr Diet 2001;58:19–25.
16. Blais CA, Pangborn RM, Borhani NO, Ferrell MF, Prineas RJ, Laing B. Effectof dietary sodium restriction on taste responses to sodium chloride: alongitudinal study. Am J Clin Nutr 1986;44:232–243.
17. Hofman A, Hazebroek A, Valkenburg HA. A randomized trial of sodiumintake and blood pressure in new born infants JAMA 1983;250:370–3.
18. Geleijnse JM, Hofman A, Witteman JC, Hazebroek AA, Valkenburg HA,Grobbee DE. Long-term effects of neonatal sodium restriction on bloodpressure. Hypertension 1997;29:913–17. (Erratum appeared in Hypertension1997;29:1211.)
19. Geleijnse JM, Grobbee DE, Hofman A. Sodium and potassium intake andblood pressure change in childhood. BMJ 1990;300:899–902.
20. Ambard L, Beaujard E. Causes de l’hypertension artérielle. Archivesgénérales de médecine 1904;1:520–33.
21. Graudal NA, Galloe AM, Garred P. Effects of sodium restriction on bloodpressure, rennin, aldosterone, catecholamines, cholesterols andtriglyceride: a meta-analysis. JAMA 1998;279:1383–91.
22. Law MR, Frost CD, Wald NJ. By how much does dietary salt reductionlower blood pressure? I. Analysis of observational data among populations.BMJ 1991;302:811–15.
23. Denton D, Weisinger R, Mundy NI, Wickings EJ, Dixson A, Moisson P et al.The effect of increased salt intake on blood pressure of chimpanzees.Nature Med 1995;1:1009–16.
24. Dahl LK. Salt and hypertension. Am J Clin Nutr 1972;25:231–44.
25. Kuller LH. Salt and blood pressure: population and individual perspectives.Am J Hypertens 1997;10:29S–36S.
192
3.7 CHOOSE FOODS LOW IN SALT
Dietary Guidelines for Children and Adolescents in Australia
26. Intersalt Cooperative Research Group. Intersalt: an international study ofelectrolyte excretion and blood pressure. Results for 24 hour urinarysodium and potassium excretion. BMJ 1988;297:319–28.
27. Frost CD, Law MR, Wald NJ. By how much does dietary salt reductionlower blood pressure? II. Analysis of observational data withinpopulations. BMJ 1991;302:815–18.
28. Cutler JA, Follmann D, Allender PS. Randomized trials of sodium reduction:an overview. Am J Clin Nutr 1997;65(suppl.):643S–651S.
29. Cutler JA, Follmann D, Elliott P, Suh IL. An overview of randomized trialsof sodium reduction and blood pressure. Hypertension1991;17(suppl. 1):27–33.
30. Midgley JP, Matthew AG, Greenwood CMT, Logan AG. Effect of reduceddietary sodium on blood pressure: a meta-analysis of randomizedcontrolled trials. JAMA 1996;275:1590–7.
31. Sacks FM, Svetley LP, Vollmer WM, Appel LJ, Bray GA, Harsha D et al. Effectson blood pressure of reduced dietary sodium and the dietary approaches tostop hypertension (DASH) diet. New Engl J Med 2001;344:3–10.
32. Whelton PK, Appel LJ, Espeland MA, Applegate WB, Ettinger WH, KostisJB et al. for the TONE Collaborative Research Group. Sodium reductionand weight loss in the treatment of hypertension in older persons: arandomized controlled trial of nonpharmacologic interventions in theelderly (TONE). JAMA 1998;279:839–46.
33. Appel LJ, Moore TJ, Obarzanek E, Vollmer WM, Svetkey LP, Sacks FM et al.for the DASH Collaborative Research Group. A clinical trial of the effectsof dietary patterns on blood pressure. N Engl J Med 1997;336:1117–24.
34. Greenland P. Beating high blood pressure with low-sodium DASH.Editorial. New Engl J Med 2001;344:53–5.
35. Cook NR, Cohen J, Hebert PR, Taylor JO, Hennekens CH. Implications ofsmall reductions in diastolic blood pressure for primary prevention. ArchIntern Med 1995;155:701–9.
36. Guest C, O’Dea K. Food habits in Aborigines and persons of Europeandescent of southeastern Australia. Aust J Publ Hlth 1993;17:321–4.
37. Department of Health and Family Services. The Australian guide to healthyeating: background information for nutrition educators. Canberra: DHFS,1998.
38. James WPT, Ralph A, Sanchez-Castillo CP. The dominance of salt inmanufactured food in the sodium intake of affluent societies. Lancet1987;1:426–9.
39. Edwards DG, Kaye AE, Druce E. Sources and intakes of sodium in theUnited Kingdom diet. Eur J Clin Nutr 1989;43:855–61.
40. Stamler J. Dietary salt and blood pressure. Ann NY Acad Sci 1993;676:122–56.
193
3.7 CHOOSE FOODS LOW IN SALT
Dietary Guidelines for Children and Adolescents in Australia
41. Mattes RD, Donelly D. Relative contributions of dietary sodium sources. JAm Coll Nutr 1991;10:383–93.
42. National Health and Medical Research Council. Recommended dietaryintakes for use in Australia. Canberra: Australian Government PublishingService, 1991.
43. National Health and Medical Research Council. Report of the Working Partyon Sodium in the Australian diet. Canberra: AGPS, 1982.
44. National Blood Pressure Advisory Committee. Salt and hypertension: apaper for health professionals. National Heart Foundation of Australia<www.heartfoundation.com.au>.
45. National High Blood Pressure Education Program Working Group. Report onprimary prevention of hypertension. Arch Intern Med 1993;153:186–208.
46. Jacobson MF, Liebman BF. Letter. Sodium in processed foods. Am J ClinNutr 1996;63:138–40.
47. Blais CA, Pangborn RM, Borhani NO, Ferrell MF, Prineas RJ, Laing B. Effectof dietary sodium restriction on taste responses to sodium chloride: alongitudinal study. Am J Clin Nutr 1986;44:232–43.
48. Bertino M, Beauchamp GK, Engelman K. Long-term reduction in dietarysodium alters the taste of salt. Am J Clin Nutr 1982;36:1134–44.
49. Grimm RH Jr, Grandits GA, Cutler JA, Stewart AL, McDonald RH, SvendsenK et al. Relationships of quality-of-life measures to long-term lifestyle anddrug treatment in the Treatment of Mild Hypertension Study. Arch InternMed 1997;157:638–48.
50. Kumanyika S. Behavioral aspects of intervention strategies to reducedietary sodium. Hypertension 1991;17(suppl. 1):190–5.
51. Luft FC, Weinberger MH. Heterogeneous responses to changes in dietarysalt intake: the salt-sensitivity paradigm. Am J Clin Nutr 1997;65:612S–617S.
52. Mattes RD, Falkner B. Salt-sensitivity classification in normotensive adults.Clin Sci 1999;96:449–59.
53. Weinberger MH, Fineberg NS, Fineberg SE, Weinberger M. Salt sensitivity,pulse pressure, and death in normal and hypertensive humans.Hypertension 2001;37(part 2):429–32.
54. Weinberger M. Sodium and volume sensitivity of blood pressure: age andpressure change over time. Hypertension 1991;18:67–71.
55. Weinberger MH. Salt sensitivity of blood pressure in humans. Hypertension1996;27:481–90.
56. Bragulat E, Sierra A, Antonio MT, Coca A. Endothelial dysfunction in salt-sensitive essential hypertension. Hypertension 2001;37(part 2):444–8.
194
3.7 CHOOSE FOODS LOW IN SALT
Dietary Guidelines for Children and Adolescents in Australia
57. McCarron DA. The dietary guideline for sodium: should we shake it up?Yes! Am J Clin Nutr 2000;71:1013–19.
58. Liu K, Cooper R, McKeever J, McKeever P, Byington R, Soltero I et al.Assessment of the association between habitual salt intake and high bloodpressure: methodological problems. Am J Epidemiol 1979;110:219–26.
59. Beard TC. Salt in medical practice. 2nd edn. Holland Park: QueenslandHypertension Association, 2000.
60. Beard TC, Woodward DR, Ball P, Hornsby H, von Witt RJ, Dwyer T. TheHobart salt study 1995: few meet national sodium intake target. Med J Aust1997;166:404–7.
61. Gunton JE, Hams G, Fiegert M, McElduff A. Iodine deficiency inambulatory participants at a Sydney teaching hospital: is Australia trulyreplete? Med J Aust 1999;171:467–70.
62. WHO Expert Committee. Hypertension control, WHO Technical ReportSeries no. 862. Geneva: World Health Organization, 1986.
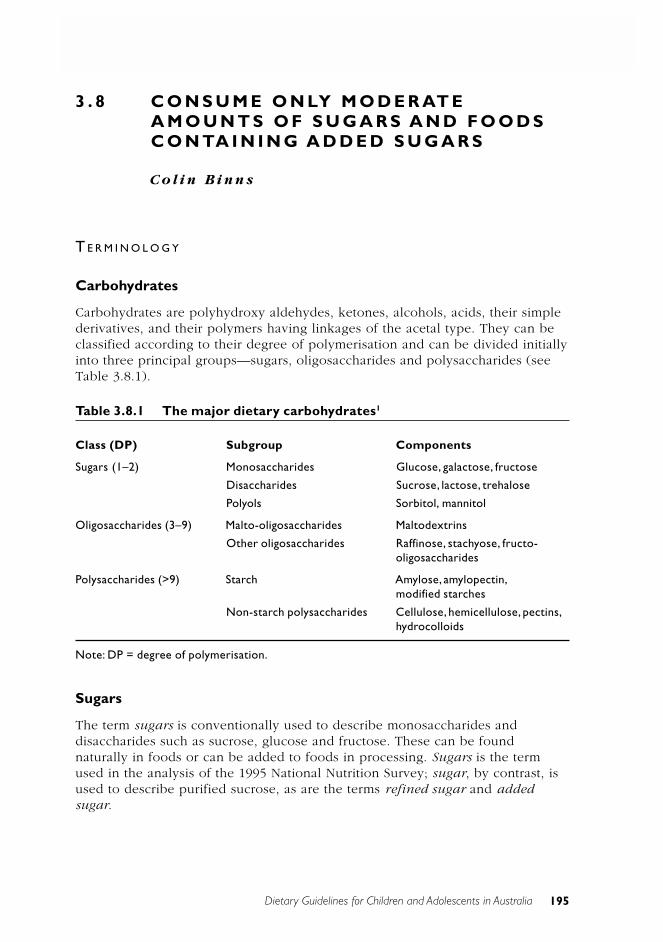
Dietary Guidelines for Children and Adolescents in Australia 195
3.8 CONSUME ONLY MODERATE AMOUNTS OF SUGARS AND FOODS CONTAINING ADDED SUGARS
3 . 8 C O N S U M E O N LY M O D E R AT EA M O U N T S O F S U G A R S A N D F O O D SC O N TA I N I N G A D D E D S U G A R S
C o l i n B i n n s
T E R M I N O L O G Y
Carbohydrates
Carbohydrates are polyhydroxy aldehydes, ketones, alcohols, acids, their simplederivatives, and their polymers having linkages of the acetal type. They can beclassified according to their degree of polymerisation and can be divided initiallyinto three principal groups—sugars, oligosaccharides and polysaccharides (seeTable 3.8.1).
Table 3.8.1 The major dietary carbohydrates1
Class (DP) Subgroup Components
Sugars (1–2) Monosaccharides Glucose, galactose, fructose
Disaccharides Sucrose, lactose, trehalose
Polyols Sorbitol, mannitol
Oligosaccharides (3–9) Malto-oligosaccharides Maltodextrins
Other oligosaccharides Raffinose, stachyose, fructo-oligosaccharides
Polysaccharides (>9) Starch Amylose, amylopectin,modified starches
Non-starch polysaccharides Cellulose, hemicellulose, pectins,hydrocolloids
Note: DP = degree of polymerisation.
Sugars
The term sugars is conventionally used to describe monosaccharides anddisaccharides such as sucrose, glucose and fructose. These can be foundnaturally in foods or can be added to foods in processing. Sugars is the termused in the analysis of the 1995 National Nutrition Survey; sugar, by contrast, isused to describe purified sucrose, as are the terms refined sugar and addedsugar.
196 Dietary Guidelines for Children and Adolescents in Australia
3.8 CONSUME ONLY MODERATE AMOUNTS OF SUGARS AND FOODS CONTAINING ADDED SUGARS
Intrinsic and extrinsic sugars
Intrinsic sugars describes sugars occurring within the cell walls of plants—thatis, naturally occurring sugars—while extrinsic sugars is used to describe sugarsthat are usually added to foods. However, the naturally occurring sugar in milk,lactose, is also an extrinsic sugar, so an additional phrase, non-milk extrinsicsugars is used in the literature. These terms have not gained wide acceptance,and there are no current plans to measure these sugars separately in the diet orto incorporate such data in food tables.1 The terms refined, added and extrinsicsugars are sometimes used to denote sucrose and glucose used in the foodindustry and in the home.
Physiologically, there is no difference between the sugars that occur naturally infood and the refined sugars that are added to the diet. Among foods rich inadded sugars are confectionery, cakes, pastries, biscuits, fruit drinks, cordials andcarbonated soft drinks. Foods with high added-sugar content often have a lowernutrient content but are energy dense. The term no added sugar means nosugars have been added during the manufacturing process; it does not mean thatno sugar is present, since most foods contain sugars in some form.
B A C K G R O U N D
Many of the foods found in the Australian diet contain naturally occurring sugars.In other foods, sugars (particularly sucrose) may be added during processing, toincrease the food’s palatability and acceptability and sometimes to add bulk.Sugars provide a readily absorbed source of energy and have an important roleas sweeteners and flavour enhancers. The presence of high amounts of sugarcan, however, dilute the nutrient density of the diet, and diets high in addedsugar have been associated with development of obesity and dental caries.
Because sugars are a significant source of energy in the Australian diet, allprevious sets of dietary guidelines—for adults, children and adolescents, andolder Australians—have included a guideline on sugar or sugars. Over the yearsthe emphasis has changed, from a guideline aimed at reducing the amount eatento one that emphasises care and moderation in the amount consumed. Thisreflects changing scientific knowledge and the relative stability of sugarconsumption in Australia. The US year 2000 dietary guidelines include in thesection on eating sensibly the guideline ‘Choose beverages and foods that limityour intake of sugars’.2 A review by Sheiham lists 23 countries that currentlymake dietary recommendations on sugars.3 The pros and cons of retaining anAustralian dietary guideline on sugar have recently been debated in the literatureby Stanton4, O’Dea and Mann5, and Williams.6
Sugars in the Australian diet
Australian adults derive about 45 per cent of their energy from carbohydratesand about half of this comes from sugars. The results of the 1995 NationalNutrition Survey show that the percentage of energy from total sugars intake
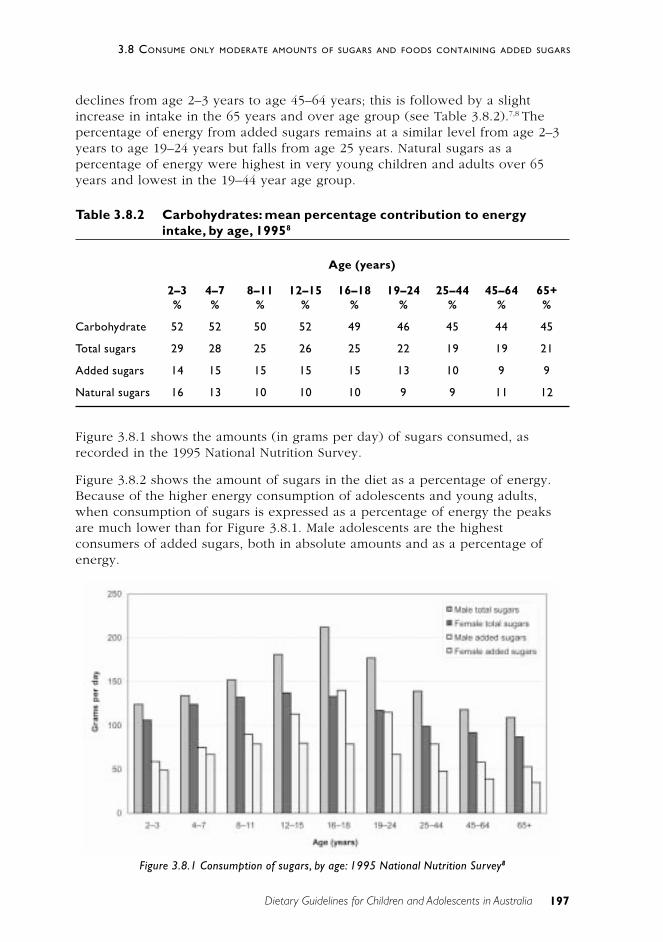
197
3.8 CONSUME ONLY MODERATE AMOUNTS OF SUGARS AND FOODS CONTAINING ADDED SUGARS
Dietary Guidelines for Children and Adolescents in Australia
declines from age 2–3 years to age 45–64 years; this is followed by a slightincrease in intake in the 65 years and over age group (see Table 3.8.2).7,8 Thepercentage of energy from added sugars remains at a similar level from age 2–3years to age 19–24 years but falls from age 25 years. Natural sugars as apercentage of energy were highest in very young children and adults over 65years and lowest in the 19–44 year age group.
Table 3.8.2 Carbohydrates: mean percentage contribution to energyintake, by age, 19958
Age (years)
2–3 4–7 8–11 12–15 16–18 19–24 25–44 45–64 65+% % % % % % % % %
Carbohydrate 52 52 50 52 49 46 45 44 45
Total sugars 29 28 25 26 25 22 19 19 21
Added sugars 14 15 15 15 15 13 10 9 9
Natural sugars 16 13 10 10 10 9 9 11 12
Figure 3.8.1 shows the amounts (in grams per day) of sugars consumed, asrecorded in the 1995 National Nutrition Survey.
Figure 3.8.2 shows the amount of sugars in the diet as a percentage of energy.Because of the higher energy consumption of adolescents and young adults,when consumption of sugars is expressed as a percentage of energy the peaksare much lower than for Figure 3.8.1. Male adolescents are the highestconsumers of added sugars, both in absolute amounts and as a percentage ofenergy.
Figure 3.8.1 Consumption of sugars, by age: 1995 National Nutrition Survey8
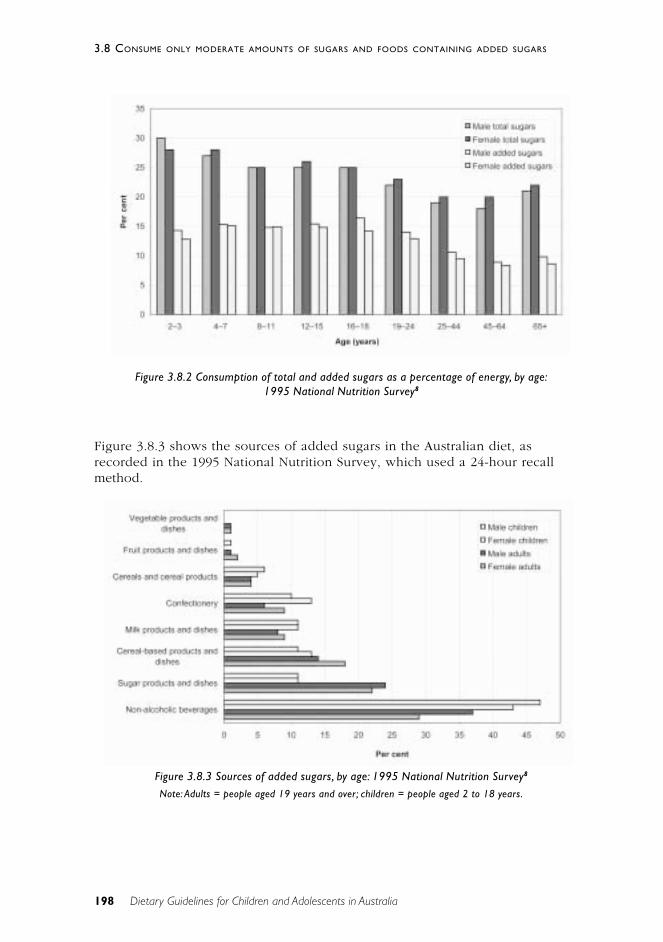
198 Dietary Guidelines for Children and Adolescents in Australia
3.8 CONSUME ONLY MODERATE AMOUNTS OF SUGARS AND FOODS CONTAINING ADDED SUGARS
Figure 3.8.3 shows the sources of added sugars in the Australian diet, asrecorded in the 1995 National Nutrition Survey, which used a 24-hour recallmethod.
Figure 3.8.2 Consumption of total and added sugars as a percentage of energy, by age:1995 National Nutrition Survey8
Figure 3.8.3 Sources of added sugars, by age: 1995 National Nutrition Survey8
Note: Adults = people aged 19 years and over; children = people aged 2 to 18 years.
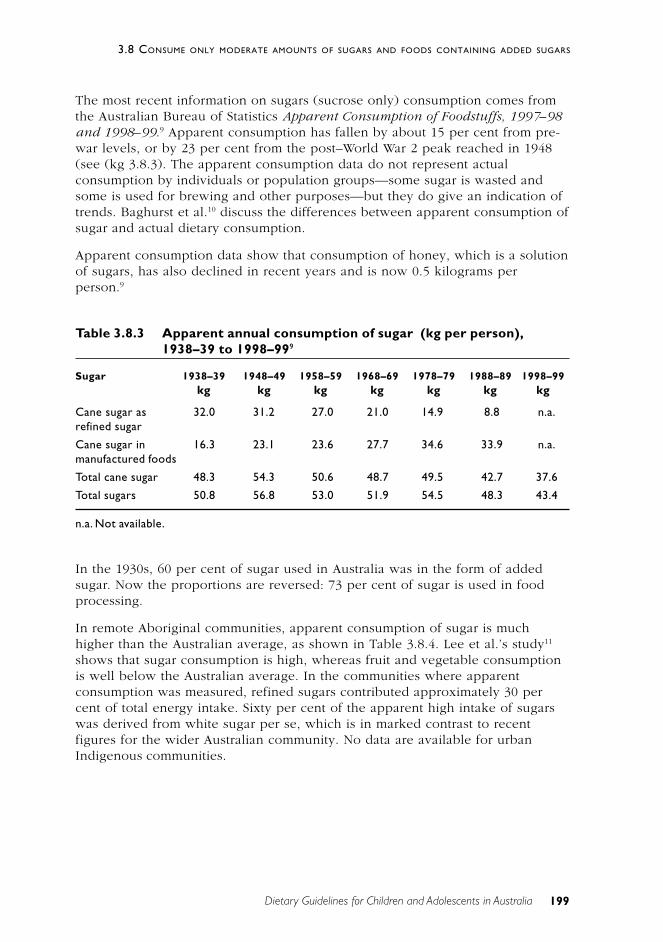
199
3.8 CONSUME ONLY MODERATE AMOUNTS OF SUGARS AND FOODS CONTAINING ADDED SUGARS
Dietary Guidelines for Children and Adolescents in Australia
The most recent information on sugars (sucrose only) consumption comes fromthe Australian Bureau of Statistics Apparent Consumption of Foodstuffs, 1997–98and 1998–99.9 Apparent consumption has fallen by about 15 per cent from pre-war levels, or by 23 per cent from the post–World War 2 peak reached in 1948(see (kg 3.8.3). The apparent consumption data do not represent actualconsumption by individuals or population groups—some sugar is wasted andsome is used for brewing and other purposes—but they do give an indication oftrends. Baghurst et al.10 discuss the differences between apparent consumption ofsugar and actual dietary consumption.
Apparent consumption data show that consumption of honey, which is a solutionof sugars, has also declined in recent years and is now 0.5 kilograms perperson.9
Table 3.8.3 Apparent annual consumption of sugar (kg per person),1938–39 to 1998–999
Sugar 1938–39 1948–49 1958–59 1968–69 1978–79 1988–89 1998–99kg kg kg kg kg kg kg
Cane sugar as 32.0 31.2 27.0 21.0 14.9 8.8 n.a.refined sugar
Cane sugar in 16.3 23.1 23.6 27.7 34.6 33.9 n.a.manufactured foods
Total cane sugar 48.3 54.3 50.6 48.7 49.5 42.7 37.6
Total sugars 50.8 56.8 53.0 51.9 54.5 48.3 43.4
n.a. Not available.
In the 1930s, 60 per cent of sugar used in Australia was in the form of addedsugar. Now the proportions are reversed: 73 per cent of sugar is used in foodprocessing.
In remote Aboriginal communities, apparent consumption of sugar is muchhigher than the Australian average, as shown in Table 3.8.4. Lee et al.’s study11
shows that sugar consumption is high, whereas fruit and vegetable consumptionis well below the Australian average. In the communities where apparentconsumption was measured, refined sugars contributed approximately 30 percent of total energy intake. Sixty per cent of the apparent high intake of sugarswas derived from white sugar per se, which is in marked contrast to recentfigures for the wider Australian community. No data are available for urbanIndigenous communities.
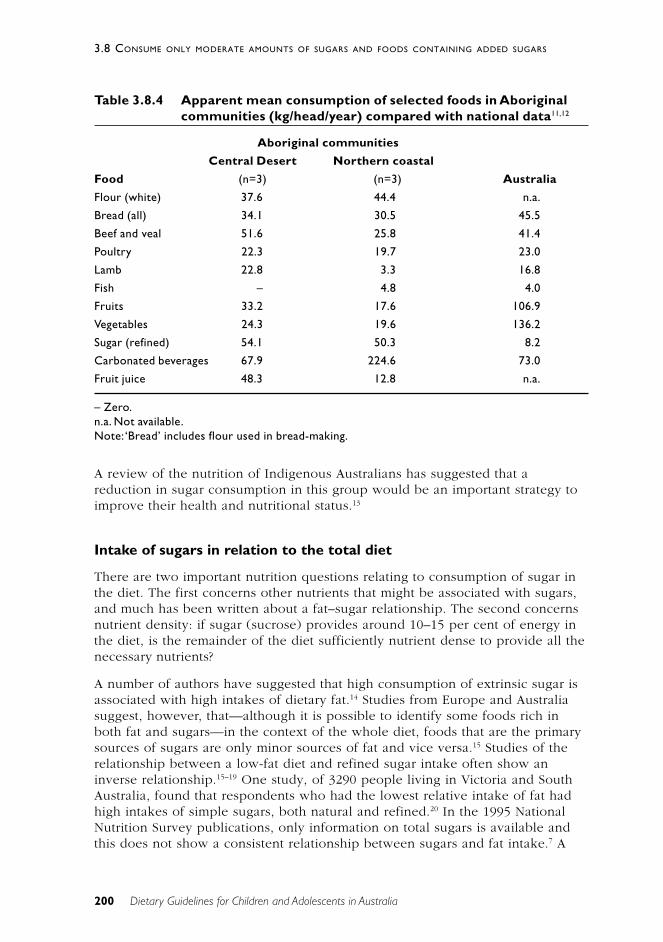
200 Dietary Guidelines for Children and Adolescents in Australia
3.8 CONSUME ONLY MODERATE AMOUNTS OF SUGARS AND FOODS CONTAINING ADDED SUGARS
Table 3.8.4 Apparent mean consumption of selected foods in Aboriginalcommunities (kg/head/year) compared with national data11,12
Aboriginal communities
Central Desert Northern coastal
Food (n=3) (n=3) Australia
Flour (white) 37.6 44.4 n.a.
Bread (all) 34.1 30.5 45.5
Beef and veal 51.6 25.8 41.4
Poultry 22.3 19.7 23.0
Lamb 22.8 3.3 16.8
Fish – 4.8 4.0
Fruits 33.2 17.6 106.9
Vegetables 24.3 19.6 136.2
Sugar (refined) 54.1 50.3 8.2
Carbonated beverages 67.9 224.6 73.0
Fruit juice 48.3 12.8 n.a.
– Zero.n.a. Not available.Note: ‘Bread’ includes flour used in bread-making.
A review of the nutrition of Indigenous Australians has suggested that areduction in sugar consumption in this group would be an important strategy toimprove their health and nutritional status.13
Intake of sugars in relation to the total diet
There are two important nutrition questions relating to consumption of sugar inthe diet. The first concerns other nutrients that might be associated with sugars,and much has been written about a fat–sugar relationship. The second concernsnutrient density: if sugar (sucrose) provides around 10–15 per cent of energy inthe diet, is the remainder of the diet sufficiently nutrient dense to provide all thenecessary nutrients?
A number of authors have suggested that high consumption of extrinsic sugar isassociated with high intakes of dietary fat.14 Studies from Europe and Australiasuggest, however, that—although it is possible to identify some foods rich inboth fat and sugars—in the context of the whole diet, foods that are the primarysources of sugars are only minor sources of fat and vice versa.15 Studies of therelationship between a low-fat diet and refined sugar intake often show aninverse relationship.15–19 One study, of 3290 people living in Victoria and SouthAustralia, found that respondents who had the lowest relative intake of fat hadhigh intakes of simple sugars, both natural and refined.20 In the 1995 NationalNutrition Survey publications, only information on total sugars is available andthis does not show a consistent relationship between sugars and fat intake.7 A
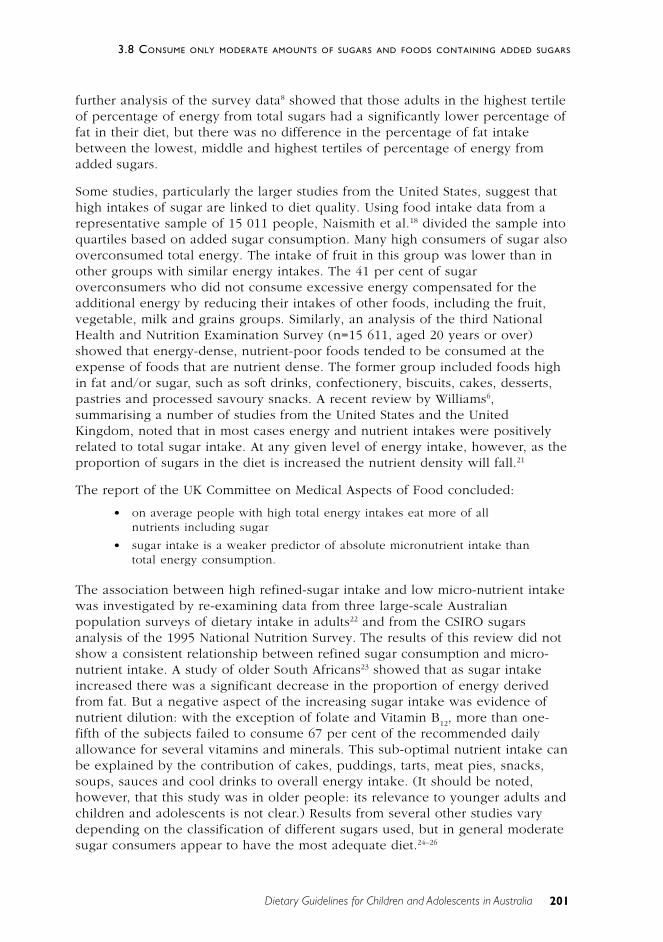
201
3.8 CONSUME ONLY MODERATE AMOUNTS OF SUGARS AND FOODS CONTAINING ADDED SUGARS
Dietary Guidelines for Children and Adolescents in Australia
further analysis of the survey data8 showed that those adults in the highest tertileof percentage of energy from total sugars had a significantly lower percentage offat in their diet, but there was no difference in the percentage of fat intakebetween the lowest, middle and highest tertiles of percentage of energy fromadded sugars.
Some studies, particularly the larger studies from the United States, suggest thathigh intakes of sugar are linked to diet quality. Using food intake data from arepresentative sample of 15 011 people, Naismith et al.18 divided the sample intoquartiles based on added sugar consumption. Many high consumers of sugar alsooverconsumed total energy. The intake of fruit in this group was lower than inother groups with similar energy intakes. The 41 per cent of sugaroverconsumers who did not consume excessive energy compensated for theadditional energy by reducing their intakes of other foods, including the fruit,vegetable, milk and grains groups. Similarly, an analysis of the third NationalHealth and Nutrition Examination Survey (n=15 611, aged 20 years or over)showed that energy-dense, nutrient-poor foods tended to be consumed at theexpense of foods that are nutrient dense. The former group included foods highin fat and/or sugar, such as soft drinks, confectionery, biscuits, cakes, desserts,pastries and processed savoury snacks. A recent review by Williams6,summarising a number of studies from the United States and the UnitedKingdom, noted that in most cases energy and nutrient intakes were positivelyrelated to total sugar intake. At any given level of energy intake, however, as theproportion of sugars in the diet is increased the nutrient density will fall.21
The report of the UK Committee on Medical Aspects of Food concluded:
• on average people with high total energy intakes eat more of allnutrients including sugar
• sugar intake is a weaker predictor of absolute micronutrient intake thantotal energy consumption.
The association between high refined-sugar intake and low micro-nutrient intakewas investigated by re-examining data from three large-scale Australianpopulation surveys of dietary intake in adults22 and from the CSIRO sugarsanalysis of the 1995 National Nutrition Survey. The results of this review did notshow a consistent relationship between refined sugar consumption and micro-nutrient intake. A study of older South Africans23 showed that as sugar intakeincreased there was a significant decrease in the proportion of energy derivedfrom fat. But a negative aspect of the increasing sugar intake was evidence ofnutrient dilution: with the exception of folate and Vitamin B
12, more than one-
fifth of the subjects failed to consume 67 per cent of the recommended dailyallowance for several vitamins and minerals. This sub-optimal nutrient intake canbe explained by the contribution of cakes, puddings, tarts, meat pies, snacks,soups, sauces and cool drinks to overall energy intake. (It should be noted,however, that this study was in older people: its relevance to younger adults andchildren and adolescents is not clear.) Results from several other studies varydepending on the classification of different sugars used, but in general moderatesugar consumers appear to have the most adequate diet.24–26
202 Dietary Guidelines for Children and Adolescents in Australia
3.8 CONSUME ONLY MODERATE AMOUNTS OF SUGARS AND FOODS CONTAINING ADDED SUGARS
The 1995 National Nutrition Survey shows that an increasing proportion ofenergy is obtained from meals and snacks eaten outside the home7, and it islikely that these have a higher sugar and fat content than the rest of the diet.Summerbell et al.27 found that 25 per cent of adolescents’ and 20 per cent ofadults’ daily energy intake was in the form of snacks and that the proportion ofenergy derived from total sugars in snacks was greater than that in meals. Mostoften this sugar was provided by plain biscuits and milk and sugar added to cupsof tea and coffee.
If energy balance is to be maintained—or approximately maintained—foods ofhigh energy content and lower nutrient density must be replacing other foodgroups. When more foods of low nutritional value (lower nutrient density) areconsumed, either less of the foods that supply essential nutrients will beconsumed or the total kilojoule intake will rise.
Foods prepared for infants should contain relatively low levels of sugar. TheAustralian Food Standards Code stipulates that if foods prepared for infantscontain more than 4 grams per 100 grams of added sugar they must be labelledas ‘sweetened’.
In summary, then, it is likely that the results of surveys reported as averages ofgroup consumption obscure the effects of consumers who are in the upperpercentiles of sugar intake. It is important that care is taken with snack foodsthat are high in added sugars, since foods that are high in refined sugars (forexample, soft drinks and confectionery) are energy dense but do not providevital nutrients. Foods such as cakes, biscuits and confectionery are high in bothsugar and fat and also energy dense; they provide few nutrients and are ofteneaten instead of more nutritious, necessary foods by both children and adults.
S C I E N T I F I C B A S I S
Carbohydrates constitute the largest source of energy in the diets of mostpeople—on average around 45 per cent of the energy in the Australian diet.Dietary carbohydrates are usually associated in foods with importantmicronutrients and phytochemicals. Diets high in carbohydrate are not associatedwith the development of obesity independently of energy intake.28 People whosediets are high in carbohydrates usually have a lower prevalence of obesity, heartdisease, type 2 diabetes, and some forms of cancer.29
Among carbohydrates’ physiological functions are the following:
• provision of energy
• effects on satiety and gastric emptying
• effects on blood glucose and insulin metabolism
• protein glycosylation
• bile acid dehydroxylation
• fermentation—production of hydrogen and methane
203
3.8 CONSUME ONLY MODERATE AMOUNTS OF SUGARS AND FOODS CONTAINING ADDED SUGARS
Dietary Guidelines for Children and Adolescents in Australia
• production of short-chain fatty acids
• control of colonic epithelial cell function
• bowel habit, laxation and motor activity
• effects on large bowel microflora.28
Epidemiological and clinical studies help to give us an understanding of the roleof carbohydrates in the aetiology of disease. Few of these studies suggest adirect causal link between carbohydrate consumption and disease.
Obesity
The 1995 National Nutrition Survey results demonstrated that obesity is anincreasing problem for all age groups in Australia.7 The World HealthOrganization describes this epidemic as part of an ‘escalating epidemic ofoverweight and obesity that is affecting many countries in the world’ and notes,‘The principal causes of the accelerating obesity problem worldwide aresedentary lifestyles and high-fat, energy-dense diets’ <http://www.who.int/nut/obs.htm>.
The links between sugar intake and obesity are not clear: many studies show nolinks but others suggest there may be cause for concern. In Australia, obesity hasbeen increasing during the past two decades. Lowered physical activity may, ofcourse, be involved in the overall picture, but changes in diet may also beplaying a role (see Chapter 2). The national dietary surveys of 1983 to 1985 and1995 showed a small increase in energy intake in adults (3–4 per cent) and alarger increase in children aged 10–15 years (11–15 per cent). Carbohydrateswere the macronutrient whose consumption increased most over this period.
It has been suggested that excess consumption of sugar contributes to an energy-dense diet that may lead to energy imbalance and obesity. In the CARMENstudy30, a randomised controlled trial of diets and weight reduction, subjectswere randomly placed in groups with diets that included reduced fat and highsimple carbohydrate and reduced fat and high complex carbohydrate. The studyfound that a reduction in fat intake resulted in a modest, but significant, weightloss. Whether the carbohydrate was in simple or complex form made nodifference to weight outcomes or to the subjects’ lipid profiles. The lack of asignificant difference between complex and simple carbohydrates may, however,have been a consequence of insufficient sample size.4
It is nevertheless important to stress that excess energy in any form will promotethe accumulation of excess body fat and that high-carbohydrate diets should bepromoted only in accordance with an individual’s energy needs.28
In a two-year longitudinal study of 548 ethnically diverse school children in theUnited States (mean age 11.7 years), Ludwig et al.31 found that an increase inconsumption of sweetened soft drink was linked to increasing body mass indexand risk of obesity. On the other hand, a number of studies have concluded thatintake of carbohydrate or even sucrose has no association with obesity or thatthe association may even be negative.32 The Ludwig study used a standardised
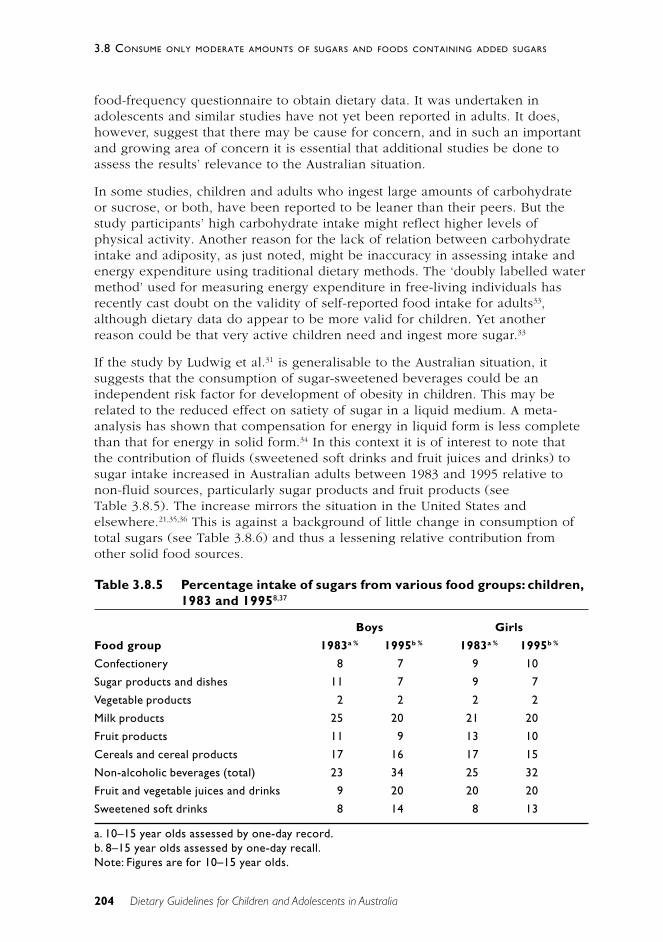
204 Dietary Guidelines for Children and Adolescents in Australia
3.8 CONSUME ONLY MODERATE AMOUNTS OF SUGARS AND FOODS CONTAINING ADDED SUGARS
food-frequency questionnaire to obtain dietary data. It was undertaken inadolescents and similar studies have not yet been reported in adults. It does,however, suggest that there may be cause for concern, and in such an importantand growing area of concern it is essential that additional studies be done toassess the results’ relevance to the Australian situation.
In some studies, children and adults who ingest large amounts of carbohydrateor sucrose, or both, have been reported to be leaner than their peers. But thestudy participants’ high carbohydrate intake might reflect higher levels ofphysical activity. Another reason for the lack of relation between carbohydrateintake and adiposity, as just noted, might be inaccuracy in assessing intake andenergy expenditure using traditional dietary methods. The ‘doubly labelled watermethod’ used for measuring energy expenditure in free-living individuals hasrecently cast doubt on the validity of self-reported food intake for adults33,although dietary data do appear to be more valid for children. Yet anotherreason could be that very active children need and ingest more sugar.33
If the study by Ludwig et al.31 is generalisable to the Australian situation, itsuggests that the consumption of sugar-sweetened beverages could be anindependent risk factor for development of obesity in children. This may berelated to the reduced effect on satiety of sugar in a liquid medium. A meta-analysis has shown that compensation for energy in liquid form is less completethan that for energy in solid form.34 In this context it is of interest to note thatthe contribution of fluids (sweetened soft drinks and fruit juices and drinks) tosugar intake increased in Australian adults between 1983 and 1995 relative tonon-fluid sources, particularly sugar products and fruit products (seeTable 3.8.5). The increase mirrors the situation in the United States andelsewhere.21,35,36 This is against a background of little change in consumption oftotal sugars (see Table 3.8.6) and thus a lessening relative contribution fromother solid food sources.
Table 3.8.5 Percentage intake of sugars from various food groups: children,1983 and 19958,37
Boys Girls
Food group 1983a % 1995b % 1983a % 1995b %
Confectionery 8 7 9 10
Sugar products and dishes 11 7 9 7
Vegetable products 2 2 2 2
Milk products 25 20 21 20
Fruit products 11 9 13 10
Cereals and cereal products 17 16 17 15
Non-alcoholic beverages (total) 23 34 25 32
Fruit and vegetable juices and drinks 9 20 20 20
Sweetened soft drinks 8 14 8 13
a. 10–15 year olds assessed by one-day record.b. 8–15 year olds assessed by one-day recall.Note: Figures are for 10–15 year olds.
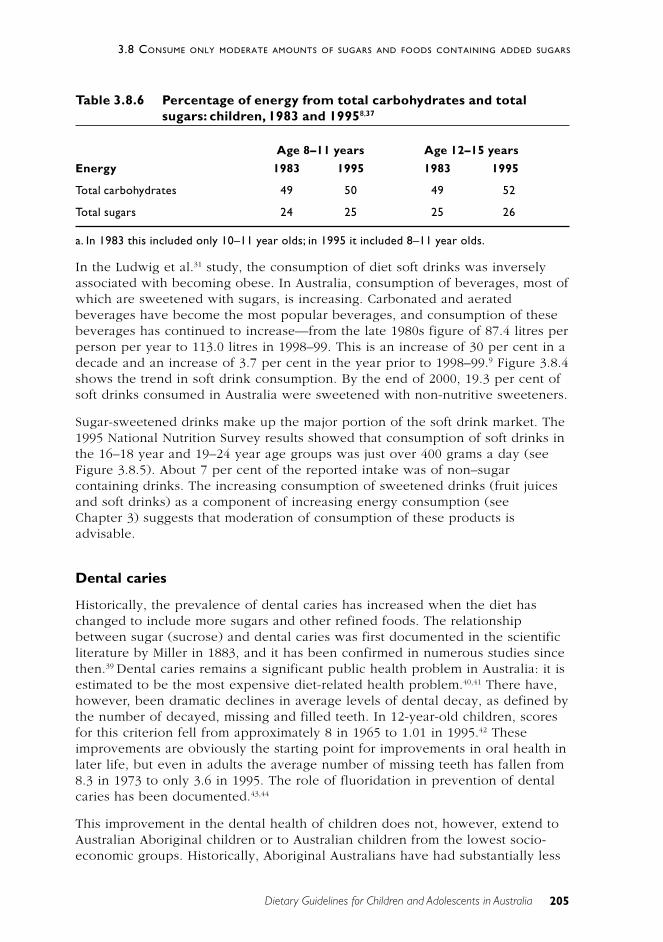
205
3.8 CONSUME ONLY MODERATE AMOUNTS OF SUGARS AND FOODS CONTAINING ADDED SUGARS
Dietary Guidelines for Children and Adolescents in Australia
Table 3.8.6 Percentage of energy from total carbohydrates and totalsugars: children, 1983 and 19958,37
Age 8–11 years Age 12–15 years
Energy 1983 1995 1983 1995
Total carbohydrates 49 50 49 52
Total sugars 24 25 25 26
a. In 1983 this included only 10–11 year olds; in 1995 it included 8–11 year olds.
In the Ludwig et al.31 study, the consumption of diet soft drinks was inverselyassociated with becoming obese. In Australia, consumption of beverages, most ofwhich are sweetened with sugars, is increasing. Carbonated and aeratedbeverages have become the most popular beverages, and consumption of thesebeverages has continued to increase—from the late 1980s figure of 87.4 litres perperson per year to 113.0 litres in 1998–99. This is an increase of 30 per cent in adecade and an increase of 3.7 per cent in the year prior to 1998–99.9 Figure 3.8.4shows the trend in soft drink consumption. By the end of 2000, 19.3 per cent ofsoft drinks consumed in Australia were sweetened with non-nutritive sweeteners.
Sugar-sweetened drinks make up the major portion of the soft drink market. The1995 National Nutrition Survey results showed that consumption of soft drinks inthe 16–18 year and 19–24 year age groups was just over 400 grams a day (seeFigure 3.8.5). About 7 per cent of the reported intake was of non–sugarcontaining drinks. The increasing consumption of sweetened drinks (fruit juicesand soft drinks) as a component of increasing energy consumption (seeChapter 3) suggests that moderation of consumption of these products isadvisable.
Dental caries
Historically, the prevalence of dental caries has increased when the diet haschanged to include more sugars and other refined foods. The relationshipbetween sugar (sucrose) and dental caries was first documented in the scientificliterature by Miller in 1883, and it has been confirmed in numerous studies sincethen.39 Dental caries remains a significant public health problem in Australia: it isestimated to be the most expensive diet-related health problem.40,41 There have,however, been dramatic declines in average levels of dental decay, as defined bythe number of decayed, missing and filled teeth. In 12-year-old children, scoresfor this criterion fell from approximately 8 in 1965 to 1.01 in 1995.42 Theseimprovements are obviously the starting point for improvements in oral health inlater life, but even in adults the average number of missing teeth has fallen from8.3 in 1973 to only 3.6 in 1995. The role of fluoridation in prevention of dentalcaries has been documented.43,44
This improvement in the dental health of children does not, however, extend toAustralian Aboriginal children or to Australian children from the lowest socio-economic groups. Historically, Aboriginal Australians have had substantially less
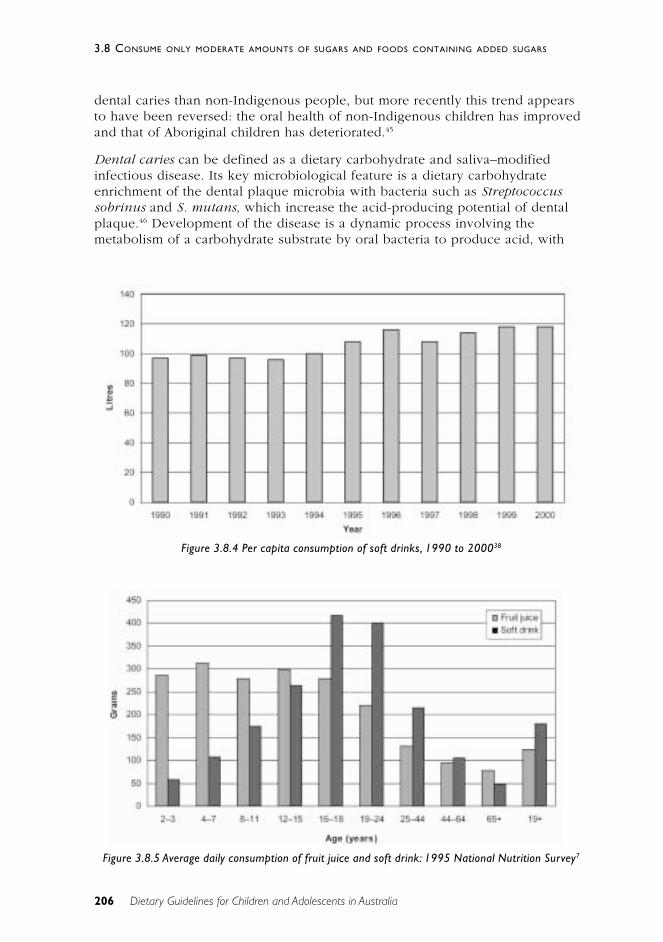
206 Dietary Guidelines for Children and Adolescents in Australia
3.8 CONSUME ONLY MODERATE AMOUNTS OF SUGARS AND FOODS CONTAINING ADDED SUGARS
dental caries than non-Indigenous people, but more recently this trend appearsto have been reversed: the oral health of non-Indigenous children has improvedand that of Aboriginal children has deteriorated.45
Dental caries can be defined as a dietary carbohydrate and saliva–modifiedinfectious disease. Its key microbiological feature is a dietary carbohydrateenrichment of the dental plaque microbia with bacteria such as Streptococcussobrinus and S. mutans, which increase the acid-producing potential of dentalplaque.46 Development of the disease is a dynamic process involving themetabolism of a carbohydrate substrate by oral bacteria to produce acid, with
Figure 3.8.4 Per capita consumption of soft drinks, 1990 to 200038
Figure 3.8.5 Average daily consumption of fruit juice and soft drink: 1995 National Nutrition Survey7
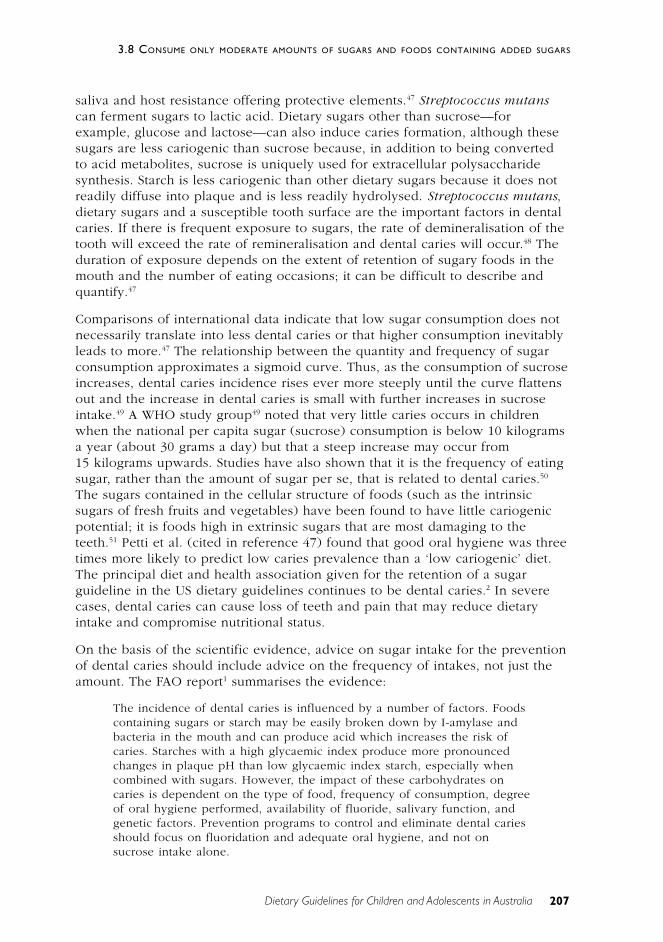
207
3.8 CONSUME ONLY MODERATE AMOUNTS OF SUGARS AND FOODS CONTAINING ADDED SUGARS
Dietary Guidelines for Children and Adolescents in Australia
saliva and host resistance offering protective elements.47 Streptococcus mutanscan ferment sugars to lactic acid. Dietary sugars other than sucrose—forexample, glucose and lactose—can also induce caries formation, although thesesugars are less cariogenic than sucrose because, in addition to being convertedto acid metabolites, sucrose is uniquely used for extracellular polysaccharidesynthesis. Starch is less cariogenic than other dietary sugars because it does notreadily diffuse into plaque and is less readily hydrolysed. Streptococcus mutans,dietary sugars and a susceptible tooth surface are the important factors in dentalcaries. If there is frequent exposure to sugars, the rate of demineralisation of thetooth will exceed the rate of remineralisation and dental caries will occur.48 Theduration of exposure depends on the extent of retention of sugary foods in themouth and the number of eating occasions; it can be difficult to describe andquantify.47
Comparisons of international data indicate that low sugar consumption does notnecessarily translate into less dental caries or that higher consumption inevitablyleads to more.47 The relationship between the quantity and frequency of sugarconsumption approximates a sigmoid curve. Thus, as the consumption of sucroseincreases, dental caries incidence rises ever more steeply until the curve flattensout and the increase in dental caries is small with further increases in sucroseintake.49 A WHO study group49 noted that very little caries occurs in childrenwhen the national per capita sugar (sucrose) consumption is below 10 kilogramsa year (about 30 grams a day) but that a steep increase may occur from15 kilograms upwards. Studies have also shown that it is the frequency of eatingsugar, rather than the amount of sugar per se, that is related to dental caries.50
The sugars contained in the cellular structure of foods (such as the intrinsicsugars of fresh fruits and vegetables) have been found to have little cariogenicpotential; it is foods high in extrinsic sugars that are most damaging to theteeth.51 Petti et al. (cited in reference 47) found that good oral hygiene was threetimes more likely to predict low caries prevalence than a ‘low cariogenic’ diet.The principal diet and health association given for the retention of a sugarguideline in the US dietary guidelines continues to be dental caries.2 In severecases, dental caries can cause loss of teeth and pain that may reduce dietaryintake and compromise nutritional status.
On the basis of the scientific evidence, advice on sugar intake for the preventionof dental caries should include advice on the frequency of intakes, not just theamount. The FAO report1 summarises the evidence:
The incidence of dental caries is influenced by a number of factors. Foodscontaining sugars or starch may be easily broken down by I-amylase andbacteria in the mouth and can produce acid which increases the risk ofcaries. Starches with a high glycaemic index produce more pronouncedchanges in plaque pH than low glycaemic index starch, especially whencombined with sugars. However, the impact of these carbohydrates oncaries is dependent on the type of food, frequency of consumption, degreeof oral hygiene performed, availability of fluoride, salivary function, andgenetic factors. Prevention programs to control and eliminate dental cariesshould focus on fluoridation and adequate oral hygiene, and not onsucrose intake alone.
208 Dietary Guidelines for Children and Adolescents in Australia
3.8 CONSUME ONLY MODERATE AMOUNTS OF SUGARS AND FOODS CONTAINING ADDED SUGARS
The British Nutrition Foundation’s report concludes, ‘The evidence establishingsugars as an aetiological factor in dental caries is overwhelming. The foundationof this lies in the multiplicity of studies rather than the power of any one’.51
While infants and young children are at risk of dental caries, as people age therisk increases again.2
Dental caries and infants
Baby-bottle tooth decay, or nursing-bottle caries, is a recognised problem ininfants who are pacified by giving them a bottle to suck on for long periods.Babies who are allowed to fall asleep while continuing to feed from their bottlecan end up with a severe form of tooth decay. Whether the bottle contains infantformula, fruit juice or some other carbohydrate-containing food does not seem tomatter.52 (See Chapter 3 for further discussion of fruit juices.)
Carbohydrates and the prevention of dental caries
Both xylitol and sorbitol have been shown to have a preventive effect on dentalcaries. Daily consumption of xylitol (5–10 grams a day) added to chewing gumand confectionery foods has been shown to prevent dental caries in children.53
Highly acidogenic snack foods should be consumed only at meal times to reducethe risk, and between-meal snacks should be either non-acidogenic (such asxylitol products) or hypo-acidogenic (such as sorbitol and HSH products).Cheeses are a natural product that may provide anti-cariogenic effects.24 Asystematic review of published double-blind comparative trials showed thatxylitol-containing chewing gums may provide superior efficacy in reducing cariesrates in high-risk populations.54 One mechanism of the action of xylitol-containing gums is the stimulation of salivary flow.48
Type 2 diabetes
The rapid cultural change experienced by many populations that previouslyconsumed a traditional diet and the high incidence of centrally distributedabdominal obesity in these populations have coincided with high rates of type 2diabetes. Some populations appear to have a stronger predisposition to thedevelopment of type 2 diabetes than others, suggesting the involvement ofgenetic factors. Family history, diet, and lifestyle conditions that are conducive toobesity will influence the risk of developing diabetes. Development of type 2diabetes does not appear to be related to ingestion of sugar or othercarbohydrates: it is predominantly influenced by genetics, body weight andlifestyle factors. Avoiding obesity and increasing intakes of a wide range of foodsthat are rich in non-starch polysaccharides and carbohydrates with a lowglycaemic index offer the best means of reducing the rapidly increasing rates oftype 2 diabetes in many countries.28 Dietary fibre may also have a beneficialeffect on insulin metabolism.55
209
3.8 CONSUME ONLY MODERATE AMOUNTS OF SUGARS AND FOODS CONTAINING ADDED SUGARS
Dietary Guidelines for Children and Adolescents in Australia
Cardiovascular disease
Body mass index, abdominal obesity, hyperlipidaemia, homocysteineaemia, andgenetic and lifestyle factors are all important in the aetiology of coronary heartdisease. Early studies suggested that a reduction in dietary sucrose could lowerelevated triglyceride levels, but it is likely that the effects seen were the result ofa reduction in energy intake and body weight.25,26 Metabolic studies of lean andobese volunteers have shown that solid-food diets that are very low in fat andhigh in simple sugars markedly stimulate fatty acid synthesis from carbohydrateand that plasma triglycerides increase in proportion to the amount of fatty acidsynthesis.26
There is some evidence that antioxidants confer protection against thedevelopment of cardiovascular disease. Fruits and vegetables, which are sourcesof sugars and carbohydrates, are rich in antioxidants, and increasing the amountof these foods in the diet can assist in the reduction of saturated fat, which willprovide further protection against cardiovascular disease. There is no evidence ofa causal role for sugar in the development of cardiovascular disease. Ensuringthat the diet contains adequate amounts of fruit, vegetables and carbohydrate-rich foods—at the expense of fat—and maintaining a healthy body weight arethe basis of dietary advice aimed at reducing the risk of cardiovascular disease.28
When the content of dietary carbohydrate is elevated above the usual level inour diets (more than 55 per cent of energy), blood concentrations of triglyceridesrise.57 There is, however, a concurrent reduction in LDL cholesterol concentration,which makes it difficult to predict whether negative health consequences willresult.57
Cancer
In a case-control study of gastric cancer (382 cases and 561 controls), higherintakes of sugar were found to decrease the likelihood of developing thiscancer.58 Other studies have suggested a link between sugar consumption andcolorectal cancer.59–61 The World Cancer Research Fund reviewed the eight case-control studies available to it and concluded that there was a correlationbetween sugar intake and colorectal cancer.62 In contrast, when the NationalHealth and Medical Research Council reviewed the risk factors for colorectalcancer, sugar was not included as a significant factor.63 The FAO–WHO ExpertConsultation concluded, ‘There is little evidence of any significant correlationbetween intake of mono-, di- and oligosaccharides and cancer at any site thatcould not be explained by total energy intake’.1 Although it is widely recognisedthat diet influences the development of cancer, a consistent role for sugar hasnot been identified. Fruit, vegetables and cereal foods are considered to beprotective against some forms of cancer, including colorectal cancer.63
210 Dietary Guidelines for Children and Adolescents in Australia
3.8 CONSUME ONLY MODERATE AMOUNTS OF SUGARS AND FOODS CONTAINING ADDED SUGARS
Gastrointestinal diseases other than cancer
Consumption of non-starch polysaccharides and resistant starch contributes tostool weight: increasing the intake of these foods can effectively preventconstipation, colon polyps, haemorrhoids and anal fissures.63,64
Attention deficit/hyperactivity disorder
Attention deficit/hyperactivity disorder is the most common neuro-behaviouraldisorder in children and among the most prevalent chronic conditions in school-aged children. There is no evidence that sugars or sugar-containing foods areinvolved in the aetiology of attention deficit/hyperactivity disorder.65
Summary
The evidence for sugar’s role in the aetiology of dental caries is strong. Whenenergy intake exceeds energy expenditure over a sustained period, overweightor obesity will result. Excess dietary energy intake—from whatever source,including sugars—can thus contribute to weight gain, overweight and obesity.Inappropriately high levels of intake of sugars may also displace other nutrientsfrom the diet. No other links to the causation of specific disease have beenidentified.
On the other hand, moderate use of sugars as sweeteners or to add flavour mayactually improve the palatability of food and increase overall nutrientconsumption. There is no evidence that, for most Australians, consumption of upto 15–20 per cent of energy as sugars is incompatible with a healthy diet.Consumption of greater amounts than this could lead to a decrease in nutrientdensity. A diet without any sugar would be impractical, hence this guideline:‘Consume only moderate amounts of sugars and foods containing added sugars’.
P R A C T I C A L A S P E C T S O F T H I S G U I D E L I N E
Adding a small amount of refined sugar can increase the palatability of somehighly nutritious foods and increase the overall nutrient intake. For example,adding a small amount of sugar or honey to porridge and spreading jam onbread or toast can greatly improve the taste and acceptability of these high-carbohydrate, nutrient-dense foods. But adding stewed fruit to porridge wouldoffer equal palatability, with less sugar. A growing number of non-nutritivesweeteners are available and promoted as substitutes for sugars. Although thereare still problems with heat stability, use of non-nutritive sweeteners incarbonated beverages could reduce the energy load in the highest-consumingage groups. Some studies on obesity control have shown mixed results, but atleast one study of the use of an artificial sweetener has shown a long-termbenefit for weight control.66
211
3.8 CONSUME ONLY MODERATE AMOUNTS OF SUGARS AND FOODS CONTAINING ADDED SUGARS
Dietary Guidelines for Children and Adolescents in Australia
R E L AT I O N S H I P TO OT H E R G U I D E L I N E S
Enjoy a wide variety of nutritious foods
It is important that a wide variety of foods is included in the diet and thatconsumption of foods high in added sugars is kept to moderate levels.
Eat plenty of vegetables, legume and fruits
Sugars are an important constituent of vegetables and fruit, contributing to theirpalatability. Adding a small amount of sugar to stewed fruits and some cookedvegetables can increase their palatability.
Eat plenty of cereals (including breads, rice, pasta and noodles),preferably wholegrain
Cereals, breads and pasta are an excellent source of energy and nutrients.Adding small amounts of sugar to cereals and breads can greatly increase theirpalatability.
Choose water as a drink
Adding sugar to hot beverages is a common practice; it should be regulated if asizeable number of drinks are consumed each day. Artificial sweeteners can beuseful in providing the sweetened flavour but reducing the amount of addedsugar consumed.
C O N C L U S I O N
The amount of sugar added to the diet of Australians should be moderate, toensure that valuable nutrients are not diluted by foods high in added sugar andlimited in nutrient density. On the other hand, adding small amounts of sugar tofoods that are energy and nutrient dense can increase the palatability of thesefoods and promote their intake.
E V I D E N C E
Much of the evidence presented in this guideline relates to dispelling commonlyheld beliefs about sugar and disease. As a result, much of it is negative in that itprovides evidence against a hypothesised relationship. There is Level I evidenceof dental caries prevention with xylitol (reference 54) and Level III evidence forthe role of carbohydrates in dental caries (references 39 and 50) and for a linkbetween consumption of sugar-sweetened drinks and childhood obesity(reference 31).
212 Dietary Guidelines for Children and Adolescents in Australia
3.8 CONSUME ONLY MODERATE AMOUNTS OF SUGARS AND FOODS CONTAINING ADDED SUGARS
In contrast, a number of studies have concluded that intake of carbohydrate, oreven sucrose, has no relationship with obesity or that the relationship may benegative (see reference 32). Other evidence concerning sugar and dental cariescomes from cross-population studies and observational studies withinpopulations.
R E F E R E N C E S
1. UN Food and Agriculture Organization. Carbohydrates in human nutrition.FAO Food and Nutrition Paper no. 66. Rome: FAO, 1997.
2. Johnson C, Kennedy E. The 2000 Dietary Guidelines for Americans: what arethe changes and why were they made? J Am Diet Assoc 2000;100:769–74.
3. Sheiham A. Dietary effects on dental diseases. Publ Hlth Nutr2001;4(2B):569–91.
4. Stanton R. Sugar: why Australia should retain a dietary guideline. Aust JNutr Diet 2001;58:31–6.
5. O’Dea K, Mann J. Importance of retaining a national dietary guideline forsugar. Med J Aust 2001;175:165–6.
6. Williams P. Sugar: is there a need for a dietary guideline in Australia? AustJ Nutr Diet 2001;58:26–31.
7. Australian Bureau of Statistics. National Nutrition Survey: selectedhighlights, Australia, 1995. Canberra: ABS, 1997.
8. Cobiac L, Record S, Leppard P, Syrette J, Flight I. Sugars in the Australiandiet: results from the 1995–96 National Nutrition Survey. Adelaide: CSIRO,2001.
9. Australian Bureau of Statistics. Apparent consumption of foodstuffs, 1997–98 and 1998–99, Australia. Canberra: ABS, 2000.
10. Baghurst K, Record S, Syrette J, Crawford D, Baghurst P. Intakes andsources of a range of dietary sugars in various Australian populations. MedJ Aust 1989;151:515–18.
11. Lee A, O’Dea K, Mathews J. Apparent dietary intake in remote Aboriginalcommunities. Aust J Publ Hlth 1994;18:190–7.
12. Australian Bureau of Statistics. Apparent consumption of foodstuffs,Australia. Canberra: ABS, 1987.
13. National Health and Medical Research Council. Nutrition in Aboriginal andTorres Strait Islander peoples: an information paper. Canberra: NHMRC,2000.
14. Emmett P, Heaton K. Is extrinsic sugar a vehicle for dietary fat? Lancet1995;345:1537–40.
15. Gibney M, Sigman-Grant M, Stanton J, Keast D. Consumption of sugars.Am J Clin Nutr 1995;62(suppl.):178S–194S.
213
3.8 CONSUME ONLY MODERATE AMOUNTS OF SUGARS AND FOODS CONTAINING ADDED SUGARS
Dietary Guidelines for Children and Adolescents in Australia
16. Bolton-Smith C, Woodward M. Dietary composition and fat to sugar ratiosin relation to obesity. Int J Obes 1994;18:820–8.
17. Lewis C, Youngmee K, Dexter P, Yetley E. Nutrient intakes and bodyweights of persons consuming high and moderate levels of added sugars. JAm Diet Assoc 1992;92:708–13.
18. Naismith D, Nelson M, Burley, Gatenby S. Does a high-sugar diet promoteoverweight in children and lead to nutrient deficiencies? J Hum Nutr Diet1995;8:249–54.
19. Flynn M, Sugrue D, Codd M, Gibney M. Women’s dietary fat and sugarintakes: implications for food based guidelines. Eur J Clin Nutr1996;50:713–19.
20. Baghurst K, Baghurst P, Record S. Demographic and dietary profiles of highand low fat consumers in Australia. J Epidem Comm Hlth 1994;48:26–32.
21. Krebs-Smith S. Choose beverages and foods to moderate your intake ofsugars: measurement requires quantification. J Nutr 2001;131(suppl.):527S–535S.
22. Baghurst K, Record S, Baghurst P. The relationship between refined sugarand micronutrient intakes. Proc Nutr Soc Aust 1991;16:33.
23. Charlton K, Wolmarans P, Lombard C. Evidence of nutrient dilution with highsugar intakes of older South Africans. J Hum Nutr Diet 1998;11:331–43.
24. Jensen ME. Diet and dental caries. Dent Clin North Am 1999;43(4):615–33.
25. Mann J, Truswell A. Effects of isocaloric exchange of dietary sucrose andstarch on fasting serum lipids, postprandial insulin secretion andalimentary lipidaemia in human subjects. Br J Nutr 1972;27:395–405.
26. Hudgins L, Hellerstein M, Seidman C, Neese R, Tremaroli J, Hirsch J.Relationship between carbohydrate-induced hypertriglyceridemia and fattyacid synthesis in lean and obese subjects. J Lipid Res 2000;41:595–604.
27. Summerbell C, Moody R, Shanks J, Stock M, Geissler C. Sources of energyfrom meals versus snacks in 220 people in four age groups. Eur J Clin Nutr1995;49:33–41.
28. UN Food and Agriculture Organization. Carbohydrates in human nutrition:report of a joint FAO–WHO expert consultation. Rome: FAO, 1997.
29. Mann J, Truswell A, eds. Essentials of human nutrition. Oxford: OxfordUniversity Press, 1988.
30. Saris WH, Astrup A, Prentice AM, Zunft HJ, Formiguera X, Verboeket-vande Venne WP et al. Randomized controlled trial of changes in dietarycarbohydrate/fat ratio and simple vs complex carbohydrates on bodyweight and blood lipids: the CARMEN study. The carbohydrate ratiomanagement in European national diets. Int J Obes Rel Metab Dis2000;24(10):1310–18.
214 Dietary Guidelines for Children and Adolescents in Australia
3.8 CONSUME ONLY MODERATE AMOUNTS OF SUGARS AND FOODS CONTAINING ADDED SUGARS
31. Ludwig DS, Peterson KE, Gortmaker SL. Relation between consumption ofsugar-sweetened drinks and childhood obesity: a prospective,observational analysis. Lancet 2001;357:505–8.
32. Hill J, Prentice A. Sugar and body weight regulation. Am J Clin Nutr1995;62(suppl. 1):264S–273S.
33. Bellisle F, Rolland-Cachera M. How sugar-containing drinks might increaseadiposity in children. Lancet 2001;357:490–1.
34. Mattes R. Dietary compensation by humans for supplemental energy providedas ethanol or carbohydrate in fluids. Physiol Behav 1996;59:179–87.
35. Johnson R, Frary C. Choose beverages and foods to moderate your intakeof sugars: the 2000 Dietary Guidelines for Americans—what’s all the fussabout? J Nutr 2001;131(suppl.):2766S–2771S.
36. Kantor LS. A dietary assessment of the US food supply: comparing per capitafood consumption with food guide pyramid service recommendations.Report no. 772/1998. Washington, DC: Department of Agriculture, 1998.
37. Department of Community Services and Health. National Dietary Survey ofAdults: 1983. Canberra: AGPS, 1987.
38. Australian Softdrink Association. Soft drink consumption statistics. Sydney:ASA, 2001.
39. Burt B, Eklund S, Morgan K, Larkin F, Guire K, Brown L et al. The effectsof sugars intake and frequency of ingestion on dental caries increment in athree-year longitudinal study. J Dent Res 1988;67:1422–9.
40. Crowley S, Antioch K, Carter R, Waters A-M, Conway L, Mathers C. The costof diet-related disease in Australia. Canberra: Australian Institute of Healthand Welfare, 1992.
41. Australian Institute of Health and Welfare. Australia’s health 2000: theseventh biennial report of the Australian Institute of Health and Welfare,Canberra: AIHW, 2000.
42. Australian Institute of Health and Welfare. Australia’s health 1998: the sixthbiennial health report of the Australian Institute of Health and Welfare.Canberra: AIHW, 1998.
43. Slade GD, Spencer AJ, Davies MJ, Stewart JF. Caries experience amongchildren in fluoridated Townsville and unfluoridated Brisbane. Aust NZ JPubl Hlth 1996;20(6):623–9.
44. McDonagh M. A systematic review of public water flouridation. Reportno. 18. York: University of York, 2000.
45. Davies MJ, Spencer AJ, Westwater A, Simmons B. Dental caries amongAustralian Aboriginal, non-Aboriginal Australian-born, and overseas-bornchildren. Bull World Hlth Org 1997;75(3):197–203.
46. Walsh LJ. Preventive dentistry. Aust Dent J 2000;45:76–82.
215
3.8 CONSUME ONLY MODERATE AMOUNTS OF SUGARS AND FOODS CONTAINING ADDED SUGARS
Dietary Guidelines for Children and Adolescents in Australia
47. Ruxton C, Garceau F, Cotrell R. Guidelines for sugar consumption in Europe:is a quantitative approach justified? Eur J Clin Nutr 1999;53:503–13.
48. Balakrishnan M, Simmonds R, Tagg J. Dental caries is a preventableinfectious disease. Aust Dent J 2000;45:235–45.
49. World Health Organization. Diet, nutrition and the prevention of chronicdiseases. Geneva: WHO, 1990.
50. Gibson S, Williams S. Dental caries in pre-school children: association withsocial class, toothbrushing habit and consumption of sugars and sugarcontaining foods. Caries Res 1999;33:101–13.
51. British Nutrition Foundation. Oral health diet and other factors.Amsterdam: Elsevier, 1999.
52. Ollila P, Niemela M, Uhari M, Larmas M. Prolonged pacifier-sucking anduse of a nursing bottle at night: possible risk factors for dental caries inchildren. Acta Odontol Scand 1998;56(4):233–7.
53. Lam M, Riedy C, Coldwell S, Milgrom P, Craig R. Children’s acceptance ofxylitol-based foods. Comm Dent Oral Epidemiol 2000;28(2):97–101.
54. Gales MA, Nguyen TM. Sorbitol compared with xylitol in prevention ofdental caries. Ann Pharmacother 2000;34(1):98–100.
55. Bessesen D. The role of carbohydrates in insulin resistance. J Nutr2001;131(suppl.): 2782S–2786S.
56. Mann J, Truswell A, Manning E. Effects on serum lipids of reducing dietarysucrose or starch for 22 weeks in normal men. S Afr Med J 1972;4:827–34.
57. Parks E. Effect of dietary carbohydrate on triglyceride metabolism inhumans. J Nutr 2001;131(suppl.):2772S–2774S.
58. Palli D, Russo A, Decarli A. Dietary patterns, nutrient intake and gastriccancer in a high-risk area of Italy. Cancer Causes Control 2001;12:163–72.
59. Franceschi S, Favero A, La Vecchia C, Negri E, Conti E, Montella M et al.Food groups and the risk of colorectal cancer in Italy. Int J Cancer1997;72(1):56–61.
60. Boutron-Ruault M, Senesse P, Faivre J, Chatelain N, Belghiti C, Meance S.Foods as risk factors for colorectal cancer: a case-control study inBurgundy (France). Eur J Cancer Prev 1999;8:229–35.
61. Slattery M, Benson J, Berry T, Duncan D, Edwards S, Caan B et al. Dietarysugar and colon cancer. Cancer Epid Bio Prev 1997;6:677–85.
62. World Cancer Research Fund. Food, nutrition and the prevention of cancer:a global perspective. Washington, DC: American Institute for CancerResearch, 1997.
63. National Health and Medical Research Council. The prevention, earlydetection and management of colorectal cancer. Canberra: NHMRC, 1999.
216 Dietary Guidelines for Children and Adolescents in Australia
3.8 CONSUME ONLY MODERATE AMOUNTS OF SUGARS AND FOODS CONTAINING ADDED SUGARS
64. World Health Organization. Carbohydrates in human nutrition: report of ajoint FAO–WHO expert consultation. Rome: World Health Organization;1997.
65. American Academy of Pediatrics. Diagnosis and evaluation of the childwith attention deficit/hyperactivity disorder. Pediatrics 2000;105:1158–70.
66. Blackburn G, Kanders B, Lavin P, Keller S, Whatley J. The effect ofaspartame as part of a multidisciplinary weight-control program on shortand long term control of body weight. Am J Clin Nutr 1997;65:409–18.
217
3.8 CONSUME ONLY MODERATE AMOUNTS OF SUGARS AND FOODS CONTAINING ADDED SUGARS
Dietary Guidelines for Children and Adolescents in Australia
4 C A R E F O R YO U R C H I L D ’ S F O O D :P R E PA R E A N D S TO R E I T S A F E LY
R o c h e l l e F i n l a y a n d P a t r i c i a B l e n m a n
B A C K G R O U N D
Despite having one of the world’s safest food-supply systems, Australia has seenan increase in the number of reported foodborne illnesses in the last 10 years.Foodborne illness can have very serious health consequences. Correct handlingof food during all stages of its preparation and storage is essential in reducingthe incidence of foodborne illness.
All population groups are susceptible to foodborne illnesses, but children andinfants are particularly vulnerable because of their underdeveloped immunesystems. They are totally dependent on others to provide food that has beenprepared correctly and is suitable for their consumption. Attention to food safetyfor this age group is of great importance.
The incidence of foodborne illnesses
Reported data on foodborne illnesses consistently underestimate the trueincidence of these illnesses, and full diagnostic testing is usually done only inmore severe cases or when there are extensive common-source outbreaks.1,2 As aresult of their apparently increasing incidence, in Australia and worldwide,foodborne diseases pose a significant public health problem.3 A number offactors are thought responsible for the increase in foodborne illness4,5:
• changes in human demographics, resulting in a greater proportion of thepopulation with increased susceptibility to severe foodborne illness
• changes in food-production methods, including intensive farming practicesand more extensive food-distribution systems. Food grown in one countrycan now be transported and consumed halfway across the world
• new and emerging pathogens. Three of the four most significant foodbornepathogens in the United States (campylobacter, listeria, andenterohaemorrhagic Escherichia coli) were unrecognised as causes offoodborne illness 20 years ago
• consumer preferences, particularly with the increasing trend towardstakeaway food and dining out.
An increase in notifications of foodborne illness has also occurred, for two mainreasons:
• better reporting and identification of pathogens.4 Dramatic scientific andtechnological improvements in the detection of pathogens have
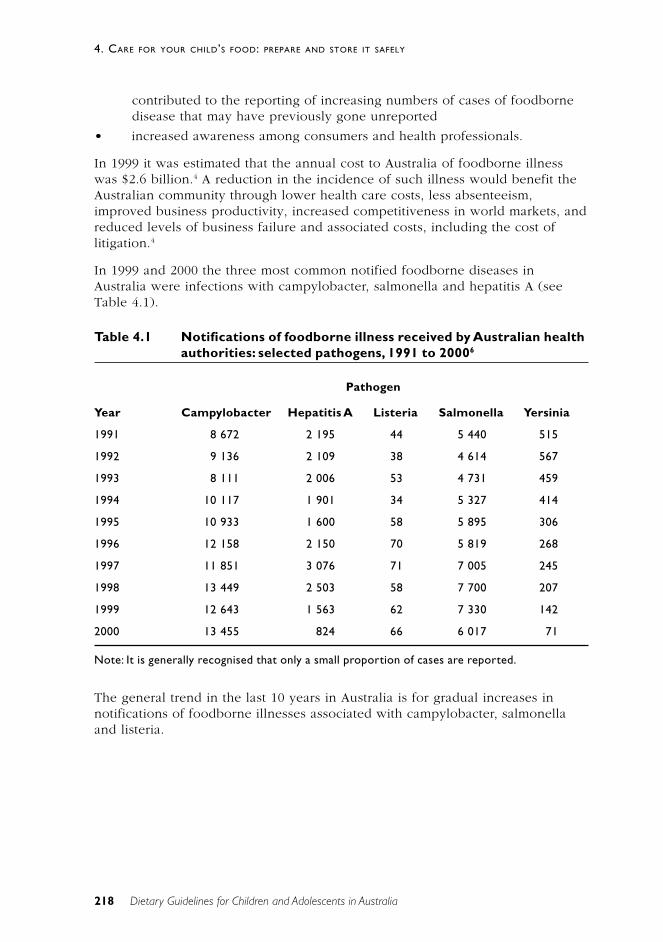
218
4. CARE FOR YOUR CHILD’S FOOD: PREPARE AND STORE IT SAFELY
Dietary Guidelines for Children and Adolescents in Australia
contributed to the reporting of increasing numbers of cases of foodbornedisease that may have previously gone unreported
• increased awareness among consumers and health professionals.
In 1999 it was estimated that the annual cost to Australia of foodborne illnesswas $2.6 billion.4 A reduction in the incidence of such illness would benefit theAustralian community through lower health care costs, less absenteeism,improved business productivity, increased competitiveness in world markets, andreduced levels of business failure and associated costs, including the cost oflitigation.4
In 1999 and 2000 the three most common notified foodborne diseases inAustralia were infections with campylobacter, salmonella and hepatitis A (seeTable 4.1).
Table 4.1 Notifications of foodborne illness received by Australian healthauthorities: selected pathogens, 1991 to 20006
Pathogen
Year Campylobacter Hepatitis A Listeria Salmonella Yersinia
1991 8 672 2 195 44 5 440 515
1992 9 136 2 109 38 4 614 567
1993 8 111 2 006 53 4 731 459
1994 10 117 1 901 34 5 327 414
1995 10 933 1 600 58 5 895 306
1996 12 158 2 150 70 5 819 268
1997 11 851 3 076 71 7 005 245
1998 13 449 2 503 58 7 700 207
1999 12 643 1 563 62 7 330 142
2000 13 455 824 66 6 017 71
Note: It is generally recognised that only a small proportion of cases are reported.
The general trend in the last 10 years in Australia is for gradual increases innotifications of foodborne illnesses associated with campylobacter, salmonellaand listeria.
219
4. CARE FOR YOUR CHILD’S FOOD: PREPARE AND STORE IT SAFELY
Dietary Guidelines for Children and Adolescents in Australia
S C I E N T I F I C B A S I S
Characteristics of foodborne illness
The symptoms of foodborne illness are dependent on the pathogen responsibleand the immune status of the affected person. Symptoms can range from beingso mild as to be hardly noticeable to being so severe that hospitalisation isneeded.7 Common symptoms are abdominal pain, nausea, vomiting, diarrhoea,bloody stools, fever and dehydration. People may also experience fatigue andmuscle pain.7 In serious cases, and depending on the pathogen, foodborneillness may result in double vision, trouble with swallowing or breathing,paralysis, encephalopathy, kidney failure, or death.4 Some foodborne pathogenscan also trigger longer term effects such as reactive arthritis and auto-immunedisorders.8
The time taken between infection by the pathogen and development ofsymptoms varies according to the pathogen involved. Symptoms of commonlyacquired foodborne infections can present themselves within two to four hoursor up to 10 days after infection. For some agents, such as Listeriamonocytogenes, the average incubation period is three weeks.
Infection by Escherichia coli O157:H7 is of particular concern with childrenbecause it can cause kidney failure and death. The pathogen has been foundparticularly in undercooked ground beef and in unpasteurised apple juices.9 Inchildren aged less than 5 years the infection can cause a complication called‘haemolytic uraemic syndrome’, which results in kidney failure: 2–7 per cent ofinfections lead to this complication. In the United States, HUS is the principlecause of acute kidney failure in children, and most cases of the syndrome arecaused by E. coli O157:H7. The death rate from HUS is 3–5 per cent.10 Anotherstrain, E. coli O111, can also cause HUS. An outbreak of E. coli O111 in Australiain 1995, which caused the death of one child and the hospitalisation of 24others, was traced to consumption of mettwurst produced in the Garibaldismallgoods factory.11
Children and food safety
Children are especially prone to foodborne illness and other infectiousdiseases.12
Infants and young children are at particular risk because their immune systemsare still developing and they cannot fight infection as well as adults can. As aresult, they are more susceptible to all types of infection and are likely to suffermore severe consequences. In addition, children produce less acid in theirstomachs than do adults13, and low stomach acidity increases the likelihood ofinfection if foodborne pathogens are ingested.14
220
4. CARE FOR YOUR CHILD’S FOOD: PREPARE AND STORE IT SAFELY
Dietary Guidelines for Children and Adolescents in Australia
Causes of foodborne illnesses
Foodborne illnesses can be caused by bacteria, viruses or bacterial toxins.4
Bacterial food poisoning occurs when pathogenic bacteria multiply to harmfullevels as a result of incorrect handling of food, particularly if temperature controlis inadequate. But not all foodborne pathogens need to multiply in food to causeillness. Viruses such as hepatitis A and Norwalk virus, and some strains ofbacteria—such as Escherichia coli (for example, E. coli O157:H7 and E. coliO111), Campylobacter jejuni and Shigella spp.—can cause illness, even whenpresent in low numbers. Food must be protected from contamination if thesepathogens are to be excluded. If a ready-to-eat food is contaminated with thesepathogens, illness may occur and, once the pathogens are present, keeping thefood at a safe temperature will not have any effect.15
A number of micro-organisms produce toxins when allowed to multiply to highlevels in food, and eating food that contains such toxins can cause foodborneillness. For example, botulism is caused by ingestion of a toxin produced byClostridium botulinum present in contaminated food; other micro-organismslinked with toxin production in food are Staphylococcus aureus (which causesstaphylococcal food poisoning), Bacillus cereus and shigella. Toxin formationcan be prevented if foods are kept at safe temperatures. Even re-heating food tohigh temperatures will not destroy toxins.16
The following are the main causes of foodborne illness in Australia:
• inadequate cooking
• improper holding temperatures
• contaminated equipment
• unsafe food sources
• poor personal hygiene.1
Temperature
Exposure to high temperatures, such as those used in cooking, should destroythe vegetative cells of bacteria. Some bacteria do, however, have heat-resistantspores and toxins that survive the cooking process; an example is Bacilluscereus. Cooling to low temperatures, such as refrigeration, will slow bacterialgrowth. With the exception of Listeria monocytogenes and Yersiniaenterocolitica, pathogenic bacteria do not multiply at temperatures at or below5ºC. Foods that support the growth of foodborne bacteria should be stored at orbelow 5°C or at or above 60°C. Between 5°C and 60°C is considered to be the‘danger zone’ for food safety: within this temperature range, bacterial replicationcan occur.
Time
The longer food is left in the temperature danger zone, the more time bacteriawill have to multiply. Some bacteria can reach an infective dose in four to sixhours at temperatures within the danger zone.17,18
221
4. CARE FOR YOUR CHILD’S FOOD: PREPARE AND STORE IT SAFELY
Dietary Guidelines for Children and Adolescents in Australia
Food contamination
Microbiological food contamination can occur in a number of ways:
• The utensils used to prepare raw food—such as a chopping board used tocut raw meat and poultry—are then used on ready-to-eat food withouthaving been cleaned, sanitised and dried.
• Raw foods are allowed to make direct contact with ready-to-eat foods.
• People preparing or serving food contaminate it by not washing theirhands adequately, particularly after handling raw food and immediatelyafter using the toilet.
• Food storage and preparation areas are themselves contaminated throughinadequate cleaning and sanitising or are open to contamination by pestssuch as insects and rodents.
Potentially hazardous foods
The ability of micro-organisms to grow in a food depends on external factors(such as temperature) as well as the characteristics of the food itself (such asnutrient content, water content and pH). Bacteria need adequate nutrients forreplication; among their most suitable media are high-protein, perishable foodssuch as dairy products, egg products, seafood, meat and poultry.17,18 These foodsalso have a relatively high moisture content: bacterial growth is limited in theabsence of moisture. The acidity or alkalinity of a food also affects bacterialgrowth: bacteria are least active in very acidic foods (those with a pH less than4.5). Often foods are preserved using vinegar to reduce bacterial growth,although moulds may still grow in these conditions.18
The following are examples of foods that are normally considered potentiallyhazardous15:
• raw and cooked meat or foods containing raw or cooked meat—forexample, casseroles, curries and meat pies
• dairy products and foods containing dairy products—for example, milk,custard and dairy-based desserts
• seafood and foods containing seafood
• cooked rice and pasta
• processed fruits and vegetables such as salads
• processed foods containing eggs or other protein-rich food
• foods that contain any of the foods just listed—for example, sandwiches.
The foods most commonly implicated in food-borne illness in Australia are meatand seafood.1
Some food-borne pathogens, such as viruses and enterohaemorrhagic strains ofEscherichia coli, do not need to grow in foods to produce illness. Contaminationof any ready-to-eat food with such a pathogen can result in food-borne illness.
222
4. CARE FOR YOUR CHILD’S FOOD: PREPARE AND STORE IT SAFELY
Dietary Guidelines for Children and Adolescents in Australia
Foreign matter in foods
Physical hazards—foreign objects and other extraneous material (that is, anyphysical matter not normally found in food)—can cause illness, includingpsychological trauma, or injury. The danger is especially great for youngchildren, who are more likely to choke and, if they are very young, cannot telltheir parent or carer that a foreign object is present.
P R A C T I C A L A S P E C T S O F T H I S G U I D E L I N E
To optimise food safety, care should be taken at all stages of the consumer ‘foodchain’—purchasing, transport, storage, preparation, cooking, serving andcleaning. Children are susceptible to infection, so it is vital that their food ishandled safely.
Purchasing
It is important to make appropriate food purchases for young children. Thefollowing foods should not be fed to young children because of their potential tocause serious foodborne illness in this age group:
• uncooked fermented meats, such as salami. Check the label: ‘heat treated’or ‘cooked’ products are safe. Do not feed young children ‘not heattreated’ products
• unpasteurised fruit juices. Shelf-stable juices are pasteurised, but somepackaged refrigerated juices may be unpasteurised. Check the label orcontact the manufacturer. All freshly squeezed juices are unpasteurised
• unpasteurised milk and products made from unpasteurised milk—such asraw-milk cheese
• raw or undercooked meat (particularly minced meat), poultry, fish andshellfish
• honey, which should not be fed to children aged less than 1 year becauseit may be contaminated with Clostridium botulinum and lead to infantilebotulism19
• raw sprouts—such as alfalfa, clover and radish.20
Storage
The various food types need to be stored properly to retain their nutrient value,freshness, aroma and texture, and to keep them safe.17–21,22 Always read the labelfor storage instructions. Ensure that storage areas such as cupboards and pantriesare clean and that foods are stored in food-grade containers away fromchemicals. Store raw foods separately from ready-to-eat foods to prevent cross-contamination.15
223
4. CARE FOR YOUR CHILD’S FOOD: PREPARE AND STORE IT SAFELY
Dietary Guidelines for Children and Adolescents in Australia
Refrigeration
Refrigeration retards the growth of bacteria and the rate of chemical change infood. The refrigerator temperature should be 5°C or less—this can be checkedusing a suitable thermometer— and care should be taken to ensure that thetemperature is maintained. All cooked foods should be covered and stored on ashelf above uncooked foods. Leftovers and ready-to-eat meals should be usedthe next day or stored in the freezer. Raw meats should be wrapped or placed ina container and stored near the bottom of the refrigerator, so that the juices donot drip onto other foods. Any spills should be cleaned up immediately, andfridge and freezer shelves and doors should be cleaned regularly. Ready-to-eatchilled foods are becoming widely available; they should be stored in the coldestpart of the fridge and used before the ‘use by’ or ‘best before’ date or as soon aspossible after purchase.
Frozen foods
Care should be taken to ensure that frozen food is kept hard frozen. It should bestored in packages that are free of air and fully sealed, to prevent ‘freezer burn’.Freezer burn is dehydration or drying that occurs on the surface of a product if itis improperly wrapped; the product is safe to eat but of poorer quality.
Canned and other hermetically sealed foods
Canned and other hermetically sealed foods—such as foods sealed in glass jars—should be stored in a cool place. Read the labels carefully for any storageinstructions. Once opened, canned foods should be stored in the refrigerator,preferably not in the can. Swollen or leaking cans indicate faulty processing:their contents should not be eaten. In addition, throw out the contents of anycan if there is an unusual odour. When opening vacuum-sealed jars, listen for apopping sound, which shows that the jar’s seal was intact. This is particularlyimportant with commercial baby foods: if the jar fails to ‘pop’ when opened, donot use the food.
Vacuum-packed and modified–atmosphere packed foods
Vacuum packing extends the shelf life of food by removing air from thepackages. Modified-atmosphere packaging extends shelf life by replacing theoxygen in a packaged food with other gases that slow bacterial growth; themethod is often used with meat and poultry products. An increasing number ofblister packs of foods such as fresh pasta, lunch meat, bacon and olives are nowavailable. Vacuum-packed and modified–atmosphere packed foods should bestored according to the instructions on the package.
Dehydrated and dried foods
Dehydration inhibits the growth of micro-organisms by removing water, but itdoes not make the food sterile21: a high level of micro-organisms can remain,only to become active again when the food is rehydrated. Rehydrated foodsshould be treated as perishables and be stored in the refrigerator. Dried food
224
4. CARE FOR YOUR CHILD’S FOOD: PREPARE AND STORE IT SAFELY
Dietary Guidelines for Children and Adolescents in Australia
should be stored in a sealed container and in a cool, dry place away from directheat or sunlight. It should be regularly inspected for insect infestation. Openedpackages of dried food can be stored in the refrigerator to maintain quality forlonger.
Date-marked packaged foods
The ‘best before’ date on packaged food signifies the end of the period duringwhich the intact package of food—if stored in accordance with any statedstorage conditions—will retain all of its quality attributes, such as colour, taste,texture and flavour.23 Foods that are date-marked in this way can continue to besold after that date provided the food is not damaged or has not deteriorated orperished. Check foods that have passed their ‘best before’ date for signs ofspoilage.
The ‘use by’ date on packaged food signifies the end of the estimated period—ifthe food is stored in accordance with any stated storage conditions—after whichthe intact package of food should not be consumed for health and safetyreasons.23 Foods marked with a ‘use by’ date are prohibited from being sold afterthis date because the food might then pose a health risk.
Food spoilage
Food spoilage occurs when food-spoiling bacteria multiply and cause the food todeteriorate and develop unpleasant odours, tastes and textures. The bacteriaspoil the food so that it becomes inedible, but they do not themselves causefoodborne illness. On the other hand, food in which pathogenic micro-organismshave grown to high levels may appear and taste normal. Food handling measuresused to optimise food safety, such as proper storage and temperature controls,also help prevent premature spoilage.
Food preparation
Handwashing and hygiene
Before starting to prepare food, people should thoroughly wash and dry theirhands. This is particularly important after:
• handling raw foods—such as raw meat
• touching animals
• using the toilet
• assisting others with toilet use
• blowing noses
• changing children’s nappies.22,24–26
Hands should be lathered and held under running water to ensure that anymicro-organisms are washed away. Particular attention should be paid towashing between fingers and under fingernails. After washing, hands should be
225
4. CARE FOR YOUR CHILD’S FOOD: PREPARE AND STORE IT SAFELY
Dietary Guidelines for Children and Adolescents in Australia
dried using either a clean towel or a paper towel. Food should not be preparedby anyone who might be suffering from a foodborne illness or who has afoodborne disease.15
Preventing cross-contamination
A number of measures should be taken to help prevent cross-contamination offood with potentially harmful micro-organisms:
• Special care should be taken with cleaning after cutting up raw meat andbefore dicing vegetables, particularly if the vegetables are to be eaten rawor with minimal cooking.
• Use a different chopping board and utensils when preparing foods to beeaten raw and foods for cooking.
• Never place cooked food on plates that have held raw meat, poultry orseafood.
• Never use a tea towel as a hand towel or for cleaning surfaces.
• During food preparation, do not taste, or allow children to taste, the foodwith the utensil used for stirring.18,25,26
Thawing foods
The method chosen for thawing food should be the one that minimises the timethe food is at a temperature that supports the growth of micro-organisms—forexample, room temperature. Ready-to-eat frozen foods should be thawed in therefrigerator or under cold water in an airtight plastic wrapper or bag, the waterbeing changed every 30 minutes.27,28 Foods can also be thawed in a microwaveoven, using the defrost setting.
When thawing raw meat, it is important that fluids produced during the thawingprocess do not contaminate other foods or containers and other utensils thatmight be used for other foods. Make sure that larger portions of raw meat, suchas chickens and turkeys, are thawed completely before cooking. This might callfor some forward planning, to allow sufficient time for thawing these meatsbefore they are required; for example, if a turkey is thawed in the fridge it mighttake several days, depending on the bird’s size.
Follow the manufacturer’s instructions for re-heating packaged ready-to-eatfrozen foods (such as TV dinners). And be sure to check the information on pre-packaged foods to determine whether they need to be cooked or simply re-heated before being eaten.
Preparing fruits and vegetables
Fruits and vegetables should be washed thoroughly under running water beforepeeling and cutting. Special care should be taken with produce such as parsleyand lettuce: they are harder to clean than smooth-skinned produce.
226
4. CARE FOR YOUR CHILD’S FOOD: PREPARE AND STORE IT SAFELY
Dietary Guidelines for Children and Adolescents in Australia
Marinating
Marinate raw foods in the refrigerator. The marinade can be used duringcooking, but do not add it to the cooked dish or use it as a dressing if raw meathas been in it.
Cooking
Not all meat needs to be cooked thoroughly: steaks, whole fillet, chops andwhole pieces of roast meat can be eaten rare. In contrast, rolled and/or stuffedmeats, poultry, pork, sausages and mince should always be cooked all the waythrough, until the juices run clear when the meat is pierced.15
When using a microwave to cook, rotate and stir the food so that it cooksevenly. Cover it with a lid or plastic wrap so that the steam can aid thoroughcooking. Food finishes cooking during standing time, and it is important to waituntil the standing time has elapsed before checking that cooking is complete.29
Never partially cook products then finish cooking them later.29 Meat, fish andpoultry must be cooked thoroughly; they can then be refrigerated and reheatedlater.
Cooling
Cooking of itself does not guarantee safety: some bacterial spores can surviveseveral hours of cooking and later grow in the food if there is poor temperaturecontrol. Foods such as stews and other meat and poultry dishes that will beeaten later should be cooled as quickly as possible to prevent spores fromgerminating and bacteria from multiplying.
Foods that have just been cooked and are still very hot can be cooled at roomtemperature until the temperature of the food drops to 60°C. The food shouldthen be cooled to 5°C as quickly as possible. To cool a large portion of foodmore quickly, divide it into smaller quantities or place it in shallow containers(5 centimetres deep) in the refrigerator.15 All leftovers should be placed in therefrigerator to cool as soon as possible and should be used within two or threedays.29
Reheating
When reheating food, heat it until it is ‘steaming hot’ throughout: this shoulddestroy any vegetative cells of foodborne pathogens that may be present, but itwill not destroy toxins. Bring soups, sauces and gravies to a rolling boil. Do notreheat food more than once.29 When heating pre-prepared frozen or refrigerateddinners, follow the instructions on the packet.
227
4. CARE FOR YOUR CHILD’S FOOD: PREPARE AND STORE IT SAFELY
Dietary Guidelines for Children and Adolescents in Australia
Serving
It is essential to serve food safely: foodborne illness can result if food is notsafely handled and served as soon as possible after it is cooked. Hands shouldbe washed with soap and water and dried thoroughly using a clean towel or apaper towel, and the food should be served on clean plates. Never put cookedfood on a plate that has held raw food21,27 or re-use utensils used during foodpreparation.22 Unless foods are to be served immediately, they should be covereduntil ready to be eaten.
Freshly cooked food that is eaten straight away is safest; if foods cannot beconsumed immediately, keep them cold (at 5°C or below) or hot (at 60°C orabove). For buffets, food can be kept hot by using chafing dishes and warmingtrays. Cold food should be kept cold by keeping it in the refrigerator or in acooler with ice until served; for buffets, it can be kept on ice. When feedingbabies, only feed directly from the baby food jar if the child is to eat all of thefood or the uneaten portion is to be discarded; otherwise, use a clean plate orbowl.
Cleaning
All work surfaces, crockery, cutlery, cooking utensils and other equipmentshould be thoroughly cleaned to remove any food or other residue. This canusually be done by using warm water with detergent. After cleaning, utensils andwork surfaces can be sanitised using hot water or chemical sanitisers (such as amixture of bleach and water) if necessary. Utensils and other equipment shouldbe thoroughly dry before they are re-used.
Foodborne bacteria readily persist in kitchen towels, sponges and cloths25,26:wash and dry them often, and replace sponges regularly. Using paper towels canreduce the risk of cross-contamination because they are disposable and socannot harbour and spread bacteria.22
For added protection, keep appliances such as microwave ovens, toasters, canopeners, and blender and mixer blades free of food particles. After thoroughcleaning, use a bleach solution to sanitise chopping blades and hard-to-cleanareas. Keep benches, shelves and work surfaces free of food particles. Whenmaking baby food at home, use a brush to clean around areas of the blenderblades or food processor parts. Old food particles can harbour bacteria that maycontaminate other foods.30
Food handling for infants and children
In addition to the general precautions just discussed, other factors should betaken into consideration for infants and babies being fed infant formula or milkand for children taking packed lunches to schools, day-care centres or creches.
228
4. CARE FOR YOUR CHILD’S FOOD: PREPARE AND STORE IT SAFELY
Dietary Guidelines for Children and Adolescents in Australia
Infant formula
Infant formulas are available in ready-to-use or powder form. Powdered formulais prepared by adding the powder to cooled boiled water. Fresh formula shouldbe prepared daily; it can be stored in the refrigerator for a maximum of 24hours.19
Outbreaks of foodborne illness have been associated with consumption ofcontaminated powdered infant formula.31 Among the pathogens found to be thecause of these outbreaks are salmonella (various strains) and Enterobactersakazakii. In infants, particularly premature newborns, colonisation byE. sakazakii has been linked with the use of contaminated spoons and blendersand with keeping ready-made milk warm in bottle heaters.
With infant formula, there is a greater risk of infection resulting from sub-standard sterilisation techniques. The risk of contamination can be reduced ifbottles, teats and spoons are boiled or otherwise sterilised. Further, baby bottlescontaining formula or milk should not be left sitting at room temperature.12
Ready-made milk should be stored in the fridge and warmed up immediatelybefore use by placing the bottle of milk in hot water. Microwave ovens shouldnot be used to heat the milk: this can cause variations in temperature throughoutthe milk. The temperature of the milk should be tested before feeding the baby.Any partially consumed milk or formula should be discarded.
If travelling, take formula powder in a bottle and add warm water just prior tofeeding.
Breastmilk
Breastfeeding offers the best way of avoiding foodborne illness. There is a lowrisk of bacterial contamination, and the risk of infectious diseases such asgastroenteritis is reduced because maternal antibodies are passed to theinfant.32,33
Breastmilk can be expressed and placed in a sterile container with a lid.19 Theexpressed milk can be stored in a refrigerator for up to five days. Frozenbreastmilk can be stored in a deep freeze for up to six months, in a separate-door fridge/freezer for three to four months, and in the box freezer of arefrigerator for up to two months. Each time breastmilk is expressed it should bestored in a different container, rather than being added to already frozenbreastmilk. Addition of warm breastmilk to pre-frozen milk can cause the frozenmilk to partially thaw, increasing the risk of bacterial growth in the milk.19
Frozen breastmilk should be allowed to thaw in the refrigerator or be placed inits container in warm water until thawed. Breastmilk should be heated graduallyby placing the bottle or other container of milk in hot water. Microwave ovensshould not be used to heat breastmilk: they can destroy some of theimmunological components34 and can cause variations in temperature throughoutthe milk. The temperature of the milk should be tested before feeding the baby.
229
4. CARE FOR YOUR CHILD’S FOOD: PREPARE AND STORE IT SAFELY
Dietary Guidelines for Children and Adolescents in Australia
Sterilising bottles and equipment
Equipment used in preparation and feeding—including bottles or cups used tofeed expressed breastmilk—must be sterilised before use, particularly in the firstthree months of the baby’s life. Sterilising equipment and tablets for makingsterilising solution are widely available and effective, provided themanufacturers’ instructions are followed carefully. Sterilising solutions can beused for 24 hours before being changed.19 Equipment can also be sterilised byboiling it in water for five minutes.35
All pieces of breast pumps should be washed with warm water and a milddetergent. If the pump has clear plastic tubing connected to an electric motor,check the manufacturer’s guidelines for washing and sterilising the tubing. Mostsuch tubing needs to be washed and sterilised only if breastmilk has accidentallybeen drawn up into it. The outside of the tubing should be wiped with a clean,moist cloth then dried with a towel or allowed to air dry.
Food safety in day-care centres and creches
Outbreaks of foodborne illness in day-care centres and creches are oftenassociated with children’s poor hygiene and poor hygiene associated with nappychanging. Hands should be washed thoroughly after changing nappies. Manyday-care centres and creches provide a midday meal or snack for children;however, when children are required to bring their own food from home, it mustbe prepared in such a way as to ensure that it is safe.36 The day-care centre orcreche should advise parents that if leftovers are to be sent with the child theyshould be stored in the refrigerator overnight, then refrigerated immediatelyupon arrival at the centre. Foods prepared fresh and sent with the child shouldalso be refrigerated immediately upon arrival at the centre. Any leftovers senthome with the child should not be eaten later by the child; nor should they besent to the centre the next day. Lunches should be clearly labelled with thechild’s name, the date and the type of food and should be stored at the correcttemperature until eaten. One child’s food should not be fed to another child.
If a child is being fed infant formula or expressed breastmilk, the formula ormilk should be poured into containers labelled with the child’s name, thencapped and refrigerated. Containers should be placed in a fridge immediatelyupon arrival at the centre. Any unused expressed breastmilk or formula shouldbe sent home with the child that day or discarded.
Food safety and packed school lunches
School lunches can safely be made ahead of time (the previous night), providedthey are then kept in the fridge or freezer. To help prevent illness, ensure thatfood preparation surfaces, hands and utensils are clean when preparing andpacking the lunch37 and that all fruits and vegetables are washed thoroughly. Ifpossible, lunches should be carried in an insulated lunch box. Something cold,
230
4. CARE FOR YOUR CHILD’S FOOD: PREPARE AND STORE IT SAFELY
Dietary Guidelines for Children and Adolescents in Australia
such as a frozen juice box or a freezer gel, should be packed with the lunch.38
Pack perishable foods such as cold meats or egg sandwiches between the colditems. Children should (if possible) keep their lunches away from heat sourcessuch as direct sunlight or room radiators.39
When hot foods are taken to school, they should be kept in an insulated bottleor flask. To ensure that the food is kept hot (and safe), the flask should be pre-heated by adding hot water, letting it stand for a few minutes, then emptying itand filling it with hot food. The flask should not be opened until lunchtime.
If lunches are not finished, the leftovers should be thrown out.
Children should be warned against sharing drink bottles because of the risk ofmeningococcal disease. A high proportion of cases of meningitis occur inchildren aged less than 5 years.40
What to do if it is thought that a child is suffering the effects of foodpoisoning
A child with suspected food poisoning should be fed liquids to preventdehydration. Seek medical care immediately if symptoms persist or are severe—for example, bloody diarrhoea, excessive nausea and vomiting or a hightemperature.
If the suspect food was served at a large gathering, by a restaurant or at someother food-service facility, or if it is a commercially produced product, contactyour local health department.
If possible, preserve the evidence. Wrap the remaining portion of the foodsecurely, label it ‘DANGER’ and freeze it. Save all the packaging materials and anyidentical unopened products. Record details of when the food was consumedand when the onset of symptoms occurred.41
The last meal eaten is often blamed for causing illness, whereas it is often a foodthat has been eaten the previous day. It is useful to recall and write down thefoods eaten in the last 48 hours.
R E L AT I O N S H I P TO OT H E R G U I D E L I N E S
Eat plenty of vegetables, legumes and fruits
This guideline closely relates to food hygiene and the purchase, transport,storage, preparation and cooking of vegetables and fruits. When these foods arestored correctly, their nutritional quality and storage life are maximised. Buyfresh vegetables and fruits that are ‘firm’, and make sure that canned and frozenvarieties have complete, undamaged packaging.
231
4. CARE FOR YOUR CHILD’S FOOD: PREPARE AND STORE IT SAFELY
Dietary Guidelines for Children and Adolescents in Australia
Eat plenty of cereals (including breads, rice, pastas, noodles), preferablywholegrain
Include milks, yoghurts, cheeses and/or alternatives …
Limit saturated fat and moderate total fat intake …
Correct storage will maximise the storage life and prevent spoilage of breads,cereals and pastas—as well as dairy products and fats (including cooking oils). Itis important to make sure that packaging is complete and undamaged.
Include lean meat, fish, poultry and/or alternatives
Illness caused by foodborne pathogenic bacteria is a serious public healthproblem, and all foods are potential vectors of pathogens. In Australia the risk offoodborne illness from primary food industries is managed across the food chain,with industry, government and consumers sharing responsibility for the deliveryof microbiologically safe products. Nevertheless, some foods from the meat, fish,poultry and alternatives food group have been implicated in outbreaks offoodborne disease, and constant vigilance is required.
Children and adolescents need sufficient nutritious foods to grow anddevelop normally
• Growth should be checked regularly for young children
• Physical activity is important for all children and adolescents
Research has shown that immune cells are responsive to the effects of acuteexercise, in terms of both number and function. Regular physical activity can bebeneficial for older people’s immune system function and can enhance thebody’s ability to defend itself against foodborne illnesses.
C O N C L U S I O N
It is essential to educate all food handlers, health care providers and the generalpublic if we are to reduce the incidence of foodborne illness. Although mostfoodborne illnesses can be avoided if safe food-handling procedures arefollowed, risk reduction is very important at every step of the way, from foodpurchase to meal serving.
E V I D E N C E
Because of the nature of this guideline, there is no evidence of the kind requiredfor rating according to the National Health and Medical Research Council’s levelsof evidence. It is not possible to conduct trials or case-control, cohort or
232
4. CARE FOR YOUR CHILD’S FOOD: PREPARE AND STORE IT SAFELY
Dietary Guidelines for Children and Adolescents in Australia
experimental studies of the microbiological safety of foods. Information aboutsafe practice comes from a basic understanding of food microbiology and humanphysiology and is based on a wide variety of evidence from laboratory studiesand ‘opportunistic’ evidence from outbreaks of food poisoning.
R E F E R E N C E S
1. Crerar SK, Dalton CB, Longbottom HM, Kraa E. Foodborne disease: currenttrends and future surveillance needs in Australia. Med J Aust 1996;165:672–5.
2. Australia New Zealand Communicable Diseases Network. Fortnightlynotifiable diseases tables. Communicable Diseases Intelligence.<www.health.gov.au/pubhlth/cdi/cdifort.htm>, 11 January 1999.
3. Desmarchelier PM. Foodborne disease: emerging problems and solutions.Med J Aust 1996;165:668–71.
4. Australia New Zealand Food Authority. Food safety standards costs andbenefits: an analysis of the regulatory impact of the proposed national foodsafety reforms. Canberra: ANZFA, 1999.
5. Kaferstin FK. Food safety: a commonly underestimated public health issue.Wld Hlth Stats Quart 1997;50:3–4.
6. Australia New Zealand Communicable Diseases Network. NationalNotifiable Diseases Surveillance System. Communicable DiseasesIntelligence. <www.health.gov.au:80/pubhlth/cdi/nndss2.htm>, April 2001.
7. Hench CP, Simpkins SM. Bugs at the banquet table: foodborne illness.<www.nurseweek.com/ce/ce3240a.html>.
8. Bender JB, Smith KE, Hedberg C, Osterholm MT. Foodborne disease in the21st century. What challenges await us? Postgrad Med 1999;106(2):109–12,115–16, 119. <www.postgradmed.com/issues/1999/08_99/bender.htm>.
9. Food and Drug Administration. Unpasteurized cider and juice can containbacteria that make children and some other people sick. College Park, MD:Centre for Food Safety and Applied Nutrition, US Food and DrugAdministration. <http://www.cfsan.fda.gov/~1rd/juicefl.html>, 1997.
10. Centers for Disease Control and Prevention. Preventing foodborne illness:Escherichia coli O157:H7. Atlanta, GA: CDC. <http://wonder.cdc.gov/wonder/prevguid/p0000417/p0000417.asp>, 1993.
11. Kriven S. Business risks from food poisoning in food processing: theGaribaldi case. Aust Agribus Rev 1995;3(2).
12. University of Nebraska—Lincoln. Food safety for childcare facilities. G94-1233-A. <http://www.ianr.unl.edu/pubs/foods/g1233.htm>, 1996.
13. Van Horn JE, Horning L. Tips for preventing foodborne illness. In: ToddCM, ed. Child Care Connections. Vol. 4, no. 4. Urbana–Champaign, IL:University of Illinois Cooperative Extension Service. <http://www.nncc.org/Health/cc44_tips.foobourne.ill.html>, 1995.
233
4. CARE FOR YOUR CHILD’S FOOD: PREPARE AND STORE IT SAFELY
Dietary Guidelines for Children and Adolescents in Australia
14. Cano RJ, Colome JS. Determinants of health and disease. In: Essentials ofMicrobiology. St Paul, MN: West Publishing Company, 1988.
15. Australia New Zealand Food Authority. Safe food Australia: a guide to theFood Safety Standards. 2nd edn. Canberra: ANZFA, 2001.
16. Fraser A. Bacterial toxins. National food safety database.<www.foodsafety.ufl.edu/consumer/nc/nc816a.htm>, 2001.
17. Sprenger RA. Hygiene for management: a text for food hygiene courses.South Yorkshire, UK: Highfield Publications, 1989.
18. Merry G. Food poisoning prevention. 2nd edn. Melbourne: MacmillanEducation Australia, 1997.
19. Ministry of Health. Food and nutrition guidelines for healthy infants andtoddlers (aged 0–2 years): a background paper. Wellington, NZ: PublicHealth Commission, 1995.
20. US Food and Drug Administration. Consumers advised of risks associatedwith raw sprouts. HHS News. Washington, DC: Centre for Food Safety andApplied Nutrition, 1999. <vm.cfsan.fda.gov/~1rd/hhssprts.html>.
21. CSIRO. Handling food in the home. North Ryde: Food Science Australia,1993.
22. US Federal Consumer Information Center. How to help avoid foodborneillness in the home. Pueblo, CO: FCIC, 1998. <www.pueblo.gsa.gov/press/nfcpubs/foodborn.txt>.
23. Australia New Zealand Food Authority. Date marking: user guide toStandard 1.2.5, Date Marking of Packaged Food. Canberra: ANZFA, 2001.
24. Altekruse SF, Street DA, Fein SB, Levy AS. Consumer knowledge offoodborne microbial hazards and food-handling practices. J Food Protect1995;59(3):287–94.
25. Abdussalan M, Kaferstein FK. Food safety in primary health care. WorldHealth Forum 1994;15:393–9.
26. Department of Health and Community Services. Food Premises Code. 2ndedn. Melbourne: DHCS, 1996.
27. Food Safety Campaign Group. Food safety tips. <www.safefood.net.au/food_august/tips/index.html>, 15 December 1998.
28. Brewer MS. Food storage, food spoilage and foodborne illness. Circular1313. Chicago, IL: Department of Food Science and Human Nutrition,University of Illinois. <www.aces.uiuc.edu/~fshn/extension/food_storage.html>, 1991.
29. US Food Safety and Inspection Service. Safe food to go. Washington, DC:Department of Agriculture. <www.fsis.usda.gov/OA/pubs/foodtogo.htm>,1997.
30. Food and Drug Administration. Seniors and food safety—preventingfoodborne illness. When grandparents take care of grandchildren: what
234
4. CARE FOR YOUR CHILD’S FOOD: PREPARE AND STORE IT SAFELY
Dietary Guidelines for Children and Adolescents in Australia
you need to know about food safety and young children. Centre for FoodSafety and Applied Nutrition, US FDA. <http://vm.cfsan.fda.gov/~dms/seniorsg.html>, 1999.
31. Centers for Disease Control and Prevention. Salmonella serotypeTennessee in powdered milk products and infant formula—Canada and theUnited States. Morbidity and Mortality Weekly Report, 1993;42(26).
32. Howie PW, Forsyth JS, Ogston SA, Clark A, Florey CD. Protective effect ofbreastfeeding against infection. BMJ 1990;300(6716):11–16.
33. Duncan B, Ey J, Holberg CJ, Wright AL, Martinez FD, Taussig LM. Exclusivebreast feeding for at least 4 months protects against otitis media. Pediatrics1993;91(5):867–72.
34. Sigman M, Burke KI, Swarner OW, Shavlik GW. Effects of microwavinghuman milk: changes in IgA content and bacterial count. J Am Dietet Assoc1989;89(5):690–2.
35. Rubbo SD, Gardner JF. Sterilization and disinfection as applied to medicalindustrial and laboratory practice. London: Lloyd-Luke, 1965.
36. Kendall P. Keeping food safe in day care settings. Fort Collins, CO:Colorado State University. <http://www.ext.colostate.edu/pubs/columnnn/nn000704.html>, 2000.
37. Van D. SafetyAlerts. Safe school lunch tips can help prevent illness. <http://www.safetyalerts.com/t/fd/schlun.htm>, 1999.
38. Lamb D. Healthy school lunches follow the new dietary guidelines. In:Nutrition and your health: dietary guidelines for Americans. Aim forfitness; build a health base; Choose sensibly for good health. Home andGarden Bulletin, 5th edn. 2000;232.
39. Canadian Food Inspection Agency. Food safety facts on bagged and boxedlunches. <http://www.inspection.gc.ca/english/corpaffr/foodfacts/bagboxe.shtml>, 2001.
40. Department of Human Services. Meningococcal disease. Melbourne: DHS<http://www.betterhealth.vic.gov.au>, 1999.
41. Food Safety and Inspection Service. Foodborne illness: what consumersneed to know. Fact sheet. Washington, DC: US Department of Agriculture.<http://www.fsis.usda.gov/oa/pubs/fact_fbi.htm>, 2000.

235
4. CARE FOR YOUR CHILD’S FOOD: PREPARE AND STORE IT SAFELY
Dietary Guidelines for Children and Adolescents in Australia
Special considerations
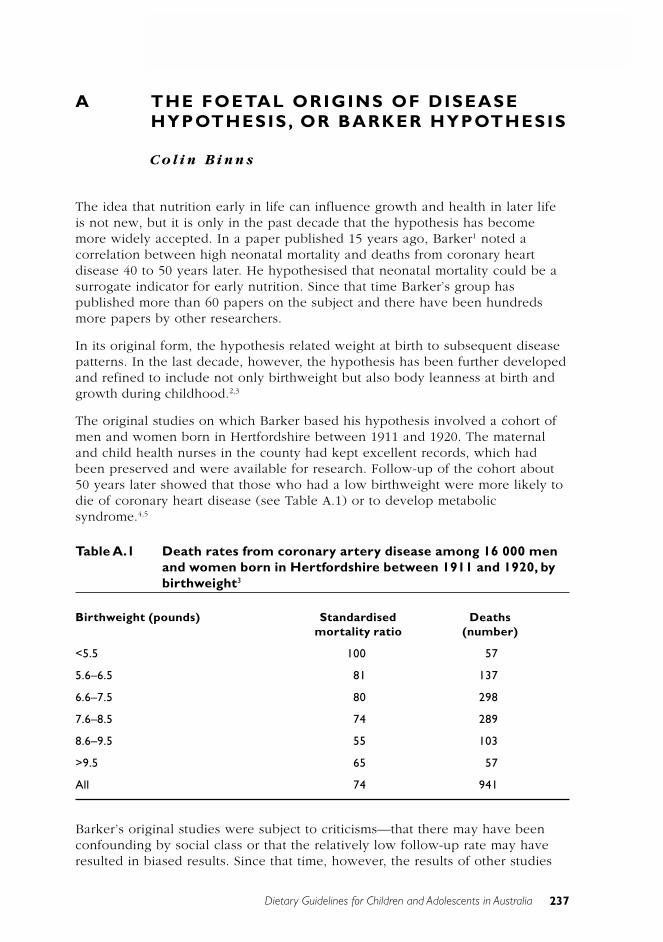
237
A. THE FOETAL ORIGINS OF DISEASE HYPOTHESIS, OR BARKER HYPOTHESIS
Dietary Guidelines for Children and Adolescents in Australia
A THE FOETAL ORIGINS OF DISEASEHYPOTHESIS, OR BARKER HYPOTHESIS
C o l i n B i n n s
The idea that nutrition early in life can influence growth and health in later lifeis not new, but it is only in the past decade that the hypothesis has becomemore widely accepted. In a paper published 15 years ago, Barker1 noted acorrelation between high neonatal mortality and deaths from coronary heartdisease 40 to 50 years later. He hypothesised that neonatal mortality could be asurrogate indicator for early nutrition. Since that time Barker’s group haspublished more than 60 papers on the subject and there have been hundredsmore papers by other researchers.
In its original form, the hypothesis related weight at birth to subsequent diseasepatterns. In the last decade, however, the hypothesis has been further developedand refined to include not only birthweight but also body leanness at birth andgrowth during childhood.2,3
The original studies on which Barker based his hypothesis involved a cohort ofmen and women born in Hertfordshire between 1911 and 1920. The maternaland child health nurses in the county had kept excellent records, which hadbeen preserved and were available for research. Follow-up of the cohort about50 years later showed that those who had a low birthweight were more likely todie of coronary heart disease (see Table A.1) or to develop metabolicsyndrome.4,5
Table A.1 Death rates from coronary artery disease among 16 000 menand women born in Hertfordshire between 1911 and 1920, bybirthweight3
Birthweight (pounds) Standardised Deathsmortality ratio (number)
<5.5 100 57
5.6–6.5 81 137
6.6–7.5 80 298
7.6–8.5 74 289
8.6–9.5 55 103
>9.5 65 57
All 74 941
Barker’s original studies were subject to criticisms—that there may have beenconfounding by social class or that the relatively low follow-up rate may haveresulted in biased results. Since that time, however, the results of other studies
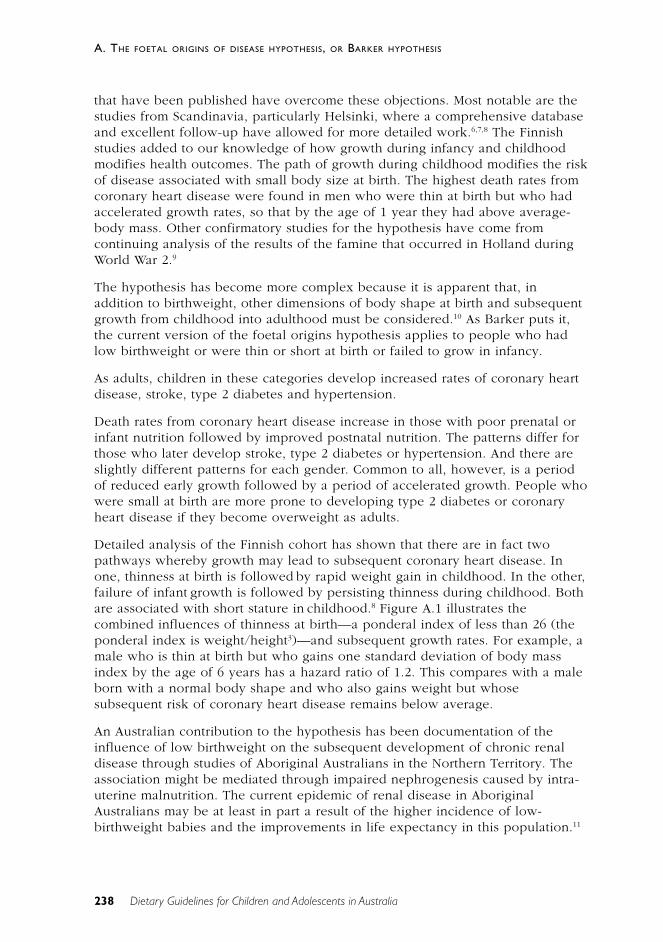
238 Dietary Guidelines for Children and Adolescents in Australia
A. THE FOETAL ORIGINS OF DISEASE HYPOTHESIS, OR BARKER HYPOTHESIS
that have been published have overcome these objections. Most notable are thestudies from Scandinavia, particularly Helsinki, where a comprehensive databaseand excellent follow-up have allowed for more detailed work.6,7,8 The Finnishstudies added to our knowledge of how growth during infancy and childhoodmodifies health outcomes. The path of growth during childhood modifies the riskof disease associated with small body size at birth. The highest death rates fromcoronary heart disease were found in men who were thin at birth but who hadaccelerated growth rates, so that by the age of 1 year they had above average-body mass. Other confirmatory studies for the hypothesis have come fromcontinuing analysis of the results of the famine that occurred in Holland duringWorld War 2.9
The hypothesis has become more complex because it is apparent that, inaddition to birthweight, other dimensions of body shape at birth and subsequentgrowth from childhood into adulthood must be considered.10 As Barker puts it,the current version of the foetal origins hypothesis applies to people who hadlow birthweight or were thin or short at birth or failed to grow in infancy.
As adults, children in these categories develop increased rates of coronary heartdisease, stroke, type 2 diabetes and hypertension.
Death rates from coronary heart disease increase in those with poor prenatal orinfant nutrition followed by improved postnatal nutrition. The patterns differ forthose who later develop stroke, type 2 diabetes or hypertension. And there areslightly different patterns for each gender. Common to all, however, is a periodof reduced early growth followed by a period of accelerated growth. People whowere small at birth are more prone to developing type 2 diabetes or coronaryheart disease if they become overweight as adults.
Detailed analysis of the Finnish cohort has shown that there are in fact twopathways whereby growth may lead to subsequent coronary heart disease. Inone, thinness at birth is followed by rapid weight gain in childhood. In the other,failure of infant growth is followed by persisting thinness during childhood. Bothare associated with short stature in childhood.8 Figure A.1 illustrates thecombined influences of thinness at birth—a ponderal index of less than 26 (theponderal index is weight/height3)—and subsequent growth rates. For example, amale who is thin at birth but who gains one standard deviation of body massindex by the age of 6 years has a hazard ratio of 1.2. This compares with a maleborn with a normal body shape and who also gains weight but whosesubsequent risk of coronary heart disease remains below average.
An Australian contribution to the hypothesis has been documentation of theinfluence of low birthweight on the subsequent development of chronic renaldisease through studies of Aboriginal Australians in the Northern Territory. Theassociation might be mediated through impaired nephrogenesis caused by intra-uterine malnutrition. The current epidemic of renal disease in AboriginalAustralians may be at least in part a result of the higher incidence of low-birthweight babies and the improvements in life expectancy in this population.11
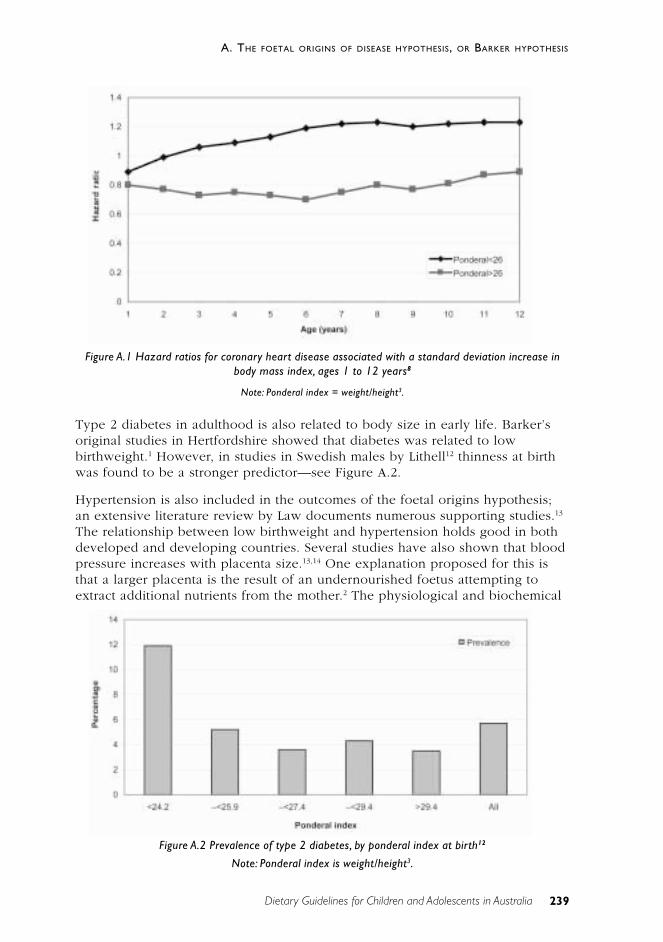
239
A. THE FOETAL ORIGINS OF DISEASE HYPOTHESIS, OR BARKER HYPOTHESIS
Dietary Guidelines for Children and Adolescents in Australia
Type 2 diabetes in adulthood is also related to body size in early life. Barker’soriginal studies in Hertfordshire showed that diabetes was related to lowbirthweight.1 However, in studies in Swedish males by Lithell12 thinness at birthwas found to be a stronger predictor—see Figure A.2.
Hypertension is also included in the outcomes of the foetal origins hypothesis;an extensive literature review by Law documents numerous supporting studies.13
The relationship between low birthweight and hypertension holds good in bothdeveloped and developing countries. Several studies have also shown that bloodpressure increases with placenta size.13,14 One explanation proposed for this isthat a larger placenta is the result of an undernourished foetus attempting toextract additional nutrients from the mother.2 The physiological and biochemical
Figure A.1 Hazard ratios for coronary heart disease associated with a standard deviation increase inbody mass index, ages 1 to 12 years8
Note: Ponderal index = weight/height3.
Figure A.2 Prevalence of type 2 diabetes, by ponderal index at birth12
Note: Ponderal index is weight/height3.
240 Dietary Guidelines for Children and Adolescents in Australia
A. THE FOETAL ORIGINS OF DISEASE HYPOTHESIS, OR BARKER HYPOTHESIS
mechanisms involved are not yet fully documented. The foetal origins hypothesisproposes that these chronic diseases develop as a result of adaptations the foetusmakes when it is undernourished. These adaptations can be cardiovascular,metabolic or endocrine, and they appear to permanently change the structureand function of the body.15 Among the specific adaptations proposed arediversion of oxygenated blood away from the trunk to the brain. There may alsobe alterations to the hormonal systems that regulate growth and maturation andalterations to body composition.
One mechanism for the association may be the way in which the hypothalamo–pituitary–adrenal axis is programmed.16 Programming of this axis is onehypothesis that can explain the link between the foetal environment anddevelopment and later disease. An excess of glucocorticoids may be associatedwith hypertension and glucose intolerance. Some animal data are available tosupport this hypothesis, and human studies have found that reduced size at birthwas associated with higher fasting 9am plasma cortisol concentrations in adults.Raised plasma cortisol concentrations were, in turn, associated with higher bloodpressure and inversely related to measures of glucose tolerance. The resultantlong-term alterations in the set-point of several major hormonal axes wouldexplain the increased prevalence of type 2 diabetes in low-birthweight infants.17
These adaptations permanently ‘re-program’ the physiology of the body.Influences on foetal programming include the mother’s body composition before,during and after pregnancy; diet during pregnancy; and postnatal nutrition andgrowth.
Although the evidence supporting the foetal origins hypothesis is strong, thereare numerous gaps and some findings are hard to explain. For example, onewould expect that the intra-uterine nutritional stress on twins would make themgood examples for the hypothesis. Yet a study in New Zealand18 shows thattwins have lower blood pressures than singletons, not the higher blood pressurethat would be expected. Similarly, if the hypothesis holds, it would be expectedthat the twins would have a higher death rate from cardiovascular disease, butthis is not the case19, although in this study the shorter of the pairs of twins didhave a higher death rate, confirming that nutrition in early life is important. Itseems likely that some additional protective mechanism operates in the case ofmultiple births. Whatever the reason, further research into multiple births mayhelp us understand the foetal origins hypothesis.
In reviewing the evidence for the foetal origins hypothesis, Terry and Susser20
acknowledge the momentum gathered by the hypothesis and pose three centralchallenges:
• refining the measure of early experience
• tracing the causal pathway that connects early experience with later health
• ruling out confounding by social class.
241
A. THE FOETAL ORIGINS OF DISEASE HYPOTHESIS, OR BARKER HYPOTHESIS
Dietary Guidelines for Children and Adolescents in Australia
The challenge now must be to discover more about the cellular and molecularmechanisms giving rise to these associations.21 But, even before the mechanismis fully understood, it is not too early to begin to apply the findings to publichealth interventions. Evaluation of appropriate interventions could actuallyexpand our knowledge of the mechanisms involved.
One interesting aspect of the foetal origins hypothesis is its ability to explaindifferences in the prevalence and timing of chronic disease epidemics indifferent countries. For some time epidemiologists have been puzzled by the‘French paradox’, whereby mortality from ischaemic heart disease in France isabout a quarter of that in Britain but the major risk factors are similar. It isthought that under-certification of ischaemic heart disease in France couldaccount for about 20 per cent of the difference and that the high consumption ofalcohol in France—and of red wine in particular—could explain a small amountof the difference. However, Barker has reviewed the development of maternalnutrition programs in the two countries and suggests that the earlier concern ofthe French with improving nutrition has protected them from this chronic diseaseepidemic.22
I M P L I C AT I O N S F O R P U B L I C H E A LT H
Because of the unproven nature of the foetal origins hypothesis, any interventionshould be conservative and not present a potential risk to the community.Nevertheless, there are at least two areas where public health nutritioninterventions could be considered:
• prenatal care—nutrition and health care programs to minimise the numberof low-birthweight babies and thin babies (ponderal index <26)
• postnatal growth—programs to avoid under-nutrition or the developmentof overweight or obesity during childhood. This would be an extension ofpresent growth monitoring at child health clinics to ensure universal care.
In Australia, low birthweight is observed more often in the babies of younger orolder mothers, first-time mothers, single mothers and Indigenous mothers.23
Cigarette smoking, alcohol consumption and the nutritional status of pregnantwomen are also factors.23
The overall proportion of low-birthweight infants in Australia is relatively low byinternational standards (see Table A.2), but there are sections of Australiansociety in which the proportion is significantly higher.
242 Dietary Guidelines for Children and Adolescents in Australia
A. THE FOETAL ORIGINS OF DISEASE HYPOTHESIS, OR BARKER HYPOTHESIS
Table A.2 Low-birthweight infants in Australia24
Year
Low-birthweightinfants 1991 1992 1993 1994 1995 1996 1997 1998
Number 16 272 16 489 16 374 16 387 16 571 16 525 16 800 16 854
Per cent of all births 6.3 6.3 6.3 6.3 6.4 6.4 6.6 6.6
Among Aboriginal Australians, 11.8 per cent of infants were below 2500 grams atbirth—almost double the national average.24 In the Northern Territory the rate forAboriginal babies was 13 per cent. It is interesting to note that in the UnitedStates the prevalence of low birthweight in black Americans is about the same asthat for Australian Aboriginal people.25
Programs to reduce the prevalence of low birthweight should be a high priority.Maternal nutrition is particularly important—not just during pregnancy but alsoprior to conception. The nutrition of girls is obviously very important, so thatthey enter adulthood in a state of nutrition that prepares them for pregnancy.
P O S T N ATA L G RO W T H A N D B R E A S T F E E D I N G
Breastfeeding is an extremely important factor in maintaining appropriate growthin infants. Infants who are breastfed have slightly lower rates of growth at 6months of age when compared with infants being fed artificial formula. Theyalso have lower rates of childhood obesity—and probably lower rates of obesitylater in life. Studies have shown that exclusive breastfeeding seems to have aprotective effect against some risk factors for cardiovascular disease in later life,including lipoprotein and glucose levels.26 This suggests that the most practicalintervention is the promotion of exclusive breastfeeding until the age of6 months. More studies are needed before the most appropriate interventions forinfants who are born with a low birthweight can be determined.
C O N C L U S I O N
The foetal origins of disease hypothesis explains many facets of the currentepidemic of chronic disease occurring around the world, but many aspects of thehypothesis need further research and substantiation before its wider acceptance.Acceptance of the hypothesis would suggest that further programs for maternal,prenatal and child nutrition should be implemented. Programs designed toachieve the goals of improved maternal and child nutrition can be justified onmany grounds, have no downside, and should therefore be promoted withoutwaiting for further evidence.
243
A. THE FOETAL ORIGINS OF DISEASE HYPOTHESIS, OR BARKER HYPOTHESIS
Dietary Guidelines for Children and Adolescents in Australia
[The material presented here is based on a paper presented to the Asia PacificAcademic Consortium for Public Health conference in Seoul, South Korea, inApril 2001. The paper is to be published in the Asia Pacific Journal of PublicHealth.]
R E F E R E N C E S
1. Barker D, Osmond C. Infant mortality, childhood nutrition, and ischaemicheart disease in England and Wales. Lancet 1986;1:1077–81.
2. Godfrey KM, Barker DJP. Fetal programming and adult health. Pub HlthNutr 2001;4(2B):611–24.
3. Robinson R. The fetal origins of adult disease. BMJ 2001;322:375–6.
4. Barker D. Mothers, babies and health in later life. Edinburgh: ChurchillLivingstone, 1998.
5. Osmond C, Barker DJ, Winter PD, Fall CH, Simmonds SJ. Early growth anddeath from cardiovascular disease in women. BMJ 1993;307:1519–24.
6. Forsén T, Eriksson JG, Tuomilehto J, Osmond C, Barker DJ. Growth inutero and during childhood among women who develop coronary heartdisease: longitudinal study. BMJ 1999;319:1403–7.
7. Eriksson JG, Forsén T, Tuomilehto J, Winter PD, Osmond C, Barker DJ.Catch-up growth in childhood and death from coronary heart disease:longitudinal study. BMJ 1999;318:427–31.
8. Eriksson JG, Forsén T, Tuomilehto J, Osmond C, Barker DJ. Early growthand coronary heart disease in later life: longitudinal study. BMJ2001;322:949–53.
9. Roseboom TJ, van der Meulen JH, Osmond C, Barker DJ, Ravelli AC,Schroeder-Tanka JM et al. Coronary heart disease after prenatal exposureto the Dutch famine, 1944–45. Heart 2000;84:595–8.
10. Barker D. The fetal origins hypothesis—where do we stand? Annals NutrMetab 2001;45(suppl. 1):123.
11. Hoy WE, Rees M, Kile E, Mathews JD, Wang Z. A new dimension to theBarker hypothesis: low birthweight and susceptibility to renal disease.Kidney International 1999;56:1072–7.
12. Lithell HO, McKeigue PM, Berglund L, Mohsen R, Lithell UB, Leon DA.Relation of size at birth to non–insulin dependent diabetes and insulinconcentrations in men aged 50–60 years. BMJ 1996;312:406–10.
13. Law C, Shiell A. Is blood pressure inversely related to birth weight? Thestrength of evidence from a systematic review of the literature. J Hypertens1996;14:935–41.
14. Law CM, Barker DJ, Bull AR, Osmond C. Maternal and fetal influences onblood pressure. Arch Dis Child 1991;66:1291–5.
244 Dietary Guidelines for Children and Adolescents in Australia
A. THE FOETAL ORIGINS OF DISEASE HYPOTHESIS, OR BARKER HYPOTHESIS
15. Barker DJP. Fetal origins of cardiovascular disease. Ann Med1999;31(suppl. 1):3–6.
16. Clark PM. Programming of the hypothalamo–pituitary–adrenal axis and thefetal origins of adult disease hypothesis. Europ J Pediat1998;157(suppl. V):S7–S10.
17. Phillips DIW. Birth weight and the future development of diabetes: areview of the evidence. Diab Care 1998;21(suppl. 2):B150–B155.
18. Williams S, Poulton R. Twins and maternal smoking: ordeals for the fetalorigins hypothesis? A cohort study. BMJ 1999;318:897.
19. Vagero D, Leon DA. Is heart disease mortality elevated in a low birthweight population? A test of the fetal origins hypothesis based on theSwedish Twins Registry. Lancet 1994;343:260–3.
20. Terry MB, Susser E. Commentary: the impact of fetal and infant exposuresalong the life course. Int J Epid 2001;30:95–6.
21. Byrne CD, Phillips DI. Fetal origins of adult disease: epidemiology andmechanisms. J Clin Path 2000;53:822–8.
22. Barker DJP. Why heart disease mortality is low in France. Commentary:intrauterine nutrition may be important. BMJ 1999;318:1471–80.
23. de Looper M, Bhatia K. Australian health trends 2001. Canberra: AustralianInstitute of Health and Welfare, 2001.
24. Nassar N, Sullivan E, Lancaster P, Day P. Australia’s mothers and babies1998. Sydney: Australian Institute of Health and Welfare, 2000.
25. Centers for Disease Control and Prevention & National Center for HealthStatistics. Low birth weight statistics from the national vital statistics system.CDC, 1998.
26. Ravelli AC, van der Meulen JH, Osmond C, Barker DJ, Bleker OP. Infantfeeding and adult glucose tolerance, lipid profile, blood pressure, andobesity. Arch Dis Child 2000;82:248–52.
Dietary Guidelines for Children and Adolescents in Australia 245
B. GROWTH, GROWTH REFERENCES AND OBESITY CUT-OFF POINTS
B G R OW T H , G R OW T H R E F E R E N C E SA N D O B E S I T Y C U T- O F F P O I N T S
C o l i n B i n n s
Weight gain and an increase in body size are integral parts of normal growth anddevelopment during childhood and adolescence. At this life stage the focus is onmaintaining a rate of physical growth that is consistent with the expected normsfor age, sex and stage of physiological maturity. Physical growth is best assessedby the conventional measures of weight, length or height, and headcircumference. Maintenance of a positive energy and nutrient balance is criticalin achieving and sustaining normal growth and development. During periods ofrapid growth, any intentional restriction of weight gain—through dieting, forexample—is usually inappropriate.
In recent years there has been increasing awareness of the importance ofperinatal nutrition in relation to the development of disease in adulthood; this isknown as the foetal origins of disease hypothesis or Barker hypothesis1—seepart A of this ‘Special considerations’ section. In addition, there is increasingevidence of the importance of growth and nutrition in relation to cognitivedevelopment.2,3 Growth during infancy also influences future bone mass.4
D E F I N I T I O N S
Growth
Growth refers to the acquisition of tissue and increase in body size.5
Development
Development refers to the increased ability of the body to function physically andintellectually. Physical and intellectual development proceed at different rates indifferent individuals.
G RO W T H
Between birth and 18 years of age, a person’s body weight increases abouttwenty-fold. During early childhood, the rate of increase in weight and length isessentially linear: the rate of increase in weight generally keeps pace with therate at which length increases. During infancy and adolescence, however, therate of growth changes rapidly over time; for example, it decelerates rapidlyduring the first year of life, while during adolescence it first accelerates over aperiod of one to three years and then decelerates rapidly until growth in height
246
B. GROWTH, GROWTH REFERENCES AND OBESITY CUT-OFF POINTS
Dietary Guidelines for Children and Adolescents in Australia
ceases at about 16 years of age in girls and 18 years in boys. Secular changes ingrowth and maturation have been well documented in many countries andAustralia is no exception. Loesch et al.6 compared the data on height and bodyweight obtained in 1992 to 1993 from 1804 Melbourne school students aged 5to17 years with historical data collected from white Australians during the last100 years. Australians have been getting taller every decade and, although theincrease in height has significantly slowed down during the last two decades, theincrease in body weight is continuing and is more pronounced in females. Thisis resulting in a continuing increase in the proportion of people who areoverweight and obese—in all age groups.
G R O W T H R E F E R E N C E S
The term growth reference refers to the data set used to compile a growth chart.In Australia, the international growth reference developed by the World HealthOrganization, which was originally based on data from the US National Centerfor Health Statistics7, was recommended by the National Health and MedicalResearch Council in 1984.8 This growth reference has been used throughoutAustralia since that time and is used in most countries of the world. This isdespite the fact that it has minor anomalies around the age of 2 years; thesearose when two separate data sets were blended.
Many studies have shown that nutritional and health status is more importantthan ethnicity in determining growth rates, allowing the use of this single WHOreference. Decision points (or ‘cut-off’ points) may, however, be defineddifferently for different purposes and perhaps for some ethnic groups. Thegrowth reference currently in use is derived from a mix of infants who werebreastfed and infants fed on infant formula. Exclusively breastfed babies maygrow at a slightly lower rate than the reference.
In Australia the US National Center for Health Statistics growth charts7 arerecommended for this purpose for all ethnic groups. The charts are included inthe personal health records produced by various organisations for use by parentsand health workers as a continuing record of a child’s health. The NCHS hassince been incorporated in the Centers for Disease Control and Prevention,which has revised the growth reference to eliminate the minor anomalies around2 years of age.9 In particular, the data used for infants have been updated andthe calculation of some percentiles has been revised.
Previously, the term growth standard was used, implying that there was aparticular growth pathway every child should follow. A growth reference impliesthat the chart will be used to monitor the individual child and not to make aproscriptive comparison. The difficulty of developing a ‘standard’ would becompounded by the secular trend just discussed and the current epidemic ofobesity. This means that the selection of any reference is somewhat arbitrary inthe absence of defined outcomes—that is, which growth channel wouldmaximise longevity and minimise morbidity. Evidence is now accumulating from
247
B. GROWTH, GROWTH REFERENCES AND OBESITY CUT-OFF POINTS
Dietary Guidelines for Children and Adolescents in Australia
the various ‘Barker hypothesis’ studies to suggest that the present reference isabout right.
The suitability of the WHO–NCHS reference values for use as an internationalstandard has been debated because many of the children on whom the valueswere based were not breastfed. In an international study, which includedAustralian children, the growth of breastfed infants was slightly below the WHO–NCHS reference. In 1993 the World Health Organization set up a working groupto develop new internationally applicable standards based on the growth ofinfants who were breastfed according to the WHO protocol.10,11 A number ofproblems were identified with the growth references developed by the NationalCenter for Health Statistics and supported by the World Health Organization:
• the predominance of formula-fed babies
• lack of representativeness and excessive homogeneity in the data for ages0–2 years
• lack of monthly measurements during early infancy—the infants andchildren were only measured every three months
• small sample sizes and lack of repeated measurements on the samechildren
• outdated curve-fitting procedures
• a length–height disjunction at 24 months. This has been eliminated in thelatest version from the Centers for Disease Control and Prevention.9
These concerns resulted in the WHO recommendation to replace the WHO–NCHS reference data and the establishment of the WHO working group. Datacollection for a new international growth reference began in 1998, and it isanticipated that the new reference will be available in 2005.12 The new referencewill be prescriptive—in contrast with the existing descriptive reference—since itwill include infants who are healthy and who have been fed in accordance withthe WHO recommendations. Preliminary studies for the new reference suggestthat, at age 12 months, infants who were exclusively breastfed to 6 months were600–650 grams lighter than artificially fed infants.13 This is the equivalent of aZ score* of –0.6 (at 12 months). This difference is the same as that foundbetween male and female infants at 12 months. Since it is more important tomonitor velocity of growth, it is uncertain whether this change will be noticeablein growth monitoring.
Dewey has also shown that the height of 12-month-old infants who wereexclusively breastfed to age 6 months is identical to that of artificially fedinfants.13 This is important because cognitive development in infants is relatedmore to height than to weight, and it reflects the protective effect ofbreastfeeding against obesity (see Chapter 1). Thus, at the age of 12 months,infants who were exclusively breastfed to 6 months will be the same height asartificially fed infants but will weigh slightly less.
* Z scores are standard deviations above or below the mean.
248
B. GROWTH, GROWTH REFERENCES AND OBESITY CUT-OFF POINTS
Dietary Guidelines for Children and Adolescents in Australia
In Australia, the growth of Aboriginal infants who are exclusively breastfedfollows the WHO–NCHS reference until 6 months of age then begins to fallaway.14,15 By the age of 12 months, the weight increase in Aboriginal infants isaround 0.5 Z scores below the reference.
Assessment of body size and growth rate
The most practical measures of nutritional status in childhood are comparisonswith reference growth charts that show the normal ranges for weight for age,height for age and weight for height, by sex. When only a single measurement ofweight and height is available, the traditional method has been to establish thepercentile of the growth reference. In some situations it is more appropriate touse the Z scores, and growth reference charts are available in both formats or acalculator is available on the internet.16,17 If weight and height are measured onseveral occasions, the measurements are most usefully interpreted by plottingthem on reference growth charts. Weight is a better indicator of acutedevelopments, while height reflects long-term nutrition.
Generally, if a child is growing normally the lines connecting the plotted valueswill proceed along or parallel to one of the percentile lines on the charts. If theplotted values show a markedly irregular pattern, this could signify a problem,although some of the measurements might have been inaccurate or the datamight have been plotted incorrectly. This possibility should always be checked atthe first opportunity. The extent to which serial data for a child can deviate froma given percentile range before concern is warranted depends on the age of thechild, the child’s position in the percentile range, the length of time for whichthe rate of growth deviates from the norm, and the coexistence of any medicalcondition. In general, the more pronounced the change in the growth rate, theyounger the child and the more extreme the percentile, the greater is theconcern.
Skinfold measurement—a measure of the amount of fat in the subcutaneouscompartment—is another index of under- or over-nutrition, although generationof reliable measurements depends to a large extent on the use of trainedoperators and calibrated instruments, and not all are reliable. DEXA (dual energyX-ray absorptiometry) and ultrasound provide the most accurate measurements,but cost limits their application to experimental use and to clinical settings wheremore accurate diagnosis is required for management. Measurement and recordingof weight and height at regular intervals remain the best way of monitoringgrowth.
Use of a growth reference in primary health care
An accurate record of growth is one of the most useful assessment tools for bothwell children and children suffering from disease.
The commonly used growth charts are prepared with a number of percentilesmarked, usually ranging from the 3rd percentile to the 97th percentile. Growth
249
B. GROWTH, GROWTH REFERENCES AND OBESITY CUT-OFF POINTS
Dietary Guidelines for Children and Adolescents in Australia
charts using Z scores are also available but are more often used in researchstudies and surveys. The 95th and 5th percentiles are approximately plus andminus 1.65 standard deviations respectively (Z scores of +1.65 and –1.65). Thevalue of a growth record is dependent not so much on the percentiles on thechart but more on accurate measurement and plotting, followed by correctinterpretation of the information and, in particular, the trends.
Scales used for weighing children must be accurate and reliable. All scales needto be continually readjusted to zero and constantly checked for any objects thatare obstructing an accurate measurement. If a towel or nappy is to be placed onthe scales, do this before the scales are set to zero. When reading the scales,always position yourself at right angles to them, to avoid parallax errors. Ideally,infants and young children should be weighed without clothing. If clothing hasto be worn, the scales should first be set to zero with an identical set of clothing,which is then removed from the scale; alternatively, a set of clothing cansubsequently be weighed and subtracted from the clothed weight. Subtraction ofan arbitrary standard weight for clothing leads to inaccuracies.
The accuracy of all scales must be checked at least daily, using a standardweight. Electronic scales are just as susceptible as mechanical ones to damageand other causes of inaccuracy and must be cared for to ensure their continuedaccuracy. If an obviously inaccurate reading is made—for example, as a result ofmovement or excess clothing—it should not be recorded.
Children less than 2 years old are usually measured while they are lying down.Between 2 and 3 years of age practices vary, and a note should be made toindicate if the child was measured lying or standing. Two adults are alwaysrequired to accurately measure the length of an infant: the infant must liestraight, and quietly, on the measuring board, with feet at a right angle, headstraight, and eyes looking straight upwards. A child or infant being measuredshould wear only minimal clothing, so that the correct position can be easilyseen. Children should be measured in a standing position only when they areable to ‘stand up straight and stand still’ long enough to be accurately measured.
Anthropometric data are of little use unless they are plotted on a growth chartfor comparison with earlier measurements from the same child or, if sequentialmeasurements are unavailable, for comparison with the growth reference. Serialmeasurements are of far more value than a ‘one-off’ measurement, and anaccurately measured and correctly plotted growth chart can be of considerableassistance in diagnosis and management. Data must be plotted for the correctgender. Make a note on the chart of any potential source of error; for example,the child was a struggler or was weighed in clothing. Check that the chart that isbeing used is based on the WHO or CDC growth reference.
A child’s percentile obviously gives an indication of the position of the childrelative to the reference population. Parental size influences a child’smeasurements, and where this is thought to be a significant factor charts ortables adjusted for the average height of both parents are available. In the caseof premature infants, allowance for their small size at birth can be made by
250
B. GROWTH, GROWTH REFERENCES AND OBESITY CUT-OFF POINTS
Dietary Guidelines for Children and Adolescents in Australia
subtracting the number of weeks of prematurity from the infant’s age beforeplotting on the growth chart. After 12 months of age it is no longer necessary toallow for prematurity.
Growth trends reveal more about a child’s nutrition or health than the position ofone measurement on the chart. A child who is on approximately the samepercentile for height and weight and who is growing at a rate parallel to the nextpercentile line is very unlikely to have a serious nutrition or chronic healthproblem. If a child’s growth percentile is changing—and particularly when it isnear or crossing the upper or lower extremes, the 10th and 90th percentiles—areason should be sought. For example, a child with a body mass index greaterthan the 85th percentile should be evaluated for risk factors associated withexcess adiposity and referred for weight management if appropriate. Similarly, atrend towards weight loss over a month or more should prompt efforts toestablish a nutritional cause or the existence of an underlying problem.
Whenever a major discrepancy from the previous measurement is found, theaccuracy of the measurement and recording should first be checked. In addition,it is important to note any difference between the weight and height percentiles.In acute nutritional problems, the weight percentile is likely to be substantiallylower than the percentile for height. Where there are endocrine deficiencies orother long-term diseases, both weight and height will be substantially depressed.
More than half of the children who are diagnosed in primary care or acommunity clinic as ‘failing to thrive’ have a relatively simple nutritionproblem—just not getting enough food to meet their needs. For example, a childmight be thought to have an allergy and be placed on a very restrictive diet, or ifthe adults in the family have been placed on a low-fat diet the child might alsobe eating the same diet. Many chronic diseases cause growth retardation; amongthem are undiagnosed renal, cardiac or metabolic problems. In the absence ofother symptoms or signs, however, it is usually appropriate to embark on a trialof improved nutrition rather than proceeding immediately to furtherinvestigation. Referral to a specialist clinic for investigation of growth hormonedeficiency is only necessary if a child is consistently below the third percentileand no other disease is present.
C L A S S I F I C AT I O N O F O V E RW E I G H T A N D O B E S I T Y I N C H I L D R E N A N D
A D O L E S C E N T S
Overweight and obesity are serious health problems in Australia and otherwestern countries: obesity, defined as a condition in which excess fat hasaccumulated to the extent that health may be impaired18, accounted for over4 per cent of the total burden of disease in Australia in 1996.19 Overweight andobesity are delineated at arbitrary points along a continuum of increasing risk ofadverse health outcomes with increasing levels of fatness.20 A recent reportfound that 19–23 per cent of Australian children are either overweight or obese.21
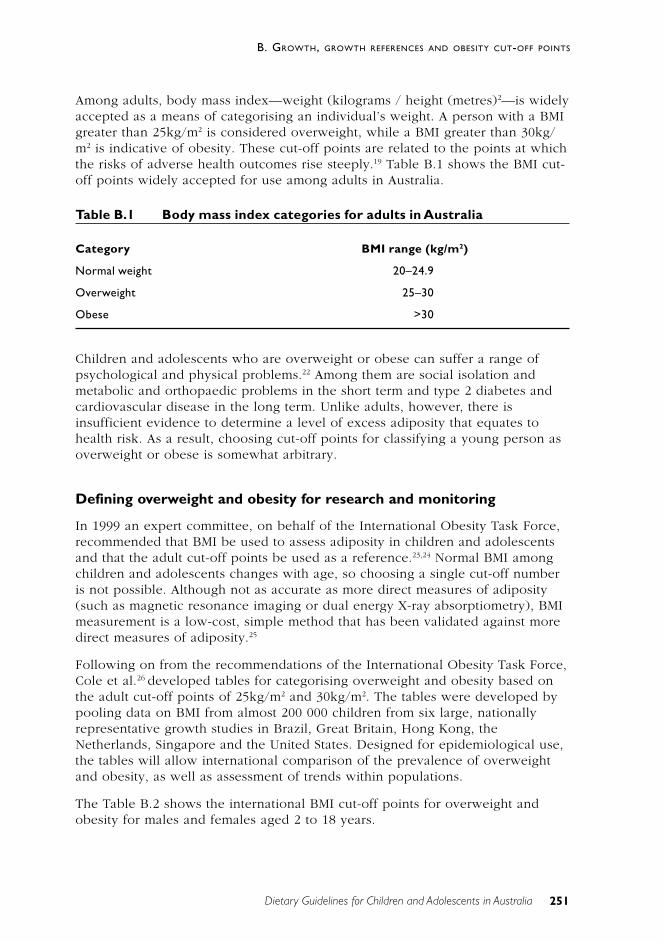
251
B. GROWTH, GROWTH REFERENCES AND OBESITY CUT-OFF POINTS
Dietary Guidelines for Children and Adolescents in Australia
Among adults, body mass index—weight (kilograms / height (metres)2—is widelyaccepted as a means of categorising an individual’s weight. A person with a BMIgreater than 25kg/m2 is considered overweight, while a BMI greater than 30kg/m2 is indicative of obesity. These cut-off points are related to the points at whichthe risks of adverse health outcomes rise steeply.19 Table B.1 shows the BMI cut-off points widely accepted for use among adults in Australia.
Table B.1 Body mass index categories for adults in Australia
Category BMI range (kg/m2)
Normal weight 20–24.9
Overweight 25–30
Obese >30
Children and adolescents who are overweight or obese can suffer a range ofpsychological and physical problems.22 Among them are social isolation andmetabolic and orthopaedic problems in the short term and type 2 diabetes andcardiovascular disease in the long term. Unlike adults, however, there isinsufficient evidence to determine a level of excess adiposity that equates tohealth risk. As a result, choosing cut-off points for classifying a young person asoverweight or obese is somewhat arbitrary.
Defining overweight and obesity for research and monitoring
In 1999 an expert committee, on behalf of the International Obesity Task Force,recommended that BMI be used to assess adiposity in children and adolescentsand that the adult cut-off points be used as a reference.23,24 Normal BMI amongchildren and adolescents changes with age, so choosing a single cut-off numberis not possible. Although not as accurate as more direct measures of adiposity(such as magnetic resonance imaging or dual energy X-ray absorptiometry), BMImeasurement is a low-cost, simple method that has been validated against moredirect measures of adiposity.25
Following on from the recommendations of the International Obesity Task Force,Cole et al.26 developed tables for categorising overweight and obesity based onthe adult cut-off points of 25kg/m2 and 30kg/m2. The tables were developed bypooling data on BMI from almost 200 000 children from six large, nationallyrepresentative growth studies in Brazil, Great Britain, Hong Kong, theNetherlands, Singapore and the United States. Designed for epidemiological use,the tables will allow international comparison of the prevalence of overweightand obesity, as well as assessment of trends within populations.
The Table B.2 shows the international BMI cut-off points for overweight andobesity for males and females aged 2 to 18 years.
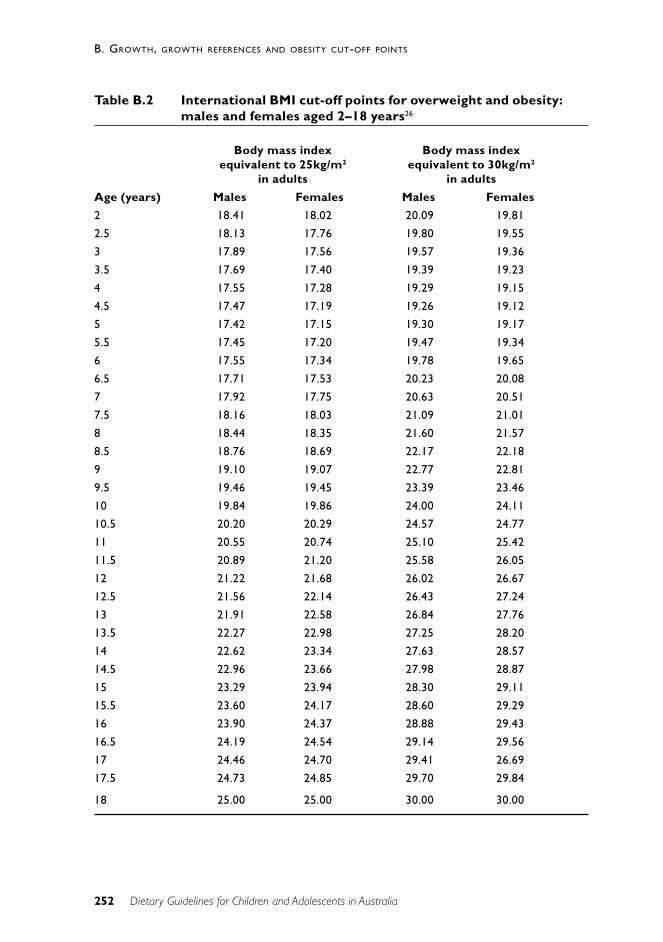
252
B. GROWTH, GROWTH REFERENCES AND OBESITY CUT-OFF POINTS
Dietary Guidelines for Children and Adolescents in Australia
Table B.2 International BMI cut-off points for overweight and obesity:males and females aged 2–18 years26
Body mass index Body mass indexequivalent to 25kg/m2 equivalent to 30kg/m2
in adults in adults
Age (years) Males Females Males Females
2 18.41 18.02 20.09 19.81
2.5 18.13 17.76 19.80 19.55
3 17.89 17.56 19.57 19.36
3.5 17.69 17.40 19.39 19.23
4 17.55 17.28 19.29 19.15
4.5 17.47 17.19 19.26 19.12
5 17.42 17.15 19.30 19.17
5.5 17.45 17.20 19.47 19.34
6 17.55 17.34 19.78 19.65
6.5 17.71 17.53 20.23 20.08
7 17.92 17.75 20.63 20.51
7.5 18.16 18.03 21.09 21.01
8 18.44 18.35 21.60 21.57
8.5 18.76 18.69 22.17 22.18
9 19.10 19.07 22.77 22.81
9.5 19.46 19.45 23.39 23.46
10 19.84 19.86 24.00 24.11
10.5 20.20 20.29 24.57 24.77
11 20.55 20.74 25.10 25.42
11.5 20.89 21.20 25.58 26.05
12 21.22 21.68 26.02 26.67
12.5 21.56 22.14 26.43 27.24
13 21.91 22.58 26.84 27.76
13.5 22.27 22.98 27.25 28.20
14 22.62 23.34 27.63 28.57
14.5 22.96 23.66 27.98 28.87
15 23.29 23.94 28.30 29.11
15.5 23.60 24.17 28.60 29.29
16 23.90 24.37 28.88 29.43
16.5 24.19 24.54 29.14 29.56
17 24.46 24.70 29.41 26.69
17.5 24.73 24.85 29.70 29.84
18 25.00 25.00 30.00 30.00
253
B. GROWTH, GROWTH REFERENCES AND OBESITY CUT-OFF POINTS
Dietary Guidelines for Children and Adolescents in Australia
Defining overweight and obesity in individuals
Cole et al.26 also developed a method of categorising overweight and obesity inpopulation and clinical research, but it is not suitable for use in clinical practice.For clinical practice, the use of a BMI-for-age chart is more suitable since anindividual can be described in terms of a percentile—for example, above the85th percentile—and their progress plotted on a chart that forms part of theclinical record. An individual with a BMI above the 85th percentile is consideredoverweight, while a BMI above the 95th percentile is indicative of obesity.27
Nevertheless, although they are useful in clinical practice, BMI-for-age charts dohave some weaknesses. First, the choice of cut-off points to classify overweightand obesity is arbitrary, without evidence of an association with adverse healthoutcomes. Second, the charts must be derived from a reference population.Australia does not at present have growth reference charts derived from the localpopulation, so a reference from another population must be used. The choice ofa suitable reference population is also somewhat arbitrary. Importantly, BMI-for-age reference charts should be derived from the same population as that used forother widely used growth references such as weight-for-age and head-circumference charts. The new Centers for Disease Control and Prevention BMI-for-age charts, developed in the United States, would meet these criteria.
Ideally, child and adolescent overweight and obesity would be defined in termsof the risks of adverse health outcomes. Those data are not currently available,and further research to identify the appropriate cut-off points should be apriority.
Further considerations
Abdominal obesity
Another important factor is the distribution of body fat. Evidence is emerging thatchildren with excess abdominal fat may be at increased risk of a constellation ofrisk factors such as hyperlipidaemia, hypertension and hyperinsulinaemia, knowncollectively as metabolic syndrome.28
Abdominal fat is measured most accurately using magnetic resonance imaging orDEXA, but both of these techniques are expensive and available only in tertiaryreferral centres. The most practical measure is waist circumference, which hasbeen validated against more direct techniques.29 At present there are no acceptedwaist-circumference cut-off points with which to characterise an individual’s riskof health problems associated with excess abdominal fat. It is, however, a usefulmeasurement, in addition to BMI, as part of serial measurements to monitorprogress in an individual.
254
B. GROWTH, GROWTH REFERENCES AND OBESITY CUT-OFF POINTS
Dietary Guidelines for Children and Adolescents in Australia
Ethnicity
Among adults there are ethnic variations in the level of excess adiposity thatprompts an increase in health risk.20 For example, an Asian person may have agreater proportion of fat than a Caucasian person with the same BMI. TheInternational Obesity Task Force has suggested that 27.5kg/m2 might be asuitable cut-off point for obesity in Asian populations. Further research is neededto determine whether these differences also apply to young people.
Conclusion
Body mass index is the most practical method of assessing adiposity in childrenand adolescents, with waist circumference providing a measure of abdominal fat.For population and clinical research, the table developed by Cole et al.26 shouldbe used to categorise young people as normal weight, overweight or obese. Inclinical practice and non–health care settings, BMI-for-age charts such as thosedeveloped by the Centers for Disease Control and Prevention should be used todescribe an individual in terms of a percentile. Although the cut-off points arearbitrary, a person with a BMI above the 85th percentile would be consideredoverweight, while an individual with a BMI above the 95th percentile would beconsidered obese. When determining a young person’s weight status, ethnicityshould be taken into consideration and further assessment recommended asappropriate.
R E F E R E N C E S
1. Forsen T, Eriksson J, Tuomilehto J, Osmond C, Barker D. Growth in uteroand during childhood among women who develop coronary heart disease:longitudinal study. BMJ 1999;319(27 Nov):1403–7.
2. Makrides M. Early childhood nutrition and cognitive outcome. Proc NutrSoc Aust 1998;22:216–22.
3. Richards M, Hardy R, Kuh D, Wadsworth MEJ. Birth weight and cognitivefunction in the British 1946 birth cohort: longitudinal population basedstudy. BMJ 2001;322:199–203.
4. Cooper C, Fall C, Egger P, Hobbs R. Growth in infancy and bone mass inlater life. Ann Rheum Dis 1997;56:17–21.
5. Network of the Federal/Provincial/Territorial Group on Nutrition &National Institute of Nutrition. Promoting nutritional health during thepreschool years: Canadian guidelines. 1989.
6. Loesch DZ, Stokes K, Huggins RM. Secular trend in body height andweight of Australian children and adolescents. Am J Phys Anthrop2000;111:545–56.
255
B. GROWTH, GROWTH REFERENCES AND OBESITY CUT-OFF POINTS
Dietary Guidelines for Children and Adolescents in Australia
7. Hamill PVV, Drizd TA, Johnson CL, Reed RB, Roche AF, Moore WM.Physical growth: National Center for Health Statistics percentiles. Am J ClinNutr 1979;32:607–29.
8. Binns CW. Assessment of growth and nutritional status. J Food Nutr1985;42:119–26.
9. Centers for Disease Control and Prevention. CDC growth charts: UnitedStates. Advance data. No. 314. 2000;314.
10. Dewey KG, Peerson JM, Brown KH, Krebs NF, Michaelsen KF, Persson LAet al. Growth of breast-fed infants deviates from current reference data: apooled analysis of US, Canadian and European data sets. Pediatrics1995;96:495–503.
11. WHO Working Group on the Growth Reference Protocol. WHO WorkingGroup on the Growth Reference Protocol and WHO Task Force onMethods for the Natural Regulation of Fertility Growth Patterns ofBreastfed Infants in Seven Countries. Acta Paediatr 2000;89(2):215–22.
12. de Onis M, Blossner M. The WHO global database on child growth andmalnutrition. In: International Colloqium on Promoting Growth andDevelopment of Under Fives. Antwerp, 2001.
13. Dewey K. Nutrition, growth and completmentary feeding of the breastfedinfant. Ped Clin Nutr Amer 2001;48(1):87–104.
14. Binns CW. Infant feeding and growth. In: Ulijaszek SJ, Johnston FE, PreeceMA, eds. Cambridge encyclopedia of human growth and development.Cambridge: Cambridge University Press; 1998:320–9.
15. Smith RM, Smith PA, McKinnon M, Gracey M. Birthweights and growth ofinfants in five Aboriginal communities. ANZ J Publ Hlth 2000;24:124–35.
16. WHO Working Group. Use and interpretation of anthropometric indicatorsof nutritional status. Bull WHO 1986;64:929–41.
17. Dibley MJ, Goldsby JB, Staehling NW, Trowbridge FL. Development ofnormalized curves for the international growth reference: historical andtechnical considerations. Am J Clin Nutr 1987;46:736–48.
18. World Health Organization. Obesity: preventing and managing the globalepidemic. Report of a WHO consultation on obesity. Geneva: WHO, 1997.
19. Australian Institute of Health and Welfare. Australia’s health 2000.Canberra: AIHW, 2000.
20. International Obesity Task Force. The Asia–Pacific perspective: redefiningobesity and its treatment. Health Communications Australia, 2000.
21. Booth ML, Wake M, Armstrong T, Chey T, Hesketh K, Mathur S. Theepidemiology of overweight and obesity among Australian children andadolescents, 1995–97. ANZ J Pub Hlth 2001;25(2):162–9.
22. Must A, Strauss RS. Risks and consequences of childhood and adolescentobesity. Int J Obes 1999;23(suppl. 2):S2–S11.
256
B. GROWTH, GROWTH REFERENCES AND OBESITY CUT-OFF POINTS
Dietary Guidelines for Children and Adolescents in Australia
23. Himes JH, Dietz WH. Guidelines for overweight in adolescent preventativeservices: recommendations from an expert committee. Am J Clin Nutr1994;59:307–16.
24. Bellizzi MC, Dietz WH. Workshop on childhood obesity: summary of thediscussion. Am J Clin Nutr 1999;70:173S–175S.
25. Pietrobelli A, Faith MS, Allison DB, Gallagher D, Chiumello G, HeymsfieldSB. Body mass index as a measure of adiposity among children andadolescents: a validation study. J Pediatr 1998;132:204–10.
26. Cole TJ, Bellizi MC, Flegal KM, Dietz WH. Establishing a standarddefinition for child overweight and obesity worldwide: internationalsurvey. BMJ 2000;320:1240–3.
27. Dietz WH, Bellizi MC. Introduction: the use of body mass index to assessobesity in children. American Journal of Clinical Nutrition1999;70(suppl.):123S–125S.
28. Goran MI. Metabolic precursors and effects of obesity in children: a decadeof progress, 1990–1999. Am J Clin Nutr 2001;73:158–71.
29. Taylor RW, Jones IE, Williams SM, Goulding A. Evaluation of waistcircumference, waist-to-hip ratio, and the conicity index as screening toolsfor high trunk fat mass, as measured by dual-energy X-ray absorptiometry.Am J Clin Nutr 2000;72:490–5.
Dietary Guidelines for Children and Adolescents in Australia 257
C. THE NUTRITION OF ABORIGINAL AND TORRES STRAIT ISLANDER PEOPLES
C T H E N U T R I T I O N O F A B O R I G I N A L A N DT O R R E S S T R A I T I S L A N D E R P E O P L E S
A m a n d a L e e
C U R R E N T H E A LT H A N D N U T R I T I O N A L S TAT U S
Aboriginal and Torres Strait Islander peoples continue to suffer a much greaterburden of ill-health—particularly nutrition-related chronic disease—comparedwith other Australians.11–3 In 1998 death rates among Indigenous Australians wereat least three times greater than those for the total Australian population, andIndigenous people’s life expectancy was around 20 years less.2 Much of this poorhealth can be attributed to poor nutrition.1
The prevalence of many nutrition-related conditions—such as type 2 diabetes,cardiovascular disease, renal disease, poor dental health, iron deficiencyanaemia, and some forms of cancer—is disproportionately high amongIndigenous Australians. Overweight and obesity tend to underpin thedevelopment of many of these conditions4,5 , which are discussed in detail inNutrition in Aboriginal and Torres Strait Islander Peoples: an information paper1
(pp. 25–34 and 143–79) and The Health and Welfare of Australia’s Aboriginaland Torres Strait Islander Peoples.2
The potential intergenerational effects of poor health and nutritional status havebeen well described.6–9 Low birthweight, failure to thrive and inappropriate childgrowth are serious concerns in Indigenous Australian communities.1,10–12 Diabetesin pregnancy also has potential intergenerational effects13,14 and is an additionalconcern.
Good maternal nutrition and healthy infant and childhood growth arefundamental to the achievement and maintenance of health throughout the lifecycle.12 Factors associated with maternal and infant health and childhood growthand nutrition are well documented in Nutrition in Aboriginal and Torres StraitIslander Peoples1 (pp. 83–140).
High Indigenous infant mortality rates have been reported throughout Australia.1,2
Several studies have indicated that infection—especially of the gastrointestinaland respiratory tracts—associated with malnutrition and growth retardation was,and continues to be, the most common cause of death in children, particularlybefore the age of two.1
Low Aboriginal birthweights have been documented, ranging from a prevalenceof less than 7 per cent in Victoria to over 20 per cent in parts of northernAustralia.1 Several causal factors are implicated: maternal ill-health andmalnutrition are significant determinants.15 Although the birthweight distributionfor Aboriginal and Torres Strait Islander infants is similar to that for non-Indigenous infants, the infant mortality rate is 2.5 times higher.16
258
C. THE NUTRITION OF ABORIGINAL AND TORRES STRAIT ISLANDER PEOPLES
Dietary Guidelines for Children and Adolescents in Australia
Growth retardation among Aboriginal infants after the age of four to six monthshas consistently been noted.1 Relatively poor growth has also been shown topersist in older children, although overweight and obesity are becomingincreasing concerns, particularly among Torres Strait Islanders.1
National breastfeeding data for Indigenous Australians are limited.1,17 The 1995National Health Survey found that Indigenous mothers breastfed for longer thannon-Indigenous mothers.2 The 1994 National Aboriginal and Torres Strait IslanderSurvey confirmed that Indigenous mothers of higher socio-economic status weremore likely to breastfeed and to do so for longer than Indigenous mothers fromlower socio-economic groups, but that Indigenous babies in rural areas weremore likely to be breastfed for longer than six months compared with those inurban areas.12,18 One small study in Melbourne found that, although 98 per centof Indigenous mothers initiated breastfeeding, only 50 per cent and 32 per centwere still breastfeeding at three and six months respectively.19
The nutritional and immunological effects of prolonged breastfeeding areparticularly important in communities with a high prevalence of infectiousdiseases. However, introduction of appropriate solids at around six months isessential to ensure appropriate growth and development.1
Vitamin and mineral status has been measured infrequently in Indigenouspopulations, but there have been some studies in a variety of groups andenvironments.1 Samples have generally been small and have often been selectedfrom vulnerable groups in the community—infants and pregnant andbreastfeeding women. Quantitative comparison of the prevalence of vitamindeficiencies may be misleading since varying methods and ‘normal’ ranges havebeen used in these studies. Multiple deficiencies have frequently been describedin the same subject, suggesting the generally poor nutritional status of suchindividuals, rather than a specific micro-nutrient problem. In particular, vitaminstatus (in relation to ascorbic acid, folate and beta-carotene) consistent with thevery low contemporary dietary intakes of fruit and vegetables have often beendescribed.20
S O C I A L D E T E R M I N A N T S O F I N D I G E N O U S A U S T R A L I A N S ’ H E A LT H
A range of social determinants underpin the poor nutritional health status ofIndigenous Australians. Among them are poverty; disrupted family andcommunity cohesion; social marginalisation; stress; lower levels of education;unemployment; lack of control over circumstances; inadequate and overcrowdedhousing; inadequate sanitation, water supplies and hygiene; limited access totransport; and discrimination.2,21–26 The broader social environment affectingIndigenous Australians and their health status is well documented in the draft ofthe National Aboriginal and Torres Strait Islander Health Strategy.21
Cultural factors can have both positive and negative influences on health andnutritional status. The relationship between social environment and poor healthoperates in both directions: poor health can increase the risks of deprivationthrough stigma and reduced earning capacity.27
259
C. THE NUTRITION OF ABORIGINAL AND TORRES STRAIT ISLANDER PEOPLES
Dietary Guidelines for Children and Adolescents in Australia
Indigenous Australians now make up 2.1 per cent of Australia’s population.2
Compared with the Australian population as a whole, Indigenous Australians areyounger (a median age of 20.1 years compared with 34.0 years), live mainly insouth-eastern Australia, are less likely to have post-school education (11 per centcompared with 31 per cent), have higher unemployment rates (23 per centcompared with 9 per cent), have a lower financial income (for men, an averageweekly income of $189 compared with $415; for women, $190 compared with$224), and are less likely to own homes (31 per cent compared with 71 percent).2,28 In addition, Aboriginal and Torres Strait Islander Australians are morelikely to live outside metropolitan areas than other Australians: 32 per cent ofIndigenous Australians live in rural areas containing less than 1000 people,whereas only 15 per cent of non-Indigenous Australians do.29 All Australiansliving in non-metropolitan areas experience higher mortality rates than those inmetropolitan areas—15 per cent higher for men and 9 per cent higher for womenin 1996.30 The higher morbidity and mortality rates observed for rural areas areprobably related more to limited occupational and educational opportunities, andthe effect of this on income, than any special attributes of the physicalenvironment. Poor access to medical services and limited lifestyle options areadditional factors.22
Many other social, economic, geographical, environmental and infrastructuralissues and factors influence food choices and nutrition in Indigenous groups;these are discussed in detail in Nutrition in Aboriginal and Torres Strait IslanderPeoples1 (pp. 51–66). Examples are inadequate housing and food storage andpreparation facilities.
In particular, people in rural and remote areas pay up to 50 per cent more forbasic healthy foods than people living in urban and metropolitan areas.31–35 Arecent Queensland study has assessed this disparity in terms of remoteness andaccessibility, as measured by the Accessibility/Remoteness Index of Australia.36
In contrast to expectations, the price of fruit and vegetables was less affected byremoteness/accessibility than other food groups; the prices of meat and meatalternatives and dairy foods were the most affected.37 The cost of tobacco andtakeaway food items was less affected by remoteness/accessibility than otheritems. Basic food items were less available in the more remote stores, as werefresh vegetables and fruits and better nutritional choices.37
Among the factors contributing to the higher costs of foods in rural and remoteareas are increased transport costs, high store overheads (including capital costsof building and maintaining long-term storage facilities and high accountancycosts) and greater wastage of stock.38 Commitment and partnership across arange of sectors are necessary if the factors contributing to the high costs andlimited supply of nutritious foods in rural and remote regions are to betackled.1,37
260
C. THE NUTRITION OF ABORIGINAL AND TORRES STRAIT ISLANDER PEOPLES
Dietary Guidelines for Children and Adolescents in Australia
H E A LT H A S P E C T S O F T R A D I T I O N A L D I E T S A N D L I F E S T Y L E S
All the available evidence suggests that, traditionally, Indigenous Australian werefit and healthy.20,35,39–42
Traditional dietary intakes and associated lifestyles have been reviewed in detailrecently and are summarised in the following paragraphs. Additional informationabout food collection, preparation, storage and distribution is also available inNutrition in Aboriginal and Torres Strait Islander Peoples.1
The available information suggests that the traditional diet was generally low inenergy density but high in nutrient density—high in protein, low in sugars, highin complex carbohydrate of low glycaemic index, and high in micro-nutrients.Even though the traditional Aboriginal diet contained a high proportion of animalfoods, it would have been low in total fat, extremely low in saturated fat, andrelatively high in polyunsaturated fatty acids (including the long-chain highlypolyunsaturated fatty acids of the omega-3 and omega-6 families) and henceprotective against cardiovascular disease and related conditions.
The composition of most traditional vegetable foods is typical of that ofuncultivated plants worldwide—high in fibre and relatively high in protein, witha generally low energy density.43 The carbohydrate in most traditional plantfoods is of low glycaemic index, producing lower glucose and insulin levels thansimilar western foods, and may be protective against diabetes.44
Although some animal foods—such as witchetty grubs (Cossidae spp.) and greenants (Oecophylla smaragdina)—have a relatively high fat content, most nativeland animals are very lean.43 Traditional meat foods have a much lower carcassfat content and intramuscular lipid content than meat from domesticated animalssuch as cattle and sheep.40 Most carcass fat is stored in discrete ‘depots’ withinthe abdomen; these fat depots tend to be small and were traditionally shared bymany people. However, marine animals such as turtle and dugong tend to behigh in fat.43,45 Chewing the bones of land and marine animals1 would haveprovided calcium.
Energy expenditure was high. Several accounts highlight the labour-intensivenature of collecting and preparing traditional foods.46–48 Food procurement andpreparation by Aboriginal hunter–gatherers were energy-intensive processes thatcould involve sustained physical activity for many hours—for example, walkinglong distances; digging for tubers, reptiles, eggs, honey ants and witchetty grubs;chopping with a stone axe; winnowing and grinding seeds; digging pits forcooking large animals; and gathering wood for fires.20,41
261
C. THE NUTRITION OF ABORIGINAL AND TORRES STRAIT ISLANDER PEOPLES
Dietary Guidelines for Children and Adolescents in Australia
Children were traditionally breastfed until they were about 3 years old, the ageof weaning depending on the arrival of another sibling. Solids were notintroduced until teeth erupted.11,49 Responsibility for feeding tended to rest withthe child, who was expected to express a desire for food and was fed ondemand; older children had priority over the feeding of infants.11
Traditional Aboriginal diet and food preferences
Until European occupation, Aboriginal people successfully pursued a hunter–gatherer lifestyle across widely different geographical and climatic conditions.Survival depended on an intimate knowledge of the land, sources of water, andthe seasonal cycle’s effects on plant foods and game.1
The traditional diet was characterised by diversity, and most early observersdescribe a varied and ample range of both animal and plant foods, even in dryregions. On a day-to-day basis, both the quantity and the quality of the foodintake varied greatly; the usual pattern of subsistence was supplemented by‘feasts’ when large game animals had been successfully hunted.
The most prized components of the Aboriginal hunter–gatherer diet were therelatively few energy-dense foods, such as depot fat and organ meats. Amongother favoured foods were those with a high fat content—for example, witchettygrubs and marine mammals. Traditional diets were generally low in sugars,although sweetness was highly valued and provided by honey ants (Melophorusinflatus), the honey of the native bee, blossoms (for example, Grevillea spp.),lerp (a secretion from the insect Psylla, which lives on the leaves of eucalypts)and gums.20,41,50
Traditional Torres Strait Islander diet and food preferences
Torres Strait Islanders were marine hunters, but they cultivated garden foods andgathered wild foods to varying degrees, depending on the local habitat.51 Somegarden foods were stored and preserved. Turtle and dugong occupied aparticular place in Torres Strait Islanders’ cultural life; the fat content of theseanimals was considered a principal indicator of meat quality, and the fat itselfwas particularly prized.52
C O N T E M P O R A RY D I E T
The process of acculturation from a traditional to a contemporary diet andlifestyle—including the effects of social, political and environmental factors—hasbeen described in detail.1,20 With the transition from a traditional hunter–gatherlifestyle to a settled westernised existence, Aboriginal and Torres Strait Islanderpeople’s diet has generally changed from a varied, nutrient-dense diet to anenergy-dense diet that is high in fat and refined sugars (see Table C.1).
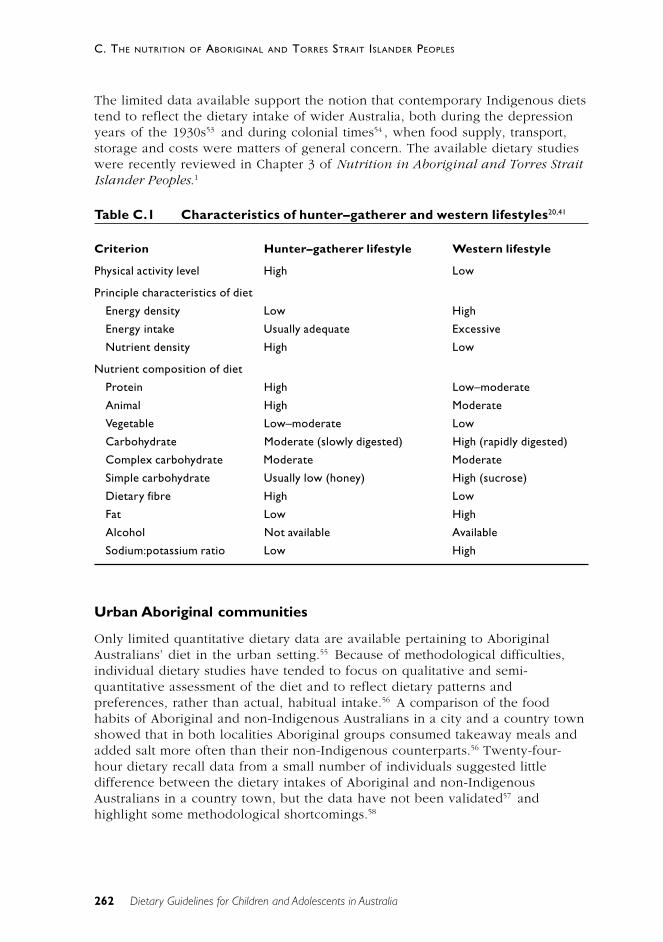
262
C. THE NUTRITION OF ABORIGINAL AND TORRES STRAIT ISLANDER PEOPLES
Dietary Guidelines for Children and Adolescents in Australia
The limited data available support the notion that contemporary Indigenous dietstend to reflect the dietary intake of wider Australia, both during the depressionyears of the 1930s53 and during colonial times54 , when food supply, transport,storage and costs were matters of general concern. The available dietary studieswere recently reviewed in Chapter 3 of Nutrition in Aboriginal and Torres StraitIslander Peoples.1
Table C.1 Characteristics of hunter–gatherer and western lifestyles20,41
Criterion Hunter–gatherer lifestyle Western lifestyle
Physical activity level High Low
Principle characteristics of diet
Energy density Low High
Energy intake Usually adequate Excessive
Nutrient density High Low
Nutrient composition of diet
Protein High Low–moderate
Animal High Moderate
Vegetable Low–moderate Low
Carbohydrate Moderate (slowly digested) High (rapidly digested)
Complex carbohydrate Moderate Moderate
Simple carbohydrate Usually low (honey) High (sucrose)
Dietary fibre High Low
Fat Low High
Alcohol Not available Available
Sodium:potassium ratio Low High
Urban Aboriginal communities
Only limited quantitative dietary data are available pertaining to AboriginalAustralians’ diet in the urban setting.55 Because of methodological difficulties,individual dietary studies have tended to focus on qualitative and semi-quantitative assessment of the diet and to reflect dietary patterns andpreferences, rather than actual, habitual intake.56 A comparison of the foodhabits of Aboriginal and non-Indigenous Australians in a city and a country townshowed that in both localities Aboriginal groups consumed takeaway meals andadded salt more often than their non-Indigenous counterparts.56 Twenty-four-hour dietary recall data from a small number of individuals suggested littledifference between the dietary intakes of Aboriginal and non-IndigenousAustralians in a country town, but the data have not been validated57 andhighlight some methodological shortcomings.58
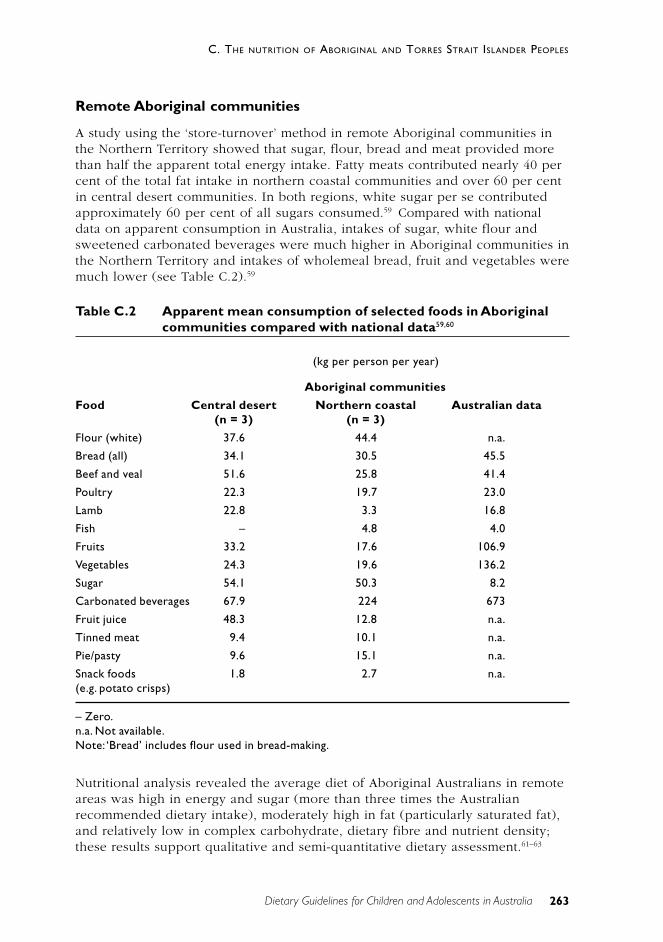
263
C. THE NUTRITION OF ABORIGINAL AND TORRES STRAIT ISLANDER PEOPLES
Dietary Guidelines for Children and Adolescents in Australia
Remote Aboriginal communities
A study using the ‘store-turnover’ method in remote Aboriginal communities inthe Northern Territory showed that sugar, flour, bread and meat provided morethan half the apparent total energy intake. Fatty meats contributed nearly 40 percent of the total fat intake in northern coastal communities and over 60 per centin central desert communities. In both regions, white sugar per se contributedapproximately 60 per cent of all sugars consumed.59 Compared with nationaldata on apparent consumption in Australia, intakes of sugar, white flour andsweetened carbonated beverages were much higher in Aboriginal communities inthe Northern Territory and intakes of wholemeal bread, fruit and vegetables weremuch lower (see Table C.2).59
Table C.2 Apparent mean consumption of selected foods in Aboriginalcommunities compared with national data59,60
(kg per person per year)
Aboriginal communities
Food Central desert Northern coastal Australian data(n = 3) (n = 3)
Flour (white) 37.6 44.4 n.a.
Bread (all) 34.1 30.5 45.5
Beef and veal 51.6 25.8 41.4
Poultry 22.3 19.7 23.0
Lamb 22.8 3.3 16.8
Fish – 4.8 4.0
Fruits 33.2 17.6 106.9
Vegetables 24.3 19.6 136.2
Sugar 54.1 50.3 8.2
Carbonated beverages 67.9 224 673
Fruit juice 48.3 12.8 n.a.
Tinned meat 9.4 10.1 n.a.
Pie/pasty 9.6 15.1 n.a.
Snack foods 1.8 2.7 n.a.(e.g. potato crisps)
– Zero.n.a. Not available.Note: ‘Bread’ includes flour used in bread-making.
Nutritional analysis revealed the average diet of Aboriginal Australians in remoteareas was high in energy and sugar (more than three times the Australianrecommended dietary intake), moderately high in fat (particularly saturated fat),and relatively low in complex carbohydrate, dietary fibre and nutrient density;these results support qualitative and semi-quantitative dietary assessment.61–63
264
C. THE NUTRITION OF ABORIGINAL AND TORRES STRAIT ISLANDER PEOPLES
Dietary Guidelines for Children and Adolescents in Australia
Intakes of calcium and zinc and of some vitamins (vitamin B2, vitamin E, beta-
carotene and folic acid) appear low64 ; these results have been confirmed bysubsequent studies in different communities.65–67
In contrast, very low energy intakes were described in one anthropological studyin remote Aboriginal outstation communities in north-east Arnhem Land.68 Theenergy intake of all subjects was approximately 50 per cent of the Australianrecommended dietary intake, and the vitamin C, magnesium and calcium intakeswere low, as was retinol activity. Where traditional bushfoods (predominantly ofanimal origin) were consumed, zinc and iron intakes were higher and iron intakewas equal to or above the recommended intake. Low intakes of fruit andvegetables were also described in this study.68
Dietary intake has been shown to vary in close association with the income cyclein remote Aboriginal communities.62 Meat and vegetables (mainly as stew) andfruits were included in the diet after pay day but were usually absent for at leastseveral days before the next pay day. A staple diet of bread or damper has oftenbeen described.62,69
Even in remote traditionally oriented outstations, foods bought at the storeaccounted for most of the energy intake, while traditional bush foods providedthe greatest proportion of protein intake.48,70 ,71 All the available studies show thatflour, sugar, sweets and fats provided much of the energy intake from store-bought foods. Animal foods—particularly those high in fat, such as lizard—provided most of the energy from the bush. In general, dietary patterns in thesesmall outstation communities are meat-oriented.
Torres Strait communities
In Torres Strait communities—and also in a few other island communities, suchas the Tiwi community—marine foods continue to make substantial contributionsto the diet. Men, women and children are involved in different aspects ofgleaning, fishing and hunting. Torres Strait Islanders living on three outer islandswere estimated to consume between 191 and 450 grams per person per day ofseafood (including turtle and dugong), which is considerably more than theJapanese seafood intake (102 grams per person per day).45 Concerns have,however, been raised about the heavy metal content in the organ meat ofdugong, and particularly turtle, and the potentially negative effects of this onhealth.72 Production of traditional garden staples continues to be important forsome ceremonial purposes.31
A study using the store-turnover method59 was undertaken in a small islandcommunity in Torres Strait. More than half the energy in the diet was found tocome from white flour, white rice, tinned meat and vegetable oil. The amount offruit and vegetables available through the store was low: the fruit available perperson was about one-sixth of the recommended amount and vegetables aboutone-third. People who depended on store foods would thus not be able to meettheir needs for vitamins A, C and E and folic acid.31
265
C. THE NUTRITION OF ABORIGINAL AND TORRES STRAIT ISLANDER PEOPLES
Dietary Guidelines for Children and Adolescents in Australia
C O N T E M P O R A RY U S E O F T R A D I T I O N A L F O O D S
It had been suggested that in the short term, after establishment of ‘new’settlements or outstations, there may be an increase in yields of traditional foodsdue to high initial availability and the use of western technology.62,71,73 In someareas introduced feral animals such as rabbits and buffalo have also beenpopular.71,74 But the longer term effect appears to be a reduction in theavailability of traditional foods for several reasons, among them the following:
• environmental degradation caused by stock and feral animals
• introduction of exotic plant species
• the increasing incidence of hot, destructive bush fires as result of poorland-management practices
• restricted access to some areas of land
• depletion of resources and population pressure around permanentsettlements
• high costs associated with the acquisition and maintenance of equipment,firearms, vehicles and fuel
• changing demographic patterns
• cultural loss from generation to generation.75 ,76
Contrary to some expectations, except for during some seasons in very remoteareas48,68,70,71 the actual dietary intake of traditional foods has been found to berelatively low where it has been measured on mainland Australia.69,77 Bush foodscontribute only a small proportion of nutrients in many areas.64 A study of anorthern coastal Aboriginal community found that an average of less than 15 percent of the population sought traditional foods on at least three days a fortnightthroughout the year. It was estimated that the proportion of total energy intakederived from bush foods averaged over the population would be less than 8 percent during the dry season and less than half this during the peak of the wetseason.77
In the 1994 National Aboriginal and Torres Strait Islander Survey 10 per cent ofrespondents aged over 14 years reported spending more than one hour a weekhunting or foraging for traditional foods and, of these, more than half reportedspending more than five hours a week doing so.18 The rate of return for thiseffort is, however, unknown. Even though the actual intake of traditional foods islow, traditional foods are still popular and culturally important for Aboriginal andTorres Strait Islander peoples.31,78
T H E N AT I O N A L A B O R I G I N A L A N D T O R R E S S T R A I T I S L A N D E R
N U T R I T I O N S T R AT E G Y A N D A C T I O N P L A N
The National Aboriginal and Torres Strait Islander Nutrition Strategy and ActionPlan, NATSINSAP, provides a framework for national action to bring about animprovement in the nutritional status of Aboriginal and Torres Strait Islander
266
C. THE NUTRITION OF ABORIGINAL AND TORRES STRAIT ISLANDER PEOPLES
Dietary Guidelines for Children and Adolescents in Australia
peoples.12 It was developed following wide-ranging consultations by a workinggroup (with broad Indigenous representation) as a key component of Eat WellAustralia.79 The seven primary action areas in the plan are:
• food supply in remote and rural communities
• food security and socio-economic status
• family-focused nutrition promotion, involving resourcing programs,communicating and disseminating ‘good practice’
• nutrition in urban areas
• the environment and household infrastructure
• the Aboriginal and Torres Strait Islander nutrition workforce
• national food and nutrition information systems.12
D I E TA RY G U I D E L I N E S F O R A U S T R A L I A ’ S I N D I G E N O U S P E O P L E S
The Dietary Guidelines for Australian Adults; the Dietary Guidelines for Childrenand Adolescents in Australia, incorporating the Infant Feeding Guidelines forHealth Workers; and the Dietary Guidelines for Older Australians are pertinent toIndigenous Australians. Two other recommendations are, however, alsoimportant:
• Choose store foods that are most like traditional bush foods.
• Enjoy traditional bush foods whenever possible.
Rationale
Indigenous people can select nutritious food by choosing those store foods thatare most like traditional bush foods—for example, fresh plant foods, wholegraincereal foods, seafoods, and lean meat and poultry. With the exception of thedairy food group, this approach is consistent with the general Australian dietaryguidelines
All the available evidence suggests that, in terms of health and wellbeing,Indigenous Australians would benefit from closer adherence to the generalAustralian dietary guidelines.12,64,66,80–84 In particular, increased consumption ofvegetables and fruits could be expected to improve the health and nutritionalstatus of this population group. Lactose intolerance after the age of 3 to 5 yearsmay, however, be problematic in some areas or individuals85 ,86 and may affectconsumption of lactose-containing dairy foods. Alternative calcium sources suchas low-lactose dairy foods (matured cheese, yoghurt), chewing meat and fishbones, and consumption of small, soft fish bones (for example, in tinned salmon)are recommended in these cases.
Consumption of traditional bush foods should also be supported whereverpossible, although this may be a nutritional issue where high-fat marine animalfoods are hunted in large numbers using modern procurement and distributionmethods.45 In addition, there may be a problem with high levels of heavy metals
267
C. THE NUTRITION OF ABORIGINAL AND TORRES STRAIT ISLANDER PEOPLES
Dietary Guidelines for Children and Adolescents in Australia
in the organ meat of turtle and dugong.72 Several other environmental factorsmight also need to be considered within the framework of sustainability.
It is particularly important to encourage and support breastfeeding, to ensurethat children and adolescents receive sufficient nutritious food to grow anddevelop normally, and to ensure that the growth of young children is checkedregularly.
Where non-Indigenous Australians have sufficient understanding of thetraditional Indigenous food supply, the additional Indigenous guidelines mayalso be useful in a wider context.
R E F E R E N C E S
1. National Health and Medical Research Council. Nutrition in Aboriginal andTorres Strait Islander peoples: an information paper. Canberra: NHMRC,2000.
2. Australian Bureau of Statistics & Australian Institute of Health and Welfare.The health and welfare of Australia’s Aboriginal and Torres Strait Islanderpeoples. ABS cat. no. 4704.0. Canberra: ABS, 1999.
3. McClelland A, Pirkis J, Willcox S. Enough to make you sick: how income andenvironment affect health. Melbourne: National Health Strategy Unit, 1992.
4. Jung RT. Obesity as a disease. Br Med Bull 1997;53:307–21.
5. O’Dea K. Body fat distribution and health outcome in AustralianAborigines. Proc Nut Soc Aust 1987;12:56–65.
6. Barker DJ. Fetal origins of cardiovascular disease. Ann Med1999;31(suppl. 1):3–6.
7. Barker D. The fetal origins of type 2 diabetes mellitus. Ann Int Med1999;130:322–3.
8. Barker D. Mothers and babies and health in later life. 2nd edn. Edinburgh:Churchill Livingstone, 1998.
9. Wadsworth M. Early life. In: Marmot M, Wilkinson R, eds. Socialdeterminants of health. New York: Oxford University Press, 1999.
10. Ruben AR, Walker AC. Malnutrition among rural Aboriginal children in theTop End of the Northern Territory. Med J Aust 1995;162:400–3.
11. Hamilton A. Nature and nurture. Canberra: Australian Institute ofAboriginal Studies, 1981.
12. Strategic Inter-Governmental Nutrition Alliance. National Aboriginal andTorres Strait Islander Nutrition Strategy and Action Plan 2000–2010.Canberra: National Public Health Partnership, 2001.
268
C. THE NUTRITION OF ABORIGINAL AND TORRES STRAIT ISLANDER PEOPLES
Dietary Guidelines for Children and Adolescents in Australia
13. Pettitt DJ, Aleck KA, Baird HR, Carraher MJ, Bennett PH, Knowler WC.Congenital susceptibility to NIDDM: role of the intrauterine environment.Diabetes 1988;37(5):622–8.
14. Silverman BL, Metzger BE, Cho NH, Loeb CA. Impaired glucose tolerancein adolescent offspring of diabetic mothers: relationship to fetalhyperinsulinism. Diab Care 1995;18(5):611–17.
15. Sayers S, Powers J. Risk factors for Aboriginal low birthweight, intrauterinegrowth retardation and preterm birth in the Darwin Health Region. Aust NZJ Publ Hlth 1997;21:524–30.
16. Coory M. Is birthweight an appropriate outcome measure for Torres StraitIslander babies? Aust NZ J Publ Hlth 2000;24:60–3.
17. Engeler T, McDonald M, Miller M, Groos A, Black M, Leonard D. Review ofcurrent interventions and identification of best practice currently used bycommunity based Aboriginal and Torres Strait Islander health serviceproviders in promoting and supporting breast feeding and appropriateinfant nutrition, Canberra: Office for Aboriginal and Torres Strait IslanderHealth Services, 1998.
18. Australian Bureau of Statistics. National Aboriginal and Torres StraitIslander Survey, 1994: health of Indigenous Australians. Cat. no. 4395.0.Canberra: ABS, 1996.
19. Holmes W, Thorpe L, Phillips J. Influences on infant-feeding beliefs andpractices in an urban Aboriginal community. Aust NZ J Publ Hlth1990;21:504–10.
20. Lee A. Transition of Australian Aboriginal diet and nutritional health. WldRev Nutr Diet 1996;79:1–52.
21. National Aboriginal and Torres Strait Islander Health Council. The NationalAboriginal and Torres Strait Islander Health Strategy, Draft for discussion.Canberra: NATSIHC, 2001.
22. Queensland Health. Social determinants of health: the role of public healthservices. Brisbane: Queensland Health, 2001.
23. McClelland A, Scotton R. Poverty and health. In: Fincher R,Niewwenhuysen J, eds. Australian poverty—then and now. Melbourne:Melbourne University Press, 1998.
24. National Health and Medical Research Council. Promoting the health ofIndigenous Australians: a review of infrastructure support for Aboriginaland Torres Strait Islander health advancement. Canberra: NHMRC, 1997.
25. Altman J, Hunter B. Indigenous poverty. In: Fincher R, Nieuwenhuysen J,eds. Australian poverty—then and now. Melbourne: Melbourne UniversityPress, 1998.
26. Glover J, Woollacott T. A social health atlas of Australia. Vol. 1. SouthAustralia. 2nd edn. Adelaide: Public Health Information DevelopmentUnit, University of Adelaide, 1999.
269
C. THE NUTRITION OF ABORIGINAL AND TORRES STRAIT ISLANDER PEOPLES
Dietary Guidelines for Children and Adolescents in Australia
27. Marmot M. Introduction. In: Marmot M, Wilkinson R, eds. Socialdeterminants of health. New York: Oxford University Press, 1999.
28. Australian Bureau of Statistics. Australia now. Aboriginal and Torres StraitIslander Australians: a statistical profile from the 1996 Census. Cat. no.1301.0. Canberra: ABS, 2000.
29. Humphreys J, Mathews-Cowey S, Rolley, F. Health service frameworks forsmall rural and remote communities: issues and options. Armidale, NSW:Department of Geography and Planning, University of New England, 1996.
30. Australian Institute of Health and Welfare. Australia’s health. Canberra:AIHW, 1996.
31. Leonard D, Beilin R, Moran M. Which way kaikai blo umi? Food andnutrition in the Torres Strait. Aust J Publ Hlth 1995;19:589–95.
32. Beaumont S. Tasmanian Food Price, Availability and Quality Survey.Hobart: Community Nutrition Unit, Tasmanian Department of Communityand Health Services, 1998.
33. Bowcock R. 1998 Kimberley Market Basket Survey. Derby: KimberleyPublic Health, 1999.
34. Price R, McComb J, Grieve H, Graham E. Surveys of food availability,quality and price in rural and remote communities of the Alice Springs andBarkly district: April and May 1998. Darwin: Northern Territory HealthServices, 1998.
35. Sullivan H, Gracey M, Hevron V. Food costs and nutrition of Aborigines inremote areas of northern Australia. Med J Aust 1987;147:334–7.
36. Department of Health and Aged Care & University of Adelaide. Measuringremoteness: Accessibility/Remoteness Index of Australia. Adelaide:University of Adelaide, 1999.
37. Queensland Health. The Healthy Food Access Basket Survey 2000. Brisbane:Public Health Services, Queensland Health, 2001.
38. McMillan S. Food and nutrition policy issues in remote Aboriginalcommunities: lessons from Arnhem Land. Aust J Publ Hlth 1991;15:281–5.
39. Coyne T, Darnton-Hill I. Australian Aborigines’ nutrition and changingdisease patterns. New Doctor 1979;12:32–7.
40. Naughton J, O’Dea K, Sinclair A. Animal foods in traditional Aboriginaldiets: polyunsaturated and low in fat. Lipids 1986;21:684–90.
41. O’Dea K. Traditional diet and food preferences of Australian Aboriginalhunter–gatherers. Phil Trans Roy Soc Lond. Series B. Biol Sci 1991;334:233–41.
42. Needeniya J, Smith A, Carter P. Food supply in rural South Australia: asurvey on food cost, quality and variety. Adelaide: Department of HumanServices, 2000.
270
C. THE NUTRITION OF ABORIGINAL AND TORRES STRAIT ISLANDER PEOPLES
Dietary Guidelines for Children and Adolescents in Australia
43. Brand Miller JC, James KW, Maggiore PMA. Tables of composition ofAustralian Aboriginal foods. Canberra: Aboriginal Studies Press, 1993.
44. Brand Miller JC, Holt SHA. Australian Aboriginal plant foods: aconsideration of their nutritional composition and health implications. NutRes Rev 1998;11:5–23.
45. Johannes R, Macfarlane J. Traditional fishing in the Torres Strait Islands.Hobart: CSIRO Division of Fisheries, 1991.
46. Spencer B, Gillen F. The native tribes of central Australia. London:Macmillan, 1899.
47. Tindale NB. Aboriginal tribes of Australia. Canberra: Australian NationalUniversity Press, 1974.
48. Devitt J. Contemporary Aboriginal women and subsistence in remote, aridAustralia. PhD thesis. Brisbane: Department of Anthropology andSociology, University of Queensland, 1988.
49. McArthur M. Food consumption and dietary levels of the Aborigines at thesettlements. In: Mountford C, ed. Records of the American–Australianscientific expedition to Arnhem Land. Vol. 2. Anthropology and nutrition.Melbourne: Melbourne University Press, 1960.
50. Devitt J. Traditional Aboriginal preferences in a changed context. CentralAustralian Rural Practitioners’ Association Newsletter 1991;14:38–41.
51. Beckett, J. Torres Strait Islanders’ custom and colonialism, Cambridge, UK:Cambridge University Press, 1987:26–9.
52. Nietschmann B, Nietschmann J. Good dugong, bad dugong; bad turtle,good turtle. Natural History 1981;90(5):54.
53. Australian Bureau of Statistics. Apparent consumption of foodstuffs andnutrients, Australia, 1998–99. Cat. no. 4306.0. Canberra: ABS, 2000.
54. Walker RB, Roberts DCK. Colonial food habits. In: Truswell AS, WahlqvistML, eds. Food habits in Australia. Proceedings of first Deakin/SydneyUniversities symposium on Australian nutrition, Melbourne: DeakinUniversity, 1988:40–59.
55. Butlin A, Cashel K, Lee A, Taylor V. Food and nutrition programs forAboriginal and Torres Strait Islander peoples. Canberra: Office forAboriginal and Torres Strait Islander Health Services, 1997.
56. Guest CS, O’Dea K. Diabetes in Aborigines and other Australianpopulations. Aust J Publ Hlth 1992;16:340–9.
57. Sibthorpe B. All our people are dying: diet and stress in an urbanAboriginal Community. PhD thesis. Canberra: Australian NationalUniversity, 1988.
58. Lee A, Smith A, Bryce S. Measuring dietary intake in remote AustralianAboriginal communities. Ecol Food Nutr 1995;34:19–31.
271
C. THE NUTRITION OF ABORIGINAL AND TORRES STRAIT ISLANDER PEOPLES
Dietary Guidelines for Children and Adolescents in Australia
59. Lee A, O’Dea K, Mathews J. Apparent dietary intake in remote Aboriginalcommunities. Aust J Publ Hlth 1994;18:190–7.
60. Australian Bureau of Statistics. Apparent consumption of foodstuffs andnutrients, Australia, 1985–86. Canberra: ABS, 1987.
61. Hitchcock NE, Gracey M. Dietary patterns in a rural Aboriginal communityin south-west Australia. Med J Aust 1975;2(suppl.):12–16.
62. Cutter T. Nutrition and food habits of the central Australian Aboriginal. In:Hetzel BS, Frith HJ, eds. The nutrition of Aborigines in relation to theecosystem of central Australia. Melbourne: CSIRO, 1978:63–72.
63. Coles-Rutishauser IHE. Growing up in Western Australia: if you areAboriginal. Proc Nut Soc Aust 1979;4:27–32.
64. Lee A, Bailey A, Yarmirr D, O’Dea K, Mathews JD. Survival tucker:improved diet and health indicators in an Aboriginal community. Aust JPubl Hlth 1994;18(3):277–85.
65. McDermott R, Rowley K, Lee A, Knight S, O’Dea K. Increase in prevalenceof obesity and diabetes and decrease in plasma cholesterol in a centralAustralian Aboriginal community. Med J Aust 2000;175:480–4.
66. Zakrevsky E, Binns C, Gracey M. Aboriginal Community FoodstoresProject: assessment of nutritional status. Perth: Health Department ofWestern Australia, 1996.
67. Gault A. Health survey, Urapuntja Health Service. Alice Springs: Institute ofAboriginal Development, 1986.
68. Maggiore PM. Analysis and interpretation of food record data from remoteAboriginal communities. Proc Nut Soc Aust 1990;15:220–3.
69. King R, Smith R, Spargo R. Dietary patterns of Aboriginal children in theKimberley. Proc Nut Soc Aust 1985;10:173.
70. Meehan B. Shell bed to shell midden. Canberra: Australian Institute ofAboriginal Studies, 1982.
71. Altman J. Hunter–gatherers today: an Aboriginal economy in northAustralia. Canberra: Australian Institute of Aboriginal Studies, 1987.
72. Haynes D, Michalek-Wagner K, Kwan D. Trace metal concentrations inTorres Strait green turtle (Chelonia mydas) tissues, 1997–1998. Reportprepared for the Torres Strait Regional Authority, 2001.
73. Sinclair AJ, Mann NJ, Kelly J. Kangaroo meat for human consumption. ProcNut Soc Aust 1997;21:52–7.
74. Calaby J. Man, fauna and climate in Aboriginal Australia. In: Mulvaney DJ,Golson J, eds. Aboriginal man and environment. Canberra: AustralianNational University Press, 1971:80–93.
272
C. THE NUTRITION OF ABORIGINAL AND TORRES STRAIT ISLANDER PEOPLES
Dietary Guidelines for Children and Adolescents in Australia
75. Peterson N. The traditional pattern of subsistence to 1975. In: Hetzel BS,Frith HJ, eds. The nutrition of Aborigines in relation to the ecosystem ofcentral Australia. Melbourne: CSIRO, 1978:25–35.
76. Cane S, Stanley O. Land use and resources in desert homelands. Canberra:Northern Australia Research Unit, Australian National University, 1985.
77. Lee A. Survival tucker: Aboriginal dietary intake and a successfulcommunity-based nutrition intervention project. PhD Thesis, Sydney:University of Sydney, 1992.
78. Rae C, Lamprell V, Lion R, Rae AM. The role of bushfoods in contemporaryAboriginal diets. Proc Nut Soc Aust 1982;7:45–9.
79. Strategic Inter-Governmental Nutrition Alliance. Eat Well Australia: anagenda for action for public health nutrition, 2000–2010, Canberra:National Public Health Partnership, 2001.
80. Queensland Health. Queensland Aboriginal and Torres Strait Islander Foodand Nutrition Strategy: Indigenous Health Program and NutritionProgram. Brisbane: Australian Centre for International and Tropical Healthand Nutrition, University of Queensland, 1995.
81. O’Dea K. Marked improvement in carbohydrate and lipid metabolism indiabetic Australian Aborigines after temporary reversion to traditionallifestyle. Diabetes 1984;33:596–603.
82. Weeramanthri T, Edmond K. Northern Territory Preventable ChronicDisease Strategy—the evidence base. Darwin: Northern Territory HealthServices, 1999.
83. White GA, Rowley KG, Daniel M, Skinner K, O’Dea K. Effectiveness of acommunity directed healthy lifestyle program in a remote AustralianAboriginal community. Aust NZ J Publ Hlth 2000;24:136–44.
84. O’Dea K, White NG, Sinclair AJ. An investigation of nutrition-related riskfactors in an isolated Aboriginal community in northern Australia: advantagesof a traditionally-orientated lifestyle. Med J Aust 1988;148:177–80.
85. Brand JC, Darnton-Hill I, Gracey MS, Spargo RM. Lactose malabsorption inAustralian Aboriginal children. Am J Clin Nutr 1985;41(3):620–2.
86. Buttenshaw R, Sheridan J, Tye V, Miller O, Carseldine J. Battistuta D et al.Lactose malabsorption and its temporal stability in Aboriginal children.Proc Nut Soc Aust 1990;15:228.
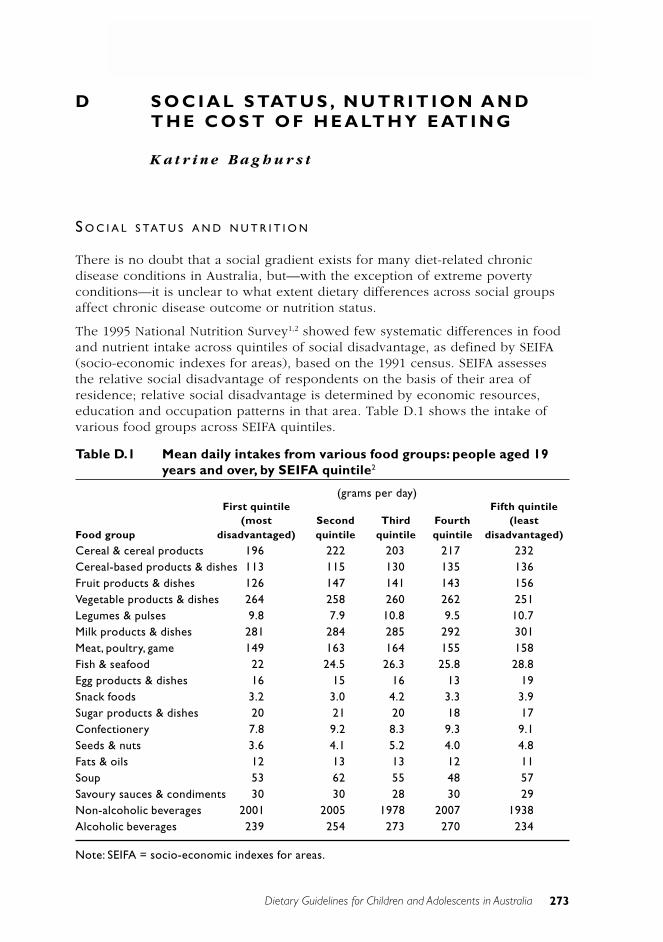
Dietary Guidelines for Children and Adolescents in Australia 273
D. SOCIAL STATUS, NUTRITION AND THE COST OF HEALTHY EATING
D S O C I A L S TAT U S , N U T R I T I O N A N DT H E C O S T O F H E A LT H Y E AT I N G
K a t r i n e B a g h u r s t
S O C I A L S TAT U S A N D N U T R I T I O N
There is no doubt that a social gradient exists for many diet-related chronicdisease conditions in Australia, but—with the exception of extreme povertyconditions—it is unclear to what extent dietary differences across social groupsaffect chronic disease outcome or nutrition status.
The 1995 National Nutrition Survey1,2 showed few systematic differences in foodand nutrient intake across quintiles of social disadvantage, as defined by SEIFA(socio-economic indexes for areas), based on the 1991 census. SEIFA assessesthe relative social disadvantage of respondents on the basis of their area ofresidence; relative social disadvantage is determined by economic resources,education and occupation patterns in that area. Table D.1 shows the intake ofvarious food groups across SEIFA quintiles.
Table D.1 Mean daily intakes from various food groups: people aged 19years and over, by SEIFA quintile2
(grams per day)First quintile Fifth quintile
(most Second Third Fourth (leastFood group disadvantaged) quintile quintile quintile disadvantaged)
Cereal & cereal products 196 222 203 217 232Cereal-based products & dishes 113 115 130 135 136Fruit products & dishes 126 147 141 143 156Vegetable products & dishes 264 258 260 262 251Legumes & pulses 9.8 7.9 10.8 9.5 10.7Milk products & dishes 281 284 285 292 301Meat, poultry, game 149 163 164 155 158Fish & seafood 22 24.5 26.3 25.8 28.8Egg products & dishes 16 15 16 13 19Snack foods 3.2 3.0 4.2 3.3 3.9Sugar products & dishes 20 21 20 18 17Confectionery 7.8 9.2 8.3 9.3 9.1Seeds & nuts 3.6 4.1 5.2 4.0 4.8Fats & oils 12 13 13 12 11Soup 53 62 55 48 57Savoury sauces & condiments 30 30 28 30 29Non-alcoholic beverages 2001 2005 1978 2007 1938Alcoholic beverages 239 254 273 270 234
Note: SEIFA = socio-economic indexes for areas.
274
D. SOCIAL STATUS, NUTRITION AND THE COST OF HEALTHY EATING
Dietary Guidelines for Children and Adolescents in Australia
The findings can be summarised thus for the major food groups:
• Consumption of cereals and cereal-based foods (for example, rice, pastaand breads) was somewhat lower in the most disadvantaged group and themiddle group compared with all other groups. Consumption of cereal-based products and dishes (for example, cakes and biscuits) was about20 per cent lower in the two most disadvantaged groups compared withthe other three.
• Consumption of fruit and fruit products was lower (10–20 per cent) in themost disadvantaged group compared with the other four groups, butvegetable and legume consumption showed no consistent trend across thegroups.
• Consumption of milk and milk products increased slightly with socialadvantage—about a 10 per cent increase across the groups.
• Consumption of meat, poultry and game was slightly higher in the middlequintiles; fish and seafood consumption gradually increased with socialadvantage.
An assessment of energy and nutrient intakes across the SEIFA quintiles (seeTable D.2) showed that energy intake increased with social advantage, as didintakes of most nutrients. However, when correcting for energy differencesacross groups, few differences were apparent in dietary quality, defined asnutrient intake per unit energy. It is unclear from the published data whetherother factors, such as the age profile, differed across the quintiles ofdisadvantage and how much variation in factors such as age (which are knownto influence total food intake) might account for the differences that wereapparent (for example, in total energy intake). Physical activity may also varyacross quintiles.
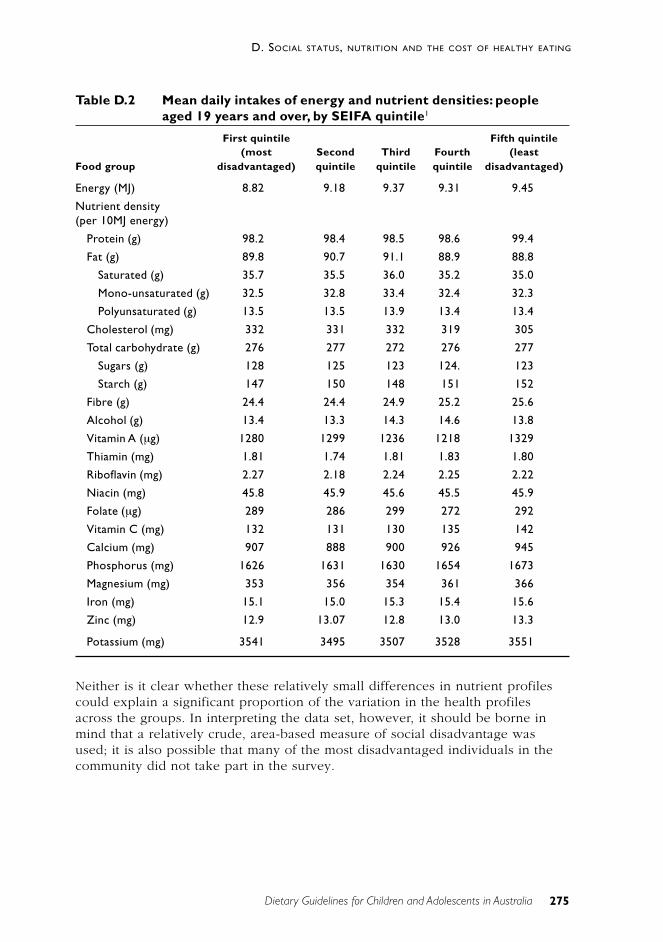
275
D. SOCIAL STATUS, NUTRITION AND THE COST OF HEALTHY EATING
Dietary Guidelines for Children and Adolescents in Australia
Table D.2 Mean daily intakes of energy and nutrient densities: peopleaged 19 years and over, by SEIFA quintile1
First quintile Fifth quintile(most Second Third Fourth (least
Food group disadvantaged) quintile quintile quintile disadvantaged)
Energy (MJ) 8.82 9.18 9.37 9.31 9.45
Nutrient density(per 10MJ energy)
Protein (g) 98.2 98.4 98.5 98.6 99.4
Fat (g) 89.8 90.7 91.1 88.9 88.8
Saturated (g) 35.7 35.5 36.0 35.2 35.0
Mono-unsaturated (g) 32.5 32.8 33.4 32.4 32.3
Polyunsaturated (g) 13.5 13.5 13.9 13.4 13.4
Cholesterol (mg) 332 331 332 319 305
Total carbohydrate (g) 276 277 272 276 277
Sugars (g) 128 125 123 124. 123
Starch (g) 147 150 148 151 152
Fibre (g) 24.4 24.4 24.9 25.2 25.6
Alcohol (g) 13.4 13.3 14.3 14.6 13.8
Vitamin A (µg) 1280 1299 1236 1218 1329
Thiamin (mg) 1.81 1.74 1.81 1.83 1.80
Riboflavin (mg) 2.27 2.18 2.24 2.25 2.22
Niacin (mg) 45.8 45.9 45.6 45.5 45.9
Folate (µg) 289 286 299 272 292
Vitamin C (mg) 132 131 130 135 142
Calcium (mg) 907 888 900 926 945
Phosphorus (mg) 1626 1631 1630 1654 1673
Magnesium (mg) 353 356 354 361 366
Iron (mg) 15.1 15.0 15.3 15.4 15.6
Zinc (mg) 12.9 13.07 12.8 13.0 13.3
Potassium (mg) 3541 3495 3507 3528 3551
Neither is it clear whether these relatively small differences in nutrient profilescould explain a significant proportion of the variation in the health profilesacross the groups. In interpreting the data set, however, it should be borne inmind that a relatively crude, area-based measure of social disadvantage wasused; it is also possible that many of the most disadvantaged individuals in thecommunity did not take part in the survey.
276
D. SOCIAL STATUS, NUTRITION AND THE COST OF HEALTHY EATING
Dietary Guidelines for Children and Adolescents in Australia
T H E C O S T O F H E A LT H Y E AT I N G
In recent years most countries in the western world have developed dietaryguidelines and recommendations similar to those outlined in this Australiandocument. The aim is to improve health and nutritional status and help preventchronic diseases such as coronary heart disease, certain cancers, hypertensionand diabetes. If, however, the changes encouraged by these guidelines arefinancially costly, there will be groups, including some low-income families, inthe community that are unable or unwilling to make these adjustments.
Although there is widespread speculation about the expense of healthy, or‘healthful’, eating, few cost analyses of healthful diets have been reported. Onestudy, in the United Kingdom, compared the cost of one-day diets that did anddid not conform to the British dietary guidelines and found that following theguidelines was in fact potentially more expensive.3 In Australia, Santich lookedat the eating patterns recommended in various federal government nutritioneducation publications and concluded that the changes recommended may notbe financially realistic for low-income families.4 However, this conclusion wasbased on an analysis of specific recipes given in the pamphlets and on thesubstitution models for healthful eating used in the education materials—forexample, using lean minced beef instead of fattier versions and using wholegrainbreads instead of white bread. Using a qualitative sociological analysis, Crowleyhas also suggested that the ‘cost’ of a diet that follows the dietary guidelines ispotentially higher compared with the cost of the average Australian diet.5 Hisanalysis included factors outside the direct financial cost of food as purchased,such as access and transportation.
In the early 1990s McAllister et al.6 undertook an analysis, based on Australiandata, to determine whether it was necessarily more directly financially costly tofollow a healthful diet in Australia (see Table D.3). Three different approacheswere used: a substitution approach; a relative costing of individual diets that arein line with the dietary guidelines; and an analysis of the cost of eatingaccording to a healthy eating plan, the 12345+ Nutrition Plan developed by theCSIRO.7 This healthy eating plan was highly flexible; it was designed to producediets conforming to both the existing Australian dietary guidelines and therecommended dietary intakes for people with varying energy needs and/orspecial nutrient needs (for example, during pregnancy, lactation andadolescence) and from a variety of cultural backgrounds.
The cost of 229 foods and drinks used in the analysis was determined byassessing prices in four major supermarkets and other food outlets such astakeaway stores when necessary. The food outlets used for pricing were locatedin a suburban area of Adelaide where there is a large concentration of low-income families.8 In each supermarket, for each food or drink the cheapestbranded item (that is, bearing the manufacturer’s brand name) was recorded,together with the price of the equivalent generic item (that is, without themanufacturer’s brand name but commonly associated with a particular retailer).
277
D. SOCIAL STATUS, NUTRITION AND THE COST OF HEALTHY EATING
Dietary Guidelines for Children and Adolescents in Australia
An analysis of the potential cost of direct substitution of healthful food choicesfor less healthful ones (for example, product-by-product substitution through theuse of fat, fibre or salt-modified alternatives) showed that this approach wouldresult in a more costly diet while providing limited nutritional improvement atthe population level. Pricing of self-selected diets of people who currentlycomply with the dietary guidelines and targets for healthful eating showed thatthese people are paying more per megajoule. In contrast, costing of diets thatconformed to a new healthful eating plan—designed to produce eating patternsthat meet both the dietary goals set for components of the food supply (such asdietary fat, refined sugars and fibre) and the recommended daily intakes forenergy, protein, vitamins and minerals—showed that healthful eating need notbe more expensive and, indeed, for most people would bring cost savings.
In summary, this study showed that healthful eating is not necessarily moreexpensive but that restructuring the diet, rather than using a direct-substitutionapproach, is the more cost effective strategy. Education programs that stress thisrestructuring approach and its cost advantages are therefore more likely to besuccessful in promoting an affordable and effective healthful alternative forpeople with limited financial means.
Unfortunately, it is generally easier for people to understand and adopt asubstitution approach rather than to basically restructure their diets. They alsoreceive encouragement to adopt the substitution approach—not only from foodmanufacturers, who, understandably, wish to promote specific healthfulproducts, but also from much of the educational literature produced by healthprofessionals.
The study just described was designed to look only at the potential financialcosts of healthful eating. It showed that the theoretical cost savings associatedwith healthier diets would be similar across all social groups in Australia. Butthere are obviously other factors that could make a healthful diet more difficultto achieve—such as the ready availability of healthful foods, skills, facilities,time, taste factors and motivation. And these factors might vary across social,educational and income groups. This has been discussed by Santich4 andCrowley5, but the data available are limited and further investigation would bevaluable, especially with respect to low-income groups in the community. Theseissues do, however, need to be dealt with in implementing the dietary guidelinesin socially disadvantaged groups and will be addressed in the implementationplan for the dietary guidelines.
Table D.3 summarises the financial costs of healthy eating, as determined in the1989 Australian Bureau of Statistics Household Expenditure Survey, the 1990Victorian and South Australian surveys, and the CSIRO’s 12345+ Nutrition Plan.
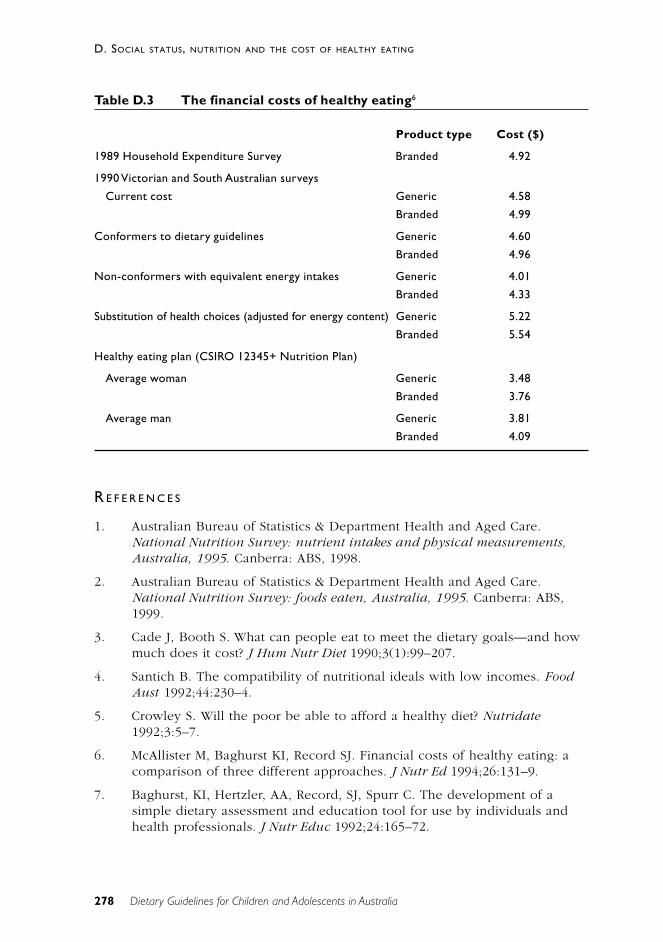
278
D. SOCIAL STATUS, NUTRITION AND THE COST OF HEALTHY EATING
Dietary Guidelines for Children and Adolescents in Australia
Table D.3 The financial costs of healthy eating6
Product type Cost ($)
1989 Household Expenditure Survey Branded 4.92
1990 Victorian and South Australian surveys
Current cost Generic 4.58
Branded 4.99
Conformers to dietary guidelines Generic 4.60
Branded 4.96
Non-conformers with equivalent energy intakes Generic 4.01
Branded 4.33
Substitution of health choices (adjusted for energy content) Generic 5.22
Branded 5.54
Healthy eating plan (CSIRO 12345+ Nutrition Plan)
Average woman Generic 3.48
Branded 3.76
Average man Generic 3.81
Branded 4.09
R E F E R E N C E S
1. Australian Bureau of Statistics & Department Health and Aged Care.National Nutrition Survey: nutrient intakes and physical measurements,Australia, 1995. Canberra: ABS, 1998.
2. Australian Bureau of Statistics & Department Health and Aged Care.National Nutrition Survey: foods eaten, Australia, 1995. Canberra: ABS,1999.
3. Cade J, Booth S. What can people eat to meet the dietary goals—and howmuch does it cost? J Hum Nutr Diet 1990;3(1):99–207.
4. Santich B. The compatibility of nutritional ideals with low incomes. FoodAust 1992;44:230–4.
5. Crowley S. Will the poor be able to afford a healthy diet? Nutridate1992;3:5–7.
6. McAllister M, Baghurst KI, Record SJ. Financial costs of healthy eating: acomparison of three different approaches. J Nutr Ed 1994;26:131–9.
7. Baghurst, KI, Hertzler, AA, Record, SJ, Spurr C. The development of asimple dietary assessment and education tool for use by individuals andhealth professionals. J Nutr Educ 1992;24:165–72.
Dietary Guidelines for Children and Adolescents in Australia 279
E. DIETARY GUIDELINES AND THE SUSTAINABILITY OF FOOD SYSTEMS
E D I E TA RY G U I D E L I N E S A N D T H ES U S TA I N A B I L I T Y O F F O O D S YS T E M S
M a l c o l m R i l e y
Sustainable development is relevant to dietary guidelines because the productionand consumption of food is a fundamental human activity guided by what wechoose to eat. Human activity has affected all the major planetary processes andcycles, and the earth’s human population continues to grow, as does its appetitefor resources. The immediate problems facing the world concern not limits tothose resources but the increasing disturbances to global and natural systems.Systemic changes have been recognised—climate change, ozone depletion,biodiversity loss, freshwater depletion and degraded food-producing systems.1
All of these have important implications for activities such as food production.Although sustainable development is a global concern, solutions also need to besought at national and local levels. If we are to deal comprehensively with theproblems that have been identified, we need integrated policies across manysectors; these policies must be adequately resourced and have an effectivelegislative and administrative base.2
The World Commission on Environment and Development defined sustainabledevelopment as ‘the ability to meet the needs of the current generation withoutcompromising future generations’ ability to meet their economic needs’. Commonelements in more comprehensive definitions of sustainable agriculture andanimal production are resource efficiency, profitability, productivity,environmental soundness, biodiversity, social viability, and other ethicalaspects.3 Important prerequisites for sustainable production are appropriategovernmental policies, awareness of our way of thinking, and a more communalworld view.
The consensus on human impact is that every major planetary process—whetherin the biosphere, the lithosphere, the hydrosphere or the atmosphere—is alreadydominated by our activity.4 The dominant species on earth (domesticatedanimals and plants) are heavily selected for specific traits, and this has reducedgenetic heterogeneity and adaptability. Maintaining the desirable traits in adverseenvironments, and in the face of mounting disease and pathogen attacks(predicted results of global climate change), requires ever-increasing energyinputs and environmental modification.4
It can be argued that the limits of sustainability have already been reached in thehuman population—with 6 billion humans alive today—since at least 20 per centof the population suffers from hunger, our natural resources are overexploited,and biodiversity is threatened.5 Demographers now believe that the worldpopulation will reach a peak of 8 to 10 billion during the 21st century, beforebeginning to slowly decline as fertility rates drop below the level necessary forreplacement.6 Problems relating to sustainable development will then be focusedon managing for the peak world population, rather than for a continually rising
280
E. DIETARY GUIDELINES AND THE SUSTAINABILITY OF FOOD SYSTEMS
Dietary Guidelines for Children and Adolescents in Australia
population. This task will be difficult enough in its own right, and ecologicalsustainability will necessarily move from being a side issue to being a centralforce in managing development, including the development of our foodproduction and consumption systems.
Humans are highly successful in an evolutionary sense, as demonstrated bysteady population increase, and this may be proof of our ability to modifyecosystems to our advantage. It has been argued that humankind can take careof environmental concerns when it can afford to and that environmental clean-upfollows wealth creation. But it is now clear that this might be misleading: forexample, the rate of increase in agricultural productivity is slowing and majorfood-production systems such as fisheries are approaching maximum capacity; ithas been estimated that nearly half the world’s marine fish populations are fullyexploited and another 22 per cent are overexploited.
Agricultural sustainability can be enhanced by a switch from linear solutions tocircular approaches to food production—for example, closing water and nutrientloops to reduce reliance on external inputs and reducing outputs of waste fromthe system. These general strategies would help restore soil fertility andultimately improve food security.7
In Australia the most pressing environmental problems are loss of biodiversity,land degradation, and disturbances to inland waterways.2 Effective solutions tothese problems will require halting large-scale land clearing, measures to dealwith dryland salinity, restoration of adequate environmental flows to our rivers,and major land use changes, including the retirement of large areas of land fromgrazing and similar uses.2
In the last 30 years there have been substantial changes to eating habits inAustralia, with the result that both apparent consumption and the level of waste(packaging and food wastes) have increased. Between 1970 and 1990 annualfood consumption in Sydney increased from 0.52 tonnes per person to 1.00tonnes per person—a 92 per cent increase. The increase in consumption isattributable to changes in food processing, retailing and lifestyle, rather than anincrease in food intake by each individual.8
Australians are the highest per capita users of water in the world, using 2.3 timesthe global average. Domestic water use accounts for only 12 per cent of this;agricultural use accounts for 79 per cent and industrial use for 9 per cent.
Published guidelines to help people consume food in a manner more consistentwith sustainable development focus on matters such as avoidingoverconsumption, eating less processed food, and eating food produced locallyand in season.9 ,10 Suggestions for ways that dietitians can contribute toprotection of the environment have also been the subject of recent discussion.11
It is apparent that a move towards more sustainable food-production methodswill require policy development and change in many different sectors. Ifsuccessful, we can expect that this will result in substantial changes to the waywe eat. While these Dietary Guidelines for Children and Adolescents are
281
E. DIETARY GUIDELINES AND THE SUSTAINABILITY OF FOOD SYSTEMS
Dietary Guidelines for Children and Adolescents in Australia
consistent with sustainable food production and consumption, dietary guidelinesof the future will probably become more and more focused on sustainability asthe problems caused by non-sustainable systems become more starkly obvious.
R E F E R E N C E S
1. McMichael AJ. Global environmental change as ‘risk factor’: canepidemiology cope? Am J Pub Hlth 2001;91:1172–4.
2. Yencken D, Wilkinson D. Resetting the compass—Australia’s journeytowards sustainability. Collingwood, Victoria: CSIRO Publishing, 2000.
3. Olesen I, Groen AF, Gjerde B. Definition of animal breeding goals forsustainable production systems. J Animal Sci 2000;78:570–82.
4. Western D. Human-modified ecosystems and future evolution. Proc NatAcad Sc 2001;98:5458–65.
5. Nentwig W. The importance of human ecology at the threshold of the nextmillenium: how can population growth be stopped? Naturwissenschaften1999;86:411–21.
6. Caldwell JC. The demographic dimension: past and future. Asia Pac J ClinNutr 2001;10(suppl.):S93.
7. Esrey SA. Towards a recycling society: ecological sanitation—closing theloop to food security. Water and Science Technology 2001;43:177–87.
8. State of the Environment Advisory Council. Australia: state of theenvironment, 1996. Collingwood, Victoria: CSIRO Publishing, 1996:3–34.
9. Gussow JD, Clancy KL. Dietary guidelines for sustainability. J Nutr Ed1986;18:1–5.
10. Gussow JD. Dietary guidelines for sustainability: twelve years later. J NutrEd 1999;31:194–200.
11. American Dietetic Association. Dietetic professionals can implementpractices to conserve natural resources and protect the environment.Position statement. J Amer Diet Assoc 2001;101:1221–7.
Infant Feeding Guidelines forHealth Workers
Colin Binns and Geoff Davidson
287
SUMMARY
Infant Feeding Guidelines for Health Workers
S U M M A RY
Breastmilk is a living tissue that includes many species-specific compounds.Exclusive breastfeeding is recommended to six months of age, before additionalfluids and solids need to be introduced. Breastfeeding is the normal way to feedinfants. Exclusive breastfeeding confers on them protection against infection andsome chronic diseases, and it leads to improved cognitive development.
In Australia, it is recommended that as many infants as possible be exclusivelybreastfed until 6 months of age. It is further recommended that mothers thencontinue breastfeeding until 12 months of age—and beyond if both mother andinfant wish. This document provides information that will help healthprofessionals promote these objectives.
Almost all mothers are capable of breastfeeding their infants. Outcomes aremuch improved where the mother has the support and encouragement of theinfant’s father, other family members, the hospital, and the community. Manymothers—perhaps the majority—encounter some difficulties with breastfeedingbut, with support and encouragement from health professionals and communityorganisations, they can nearly always continue to breastfeed. Further, mostmothers can continue breastfeeding if they choose to return to work. It isimportant, though, to follow the correct procedures when expressing and storingbreastmilk.
Similarly, in the event that an infant is not breastfed, it is important that correctmethods be used for the preparation and storage of feeds. The WHOInternational Code of Marketing of Breast-milk Substitutes and the Marketing inAustralia of Infant Formulas: Manufacturers and Importers Agreement provide thebasis for control of the marketing of infant formula in Australia.
All health workers have an obligation to promote breastfeeding in thecommunity and to ensure that best practice in breastfeeding is followed.
In comparison with many other countries, Australia’s breastfeeding record isgood, but it is important for the health of the nation’s mothers and infants thatinitiation rates and the duration of breastfeeding be increased.
The main management precepts are briefly described in the remainder of thissummary.
288
SUMMARY
Infant Feeding Guidelines for Health Workers
Breastfeeding
Breastfeeding is the normal way to feed all infants. Breastfeeding is veryimportant in the first six months; breastfeeding and its substantial benefits maycontinue for two years and beyond.
RECOMMENDATION
• Encourage, support and promote exclusive breastfeeding for the first sixmonths of life. An initiation rate in excess of 90 per cent and 80 per centof infants being breastfed at the age of 6 months are objectives forAustralia.
The active promotion and support of breastfeeding by community health,primary health care services, hospitals, and workplaces will increase initiationrates and the duration of breastfeeding.
RECOMMENDATIONS
• Provide antenatal information and counselling about the benefits andpractical aspects of breastfeeding (and the risks of not breastfeeding ) toall potential mothers and fathers.
• Promote the principles of the Baby Friendly Hospitals initiative.
• Pay particular attention to the importance of correct attachment andpositioning when breastfeeding. Effective, rapid management of anybreastfeeding difficulties is important to extend the duration ofbreastfeeding.
• Encourage community-based programs supporting breastfeeding families:such programs are of increasing importance as the length of hospital staysdecreases.
• Encourage support in the community and workplace for flexible workschedules, ‘part-time’ breastfeeding, and the use of expressed breastmilk.
• Continue to implement the WHO International Code of Marketing ofBreast-milk Substitutes and the Marketing in Australia of Infant Formulas:Manufacturers and Importers Agreement and ensure that all healthprofessionals understand their obligations.
There are very few contra-indications for breastfeeding. Smoking andenvironmental contaminants are not reasons for stopping breastfeeding.Moderate, infrequent use of alcohol, most prescription and over-the-counter
289
SUMMARY
Infant Feeding Guidelines for Health Workers
drugs, and most maternal diseases are not indications for stopping breastfeeding.Use of a pacifier (dummy) can, however, interfere with breastfeeding.
RECOMMENDATIONS
• Encourage mothers who smoke to stop or reduce smoking and to avoidexposing their infant to tobacco smoke. Even if a mother persists withsmoking, breastfeeding remains the best choice.
• Encourage mothers to limit their intake of alcohol and to avoid illicit drugs.
• Most prescription drugs are compatible with breastfeeding, but each caseshould be specifically assessed.
• At present, breastfeeding is contra-indicated when a mother is known tobe HIV positive. (Research into the possible benefits of antiretroviral drugsis continuing.)
• If a pacifier (dummy) is used, it should be introduced after one to twomonths and be used infrequently.
When an infant is not receiving breastmilk
If an infant is not breastfed or is partially breastfed, the commercial infantformulas are the most acceptable alternative to breastmilk until 12 months ofage.
RECOMMENDATIONS
• Parents should be informed of the benefits of breastfeeding and of therisks of not breastfeeding when a change from breastfeeding is beingconsidered.
• If complementary feeding is considered in hospital, the mother’s informedconsent should be obtained.
• Use cow’s milk–based formulas until 12 months of age. (All infant formulasavailable in Australia are iron-fortified.) Use soy-based or other specialformulas only for infants who cannot take dairy-based products or becauseof specific medical, cultural or religious reasons.
• Specialty formulas are indicated only for infants with detected orsuspected pathology: the advice of a health care professional should besought.
• When an infant formula is used, the instructions for preparation must befollowed exactly.
290
SUMMARY
Infant Feeding Guidelines for Health Workers
It is not appropriate to use nutritionally incomplete alternate milks as the solesource of nutrition for infants. Pasteurised whole cow’s milk is, however, animportant component of a mixed diet for a child older than about 12 months.
RECOMMENDATIONS
• Pasteurised whole cow’s milk may be introduced to a child’s diet at around12 months of age and be continued throughout the second year of life—and, of course, beyond. It is an excellent source of protein, calcium andother nutrients.
• Reduced-fat milks (skim milk and milk with 1 or 2 per cent fat) are notrecommended in the first two years of life.
• Soy (except soy formula where specifically indicated), rice and othervegetarian beverages—whether or not they are fortified—areinappropriate alternatives to breastmilk, formula or pasteurised wholecow’s milk in the first two years of life.
Other fluids in infant feeding
Tapwater that meets the Australian water standards and commercially bottledwater—but not mineral, carbonated or flavoured water—are generally suitablefor infants and children. Limit the use of fruit juices, to avoid interfering with theintake of nutrient-containing foods and fluids. Herbal teas and other beveragesare of no known benefit to an infant and could possibly be harmful.
RECOMMENDATIONS
• Boil all water that is to be fed to an infant.
• Limit an infant’s fruit juice intake, to avoid interfering with their intake ofbreastmilk or infant formula.
• Do not use herbal teas, soft drinks or other beverages.
The transition to solid foods
At the age of 6 months, infants are physiologically and developmentally readyfor new foods, textures and modes of feeding, and they need more nutrientsthan can be provided by breastmilk or formula. By 12 months of age, ingestionof a variety of foods from the different food groups, as described in theAustralian Guide to Healthy Eating, is recommended.
291
SUMMARY
Infant Feeding Guidelines for Health Workers
RECOMMENDATIONS
• Introduce solid foods at around 6 months, to meet the infant’s increasingnutritional and developmental needs.
• Start with low-allergenic foods such as single-grain baby cereals; follow thiswith vegetables and fruits and then meats. Add only one food at a time andwait several (ideally five to 10) days before introducing a new food. Toprevent iron deficiency, iron-containing foods such as iron-fortified cerealsare recommended as the first foods, followed later by foods containingmeats and other protein-rich foods.
Caring for infants’ food
Foods provided to an infant must be free of pathogens and of suitable size andtexture; they must also provide the necessary nutrients and be fed to the infantin a safe way.
RECOMMENDATIONS
• Store foods safely and prepare them hygienically.
• To prevent botulism, do not feed unpasteurised honey to infants.
• To prevent salmonella poisoning, cook all eggs well and do not useproducts containing raw eggs.
• Hard, small and round, smooth and sticky solid foods are notrecommended because they can cause choking and aspiration.
• Ensure that infants and toddlers are always supervised during feeding.
• Avoid feeding an infant using a ‘propped’ bottle.
Nutrition in the second year of life
Healthy eating is important in the second year of life. It provides the energy andnutrients needed for growth and development; it develops a sense of taste andan acceptance and enjoyment of different foods; and it instils attitudes andpractices that can form the basis for lifelong health-promoting eating patterns.
292
SUMMARY
Infant Feeding Guidelines for Health Workers
RECOMMENDATION
• Small, frequent, nutritious and energy-dense feedings of a variety of foodsfrom the different food groups are important to meet nutrient and energyneeds during the second year of life. The regular family diet (see theAustralian Guide to Healthy Eating) should be the basis of the child’s meals.
Other aspects of infant nutrition
Food allergies
Whenever possible, food allergies should be minimised.
RECOMMENDATION
• Encourage exclusive breastfeeding for six months to decrease the risk ofallergy in infants with a positive family history. If there is a strong familyhistory of allergy, delay introducing some or all of the highly allergenicfoods during the first year; among these foods are cow’s milk and otherdairy products, soy, eggs, nuts, peanuts and fish. It is best to continueavoiding eggs, nuts and shellfish until the age of 3 years.
Treatment of proven food allergies involves avoidance of foods known to causesymptoms.
RECOMMENDATION
• When food choices are restricted, the advice of a dietitian should besought to ensure that the dietary intake continues to meet nutrient andenergy needs.
Colic
Changes in diets and restrictions on individual foods have had very limitedsuccess in the treatment of colic.
RECOMMENDATION
• Ensure that any dietary modification or pharmacological intervention issafe and does not result in nutritional deficiencies.
293
SUMMARY
Infant Feeding Guidelines for Health Workers
Constipation
In infancy, true constipation is infrequent.
RECOMMENDATION
• To avoid unnecessary intervention, parents need to be educated about thewide variation in normal bowel function in infants (particularly those whoare breastfed) and toddlers.
Dietary fat
Dietary fat is an important source of energy and the primary source of essentialfatty acids. It also promotes the absorption of essential fat-soluble vitamins.
RECOMMENDATION
• Restriction of dietary fat is not recommended during the first two years oflife because it may compromise the intake of energy and essential fattyacids and adversely affect growth, development, and the myelination of thecentral nervous system.
Dental caries
The prevalence of dental caries is lower where infants and children have accessto fluoridated water and when long-term exposure of teeth to nutrient-containingliquids is avoided. Excessive fluoride intake can, however, cause dental fluorosis.
RECOMMENDATIONS
• Fluoride supplementation is not recommended for infants aged less than 6months.
• For children between the ages of 6 months and 2 years who are living inareas where the household water supply is not fluoridated, dailysupplementation with 0.25 milligrams of fluoride may be recommended.
• Avoid leaving a bottle with a sleeping infant or using one as a pacifier. Avoidnight-time and long-term use of baby bottles containing liquids other thanwater.
• Do not dip pacifiers or bottle teats in sugar or honey.
294
SUMMARY
Infant Feeding Guidelines for Health Workers
Diarrhoeal disease
Mild to moderate dehydration associated with gastroenteritis should be managedwith oral rehydration therapy on the advice of a health professional.
RECOMMENDATIONS
• Manage mild to moderate dehydration with an oral electrolyte solutionand early refeeding.
• For breastfed infants, continue breastfeeding while supplementing theirfluid intake with an oral electrolyte solution as necessary.
Iron deficiency anaemia
Iron deficiency is common, but it is preventable if suitable feeding choices aremade. Exclusive breastfeeding to the age of 6 months will ensure that breastmilkis not replaced by foods of lower nutrient density and will minimise the risk ofiron deficiency.
RECOMMENDATIONS
• Continue exclusive breastfeeding for about six months.
• Introduce complementary foods containing iron at about 6 months of age.
• Choose iron-containing formula for infants who are not breastfed and forinfants receiving formula as well as breastmilk.
• Delay the introduction of whole cow’s milk until 12 months of age.
• Continue to offer iron-fortified and meat-containing foods beyond 12months of age.
295
SUMMARY
Infant Feeding Guidelines for Health Workers
Vegetarian diets
Nutritional needs can be met by a well-planned vegetarian diet. The advice of adietitian may be needed in particular situations.
RECOMMENDATIONS
• Vegetarian mothers should be advised to breastfeed their infants for aslong as possible—two years or more. For vegan infants who are notbreastfed or are partially breastfed, use of a commercial soy-based infantformula during the first two years of life is recommended.
• After dietary assessment, infants on vegan diets may require nutritionalsupplements.
Low-birthweight infants
Breastmilk is the best food for low-birthweight infants, although specialsupplements may be required. Low-birthweight infants are often iron deficientand supplementation is required.
Infant Feeding Guidelines for Health Workers 297
CONTENTS
C O N T E N T S
Summary 287
Definitions 301
Introduction: breastfeeding in Australia 305
I Encouraging and supporting breastfeeding in the Australiancommunity 317Breastfeeding as the physiological norm 317References 323
II Initiating, establishing and maintaining breastfeeding 329Breastfeeding education for parents 329Antenatal advice 330Physiology of breastmilk and breastfeeding 331The first breastfeed 337References 338
III Breastfeeding: early days 341The natural patterns of breastfeeding 341The sleepy infant 341The unsettled infant 342Exclusive breastfeeding 343Rooming-in 345Monitoring an infant’s progress 345Young mothers 349References 349
IV Breastfeeding: common problems and their management 353Hygiene 354Nipple pain and trauma 354Nipple variations 355Nipple shields 356Other nipple problems 356‘Too much milk’ 357‘Too little milk’ 358Engorgement 361Inflammatory conditions of the breast 362Blood in the breastmilk 364Postnatal depression and mood disorders 364Breast refusal 366The crying infant 367
298
CONTENTS
Infant Feeding Guidelines for Health Workers
Regurgitation and gastro-oesophageal reflux 369Physiological jaundice 371Breastmilk jaundice 371References 371
V Expressing and storing breastmilk 377Expressing breastmilk 377Feeding with expressed breastmilk 379Storage of expressed breastmilk 379References 381
VI Breastfeeding in specific situations 383Absolute contra-indications to breastfeeding 383Relative contra-indications to breastfeeding 384Nicotine, alcohol and other drugs 385Women and paid work 386Low-birthweight infants 387References 387
VII Informed use of complementary feeds in hospital 389
VIII Safe use of infant formula 391Infant formulas 391Preparation of formula 395Sterilisation methods 395Using infant formula 397References 401
IX Foods not suitable for infants or that should be used with care 405Honey 405Tea 405Nuts 405Fruit juices 405Cow’s milk 406Reduced-fat milks 406References 406
X Interpretation of the WHO Code for health workers in Australia 407The Marketing in Australia of Infant Formula Agreement: status 407The Advisory Panel on the Marketing in Australia of Infant Formula:terms of reference 408Interpretations of the Advisory Panel on the Marketing in Australia ofInfant Formula 408References 415
299
CONTENTS
Infant Feeding Guidelines for Health Workers
Appendix A Measurement of breastfeeding rates 417
Appendix B The Innocenti Declaration on the Protection,Promotion and Support of Breastfeeding 419
Appendix C Royal Australian College of General Practitioners:breastfeeding position statement 423
Appendix D Breastfeeding program of the Department of Healthand Ageing 427
Appendix E Feeding low-birthweight pre-term infants(finger feeding) 431
Appendix F Pharmaceutical and other drugs and breastfeeding 433
Appendix G The composition of human milk 439
Appendix H Sample consent form for complementary feeds 443
Appendix I Australian nutrition and breastfeeding resourcesand websites 445
Appendix J Marketing of breastmilk 447
301
DEFINITIONS
Infant Feeding Guidelines for Health Workers
D E F I N I T I O N S
[Unless otherwise noted, the following definitions are taken from reference 1 atthe end of this list. Where ‘WHO Code’ is inserted in brackets, this refers to theWHO International Code of Marketing of Breast-milk Substitutes. All thedefinitions given here are consistent with the WHO definitions—see reference 2at the end of the list.]
Breastfeeding duration The total length of time during which an infantreceives any breastmilk at all—from initiationuntil breastfeeding has ceased.
Breastmilk substitute Any food being marketed or otherwiserepresented as a partial or total replacement forbreastmilk, whether or not it is suitable for thatpurpose [WHO Code]. In Australia, this term isconsidered inappropriate because it implies anequivalence to breastmilk. The term infantformula is used throughout this document,although it is acknowledged that other foods andfluids are used in place of breastmilk. Infantformula is the term used in Australia NewZealand Food Standards Code, volume 2.
Complementary food Any food—manufactured or locally prepared—suitable as a complement to breastmilk or infantformula, when either becomes insufficient tosatisfy the nutritional requirements of the infant.Such food is also commonly called weaning foodor breastmilk supplement [WHO Code]. In thisdocument the following working definition isused: any nutrient-containing foods or liquids(other than breastmilk) given to infants who arebreastfeeding.
Complementary feeding The infant or child is receiving both breastmilkand nutrient-containing foods, which includes anyfood or liquid containing non-human milk.
Container Any form of packaging of products for sale as anormal retail unit, including wrappers [WHOCode].
302
DEFINITIONS
Infant Feeding Guidelines for Health Workers
Distributor A person, corporation or other entity in the publicor private sector engaged, directly or indirectly, inthe business of marketing at the wholesale orretail level a product within the scope of theWHO Code. A ‘primary distributor’ is amanufacturer’s sales agent, representative,national distributor or broker [WHO Code].
Ever breastfed Infants who have been put to the breast, if onlyonce. Also includes infants who have receivedexpressed breastmilk but have never been put tothe breast.
Exclusive breastfeeding An infant receives only breastmilk from his or hermother or a wet nurse, or in the form ofexpressed breastmilk, and no other liquids orsolids apart from drops or syrups containingvitamins, mineral supplements or medicines.
Fully breastfed This term embraces the WHO indicators of‘exclusive’ breastfeeding and ‘predominant’breastfeeding. It refers to infants who arereceiving almost all of their nutrients frombreastmilk but take some other liquids such aswater, water-based drinks, oral rehydrationsolutions, ritual fluids, and drops or syrups. Itexcludes any food-based fluids.
Health care system Government, non-government and privateinstitutions or organisations engaged, directly orindirectly, in providing health care for mothers,infants and pregnant women. Also includesnurseries and child care facilities, plus healthworkers in private practice. For the purposes ofthe WHO Code, the term does not includepharmacies or other established sales outlets.
Health worker A professional or non-professional personworking in a component of a health care system;includes voluntary unpaid workers [WHO Code].
Infant A child aged less than 12 months.
Infant formula An infant formula product represented as abreastmilk substitute for infants and whichsatisfies the nutritional requirements of infantsaged up to 4 to 6 months. (Aust New ZealandFood Standards (volume 2) See also Breastmilksubstitute.
303
DEFINITIONS
Infant Feeding Guidelines for Health Workers
Infant formula product Means a product based on milk or other ediblefood constituents of animal or plant origin whichis nutritionally adequate to serve as the principalliquid source of nourishment for infants. (AustraliaNew Zealand Food Standards (volume 2).
Initiation of breastfeeding An infant’s first intake of breastmilk.
Label Any tag, brand, mark, pictorial or otherdescriptive matter written, printed, stencilled,marked, embossed or impressed on, or attachedto, a container of any product within the scope ofthe WHO Code.
Manufacturer A corporation or other entity in the public orprivate sector engaged in the business orfunction—whether directly, through an agent, orthrough an entity controlled by or under contractwith it—of manufacturing a product within thescope of the WHO Code.
Marketing Product promotion, distribution, selling andadvertising; product public relations; and productinformation services [WHO Code].
Marketing personnel Any people whose functions involve themarketing of a product or products coming withinthe scope of the WHO Code.
Nursing staff The terms used for nursing staff associated withinfant care change from time to time and indifferent localities. In this document the termencompasses all involved in infant and maternalcare, regardless of their current or former titles.
Predominant breastfeeding An infant’s predominant source of nourishment isbreastmilk but he or she may also receive waterand water-based drinks (sweetened and flavouredwater, teas, infusions, and so on); fruit juice; oralrehydration solution; drop and syrup forms ofvitamins, minerals and medicines; and ritual fluids(in limited quantities). All other food-based fluidsare excluded—in particular, non-human milk. (Ineveryday use, this term is sometimes used toinclude infants who are occasionally fed non-human milk, but the ‘official’ use of the termprecludes this.)
304
DEFINITIONS
Infant Feeding Guidelines for Health Workers
Samples Single or small quantities of a product providedwithout cost [WHO Code]. For the purposes ofthis document, and having regard to the Australiancontext, free or subsidised samples or supplies ofinfant formula are those given by manufacturersto health care facilities at no cost or at a cost thatis substantially less than the normal retail orwholesale cost.
Supplies Quantities of a product provided for use over anextended period, free or at a low price, for socialpurposes, including those provided to families inneed [WHO Code].
Solid foods Any nutrient-containing foods (semi-solid orsolid)—for example, dilute infant cereals.Excludes breastmilk and breastmilk substitutes,fruit and vegetable juices, sugar water, and so on.
Supplementary feed Fluids or foods dissolved in fluids given tocompletely replace a breastfeed. The distinctionbetween complementary feeds and supplementaryfeeds is important: there seems to be a great dealof confusion among health professionals.
Toddler A child aged from 1 to 2 years.
Weaning The period during which an infant is introducedto breastmilk substitutes or solid foods, or both,with the intention of ceasing breastfeeding. (Thisterm should be used with care: in the literature,weaning, weaning foods and weaned are used indifferent ways.)
Weaned The infant or child no longer receives anybreastmilk.
Young child A child aged less than 5 years.
R E F E R E N C E S
1. Webb K, Marks K, Lund-Adams M, Abraham B. Towards a national systemfor monitoring breastfeeding in Australia: a discussion paper. Canberra:Australian Food and Nutrition Monitoring Unit, 2002.
2. World Health Organization. Complementary feeding of young children indeveloping countries; 1998. Report no. WHO/NUT/98.1. Geneva: WHO,1998.
Infant Feeding Guidelines for Health Workers 305
INTRODUCTION: BREASTFEEDING IN AUSTRALIA
I N T R O D U C T I O N : B R E A S T F E E D I N G I NA U S T R A L I A
[The introduction of solid foods is covered in detail in the Dietary Guidelines forChildren and Adolescents in Australia.]
Breastfeeding is the normal way to feed infants. The purpose of this document isto encourage health workers to continue promoting breastfeeding as the normand to help mothers overcome any difficulties they might encounter. All healthworkers have an obligation to promote breastfeeding and to ensure that bestpractice in breastfeeding is followed. With modern obstetric care, mothers spendso little time in hospital that breastfeeding may not be fully established beforethey are discharged; the result is that many mothers who are breastfeedingconsult community health professionals.
Provision of breastfeeding education prior to, or in the early stages of, pregnancyis important. The earlier in the pregnancy a mother makes the decision tobreastfeed, the more likely is she to initiate breastfeeding and continue tobreastfeed.1,2 The support of the baby’s father and the encouragement of societyplay important roles in the success of breastfeeding3 —see Chapter 1 of theDietary Guidelines for Children and Adolescents and Section II here for a moredetailed discussion.
When, for some reason, substitutes for breastmilk are used, health workersshould provide the relevant information and do their utmost to ensure that bestpractice is followed. Once the use of infant formula is established, theappropriate public health response is to ensure best practice, minimise the risksassociated with formula feeding, and avoid inducing guilt in the mother.
Exclusive breastfeeding to the age of about 6 months gives the best nutritionalstart to infants and is recommended by a number of authorities.4–8 The WHOreviewed the literature on breastfeeding duration and more than 3000 referenceswere identified. The WHO Expert Consultation recommended exclusivebreastfeeding for six months, with the introduction of complementary foods andcontinued breastfeeding thereafter; the 2001 World Health Assembly adopted aresolution supporting this change in policy.7 The WHO also recommends thatbreastfeeding continue for up to two years and beyond. Breastmilk can continueto provide half or more of an infant’s nutrients during the second half of the firstyear of life and up to one-third during the second year of life <www.who.int>.
For Australia, it is recommended that as many infants as possible be exclusivelybreastfed until 6 months of age. It is further recommended that mothers thencontinue breastfeeding until 12 months of age—and beyond if both mother andinfant wish. Although the greatest benefits from breastfeeding are to be gained in
306
INTRODUCTION: BREASTFEEDING IN AUSTRALIA
Infant Feeding Guidelines for Health Workers
the early months, especially from exclusive breastfeeding for at least six months,there is no doubt that breastfeeding provides benefits that continue beyond thistime. After six months, continued breastfeeding along with complementary foodsfor at least 12 months will bring continuing benefits.9–14
Infants’ needs differ, and a small number may benefit from the introduction ofsolids before the age of 6 months, but not before 4 months.15 Growth monitoringon a regular basis, using an accurate scale, a suitable methodology and a growthreference, offers the most objective way of determining whether there is a needfor supplementation. This should, however, be considered in association with anumber of factors, among them examination, the infant’s history, the parents’size, and the infant’s current feeding patterns. If an infant’s growth is faltering,efforts should be made to increase the milk supply: the assistance of a lactationconsultant is often beneficial. Infants who are exclusively breastfed until the ageof 6 months are likely to have better iron status than those who have been givenother foods. This is because of the high bioavailability of the iron (lactoferrin) inbreastmilk. However, delaying the introduction of solid foods much beyond6 months can compromise iron status. Iron deficiency at this age is known tocause delayed growth and problems with cognitive development16,17 —seeChapter 3 of the Dietary Guidelines for Children and Adolescents for furtherinformation).
Australia includes breastfeeding in its national health goals and targets, and allthe states have also accorded high priority to maximising initiation rates and theduration of breastfeeding. Following a decline in breastfeeding around themiddle of the 20th century, in the 1970s there was increasing recognition of theharm being done by departing from the norm of breastfeeding. Rates began toincrease again, in Australia and in comparable overseas countries, beginning inthe higher socio-economic groups. By 1983 both the prevalence and the durationof breastfeeding in Australia were among the highest in the western world, with85 per cent of mothers breastfeeding at discharge from hospital and 54–55 percent three months later.18 Breastfeeding rates have remained around this levelsince then. In comparison, breastfeeding initiation rates in the United States werearound 20 per cent in the 1970s and increased to 62 per cent in 198219 ; theythen declined in the 1990s but rose again, to 68.2 per cent, in 2000.8 Promotionof breastfeeding in the Australian dietary guidelines may have been an importantfactor in preventing the decline in breastfeeding seen in the 1990s in othercountries.
In 1992–93 in Western Australia and 1995–96 in Queensland a survey was carriedout by Scott et al.1,20 ; the results suggested a continuing trend to increasingbreastfeeding rates and durations in those states. In the years preceding thesurvey the hospitals had a breastfeeding discharge rate of 82 per cent, and by sixmonths 46 per cent of mothers were still breastfeeding (note that the Scott et al.and the Palmer18 data are not significantly different). Women who were born inAustralia or New Zealand were almost twice as likely to be breastfeeding atdischarge than women born in other countries.
307
INTRODUCTION: BREASTFEEDING IN AUSTRALIA
Infant Feeding Guidelines for Health Workers
Donath and Amir analysed data from the 1995 National Nutrition Survey andfound that breastfeeding rates were 81.8 per cent on discharge from hospital and57.1 per cent fully breastfed at age 3 months.21 At age 6 months it is estimatedthat 18.6 per cent of babies are fully breastfed and 46.2 per cent partiallybreastfed; at 1 year of age 21.2 per cent of infants are receiving some breastmilk.Thus, in Australia at present fewer than 20 per cent of infants are achieving thegoal of being exclusively breastfed to 6 months of age and continuing withbreastfeeding thereafter. It is important to note, however, that, while theobjective is to promote exclusive breastfeeding to the age of 6 months, anyamount of breastfeeding is to be encouraged. Mothers should always beencouraged to continue breastfeeding, even if their circumstances do not allowexclusive breastfeeding.
Mothers who are less likely to breastfeed are those from lower socio-economicgroups and certain ethnic groups. Mothers born in Asia are among the earliest ofthe ethnic groups to stop breastfeeding; they are followed by mothers fromlower socio-economic groups.1
Although the Australian figures are better than those for most other developedcountries, by the age of 6 months about half of the infants in Australia are nolonger breastfed. This decline in breastfeeding rates after the first few monthsmeans a loss of important health benefits for these infants, and hence forAustralia.
The current situation and the challenge facing Australia can be put in thefollowing terms. Initiation rates are relatively high, at around 82 per cent ormore, but experience in countries such as Sweden and Norway suggests that aninitiation rate of 98 per cent is achievable. A target of 50 per cent exclusivebreastfeeding for the first six months is realistic in the next few years; this targetwould still be sub-optimal, and it should be raised as soon after that aspracticable. Within a decade a target of 80 per cent fully breastfed for around sixmonths should be set and the necessary parental education and communitysupport initiated.
The socio-cultural environment has an important influence on parents’ choice tobreastfeed their infant.22 Antenatal exposure to the advertising of infant formulaincreases the rate of early termination of breastfeeding and shortens the overallduration among women with uncertain breastfeeding goals or goals of 12 weeksof less.23 For these reasons, the promotion of infant formula in Australia iscontrolled by voluntary codes based on the World Health Organization’s policies.
The WHO International Code of Marketing of Breast-milk Substitutes
During the 1960s and 1970s infant formulas were inappropriately marketed inmany countries, contributing to a decline in breastfeeding and consequentincreases in infant morbidity and mortality. In response to this situation, UNICEF,the WHO and a number of other organisations proposed a code to limit theinappropriate promotion of infant formulas. The World Health Assembly adopted
308
INTRODUCTION: BREASTFEEDING IN AUSTRALIA
Infant Feeding Guidelines for Health Workers
the International Code of Marketing of Breast-milk Substitutes on 21 May 1981,with 118 votes in favour, one against, and three abstentions.
The recommendation to develop a marketing code came out of the 1979UNICEF–WHO ‘Meeting on Infant and Young Child Feeding’. The meeting wasattended by representatives of governments, UN agencies, non-governmentorganisations and the infant-food industry, and experts from related disciplines.The WHO Code aims to protect the nutritional wellbeing of all infants in twoseparate but closely related ways: through protecting and promotingbreastfeeding; and the appropriate use and marketing of breastmilk substitutes,bottles and teats when these are necessary.24
Since 1981 the World Health Assembly has adopted a number of resolutions thatrelate to the WHO Code and clarify some of its provisions. Among the mostsignificant of these is Resolution 39.28 (1986), which deals with the issue of freesupplies, the promotion of early introduction of and use of complementaryfoods, and the use of follow-up milks. The Assembly’s Resolution 47.5 (1994)adds important guidance on the issue of free supplies and proper complementaryfeeding at the age of about 6 months. Resolution 49.15, adopted in 1996, urgesmember states to ensure that complementary foods are not marketed in waysthat undermine exclusive and sustained breastfeeding. The same resolutionaddresses the question of financial support for health professionals and warnsabout the danger of conflicts of interest. In response to the WHO Code, inAustralia a self-regulatory model was adopted (see ‘Implementation of the WHOCode in Australia’, at the end of this introduction). To mark the 20th anniversaryof the Code, Young reviewed some of the violations still being encountered.25
Since the WHO Code was adopted a number of other initiatives designed toimprove the health of infants through promoting and supporting breastfeedinghave been developed. One is the joint WHO–UNICEF Baby Friendly Hospitalinitiative, announced in 1991, which seeks to eliminate hospital practices thatmay interfere with successful initiation and maintenance of breastfeeding.Although mothers are now in hospital for only a short period after delivery,hospitals can still have a positive influence on breastfeeding. If hospitals are notsupportive of breastfeeding the negative effects can be marked. A Cochranesystematic review has shown that that negative hospital practices, such as thedistribution of commercial sample packs, can have a very negative effect onbreastfeeding. The distribution of these packs (with or without formula) tomothers while in hospital reduces the number of women who exclusivelybreastfeed.26
Hospitals are encouraged to adopt the Baby Friendly Hospital initiative and the‘Ten steps to successful breastfeeding’ (see the box below). All steps in thisprogram have been shown to positively influence breastfeeding outcomes.27 Thebenefits of this policy have been demonstrated by the Boston Medical Centre,where breastfeeding initiation rates rose from 58 per cent in 1995 to 86.5 percent in 200028 ; the recent PROBIT study in Belarus has also shown increasedinitiation rates.12
309
INTRODUCTION: BREASTFEEDING IN AUSTRALIA
Infant Feeding Guidelines for Health Workers
A further important statement on breastfeeding is the Innocenti Declaration,which was adopted in April 1990 by participants in the WHO–UNICEF policymakers’ meeting ‘Breastfeeding in the 1990s: a global initiative’.30
The Baby Friendly Hospitals initiative in Australia
In Australia the Baby Friendly Hospitals initiative is administered by theAustralian College of Midwives Incorporated. As of mid-2001, there were 24hospitals across Australia that had achieved ‘Baby–Feeding Friendly Hospitalstatus’ <www.UNICEF.org>.
Promotion of breastfeeding in Australia
The Commonwealth Government is committed to protecting, promoting andsupporting exclusive breastfeeding for the first six months of life and continuedbreastfeeding thereafter. Australia is one of the few developed countries in theworld to include a guideline on breastfeeding in its Dietary Guidelines forAdults; the guideline is included in recognition of the role the whole communityplays in encouraging and supporting breastfeeding. In the Dietary Guidelines forChildren and Adolescents the breastfeeding guideline is placed first, toemphasise its importance to the health of this age group.
A systematic review of the promotion of breastfeeding has been undertaken bythe Health Technology Assessment Group of the National Health Service.31 Atotal of 59 studies were identified as eligible for inclusion, including 14randomised controlled trials. Three types of intervention have been found to beeffective in developed countries when delivered as stand-alone interventions, oras part of an integrated package:
Ten steps to successful breastfeeding29
Every facility providing maternity services and care for newborn infants should:
1. Have a written breastfeeding policy that is routinely communicated to all health carestaff.
2. Train all health care staff in skills necessary to implement this policy.
3. Inform all pregnant women about the benefits and management of breastfeeding.
4. Help mothers initiate breastfeeding within half an hour of birth.
5. Show mothers how to breastfeed, and how to maintain lactation even if they areseparated from their infants.
6. Give newborn infants no food or drink other than breastmilk, unless medically indicated.
7. Practise rooming-in (allow mothers and infants to remain together), 24 hours a day.
8. Encourage breastfeeding on demand.
9. Give no artificial teats or pacifiers (also called dummies or soothers) to breastfeedinginfants.
10. Foster the establishment of breastfeeding support groups and refer mothers to them ondischarge from the hospital or clinic.
310
INTRODUCTION: BREASTFEEDING IN AUSTRALIA
Infant Feeding Guidelines for Health Workers
• small group health education delivered during the antenatal period
• one-to-one health education can be effective in increasing initiation ratesin low income mothers
• peer-support programs in the antenatal and postnatal periods have beenshown to be effective in increasing breastfeeding initiation and duration.31
Breastfeeding programs
The National Breastfeeding Strategy was initiated in 1996 and has funded anumber of projects (see www.health.gov.au/pubhlth/strateg/brfeed/index.htm fordetails). The National Child Nutrition Program, with funding of $15 million, willsupport community-level projects designed to improve the diet and eating habitsof children from the prenatal stage to the primary school years. In addition, thestate and territory governments support the promotion of breastfeeding and haveadditional programs and resources available. Appendix I lists some of theresources relating to breastfeeding and infant feeding that are provided by theCommonwealth and the states and territories.
The National Breastfeeding Strategy has promoted the following actions:
• National Health and Medical Research Council guidelines
– development and dissemination of the Infant Feeding Guidelines forHealth Workers (1996), with the aim of helping health workers topromote and support breastfeeding in a consistent way
– development and dissemination of the Dietary Guidelines forAustralians (1991), which encourage breastfeeding because of itsimportance to all Australians in terms of nutritional, health, social andeconomic benefits to the community
– development and dissemination of the Dietary Guidelines for Childrenand Adolescents32 , in which the breastfeeding message is the mostimportant guideline
• the International Code of Marketing of Breast-milk Substitutes
– facilitation of a self-regulatory model for implementation of the WHOCode in the 1990s. The resulting voluntary agreement is the 1992Marketing in Australia of Infant Formulas: Manufacturers and ImportersAgreement, which deals solely with the marketing of infant formula bymanufacturers
• the Australian Breastfeeding Association
– funding of $50 000 a year for the three years, beginning in 1998–99,allocated to the Australian Breastfeeding Association (formerly theNursing Mothers Association of Australia) to assist its ongoing work ofsupporting breastfeeding in the community
• Indigenous health services
– an audit of current training in breastfeeding support and infantnutrition and a review of current interventions and best practice. The
311
INTRODUCTION: BREASTFEEDING IN AUSTRALIA
Infant Feeding Guidelines for Health Workers
resultant reports—covering current training in breastfeeding supportand infant nutrition, current interventions and identification of bestpractice, and stories and ideas from around Australia—were producedfor use in the development of a national public health nutritionstrategy and disseminated by the Office for Aboriginal and TorresStrait Islander Health
• Naturally: the facts about breastfeeding
– a companion to the NHMRC’s Infant Feeding Guidelines for HealthWorkers33 , this document contains fact sheets for health workers andwas distributed to health workers and GPs across Australia
• national accreditation standards for maternal and child health services
– national care standards for services, such as hospitals and communityhealth services, that support the maintenance of breastfeeding. Thestandards are set out in the Maternal and Infant Care Services Moduleand the Guidelines for Maternal and Infant Care Services
• family education
– resources called ‘tip cards’ targeting a variety of ethnic, cultural andsocio-economically disadvantaged groups in Australia; disseminated in1998. A variety of resources were produced: five series of tip cards,each with seven hints; a series of tip cards in Vietnamese, Chinese,Arabic, Turkish and Spanish; You can Breastfeed Your Baby, a bookletfor those with lower literacy; Let’s give our Baby the Best, a comicbooklet aimed at young parents; and two posters captioned ‘Mother’smilk—perfect anytime, anywhere’
• employer support
– insert developed for the Department of Workplace Relations and SmallBusiness newsletter Work and Family on workplace initiatives tosupport breastfeeding women (targeted at employers). Disseminatednationally to employers
• health professionals’ education
– education kit targeting community health workers and members ofprofessional colleges. Distributed to practising GPs and paediatricians,baby health clinics and pharmacies. A variety of resources wereproduced: a best-practice guide to the management of commonbreastfeeding problems; a lactation resource guide; a breastfeedingmodule (a continuing education program for GPs); a continuingpharmacy education module on breastfeeding; and similar modules forchild health nurses and pharmacy assistants
• antenatal education breastfeeding package
– an education package, distributed to 3000 antenatal educators andobstetricians, consisting of an Educators Manual, providing strategies,tools and lesson plans, including for use with people of non–Englishspeaking background; a video promoting the importance of the social,
312
INTRODUCTION: BREASTFEEDING IN AUSTRALIA
Infant Feeding Guidelines for Health Workers
emotional and relationship aspects of breastfeeding; and a poster toaccompany the video and for display in waiting rooms
• workplace support
– resources to be developed and strategies implemented that facilitatewomen breastfeeding whilst in employment. Fifty thousand kits havebeen distributed to medium and large businesses across Australia. Theresources produced are a booklet, aimed at employers and employees,on ways of continuing breastfeeding; a poster for display inworkplaces as a general awareness-raising tool; a flier featuring keyaspects of combining breastfeeding and paid work; and the same fliertranslated into Turkish, Vietnamese, Chinese, Arabic and Spanish.
The National Breastfeeding Monitoring Program will provide consistent andaccurate monitoring of breastfeeding prevalence nationally as part of theNational Nutrition Monitoring and Surveillance Project.
The documents prepared as a part of the National Breastfeeding Program areavailable from the Commonwealth Department of Health and Ageing<www.health.gov.au/pubhlth/strateg/brfeed/index.htm>. Australia is alsofortunate in having a number of voluntary organisations active in the promotionof breastfeeding. The largest—and the one most accessible to mothers, throughits many branches—is the Australian Breastfeeding Association<www.breastfeeding.asn.au>.
Implementation of the WHO code in Australia
In Australia the WHO International Code of Marketing of Breast-milk Substitutesis implemented in a number of ways. A voluntary agreement, the Marketing inAustralia of Infant Formulas: Manufacturers and Importers Agreement (the MAIFAgreement), was signed in 1992 (see Appendix J). Under this agreement amonitoring mechanism, in the form of the Advisory Panel on the Marketing inAustralia of Infant Formula, was established, funded jointly by industry andgovernment. The panel comprises an independent chairperson, a public healthnutritionist and industry and consumer nominees; the Department of Health andAgeing provides secretariat support. (The panel’s annual reports are available at<www.health.gov.au>.) The working of the panel and the implementation of theagreement itself has recently been reviewed.34
Australia’s health workers also need information about their responsibilitiesunder the WHO Code, to ensure the continuing emphasis on breastfeeding.Approximately one-third of the WHO Code is directly addressed to healthworkers, and Section X of these guidelines is devoted to interpreting the Code.Health workers must always ensure that they encourage the initiation andmaintenance of breastfeeding and avoid any role in the promotion of breastmilksubstitutes.33
313
INTRODUCTION: BREASTFEEDING IN AUSTRALIA
Infant Feeding Guidelines for Health Workers
These guidelines—prepared after extensive consultation—are a revision of thoseoriginally developed by the National Health and Medical Research Council in1984; they provide for health workers information on ways of encouraging andsupporting breastfeeding. Health workers are committed to promoting optimalhealth and development for all infants. When interpreting these guidelines,however, health workers should be mindful that mothers who do not breastfeedneed information about infant formula and instruction about its use andpreparation; this is covered in Section VIII. All mothers are entitled to supportand advice, so that they can feed their infants well.
Scope of the WHO Code
The WHO Code applies to the marketing (and practices related to the marketing)of breastmilk substitutes—including infant formula, other milk products, foodsand beverages. It also applies to bottle-fed complementary foods when these aremarketed or otherwise represented as suitable, with or without modification, as apartial or total replacement for breastmilk. In addition, the Code deals with thequality and availability of feeding bottles and teats and provides informationabout their use.
The following box summarises the provisions of the WHO Code, as interpretedand implemented in Australia.
314
INTRODUCTION: BREASTFEEDING IN AUSTRALIA
Infant Feeding Guidelines for Health Workers
R E F E R E N C E S
1. Scott JA, Aitkin I, Binns CW, Aroni RA. Factors associated with the durationof breastfeeding amongst women in Perth, Australia. Acta Paediatr Scand1999;88(4):416–21.
Interpretation and implementation of the WHO Code in Australia
The WHO Code has been implemented in Australia through the MAIF Agreement and theNHMRC’s Interpretation of the WHO Code for Health Workers in Australia. Following is asummary of the main points covered by these documents.
• The restrictions in the Code apply to infant formula and other products marketed orrepresented as breastmilk substitutes and to feeding bottles and teats. Responsibilitiesare outlined for companies that manufacture, market or distribute these products, aswell as for health workers and the health care system.
• Educational materials produced by companies for parents should be unbiased andconsistent; they should include all the facts, describe all the hazards, and avoid referenceto a specific product. Distribution of materials should be only through the health caresystem, not through retail outlets.
• Companies are not permitted to promote their products to the general public, eitherdirectly or through retail outlets. Companies may not give samples or gifts to parents.Health workers may not give samples to parents.
• Health workers should consider the message about infant feeding that their actions andtheir health care facility gives to mothers. There should be no display or distribution ofproducts or of company materials that refer to a product or encourage artificial feeding.
• Marketing personnel—even if they are health professionals—should have no contactwith parents and should not perform any educational or health care functions.
• Companies may provide scientific and factual information about their products directlyto health workers through meetings or materials.
• Companies may not offer, and health workers may not accept, gifts or otherinducements that might influence a health worker’s product recommendations toparents or their health care facility. Study grants may be accepted in somecircumstances, but they must be disclosed.
• All products within the scope of the Code must conform to standards for quality,composition and labelling.
• Independently of measures taken to implement the Code, companies and healthworkers should take steps to conform to the principles and aim of the Code and tomonitor their own practices.
In Australia, concerns about or breaches of the WHO Code should be reported to theAdvisory Panel on the Marketing in Australia of Infant Formula:
APMAIF SecretariatDepartment of Health and AgeingPO Box 7186Canberra BC ACT 2610
Sourced: Modified from <www.health.gov.au/pubhlth/strateg/brfeed/index.htm>.
315
INTRODUCTION: BREASTFEEDING IN AUSTRALIA
Infant Feeding Guidelines for Health Workers
2. Scott JA, Binns CW. Factors associated with the initiation and duration ofbreast feeding. Aust J Nutr Diet 1998;55(2):51–61.
3. Scott JA, Binns CW, Aroni RA. The influence of reported paternal attitudeson the decision to breastfeed. J Paed Child Hlth 1997;33:305–7.
4. American Academy of Pediatrics. Breastfeeding and the use of human milk.Pediatrics 1997;100:1035–9.
5. Royal Australian College of General Practitioners Council. RACGPbreastfeeding position statement. Melbourne: RACGP Council, 2000.
6. World Health Organization European Region. Infant Nutrition. Geneva:WHO, 1999.
7. World Health Organization. The optimal duration of exclusivebreastfeeding. Press release no. 7. Geneva: WHO, 2001.
8. Dobson B, Murtaugh M. Position of the American Dietetic Association:breaking the barriers to breastfeeding. JADA 2001;101(10):1213–20.
9. Scariati P, Grummer-Strawn L, Fein S. A longitudinal analysis of infantmorbidity and the extent of breastfeeding in the United States. Pediatrics1997;99(6):E5.
10. Duncan B, Ey J, Holberg CJ, Wright AL, Martinez FD, Taussig LM. Exclusivebreastfeeding for at least four months protects against otitis media.Pediatrics 1993;91(5):867–72.
11. Raisler J, Alexander C, O’Campo P. Breastfeeding and infant illness: adose–response relationship? Am J Publ Hlth 1999;89(1):25–30.
12. Kramer M, Chalmers B, Hodnett E, Sevkovskaya E, Dzihovich I, Shapiro Set al. The Promotion of Breastfeeding Intervention Trial (PROBIT): arandomized trial in the Republic of Belarus. JAMA 2001;285(4):413–20.
13. Rogan W, Gladen B. Breastfeeding and cognitive development. Early HumDev 1993;31:181–93.
14. Anderson J, Johnstone B, Remley D. Breast-feeding and cognitivedevelopment: a meta-analysis. Am J Clin Nutr 1999;70(4):525–35.
15. Lanigan J, Bishop J, Kimber A, Morgan J. Systematic review concerning theage of introduction of complementary foods to the healthy full-term infant.Eur J Clin Nutr 2001;55:309–20.
16. Lozoff B, Jimenez E, Wolf A. Long-term developmental outcome of infantswith iron deficiency. N Engl J Med 1991;23:687–94.
17. Walter T, De Andraca I, Chadud P, Perales C. Iron deficiency anemia: adverseeffects on infant psychomotor development. Pediatrics 1989;84:7–11.
18. Palmer N. Breastfeeding: the Australian situation. J Food Nutr 1985;42:13–18.
19. Ryan AS, Rush D, Krieger FW, Lewandowski GE. Recent declines inbreastfeeding in the United States, 1984 through 1989. Pediatrics1991;88(4):719–27.
316
INTRODUCTION: BREASTFEEDING IN AUSTRALIA
Infant Feeding Guidelines for Health Workers
20. Scott J, Landers M, Hughes R, Binns C. Factors associated with theinitiation and duration of breast feeding amongst two populations ofAustralian women. J Paediatr Child Hlth 2001;37:254–61.
21. Donath S, Amir LH. Rates of breast feeding in Australia by state andsocioeconomic status: evidence from the 1995 National Health Survey. JPaediatr Child Hlth 2000;36(2):164–8.
22. Dungy C, Christensen-Szalanski J, Losch M, Russell D. Effect of dischargesamples on duration of breastfeeding. Pediatrics 1992;90:233–7.
23. Howard C, Howard F, Lawrence R, Andresen E, De Blieck E, Weitzman M.Office prenatal formula advertising and its effect on breast-feedingpatterns. Obstet Gynecol 2000;95:296–303.
24. Department of Health and Community Services. Review of theimplementation in Australia of the WHO International Code of Marketingof Breast-milk Substitutes: report of the Steering Committee. Canberra:DHCS, 1993.
25. Young D. Violating the Code: breastfeeding, ethics and choices. Editorial.Birth 2001;28:77–8.
26. Donnelly A, Snowden HM, Renfrew MJ, Woolridge MW. Vol. 2001. TheCochrane Library, 2000.
27. DiGiloroma A, Laurence M, Strawn G, Fein S. Maternity care practices:implications for breastfeeding. Birth 2001;28:94–101.
28. Phillipp B, Merewood A, Miller L, Chawla N. Baby Friendly Hospitalinitiative improves breastfeeding initiation rates in a US hospital setting.Pediatrics 2001;108:677–81.
29. World Health Organization. Protecting, promoting and supportingbreastfeeding: the special role of maternity services. Joint WHO–UNICEFstatement. Geneva: WHO/UNICEF, 1989.
30. USAID–SIDA. The Innocenti declaration: breastfeeding in the 1990s—aglobal initiative. From a meeting held at the Spedale degli Innocenti,Florence, Italy, 30 July – 1 August 1990. Florence: United States Agency forInternational Development & the Swedish International DevelopmentAuthority, 1990.
31. Fairbank L, O’Meara S, Renfrew MJ, Woolridge M, Sowden AJ, Lister-SharpD. Health Technol Assess, 2000;4,1–171.
32. National Health and Medical Research Council. Dietary guidelines forchildren and adolescents. Canberra: AGPS, 1995.
33. National Health and Medical Research Council. Infant feeding guidelinesfor health workers. Canberra: NHMRC, 1996.
34. Knowles R. Independent advice on the composition and modus operandiof APMAIF and the scope of the MAIF agreement. Canberra: Department ofHealth and Aged Care, 2001.
317
INTRODUCTION: BREASTFEEDING IN AUSTRALIA
Infant Feeding Guidelines for Health Workers
I E N C O U R AG I N G A N D S U P P O RT I N GB R E A S T F E E D I N G I N T H EA U S T R A L I A N C O M M U N I T Y
[The breastfeeding guideline in the Dietary Guidelines for Children andAdolescents contains additional material on factors that are important inpromoting breastfeeding initiation and duration.]
A partner who is supportive is important for both the initiation and the durationof breastfeeding. Education of fathers during the antenatal period is a priority asa public health intervention.
Partner support
In my view breastfeeding is like holding down a full time job—only morephysically demanding than most! If your partner is working while you areat home with a baby, sometimes it is difficult for them to understand whythe dinner is not on the table when they get home, the house is a tip andno shirt is ironed ready for the next day’s work. A supportive partner isable to roll up their sleeves and lend a hand when they are at home. Theyalso bring the baby to you in the middle of the night and don’t complainwhen you feed the baby lying down in bed because you are too tired to situpright. It is the small things that help to make it work.
——A senior nutritionist, writing about her own experience
B R E A S T F E E D I N G A S T H E P H Y S I O L O G I C A L N O R M
Numerous studies have demonstrated the importance of breastfeeding formothers and infants. The epidemiological evidence confirms the protectiveeffects of breastfeeding, in both developed and less-developed countries.1–3
Breastfeeding has positive effects on the nutritional, health and psychologicalmake-up of the infant and brings health and fertility-control benefits for themother. It also offers economic benefits to both the family and society.
Benefits to the infant
Nutrition
It is now clear that the composition of breastmilk is uniquely suited to theneonate, at a time when growth and development are occurring at very highrates yet when many of the infant’s systems—such as the digestive, hepatic,
318
I. ENCOURAGING AND SUPPORTING BREASTFEEDING IN THE AUSTRALIAN COMMUNITY
Infant Feeding Guidelines for Health Workers
neural, renal, vascular and immune systems—are functionally immature. Many ofthe nutrients contained in breastmilk are in readily absorbed and bioavailableforms.4
Breastmilk is not only a high-quality food; it also contains many components—forexample, bile salt–stimulated lipase, glutamate, certain polyunsaturated long-chain fatty acids, low sodium, lysozyme, immunoglobulin A, growth factors andnumerous other bioactive factors—that facilitate optimal function of the infant’simmature systems. The living cells found in breastmilk are also importantfunctionally.
Furthermore, the young of various mammals are born at very different stages ofmaturity, and it is not easy to modify the milk of one species so that it optimisesthe metabolism of the young of another species.
Health
Studies have shown that breastfeeding reduces the risk or severity of a numberof disease states, among them the following:
• physiological reflux5
• pyloric stenosis6
• respiratory illness, particularly in households where both parents smoke7
• asthma8,9
• obesity10,11
• gastrointestinal tract disease12,13
• inflammatory bowel disease14
• some childhood cancers15,16
• coeliac disease—reduced incidence17 or delayed onset17–20
• otitis media21,22 ,3
• urinary tract infections23,24
• bacteraemia-meningitis25,26
• SIDS—sudden infant death syndrome27–29
• necrotising enterocolitis in premature infants—reduced incidence.30
A detailed review of the scientific and epidemiological evidence in support of theWorld Health Organization’s and UNICEF’s Global Strategy for Infant and YoungChild Feeding provides detailed summaries and assessments of the most relevantstudies. (León-Cava, Lutter et al. 2002)
The mechanism whereby middle ear pressure changes during bottle-feeding andpredisposes to ear infection has recently been described.31
In children who were breast-fed for at least three months, a longitudinal study inAustralian children has shown an improvement in bone mass in eight-year-oldchildren.32
The association between breastfeeding dose and illnesses in the first six months oflife was analysed by reviewing illness episodes in 7092 infants from the National
319
I. ENCOURAGING AND SUPPORTING BREASTFEEDING IN THE AUSTRALIAN COMMUNITY
Infant Feeding Guidelines for Health Workers
Maternal and Infant Health Survey.33 Full breastfeeding was associated with thelowest illness rates, while minimal breastfeeding was not protective. Breastfeedingconferred health benefits on infants from all socio-economic groups.
Colic and/or excessive crying in their infants is often a complaint of mothers.Whether colic exists as a separate entity or as symptom of a maternal problem isoften debated. However, in a study of 3345 infants aged 1 to 6 months (96 percent response rate), the prevalence of colic was twice as high among infants ofsmoking mothers but significantly less among breastfed infants. Maternalsmoking as a potential risk factor for infantile crying needs further study.34 Ameta-analysis identified 27 controlled trials of a number of interventions forcolic; the authors concluded that for non-breastfed infants ‘infantile colic shouldpreferably be treated by advising carers to reduce stimulation and with a oneweek trial of a hypoallergenic formula milk’.35
Studies on colic are fraught with definitional problems, and many of the studiesidentified were of short duration. For breastfed infants, simple strategies such aschanging to a more upright position should be tried. Letting the baby ‘finish thefirst side first’ can also be helpful.36 In the management of colic, discussion withthe mother followed by environmental changes should be the first response;changing to an expensive formula should be a last resort, and then only forbabies not being breastfed.
Diabetes
Using data from the Oxford Record Linkage Study, Jones and colleagues wereable to demonstrate a significant 33% increased risk of diabetes among infantswho were not breastfed at discharge.37 The development of insulin-dependentdiabetes mellitus (type 1 diabetes) is linked to the age at which cow’s milk isintroduced to an infant’s food intake.38 Breastmilk contains factors that protectthe infant against developing this disease.39,40
Leukaemia
In a case-control study of children under the age of 14 years with leukaemia,2200 cases and 2419 controls were studied. Ever having breastfed was found tobe associated with a 21 per cent reduction in risk of childhood acute leukaemias(odds ratio for all types combined = 0.79; 95%CI: 0.70–0.91).41 A further ninecase-control studies have suggested that children who have never been breastfedor were breastfed in the short-term only have a higher risk than those breastfedfor six months or more of developing Hodgkin’s disease. 41 Further studies areneeded to confirm the strength of these relationships.
Specific immune factors
Immunoglobulin A (IgA) is the most abundant antibody in breastmilk. It ismanufactured in and excreted by the breast in response to specific bacteria andviruses to which the mother is exposed. This provides protection against
320
I. ENCOURAGING AND SUPPORTING BREASTFEEDING IN THE AUSTRALIAN COMMUNITY
Infant Feeding Guidelines for Health Workers
pathogens the infant is most likely to encounter in his or her localenvironment.42 IgG and IgM antibodies offer further protection against specificpathogens.43 Donnet-Hughes et al. have reviewed all the specific and non-specific factors present in breastmilk44 and Oddy has reviewed currentknowledge of immune factors in breastmilk.45
Non-specific protective factors46
• Lactoferrin has a high binding affinity with iron, making it unavailable tomicro-organisms such as E. coli and Candida albicans, which require ironfor growth. Further, a peptide with bactericidal properties is released fromlactoferrin, and it is possible that this peptide is responsible for much ofthe antibacterial action attributed to lactoferrin.47,48 Similarly, vitaminB
12-binding proteins make vitamin B
12unavailable to micro-organisms.
• Lysozyme is bactericidal against certain gram-negative rods and gram-positive bacteria.
• Prolactin enhances the development of B- and T-lymphocytes and affectsdifferentiation of intestinal lymphoid tissue. Cortisol, thyroxine, insulin andgrowth factors promote maturation of the newborn’s intestine and thedevelopment of intestinal host defences.
• The functions of cellular components such as macrophages and monocytes,neutrophils and B- and T-lymphocytes are not yet fully understood but doinclude the inhibition and/or destruction of micro-organisms such asbacteria and viruses.43 The concentration of these cellular components isespecially high in colostrum, but they are present in all breastmilk.
• Oligosaccharides form the third most abundant class of compounds inbreastmilk (12–24 grams per litre). Over 130 different oligosaccharideshave been isolated from human milk49 , and most are resistant to digestionin the small intestine. They provide specific growth factors for thedesirable bifidus bacteria of the large intestine. They also inhibit theattachment of pathogenic bacteria to the mucosal surfaces of the intestinaland urinary tracts and may provide important precursors for thedevelopment of the brain in early infancy.
• Fatty acids are released from milk fat by the hydrolytic action betweenmilk and infant lipases. Some of these free fatty acids have antimicrobialactions.50
The concentration of most of these protective factors is highest in colostrum; itdecreases as lactation is established and increases again during slow weaning.Although breastfeeding is of particular value while the infant’s immune system isimmature, it continues to offer some protection throughout the entire course oflactation.45,51
321
I. ENCOURAGING AND SUPPORTING BREASTFEEDING IN THE AUSTRALIAN COMMUNITY
Infant Feeding Guidelines for Health Workers
Breastfeeding and allergy
Breastfeeding offers at least some protection against allergy. In the generalpopulation and in atopic families, it can protect against allergic rhinitis,wheezing, asthma and atopy in children.8,9 A prospective study of 2187 WesternAustralian children showed that breastfed infants had lower rates of asthma andatopic disease. After adjusting for confounding factors, the introduction of milkother than breastmilk, led to increased rates of asthma at 6 years of age (OR1.25, 1.02-1.52) and of atopic disease (1.30, 1.04-1.61).8 The results of somestudies are confounded by the failure to control for the introduction of cow’smilk formula in hospital in the newborn period. The mother’s own feedinghistory and intake of dietary allergens may also be significant.52 Among thereasons breastfed babies have fewer occurrences of atopic disease are:
• reduced exposure to the food proteins present in formulas and other foods
• improved maturation of the intestinal barrier, which reduces the absorptionof large molecules
• reduced frequency of infection, which can act as an adjuvant
• the presence of anti-inflammatory factors and antibodies in humanbreastmilk.53,54
Cytokine, growth factors, hormones and other bioactive components in humanmilk may play an important role in modulating the development of asthma.46
Allergy is often a concern for parents and health workers. Current preventivestrategies are limited, and many children still develop allergies despite efforts atprevention. If through family history an infant is identified as being at high riskof developing an allergy, the practical tips in Box I.1 may be of assistance.
322
I. ENCOURAGING AND SUPPORTING BREASTFEEDING IN THE AUSTRALIAN COMMUNITY
Infant Feeding Guidelines for Health Workers
Benefits later in life
Breastfeeding confers health advantages that persist into later life. Obviously,this is a difficult area to study because of time lags and differences in definitions.In a study of 625 adults aged about 50 years in Holland, information on infantfeeding methods was available. Exclusive breastfeeding seems to have aprotective effect against some risk factors for cardiovascular disease in later life,including lipoprotein and glucose levels.55 Part A of the ‘Special considerations’section in the Dietary Guidelines for Children and Adolescents provides furtherinformation about these benefits.
Psychological benefits
Breastfeeding can be an important factor in the bonding between mother andinfant. The interdependence between the breastfeeding mother and infant, theregular close interaction, and the skin-to-skin contact during breastfeedsencourage mutual responsiveness and attachment.
Several studies have shown that the method of feeding in early life affectscognitive development. Children who were breastfed are reported to gain higher
Box I.1 Minimising the risk of allergy in high-risk infants
• Do not smoke during pregnancy, and provide a smoke-free environment for your childafter birth.
• Dietary restrictions in pregnancy are not recommended.
• Exclusively breastfeed your child for at least six months, and preferably longer.
• If breastfeeding is discontinued for any reason, seek professional advice. A hydrolysedprotein formula may be recommended.
• Soy milk and goat’s milk formulas do not reduce allergies, and should not be used as analternative to cow’s milk formulas.
• Solid foods should not be introduced until about 6 months of age.
• Start with low-allergenic foods such as single-grain baby cereals, followed by vegetablesand fruits, then meats.
• Add only one food at a time. Wait several days (ideally five to 10 days) beforeintroducing a new food.
• If there is a strong history of allergy in the family, delay introducing some or all of thehighly allergenic foods during the first year—including cow’s milk and other dairyproducts, soy products, eggs, nuts and fish. It is best to continue to avoid nuts andshellfish until the age of 3 years.
• The foods most commonly associated with allergies are eggs, nuts, dairy products, soyaand shellfish. If breastfeeding, the mother should avoid these foods.
• Simple measures designed to reduce the amount of house dust in the child’s bedroomand play areas—for example, using barrier encasing for the mattress and pillow andremoving carpets—may help prevent the development of allergy.
• The role of pets in the development of allergy is controversial. It is currentlyrecommended that household pets be kept outside and away from the child’s bedroomand play areas.
323
I. ENCOURAGING AND SUPPORTING BREASTFEEDING IN THE AUSTRALIAN COMMUNITY
Infant Feeding Guidelines for Health Workers
scores on tests of intelligence and language development than those who werebottle-fed. This beneficial effect becomes more pronounced with increasingduration of breastfeeding.56,57 Pre-term infants given breastmilk for at least onemonth had enhanced cognitive development (approximately 7 IQ units) at 7 to8 years of age compared with formula-fed pre-term infants.19,20,58–61 This researchhas been extended to term infants, with similar results for both cognitive andvisual development. These responses may be related to the higher concentrationof a particular polyunsaturated long-chain fatty acid (docosahexaenoic acid, orDHA) in breastmilk.62
Benefits to the mother
Health
Breastfeeding shows some protection against premenopausal breast cancer63–67,72
ovarian cancer68,69 and osteoporosis.70,71
The Collaborative Group on Hormonal Factors in Breast Cancer has broughttogether worldwide data from epidemiological studies in 30 countries thatincluded information on breastfeeding patterns and other aspects ofchildbearing72 . Their meta-analysis showed a relative risk of breast cancerreduction of 4·3% (95% CI 2·9–5·8; p<0·0001) for every 12 months ofbreastfeeding in addition to a decrease of 7·0% (5·0-9·0; p<0·0001) for each birth.
Breastfeeding hastens uterine involution after birth and helps the mother regainher pre-pregnancy body weight (providing that breastfeeding continues for morethan seven months).73
Contraceptive effect
Although breastfeeding is not regarded as a reliable method of contraception forindividual women in Australia, it does provide useful benefits on a population-wide basis. If all women in the world stopped breastfeeding, it is estimated that30 to 50 per cent more children would be born in the following 12 months. Therisk of pregnancy during periods of lactational amenorrhoea is as low as 1.7 percent in the first six months74 , and even in developed countries that comparesfavourably with barrier methods of contraception, as long as the woman remainsamenorrhoeic.75–77 For example, amenorrhoea is increased by exclusive and morefrequent nursing, especially at night.78
R E F E R E N C E S
1. Cunningham AS, Jelliffe D, Jelliffe EFP. Breastfeeding and health in the1980s: a global epidemiological review. J Pediatrics 1991;118(5):659–66.
2. Arifeen SE, Black RE, Caulfield LE, Antelman G, Baqui A. Determinants ofinfants growth in the slums of Dhaka: size and maturity at birth,breastfeeding and morbidity. Eur J Clin Nutr 2001;55(3):167–78.
324
I. ENCOURAGING AND SUPPORTING BREASTFEEDING IN THE AUSTRALIAN COMMUNITY
Infant Feeding Guidelines for Health Workers
3. Heinig MJ. Host defense benefits of breastfeeding for the infant. Effect ofbreastfeeding duration and exclusivity. Pediatr Clin North Am2001;48(1):105–23, ix.
4. Lawrence RA, Lawrence RM. Breastfeeding: a guide for the medicalprofession. 4th edn. St Louis: CV Mosby, 1999.
5. Heacock H, Jeffery H, Baker J, Page M. Influence of breast versus formulamilk on physiological gastroesophageal reflux in healthy, newborn infants.J Ped Gastroent Nutr 1992;14(1):41–6.
6. Habbick BF, Khanna C, To T. Infantile hypertrophic pyloric stenosis: astudy of feeding practices and other possible causes. CMAJ1989;140(4):401–4.
7. Woodward A, Douglas RM, Graham N, Miles H. Acute respiratory illness inAdelaide children: breastfeeding modifies the effects of passive smoking. JEpidem and Comm Hlth 1990;44:224–30.
8. Oddy W, Holt P, Sly P, Read A, Landau L, Stanley F et al. Associationbetween breastfeeding and asthma in 6 year old children: findings of aprospective birth cohort study. BMJ 1999;319:815–19.
9. Gdalevich M, Mimouni D, Mimouni M. Breastfeeding and the risk ofbronchial asthma in childhood: a systematic review and meta-analysis ofprospective studies. J Pediatrics 2001;139:261–6.
10. Fisher J, Birch L, Smiciklas-Wright H, Picciano M. Breast-feeding throughthe first year predicts maternal control in feeding and subsequent toddlerenergy intakes. JADA 2000;100:641–6.
11. von Kries RB, Sauerwald T, von Mutius E, Barnert D, Grunert V, von VossH. Breast feeding and obesity: cross sectional study. BMJ 1999;319:147–50.
12. Howie PW, Forsyth JS, Ogston SA, Clark A, Florey CD. Protective effect ofbreast feeding against infection. BMJ 1990; 300(6716):11–16.
13. Sethi D, Cumberland P, Hudson MJ, Rodrigues LC, Wheeler JG, Roberts JAet al. A study of infectious intestinal disease in England: risk factorsassociated with group A rotavirus in children. Epidemiol Infect2001;126(1):63–70.
14. Calkins BM, Mendeloff AL. Epidemiology of inflammatory bowel disease.Epidemiol Rev 1986;8:60–91.
15. Davis MK, Savitz DA, Graubard BL. Infant feeding and childhood cancer.Lancet 1988;2(8607):365–8.
16. Bener A, Denic S, Galadari S. Longer breast-feeding and protection againstchildhood leukaemia and lymphomas. Eur J Cancer 2001;37:234–8.
17. Peters U, Schneeweiss S, Trautwein E, Erbersdoble H. A case-control studyof the effect of infant feeding on celiac disease. Annals Nutr Metab2001;45:135–9.
325
I. ENCOURAGING AND SUPPORTING BREASTFEEDING IN THE AUSTRALIAN COMMUNITY
Infant Feeding Guidelines for Health Workers
18. Kelly DA, Phillips AD, Elliott EJ, Dias JA, Walker-Smith JA. Rise and fall ofcoeliac disease 1960–85. Arch Dis Child 1989;64:1157–60.
19. Knowles R. Independent advice on the composition and modus operandiof APMAIF and the scope of the MAIF agreement. Canberra, 2001.
20. Lang S, Lawrence CJ, Orme RE. Cup feeding: an alternative method toinfant feeding. Arch Dis Child 1994;71:365–9.
21. Duncan B, Ey J, Holberg CJ, Wright AL, Martinez FD, Taussig LM. Exclusivebreastfeeding for at least four months protects against otitis media.Pediatrics 1993;91(5):867–72.
22. Lawrence R. The clinician’s role in teaching proper infant feedingtechniques. J Pediatr 1995;126(6):S112–S117.
23. Pisacane A, Graziano L, Mazarella G, Scarpellino B, Zona G. Breastfeedingand urinary tract infection. J Pediatrics 1992;120:87–9.
24. Coppa GV, Gabrielli O, Giorgi P, Catassi C, Montanari MP, Varaldo PE.Preliminary study of breastfeeding and bacterial adhesion to ureoepithelialcells. Lancet 1990;335:569–71.
25. Cochi SL, Fleming DW, Hightower AW, Limpakamjanarat K, Facklam RR, SmithJD, et al. Primary invasive Haemophilus influenzae type b disease: apopulation-based assessment of risk factors. J Pediatrics 1986;108(6):887–96.
26. Takala AK, Eskola J, Palmgren J, Ronnberg PR, Kela E, Rekola P, MakelaPH. Risk factors of invasive Haemophilus influenzae type b disease amongchildren in Finland. J Pediatrics 1989;115:694–701.
27. Mitchell EA, Scragg R, Stewart AW, Becroft DM, Taylor BJ, Ford RP et al.Results from the first year of the New Zealand cot death study. NZ Med J1991;104(906):71–6.
28. Scragg R, Stewart AW, Mitchell EA, Ford RP, Thompson JM. Public healthpolicy on bed sharing and smoking in the sudden infant death syndrome.NZ Med J 1995;108(1001):218–22.
29. Kiechl-Kohlendorfer U, Peglow UP, Kiechl S, Oberaigner W, Sperl W.Epidemiology of sudden infant death syndrome SIDS) in the Tyrol before andafter an intervention campaign. Wien Klin Wochenschr 2001;113:27–32.
30. Lucas A, Cole TJ. Breast milk and neonatal necrotising enterocolitis. Lancet1990;336:1519–23.
31. Brown CE, Magnuson B. On the physics of the infant feeding bottle andmiddle ear sequela: ear disease in infants can be associated with bottlefeeding. Int J Pediatr Otorhinolaryngol 2000;54(1):13–20.
32. Jones G, Riley M, Dwyer T. Breastfeeding in early life and bone mass inprepubertal children: a longitudinal study. Osteoporosis International2000;11:146–52.
33. Raisler J, Alexander C, O’Campo P. Breastfeeding and infant illness: adose-response relationship? Am J Pub Hlth 1999;89(1):25–30.
326
I. ENCOURAGING AND SUPPORTING BREASTFEEDING IN THE AUSTRALIAN COMMUNITY
Infant Feeding Guidelines for Health Workers
34. Reijneveld SA, Brugman E, Hirasing RA. Infantile colic: maternal smokingas potential risk factor. Arch Dis Childhood 2000;83(4):302–3.
35. Lucassen PL, Assendelft WJ, Gubbels JW, van Eijk JT, van Geldrop WJ,Neven AK. Effectiveness of treatments for infantile colic: systematicreview. BMJ 1998;316:1563–9.
36. Trenholme A. Colic—more than one solution. BMJ 1998;316(23 May).
37. Jones, M., A. Swerdlow, et al. Pre-natal and early life risk factors forchildhood onset diabetes mellitus: A record linkage study. Int JEpidemiol 1998;27: 444–449
38. Mayer EJ, Hamman RF, Gay EC, Lezotte DC, Savitz DA, Klingensmith GJ.The Colorado IDDM Registry Reduced risk of IDDM among breast-fedchildren. Diabetes 1988;37:1625–32.
39. Howie PW, Forsyth JS, Ogston SA, Clark A, Florey CD. Protective effect ofbreast feeding against infection. BMJ 1990;300(6716):11–16.
40. Couper J. Environmental triggers of type 1 diabetes. J Paediatr Ch Hlth2001;37:218–20.
41. Shu XO, Linet MS, Steinbuch M, Wen WQ, Buckley JD, Neglia JP et al.Breastfeeding and risk of childhood acute leukemia. JNCI1999;91(20):1765–72.
42. Hanson LA. Breastfeeding provides passive and likely long-lasting activeimmunity. Ann Allergy Asthma Immunol 1998;81(6):523–33.
43. Hausman CL, Callahan CA. Breastfeeding: advantages andcontraindications. Del Med J 1989;61(5):219, 223–7.
44. Donnet-Hughes A, Duc N, Serrant P, Vidal K, Schiffrin E. Bioactivemolecules in milk and their role in health and disease: the role oftransforming growth factor-b. Immunol Cell Biol 2000;78:74–9.
45. Oddy W. Breastfeeding protects against illness and infection in infants andchildren: a review of the evidence. Breastfeed Rev 2001;9:11–18.
46. Hamosh H. Bioactive factors in human milk. Ped Clin N Am 2001;48(1):69–86.
47. Tomita M, Takase M, Wakabayashi H, Bellamy W. Anti-microbial peptidesof lactoferrin. Adv Exp Med Biol 1994;357:209–18.
48. Oppenheimer SJ. Iron and its relation to immunity and infectious disease. JNutr 2001;131:616S–633S, 633S–635S.
49. Renner E. Micronutrients in milk and milk-based food products. London &New York: Elsevier Applied Science, 1989.
50. Subcommittee on Nutrition during Lactation. Nutrition during lactation.Washington DC: National Academy Press, 1991.
51. Goldman AS, Goldblum R, Garza C. Immunologic components in humanmilk in the second year of lactation. Acta Paediatr Scand 1983;72:461–2.
327
I. ENCOURAGING AND SUPPORTING BREASTFEEDING IN THE AUSTRALIAN COMMUNITY
Infant Feeding Guidelines for Health Workers
52. Bahna SL. Factors determining the development of allergy in infants.Allergy Proc 1992;13:21–5.
53. Chandra RK. Food allergy and nutrition in early life: implications for laterhealth. Proc Nutr Soc 2000;59:273–7.
54. Dandrifosse G, Peulen O, El Khefif N, Deloyer P, Dandrifosse A, GrandfilsC. Are milk polyamines preventive agents against food allergy? Proc NutrSoc 2000;59:81–6.
55. Ravelli ACJ, van der Meulen JHP, Osmond C, Barker DJP, Bleker OP. Infantfeeding and adult glucose tolerance, lipid profile, blood pressure, andobesity. Arch Dis Child 2000;82:248–52.
56. Lancet. Breastfeeding and Cognitive development. Lancet 1996;347:1057.
57. Angelsen NK, Vik T, Jacobsen G, Bakketeig LS. Breast feeding andcognitive development at age 1 and 5 years. Arch Dis Child2001;85(3):183–5.
58. Bauer G, Ewald LS, Hoffman J, Dubanoski R. Breastfeeding and cognitivedevelopment of three year-old children. Psych Reports 1991;68(3)(Pt2):1218.
59. Carlson SE, Peeples JM, Werkman SH, Cooke RJ, Wilson WM. Arachidonicacid (AA) in plasma and red blood cell (RBC) phospholipids (PL) duringfollow up of preterm infants: occurrence, dietary determinants andfunctional relationships. Second International Conference on the HealthEffects of Omega-3 Fatty Acids in Seafoods. Washington DC, 1990.
60. Lucas A, Morley R, Cole TJ, Lister G, Leeson-Pope C. Breast milk andsubsequent intelligence quotient in children born preterm. Lancet1992;339:261–4.
61. Horwood LJ, Darlow BA, Mogridge N. Breast milk feeding and cognitiveability at 7–8 years. Arch Dis Child Fetal Neonatal Ed 2001;84(1):F23–F27.
62. Makrides M, Neumann MA, Byard RW, Simmer K, Gibson RA. Fatty acidcomposition of brain, retina and erythrocytes in breast and formula fedinfants. Am J Clin Nutr 1994;60:189–94.
63. McTiernan A, Thomas DA. Evidence for the protective effect of lactationon risk of breast cancer in young women. Am J Epidemiol 1986;124:353–8.
64. Yuan J, Yu MC, Ross RK, Gao Y, Henderson BE. Risk factors for breastcancer in Chinese women in Shanghai. Cancer Res 1988;48:1949–53.
65. Siskind V, Schofield F, Rice D, Bain C. Breast cancer and breastfeeding: resultsfrom an Australian case control study. Am J Epidemol 1989;130:229–36.
66. Brinton LA, Potischman NA, Swanson CA, Schoenberg JB, Coates RJ,Gammon MD et al. Breastfeeding and breast cancer risk. Cancer CausesControl 1995;6(3):199–208.
67. Lipworth L, Bailey LR, Trichopoulos D. History of breastfeeding in relationto breast cancer risk: a review of the epidemiologic literature. J Nat CancerInst 2000;92:302–12.
328
I. ENCOURAGING AND SUPPORTING BREASTFEEDING IN THE AUSTRALIAN COMMUNITY
Infant Feeding Guidelines for Health Workers
68. Gwinn ML, Lee NC, Rhodes PH, Layde PM, Rubin GL. Pregnancy,breastfeeding, and oral contraceptives and the risk of epithelial ovariancancer. J Clin Epidemiol 1990;43(6):559–68.
69. Whittemore AS. Characteristics relating to ovarian cancer risk: implicationsfor prevention and detection. Gynecol Oncol 1994;55(3)(Pt 2):S15–S19.
70. Cummings SR, Kelsey JL, Nevitt MC, O’Dowd KJ. Epidemiology ofosteoporosis and osteoporotic fractures. Epidemiol Rev 1985;7:178–203.
71. Labbok MH. Effects of breastfeeding on the mother. Pediatr Clin North Am2001;48:143–58.
72 CCGHFBC and CGoHFiB. Cancer (2002). “Breast cancer and breastfeeding:collaborative reanalysis of individual data from 47 epidemiological studiesin 30 countries, including 50 302 women with breast cancer and 96 973women without the disease.” Lancet 360: 187-195.
73. Dewey KG, Heinig MJ, Nommsen LA, Peerson JM, Lonnerdal B. Breast-fedinfants are leaner than formula-fed infants at 1 y of age: the DARLINGstudy. Am J Clin Nutr 1993;57(2):140–5.
74. Short RV, Lewis PR, Renfree M, Shaw G. Contraceptive effect of extendedlactational amenorrhoea: beyond the Bellagio Concensus. Lancet1991;337:715–17.
75. Kennedy KL, Visness CM. Contraceptive efficacy of lactationalamenorrhoea. Lancet 1992;339:227–30.
76. Gray RH, Campbell OM, Apelo R, Eslami SS, Zacur H, Ramos RM et al. Riskof ovulation during lactation. Lancet 1990;335:25–9.
77. Labbok M, Cooney K, Coly S. Guidelines for breastfeeding, familyplanning, and the lactational amenorrhea method—LAM. Washington DC:Institute of Reproductive Health, Georgetown University, 1995.
78. Heinig MJ, Nommsen-Rivers LA, Peerson JM, Dewey KG. Factors related toduration of postpartum amenorrhoea among USA women with prolongedlactation. J Biosoc Sci 1994;26(4):517–27.
329
I. ENCOURAGING AND SUPPORTING BREASTFEEDING IN THE AUSTRALIAN COMMUNITY
Infant Feeding Guidelines for Health Workers
I I I N I T I AT I N G , E S TA B L I S H I N G A N DM A I N TA I N I N G B R E A S T F E E D I N G
Health professionals and voluntary health workers can provide invaluable helpfor mothers initiating breastfeeding. Offering factual information and sympatheticsupport, demonstrating practical skills, and discussing strategies for problemsolving all work to create a positive environment for breastfeeding. Nevertheless,it is important to view this role as one of encouragement and support betweenmother and worker, always having regard for the mother’s suggestions, concernsand cultural background.
B R E A S T F E E D I N G E D U C AT I O N F O R PA R E N T S
All women should be informed of the benefits of breastfeeding and the risks ofnot breastfeeding. Health professionals should also discuss the management ofbreastfeeding with them, and they should be encouraged to use the servicesavailable for antenatal education. The antenatal education should cover theimportance of exclusive breastfeeding for the first six months (including thenutritional and protective benefits), basic breastfeeding management, and copingwith minor problems. Mothers should also be encouraged to become familiar andcomfortable with handling their breasts. Virtually every mother can breastfeed,but for some it is not so easy and learning and patience are necessary.1
In many cultures the support of grandmothers and other female relatives is veryimportant and changes in family structures in Australian society now mean thatthe father’s role has assumed greater importance. Education programs shouldinvolve fathers and help them understand the advantages of breastfeeding andthe role they can play in supporting the breastfeeding mother.2,3
Since breastfeeding should be regarded as ‘best practice’, mothers wishing toinitiate formula feeding in a health care institution should sign a form indicatingtheir informed consent. A policy using standard informed-consent proceduresshould be considered; this is required by the Baby Friendly Hospital initiative.The Baby Friendly Hospital initiative should be implemented in all maternityfacilities in Australia, and a 10-year plan for achieving this should be prepared.
A range of useful, easy-to-read, publications dealing with pregnancy andbreastfeeding is available through antenatal programs, outpatient services, earlychildhood centres, community health centres, and medical practitioners.Hospitals and other agencies should offer information about the AustralianBreastfeeding Association and contact details for local support groups. Aresource list is provided in Appendix I. The ABA’s (Australian Breastfeeding
330
II. INITIATING, ESTABLISHING AND MAINTAINING BREASTFEEDING
Infant Feeding Guidelines for Health Workers
Association) Lactation Resource Centre has breastfeeding information available ina variety of media. Many of these resources are also available from local ABAgroups.
In hospital during the postnatal period, midwives give support, help and adviceas mothers begin breastfeeding. A lactation consultant is generally available ifsomeone experiences difficulties and needs specialist advice. Women whosebabies are in special care should be encouraged—using both practicaldemonstration and written information—to initiate and maintain an adequatemilk supply. When expression of breastmilk is required, mothers sometimes haveparticular difficultly in the immediate post-partum period and may require extrasupport.
Following discharge from hospital, support, particularly from home-supportmidwives and lactation consultants, should still be available. Mothers are alsoencouraged to seek assistance from other people, such as maternal and childhealth nurses and ABA counsellors. General practitioners need to be familiarwith breastfeeding or at least with points of referral for assistance.
A N T E N ATA L A D V I C E
The initial antenatal interview between a woman and her doctor or midwifeshould include a careful assessment of a woman’s (and her partner’s) attitudes,beliefs, expectations, knowledge and experience in relation to infant feeding.Nursing and medical practitioners often leave discussion of breastfeeding untillater in the pregnancy, but research shows that the earlier in the pregnancy adecision to breastfeed is made the more likely the breastfeeding will besuccessful.4
During antenatal examination the following breast characteristics should benoted:
• scars indicating previous surgery
• extra-large breasts, which may sometimes cause initial difficulties withattachment
• nipple or areola eczema or dermatitis
• minimal or absent development of the mammary tissue—very rare
• any other breast pathology.
Physical problems that interfere with breastfeeding are extremely rare, and inmost societies breastfeeding has been universal.5,6 Antenatal treatment of invertedor non-protractile nipples is not recommended: it has been found to beineffective and associated with a negative impact on breastfeeding.7 Variouspractices for antenatal nipple preparation—including some form of nipplefriction, applications of cream, and antenatal expression of colostrum—have
331
II. INITIATING, ESTABLISHING AND MAINTAINING BREASTFEEDING
Infant Feeding Guidelines for Health Workers
been evaluated by a number of researchers, but no evidence has been found tosupport these practices.8 Nor is there evidence to support the commonly heldbelief that fair-skinned women are more likely to experience nipple problems.9,10
P H Y S I O L O G Y O F B R E A S T M I L K A N D B R E A S T F E E D I N G
Breastmilk production
The alveoli of the breast mature during pregnancy under the control of thehormones of pregnancy. Progesterone, prolactin and human placental lactogenare essential for the final stages of mammary growth and differentiation.Lactogenesis Stage One is complete by mid-pregnancy; the breast is then able tosecrete and lactose is found in blood and urine. During the first three to fourdays post-partum, copious milk secretion occurs; this is Lactogenesis StageTwo11 , and it involves preparation of the mammary epithelium, progesteronewithdrawal, maintained prolactin levels, and removal of milk from the breast.12
Control of the initiation of lactation after birth
Late in pregnancy, copious milk production is inhibited by the highconcentrations of blood progesterone. In the presence of permissive hormones(prolactin, cortisol and insulin), the withdrawal of progesterone following thedelivery of the placenta triggers a rapid increase in milk productionapproximately 30 to 40 hours after birth.13
The withdrawal of progesterone and the changes in milk composition followingdelivery by Caesarean section are similar to those following normal delivery.14
Where possible, management of breastfeeding after a Caesarean birth should besimilar to that after a normal birth. Initiation of lactation is delayed a further 24hours in women who have type 1 diabetes15 and may be inhibited if there is aretained placental fragment.16
Milk ‘comes in’ about 48 to 72 hours after birth14 and is perceived by the motheras the start of lactation. However, milk ‘coming in’ does not mean a suddenincrease in the infant’s milk intake, and the aetiology of associated engorgementis poorly understood.
Four secretory processes are involved in the production of milk by the mammarygland:
• exocytosis
• fat synthesis and secretion
• secretion of ions and water
• transcystosis of immunoglobulins and other substances, from the interstitialspace17 and the paracellular pathway.
332
II. INITIATING, ESTABLISHING AND MAINTAINING BREASTFEEDING
Infant Feeding Guidelines for Health Workers
Regulation of milk production
It has long been known that one of the most important factors in successfullactation is removing milk from the breasts. Recent research shows that thelactating mammary gland exercises a local feedback inhibitory control over milksynthesis, referred to as autocrine control.18,19 It is important to emphasise thefollowing simple equation:
SUPPLY = DEMAND
The rate of milk production is regulated to match the amount of milk removedfrom each breast at each breastfeed. If milk withdrawal has not started withinthree days post-partum, the changes in milk composition with lactogenesis arereversed and the likelihood of the establishment of successful breastfeedingdeclines.20,12
Prolactin is secreted by the anterior pituitary gland in response to sucking andthe consequent stimulation of the nerve endings in the nipple and areola. Thesecretion is greatest in early lactation and declines to only a small response sixmonths after birth. There does not appear to be any relationship between therelease of prolactin and milk yield: it is thought that hormonal influencesregulate the maximum potential for milk production in women and that autocrinecontrol ‘downregulates’ milk synthesis to match the mother’s supply of milk tothe infant’s appetite. In contrast with fat, the concentration of prolactin is high inthe ‘fore milk’ but low in the ‘hind milk’. However, the physiological significanceof these changes is unknown.
A meta-analysis of the milk volumes of exclusively breastfeeding women showsthat milk production is fairly constant across studies from a number of differentcountries, at about 800 millilitres a day (820ml; SD 110ml).17
Milk ejection
Within seconds of a baby stimulating the sensory nerve endings around thenipple by sucking, a pulse of oxytocin is released from the posterior pituitarygland. Oxytocin stimulates the contraction of myoepithelial cells surrounding thealveoli, and milk is forced into the ducts and milk sinuses towards the nipple.This process is known as milk ejection or milk let-down. Multiple releases ofoxytocin can occur during a breastfeed (or during breast expression). Milkejection can be blocked by stress, but it rarely seems to be a problem inbreastfeeding mothers; on the other hand, eliciting milk ejection can at times bea problem for mothers expressing breastmilk.
Breastmilk composition
Human breastmilk is a very complex secretion, consisting of thousands ofcompounds and cellular components.21 Furthermore, the composition of milkvaries greatly between different species, and mature human milk tends to fall at

333
II. INITIATING, ESTABLISHING AND MAINTAINING BREASTFEEDING
Infant Feeding Guidelines for Health Workers
one extreme (see Tables II.1 and II.2), having very low concentrations of proteinand sodium chloride and high concentrations of lactose and oligosaccharides.22
Appendix G provides a detailed table of composition. Human milk has acharacteristic very pale whitish-blue appearance. One important component is, ofcourse, water: this meets all the infant’s requirements, and for at least six monthsno additional fluids are required when breastfeeding.
Breastmilk’s whiteness is a result of its fat content, so hind milk, which usuallyhas a higher fat content than fore milk, has a whiter appearance. It is misleadingto describe breastmilk as ‘thin’ or ‘watery’: it contains the same energy and totalsolids content as cow’s milk. Precipitation of the casein curd from milk produceswhey that contains soluble proteins, lactose and many water-soluble minorcomponents.
Table II.1 Composition of mature human milk and cow’s milk andcomposition of infant formula
Mean value forComponent mature human milk Cow’s milk Infant formulaa
Energy (kJ) 280 276 273–285
Energy (kcal) 67 66 65–68
Protein (g) 1.3b 3.2 1.5–1.7
Fat (g) 4.2 3.9 3.6–3.9
Lactose (g) 7 4.6 7.0–7.6
Sodium (mg) 15 55 14–17
Chloride (mg) 43 97
Calcium (mg) 35 120 42–55
Phosphorus (mg) 15 92 21–32
Iron (µg) 76c 60 700–800
Vitamin A (µg) 60 35
Vitamin C (mg) 3.8 1.8 5.4–7.1
Vitamin D (µg) 0.01 0.08
Linoleic acid (mg) – – Minimum 190mg
Potassium (mg) 60-70 – 56–59
Magnesium (mg) 3.0-3.5 – 4.5–5.3
Renal solute load – – Average 290
– Zero.
a. Ranges for infant formula products (from birth, cow’s milk–based, whey:casein ratio of60:40).
b. True protein = 0.85g per 100ml, excluding non-protein nitrogen, although a proportion ofthe non-protein nitrogen is used for the maintenance and growth of infants.
c. Iron in breastmilk is highly bioavailable, with absorption of 50–70 per cent.
d. Iron in infant formula is poorly bioavailable, with only about 10 per cent absorption.
Sources: Reference 23 ; data for the average composition of infant formula supplied by the InfantFormula Manufacturers Association of Australia Inc. (2001).
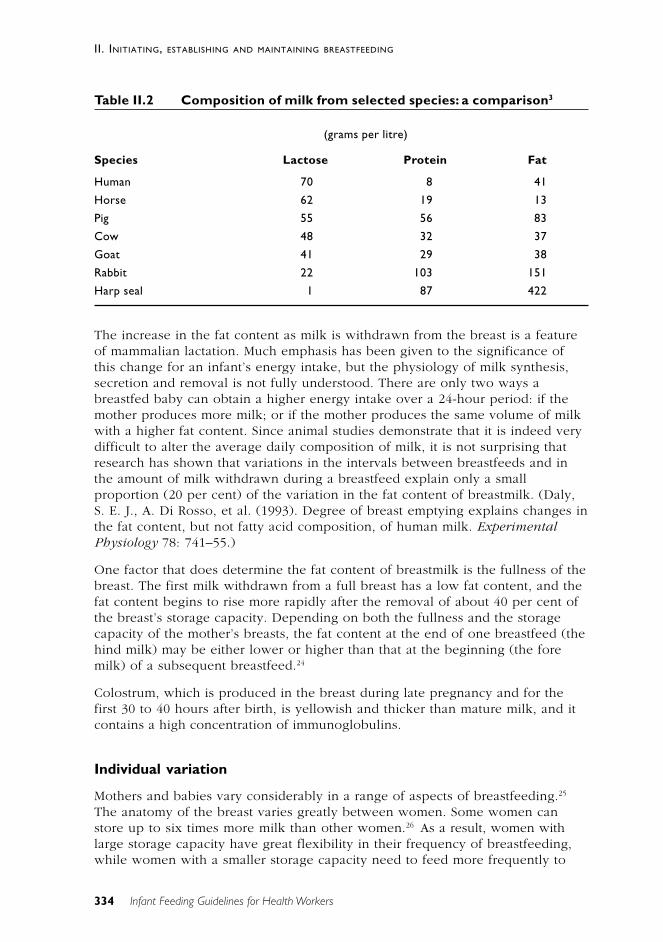
334
II. INITIATING, ESTABLISHING AND MAINTAINING BREASTFEEDING
Infant Feeding Guidelines for Health Workers
Table II.2 Composition of milk from selected species: a comparison3
(grams per litre)
Species Lactose Protein Fat
Human 70 8 41
Horse 62 19 13
Pig 55 56 83
Cow 48 32 37
Goat 41 29 38
Rabbit 22 103 151
Harp seal 1 87 422
The increase in the fat content as milk is withdrawn from the breast is a featureof mammalian lactation. Much emphasis has been given to the significance ofthis change for an infant’s energy intake, but the physiology of milk synthesis,secretion and removal is not fully understood. There are only two ways abreastfed baby can obtain a higher energy intake over a 24-hour period: if themother produces more milk; or if the mother produces the same volume of milkwith a higher fat content. Since animal studies demonstrate that it is indeed verydifficult to alter the average daily composition of milk, it is not surprising thatresearch has shown that variations in the intervals between breastfeeds and inthe amount of milk withdrawn during a breastfeed explain only a smallproportion (20 per cent) of the variation in the fat content of breastmilk. (Daly,S. E. J., A. Di Rosso, et al. (1993). Degree of breast emptying explains changes inthe fat content, but not fatty acid composition, of human milk. ExperimentalPhysiology 78: 741–55.)
One factor that does determine the fat content of breastmilk is the fullness of thebreast. The first milk withdrawn from a full breast has a low fat content, and thefat content begins to rise more rapidly after the removal of about 40 per cent ofthe breast’s storage capacity. Depending on both the fullness and the storagecapacity of the mother’s breasts, the fat content at the end of one breastfeed (thehind milk) may be either lower or higher than that at the beginning (the foremilk) of a subsequent breastfeed.24
Colostrum, which is produced in the breast during late pregnancy and for thefirst 30 to 40 hours after birth, is yellowish and thicker than mature milk, and itcontains a high concentration of immunoglobulins.
Individual variation
Mothers and babies vary considerably in a range of aspects of breastfeeding.25
The anatomy of the breast varies greatly between women. Some women canstore up to six times more milk than other women.26 As a result, women withlarge storage capacity have great flexibility in their frequency of breastfeeding,while women with a smaller storage capacity need to feed more frequently to
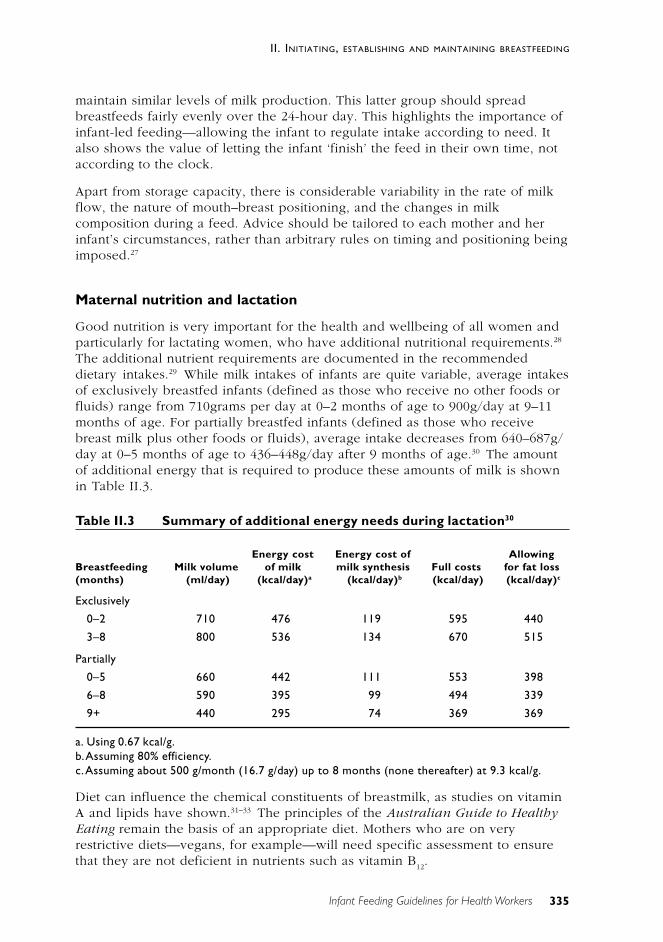
335
II. INITIATING, ESTABLISHING AND MAINTAINING BREASTFEEDING
Infant Feeding Guidelines for Health Workers
maintain similar levels of milk production. This latter group should spreadbreastfeeds fairly evenly over the 24-hour day. This highlights the importance ofinfant-led feeding—allowing the infant to regulate intake according to need. Italso shows the value of letting the infant ‘finish’ the feed in their own time, notaccording to the clock.
Apart from storage capacity, there is considerable variability in the rate of milkflow, the nature of mouth–breast positioning, and the changes in milkcomposition during a feed. Advice should be tailored to each mother and herinfant’s circumstances, rather than arbitrary rules on timing and positioning beingimposed.27
Maternal nutrition and lactation
Good nutrition is very important for the health and wellbeing of all women andparticularly for lactating women, who have additional nutritional requirements.28
The additional nutrient requirements are documented in the recommendeddietary intakes.29 While milk intakes of infants are quite variable, average intakesof exclusively breastfed infants (defined as those who receive no other foods orfluids) range from 710grams per day at 0–2 months of age to 900g/day at 9–11months of age. For partially breastfed infants (defined as those who receivebreast milk plus other foods or fluids), average intake decreases from 640–687g/day at 0–5 months of age to 436–448g/day after 9 months of age.30 The amountof additional energy that is required to produce these amounts of milk is shownin Table II.3.
Table II.3 Summary of additional energy needs during lactation30
Energy cost Energy cost of AllowingBreastfeeding Milk volume of milk milk synthesis Full costs for fat loss(months) (ml/day) (kcal/day)a (kcal/day)b (kcal/day) (kcal/day)c
Exclusively
0–2 710 476 119 595 440
3–8 800 536 134 670 515
Partially
0–5 660 442 111 553 398
6–8 590 395 99 494 339
9+ 440 295 74 369 369
a. Using 0.67 kcal/g.b.Assuming 80% efficiency.c.Assuming about 500 g/month (16.7 g/day) up to 8 months (none thereafter) at 9.3 kcal/g.
Diet can influence the chemical constituents of breastmilk, as studies on vitaminA and lipids have shown.31–33 The principles of the Australian Guide to HealthyEating remain the basis of an appropriate diet. Mothers who are on veryrestrictive diets—vegans, for example—will need specific assessment to ensurethat they are not deficient in nutrients such as vitamin B
12.
336
II. INITIATING, ESTABLISHING AND MAINTAINING BREASTFEEDING
Infant Feeding Guidelines for Health Workers
Attaching and positioning at the breast: the key to successful breastfeeding
An infant’s ‘milking’ of the breast is dependent on two things: ‘latching onto’sufficient breast tissue containing the lactiferous sinuses or milk glands; and thecorrect sucking or milking action with the tongue. Correct positioning at thebreast and correct latching-on and milking action are vital for the efficientremoval of milk from the breast without nipple pain or trauma.
• The mother should be seated comfortably in an upright position, so thather breasts fall naturally. She should have good support for her back, armsand feet. The infant should be unwrapped to allow easy handling andavoid overheating.
• If the nipple is erect, support the outer area of the breast with a ‘C’ hold,being careful not to alter the breast position. If the nipple is flat orinverted, move the ‘C’ hold under the breast and shape the breast betweenthe thumb and index finger, well back from the areola.
• The infant should be supported behind the shoulders and facing themother, with his or her body flexed around the mother’s body. Theposition must be a comfortable drinking position for the infant.
• The infant’s top lip should be level with the mother’s nipple, and a widegape should be encouraged by teasing the infant’s mouth with the nipple.
• When the infant gapes widely, bring him or her quickly onto the breast. Sothat the infant will take a good mouthful of breast, it is always advisable tobring the infant to the breast, not the breast to the infant.
• The chin should be tucked well into the breast, and the infant’s mouthshould be wide open, with the bottom lip curled back. More areola will beevident above the infant’s top lip than below the bottom lip. Whenpositioning is correct it is not necessary to hold the breast away from theinfant’s nose.
• After an initial short burst of sucking, the rhythm will be slow and even,with deep jaw movements that should not cause the mother anydiscomfort. Pauses are a normal part of the feed and they become morefrequent as the feed continues.
• If the cheeks are being sucked in or there is audible ‘clicking’, the infant isnot latched on correctly.
• The infant should stop feeding of his or her own accord by coming off thebreast spontaneously. The nipple will appear slightly elongated but thereshould be no evidence of trauma.
Women normally experience heightened nipple sensitivity and tenderness in thefirst few days after birth but this subsides as breastfeeding becomes established.If nipples are already sore or cracked—and even if positioning and attachingerrors are corrected—they may continue to be tender at the start and end offeeds for some time. The mother should be reassured that the discomfort willdiminish as the nipples heal and feeding continues.
If the baby is correctly positioned and attached and is sucking correctly thereshould be no nipple pain.
337
II. INITIATING, ESTABLISHING AND MAINTAINING BREASTFEEDING
Infant Feeding Guidelines for Health Workers
Signs of a functioning let-down reflex
Although some mothers report no noticeable signs of the let-down reflex, manymothers do notice one or more of the following signs:
• tingling or prickling—‘pins and needles’, which may take several weeks todevelop
• a sudden feeling of fullness
• an increase in skin temperature
• a feeling of wellbeing or relaxation
• for some mothers, pain or nausea
• dripping, leaking or spurting from the unsucked breast
• for some mothers, an intense thirst
• uterine contractions accompanied by a gush of lochia in the immediatepostpartum period—more common in multiparas.
There may also be noticeable changes in the infant’s sucking and swallowingpattern. This sign is more consistent than any of the others, but it may take themother several days of observation after her the milk ‘comes in’ to recognise thechanges. There are two types of sucking: non-nutritive and nutritive.
Non-nutritive sucking occurs in short, sharp bursts at a rate of up to two persecond. Nutritive sucking occurs at a slower rate—about one per second. Oncethe milk has started to flow the sucking continues at a regular rate. As the feedprogresses sucking becomes fragmented into bursts, usually separated by pausesof longer duration than are seen in the non-nutritive phase. At the start of eachburst there may be two to three fast sucks typical of non-nutritive sucking—termed restart sucking.
At all times the aim of the health professional should be to help the motherachieve independence in breastfeeding and caring for her infant. If mothers aremanaging well—particularly mothers who have previously breastfedsuccessfully—advice from midwives and others may be inappropriate if it is notasked for.
T H E F I R S T B R E A S T F E E D
Baby Friendly training will inform all staff of what is required to promote andsupport breastfeeding. There is evidence that starting to breastfeed within thefirst hour or so of birth is good for both mother and infant and for continuedbreastfeeding.34,35 A successful first breastfeed has a number of positive effects:
• It builds the mother’s confidence in her ability to breastfeed.
• The infant starts to receive the immunological benefits of colostrum.
• The infant’s digestion and bowel function are stimulated.
• Correct sucking at the breast at this stage may avert later suckingdifficulties.
• The bonding and attachment between mother and infant are enhanced.
338
II. INITIATING, ESTABLISHING AND MAINTAINING BREASTFEEDING
Infant Feeding Guidelines for Health Workers
Ideally, uninterrupted skin-to-skin contact should be maintained following birth.Common practices such as early weighing, bathing the infant, or passing him orher around should be delayed until later. Good antenatal education will helpwith parents’ expectations in this regard.
When the infant indicates an interest in sucking, the midwife can guide themother into a comfortable position that will enable the infant to latch oncorrectly.
Unless there is a medical reason (such as prematurity) mother and infant shouldremain together, so that breastfeeding begins and proceeds according to theinfant’s needs—without restriction on the number or length of feeds. It shouldalso be emphasised, however, that, although early contact between mother andinfant is the ideal, when this is not possible it does not preclude successfulbreastfeeding. In many cultures, the mother may not have contact with her infantfor many hours, yet successful breastfeeding is almost universal.
R E F E R E N C E S
1. James J. Ready for birth—but what about breastfeeding? Breastfeed Rev1999;7(3):29–32.
2. Scott JA, Binns CW. Factors associated with the initiation and duration ofbreast feeding. Aust J Nutr Diet 1998;55(2):51–61.
3. Scott JA, Aitkin I, Binns CW, Aroni RA. Factors associated with the durationof breastfeeding amongst women in Perth, Australia. Acta Paediatr Scand1999;88(4):416–21.
4. Scott JA, Binns CW, Aroni RA. The influence of reported paternal attitudeson the decision to breastfeed. J Paed Child Hlth 1997;33:305–7.
5. Dettwyler K. A time to wean. In: Stuart-Macadam P, Dettwyler K, eds.Breastfeeding: biocultural perspectives. New York: Aldine de Gruytyer,1995.
6. Binns CW. Food, sickness and death in children of the highlands of PapuaNew Guinea. J Trop Pediatr Environ Child Hlth 1976;22(1):9–11.
7. Alexander JM, Grant AM, Campbell MJ. Randomised controlled trial ofbreast shells and Hoffman’s exercises for inverted and non-protractilenipples. BMJ 1992;304:1030–2.
8. Scott-Brown MS, Hurlock JT. Preparation of the breast for breastfeeding.Nursing Res 1975;24:448–51.
9. Gans B. Breast and nipple pain in the early stages of lactation. BMJ1958;(Oct. 4):830–4.
10. Brockway L. Hair colour & problems in breast feeding. Midwives Chron1986;99(1178):66–7.
339
II. INITIATING, ESTABLISHING AND MAINTAINING BREASTFEEDING
Infant Feeding Guidelines for Health Workers
11. Hartmann P. Changes in the composition and yield of the mammarysecretion of cows during the initiation of lactation. J Endocrinol1973;59:231–47.
12. Neville MC, Morton J, Umemura S. Lactogenesis: the transition frompregnancy to lactation. Pediat Clin Nth Am 2001;48(1):36–51.
13. Kulski JK, Smith M, Hartmann PE. Perinatal concentrations of progesterone,lactose and á-lactalbumin in the mammary secretion of women. J Endocrin1977;74:509–10.
14. Kulski JK, Smith M, Hartmann PE. Normal and caesarian section deliveryand the initiation of lactation in women. Aust J Exp Biol Med Sci1981;59:405–12.
15. Arthur PG, Smith M, Hartmann PE. Milk lactose, citrate and glucose asmarkers of lactogenesis in normal and diabetic women. J PaediatrGastroentero Nutr 1989;9(4):488–96.
16. Neifert MR, McDonough SL, Neville MC. Failure of lactogenesis associatedwith placental retention. Am J Obstet Gynaec 1982;140:477–9.
17. Neville MC. Anatomy and physiology of lactation. Pediatr Clin Nth Am2001;48(1):13–34.
18. Hartmann P, Sherriff J, Kent J. Maternal nutrition and the regulation of milksynthesis. Proc Nutr Soc 1995;54(2):379–89.
19. Wilde CJ, Addey VP, Boddy LM, Peaker M. Autocrine regulation of milksecretion by a protein in milk. Biochem J 1995;305:51–8.
20. Kulski JK, Hartmann P, Martin J. Effects of bromocritine mesylate on thecomposition of the mammary secretion in non-breastfeeding women.Obstet Gynecol 1978;52:38–42.
21. Renner E. Micronutrients in milk and milk-based food products. London &New York: Elsevier Applied Science, 1989.
22. Oftedal OT. Milk composition, milk yield and energy output at peaklactation: a comparative review. In: Peaker M, Vernon RG, Knight CH, eds.Physiological strategies in lactation: symposia of the Zoological Society ofLondon. London: Academic Press, 1984.
23. Department of Health. Weaning and the weaning diet. Report of theWorking Group on the Weaning Diet of the Committee on Medical Aspectsof Food Policy. Report no. 45. London, 1994.
24. Daly SEJ, Di Rosso A, Owens RA, Hartmann PE. Degree of breast emptyingexplains changes in the fat content, but not fatty acid composition, ofhuman milk. Experim Physiol 1993;78:741–55.
25. Daly SEJ, Owens RA, Hartmann PE. The short-term synthesis and infantregulated removal of milk in lactating women. Experim Physiol1993;78:209–20.
340
II. INITIATING, ESTABLISHING AND MAINTAINING BREASTFEEDING
Infant Feeding Guidelines for Health Workers
26. Daly SEJ, Hartmann PE. Infant demand and milk supply. Part 2: the short termcontrol of milk synthesis in lactating women. J Hum Lact 1995;11:21–6.
27. Dewey KG, Lonnerdal B. Infant self-regulation of breast milk intake. ActaPaediatr Scand 1986;75:893–8.
28. National Health and Medical Research Council. Dietary Guidelines forChildren and Adolescents, Canberra: AGPS, 1995.
29. National Health and Medical Research Council. Recommended DietaryIntakes for Use in Australia, Canberra: AGPS, 1991.
30. Dewey K. Ann Rev Nutr 1997;17:19–36.
31. Canfield L, Kaminsky RG, Taren DL, Shaw E and Sander JK. EuropeanJournal of Nutrition, 2001;40:30–8.
32. Neville MC and Picciano M. Ann Review Nutrition 1997;17:159–84.
33. Gonzalez-Coss 1T, Habicht J, Rasmussen K and Delgado H. J Nutrition1998;128:1692–702.
34. De Chateau P, Holmberg H, Jakobsson K, Winberg J. A study of factorspromoting and inhibiting lactation. Develop Med Child Neurol1977;19(5):575–84.
35. Salariya EM, Easton PM, Carter JI. Duration of breast-feeding after earlyinitiation and frequent feeding. Lancet 1978;ii:1141–3.
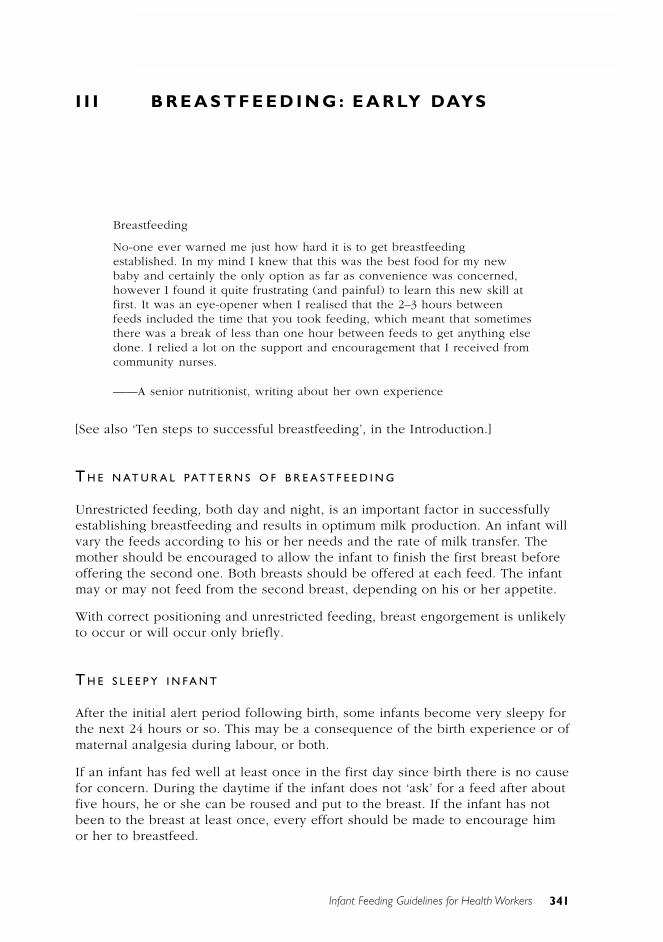
341
II. INITIATING, ESTABLISHING AND MAINTAINING BREASTFEEDING
Infant Feeding Guidelines for Health Workers
I I I B R E A S T F E E D I N G : E A R LY DAYS
Breastfeeding
No-one ever warned me just how hard it is to get breastfeedingestablished. In my mind I knew that this was the best food for my newbaby and certainly the only option as far as convenience was concerned,however I found it quite frustrating (and painful) to learn this new skill atfirst. It was an eye-opener when I realised that the 2–3 hours betweenfeeds included the time that you took feeding, which meant that sometimesthere was a break of less than one hour between feeds to get anything elsedone. I relied a lot on the support and encouragement that I received fromcommunity nurses.
——A senior nutritionist, writing about her own experience
[See also ‘Ten steps to successful breastfeeding’, in the Introduction.]
T H E N AT U R A L PAT T E R N S O F B R E A S T F E E D I N G
Unrestricted feeding, both day and night, is an important factor in successfullyestablishing breastfeeding and results in optimum milk production. An infant willvary the feeds according to his or her needs and the rate of milk transfer. Themother should be encouraged to allow the infant to finish the first breast beforeoffering the second one. Both breasts should be offered at each feed. The infantmay or may not feed from the second breast, depending on his or her appetite.
With correct positioning and unrestricted feeding, breast engorgement is unlikelyto occur or will occur only briefly.
T H E S L E E P Y I N F A N T
After the initial alert period following birth, some infants become very sleepy forthe next 24 hours or so. This may be a consequence of the birth experience or ofmaternal analgesia during labour, or both.
If an infant has fed well at least once in the first day since birth there is no causefor concern. During the daytime if the infant does not ‘ask’ for a feed after aboutfive hours, he or she can be roused and put to the breast. If the infant has notbeen to the breast at least once, every effort should be made to encourage himor her to breastfeed.
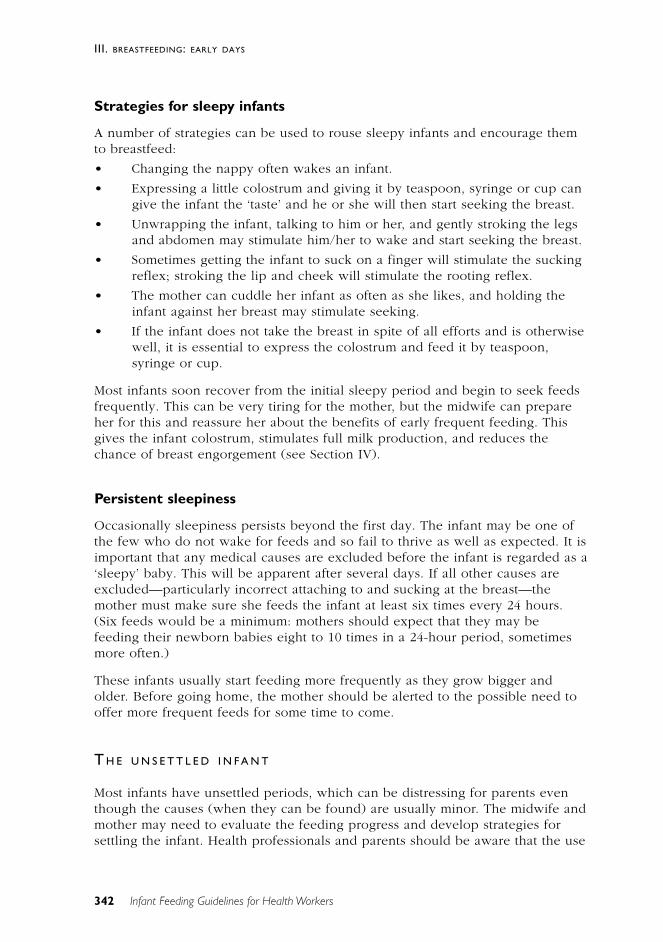
342
III. BREASTFEEDING: EARLY DAYS
Infant Feeding Guidelines for Health Workers
Strategies for sleepy infants
A number of strategies can be used to rouse sleepy infants and encourage themto breastfeed:
• Changing the nappy often wakes an infant.
• Expressing a little colostrum and giving it by teaspoon, syringe or cup cangive the infant the ‘taste’ and he or she will then start seeking the breast.
• Unwrapping the infant, talking to him or her, and gently stroking the legsand abdomen may stimulate him/her to wake and start seeking the breast.
• Sometimes getting the infant to suck on a finger will stimulate the suckingreflex; stroking the lip and cheek will stimulate the rooting reflex.
• The mother can cuddle her infant as often as she likes, and holding theinfant against her breast may stimulate seeking.
• If the infant does not take the breast in spite of all efforts and is otherwisewell, it is essential to express the colostrum and feed it by teaspoon,syringe or cup.
Most infants soon recover from the initial sleepy period and begin to seek feedsfrequently. This can be very tiring for the mother, but the midwife can prepareher for this and reassure her about the benefits of early frequent feeding. Thisgives the infant colostrum, stimulates full milk production, and reduces thechance of breast engorgement (see Section IV).
Persistent sleepiness
Occasionally sleepiness persists beyond the first day. The infant may be one ofthe few who do not wake for feeds and so fail to thrive as well as expected. It isimportant that any medical causes are excluded before the infant is regarded as a‘sleepy’ baby. This will be apparent after several days. If all other causes areexcluded—particularly incorrect attaching to and sucking at the breast—themother must make sure she feeds the infant at least six times every 24 hours.(Six feeds would be a minimum: mothers should expect that they may befeeding their newborn babies eight to 10 times in a 24-hour period, sometimesmore often.)
These infants usually start feeding more frequently as they grow bigger andolder. Before going home, the mother should be alerted to the possible need tooffer more frequent feeds for some time to come.
T H E U N S E T T L E D I N F A N T
Most infants have unsettled periods, which can be distressing for parents eventhough the causes (when they can be found) are usually minor. The midwife andmother may need to evaluate the feeding progress and develop strategies forsettling the infant. Health professionals and parents should be aware that the use
343
III. BREASTFEEDING: EARLY DAYS
Infant Feeding Guidelines for Health Workers
of bottles and dummies is usually inappropriate at this early stage ofbreastfeeding.
Unsettled periods may occur before the mother’s milk ‘comes in’. It is commonfor infants to want to feed frequently before the milk comes in, particularly inthe second 24 hours. The mother may need to be reassured that this is normaland that frequent feeds help stimulate the milk supply and reduce the likelihoodof engorgement. Frequent feeds can, however, present a problem for tiredmothers during the night. In many cultures it is common for mothers to sleepwith their infants. The safest way of co-sleeping is for the infant to have abassinet next to the mother’s bed. If a mother does choose to sleep with aninfant, ‘safe sleeping’ should be emphasised; this includes avoidinghyperthermia, not using soft pillows or bed coverings, avoiding smoking, andavoiding drugs that cause drowsiness (such as alcohol). Sometimes it isappropriate for the midwife to offer the mother time away from the infant, themidwife caring for the infant between feeds while the mother sleeps or rests.
After the milk comes in the following factors should be assessed:
• Is the infant attached properly and getting the milk?
• Is the mother leaving the infant on the breast until he or she comes offnaturally?
• Is the infant sucking properly?
Some infants take several days to establish a good sucking technique. Until thathappens, the breastmilk may need to be expressed and given to the infant afterthe breastfeed, by spoon, cup or syringe.
Unrealistic expectations
Because of entrenched social attitudes about sleeping and eating schedules,many people think infants sleep three to four hours in regular patterns aroundthe clock. Infants’ individuality and variations in their appetites should becarefully explained to new mothers.
Is the infant needing attention other than for breastfeeding?
Infants need contact for comfort in addition to food. The mother and the healthprofessional should together consider strategies and options for helping restlessor crying infants (see ‘The crying infant’ in Section IV).
E X C L U S I V E B R E A S T F E E D I N G
Exclusive breastfeeding—that is, no use of breastmilk substitutes—ensures thatan infant receives the full nutritional and protective benefits of colostrum andbreastmilk.
344
III. BREASTFEEDING: EARLY DAYS
Infant Feeding Guidelines for Health Workers
Detrimental effects of bottle and dummy use
Early use of bottles and dummies (pacifiers), especially before the firstbreastfeed, can interfere with the natural processes of breastfeeding, reducingthe infant’s sucking capacity and the stimulation of the mother’s breasts. Thelikely result is delayed or poor establishment of lactation.1 The most importantrisks associated with use of a pacifier and the non-nutritive sucking habit itpromotes are failure of breastfeeding, dental deformities, recurrent acute otitismedia, and the risk of accidents. Latex allergy, tooth decay, oral ulcers and sleepdisorders are other possible problems; the WHO has published a review ofevidence supporting this statement.2 A longitudinal study in New Zealand foundthe use of dummies to be very widespread, at around 80 per cent.3 The authorsfollowed 351 mothers and their infants for 12 months to assess the impact of theuse of pacifiers on the duration of breastfeeding; they showed that breastfeedingduration was decreased by pacifier use.
The detrimental effects of giving breastmilk substitutes
Offering complementary feeds—water, glucose or milk formula—when there isno medical reason has been shown to adversely affect the establishment andmaintenance of successful breastfeeding.4–7
Complementary feeds
If an infant is unable to take all the feeds directly at the breast, expressedbreastmilk should be the preferred method of feeding the infant (see Section V).
Midwifery staff should seek the informed consent of the mother beforecomplementing or supplementing infant feeding with fluids other thanbreastmilk. Sample consent forms for complementary feeds are shown inAppendix H.
If lactation is not fully established, the mother should be helped to understandthe processes of lactation and breastfeeding techniques. She should also beencouraged to call on support people or groups when in need; these can includehome care, home midwifery services, lactation consultants, and early childhoodnurses. The Australian Breastfeeding Association offers counselling and mother-to-mother support seven days a week.
Breastfeeding of premature infants is occasionally complemented by formulafeeding (usually a special product for low-birthweight infants) while in hospital.If these feeds are to be continued after discharge, the mother’s competence informula preparation and bottle feeding should be ensured and follow-up careorganised. In particular, the mother will benefit from information about how shecan establish full breastfeeding by:
• gradually increasing her milk supply by expressing after feeds
• increasing the number of breastfeeds per day
345
III. BREASTFEEDING: EARLY DAYS
Infant Feeding Guidelines for Health Workers
or
• gradually reducing the amount of bottle complements—by putting slightlyless in the bottle each time or by cutting down the complement one feedat a time, daily or on alternate days, or more slowly if appropriate.
Even if the mother does need to continue giving complementary feedsindefinitely, it should not be suggested that the infant be totally formula fed. Themother should be encouraged to continue breastfeeding before offering thecomplementary feed.
R O O M I N G - I N
Rooming-in 24 hours a day is the usual practice in most hospitals. This meansthe infant is with the mother from birth. The practice:
• facilitates unrestricted breastfeeding
• promotes mother–infant bonding
• helps prevent cross-infection
• allows both mother and infant contact with the father and other familymembers
• helps the mother learn about her infant’s patterns of behaviour andfeeding, so she learns sooner to manage and care for the infant.
After delivery the infant should remain with the mother, so that they aretransferred to the postnatal ward together. The infant’s cot remains beside themother’s bed. Contrary to popular opinion, mothers who have their infants withthem at night lose no more sleep than mothers whose infants are in a nursery.8
Occasional use of the nursery or staff care during the day or night is an optionfor the mother. If she does choose to place her infant with staff at night, theinfant should be taken to her for breastfeeds or the mother should beencouraged and helped to express breastmilk.
After delivery by Caesarean section an infant is sometimes placed in the nursery.When the mother returns to the postnatal ward, though, the infant should be inher room. Initially, rooming-in after Caesarean section calls for extra supportfrom the midwife.
M O N I TO R I N G A N I N F A N T ’ S P RO G R E S S
To ensure that an infant is well and to allay any concerns the mother mighthave, it is important that both mother and health professional have a means ofassessing the infant’s progress. Observing the infant and his or her behaviourand documenting his/her feeding and output contribute to this assessment.
A healthy infant is alert and responsive when awake and has bright eyes andfirm skin with good elasticity. The adequacy of breastfeeding (with no breastmilk
346
III. BREASTFEEDING: EARLY DAYS
Infant Feeding Guidelines for Health Workers
substitutes) can be assessed by observing the infant’s behaviour, feedingpatterns, urine output and bowel actions, and by checking the infant’s weightand using growth reference charts.
Infants’ behaviour
Infants are generally content after feeds, although most have one period eachday when they want to feed frequently and will not settle (see ‘The crying infant’in Section IV). This often happens in the evening, and it should not beinterpreted as ‘running out of milk at the end of the day’: milk production iscontinuous over a 24-hour period, although the rate of production variesaccording to the fullness of the breast.9
Feeding patterns
Infants usually breastfeed eight to 10 times, or even 12 times, during a 24-hourperiod. Some mothers expect their infant to feed on a regular four-hourlypattern, but they should be reassured that this is not a common pattern offeeding. The length of each feed is very variable, and during the early neonatalperiod feeds can take about an hour. If an infant is spending long periods on thefirst breast, however, there is a good chance there is a feeding problem: perhapshe or she is not attached properly and cannot milk the lactiferous sinuseseffectively. The positioning and attachment of an infant should be carefullymonitored in the early days.
Urine output
Until the mother’s milk comes in an infant will not pass urine often; provided heor she voids once or more every 24 hours there is no cause for concern. As themilk volume increases, the infant’s urine output will increase, and a cloth nappywill be soaked with pale or colourless urine six or more times every 24 hours.Disposable nappies tend to mask wetness and may need close inspection todetermine whether the infant has urinated. If an infant’s urine becomes scantyand strongly yellow in colour—suggesting the development of dehydration—feeding frequency and milk transfer should be evaluated.
Bowel actions
An infant’s first bowel actions consist of meconium, which is greenish-black.After 24 to 48 hours the meconium changes—first to brownish ‘transitional’ stoolsand then, by the third or fourth day, to typical breastfed infants’ stools, whichare loose and mustard-yellow (sometimes with milk curds), although occasionallythey are green or orange. None of these changes is significant in a healthybreastfed infant. Frequent, runny stools do not mean a breastfed infant hasdiarrhoea or lactose intolerance: they should simply be viewed as evidence ofsufficient milk. Diarrhoea entails very frequent watery stools.
347
III. BREASTFEEDING: EARLY DAYS
Infant Feeding Guidelines for Health Workers
The number of bowel motions of breastfed infants tends to decrease between6 weeks and 3 months of age. Intervals of several days or more between stoolsare common. If the infant is receiving breastmilk only and no other food or fluid,there is no cause for concern. Infants who are having formula for most of theirfeeds tend to pass fewer motions than breastfed infants—once a day or everysecond day, often khaki-coloured and with a Plasticine-like consistency. Mothersneed to be aware of the potential change in their infant’s motions when they areweaning.
Constipation refers to the hard, dry consistency of the stools, not the frequencyof bowel motions. It has been observed that hard, dry bowel motions are morelikely to occur after formula or solids have been introduced. Exclusivelybreastfed infants are rarely constipated. Many breastfed infants show signs ofdiscomfort or distress before passing a motion: this is a normal response to bodysensations they are not used to; it does not indicate pain or constipation.
Infants’ weight
A newborn infant adapts to the small amounts of colostrum available. With thepassage of meconium and loss of water by evaporation, an initial weight loss of5–10 per cent of the birthweight is normal. Between 4 and 6 days of age theinfant starts to regain weight and by 2 weeks of age should have returned totheir birthweight. If the infant appears contented and healthy there should be noimmediate cause for concern about minor fluctuations in weight—which canresult from factors as simple as passing a stool, urinating, or a recent feed. Staticweight or suspected weight loss over several days should, however, be carefullyexamined. Further investigation to exclude disease should include evaluatingfeeding frequency and milk transfer.
It is recommended that an appropriate growth chart be used. In general, weightgain should be assessed on a four-week average. The rate of growth is the mostimportant factor, although if growth is above the 95th percentile or below the5th, or crosses these percentiles, further investigation is required. A growthreference chart should always be used, but the following is a rough guide:
• birth to age 3 months—a gain of 150–200 grams a week
• age 3 to 6 months—a gain of 100–150 grams a week
• age 6 to 12 months—a gain of 70–90 grams a week.
Percentile growth reference charts
Percentile charts are used to assess growth. While the international growthreference used in Australia was originally derived from US data, it is applicableto Australia. The charts should be used as a reference for monitoring, not as anabsolute standard. The body size of infants and their growth rates are determinedmainly by nutritional status, and the weights of individual infants often crosspercentiles in the first few months after birth. Birthweight is influenced more bynutritional conditions in utero and maternal health—for example, mothers who
348
III. BREASTFEEDING: EARLY DAYS
Infant Feeding Guidelines for Health Workers
smoke or have pregnancy-induced hypertension have smaller babies—than bygenetic considerations. 10
The weight percentiles for breastfed infants differ only slightly from those forbottle-fed infants. In general, breastfed infants tend to grow rapidly in the firsttwo to three months of life but then at a slightly slower rate than the currentpercentile charts. At 8–11 months of age, infants who have been exclusivelybreastfed for six months will have a weight-for-age Z score of around –0.5 to –0.6.11 Height for age is generally less affected. Studies have confirmed minimaldifferences between ethnic groups.12,13 Part B of the ‘Special considerations’section in the Dietary Guidelines for Children and Adolescents discuses growthand growth references in detail.
In Australia, the growth rate of Aboriginal infants who are exclusively breastfedfollows the WHO–NCHS reference until about 6 months of age, when it begins tofall away.14,15 This suggests that the differences between breastfed infants and theCDC–WHO reference are not very significant for Australia, particularly if thereference charts are used for monitoring growth and not as a standard.Whitehead and Paul16 reviewed the use of doubly labelled water techniques tostudy energy dynamics in breastfed infants. This approach indicated that460 kilojoules (110 kilocalories) per kilogram per day at age 1 month and 397kJand 355kJ (95kcal and 85kcal) per kilogram per day at 3 and 6 monthsrespectively would provide sufficient nutrients, given the high bioavailability ofthe nutrients in breastmilk. This means that a breastmilk intake of 850 millilitresa day would cover the dietary energy needs of the average infant growing alongthe 50th percentile until at least age 4 months, but after that there may be somedecline in the growth percentile of currently used references.
The extent to which serial data for an infant can deviate from a given percentilerange before concern is warranted depends on the infant’s age, their position inthe percentile range, and the length of time for which the rate of growth deviatesfrom the norm. Because of the slightly slower growth velocity of breastfedinfants, they may appear to be faltering after two to three months when they areplotted on current growth charts, even when they are healthy and thriving.17
Health professionals may mistakenly believe that the mother’s milk production isinadequate and suggest starting complementary formula.
In general, the more pronounced the change in growth rate, the younger theinfant and the more extreme the percentile, the greater the cause for concern. Asnoted, some slowing in the infant’s rate of growth is expected after 3 months ofage. In addition, many normal infants cross percentiles to reach their genetic andnutritional potential, so percentile charts should be used as a guide only. As ageneral rule, however, any infant whose weight is static for two weeks, wholoses weight over a five to seven–day period, or who crosses the 10th or 90thpercentiles should be clinically examined.
349
III. BREASTFEEDING: EARLY DAYS
Infant Feeding Guidelines for Health Workers
Y O U N G M OT H E R S
The results of many observational studies, and two intervention studies, showthat adolescent mothers breastfeed less often than older mothers.18 Teenagemothers’ breastmilk is comparable in composition to that of adults.18–20
A study of breastfeeding by Aboriginal mothers in Kalgoorlie found that amongolder women breastfeeding was almost universal, but the rates among youngmothers were often much lower.21 Young mothers, Indigenous mothers andmothers from lower socio-economic groups generally require more support ifthey are to maintain satisfactory breastfeeding levels.
R E F E R E N C E S
1. Newman J. Breastfeeding problems associated with the early introductionof bottles and pacifiers. J Hum Lact 1990;6(2):59–63.
2. Vallenas C, Savage F. Evidence for the ten steps to successfulbreastfeeding. Geneva: World Health Organization, 1998.
Not enough breastmilk?
Most mothers at some stage are concerned that they are not producing enough breastmilk.Here are some tips:
• Is your baby losing weight or gaining weight and growing in length? Most babies loseweight in the days following birth. Within a week or two, they start to gain weight, at therate of around 600 grams a month, or 150 grams a week. Plotting weights on a growthchart and explaining these patterns can be very reassuring. A baby who is gaining weightis getting enough breastmilk and does not have any significant chronic disease problem.
• Does your baby have six to eight wet nappies a day? This is the typical amount for abreastfed baby. Bowel movements are often infrequent in breastfed babies: this isn’tconstipation; it’s just that breastmilk is so good there’s nothing to waste!
• Are you eating a nutritious diet, drinking plenty of water, and getting as much rest aspossible? Taking care of yourself will enable you to take care of your baby. Make sure youeat good food and drink plenty of fluid; drink a glass of water every time you breastfeed.Weight-loss diets are not recommended for breastfeeding mothers.
• Is your baby’s urge to suck being met in other ways? Breasts respond to frequentstimulation by producing more milk. If your baby is sucking on a dummy (pacifier) or abottle, he or she won’t nurse as much and your milk supply will decrease.Complementary bottles should be completely avoided.
• Your baby can’t tell the time yet. In the first months of life babies don’t always becomehungry at the same time each day. Don’t feed on a schedule: feed ‘according to need’,whenever your baby shows signs of hunger or fussiness. Your baby will be happier andyour milk supply greater.
• Breast size has no relationship to milk production.
350
III. BREASTFEEDING: EARLY DAYS
Infant Feeding Guidelines for Health Workers
3. Vogel A, Hutchison B, Mitchell E. The impact of pacifier use onbreastfeeding: a prospective cohort study. J Paediatr Child Hlth2001;37:58–63.
4. Lennon I, Lewis BR. Effect of early complementary feeds on lactationfailure. Breastfeeding Rev 1987;11:24–6.
5. Nylander G, Lindemann R, Helsing E, Bendvold E. Unsupplementedbreastfeeding in maternity ward. Acta Obstet Gynecol Scand 1991;70:205–9.
6. Gray-Donald K, Kramer MS, Munday S, Leduc DG. Effect of formulasupplementation in the hospital on the duration of breastfeeding: acontrolled clinical trial. Pediatrics 1985;75:514–18.
7. Blomquist H, Jonsbo F, Serenius F, Persson L. Supplementary feeding inthe maternity ward shortens the duration of breast feeding. Acta PaediatrScand 1994;83:1122–6.
8. Keefe MR. The impact of infant rooming-in on maternal sleep at night. JObstet Gynecol Neonatal Nurs 1988;Mar/Apr:122–6.
9. Daly SEJ, Kent JC, Huynh DQ, Owens RA, Alexander BF, Hartmann PE.The determination of short-term breast volume changes and the rate ofsynthesis of human milk using computerised breast measurement. ExperimPhysiol 1992;77(1):79–87.
10. Binns, C. W. (1998). Infant feeding and growth. The CambridgeEncyclopedia of Human Growth and Development. S. J. Ulijaszek, F. E.Johnston and M. A. Preece. Cambridge, University of Cambridge Press:320-329.
11. Hediger ML, Overpeck MD, Ruan WJ, Troendle JF. Early infant feeding andgrowth status of US-born infants and children aged 4–71 mo: analyses fromthe third National Health and Nutrition Examination Survey, 1988–1994.Am J Clin Nutr 2000;72(1):159–67.
12. Dewey KG, Peerson JM, Brown KH, Krebs NF, Michaelsen KF, Persson LA etal. Growth of breastfed infants deviates from current reference data: a pooledanalysis of US, Canadian and European data sets. World Health OrganizationWorking Group on Infant Growth. Pediatrics 1995;96:495–503.
13. Cohen RJ, Brown KH, Canahuati J, Rivera LL, Dewey KG. Effects of age ofintroduction of complementary foods on infants’ breastmilk intake, totalenergy intake, and growth: a randomized intervention study in Honduras.Lancet 1994;344:288–93.
14. Binns CW. Infant feeding and growth. In: Ulijaszek SJ, Johnston FE, PreeceMA, eds. The Cambridge encyclopedia of human growth and development.Cambridge: University of Cambridge Press; 1998:320–9.
15. Gracey M. Infant feeding and weaning practices in an urbanizingtraditional hunter–gatherer society. Pediatrics 2000;106:1276–7.
351
III. BREASTFEEDING: EARLY DAYS
Infant Feeding Guidelines for Health Workers
16. Whitehead RG, Paul AA. Long-term adequacy of exclusive breastfeeding:how scientific research has led to revised opinions. Proc Nutr Soc2000;59(1):17–23.
17. Dewey K, Heinig MJ, Nommsen LA, Lonnerdal B. Adequacy of energyintake among breastfed infants in the DARLING Study: relationships togrowth velocity, morbidity and activity level. J Pediatr 1993;119:538–47.
18. Scott JA, Binns CW. Breastfeeding in Perth—recent trends. Aust NZ J PubHlth 1996;20(2):210–11.
19. Misra R, James DC. Breastfeeding practices among adolescent and adultmothers in the Missouri WIC population. JADA 2000;100(9):1071–3.
20. Wambach KA, Cole C. Breastfeeding and adolescents. J Obstet GynecolNeonatal Nurs 2000;29(3):282–94.
21. Community Health Services Report. Kalgoorlie: 2000.
353
III. BREASTFEEDING: EARLY DAYS
Infant Feeding Guidelines for Health Workers
I V B R E A S T F E E D I N G : C O M M O NP R O B L E M S A N D T H E I R M A N AG E M E N T
[The Commonwealth Department of Health and Ageing publication Best PracticeGuide to Common Breastfeeding Problems provides detailed advice onbreastfeeding problems and their management <www.health.gov.au/pubhlth/strateg/brfeed/index.htm>. The Australian Breastfeeding Association’s LactationResource Centre (telephone 03 9885 0855) also has many excellent resources.]
Much of the advice in this section of the first edition of the Infant FeedingGuidelines was based on Promoting Breastfeeding, the breastfeeding guidelinesproduced by the Victorian Department of Health and Community Services. It hasbeen modified here to give guidance to health workers who have contact withinfants and families after discharge from hospital.
At an institutional level, many lactation problems are iatrogenic and will respondto changes in the routine care of mothers and newborns, such as those outlinedin the Baby Friendly Hospital initiative.1 The early days of breastfeeding arecritical times for education and assistance to ensure correct positioning andattachment, which will prevent many subsequent difficulties.2 Early follow-upvisits and support at home or in community or outpatient clinics are important toanswer mothers’ breastfeeding concerns.3 In Australia, additional communityresources are available from the Australian Breastfeeding Association andlactation consultants.
Most women experience some difficulties when breastfeeding, particularly in theearly days. But they are usually only minor and can be readily overcome withadvice, assistance and support.4 Adequate support in the community and ingeneral practice—particularly through the use of lactation consultants and othertrained health professionals—is of considerable value in minimising the impactof problems on breastfeeding outcomes.5 Table IV.1 provides an indication ofthe prevalence of the difficulties encountered during breastfeeding.
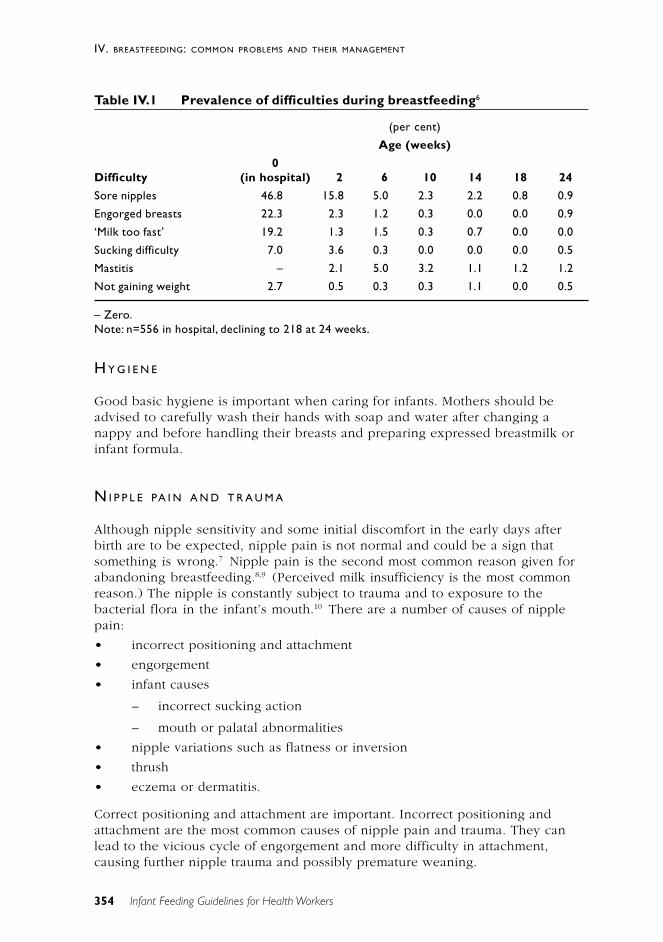
354
IV. BREASTFEEDING: COMMON PROBLEMS AND THEIR MANAGEMENT
Infant Feeding Guidelines for Health Workers
Table IV.1 Prevalence of difficulties during breastfeeding6
(per cent)
Age (weeks)
0Difficulty (in hospital) 2 6 10 14 18 24
Sore nipples 46.8 15.8 5.0 2.3 2.2 0.8 0.9
Engorged breasts 22.3 2.3 1.2 0.3 0.0 0.0 0.9
‘Milk too fast’ 19.2 1.3 1.5 0.3 0.7 0.0 0.0
Sucking difficulty 7.0 3.6 0.3 0.0 0.0 0.0 0.5
Mastitis – 2.1 5.0 3.2 1.1 1.2 1.2
Not gaining weight 2.7 0.5 0.3 0.3 1.1 0.0 0.5
– Zero.Note: n=556 in hospital, declining to 218 at 24 weeks.
H Y G I E N E
Good basic hygiene is important when caring for infants. Mothers should beadvised to carefully wash their hands with soap and water after changing anappy and before handling their breasts and preparing expressed breastmilk orinfant formula.
N I P P L E PA I N A N D T R A U M A
Although nipple sensitivity and some initial discomfort in the early days afterbirth are to be expected, nipple pain is not normal and could be a sign thatsomething is wrong.7 Nipple pain is the second most common reason given forabandoning breastfeeding.8,9 (Perceived milk insufficiency is the most commonreason.) The nipple is constantly subject to trauma and to exposure to thebacterial flora in the infant’s mouth.10 There are a number of causes of nipplepain:
• incorrect positioning and attachment
• engorgement
• infant causes
– incorrect sucking action
– mouth or palatal abnormalities
• nipple variations such as flatness or inversion
• thrush
• eczema or dermatitis.
Correct positioning and attachment are important. Incorrect positioning andattachment are the most common causes of nipple pain and trauma. They canlead to the vicious cycle of engorgement and more difficulty in attachment,causing further nipple trauma and possibly premature weaning.
355
IV. BREASTFEEDING: COMMON PROBLEMS AND THEIR MANAGEMENT
Infant Feeding Guidelines for Health Workers
Nipple care• Avoid using shampoos and soaps on the nipples.
• Air dry the nipples after breastfeeding.
• Applying hind milk or colostrum to the nipples after a feed may behelpful.
• If nursing pads are used, replace damp pads frequently.
• Generally avoid applying ointments, sprays, tinctures and powders—apartfrom purified lanolin, which may be useful.11–13
• For severe cases, a controlled trial has shown that treatment with purifiedlanolin and breast shells is more effective than using moist dressings.10
Management• Correct positioning and attachment are essential.
• Treat any underlying cause.
• Continue breastfeeding unless the pain is intolerable or, in spite of everyeffort, the trauma worsens.
• Except in rare circumstances, an infant who has been removed from thebreast should be fed on expressed breastmilk and returned to the breast assoon as possible. Skilled support is usually required.
Although I found early breastfeeding painful with my son, the discomfortreally wasn’t necessary. I’d recommend future mothers to do what I didthis time round—make it easy on yourself with correct positioning fromthe start. Contact your local breastfeeding group before the birth to learnand practise the technique. I’m delighted to say that since my daughterwas born eight weeks ago breastfeeding has not caused so much as atwinge.
——‘Readers Notes’, The Times, 17 November 2001, p. 3.
N I P P L E VA R I AT I O N S
Most women’s nipples are perfectly adequate for breastfeeding, in spite ofvariations in shape and size, and there is no scientific evidence of the benefit ofnipple preparation during the antenatal period. For a small number of women,however, nipple variations such as non-protractile or inverted nipples canpresent difficulties when initiating breastfeeding. Previous breast or nipplesurgery, or nipple piercing, can also cause difficulties, but each case should beindividually assessed.
If some degree of flatness or retraction is present the following will assist:
• The ideal is to begin breastfeeding early, preferably within an hour ofbirth, when the infant is alert and eager to suckle. Teaching correctattachment and encouraging correct suckling action at this time may reducethe likelihood of subsequent problems.
356
IV. BREASTFEEDING: COMMON PROBLEMS AND THEIR MANAGEMENT
Infant Feeding Guidelines for Health Workers
• Express milk until successful attachment is achieved. If the infant cannotlatch onto the breast, the colostrum needs to be expressed and given tohim or her. Expression should be frequent and thorough to keep thebreasts well drained and to stimulate the milk supply.
• Avoid ‘nipple confusion’: the sucking action used by an infant on thebreast appears to be different from that used on teats and dummies.14 Thetheory of nipple confusion refers to an infant who has difficultiesbreastfeeding because he or she has first learnt to ‘bottle suck’ on teats ordummies in the early postnatal period.15–17 It has been suggested thatbottle teats and dummies should be avoided in the early postnatal period,and if an alternative to breastfeeding is required consideration should begiven to feeding the infant expressed breastmilk with a cup, spoon18 orsyringe or to gavage.
N I P P L E S H I E L D S
Using nipple shields may be associated with a decreasing milk supply.19–21,14 Theiruse should be limited to situations where all other avenues of treatment havefailed. If a nipple shield is needed, the woman should be referred to a qualifiedperson, such as a lactation consultant, midwife, maternal and child health nurse,or Australian Breastfeeding Association counsellor.
O T H E R N I P P L E P R O B L E M S
Candida
A lactating mother suffering from candida (thrush) infection of the nipples orbreast, or both, may experience breast pain, nipple pain or nipple rash.22,23
Breast pain is often described as ‘shooting, burning’ pain, like ‘red-hot needles’,that radiates from the nipple into the breast. The pain can occur both during andbetween breastfeeds. Similarly, the nipples may be painful during and betweenbreastfeeds. In the case of nipple rash, the nipples may look normal, be abrighter pink than usual, or be covered with an erythematous rash and possiblyitchy. In association with these maternal symptoms, the infant may have oral andperianal thrush.
Treatment
Miconazole or nystatin is a suitable antifungal agent for topical application to thenipples while simultaneously treating the infant with an oral preparation.Treatment should continue until mother and infant have been symptom-free forseveral days. If pacifiers (dummies) are used during an episode of monilialinfection they could be a source of re-infection: they should be boiled severaltimes each day and be replaced after a week.
357
IV. BREASTFEEDING: COMMON PROBLEMS AND THEIR MANAGEMENT
Infant Feeding Guidelines for Health Workers
Eczema and dermatitis
Eczema and dermatitis are generalised skin conditions that can affect the nipplesand breasts of breastfeeding women. There are three main types:
• atopic eczema, where the nipples are affected by more widespread skindisease
• irritant contact dermatitis, occurring in response to an agent being appliedto the nipples
• allergic contact dermatitis, which is a delayed hypersensitivity reaction toan allergen in contact with the nipple—for example, in nipple cream oreven food in the baby’s mouth.24
Management• Avoid using soap and nipple creams—except for the treatment of candida.
• If a nipple cream being used for the management of thrush is suspected,change to another antifungal agent.
• Breastfeed before offering solids to the infant and/or rinse the infant’smouth with water to avoid food allergens in the mouth.
• To reduce the infant’s exposure, topical corticosteroids should be usedonly as a last resort. When one is necessary, use the minimum effectivepreparation strength for the shortest period and apply it sparingly to thenipples after a feed.
‘ T O O M U C H M I L K ’
When an infant is not removing the milk effectively, there might be a perceived‘oversupply’ of milk (see also ‘Engorgement’, later in this section).
Some women find they initially have so much milk that it causes temporarydifficulties. This is more common in the early days of breastfeeding because thebreasts have the potential to feed more than one infant. But as an infantcontinues to feed, local autocrine control of milk production helps to balance theamount of milk produced with the amount he or she is taking.
Management• Provide reassurance that it is usually a temporary problem and will resolve
with time.
• Try temporarily feeding on one breast only at each feeding time. Theinfant is put back on the first breast instead of being offered the secondbreast.
• Provide symptomatic relief—ice packs, analgesia (paracetamol) and breastsupport.
• Expression of milk at the beginning or end of feeds will also help to easediscomfort. It may prolong the excess production somewhat but it can be a
358
IV. BREASTFEEDING: COMMON PROBLEMS AND THEIR MANAGEMENT
Infant Feeding Guidelines for Health Workers
more comfortable approach while the milk supply is settling down. Theexpressed milk can be saved and stored for future use (see Section V).
There is no evidence that posture feeding assists, so it is not recommended.
‘ T O O L I T T L E M I L K ’
It is important to distinguish between actual low milk supply and perceived lowmilk supply. Although most problems of undersupply can be resolved byimproving the management of breastfeeding, a very small proportion of womendo not have the metabolic capacity to produce enough breastmilk for theirinfants. Perceived low milk supply is a cause of much anguish to mothers andthe most common reason for stopping breastfeeding early.25 Underlyingendocrine and/or metabolic defects, while uncommon, do occur; among them areanother pregnancy, oral contraceptives or diuretics, and thyroid disease.
The mother’s milk supply is sufficient if:
• The infant is fully breastfed—that is, receiving no other fluids or solids—and producing six to eight very wet nappies of pale, inoffensive-smellingurine in a 24-hour period.
• When young, the infant has some greenish-gold bowel motions daily,changing to less frequent soft, pasty or curdy yellow bowel as he or shebecomes older.
• The infant is alert, with bright eyes, moist lips and good skin tone.
· The infant is reasonably content for some time between some feeds.
• The infant has appropriate weight gain when averaged out over a four-week period, remembering that infants often lose 5 to 10 per cent of theirbirthweight during the first week.
• The infant is fed according to need rather than schedule, although somesleepy infants may have to be reminded.
There are a number of reasons mothers (and those around them) believe theyhave insufficient milk:
• The infant keeps turning his or her head and opening the mouth, as ifwanting to suck. This is the ‘rooting reflex’, present from birth to 3 or4 months of age; infants do it when they are awake and alert andsomething touches their cheek, whether or not they are hungry.
• The mother experiences no sensation of let-down or the sensation fades ordisappears as the infant grows older.
• The infant is unsettled. The reasons infants cry a lot and have troublesleeping are complex and varied: when an infant is taking the breast well,gaining weight and developing normally, it is unlikely that the unsettledbehaviour has anything to do with breastfeeding.
359
IV. BREASTFEEDING: COMMON PROBLEMS AND THEIR MANAGEMENT
Infant Feeding Guidelines for Health Workers
• The translucent appearance of breastmilk makes the mother (or others)think breastmilk is weaker than formula or cow’s milk and therefore not asnourishing.
• The mother may be unable to express much milk. It must be rememberedthat the ability to express is not a reflection of how much milk the infanttakes.
• The infant starts to suck her fists all the time: between 8 and 12 weeks ofage her hands are almost never out of her mouth. This is a normal part ofsensory and motor development and not a sign of hunger.
• Between six and 12 weeks after the birth the mother’s breasts stop leakingand become softer and smaller. This is normal and not a sign ofinsufficient milk.
• The infant’s bowel motions become less frequent at about 6 to 12 weeks ofage.
• The feeds become shorter.
• The mother receives well-meaning advice from an assortment of sources,suggesting that her milk supply is not ‘satisfying the baby’. This plantsdoubts in the mother’s mind about the quantity and quality of her milksupply. Similar suggestions—‘the baby would be more content and sleepfor longer if the milk was satisfying’, ‘you’ll have greater peace of mind ifyou can see how much the baby is getting’, and so on—contribute to themother’s misperceptions about her milk supply.
Actual insufficiency of breastmilk has a number of possible causes:
• Positioning or attachment is incorrect.
• The infant is not feeding frequently enough or not being given enoughtime to feed, or the milk is not being removed from the breast. Afterseveral days the milk supply will start to diminish.
• The use of dummies, which reduce sucking time at the breast, caneventually lead to reduced milk supply.26
• Reduction mammaplasty (breast reduction surgery) and other breastsurgery, while not precluding breastfeeding, can hinder full lactation.Some areas of the glandular tissue that are no longer connected to thenipple ducts will become hard when the milk comes in, but this istemporary because these sections of the breast will gradually cease tomake milk in response to local autocrine control.
• Very rarely, insufficient glandular tissue can be a problem, particularly if amother has undergone augmentation surgery for a congenital lack ofmammary tissue. It must be borne in mind, though, that breastmilkproduction is not related to breast size.
• Retained placenta can cause reduced milk supply.
360
IV. BREASTFEEDING: COMMON PROBLEMS AND THEIR MANAGEMENT
Infant Feeding Guidelines for Health Workers
Management
A low supply of breastmilk is usually a temporary difficulty; only occasionallydoes it become a continuing problem that requires supplementation of thebreastmilk supply. It is important that health care professionals recognise thesigns and symptoms of insufficient milk—among them can be infant lethargyand/or irritability, jaundice, infrequent stools, and scant urine production orinfrequent urinating. Any failure to gain weight or excessive weight loss (7–10 per cent of birth weight) over a period should be assessed. Intervention isvital if an infant’s health might be jeopardised; it should include a fullassessment of lactation and a plan that preserves breastfeeding.27 A number ofstrategies may be helpful:
• Check positioning and attachment.
• Feed more frequently.
– Offer the breast between the usual feeds.
– Offer the breast as a comforter instead of a dummy.
– Wake the infant and offer an extra feed before going to bed.
• Allow the infant to finish the first breast before offering the second breast.
• Always feed from each breast more than once each feed.
• Express milk between feeds.
• Encourage good maternal nutrition and rest.
– Recommend a healthy, well-balanced diet.
– Discourage excessive exercise and weight-loss diets.
– Ensure adequate fluid intake by encouraging the mother to drinkwhen thirsty.
– Encourage rest and relaxation.
• Metoclopramide, a dopamine antagonist, induces the release of prolactinand has been shown to increase milk supply.28–32 It has been used inmothers with lactation failure caused by stress.33
• If the infant requires supplementation, this can best be achieved by usinga supply line or supplementary nursing system available from theAustralian Breastfeeding Association. A supply line consists of a plasticcontainer of expressed breastmilk or formula hung around the mother’sneck; a fine tube leading from it is taped to the mother’s nipple, and asthe infant sucks on the breast he or she gets both milk from the breast andexpressed milk or formula from the supply line. The ‘nursingsupplementer’ is a similar product available from pharmacies.
The supply line obviates the possibility of ‘nipple confusion’, which can result ifa bottle and teat are used, and encourages milk production by continuedstimulation of the breast.34 Mothers using a supply line when discharged fromhospital need specific follow-up and referral to a health professional. Carefulsterilisation of supply lines is essential.
361
IV. BREASTFEEDING: COMMON PROBLEMS AND THEIR MANAGEMENT
Infant Feeding Guidelines for Health Workers
The most important factor to remember is:
SUPPLY = DEMAND
A good milk supply is dependent on continued stimulation of the breast.
E N G O R G E M E N T
Engorgement is a problem that occurs primarily in the early days of lactation. Itis usually preventable and always manageable.
If breastmilk is not removed effectively, engorgement will result. Feeding otherfluids can decrease an infant’s demand for breastmilk. Over-distension of thealveoli with milk can also restrict blood flow, leading to further distension anddiscomfort. Early engorgement can be reduced by correct positioning andattachment and unrestricted access to the breast.35 Engorgement can also resultfrom prolonged separation of mother and infant and from weaning too rapidly.
Management• Unrestricted sucking is the best response to engorgement. Dummies and
complementary feeds should not be used.
• Correct positioning and attachment are vital; expressing a small amount ofmilk first may provide relief and help with attachment.
• Relief of the discomfort associated with engorgement can be found insimple analgesia (for example, paracetamol), cold packs between feeds,and support of the breast, although the bra should not be too tight. Somewomen find it more comfortable not to wear a bra; others prefer lightsupport—perhaps a T-shirt tied under the breasts or a crop top.
• Feeding twice on the first breast can be tried as a temporary strategy.
• It can be helpful to remove the bra during feeding and allow the milkfrom the second breast to flow freely into a towel or cloth.
• If engorgement persists for more than a day or two—especially in the earlydays of lactation—the cycle can be broken by completely draining bothbreasts with an electric pump after a feed, but this is a ‘one-off’ strategythat brings relief and makes it easier for the baby to attach to the breast atthe next feed.
Young infants often feed eight to 12 times in 24 hours, including several timesduring the night. If a mother is separated from her infant, complete expression(usually as often as the infant would breastfeed) is necessary.
Untreated engorgement can progress to complications such as suppression oflactation, blocked ducts, mastitis, and even breast abscess.
362
IV. BREASTFEEDING: COMMON PROBLEMS AND THEIR MANAGEMENT
Infant Feeding Guidelines for Health Workers
I N F L A M M ATO RY C O N D I T I O N S O F T H E B R E A S T
Non-infective mastitis
Non-infective mastitis can result from a blocked milk duct. Usually one segmentof a breast becomes tender, reddish and hardened. The inflammation occursbecause milk in the blocked duct cannot be removed and banks up, causinglocalised distension. If the blockage is not cleared rapidly, milk is forced into thesurrounding breast tissue, causing inflammation. A blocked milk duct will notinitially be accompanied by systemic symptoms such as fever and aches andpains, but as the breast becomes more inflamed flu-like symptoms may develop.Blockage of ducts frequently recurs, and mothers need to be advised of thispossibility and informed about preventive measures.
A variety of factors can lead to a blocked duct:
• poor drainage of the breast as a result of poor positioning and attachmentor incorrect sucking
• sudden engorgement caused by a missed feed, perhaps because the infanthas changed his or her feeding pattern—for example, by sleeping throughthe night. It can also happen if the mother is absent for a feed and cannotexpress milk while away.
• a tight or ill-fitting bra or other clothing putting pressure on one particularsegment of the breast, inhibiting drainage
• consistently lying on one side or in one position during sleep, placingpressure on the breast
• pressure on one spot if the mother holds the breast too tightly, particularlyclose to the nipple, during feeding.
Treatment• Check positioning and attachment.
• Vary the feeding positions of the infant.
• Feed the infant frequently, starting with the affected side and pointing theinfant’s chin towards the blocked duct.
• A warm cloth can be applied before and during a feed to assist the let-down.
• The affected area can be gently massaged, towards the nipple, whilefeeding or expressing.
• Cold packs can be applied for comfort after feeding.
• Paracetamol can be taken as needed—simple analgesia, four-hourly.
When treated promptly, a blocked duct should clear in 24 to 48 hours. If thepooling of the milk continues, the inflammation will intensify and provide anideal environment for bacterial growth, leading to infective mastitis.
363
IV. BREASTFEEDING: COMMON PROBLEMS AND THEIR MANAGEMENT
Infant Feeding Guidelines for Health Workers
Infective mastitis
Infective mastitis generally results from either an immense overgrowth ofpathogenic bacteria or conditions that give bacteria access to breast tissue whileat the same time preventing the body from destroying them. It can develop veryrapidly.
There are several predisposing factors:
• nipple trauma
• poor physical health
• a blocked milk duct
• a sudden change in feeding pattern, such as abrupt weaning
• use of nipple creams.
The most common form of infective mastitis is cellulitis caused by infection withStaphylococcus aureus36 or, less commonly, a streptococcus.
The appearance of a breast harbouring infective mastitis differs from that of abreast with a blocked duct only in degree. The breast will usually be red,swollen, hot and painful. The skin may appear tight and shiny and be streakedwith red. The mother will be feeling very unwell, with general myalgia (musclepain) and a fever. A health professional should consider infective mastitis in anybreastfeeding mother who complains of flu-like symptoms.
Prevention• Ensure correct positioning of the infant on the breast to avoid nipple
trauma and poor breast drainage.
• Avoid sudden long periods between feeds.
• Handle breasts gently to avoid bruising.
• Treat blocked milk ducts promptly.
• Wear loose, comfortable clothing.
• Avoid localised obstruction of the breast—such as a tight bra.
• Avoid nipple creams and ointments.
• Avoid prolonged use of nipple pads, especially plastic-backed ones.
• Maintain good health.
Treatment• Early detection of infective mastitis is very important, and health workers
need to be aware of the signs. A medical practitioner should be consultedwithout delay.
• Most importantly, breastfeeding should continue. This is not the time towean because such an abrupt change can increase the risk of developing abreast abscess.36 The breast should be kept as well drained as possible.
• Breastfeed frequently.
• Express after feeds.
364
IV. BREASTFEEDING: COMMON PROBLEMS AND THEIR MANAGEMENT
Infant Feeding Guidelines for Health Workers
• Feed from the affected breast first—but not all the time because as theother breast may become engorged.
• Varying the feeding position may help to drain the affected area. Forexample, if the outer area is affected the underarm position may assistdrainage of that area.
If after trying these measures the symptoms persist, antibiotics should be startedearly and continued for 10 days. As noted, Staphylococcus aureus is the mostcommon cause, and suitable antibiotics are Cephalexin, Erythromycin andFlucloxacillin.37 On completion of a course of antibiotics, the mother may needto be reassessed by her GP to ensure that the mastitis has resolved completely.37
Hospitalisation and intravenous antibiotics may be required if severe cellulitishas developed. Adequate analgesia should be provided, and bed rest and anadequate fluid intake encouraged.
Breast abscess
A breast abscess is a serious and painful condition. It is usually the result ofuntreated or inadequately treated mastitis, and it requires urgent medicalattention. The abscess may be managed with needle aspiration38 or with surgicalincision but, unless the position of the incision makes it impossible,breastfeeding should continue.
B L O O D I N T H E B R E A S T M I L K
Blood in the breastmilk occasionally occurs in late pregnancy or in the first fewdays after delivery. Its cause is unclear, although it is thought to be ducthyperplasia. When excess duct cells are dislodged during feeding or expressing,bleeding may result. Since only a small amount of blood is involved, it will notupset the baby and breastfeeding can continue as normal. If bleeding persistsbeyond a few days, however, medical referral is required to exclude thepresence of a duct papilloma or other breast pathology.
If a baby vomits milk containing blood the most common cause is bleeding fromtraumatised nipples.
P O S T N ATA L D E P R E S S I O N A N D M O O D D I S O R D E R S
Knowledge about the use of drugs during pregnancy and lactation is advancingrapidly, so where specific medications are mentioned here the most recentadvice should be sought. Medication that permits continued breastfeeding isnearly always available.
‘The blues’ is a mild, transient disorder occurring in the first week after deliveryand peaking on the third to fifth day. It affects up to 70 per cent of mothers.39
365
IV. BREASTFEEDING: COMMON PROBLEMS AND THEIR MANAGEMENT
Infant Feeding Guidelines for Health Workers
The symptoms are swings from tearfulness to elation and irritability or increasedsensitivity. Empathy, support and encouragement are all that is necessary fortreatment.
Post-partum psychosis is a severe psychiatric illness that begins acutely withinthe first three weeks of delivery. It affects two women per 1000 births ordeliveries and is characterised by confusion and indecisiveness. The mother mayhave hallucinations or delusions, with a mixture of affective (manic, depressiveor manic-depressive) or schizophrenic symptoms. Hospitalisation—ideally in aspecialised mother–baby unit—and appropriate medication are necessary.40,41
Antipsychotics are often needed in the first few days of treatment; in this case,breastfeeding must be stopped temporarily. Health professionals can encouragemothers to maintain their milk supply by helping them express by hand or witha breast pump, discarding the milk.
Postnatal depression is an episode of major depression that arises within the firstthree to six months after delivery.42 It is important to distinguish betweenpostnatal depression and the common mood changes experienced by manypostnatal women who are sleep-deprived and struggling to come to terms withtheir new role. These common mood changes are probably better termed an‘adjustment disorder with depressed (or anxious) mood’; women experiencingthis need counselling, encouragement and support from their families and healthprofessionals.
Depression as an illness is distinguished from an adjustment disorder by thepersistence of the depressed mood and the presence of other symptoms,especially disturbed sleep, loss of appetite, loss of self-esteem, lethargy, andpoor concentration. Anxiety and irritability are also common. Australian studieshave shown prevalence rates for birth-induced depression ranging from 9 percent at six weeks after birth43 to 14 per cent at four months44 and 15.4 per centat eight months.45
It is generally accepted that the aetiology of postnatal depression is multi-factorial, involving psychological factors, hormonal changes and social variables.Australian studies46,47 have shown that the condition was associated with lack ofsupport (being single, divorced or separated), not breastfeeding, having aCaesarean or forceps delivery, feeling dissatisfied with various aspects ofmaternity care, and being a non–English speaking immigrant. In some states andterritories the Edinburgh Postnatal Depression Scale has been used to screenwomen as part of their postnatal care. The questionnaire has been validated foruse in Australia.48
If symptoms are marked—especially loss of appetite, insomnia, constantlylowered mood and feelings of worthlessness—medication and sometimeshospitalisation may be required. Antidepressant medication is not alwaysnecessary, but where it is appropriate women find that it quickly reduces theiranxiety and helps with sleeping problems. It is often not until two to threeweeks after the full dosage is reached that the full antidepressant effect occurs.Breastfeeding can continue while a mother is on tricyclic antidepressants and
366
IV. BREASTFEEDING: COMMON PROBLEMS AND THEIR MANAGEMENT
Infant Feeding Guidelines for Health Workers
most other drugs; for other classes of antidepressants specific advice onbreastfeeding must be sought. Enabling a mother experiencing postnataldepression to continue breastfeeding may help her feel more positive about hermothering ability. Counselling or psychotherapy from a skilled healthprofessional is essential for both the mother and her partner. Referral to asupport group can also be valuable.
Among the mood-stabilising medications that have been the subject of at leastlimited studies in breastfeeding women are tricyclic antidepressants, selectiveserotonin reuptake inhibitors, benzodiazepines, and the mood stabilisers lithium,carbamazepine and divalproex.49–51 Tricyclic antidepressants such as dothiepinand amitriptyline are considered safe for the breastfeeding infant. The risk ofrecurrence of post-partum psychosis with subsequent deliveries is high, andlithium prophylaxis has proved beneficial52 , although it should be used onlyunder close supervision.53 A Cochrane Review concluded that mothers withpostnatal depression can be effectively treated with fluoxetine and that this waseffective as a course of cognitive-behavioural counselling in the short term.54
The reviewers also commented that postnatal depression is a neglected area,despite its large public health impact.
B R E A S T R E F U S A L
The causes of breast refusal are numerous; often no cause can be found.
Among the infant-related causes can be the following:
• infectious illness—for example, respiratory illness causing a blocked noseand/or sore ears. Clearing a blocked nose with saline drops may solve afeeding problem
• frequent regurgitation with acid reflux—oesophagitis rarely occurs underthe age of 4 months
• allergy resulting in blockage of the Eustachian tube
• thrush
• distractions (10 weeks onwards)—some babies are easily distracted andneed a quiet environment to feed. This is in fact a normal development ininfants.
Among the mother-related causes can be the following:
• a change in perfume or talcum powder
• mastitis, which leads to salty-tasting milk
• unwell mother
• illness decreasing the milk supply or inhibiting let-down
• medication altering the taste of milk
• hormonal changes, which may affect both the taste and the supply of milk
• ovulation—three or four days before ovulation there appears to be achange in milk composition
367
IV. BREASTFEEDING: COMMON PROBLEMS AND THEIR MANAGEMENT
Infant Feeding Guidelines for Health Workers
• menstruation
• pregnancy.
Other causes can be low milk supply, a slow let-down response, and milk flowthat is too fast.
Management
A number of management strategies might be helpful:
• reassurance—encouraging mothers to relax and not to perceive breastrefusal as a personal rejection. They need to know this is usually atemporary situation. Support from their health professional or AustralianBreastfeeding Association counsellor is extremely important
• stopping the feed when the infant cries and refuses the breast
• feeding the infant when he or she is drowsy, either when just awakeningor just going to sleep
• encouraging the infant to suck on a finger and then slipping the nipple in
• calming the infant by singing, rocking or massaging him or her beforefeeding
• trying alternative feeding positions
• expressing milk into the infant’s mouth
• expressing milk and feeding the infant with a cup or bottle
• dealing with any underlying causes of an unwell baby.
T H E C RY I N G I N F A N T
Our society encourages the perception that infants who are loved, well cared forand well fed do not cry. So parents are bewildered when, in spite of all theirefforts, their infant continues to cry. For this reason, they often seek a healthprofessional’s advice during the first three months. Crying is an essential part ofhuman development, but it is a complex subject and there are many differentschools of thought about the management of a crying infant.
It is easy to respond to crying caused by hunger, heat, cold, noise, or a clearlydefined medical problem. Less easy, but usually manageable, are causes such asover-tiredness or over-stimulation. Crying that persists after all these needs aremet can cause deep distress and frustration—for the infant and especially theparents.
The age and times of day at which infants cry tend to fall into identifiablepatterns. From birth to 3 weeks of age many infants sleep a lot. Their cryingperiods do not last long and are easy to resolve. From 3 weeks to 3 months thescene changes dramatically, with infants being more wakeful and active. Theircrying, unsettled behaviour can be loosely classified into three types:
368
IV. BREASTFEEDING: COMMON PROBLEMS AND THEIR MANAGEMENT
Infant Feeding Guidelines for Health Workers
• Explained crying is ‘expected crying’. It has an obvious cause, and theinfant can usually be calmed and settled by simple measures such asfeeding, rocking or patting, and sometimes a bath or a walk. Occasionallythe crying is caused by a clearly defined medical problem such as a urinarytract infection, which can be treated.
• Unexplained crying for short periods is ‘unexpected crying’ for a reasonthat is hard to determine. Unexplained crying for short periods every 24hours is normal for about 80 per cent of healthy babies.55 Parents findtheir baby cries for one to four hours every 24 hours, in spite of promptattention to his or her needs. It usually happens in the evening and rarelyin the morning before lunch, but it may occur at any time during the 24-hour period.
• Third, there is unexplained crying for long periods. Researchers estimatethat about 10 to 35 per cent of healthy babies cry for long periods of theday and night.56 This sort of crying in healthy, well–cared for babies isdifficult to resolve—no one really knows what the cause is, the baby can’ttell us, and there is no single solution that suits every baby.
Management• Rule out hunger with care. Breastfed babies commonly have times when
they feed frequently, and it does not necessarily indicate a low milksupply. Unexplained crying in healthy babies is usually not caused bybreastfeeding problems. Weighing the baby—and thus assessing theircontinuing growth—remains the most reliable way of checking thelikelihood of hunger. Once hunger has been ruled out, the baby’s cryingand sleeping patterns should be seen as unrelated to breastfeeding.
• Exclude medical causes.
• Parent counselling that emphasises safe options rather than solutions canbe valuable. Advice needs to be tailored to individual mothers and babies.
• Mothers may find that a return to their antenatal relaxation techniques is ahelp.
The following strategies work sometimes:
• rocking and patting
• wrapping the baby firmly in a flexed position
• carrying the baby in a sling
• taking the baby for a walk or trying some other gentle, rhythmic activity
• playing music or other rhythmic sounds
• giving the mother permission to let her baby cry for short periods whenthere is nothing else she can do—well-fed tired babies sometimes sleepafter crying for 20 to 30 minutes.
Parents should be encouraged to be flexible and try whatever strategy they thinkis reasonable at the time. They should be reassured that they will not ‘spoil’ their
369
IV. BREASTFEEDING: COMMON PROBLEMS AND THEIR MANAGEMENT
Infant Feeding Guidelines for Health Workers
baby by picking her up all the time, nor will they ‘damage’ her by allowing herto cry for short periods.
In general, there are no easy answers and research suggests that parentcounselling, support and practical help are more effective remedies than medicaldiagnoses and medications.57,58
R E G U R G I TAT I O N A N D G A S T RO - O E S O P H A G E A L R E F L U X
Regurgitation is common and may occur in about 40 per cent of infants aged lessthan 3 months. It is probably a normal physiological response to food in thestomach. Gastro-oesophageal reflux is a condition of frequent regurgitation orvomiting, often beginning between 2 and 6 weeks of age. If severe, it can leadto complications such as failure to thrive, recurrent aspiration (which may beassociated with apnoea) and pneumonia.59 Most infants with regurgitation orreflux remain healthy and thrive, and the symptoms settle down between 6 and10 months of age, when the infant begins to spend more of the day in an uprightposture.
The symptoms in young infants differ from those seen in older children andinclude excessive crying, irritability, back arching, breast refusal and feedingdifficulties. Oesophagitis (inflammation of the oesophagus) is extremely rare ininfants under 4 months of age.
Diagnosis
The diagnosis of gastro-oesophageal reflux is made on clinical grounds. It isimportant to exclude other causes of vomiting in infants—such as pyloricstenosis, infections, chronic renal or cardiac disease, allergy, anatomicalabnormalities of the gastrointestinal tract, or metabolic disorders. Heacock et al.showed that physiological gastro-oesophageal reflux was significantly lesscommon in breastfed infants than in those fed formula.60 This finding wasunrelated to feed volume.
Investigation is required only when complications are present or if the infantdoes not respond to simple management measures.
Management
Reassurance
The majority of infants will have physiological regurgitation and will settlespontaneously. Provided the infant is thriving, no investigation or intervention isrequired. It is important not to label these children as having a condition such asgastro-oesophageal reflux.
370
IV. BREASTFEEDING: COMMON PROBLEMS AND THEIR MANAGEMENT
Infant Feeding Guidelines for Health Workers
Posture
Placing the infant in a more upright feeding position can be helpful forregurgitation. Keeping the infant upright for 15 to 30 minutes after feeding alsohelps; a baby sling is useful in this setting. The best position for reducing refluxis prone but, because this position has been associated with an increasedincidence of sudden infant death syndrome, it is not generally recommended.61
No other lying position has been shown to be effective.
Food thickening
Thickening feeds with rice cereal or carob has been shown to be effective inclinical trials in regurgitating infants but not in complicated gastro-oesophagealreflux. Thickening is difficult with breastfeeding, and in that case liquid Gavisconis sometimes effective, although it can cause constipation. Recently infantformulas containing a thickening agent (AR formulas) have become widelyavailable. Data on their clinical efficacy are limited but they offer no benefit overrice cereal. They should be considered only for reducing regurgitation; they arenot an anti-reflux formula.62
Drug therapy
Drug therapy should be given only under medical supervision. There are twopossible therapies: acid reduction and use of prokinetic agents.
At present there is no drug available that is truly anti-reflux. The ideal drugwould reduce the frequency of transient lower oesophageal sphincterrelaxations, the major contributor to gastro-oesophageal reflux. Medicationscontaining antacids for treatment of reflux act only for a short time. The responseof an irritable infant to antacid suggests that the symptoms are related to acidreflux. H
2receptor antagonists provide more potent acid reduction. Proton pump
inhibitors are the most potent reducers of gastric acid and also have an anti-reflux effect.
Cisapride, the most widely used prokinetic agent for gastro-oesophageal reflux,has been withdrawn from use in reflux for safety reasons.63 Drugs in this classworked on the premise that delayed gastric emptying was an important cause ofreflux, but this now seems unlikely. Several studies have also shown thatCisapride in fact offered no symptomatic benefit in children with reflux.64 Noother agents have proven benefit.65
A study of the natural history of reflux66 showed that active medical managementproduces control of symptoms such that approximately 50 per cent of cases needno further therapy beyond 8 to 10 months of age and 30 per cent beyond 18months of age. However, 17 per cent of patients have ongoing symptoms orcomplications requiring anti-reflux surgery.
371
IV. BREASTFEEDING: COMMON PROBLEMS AND THEIR MANAGEMENT
Infant Feeding Guidelines for Health Workers
Surgical intervention
Surgical intervention is restricted to infants for whom medical management hasfailed and/or who have potentially life-threatening complications such as apnoeaor aspiration.66
P H Y S I O L O G I C A L J A U N D I C E
Some degree of physiological jaundice—or early-onset jaundice—occurs inalmost half of all infants; it shows up after 24 hours of age, peaks on the third orfourth day of life, and declines steadily through the first week. An early firstbreastfeed (within an hour or so of birth) and frequent breastfeeds with norestrictions help to prevent or reduce jaundice. Frequent stimulation of theinfant’s gut speeds up the elimination of meconium, which contains jaundice-causing bilirubin.67
If an infant requires phototherapy breastfeeding should continue. The infantshould be removed from under the lights to be breastfed: intermittentphototherapy is as effective as continuous therapy.68 If the infant becomessleepy or requires extra fluids while under phototherapy, the mother can expressmilk to be given in addition to breastfeeds.
B R E A S T M I L K J A U N D I C E
A small percentage of infants have prolonged jaundice, which cannot bedistinguished from early-onset jaundice in the first week. Any infant jaundicedbeyond 2 weeks of age should have a serum-conjugated (direct) bilirubindetermination, together with serum amino transferase levels, in order to excludea pathologic cause of hyperbilirubinaemia (for example, biliary atresia).Breastmilk jaundice—or late-onset jaundice—manifests itself in the second weekof life with a rising serum bilirubin concentration. The exact cause is unknown,but it appears to be a syndrome associated with the milk of a particular mother.Varying degrees of the syndrome are likely to occur with subsequentpregnancies.69 Usually the infant is thriving, healthy and gaining weight and hasnormal bowel motions. Once other causes of prolonged or excessive jaundice(such as haemolytic disease, hypothyroidism, G6PD deficiency and intestinalobstruction) are ruled out, late-onset jaundice requires no intervention. No casesof kernicterus caused by breastmilk jaundice have been reported.69
R E F E R E N C E S
1. World Health Organization. Protecting, promoting and supportingbreastfeeding: the special role of maternity services. Joint WHO–UNICEFstatement. Geneva: WHO–UNICEF, 1989.
372
IV. BREASTFEEDING: COMMON PROBLEMS AND THEIR MANAGEMENT
Infant Feeding Guidelines for Health Workers
2. Kuan L, Britto M, Decolongon J, Schoettker P, Atherton H, Kotagal U.Health system factors contributing to breastfeeding success. Pediatrics.1999;104(3):E28.
3. Lieu T, Braveman P, Escobar G, Fischer A, Jensvold N, Capra A. Arandomized comparison of home and clinic follow-up visits after earlypostpartum hospital discharge. Pediatrics 2000;105(5):1058–65.
4. Melnikow J, Bedinghaus JM. Management of common breast-feedingproblems. J Fam Pract 1994;39(1):56–64.
5. Lawlor-Smith C, McIntyre E, Bruce J. Effective breastfeeding support in ageneral practice. Aust Fam Physician 1997;26(5):573–5, 578–80.
6. Scott JA, Binns CW, Aroni R. Infant feeding practices in Perth andMelbourne. Report for the National Better Health Promotion Program.Perth: Curtin University, 1995.
7. Woolridge MW. Aetiology of sore nipples. Midwifery 1986;2(4):172–6.
8. Martin J, Monk J. Infant feeding practice in 1980: OPCS Survey. London:HMSO, 1983.
9. Sloper KS, Eldsen E, Baum JD. Increasing breastfeeding in a community.Arch Dis Childhood 1977;52:700–2.
10. Brent N, Rudy SJ, Redd B, Rudy TE, Roth LA. Sore nipples in breast-feeding women: a clinical trial of wound dressings vs conventional care.Arch Pediatr Adolesc Med 1998;152(11):1077–82.
11. Hagen RL. Lanolin for sore nipples. Arch Pediatr Adolesc Med1999;153(6):658.
12. Huml S. Sore nipples: a new look at an old problem through the eyes of adermatologist. Pract Midwife 1999;2(2):28–31.
13. Hewat RJ, Ellis DJ. A comparison of the effectiveness of two methods ofnipple care. Birth 1987;14(1):41–5.
14. Woolridge M, Baim J, Drewett R. Effect of traditional and of a new nippleshield on sucking patterns and milk flow. Early Hum Dev 1980;4:357–64.
15. Bu’Lock F, Woolridge MW, Baum JD. Development of co-ordination ofsucking, swallowing and breathing: ultrasound study of term and preterminfants. Developmental Medicine and Child Neurology 1990;32(8):669–78.
16. Newman J. Breastfeeding problems associated with the early introductionof bottles and pacifiers. J Hum Lact 1990;6(2):59–63.
17. Neifert M, Lawrence R, Seacat J. Nipple confusion: toward a formaldefinition. J Pediatrics 1995;126:S125–S130.
18. Lang S, Lawrence CJ, Orme RE. Cup feeding: an alternative method toinfant feeding. Arch Dis Child 1994;71:365–9.
19. Amatayakul K, Vutyavanich T, Tanthayaphinant O, Tovanabutra S,Yutabootr Y, Drewett RF. Serum prolactin and cortisol levels after suckling
373
IV. BREASTFEEDING: COMMON PROBLEMS AND THEIR MANAGEMENT
Infant Feeding Guidelines for Health Workers
for varying periods of time and the effect of a nipple shield. Acta ObstetGynecol Scand 1987;66:47–51.
20. Auerbach KG. The effect of nipple shields on maternal milk volume. JObstet Gynecol Neonatal Nurs 1990;19:419–27.
21. Jackson DA, Woolridge MW, Imong SM, McLeod CN, Yutabootr Y,Wongsawat L et al. The automatic sampling shield: a device for samplingsuckled breast milk. Early Hum Dev 1987;15:295–306.
22. Amir LH, Pakula P. Nipple pain, mastalgia and candidiasis in the lactatingbreast. Aust NZ J Obstet Gynaecol 1991;31(4):378–80.
23. Johnstone HA, Marcinak JF. Candidiasis in the breastfeeding mother andinfant. J Obstet Gynecol Neonatal Nurs 1990;19:171–3.
24. Amir L. Eczema of the nipple and breast: a case report. J Hum Lact1993;9(3):173–5.
25. Barros F, Victoria CG, Semer TC, Tonioli-Filho S, Tomasi E, Weiderpass E.Use of pacifiers is associated with decreased breastfeeding duration.Paediatrics 1995;95(4):497–9.
26. Woolridge M, Baum J, Drewett R. Individual patterns of milk intake duringbreastfeeding. Early Hum Devel 1982;7:265–72.
27. Dobson B, Murtaugh M. Position of the American Dietetic Association:breaking the barriers to breastfeeding. JADA 2001;101(10):1213–20.
28. Ehrenkranz TA, Ackerman BA. Metoclopramide effect on faltering milkproduction by mothers of premature infants. Pediatrics 1986;78(4):614–20.
29. Guzman V, Toscano G, Canales ES, Zarate A. Improvement of defectivelactation by using oral metoclopramide. Acta Obstet Gynec Scand1979;58:53–5.
30. Kauppila A, Kivinen S, Ylikorkala O. A dose response relation betweenimproved lactation and metoclopramide. Lancet 1983;1(8231):1175–7.
31. Seema, Patwari AK, Satyanarayana L. Relactation: an effective interventionto promote exclusive breastfeeding. J Trop Pediatr 1997;43(4):213–16.
32. Kauppila A, Kivinen S, Ylikorkala O. Meoclopramide increases prolactinrelease and milk secretion in puerperium. J Clin Endocrinol Metab1981;52:436–9.
33. Lau C. Effects of stress on lactation. Pediatr Clin Nth Am 2001;48(1):221–34.
34. Sutherland F. Breastfeeding with the use of a supply line. Nursing MothersAssociation of Australia Newsletter 1987;May:24–5.
35. Moon Jl, Humenick SS. Breast engorgement: contributing variables andvariables amenable to nursing intervention. J Obstet Gynecol Neonatal Nurs1989;18:309–15.
36. Marshall BR, Hepper JK, Zirbel CC. Sporadic puerperal mastitis. JAMA1975;233(13):1377–9.
374
IV. BREASTFEEDING: COMMON PROBLEMS AND THEIR MANAGEMENT
Infant Feeding Guidelines for Health Workers
37. Mashford ME. Antibiotic guidelines 1994–1995. 8th edn. Melbourne:Therapeutics Committee, Victorian Medical Postgraduate Foundation Inc.,1995.
38. Dixon JM. Repeated aspiration of breast abscess in lactating women. BMJ1988;297(6662):1517–18.
39. Kennerley H, Gath D. Maternity blues detection and measurement byquestionnaire. Br J Psychiat 1989;155:356–62.
40. Brockington IF, Cernik KF, Scholfield EM, Downing AR, Francis AF, KeelanC. Puerperal psychosis: phenomena and diagnosis. Arch Gen Psychiat1981;38:829–33.
41. Nurnberg HG, Prudic J. Guidelines for treatment of psychosis duringpregnancy. Hosp Comm Psychiat 1984;35(1):67–71.
42. Boyce PM, Stubbs JM. The importance of postnatal depression. MJA1994;161(8):471–2.
43. Stamp GE, Crowther CA. Postnatal depression: a South Australianprospective survey. Aust NZ J Obstet Gynaecol 1993;34:164–7.
44. Astbury J, Brown S, Lumley J, Small R. Birth events, birth experiences andsocial differences in postnatal depression. Aust J Pub Hlth 1994;18:176–84.
45. Small R, Astbury J, Brown S, Lumley J. Depression after childbirth: doessocial context matter? Med J Aust 1994;161:473–7.
46. Williams H, Carmichael A. Depression in mothers in a multi-ethnic urbanindustrial municipality in Melbourne. J Ch Psychol Psychiat 1985;26:277–88.
47. Small R, Brown S, Lumley J, Astbury J. Missing voices: what women say anddo about depression after birth. J Reprod Infant Psychol 1994;12:89–103.
48. Boyce P, Stubbs J, Todd A. The Edinburgh Postnatal Depression Scalevalidation for an Australian sample. Aust NZ J Psychiat 1993;27:472–6.
49. Suri, Altshuler et al. 1998
50. Iqbal MM, Gundlapalli SP, Ryan WG, Ryals T, Passman TE. Effects ofantimanic mood-stabilizing drugs on fetuses, neonates, and nursing infants.South Med J 2001;94(3):304–22.
51. Misri S, Kostaras D, Kostaras X. The use of selective serotonin reuptakeinhibitors during preganancy and current knowledge. Can J Psychiat2000;45:285–7.
52. Austin MP. Puerperal affective psychosis: is there a case for lithiumprophylaxis? Br J Psychiat 1992;161(Nov):692–4.
53. Iqbal MM, Sohhan T, Mahmud SZ. The effects of lithium, valproic acid, andcarbamazepine during pregnancy and lactation. J Toxicol Clin Toxicol2001;39(4):381–92.
375
IV. BREASTFEEDING: COMMON PROBLEMS AND THEIR MANAGEMENT
Infant Feeding Guidelines for Health Workers
54. Hoffbrand S, Howard L, Crawley H. Antidepressant drug treatment forpostnatal depression (Cochrane Review). Cochrane Database Syst Rev2001;2.
55. Brazelton TB. Crying in infancy. Pediatrics 1962;29:579–88.
56. National Health and Medical Research Council. Infant colic: currentconcepts in aetiology and management. Canberra: Australian GovernmentPublishing Service, 1991.
57. Taubman B. Parental counselling compared with elimination of cow’s milkor soy milk protein for the treatment of colic syndrome: a randomised trial.Pediatrics 1988;81:756–61.
58. Carey WB. Infantile colic: a pediatric practitioner-researcher’s point ofview. Inf Ment Hlth J 1990;2:334–9.
59. Davidson G, Omari T. Reflux in children. Bailliere’s Clinical Gastroenterol2002;14:839–55.
60. Heacock H, Jeffery H, Baker J, Page M. Influence of breast versus formulamilk on physiological gastroesophageal reflux in healthy, newborn infants.J Ped Gastroent Nutr 1992;14(1):41–46.
61. Bremberg S. Health promotion at Swedish child health centres. ActaPaediatr Suppl 2000;89(434):53–6.
62. Vandenplas Y, Belli D, Cadranel S, Cucchiara S, Dupont C, Heymans H etal. Dietary treatment of regurgitation—recommendations from a workingparty. Acta Paediatr 1998;87:462–8.
63. Miller J. Cisapride to be taken off market, placed in controlled-access plan.Am J Health Syst Pharm 2000;57:834.
64. Cohen R, O’Loughlin E, Davidson G, Moore D, Lawrence D. Cisapride inthe control of symptoms in infants with gastro oesophageal reflux. JPediatr 1999;134:287–92.
65. Vandenplas Y, Belli D, Benhamou P, Cadranel S, Cezard JP, Cucchiara S etal. A critical appraisal of current management practices for infantregurgitation—recommendations of a working party. Eur J Paediatr1997;156:343–57.
66. Shepherd RW, Wren J, Evans S, Lander M, Ong TH. Gastro-oesophagealreflux in children: clinical profile, course and outcome with active therapyin 126 cases. Clin Pediatr (Phila) 1987;26(2):55–60.
67. De Carvalho M, Robertson S, Klaus M. Fecal bilirubin excretion and serumbilirubin concentrations in breast-fed and bottle-fed infants. J Pediatrics1985;107(5):786–90.
68. Jahrig K, Jahrig D, Meisel P. Dependence on the efficiency of phototherapyon plasma bilirubin concentration. Acta Paediatr Scand 1982;71:293–299.
69. Auerbach KG, Gartner LM. Breastfeeding and human milk: their associationwith jaundice in the neonate. Clin Perinatal 1987;14:89–107.
377
IV. BREASTFEEDING: COMMON PROBLEMS AND THEIR MANAGEMENT
Infant Feeding Guidelines for Health Workers
V E X P R E S S I N G A N D S TO R I N GB R E A S T M I L K
It is important that instructions for collecting and storing breastmilk do not seemdaunting; nor should they promote anxiety by implying that there is a risk ofharming the infant.1,2
E X P R E S S I N G B R E A S T M I L K
Mothers may need to express their breastmilk for a variety of reasons:
• The infant is sick or premature.
• Mother and baby are temporarily separated.
• The mother is returning to paid work.
• The milk supply needs to be increased.
• The mother’s breasts are uncomfortably full.
The requirements for collecting breastmilk for sick or premature babies inhospital are more stringent than those applying to collecting milk for healthybabies at home. Midwives, lactation consultants, early childhood nurses andAustralian Breastfeeding Association counsellors are available to provide adviceabout expressing, both in hospital and at home.
There are three methods of expressing: hand expressing, hand pump expressing,and electric pump expressing. The mother’s choice will depend on her reasonfor expressing and her personal preference. The following general hints apply,regardless of the method chosen:
• Express in a comfortable, private place.
• Disable the telephone.
• Have a glass of water nearby.
• Have all expressing equipment ready.
• Relax! Music may help.
Hand expressing
Every mother should be shown how to hand express her milk. This method hasmany advantages: no equipment is required; it is convenient; and the skin-to-skin contact stimulates milk production. In spite of initial reservations, manywomen find hand expressing becomes easier with practice. Here are the steps:
• Wash hands with soap and warm water.
378 Infant Feeding Guidelines for Health Workers
V. EXPRESSING AND STORING BREASTMILK
• Gently massage the breast. Start from the top of the breast and stroketowards the nipple; massage the underside too. Do this several times toensure that the whole breast is massaged.
• Hold a clean plastic dish under the breast to collect the milk. This may bedifficult for some mothers to manage when they are learning: instead, awide bowl can be held between the legs or placed on a low table, leavingboth hands free; a towel may be needed to catch any spills.
• Place thumb and finger diagonally opposite each other on the edge of theareola.
• Gently press inward towards the centre of the breast, squeezing the fingerand thumb together.
• Repeat with a rhythmic rolling movement, feeling for the milk sinuses. Thefingers should not slide over or pinch the skin.
• Once the milk flow has stopped, move the fingers around the nipple andpress again. This helps express more milk and empty all sectors of thebreast.
• Repeat the process on the other breast.
• If more milk is required, the mother can change from breast to breast untilshe has the amount of milk needed or she can wait and try again later.
Hand pumps
Hand pumps are portable and relatively inexpensive. They are recommended if amother is breastfeeding and needs to express regularly once or twice a day whenaway from her baby. Many types are available; they should be used according tothe manufacturers’ instructions. The following steps relate to piston hand pumps:
• Wash hands with soap and warm water.
• Have a clean, sterilised pump ready.
• Gently massage the breast. Start from the top of the breast and stroketowards the nipple; massage the underside too. Do this several times toensure that the whole breast is massaged.
• Place the flat rim of the breast cup on the breast, centring the nipple.
• Gently work the pump with a smooth action, pulling the piston andreleasing the suction rhythmically. By releasing the suction, the bloodcirculation to the areola and the nipple will be maintained.
• Continue working the pump until the breast is soft and about half therequired amount of milk has been expressed.
• Change to the other breast and repeat the process, starting with the gentlemassage.
• If more milk is required the mother can change from breast to breast untilshe has the amount needed or she can wait and try again later.
• Pour the collected milk into a storage container and put it in therefrigerator (see ‘Storage of expressed breastmilk’, below).
379
V. EXPRESSING AND STORING BREASTMILK
Infant Feeding Guidelines for Health Workers
Electric pumps
Electric breast pumps are recommended when the baby is sick or premature,mothers are separated from their babies for long periods, mothers are not gettingenough milk using other expression methods, and babies cannot attach well atthe breast. Here are the steps to follow when using an electric pump:
• Wash hands with soap and warm water.
• Have the sterilised pump equipment ready.
• Gently massage the breast. Start from the top of the breast and stroketowards the nipple; massage the underside too. Do this several times toensure that the whole breast is massaged.
• Place the breast cup on the areola, centring on the nipple.
• Turn the suction strength to low, start the pump, and relax.
• Gradually increase the suction strength—as long as there is no discomfort.The strength should not be increased above the recommended level forthe type of pump being used.
• Continue until the breast is soft and about half the required amount ofmilk is collected.
• Change the cup to the other breast, turning the suction to low, and repeatthe process, beginning with the gentle breast massage.
• If more milk is required, the mother can change from breast to breast untilshe has the required amount or she can wait and try again later.
• Pour the collected milk into a storage container and put it in therefrigerator (see ‘Storage of expressed breastmilk’).
Electric breast pumps can be hired from many pharmacies or from the AustralianBreastfeeding Association.
F E E D I N G W I T H E X P R E S S E D B R E A S T M I L K
Expressed breastmilk can be fed to an infant by bottle, cup or spoon. Using acup will minimise problems with nipple confusion. Whether a bottle, a cup or aspoon is used, the same procedures for sterilisation and storage apply.
S TO R A G E O F E X P R E S S E D B R E A S T M I L K
The requirements for storing breastmilk are more stringent for sick or prematurebabies in hospital than for healthy babies at home.
Storing breastmilk in hospital
Mothers and health workers should wash their hands thoroughly with soap andwater before handling breastmilk.
380 Infant Feeding Guidelines for Health Workers
V. EXPRESSING AND STORING BREASTMILK
• Breastmilk is best used when fresh. A mother should try to provide freshbreastmilk daily for her baby; if this is not possible, the milk can be storedin a refrigerator or freezer in sterilised plastic containers.
• Breastmilk refrigerated at 4°C for 48 hours suffers little loss of nutrients orimmunological properties and the bacterial count is actually reduced.3
• Freshly expressed milk should be chilled in the refrigerator before beingadded to frozen milk.
• Warmed milk should be given straight away and any amount left overshould be discarded.
• Never refreeze or reheat breastmilk.
• Label the container with surname, date, and time of expression.
• Do not thaw or warm breastmilk in the microwave.
• Thaw breastmilk by placing it in either cool or warm water. Shake the milkgently before using it if it has separated.
• Thawed milk should be used within 24 hours.
Mothers should be given advice about cleaning, storing and sterilisingequipment—see Section VIII.
Storing breastmilk at home
Very little special handling of a mother’s milk is necessary. Since it is alreadysterile when it comes from the breast, expressed breastmilk is safer to use thanprepared infant formula. It can be stored in glass or plastic containers, includingsealable plastic bags. Freshly expressed milk can be chilled in the refrigeratorand added to frozen milk in the freezer.
The following is a simple guide for mothers storing expressed breastmilk athome4 :
• Wash hands thoroughly with soap and water.
• Refrigerate or freeze milk after expressing.
• Use fresh milk whenever possible.
• Freeze milk that will not be used within two days.
• Use the oldest milk first; date the container at the time of collection.
Table V.1 shows how long breastmilk can be stored.
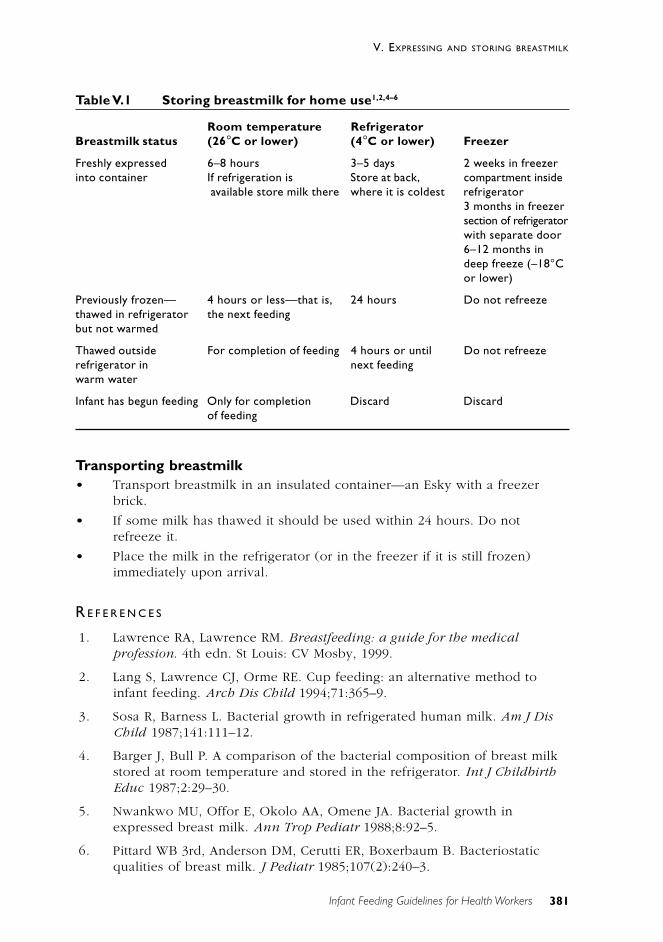
381
V. EXPRESSING AND STORING BREASTMILK
Infant Feeding Guidelines for Health Workers
Table V.1 Storing breastmilk for home use1,2,4–6
Room temperature RefrigeratorBreastmilk status (26°C or lower) (4°C or lower) Freezer
Freshly expressed 6–8 hours 3–5 days 2 weeks in freezerinto container If refrigeration is Store at back, compartment inside
available store milk there where it is coldest refrigerator3 months in freezersection of refrigeratorwith separate door6–12 months indeep freeze (–18°Cor lower)
Previously frozen— 4 hours or less—that is, 24 hours Do not refreezethawed in refrigerator the next feedingbut not warmed
Thawed outside For completion of feeding 4 hours or until Do not refreezerefrigerator in next feedingwarm water
Infant has begun feeding Only for completion Discard Discardof feeding
Transporting breastmilk• Transport breastmilk in an insulated container—an Esky with a freezer
brick.
• If some milk has thawed it should be used within 24 hours. Do notrefreeze it.
• Place the milk in the refrigerator (or in the freezer if it is still frozen)immediately upon arrival.
R E F E R E N C E S
1. Lawrence RA, Lawrence RM. Breastfeeding: a guide for the medicalprofession. 4th edn. St Louis: CV Mosby, 1999.
2. Lang S, Lawrence CJ, Orme RE. Cup feeding: an alternative method toinfant feeding. Arch Dis Child 1994;71:365–9.
3. Sosa R, Barness L. Bacterial growth in refrigerated human milk. Am J DisChild 1987;141:111–12.
4. Barger J, Bull P. A comparison of the bacterial composition of breast milkstored at room temperature and stored in the refrigerator. Int J ChildbirthEduc 1987;2:29–30.
5. Nwankwo MU, Offor E, Okolo AA, Omene JA. Bacterial growth inexpressed breast milk. Ann Trop Pediatr 1988;8:92–5.
6. Pittard WB 3rd, Anderson DM, Cerutti ER, Boxerbaum B. Bacteriostaticqualities of breast milk. J Pediatr 1985;107(2):240–3.
383
V. EXPRESSING AND STORING BREASTMILK
Infant Feeding Guidelines for Health Workers
V I B R E A S T F E E D I N G I N S P E C I F I CS I T UAT I O N S
There are very few situations for which breastfeeding is contra-indicated. Evenmothers who have serious conditions are able to breastfeed successfully; amongthese conditions are1 :
• type 1 diabetes
• type 2 diabetes
• gestational diabetes
• multiple sclerosis
• systemic lupus erythematosis
• hypothyroidism
• hypertension
• Crohn’s disease and ulcerative colitis
• phenylketonuria
• cystic fibrosis
• fibrocystic disease.
A B S O L U T E C O N T R A - I N D I C AT I O N S TO B R E A S T F E E D I N G
In a limited number of situations breastfeeding is absolutely contra-indicated:
• active tuberculosis that has not yet been treated. Any contact with theinfant, including breastfeeding, is not permitted until the mother hasfinished two weeks of treatment. The infant is usually prescribedprophylactic treatment. Lactation is initiated and maintained by expressingbreastmilk until contact is approved
• brucellosis (undulant fever), which, like tuberculosis, can pass from themother’s blood to the breastmilk
• recently acquired maternal syphilis with an unaffected infant. Mother–infant contact and breastfeeding can begin after 24 hours of therapy,provided there are no lesions around the breasts or nipples. If there arelesions around the breasts or nipples, feeding may begin or resume oncetreatment is complete and the lesions are healed
• breast cancer detected during pregnancy1
• HIV infection. In Australia, women who are HIV positive are advised not tobreastfeed. Transmission of the human immunodeficiency virus throughbreastfeeding is well documented. The US Centers for Disease Control and
384
VI. BREASTFEEDING IN SPECIFIC SITUATIONS
Infant Feeding Guidelines for Health Workers
Prevention advise women with HIV infection not to breastfeed.2,3 TheNHMRC4 and the American Academy of Pediatrics5 have issued statementsin support of this position. Other countries may have different policies. Fordeveloping countries, the WHO and other UN agencies currentlyrecommend exclusive breastfeeding by HIV-positive mothers until 6months of age and then transfer to other methods of feeding. Use ofretroviral drugs assists in reducing mother-to-infant transmission. It isestimated that the rate of mother-to-infant transmission duringbreastfeeding is 10–20 per cent, but all the studies are fraught withproblems of definition of exclusive breastfeeding6
• rare metabolic disorders of infants such as galactosaemia and maple syrupurine disease, which severely limit or render impossible the infant’s use ofcertain milk components. In cases of phenylketonuria, partialbreastfeeding may be possible, provided there is careful monitoring by apaediatrician and a dietitian with expertise in metabolic disease
• hepatitis B infection, although breastfeeding may begin or resume once theinfant has been immunised.
R E L AT I V E C O N T R A - I N D I C AT I O N S TO B R E A S T F E E D I N G
Some conditions may need to be considered on their merits before use of infantformula is advised:
• maternal medications. Most drugs are excreted into the breastmilk butusually in concentrations less than 1–2 per cent of the maternal dose,which rarely poses a danger to the infant.7–9 Some drugs may be contra-indicated during breastfeeding, but this is a complex subject and advicegiven may depend on factors such as the drug dose, the duration oftreatment, and the nature of the illness. The advice of the generalpractitioner who prescribed the medication or the pharmacist at thenearest women’s or children’s hospital should be sought if there is anydoubt.
• hepatitis C. There is as yet no evidence that hepatitis C is transmittedthrough breastmilk
• specific illnesses in the infant. Breastfeeding can continue in almost allcircumstances
• maternal illness and malignancy, depending on the mother’s health and themedications used
• maternal psychiatric illness if there is definite danger to the infant. Apsychiatrist’s advice should be sought.
385
VI. BREASTFEEDING IN SPECIFIC SITUATIONS
Infant Feeding Guidelines for Health Workers
N I C OT I N E , A L C O H O L A N D OT H E R D R U G S
Nicotine
Cigarette smoking can affect the mother’s milk supply and may causegastrointestinal upsets in the infant, so mothers are advised to give up smoking.If this is not possible, they should reduce their smoking as much as possible, andthey should completely avoid smoking in the hour before feeding, and duringfeeding, to reduce the harmful effects. No one should smoke in the same roomas an infant because of the dangers of passive smoking. Smokers are less likelyto breastfeed, but they should be encouraged to do so because of the modifyingeffect breastfeeding has on the ill-effects of smoking.
Alcohol
The level of hepatic alcohol dehydrogenase activity in infants is less than 50 percent of that in adults.10 Ingestion of alcohol by breastfeeding mothers can lead toimpaired neurologic development in their infants. One study found thatPsychomotor Development Index scores were lower among infants who wereexposed to alcohol through breastmilk than among those who were notexposed.11 When a breastfeeding mother takes even one standard alcoholicdrink, a small quantity of ethanol passes into her milk and is subsequently takenby the suckling infant, so lactating women are advised not to drink alcohol. Theaverage woman takes about two hours to metabolise one standard drink. Thus, amother who does take alcohol should limit the amount to one drink, consumedjust after a breastfeeding; this will allow the alcohol to be substantiallymetabolised before the next feed.8 The level of alcohol in the breastmilk is thesame as the level in the mother’s blood. Larger amounts of alcohol inhibit thelet-down reflex.
Other drugs
Marijuana should not be smoked by breastfeeding mothers. Use of other mood-altering substances is also contra-indicated: these substances may be excreted inthe breastmilk. In addition, a mother who is not fully alert can be a hazard toherself and her infant while breastfeeding or preparing infant formula.
Use of methadone for the treatment of narcotic addiction is justified duringlactation.8
Appendix F provides information about breastfeeding and pharmaceutical andother drugs.
386
VI. BREASTFEEDING IN SPECIFIC SITUATIONS
Infant Feeding Guidelines for Health Workers
W O M E N A N D PA I D W O R K
Returning to paid work has a significant impact on the experience ofbreastfeeding and is commonly cited as a reason for ceasing to breastfeed.12–14
Among the factors that have limited mothers’ ability to continue breastfeedingare the relative brevity of maternity leave, inflexible hours of work, and the lackof paid breastfeeding (or pumping) breaks while at work.15 Until recently, therights of a woman in paid employment to breastfeed her baby have beenneglected; increasingly, though, the social environment in Australia is allowingmothers the choice of working and breastfeeding and this is being recognised inemployment contracts.
The booklet Balancing Breastfeeding and Work outlines the benefits ofpromoting breastfeeding—for employers, mothers and infants.16 The facilitiesthat should be provided are listed and a number of other usefulrecommendations are made. A number of websites also provide usefulinformation (see Appendix I).
The International Labour Organisation’s Convention 103 on Maternity Protection(1952) calls on member nations to provide, by national legislation, anentitlement of at least 12 weeks’ maternity leave. During this period the motheris to be entitled to cash benefits provided by a compulsory social insurancescheme or from public funds. The convention also calls for nursing breaks forwomen in the workplace.
In Australia, most employed women are entitled to maternity (or parental) leave,although there is variation in the benefits available. In some areas of the publicsector a period of maternity leave is paid; in the private sector maternity leave isgenerally unpaid.
Regardless of their eligibility for paid maternity leave, many women, foreconomic or personal reasons, return to paid work before they want to stopbreastfeeding. They commonly find that their workplace lacks the flexibility andfacilities—such as work-based child care or the time and a suitable place toexpress and store milk—that would allow them to combine breastfeeding andtheir job. Because of this, some women who intend to return to work may bediscouraged from initiating breastfeeding and others may feel that breastfeedinghas to stop once paid work starts.
This is usually not the case. Health workers need to be well informed andpositive when advising parents about combining breastfeeding and paid work.When it is not possible for the mother to go to her baby during working hours,several options are available:
• replacing breastfeeds during work hours with expressed breastmilk fedfrom a cup or a bottle
• for babies aged 6 months and over, replacing breastfeeds during workhours with food from a spoon and a cup
• replacing breastfeeds during work hours with infant formula fed from acup or a bottle.
387
VI. BREASTFEEDING IN SPECIFIC SITUATIONS
Infant Feeding Guidelines for Health Workers
Health workers need to be aware that breastfeeding and formula feeding can becombined: using formula does not mean the mother has to cease breastfeeding.When formula is used during working hours, breastfeeding can still continuebefore and after work and during weekends. A combination of both expressedbreastmilk and formula can be given to a baby when there is not enoughexpressed milk.
It is important that in the first six weeks to three months of a baby’s life healthworkers give the mother as much assistance as possible to establishbreastfeeding successfully; that way, the mother has a greater range of options.Accurate advice on expressing, storing and using frozen breastmilk, as well as onbottle-feeding and using formula, is also necessary.
Health workers should become advocates for workplace adoption of policies thatenable women to breastfeed. Such policies entail flexible working hours, work-based child care, and provision of rooms for expressing breastmilk orbreastfeeding and of refrigerators for storing expressed milk.
L O W - B I RT H W E I G H T I N F A N T S
Management of low-birthweight infants is beyond the scope of this document.Infants weighing less than 2000 grams at birth have relatively higherrequirements for nutrients—such as protein, calcium, phosphorus and zinc—andoften need breastmilk that has been fortified. Feeding infants of low or very lowbirthweight with breastmilk reduces the incidence of infection, includingsepticaemia, meningitis and necrotising enterocolitis.17–19
R E F E R E N C E S
1. Dobson B, Murtaugh M. Position of the American Dietetic Association:breaking the barriers to breastfeeding. JADA 2001;101(10):1213–20.
2. Centers for Disease Control and Prevention. Public Health Servicerecommendations for human immunodeficiency virus counseling andvoluntary testing for pregnant women. MMWR 1995;44(RR–7):1.
3. Department of Health and Human Services. Blueprint for action onbreastfeeding 2000. Washington DC: DHHS, 2000.
4. National Health and Medical Research Council. Consensus statement fromthe WHO–UNICEF consultation on HIV transmission and breastfeeding. In;1993.
5. American Academy of Pediatrics. Human milk, breastfeeding, andtransmission of human immunodeficiency virus in the United States.Pediatrics 1995;96:977–9.
6. Coutsoudis A. Promotion of exclusive breastfeeding in the face of the HIVpandemic. Lancet 2000;356:1620–1.
388
VI. BREASTFEEDING IN SPECIFIC SITUATIONS
Infant Feeding Guidelines for Health Workers
7. Colvin J. Drugs and breastfeeding guide. The Royal Women’s Hospital,1994/95.
8. Ito S. Drug therapy for breast-feeding women. N Eng J Med 2000;343:118–28.
9. APA Drugs Co. The transfer of drugs and other chemicals in human milk.Pediatrics 1994;93:137–50.
10. Pikkarainen P, Raiha N. Development of alcohol dehydrogenase activity inthe human liver. Pediatr Res 1967;1:165–8.
11. Little R, Anderson K, Ervin C, Worthington-Roberts B, Clarren S. Maternalalcohol use during breast-feeding and infant mental and motordevelopment at one year. N Engl J Med 1989;321:425–30.
12. Visness C, Kennedy K. Maternal employment and breast-feeding: findingsfrom the 1988 National Maternal and Infant Health Survey. Am J Pub Hlth1997;87(6):945–50.
13. James J. Working & breastfeeding: a contemporary workplace dilemma.Australian College of Midwives 1999;12(4):8–11.
14. Noble S, Team TAS. Maternal employment and the initiation ofbreastfeeding. Acta Paediatr 2001;90:423–8.
15. Fein S, Roe B. The effect of work status on initiation and duration ofbreast-feeding. Am J Pub Hlth 1998;88(7):1042–6.
16. Department of Health and Aged Care. Balancing breastfeeding and work.Canberra: DHAC, 2000.
17. Lucas A, Fewtrell M, Morley R, Lucas P, Baker B, Lister G et al.Randomized outcome trial of human milk fortification and developmentaloutcome in preterm infants. Am J Clin Nutr 1996;64:142–51.
18. Hylander M, Strobino D, Dhanireddy R. Human milk feedings and infectionamong very low birth weight infants. Pediatrics 1998;102(3):E38.
19. Schanler R, Shulman R, Lau C, Smith E, O’Brian M, Heitkemper M. Feedingstrategies for premature infants: randomized trial of gastrointestinalpriming and tube-feeding method. Pediatrics 1999;103:434–9.
389
VI. BREASTFEEDING IN SPECIFIC SITUATIONS
Infant Feeding Guidelines for Health Workers
V I I I N F O R M E D U S E O F C O M P L E M E N TA RYF E E D S I N H O S P I TA L
Complementary feeding is not helpful for the early establishment of successfulbreastfeeding. When complementary feeds are to be used in hospital, the mothershould give her informed consent. If an infant has become dehydrated,rehydration may enable him or her to begin breastfeeding successfully: apaediatric assessment should be made before seeking the mother’s consent forthis. It should be emphasised, however, that such a situation is uncommon, evenin Australia’s climate. A consent form that tells the mother about the advantagesof breastfeeding and the risks associated with not breastfeeding should besigned. The implications of complementary feeding for establishing andmaintaining successful breastfeeding should be the subject of discussion betweenhealth worker and mother; an example of a consent form is shown inAppendix H.
It is also important that women be informed about their options for feedingbefore they are admitted to hospital, preferably during the antenatal educationperiod. The decision to breastfeed, or not to do so, should be an informed one.To assist in this decision making, all pregnant women and their partners shouldhave the opportunity to discuss feeding methods with their midwife or doctor.They should be encouraged to read the wide selection of material available oninfant feeding, and they should be told about community groups that offerinformation and support for women who intend to breastfeed—for example, theAustralian Breastfeeding Association and La Leche League.
391
VIII. SAFE USE OF INFANT FORMULA
Infant Feeding Guidelines for Health Workers
V I I I S A F E U S E O F I N FA N T F O R M U L A
The primary objective of the WHO International Code of Marketing of Breast-milk Substitutes is to ensure safe and adequate nutrition for infants by protectingand promoting breastfeeding and by ensuring the safe use of infant formula,when it is necessary, on the basis of adequate information and throughappropriate marketing and distribution. The Code states that feeding with infantformula should be demonstrated only by health workers or other communityworkers and only to those mothers or family members who need to use formula.In giving this information, health and other community workers should informparents and others of the hazards of improper use of infant formula (WHO Code,Article 6.5).
It is important that health workers know how to demonstrate the reconstitutionof infant formula and how to feed an infant with a bottle. (Bottles may, ofcourse, also be used to feed infants expressed breastmilk.) While breastfeeding isthe objective for all infants, if formula is to be used it is essential that healthprofessionals demonstrate the correct methods and that the methods be regularlymonitored.
I N F A N T F O R M U L A S
Compared with cow’s milk, all modern infant formulas contain reduced proteinand electrolytes and added iron and vitamins A, B group, C, D, E and K. Theprotein in the formula is either casein or whey dominated and, since its aminoacid content is not the same as that in human milk, a slightly higher proteincontent is required in formula. The fat in formula is either butterfat or mixturesof vegetable oils. The mixtures of vegetable oils are closer to the pattern ofsaturated fatty acids in human milk, but the fatty acids’ actual composition isvery different.1
Although human milk constituents are used as a reference point for thedevelopment of infant formula, it is not possible to duplicate human milk. Infantformula lacks many factors present in human milk, including numerous types ofliving cells, cholesterol, polyamines, free amino acids, glycosamine, and enzymesand other bioactive substances. Furthermore, the sterilisation (pasteurisation)processes used in manufacturing formula slightly modify the structure of thecow’s milk proteins, with a consequent loss of any cross-species protectionagainst infection. The processing does, however, reduce the allergenicity of thecow’s milk protein. Although research into the development of formulas iscontinuing, it is unlikely that these products will provide the variety of nutrientand active factors present in human milk in the foreseeable future.1 In spite of
392
VIII. SAFE USE OF INFANT FORMULA
Infant Feeding Guidelines for Health Workers
this, when a baby is not breastfed use of an infant formula offers a better way ofmeeting their primary nutritional needs than using modified raw cow’s milk.
Standards for the quality, composition and labelling of infant formulas sold inAustralia are regulated through Standard 2.9.1—Infant Formula in the jointAustralia New Zealand Food Standards Code (volume 2).2 For the purposes ofthe standard, an infant is defined as being a person aged up to 12 months.
Cows’ milk–based formula is suitable for most normal-term infants and isrecommended over formulas made from soy beans or goat’s milk, modifiedlactose formula, or specialised formula designed for babies with nutritionalproblems, which should be used only in the case of medically diagnosedconditions. Changing the type of formula because of minor rashes or irritabilityand infant or parent distress is usually of no benefit.
Although soy formulas offer no advantages over cow’s milk formulas, soyprotein–based formulas have been demonstrated to permit normal growth anddevelopment in infants.3,4 Vegans may prefer a soy-based formula. Soy formulacan also be used as an alternative to cow’s milk formula in infants with anallergy to or intolerance of cow’s milk protein.
A number of concerns have, however, been raised about soy-based infantformulas, on the basis of possible physiological effects of the isoflavonecompounds on the infant’s developing neuro-endocrine system. There is no clearclinical or scientific evidence to support the position that these compounds areharmful, although there have been no long-term studies that conclusivelydocument the product’s safety in infants.
The Australian College of Paediatrics policy for the use of soy formula in infants(1998) is as follows:
1. The indiscriminate use of soy formula for vague symptoms and signs notproven to be due to cow’s milk protein intolerance (CMPI) is to beavoided. Casual treatment in this manner is undesirable because it leads toover-diagnosis of food intolerance, with potential long-term effects onchild health and behaviour.
2. Soy formula should not be used routinely as prophylaxis in infants thoughtto be at risk of the development of allergy. Soy protein is an allergen in itsown right.5 The diagnosis of gastrointestinal CMPI should not be madewithout careful evaluation by an expert in the field. When proven, itshould be treated with formulas containing protein hydrolysates
3. Conditions in infancy for which soy formula may be appropriatelyprescribed are galactosaemia and lactose intolerance.
4. The use of soy formula may not be without side-effects. There is someevidence that soy formula may impair immunity and the long term effectsof contaminants of soy (eg aluminium and phytoestrogens) are unknown.
During its review of infant formula (Proposal P93), Food Standards Australia NewZealand (formerly the Australia New Zealand Food Authority) completed anassessment of the risks to infants from soy-based infant formula. FSANZ
393
VIII. SAFE USE OF INFANT FORMULA
Infant Feeding Guidelines for Health Workers
concluded, ‘The currently available information suggests that, whilephytoestrogens have the potential to cause adverse effects, there is no evidencethat exposure of healthy infants to soy-based infant formula has been associatedwith any demonstrated harm’. It recommended that the use of soy-based infantformula be limited, that support be given for education strategies that promotebreastfeeding, and that, when breastfeeding is not an option, modified cow’smilk formula be chosen in preference to soy-based formula.6 A more recentreview reached similar conclusions.7
In the past there was concern about aluminium levels found in soy formulas, butthese have now been lowered to within the acceptable range.
Many infants who are allergic to cow’s milk are also allergic to goat’s milk andsoy milk.8 Although there is a range of cow’s milk–based formulas on themarket, there is little evidence that one is better than another for normal-terminfants.1
The prices of different infant formulas and the types of retail outlets that sell theformulas are not related to quality or nutritional value. All infant formulas sold inAustralia meet the relevant nutritional and quality-control standards. Use of aparticular formula by a hospital does not mean that formula is the ‘best’ one.Interchange between formulas within the same generic group is optional and canbe decided on the basis of cost.
Standard formulas labelled ‘suitable from birth’ are for infants from birth to 12months. ‘Follow-on’ formulas labelled ‘suitable only for babies over 6 months’are for infants aged from 6 to 12 months, but their use is not considerednecessary for most and there have been no studies showing advantages over theinfant formula they are already having. The American Academy of Pediatricsrecommends that infants be fed breast milk for the first 6 to 12 months and statesthat the only acceptable alternative to breast milk is iron-fortified infantformula.9,10 By 12 months of age infants should be eating a wide variety of familyfoods, and cow’s milk should be introduced at this time.
Long-chain polyunsaturated fatty acids and infant formulas
Long-chain polyunsaturated fatty acids, or LCPUFAs, are important structuralcomponents of lipid-rich cell membranes in the infant’s developing centralnervous system, particularly the brain and retina.11 They are also precursors toeicosanoids, which are oxygenated, highly active lipid mediators such asleukotrienes, prostaglandins and thromboxanes.12 Eicosanoids have key roles asmodulators of renal function, mediators and messengers of allergic andinflammatory reactions, and messengers in cellular signalling cascades.12,13
In infants, LCPUFAs are preferentially accumulated by the brain during the lasttrimester of pregnancy and the first months of life.14 Breastmilk containsLCPUFAs, among them docosahexaenoic acid (DHA, C22:6n-3) and arachidonicacid (AA, C20:4n-6), and their precursors alpha linolenic acid and linoleic acid.15
Evidence suggests that formula-fed premature and newborn infants have limited
394
VIII. SAFE USE OF INFANT FORMULA
Infant Feeding Guidelines for Health Workers
capacity to synthesise sufficient DHA and AA from the precursor fatty acidsnormally included in infant formula16 : they have lower levels of DHA and AA intheir plasma and red blood cell lipids compared with breastfed infants.17,18 Adeveloping body of evidence suggests that formula-fed infants require dietarypreformed DHA and AA to match the tissue accretion rates of infants receivingDHA and AA from breastmilk.11,19,20
Clinical studies have evaluated the dietary benefit of supplementation of DHAand AA and reached different conclusions. A systematic Cochrane Review ofsupplementation in pre-term infants found evidence that n-3 LCPUFAsupplementation of formula increases the early rate of visual maturation in theseinfants.21 A similar review in term infants did not identify a benefit for visual orcognitive development.22 These reviews established that DHA and AAsupplementation of formulas does not influence the growth of term and pre-terminfants, which is a consistent conclusion.23,24,19 More recently, two large trials haveshown that visual acuity and cognitive development in formula-fed infantssupplemented with LCPUFAs were increased compared with infants fedunsupplemented formula.25,26 The failure of earlier studies to find a significantbenefit could be a result of protocol differences, evaluation methodology,limiting levels of supplementation, differing LCPUFA sources, trial sample sizesand other confounding variables.22 Any benefits LCPUFAs in infant formulas offerfor cognitive development are smaller than the advantage of breastmilk overformula for infants.27
Fluoride in infant feeding
Fluoride is an essential nutrient, being part of the structural componentry ofbone and teeth. The US National Research Council recommends a fluoride intakeof 0.1–1.0 milligrams a day for infants aged less than 12 months. An extra0.25 milligrams a day is recommended for breastfed infants and those fed ready-to-use formula that has been made with non-fluoridated water.28
The water supply in most metropolitan and many regional areas in Australia isfortified with approximately 1 milligrams per litre of fluoride. The NationalHealth and Medical Research Council29 recommends that infant formulamanufacturers assume that formula powder will be reconstituted usingfluoridated water, so the level of fluoride in the infant formula powder should bekept as low as possible. An intake above 2 milligrams a day can be regarded asundesirable and may result in mottled teeth in the infant.
In order to limit the amount of fluoride in formula, infant formula manufacturersuse non-fluoridated or de-fluoridated water in processing. This results in infantformula powders that contribute minimal amounts of fluoride to the reconstitutedliquid and levels of less than 1.5 milligrams a litre in the reconstituted formula.In areas where the water supply is not fluoridated, an inadequate intake offluoride by infants and the general community poses a public health problemthat may need to be redressed by health professionals.
395
VIII. SAFE USE OF INFANT FORMULA
Infant Feeding Guidelines for Health Workers
P R E PA R AT I O N O F F O R M U L A
Safe bottle-feeding depends on a safe water supply, sufficient family income tomeet the costs, effective refrigeration, clean surroundings, and satisfactoryarrangements for sterilising and storing equipment. Health workers should beaware that parents without literacy skills or from a non–English speakingbackground might need extra help to make sure bottle-feeding is done safely.
Equipment
The following equipment is needed for preparing formula:
• two to six large bottles. A large variety of bottles made of glass orpolycarbonate (rigid plastic) are available. Bottles made of plastic arepreferred over glass because of the potential for glass to break. Manybottle manufacturers offer differently shaped bottles and bottles with ‘anti-colic’ devices. Decorations and odd shapes make bottles hard to clean andthere is no evidence that a particular shape of bottle prevents wind orcolic
• several teats. Teats are made from rubber, also called latex (brown-coloured), or silicone (clear-coloured). Shape variations (as in ‘orthodontic’teats) offer no particular advantage unless the infant prefers that shape
• a knife for levelling the formula powder
• a bottle brush to clean the bottles
• sterilising equipment.
After use, all equipment should be rinsed in cold water, washed in detergent andhot water, using a bottle brush to thoroughly clean bottles and teats; then rinsedagain before sterilising. Careful cleaning and safe storage of equipment shouldcontinue for as long as bottles and teats are used.
It is recommended that equipment be sterilised until the infant is 12 months of age.
Sterilisation of equipment and water by microwaving is not recommendedbecause microwaves do not heat evenly and this may lead to some equipment orparts of equipment not being properly sterilised.
S T E R I L I S AT I O N M E T H O D S
It is recommended that all equipment used in the preparation of infant formulabe boiled in fresh water for five minutes. Water used in the preparation offormula should also be brought to the boil and boiled for five minutes. In mostcases it is safe to use cold tapwater and then boil it. The water used should meetthe standards specified in the Australian Drinking Water Guidelines <http://www.health.gov.au:80/hfs/nhmrc/publications/synopses/eh19syn.htm>: ‘drinkingwater should be clear, colourless, well aerated, no unpalatable taste or odourand contain no suspended matter, harmful chemical substances or pathogenic
396
VIII. SAFE USE OF INFANT FORMULA
Infant Feeding Guidelines for Health Workers
micro-organisms’. If your tapwater does not meet these standards, plain bottledwater can be used, but it should still be boiled for 5 minutes. Bottled natural orsparkling mineral water should not be used in the preparation of infant formula:its high mineral content raises the renal solute load of the formula and placesstress on the infant’s kidneys.
Boiling water for extended periods (10 minutes or more) is not recommendedbecause of the possibility of concentrating heavy metals such as lead in thewater.
Sterilisation of water is recommended until the age of 12 months.
Microwaving is not recommended because microwaves do not heat evenly.Similarly, using microwaves to reheat formula prior to use is not recommendedbecause hot spots can form in the formula and may burn the infant.30 –33
Boiling
Boiling is the preferred option for sterilisation. It will give consistent and reliableresults if the following steps are taken:
• Place utensils—including bottles, teats and caps—in a large saucepan onthe back burner of the stove.
• Cover utensils with water, making sure to eliminate all air bubbles fromthe bottle.
• Bring water to the boil and boil for five minutes. Turn off—don’t allow itto boil dry.
• Care needs to be taken to avoid scalds, so allow the equipment to cool inthe saucepan until it is hand hot, then remove it. Be extra careful ifchildren are present.
• Store equipment that is not being used straight away in a clean containerin the fridge.
• Boil all equipment every 24 hours, even if it has not been used during thattime.
Note. It is common practice to use an electric jug or kettle with an automatic cut-off to boil water. After the cut-off has activated, reset the cut-off switch and boilagain. This will be about the same as boiling for five minutes.
Sterilising using chemicals
A chemical sterilant is an antibacterial solution that comes in liquid or tabletform. Follow the manufacturer’s instructions carefully when making up thesolution to ensure the correct dilution. After 24 hours discard the used solution,thoroughly scrub the container and equipment in warm water with detergent,and make up a new solution. Make sure all equipment is made of plastic orglass: metal corrodes when left in chemical sterilant.
397
VIII. SAFE USE OF INFANT FORMULA
Infant Feeding Guidelines for Health Workers
Completely submerge everything, making sure there are no air bubbles, andleave it in the solution for at least the recommended time. Equipment can be leftin the solution until it is needed. Allow the equipment to drain; do not rinse thesterilising liquid off it or there will be a risk of re-contamination.
Store the sterilising concentrate and solution well out of the reach of children.
Chemical sterilisation is not as effective as boiling: unless bottles and otherutensils are meticulously cleaned, the process will not be effective.
Steam sterilisers
Steam sterilisers are automatic units that raise the temperature quickly to therange that kills harmful bacteria.
Place thoroughly cleaned equipment inside the unit, add water according to themanufacturer’s instructions, and switch on. The unit switches itself off when thesterilisation process is complete.
Microwave steam sterilisers
Sterilising units designed for use in a microwave oven are available. The caveatsthat apply to chemical sterilisation also apply to microwave sterilisation.
U S I N G I N F A N T F O R M U L A
Manufacturers’ information about formula composition is based on accuratelymade-up mixtures, but accuracy is not always achieved in practice. A survey of274 Sydney mothers who were bottle-feeding showed that 30 per cent mademistakes in reconstituting feeds; in 52 cases there were potentially seriouserrors.34 A study by Bennett and Gibson suggests there is an inherent limitationin accuracy when measuring powdered formula with scoops.35 A review of theUS Food and Drug Administration’s Infant Feeding Practices Study, a nationallongitudinal survey, found a high level of non-compliance with best practice; thisincluded 33 per cent of mothers who mixed formula with warm tapwater and upto 48 per cent who heated bottles in a microwave oven.36
Health professionals need to instruct parents how to reconstitute formulacorrectly.
Important points for preparing formula• Formula is designed to remain at a constant strength. As an infant grows it
is the amount of formula that should increase, not the strength. Never, forany reason, add any more scoops than instructed.
• Always use the scoop provided with the brand of formula being used:scoops are not interchangeable between brands. All scoops used in
398
VIII. SAFE USE OF INFANT FORMULA
Infant Feeding Guidelines for Health Workers
Australia should be filled to the level: never use half scoops of powder.When a container of formula is finished, throw away the scoop with thecontainer, to ensure that the correct scoop is used next time.
• If using concentrated liquid formula, use equal proportions of formula andwater unless otherwise instructed.
• If the brand of powdered formula is changed, it is important that theparent is reminded to check the number of millilitres of boiled water perscoop. Brands differ.
• It is important to use cooled boiled water: hot water can destroy vitaminsand other nutrients.
Making the feeds
Prolonged boiling of water is unnecessary when making the feeds. To preparewater for mixing with powder or liquid formula, empty the kettle or electric jug,refill it with water, and bring the water to the boil. Kettles and jugs with noautomatic cut-off should be switched off within 30 seconds of boiling.37 Alwaysallow the water to cool before adding the powder or liquid. Bottled water is safeto use but still should be boiled. Mineral waters and soda water are unsuitable.
The preferred—and safest—way of making formula at home is ‘in the bottle’, oneat a time. This reduces the potential for contamination, the amount of equipmentneeded, and the possibility of mistakes when counting out the scoops offormula.
The procedure• Measure the required amount of cooled, boiled water and pour it into each
bottle.
• Using the scoop from the formula container, measure the required numberof scoops and place them in each bottle. Use a knife to level off eachscoop, and do not pack down the formula in the scoop.
• Seal the bottle with a cap and disc and shake it gently to mix the formula.Note that the total volume will be greater than the measured waterbecause of displacement.
• Store all made-up formula in the centre at the back of the fridge, where itis coldest—not in the door, where it is warmer.
• Throw out any unused formula after 24 hours.
Safety points• Always wash your hands and work surfaces before preparing formula.
• Put formula straight into the refrigerator as soon as it is made.
• Discard the contents of partially used bottles after an hour. Re-using half-empty bottles is risky once they have been heated and sucked on.
399
VIII. SAFE USE OF INFANT FORMULA
Infant Feeding Guidelines for Health Workers
• Check the expiry date on formula containers and discard them if they areout of date. Discard any opened container of formula after a month. Invery hot climates formula can deteriorate before its expiry date.
• The safest way to transport formula is to take the cooled, boiled water andthe powdered formula in separate containers and mix them when needed.When it is necessary to transport prepared formula (or expressedbreastmilk), it must be icy cold when leaving home and be carried in aninsulated pack to keep it cold. It can be given cold to the infant if there isno way of warming it.
• The time taken to warm a bottle of formula should not exceed 10 minutes:bacteria multiply rapidly in warm formula, and extended warming time hasthe potential to create this environment and then cause diarrhoea.
Feeding formula
It is not harmful to feed babies cold formula, but formula warmed to roomtemperature flows faster and generally babies seem to prefer it warm. Standingthe bottle in warm to hot water is the traditional, and safest, way of heatingformula.
Bottle warmers are convenient and safe, provided they have a thermostatcontrol, but bottles should not be left to warm in them for longer than10 minutes. Microwaves are not recommended for warming for safety reasons:they do not heat the milk evenly, so the temperature of the milk can bemisjudged; and, because of ‘hot spots’ in the milk, an infant can receive burns tothe mouth.
Teats and flow rates
It can be difficult to get the milk to flow at just the right rate: several types ofteat may have to be tried until a suitable one is found. ‘Orthodontic teats’ offerno particular advantage, and there is some evidence they could be harmfulbecause of the reduced tongue movement in the suck–swallow cycle, leading toan increased risk of speech problems, particularly in boys. Their shape is alsoimplicated in an increased risk of later orthodontic problems as a result ofpressure on the gums and developing jaw.
To test the flow of a teat, hold the bottle upside down when it is filled withroom-temperature milk mixture: the milk should drip steadily. If the bottle has tobe shaken vigorously, the teat is too ‘slow’ and the infant may go to sleep beforedrinking as much as he or she needs. The milk should drip easily at a steadyrate, without pouring out in a great stream. A little leakage at the corners of themouth while an infant feeds is nothing to worry about; it stops as he or she getsolder. When the ideal teat cannot be found, a faster teat is usually preferable toa slower one.
400
VIII. SAFE USE OF INFANT FORMULA
Infant Feeding Guidelines for Health Workers
Teats need to be checked and replaced regularly. Silicone and rubber teats areprone to perishing and can become dangerous if they crack: they can harbourbacteria, and there is a risk of pieces coming off and being inhaled or ingested.
Reducing the risks of bottle feeding
Before giving the bottle to the infant, always check the temperature of the feedby shaking a little milk from the teat onto the inside of the wrist. It should feelwarm, not hot.
It is important to hold an infant while feeding him or her with a bottle. Not onlyis parent–infant contact extremely important, but leaving infants to feed on theirown can place them at risk. Feeding should be a pleasurable experience for bothmother and infant, regardless of the feeding method. It is dangerous for parentsto ‘prop up’ a bottle and leave the infant to manage alone. The milk may flowtoo quickly and cause the baby to splutter, or even choke. In addition, infantswho feed a lot on their own are at greater risk of ear infection38 and toothdecay. Infants need to be held, cuddled and talked to when they are fed.
Infants should never be put to sleep while drinking from a bottle. Apart from therisk of choking, they can end up with a severe form of tooth decay called bottledecay.39
How much milk?
As with breastfeeding, bottle-feeding according to need is appropriate. Bottle-fedyoung infants need about 150 millilitres per kilogram of body weight each day tomeet their nutrient needs before solids are introduced. Some will require more(up to 200ml/kg); others less. It is important for parents to be aware that thereare many individual variations in the amount of formula and the number ofbottles consumed each 24 hours. Information on formula packagesrecommending certain amounts for various ages is a guide only and does notnecessarily suit every infant. Plenty of wet nappies, consistent (but notexcessive) weight gain, and a thriving, active infant indicate that all is well.
Following are the average formula requirements for infants and toddlers:
• day 1—30 millilitres per kilogram of body weight each day
• day 2—60ml/kg/day
• day 3—90ml/kg/day
• day 4—120ml/kg/day
• day 5 to 3 months—150ml/kg/day. Some, especially premature, babies willrequire up to 180–200ml/kg/day
• 3 to 6 months—120ml/kg/day
• 6 to 12 months—100ml/kg/day. Some may reduce to 90ml/kg/day
• 1 to 2 years—90ml/kg/day.
401
VIII. SAFE USE OF INFANT FORMULA
Infant Feeding Guidelines for Health Workers
Using a cup
A feeding cup can be used instead of a bottle for feeding infant formula orexpressed breastmilk. The technique used by an infant to suck on the teat of abottle differs from that used on the breast40 , and use of a feeding cup instead ofa bottle reduces the risk of confusion. Cups can be used from birth.41 When thedecision to wean is made, infants of all ages can be weaned onto a cup. Thispractice is widespread in developing countries, where difficulties with cleaningmake a cup a potentially safer option than a bottle. The techniques used forsterilising equipment and preparing formula apply equally to feeding cups.
R E F E R E N C E S
1. Daly SEJ, Hartmann PE. Infant demand and milk supply. Part 2: the short termcontrol of milk synthesis in lactating women. J Hum Lact 1995;11:21–6.
2. National Food Authority. Australian Food Standards Code, Standard R7—Infant Formula. Canberra: Australian Government Publishing Service, 1994.
3. Lasekan JB, Ostrom KM, Jacobs JR, Blatter MM, Ndife LI, Gooch WM 3rd etal. Growth of newborn, term infants fed soy formulas for 1 year. ClinPediatr (Phila) 1999;38(10):563–71.
4. Businco L, Bruno G, Giampietro PG. Soy protein for the prevention andtreatment of children with cow-milk allergy. J Clin Nutr1998;68(6)(suppl.):1447S–1452S.
5. Hill D, Hosking C. Preventing childhood allergy: leading articles. M J Aust1993;158:367–8.
6. Australia New Zealand Food Authority. Phytoestrogens: an assessment ofthe potential risks to infants associated with exposure to soy-based infantformula. Canberra: ANZFA, 1999.
7. Strom BL, Schinnar R, Ziegler EE, Barnhart KT, Sammel MD, Macones GAet al. Exposure to soy-based formula in infancy and endocrinological andreproductive outcomes in young adulthood. JAMA 2001;286:807–14.
8. Hill DJ, Ford RPK, Shelton M, Hosking CS. Study of 100 infants and youngchildren with cow’s milk allergy. Clin Rev Allergy 1984;2:125–42.
9 American Academy of Pediatrics (1992). The use of whole cow’s milk ininfancy (RE9251). Pediatrics 89(6): 1105–1109,)
10 American Academy of Pediatrics Committee on Nutrition (1989). Follow-upor weaning formulas. Pediatrics 83(6): 1067–1071
11. Clandinin MT, Van Aerde JE, Parrott A, Field CJ, Euler AR, Lien E.Assessment of feeding different amounts of arachidonic anddocosahexaenoic acids in preterm infant formulas on the fatty acid contentof lipoprotein lipids. Acta Paediatr 1999;88:890–6.
402
VIII. SAFE USE OF INFANT FORMULA
Infant Feeding Guidelines for Health Workers
12. Sellmayer A, Koletzko B. Long-chain polyunsaturated fatty acids andeicosanoids in infants—physiological and pathophysiological aspects andopen questions. Lipids 1999;34:1999–2005.
13. Kurlak and Stephenson, 1999
14. Clandinin MT, Chappell JE, Heim T. Do low weight infants requirenutrition with chain elongation–desaturation products of essential fattyacids? Prog Lipid Res 1981;20:901–4.
15. Rodriguez-Palmero M, Koletzko B, Kunz C, Jensen R. Nutritional andbiochemical properties of human milk—II: lipids, micronutrients andbioactive factors. Clinics in Perinatol 1999;26:335–59.
16. Sauerwald T, Hachey D, Jensen C, Heird W. New insights into themetabolism of long chain polyunsaturated fatty acids during infancy. Eur JMed Res 1997;2:88–92.
17. Makrides M, Neumann MA, Byard RW, Gibson RA. Fatty acid compositionof brain, retina and erthyrocytes in breast- and formula-fed infants. Am JClin Nutr 1994;60:194–8.
18. Jorgenson MH, Hemell, Lund P, Holmer G, Michaelson K. Visual acuity anderythrocyte docosahexaenoic acid status in breast-fed and formula-fed terminfants during the first four months of life. Lipids 1996;31:99–105.
19. Vanderhoof J, Gross S, Hegyi T. A multicenter long-term safety and efficacytrial of preterm formula supplemented with long-chain polyunsaturatedfatty acids. J Pediatr Gastr Nutr 2000;31:121–7.
20. Birch et al 1998
21. Simmer K. Longchain polyunsaturated fatty acid supplementation inpreterm infants. Cochrane Database Syst Rev 2000;(2):(CD000375).
22. Simmer K. Longchain polyunsaturated fatty acid supplementation in infantsborn at term. Cochrane Database Syst Rev 2000;(2):(CD000376).
23. Morris G, Moorcraft J, Mountjoy A, Wells J. A novel infant formula milkwith added long-chain polyunsaturated fatty acids from single-cell sources:a study of growth, satisfaction and health. Eur J Clin Nutr 2000;54:883–6.
24. Diersen-Schade D, Hansen J, CL. H, Merkel K, Wisont K, Boettcher J.Docosahexaenoic acid plus arachidonic acid enhance preterm infantgrowth. In: Essential fatty acids and eicosanoids. Champaign IL: AOCSPress, 1999:123–7.
25. Birch EE, Garfield S, Hoffman DR, Uauy R, Birch DG. A randomizedcontrolled trial of early dietary supply of long-chain polyunsaturated fattyacids and mental development in term infants. Devel Med Child Neurol2000;42:174–81.
26. Birch EE, Hoffman DR, Uauy R, Birch DG, Prestidge C. Visual acuity andthe essentiality of docosahexaenoic acid and arachidonic acid in the diet ofterm infants. Pediatr Res 1998;44:201–9.
403
VIII. SAFE USE OF INFANT FORMULA
Infant Feeding Guidelines for Health Workers
27. Gibson RA. Long-chain polyunsaturated fatty acids and infant development.Lancet 1999;354:1919–20.
28. National Research Council. Recommended dietary allowances. 10th edn.Washington DC: National Research Council, 1989.
29. National Health and Medical Research Council. The effectiveness of waterfluoridation. Canberra: NHMRC, 1991.
30. Nemethy M, Clore E. Microwave heating of infant formula and breastmilk. JPediatr Health Care 1990;4:131–5.
31. American Academy of Pediatrics & American College of Obstetricians andGynecologists. Guidelines for perinatal care. In: Frigoletto F, Little G, IL E,eds. 2nd edn. 1988:201–3.
32. Dixon J, Burd D, Roberts D. Severe burns resulting from an exploding teaton a bottle of infant formula heated in a microwave oven. Burns1997;23(3):268–9.
33. Department of Community Services and Health (Victoria). CommunicableDiseases Update 1993;2(3):103–4.
34. Lilburne A, Oates R, Thompson S, Tong L. Infant feeding in Sydney: asurvey of mothers who bottle feed. Aust Paediatr J 1988;24:49–54.
35. Bennett J, Gibson RA. Inaccuracies in reconstituting infant formulas. Aust JNutr Diet 1988;47(1):27–30.
36. Beck-Fein S, Faici CD. Infant formula preparation, handling, and relatedpractices in the United States. JADA 1999;99(10):1234–40.
37. Taylor K. Boiling of water for the preparation of infant formulae.Communicable Diseases Update 1993;3:27–8.
38. Beauregard WG. Positional otitis media. J Pediatr 1971;79:294.
39. Wight NE. Management of common breastfeeding issues. Pediatr ClinNorth Am 2001;48(2):321–44.
40. Righard L, Alade MO. Sucking technique and its effect on success ofbreastfeeding. Birth 1992;19(4):185–9.
41. Lang S, Lawrence CJ, Orme RE. Cup feeding: an alternative method toinfant feeding. Arch Dis Child 1994;71:365–9.
405
VIII. SAFE USE OF INFANT FORMULA
Infant Feeding Guidelines for Health Workers
I X F O O D S N OT S U I TA B L E F O R I N FA N T SO R T H AT S H O U L D B E U S E D W I T HC A R E
H O N E Y
Honey can contain the spores of Clostridium botulinum, and it is recommendedthat it not be given to children aged less than 2 years. Previously, honey wasprohibited in foods for infants in Australia, but it is now permitted providing ithas been treated to inactivate C. botulinum. This is indicated on the label by theterm sterilised honey.1 After the age of 12 months, children are less susceptibleto this bacterium.1
T E A
Tea contains tannins and other compounds that bind iron and other minerals,thereby reducing their bioavailability. Furthermore, sugar is often added to tea,increasing the risk of dental caries.
N U T S
Nuts are a problem with small children because of the risk of inhalation. For thisreason, they should not be given to children aged less than 5 years. In addition,peanuts pose a risk of allergy: it is estimated that 0.6 per cent of the USpopulation—that is, 1.6 million people—suffer from peanut allergy.2
F R U I T J U I C E S
Juices made from compressed fruit contain all the nutrients present in fruits butnot the dietary fibre. They have historically been given to children to preventvitamin C deficiency and scurvy.
An Adelaide study found that, in addition to milk, fruit juice and water were themain fluids given to infants aged less than 8 months.3 This was especially thecase with non-breastfed infants. The study results suggest that inclusion of juicein infants’ diets is common: 85 per cent of the children on juice in the study hadbegun drinking juice by the age of 6 months.
Fruit juice offers no nutritional benefits to infants under 6 months of age; forinfants over 6 months of age, drinking water or milk and consuming whole fruitare preferable.4,5 Excess consumption of fruit juice by young children has been
406 Infant Feeding Guidelines for Health Workers
IX. FOODS NOT SUITABLE FOR INFANTS OR THAT SHOULD BE USED WITH CARE
associated with gastrointestinal symptoms, failure to thrive, decreased appetite,loose stools, and failure to gain weight.6 –8 In the case of older children andadolescents, see Section 3.8 in the Dietary Guidelines for Children andAdolescents for a discussion of sugar-containing drinks and the risk of obesity.Milk drinks (for children aged more than 12 months) or water are goodsubstitutes; milk is particularly beneficial because of its calcium content.
C O W ’ S M I L K
It is recommended that children under the age of 12 months not be given cow’smilk. The evidence for this recommendation is discussed in Section 3.4 of theDietary Guidelines for Children and Adolescents.
R E D U C E D - F AT M I L K S
In Australia reduced-fat milks are recommended for older children and for alladults as part of a healthy diet. They are not recommended for children agedless than 2 years.
R E F E R E N C E S
1. Australia New Zealand Food Authority. Food Standards Code of Australiaand New Zealand. Vol. 2. Canberra: ANZFA.
2. Sicherer S. New insight on the natural history of peanut allergy. Annals ofAllergy, Asthma, and Immunology 2000;85:435–6.
3. Retallack SJ, Simmer K, Gibson RA. Infant weaning practices in Adelaide:the results of a shopping complex survey. J Paediatr Child Hlth (Australia)1994;30(1):28–32.
4. American Academy of Pediatrics. AAo Committee on Nutrition. The useand misuse of fruit juice in pediatrics. Pediatrics 2001;107(5):1210–13.
5. American Academy of Pediatrics. Breastfeeding and the use of human milk.Pediatrics 1997;100:1035–39.
6. Hourihane J, Rolles C. Morbidity from excessive intake of high energyfluids: the squash drinking syndrome. Arch Dis Child 1995;72:141–3.
7. Lifshitz F, Ament ME, Kleinman RE, Klish W, Lebenthal E, Perman J et al.Role of juice carbohydrate malabsorption in chronic nonspecific diarrheain children. J Pediatr 1992;120(5):825–9.
8. Smith MM, Lifshitz F. Excess fruit juice consumption as a contributingfactor in nonorganic failure to thrive. Pediatrics 1994;93:438–43.
407
IX. FOODS NOT SUITABLE FOR INFANTS OR THAT SHOULD BE USED WITH CARE
Infant Feeding Guidelines for Health Workers
X I N T E R P R E TAT I O N O F T H E W H OC O D E F O R H E A LT H WO R K E R S I NA U S T R A L I A
All health workers in Australia have a responsibility to promote and supportbreastfeeding. This section outlines aspects of the WHO Code—the WHOInternational Code of Marketing of Breast-milk Substitutes—and subsequentWorld Health Assembly resolutions that are relevant to health workers. Someaspects of the Code are actually the responsibility of others, such as governmentor industry, but it is important that health workers be aware of theirresponsibilities. The marketing in Australia of infant formula is regulated on avoluntary basis by the Advisory Panel on the Marketing in Australia of InfantFormula, through the MAIF Agreement. All health professionals have anobligation to do their best to promote breastfeeding. The extracts that follow aretaken from the Advisory Panel’s 1999–2000 annual report.1 More details aboutthe MAIF Agreement are available from the Department of Health and Ageing.
The aim of the WHO Code is to contribute to the provision of safe and adequatenutrition for infants by protecting and promoting breastfeeding and by ensuringthe proper use of breastmilk substitutes, when these are necessary, on the basisof adequate information and through appropriate marketing and distribution.(The box at the end of the Introduction to these Infant Feeding Guidelinessummarises the Code.)
The whole purpose of these Infant Feeding Guidelines, and of the WHO Code, isto protect the nutritional wellbeing of infants. Breastfeeding is to be encouragedand should be protected from practices that undermine it. Health workers areseen by the public as the source of advice on infant feeding. This advice is to beavailable to all mothers, regardless of the feeding option they have chosen fortheir infant. When mothers do not breastfeed, or do so only partially, theyshould use a suitable infant formula until their child is 12 months of age. Theyshould be fully informed about the health implications of using formula, thepotential cost, and the hazards of improper use.
T H E M A R K E T I N G I N A U S T R A L I A O F I N F A N T F O R M U L A A G R E E M E N T :S TAT U S
The MAIF Agreement is a voluntary agreement between the manufacturers,importers and distributors of infant formula and is not law. The Agreementhas been authorised by the Australian Competition and ConsumerCommission under the TPA [Trade Practices Act]. An Agreement must besubmitted for authorisation where it contains marketing restrictions and
408
X. INTERPRETATION OF THE WHO CODE FOR HEALTH WORKERS IN AUSTRALIA
Infant Feeding Guidelines for Health Workers
authorisation is only granted where the public benefit is shown tooutweigh any anti-competitive effect. The signatories can legally follow theprovisions of the authorised Agreement, but could be in breach of the TPAif they agree to any further marketing restriction, which is not covered inthe Agreement, even if it is recommended in the WHO Code. Similarly, foraspects of the WHO Code for which there is no authorised Agreement,agreements by companies to restrict marketing practices may result inpenalties for breaching the TPA.
T H E A D V I S O RY P A N E L O N T H E M A R K E T I N G I N A U S T R A L I A O F
I N F A N T F O R M U L A : T E R M S O F R E F E R E N C E
The aim of APMAIF is to:
• receive and investigate complaints regarding the marketing in Australiaof infant formulas;
• act as a liaison point for issues relating to the marketing in Australia ofinfant formulas;
• develop guidelines on the interpretation and application of the MAIFAgreement; and
• provide advice to the Commonwealth Minister for Health and AgedCare, on the operation of the Agreement.
I N T E R P R E TAT I O N S O F T H E A D V I S O RY P A N E L O N T H E M A R K E T I N G I N
A U S T R A L I A O F I N F A N T F O R M U L A
Clause 4: Information and education
Clause 4(a): Manufacturers and importers of infant formulas in Australiaagree that informational and educational materials, whether written, audioor visual, dealing with the feeding of infants and intended to reachpregnant women and parents of infants and young children, should alwaysinclude clear information on all the following points:
(i) the benefits and superiority of breastfeeding;
(ii) maternal nutrition, and the preparation for and maintenance ofbreastfeeding;
(iii) the negative effect on breastfeeding of introducing partial bottle-feeding;
(iv) the difficulty of reversing the decision not to breastfeed; and
(v) where needed, the proper use of infant formula, whethermanufactured industrially or home prepared. (WHO Code, Article 4.2)
Clause 4(b): When such materials contain information about the use ofinfant formulas, they should include the social and financial implications ofits use, the health hazards of inappropriate foods or feeding methods and,in particular, the health hazards of unnecessary or improper use of infant
409
X. INTERPRETATION OF THE WHO CODE FOR HEALTH WORKERS IN AUSTRALIA
Infant Feeding Guidelines for Health Workers
formulas. Such materials should not use any pictures or text which mayidealise the use of infant formulas. (WHO Code, Article 4.2)
Inclusion of information
The information required by clauses 4(a) and 4(b) must be included in anyvideo or written material which refers to infant formula that is produced orsponsored by an infant formula manufacturer. (December 1993)
• The information required by clauses 4(a) and 4(b) must be included inthe main body of the video in the same type of presentation as the restof the material, and at a level suitable for the target audience. A mothershould be able to understand what it means. (December 1993)
• The print size of the information required by clauses 4(a) and 4(b)should be the same size as the majority of the main text or at least 8point. (September 1993)
• The Panel sees the social and financial implications as interrelated.They may include the following points:
– cost will be (about $20 per week) (at least 1 can per week) (eachcompany should insert the most appropriate quantity);
– infant formula will need to be purchased until the baby is 12months of age; and
– the costs affect the family budget. (March 1994)
Pictures on informational or educational material for health professionals• Certain pictures may be acceptable on materials for health
professionals. (1994)
• The Panel considered that cartoons and pictures of animals and toys donot necessarily idealise the use of infant formulas and therefore may beacceptable. They should not depict an animal or toy being fed, whetherby breast or by bottle, nor should they depict animal or toy ‘mothers’,because the Panel considers that these would idealise the use of infantformula. (1994)
• The Panel considers that real babies depicted in a normal context donot necessarily idealise the use of infant formulas and may legitimatelydraw a health professional’s attention to information about an infantformula.
• However:
– babies (with or without bottles) in fantasy situations (e.g. stars,heavens, clouds, sitting up in school) are unacceptable because theysuggest formula-fed babies are in some way ‘ahead’ of breastfedbabies (March 1994);
– babies with slogans over or adjacent to the pictures (such as ‘Everybaby deserves the best’ or ‘A little extra something’) areunacceptable. The Panel believes this implies that the product isbetter than breastmilk and idealises the use of infant formula (March1994); and
– the Panel feels that it is inappropriate to use a picture of anapparently newly born baby to draw attention to information about
410
X. INTERPRETATION OF THE WHO CODE FOR HEALTH WORKERS IN AUSTRALIA
Infant Feeding Guidelines for Health Workers
infant formula. Breastmilk is the best milk for babies up to 12months old, but it is particularly valuable in the first few weeks oflife when the baby is most vulnerable. Baby models for suchpictures should be no younger than three months (February 1995).
• The Panel considers that a picture of a woman breastfeeding is neveracceptable because it:
– creates an impression that their product is equivalent tobreastfeeding;
– appropriates the image of breastfeeding for the purpose ofpromoting a product; and
– is a misleading way of gaining attention (March 1994).
Clause 4(c): Manufacturers and importers of infant formulas should notdonate informational or educational equipment or materials unless it is atthe request of, and with the written approval of, the appropriategovernment authority or within guidelines given by the Commonwealth,State or Territory Governments for this purpose. Such equipment ormaterials may bear the donating company’s name or logo, but should notrefer to a proprietary infant formula, and should be distributed onlythrough the health care system. (WHO Code, Article 4.3)
• Instructions how to prepare a specific infant formula may include thebrand logo and should include the product name. Such materialsshould be limited to preparation instructions only and should notinclude other educational or promotional information. (March 1994)
• The Panel has determined that the distribution at conferences of pensand monogrammed paper which bear a brand name and not just a logois unacceptable. (March 1994)
• The Panel considers that a slogan is different to a logo. For example,‘Every baby deserves the best’ and ‘A little extra something’ are slogans.When used in conjunction with the brand name of a product, it isimplied that feeding a baby the product would be better thanbreastfeeding. (March1994)
• Inexpensive materials likely to be used only in the process ofprofessional duty (provided they are not readily given to mothers, forexample small ‘tear off’ note pads) may be acceptable. However,materials of a personal nature such as coffee mugs are not consideredacceptable. Any such materials should bear only the company nameand logo, and not a product brand name. The use of slogans on thesematerials is unacceptable. (March 1994)
• The provision of ordinary food (morning/afternoon tea or lunch) isacceptable provided it is in association with a presentation thatcoincides with a mealtime and that is not of a lavish nature. (March1994)
• The Panel agreed that manufacturers should keep in mind clause 7 thatprohibits any donations, or activities, which can be construed as amaterial inducement. (September 1993)
411
X. INTERPRETATION OF THE WHO CODE FOR HEALTH WORKERS IN AUSTRALIA
Infant Feeding Guidelines for Health Workers
Clause 5: The general public and mothers
Clause 5(a): Manufacturers and importers of infant formulas should notadvertise or in any other way promote infant formulas to the generalpublic. (WHO Code, Article 5.1)
Advertisements to the general public• The Panel is aware of its obligation under both the Australian
Agreement and the TPA. We wish to minimise harm to breastfeedingwhile allowing consumers to obtain formula at a competitive price.(March 1994)
• The Panel feels that parents have a right to information aboutavailability of infant formula. However:
– announcements regarding changes to availability of infant formulas(for example, in supermarkets) are acceptable, but only on a one-off basis. Advertisements may appear only once in any onepublication over a maximum of a three-month period (to allow forinclusion in quarterly publications);
– references to outlets of availability should be restricted to genericlocations such as ‘toy stores’ or ‘supermarkets’, but not to specificlocations such as ‘Coles’ or ‘Woolworths’;
– such advertisements should have no promotional content. Thereshould be no slogans and the logo should not include a slogan;
– advertisements should not promote or encourage use of formula;
– changes in formulation should be referred to only on the container,not promoted in advertisements (March 1994); and
– pack shot size is to be restricted to 4 cm x 3 cm. (February 1996)
• New infant formula products may not be advertised or ‘announced’ tothe general public. (1994)
• When infant formula manufacturers widened the distribution of theirproduct from pharmacies to supermarkets, it was accepted by the Panelthat it was in the interest of consumers to be aware of this change ofavailability. However, infant formula products have now been availablein a range of retail outlets for over two years. The Panel therefore doesnot consider it necessary for further changes in availability to beannounced to consumers and such announcements are no longeracceptable. (June 1996)
• When an infant formula manufacturer advertises to the general public aproduct with the same name as an infant formula, the product nameshould be followed either by the range name (e.g. toiletries) or thespecific product (e.g. baby powder). Generalised terms such as ‘BrandX Baby Care Products’ or ‘Brand X, Best for Baby’, should not be usedwhere Brand is the name of an infant formula. (June 1996)
Price promotions of infant formula by manufacturers through retailers• Price tickets on the ‘shelf-talkers’ that simply advertise the price of the
product or the fact that it has a ‘special’ price are acceptable. The ticketmay also state the saving to be made; e.g. ‘Special. Save $1’. Shelf
412
X. INTERPRETATION OF THE WHO CODE FOR HEALTH WORKERS IN AUSTRALIA
Infant Feeding Guidelines for Health Workers
tickets should have no content other than the price, the name of theproduct and, if wanted, the amount to be saved.
• The Panel believes that descriptors such as ‘soy formula’ or ‘lactosefree’ should not be allowed on these price promotion announcementsor ‘shelf-talkers’. This is because manufacturers may claim that a listsuch as ‘cholesterol-free, cow’s milk protein–free, lactose-free’ shouldbe allowed, as these are all ‘descriptors’. Also, the Panel believes thatinfant formula other than standard formulas based on cow’s milkshould only be used if there is a medical indication. If these descriptorsare used in promotion, some parents may mistakenly believe that‘lactose-free’ or ‘cow’s milk protein–free’ formulas are superior to cow’smilk formula.
• For the purpose of in-store price promotions, ‘pack shots’ (i.e.depictions or photographs of the product) are allowable in storespecific catalogues but the depiction of the product should be relativeto the size, colour etc, the other products similarly depicted.
• This is in recognition that ‘pack shots’ may be necessary for those retailcustomers with a non–English speaking background or low literacy.Such ‘pack shots’ should not include slogans or descriptors.
• Large stacks of cans (gondola ends or shelf stacks) are not necessary tomake consumers aware of the price of the product, but the Panelrecognises that they are apparently necessary to provide ‘stock weight’(sufficient stock) for the increased demand created by ‘special offers’.Stock in gondola end stacks and shelf stacks should be kept in theirboxes and efforts should be made to ensure that the stack is not overlypromotional.
• Window displays, window stacks and pavement displays are notacceptable.
• Care should be taken not to display infant formula products or thename of the product under generic slogans for a range of products,such as ‘Everything that is best for baby’.
• There should be no price or product promotion on radio, television orany other electronic media. (May 1995)
• Information materials for health professionals should not containpictures, music or other devices that are likely to be attractive to youngchildren, and therefore might lead to health professionals putting themon display or giving them to children and parents to look at or playwith. Examples might include use of music, posters or mobiles.(December 1995)
Clause 5(b): Manufacturers and importers of infant formulas should notprovide samples of infant formulas to the general public, pregnant women,parents or members of their families. (WHO Code, Article 5.2)
• The Panel considered that the provision of free samples bymanufacturers through pharmacies breaches the Agreement. However,small packs could be made available in retail outlets for purchase atcommercial competitive rates. (February 1993)
413
X. INTERPRETATION OF THE WHO CODE FOR HEALTH WORKERS IN AUSTRALIA
Infant Feeding Guidelines for Health Workers
Clause 7: Health care professionals
Clause 7(a): Manufacturers and importers of infant formulas providinginformation about the formulas to health care professionals should restrictthe information to scientific and factual matters. Such information shouldnot imply or create a belief that bottle-feeding is equivalent or superior tobreastfeeding. It should also include the information specified in clause4(a) above. (WHO Code, Article 7.2)
Interpretation of the term ‘scientific’• By ‘scientific’, it is meant that the total current scientific knowledge is
reflected in total, not simply selective parts that can be used in amisleading way. (February 1993)
Use of the terms ‘resembles’, ‘is close to’ and ‘is similar to’• The Panel does not consider that it is scientific or factual to claim that a
product resembles, or is similar to, or is close to breastmilk unless thecomponent that the company claims is similar to that in breastmilk isspecified, and evidence is provided which satisfies the Panel that thisspecific claim is valid.
• Where these terms are used without a specific claim, the Panelconsiders that the manufacturer is implying equivalence with breastmilkand is therefore in breach of the Agreement.
• In informational material for health professionals, a manufacturersometimes wishes to point out that mothers who cannot breastfeedshould be advised that they should use an infant formula that resemblesbreastmilk more closely than cow’s milk. The Panel considers that theuse of the term ‘resembles breastmilk’ is acceptable only in this contextof the comparison with cow’s milk. (December 1993)
• Requirement for tables used in promotional pieces to comparebreastmilk with infant formula or components of infant formula. Thefollowing information should be included:
(i) the units of measurement;
(ii) the specific type of breastmilk sample which is being compared;
(iii) the average or mean values and the standard deviation; and
(iv) the references for the source of date. (January 1999)
Access to health professionals• It is up to health care professionals to decide whether they wish to see
representatives of formula manufacturers. The Panel agrees that there isnothing in the MAIF Agreement, nor in the WHO Code, which preventsthe access of representatives to health care professionals, and indeedbelieves that such access plays an important part in providinginformation about infant formula to health care professionals. (June1994 – February 1995)
• Information materials for health professionals should not containpictures, music or other devices that are likely to be attractive to youngchildren, and therefore might lead to health professionals putting them
414
X. INTERPRETATION OF THE WHO CODE FOR HEALTH WORKERS IN AUSTRALIA
Infant Feeding Guidelines for Health Workers
on display or giving them to children and parents to look at or playwith. Examples might include use of music, posters or mobiles.(December 1995)
• In the new marketing environment of infant formula in Australia it isreasonable for manufacturers to provide information for retailers oftheir products in trade journals only. The information should complywith the restrictions of clause 7(a) and clause 4(a) of the MAIFAgreement. They should not be promotional in any way, and theinformation should be restricted to the scientific and factual. Inaddition, such information should be able to be understood by retailerswho are not health professionals. (June 1996)
Competitions
Clause 7(c): Manufacturers and importers of infant formulas should notoffer any financial or material inducement to health care professionals ormembers of their families to promote infant formulas, nor should suchinducements be accepted by health care professionals or members of theirfamilies. (WHO Code, Article 7.3)
• The Panel considers it is acceptable to hand out gifts such as pens andpapers (with the company name or logo only) designed for personaluse at a conference. However, if the gifts were designed to be takenhome, this would be classed as an inducement. It was consideredunacceptable for these materials to be left in a hospital ward(September 1993). The Panel considers that anything intended or likelyto be taken home is an inducement.
• The Panel considers that competitions, included in information materialfor health professionals, which are clearly for the purpose ofemphasizing information that is restricted to the scientific and factual,may be acceptable. Such competitions, however, should not be aninducement to promote infant formulas. Therefore the prize should notexceed a value of $100. Manufacturers should also be mindful of clause4(c). (February 1996)
Clause 7(d): Manufacturers and importers should not provide samples ofinfant formulas, or of equipment or utensils for their preparation or use, tohealth care professionals except when necessary for the purpose ofprofessional evaluation or research at the institutional level. (WHO Code,Article 7.4)
• Infant formula given to child care or day care centres for distribution insingle or small quantities to parents or when a mother has forgotten tobring her own formula or when the baby’s formula has unexpectedlybeen exhausted, will be considered, according to the definition in theMAIF Agreement, as a ‘sample’. Child care centres are not a setting inwhich professional evaluation of infant formula occurs. There istherefore no valid reason for manufacturers to give samples of infantformula to child care centres. Such provision will be considered by thePanel as a breach of the Agreement. (May 1995)
• Samples should not be distributed unless for valid professionalevaluation or research at the institutional level implying sound scientificscrutiny and methodology. (January 1999)
415
X. INTERPRETATION OF THE WHO CODE FOR HEALTH WORKERS IN AUSTRALIA
Infant Feeding Guidelines for Health Workers
The position of APMAIF on conferences, seminars or publications, under the auspices ofanother organisation, by manufacturers of infant formula
• Sponsorship of conferences, seminars or publications by manufacturersof infant formula does not necessarily breach the Agreement.
• The Panel believes that any sponsorship of meetings, seminars orconferences should be declared. There should be no conditions whichrelate to the marketing of the sponsor’s product or to restrictions onpromotion of breastfeeding.
• The sponsor should not exert any influence on the choice of speakersof the content of presentations.
• In line with clause 4(c) of the Agreement, any conference materialsmay bear the donating company’s logo, but should not refer to aproprietary infant formula, and should be distributed only through thehealth care system.
R E F E R E N C E S
1. Advisory Panel on the Marketing in Australia of Infant Formula. Annualreport of the Advisory Panel on the Marketing in Australia of InfantFormula 1999–2000. Canberra; 2000.
417
X. INTERPRETATION OF THE WHO CODE FOR HEALTH WORKERS IN AUSTRALIA
Infant Feeding Guidelines for Health Workers
A P P E N D I X A
M E A S U R E M E N T O F B R E A S T F E E D I N G R AT E S
The review of breastfeeding indicators recommends a large number of indicators.For comparison of studies in Australia, the following indicators are a usefulminimum:
• percentage ever breastfed—that is, the rate of initiation of breastfeeding
• median duration of breastfeeding among children who have ever beenbreastfed
• mediation of the introduction of solid foods. This should specify the exactquestion asked because it may mean a first taste or more establishedfeeding
• prevalence (percentage) at ages 4 months and 6 months of
– exclusively breastfed
– predominantly breastfed
– fully breastfed—that is, exclusively plus predominantly
– infants receiving solid foods.
It is usual to also collect information on ‘any or some’ breastfeeding.
For precise definitions, see references 1 to 3 .
It is important to state the method used to record the data. Evidence suggeststhat mothers can recall relatively accurately—even over a long period—theincidence and duration of breastfeeding, but their recall is not as accurate for thetiming of the introduction of other fluids and solid foods.1
Data on ‘ever breastfeeding’ and ‘some breastfeeding’ can usually be collected bycross-sectional, retrospective studies, but for more detailed data longitudinalstudies have advantages, among them interviewing the mother close to the eventto reduce recall bias and the ability to obtain data related to different stages ofbreastfeeding. The problem of recall is demonstrated by comparing the results ofthe Donath and Amir analysis of the National Health Survey4 , which is cross-sectional, and the Perth breastfeeding study, which is longitudinal.5 Donath andAmir reported the exclusive breastfeeding rate at 57 per cent at age 3 monthsand Scott and Binns reported 47 per cent; overall rates of breastfeeding weresimilar. It is likely that the difference is a result of the recall bias inherent in theNational Health Survey methodology, which is based on recall over a longperiod.
The way the questions are asked and the timing of the questions is importantwhen studying breastfeeding and the introduction of solids.
418
APPENDIX A
Infant Feeding Guidelines for Health Workers
Data from India are illustrative of the way the questions influence the results forrates of introduction of solids in infant feeding6 : the proportions of exclusivebreastfeeding at 3 months from three national surveys were 52 per cent, asdetermined retrospectively using one question; 38 per cent when determinedretrospectively with multiple questions and a checklist of foods; but only 15 percent in a prospective cohort study using multiple questions.
For these reasons—to be accurate—data on the time of introduction of solids andon the proportion exclusively breastfeeding should be collected prospectively orat least as close to the event as possible.
R E F E R E N C E S
1. Webb K, Marks K, Lund-Adams M, Abraham B. Towards a national systemfor monitoring breastfeeding in Australia: a discussion paper. Canberra:AusInfo, 2002.
2. World Health Organization. Complementary feeding of young children indeveloping countries. Report no. WHO/NUT/98.1. Geneva: WHO, 1998.
3. Labbok M, Krasovec K. Toward consistency in breastfeeding definitions.Stud Fam Plann 1990;4:226–30.
4. Donath S, Amir LH. Rates of breast feeding in Australia by state andsocioeconomic status: evidence from the 1995 National Health Survey.J Paediatr Child Health 2000;36(2):164–8.
5. Scott JA, Binns CW. Factors associated with the initiation and duration ofbreast feeding. Aust J Nut Dietet 1998;55(2):51–61.
6. Engle PL. What is child development? In: International colloquium onpromoting growth and development of under fives. Antwerp; 2001. p. 67.
419
APPENDIX A
Infant Feeding Guidelines for Health Workers
A P P E N D I X B
T H E I N N O C E N T I D E C L A R AT I O N O N T H E
P R O T E C T I O N , P R O M O T I O N A N D S U P P O R T O F
B R E A S T F E E D I N G
The Innocenti Declaration was developed and adopted by participants in theWHO–UNICEF policymakers’ meeting ‘Breastfeeding in the 1990s: a globalinitiative’, which was jointly sponsored by the United States Agency forInternational Development and the Swedish International Development Authorityand held at the Spedale degli Innocenti in Florence, Italy, from 30 July to 1August 1990. The declaration reflects the content of the original backgrounddocument for the meeting and the views expressed in group and plenarysessions.
RECOGNISING that
Breastfeeding is a unique process that:
• provides ideal nutrition for infants and contributes to their healthygrowth and development
• reduces incidence and severity of infectious diseases, thereby loweringinfant morbidity and mortality
• contributes to women’s health by reducing the risk of breast andovarian cancer, and by increasing the spacing between pregnancies
• provides social and economic benefits to the family and the nation
• provides most women with a sense of satisfaction when successfullycarried out
and that Recent Research has found that:
• these benefits increase with increased exclusiveness* of breastfeedingduring the first six months of life, and thereafter with increasedduration of breastfeeding with complementary foods, and
• programme intervention can result in positive changes in breastfeedingbehaviour
WE THEREFORE DECLARE that
As a global goal for optimal maternal and child health and nutrition, allwomen should be enabled to practise exclusive breastfeeding and allinfants should be fed exclusively on breastmilk from birth to 4–6 months of
* Exclusive breastfeeding means that no other drink or food is given to the infant; theinfant should feed frequently and for unrestricted periods.
420
APPENDIX B
Infant Feeding Guidelines for Health Workers
age. Thereafter, children should continue to be breastfed, while receivingappropriate and adequate complementary foods, for up to two years of ageor beyond. This child-feeding ideal is to be achieved by creating anappropriate environment of awareness and support so that women canbreastfeed in this manner.
Attainment of this goal requires, in many countries, the reinforcement of a‘breastfeeding culture’ and its vigorous defence against incursions of a‘bottle-feeding culture’. This requires commitment and advocacy for socialmobilization, utilizing to the full the prestige and authority ofacknowledged leaders of society in all walks of life.
Efforts should be made to increase women’s confidence in their ability tobreastfeed. Such empowerment involves the removal of constraints andinfluences that manipulate perceptions and behaviour towardsbreastfeeding, often by subtle and indirect means. This requires sensitivity,continued vigilance, and a responsive and comprehensive communicationsstrategy involving all media and addressed to all levels of society.Furthermore, obstacles to breastfeeding within the health system, theworkplace and the community must be eliminated.
Measures should be taken to ensure that women are adequately nourishedfor their optimal health and that of their families. Furthermore, ensuringthat all women also have access to family planning information andservices allows them to sustain breastfeeding and avoid shortened birthintervals that may compromise their health and nutritional status, and thatof their children.
All governments should develop national breastfeeding policies and setappropriate national targets for the 1990s. They should establish a nationalsystem for monitoring the attainment of their targets, and they shoulddevelop indicators such as the prevalence of exclusively breastfed infantsat discharge from maternity services, and the prevalence of exclusivelybreastfed infants at four months of age.
National authorities are further urged to integrate their breastfeedingpolicies into their overall health and development policies. In so doingthey should reinforce all actions that protect, promote and supportbreastfeeding within complementary programmes such as prenatal andperinatal care, nutrition, family planning services, and prevention andtreatment of common maternal and childhood diseases. All healthcare staffshould be trained in the skills necessary to implement these breastfeedingpolicies.
421
APPENDIX B
Infant Feeding Guidelines for Health Workers
Operational targets
All governments by the year 1995 should have:
• appointed a national breastfeeding coordinator of appropriate authority,and established a multisectoral national breastfeeding committeecomposed of representatives from relevant government departments,non-governmental organizations, and health professional associations
• ensured that every facility providing maternity services fully practisesall ten of the Ten Steps to Successful Breastfeeding set out in the jointWHO–UNICEF statement ‘Protecting, promoting and supportingbreastfeeding: the special role of maternity services’**
• taken action to give effect to the principles and aim of all Articles ofthe International Code of Marketing of Breast-Milk Substitutes andsubsequent relevant World Health Assembly resolutions in theirentirety, and
• enacted imaginative legislation protecting the breastfeeding rights ofworking women and established means for its enforcement.
We also call upon international organizations to:
• draw up action strategies for protecting, promoting and supportingbreastfeeding, including global monitoring and evaluation of theirstrategies
• support national situation analyses and surveys and the development ofnational goals and targets for action; and
• encourage and support national authorities in planning, implementing,monitoring and evaluating their breastfeeding policies.
** World Health Organization, Geneva, 1989.
423
APPENDIX B
Infant Feeding Guidelines for Health Workers
A P P E N D I X C
R O YA L A U S T R A L I A N C O L L E G E O F G E N E R A L
P R A C T I T I O N E R S : B R E A S T F E E D I N G P O S I T I O N
S TAT E M E N T
The RACGP position statement on breastfeeding was endorsed on 9–10 December2000 and formally published on 7 February 2001. It reads as follows.
Aim• To protect, promote and support breastfeeding in Australia in ways that
optimise maternal and child health.
• To assist GPs to provide information and support for breastfeedingwomen, their babies and their families.
• To raise awareness among GPs of the important role they can play insupporting breastfeeding women.
Principles
In 1999, UNICEF recommended that babies be exclusively breastfed forabout the first 6 months of life.1 They recommended that breastfeedingshould be sustained until the baby was at least 2 years old, but beginningat about 6 months breastmilk should be complemented with appropriatesolid food
They stated that mothers have the right to breastfeed wherever andwhenever their baby requires and that breastfeeding mothers in the paidwork force should be supported to continue breastfeeding.
Background
Breastfeeding provides infants with optimal nutrition; human milk isspecific for human babies. Research studies have demonstrated that wheninfants are not fed on human milk they may be more likely to experiencegastrointestinal2 and respiratory infections3 , asthma4 , otitis media5 , urinarytract infections6 , necrotising enterocolitis7 , insulin-dependent diabetes8 ,inflammatory bowel disease9 , lymphoma10 and atopy.11 Continued researchis required to determine the full health benefits of human milk for infants.
Breastfeeding is also beneficial for women’s health. Breastfeeding womenhave less postpartum bleeding12 , delayed resumption of ovulation13 ,improved bone remineralization postpartum14 and less ovarian15 andpremenopausal breast cancer.16
424
APPENDIX C
Infant Feeding Guidelines for Health Workers
Breastfeeding may facilitate mother-infant bonding, saves the family moneyand protects the environment.
Position of the College
The RACGP supports the NHMRC Infant Feeding Guidelines (1996).17
General practitioners should have the knowledge and skills to helpmothers and babies with common breastfeeding difficulties.
The WHO International Code of Marketing of Breast-milk Substitutes [seeAppendix J] seeks to ensure that infant formula is not marketed ordistributed in ways that interfere with breastfeeding. The RACGP supportsthe WHO Code and will not accept practices that undermine the Code.Only information that is scientific and factual should be accepted by GPsfrom the infant formula industry. GPs should also be careful not toinadvertently undermine, by the display of artificial feeding materials,industry’s public commitment not to advertise its products to the generalpublic.
The RACGP supports the Baby Friendly Hospital Initiative (BFHI) inAustralia. This is a global UNICEF–WHO initiative based on the ‘Ten Stepsto Successful Breastfeeding’. The BFHI improves breastfeeding practices inmaternity hospitals, as the basis of protection, promotion and support ofbreastfeeding in the community.18 Mothers of newborn babies shouldreceive adequate assistance to establish and maintain breastfeeding,whether in hospital or at home.
The RACGP supports breastfeeding as a normal part of life, and willcontinue to facilitate education in normal lactation and commonbreastfeeding difficulties for GP registrars and practicing GPs. The RACGPsupports breastfeeding women GPs and registrars in medical settings.
Recommended role for GPs
The RACGP recommends that:
• GPs support and encourage breastfeeding in the community
• GPs promote breastfeeding as the optimal infant feeding method topregnant women and their partners
• GPs maximise maternal physical and emotional well being to assist newmothers in the early postpartum weeks during establishment ofbreastfeeding
• GPs make mothers aware of mother-to-mother support groups, such asthe Australian Breastfeeding Association (ABA)
• GPs become skilled in the diagnosis and management of commonbreastfeeding problems. When specialised help is needed, doctorsshould refer to experienced health workers, such as International Board
425
APPENDIX C
Infant Feeding Guidelines for Health Workers
Certified Lactation Consultants (IBCLCs), NMAA breastfeedingcounsellors or other qualified workers. The NH&MRC Infant FeedingGuidelines (1996) provide information on the management ofbreastfeeding problems17
• GPs prescribe medication that is compatible with breastfeeding. If indoubt, consult a reference centre knowledgeable about drugs inlactation
• GPs encourage exclusive breastfeeding for the first 6 months and thengradual introduction of suitable foods. Breastfeeding may continue aslong as the mother and child wish to continue, and weaning should begradual
• GPs support and advise women who, for a variety of reasons, areunable to breastfeed their babies
• GPs acknowledge that even partial breastfeeding is of great value.
R E F E R E N C E S
1. UNICEF. Breastfeeding: foundation for a healthy future.
2. Howie PW et al. Protective effect of breastfeeding against infection. BrMed J 1990;300:11–16.
3. Raisler J, Alexander C, O’Campo P. Breastfeeding and infant illness: adose–response relationship? Am J Publ Hlth 1999;89(1):25–30.
4. Oddy W, Holt P, Sly P, Read A, Landau L, Stanley F et al. Associationbetween breastfeeding and asthma in 6 year old children: findings of aprospective birth cohort study. BMJ 1999;319:815–19.
5. Scariati P, Grummer-Strawn L, Fein S. A longitudinal analysis of infantmorbidity and the extent of breastfeeding in the United States. Pediatrics1997;99(6):E5.
6. Pisacane A, Graziano L, Mazarella G, Scarpellino B, Zona G. Breastfeedingand urinary tract infection. J Pediatrics 1992;120:87–9.
7. Lucas A, Cole TJ. Breast milk and neonatal necrotising enterocolitis. Lancet1990;336:1519–23.
8. Gerstein HC. Cow’s milk exposure and type I diabetes mellitus. A criticaloverview of the clinical literature. Diabetes Care 1994;17:13–19.
9. Rigas A, Rigas B, Glassman M, Yen YY, Lan SJ, Petridou E et al. Breast-feeding and maternal smoking in the etiology of Crohn’s disease andulcerative colitis in childhood. Ann Epidemiol 1993;3:387–92.
10. Shu XO, Clemens J, Zheng W, Ying DM, Ji BT, Jin F. Infant breastfeedingand the risk of childhood lymphomas and leukaemia. Int J Epidemiol1995;24:27–32.
11. Saarinen UM, Kajosaari M. Breastfeeding as prophylaxis against atopicdisease: prospective follow-up study until 17 years old. Lancet1995;346:1065–9.
426
APPENDIX C
Infant Feeding Guidelines for Health Workers
12. Chua S, Arulkumaran S, Lim I, Selamat N, Ratnam SS. Influence ofbreastfeeding and nipple stimulation on postpartum uterine activity. Br JObstet Gynaecol 1994;101:804–5.
13. Kennedy KI, Visness CM. Contraceptive efficacy of lactationalamenorrhoea. Lancet 1992;339:227–30.
14. Cumming RG, Klineberg RJ. Breastfeeding and other reproductive factorsand the risk of hip fractures in elderly women. Int J Epidemiol1993;22:684–91.
15. Rosenblatt KA, Thomas DB. WHO collaborative study of neoplasia andsteroid contraceptives. Int J Epidemiol 1993;22:192–7.
16. Newcomb PA, Storer BE, Longnecker MP, Mittendorf R, Greenberg ER,Clapp RW. Lactation and a reduced risk of premenopausal breast cancer. NEngl J Med 1994;330:81–7.
17. NHMRC Infant Feeding Guidelines <http://www.health.gov.au/nhmrc/publicat/n-home.htm>, 1996; NHMRC Children’s Dietary Guidelines,chapter on breastfeeding <http://www.health.gov.au/nhmrc/publicat/n-home.htm>, 1996.
18. World Health Organization. Evidence for the ten steps to successfulbreastfeeding. Geneva: Division of Child Health and Development, WHO,1998.
427
APPENDIX C
Infant Feeding Guidelines for Health Workers
A P P E N D I X D
B R E A S T F E E D I N G P R O G R A M O F T H E D E PA R T M E N T
O F H E A LT H A N D A G E I N G
Relatively simple, cost-effective measures such as breastfeeding can have asignificant impact on the health of women and children.
In recognition of this, the Commonwealth Government made a commitmentthrough the policy document Health throughout Life to encourage breastfeedingawareness, with the aim of increasing Australia’s rate of breastfeeding,particularly for babies up to 6 months of age. Australia’s target for breastfeedingfor the year 2000 was to have 80 per cent of babies at least partially breastfed upto 6 months of age.
The National Breastfeeding Strategy takes a multi-faceted approach:
• family education
• national accreditation standards for maternal and infant care services
• employer support
• education of health professionals
• Indigenous health
• data collection
• antenatal educators.
Family education
Education materials target the family, particularly fathers, ethnic and culturalgroups, and disadvantaged socio-economic groups. Hard copies of thesematerials are available through the Australian Breastfeeding Association. Onlineversions can be downloaded, as follows:
• 7 Helpful Hints for Learning to Breastfeed (1998)
• 7 Helpful Hints for Solving Breastfeeding Problems (1998)
• 7 Reasons Why Mother’s Milk is Better for Your Baby and You (1998)
• 7 Important Facts for Fathers about Breastfeeding (1998)
• 7 Suggestions for Breastfeeding Your Baby—anywhere, anytime (1998)
• non–English language materials (1998)
• Let’s Give Our Baby the Best (1998)
• Mother’s Milk—perfect anytime anywhere (1998)
• You Can Breastfeed Your Baby (1998)
A practical, evidence-based antenatal education breastfeeding package is beingdeveloped. The package will be provided to antenatal educators nationally for
428
APPENDIX D
Infant Feeding Guidelines for Health Workers
inclusion in antenatal education programs. A video produced as part of thispackage will be provided to obstetricians nationally.
National accreditation standards for maternal and infant care services
The national accreditation standards for integrated maternal and infant careservices have a strong emphasis on support for the initiation and maintenance ofbreastfeeding and on the transfer of support and encouragement from hospital tocommunity health services.
Employer support
The Department of Health and Ageing has produced an insert, on the topic ofsupportive workplace initiatives for women who are breastfeeding, for theDepartment of Workplace Reform and Small Business newsletter Work andFamily; it has also been distributed nationally to employers. The insert is basedon the DWRSB’s booklet Guide to Combining Breastfeeding and Work. Materialsaimed at employers, employees and workplaces and providing information aboutcombining breastfeeding and employment are also being developed:
• Balancing Breastfeeding and Work—booklet
• Balancing Breastfeeding and Work—poster
• Balancing Breastfeeding and Work—pamphlet
• non–English language materials in Arabic, Chinese, Spanish, Turkish andVietnamese.
Education of health professionals
A companion document to the Infant Feeding Guidelines for Health Workers hasbeen developed. Titled Naturally: the facts about breastfeeding, it contains factsheets for health workers to use during consultations with mothers and isavailable for purchase through government bookshops. Breastfeeding educationkits have been produced for community-based health professionals by theAustralian Breastfeeding Association (formerly the Nursing Mothers Associationof Australia) in partnership with the Royal Australian College of GeneralPractitioners, the Division of Paediatrics, the Royal Australasian College ofPhysicians (formerly the Australian College of Paediatrics), the Royal College ofNursing, Australia, and the Pharmaceutical Society of Australia. The kits contain abest-practice guide to the management of breastfeeding problems, a lactationresource guide, and examples of consumer materials drawn from the familyeducation project. They have been distributed to all practising GPs andpaediatricians, all child health clinics, and all pharmacies nationally. Acontinuing education module on breastfeeding has also been produced for eachgroup of health professionals, as well as pharmacy assistants. Online versionscan be downloaded:
429
APPENDIX D
Infant Feeding Guidelines for Health Workers
• Best Practice Guide to the Management of Common Breastfeeding Problems(1999)
• Lactation Resource Directory (1999)
• Breastfeeding CHECK Module (1999)
• Continuing Pharmacy Education Module on Breastfeeding (1999)
• Continuing Education Module for Child Health Nurses (1999)
• Breastfeeding Education Module for Pharmacy Assistants (1999).
Indigenous health
An audit has been undertaken of current training in breastfeeding support andinfant nutrition for Aboriginal and Torres Strait Islander health workers and otherprofessionals providing health care to Aboriginal and Torres Strait Islanderwomen. A review has also been undertaken of current interventions andidentification of best practice currently used by community-based Indigenoushealth service providers in promoting and supporting breastfeeding andappropriate infant nutrition. The outcomes of these reviews will be taken up inthe broader context of the development of a national approach to the nutrition ofIndigenous Australians.
A book of breastfeeding stories has been prepared for Indigenous communities.It presents case histories of programs and projects run by Indigenous servicesand organisations to promote and support breastfeeding and infant nutrition.
Data collection
A framework for monitoring national breastfeeding rates will be established aspart of a National Nutrition Monitoring Program. This project will involve thedevelopment of consistent breastfeeding definitions and standardised questionsto monitor breastfeeding rates, thereby establishing a framework through which,for the first time, breastfeeding rates across Australia can be consistently andaccurately monitored.
Antenatal educators
The following resources are available for antenatal educators:
• Breastfeeding and You: a handbook for antenatal educators
• Breastfeeding and You: preparing the way.
For further information, see the Breastfeeding Fact Sheet.
[Last updated on 15 August 2000 by the Population Health Division,Commonwealth Department of Health and Ageing (www.health.gov.au/pubhlth/strateg/ brfeed/index.htm). For further information, contact the Population HealthDivision (telephone 02 6289 1555).]
431
APPENDIX D
Infant Feeding Guidelines for Health Workers
A P P E N D I X E
F E E D I N G L O W - B I R T H W E I G H T P R E - T E R M I N F A N T S
( F I N G E R F E E D I N G )
We n d y O d d y
When supplementation is thought necessary, alternatives to bottles and teats—including lactation aids and feeding with a cup, spoon or eyedropper—or fingerfeeding, may be sought. Although finger feeding is a technique that allows ababy to be fed without giving him or her an artificial nipple, it is also a methodthat helps train the baby to take the breast and is particularly useful for pre-terminfants.
Finger feeding can be used in a number of situations:
• The baby refuses the breast or is too tired to nurse.
• The baby does not latch on well and therefore does not get milk well.
• The baby is separated from its mother.
• Breastfeeding is stopped temporarily.
• The mother’s nipples are so sore that she cannot put the baby to herbreast, although proper positioning and good latching-on help sore nipplesmore often than finger feeding.
Finger feeding is more like breastfeeding than bottle-feeding and is best used toprepare a baby to take the breast. The baby must keep his or her tongue downand forward over the gums, with the mouth wide open and jaw forward. Themotion of the tongue and jaw is similar to that when feeding at the breast.
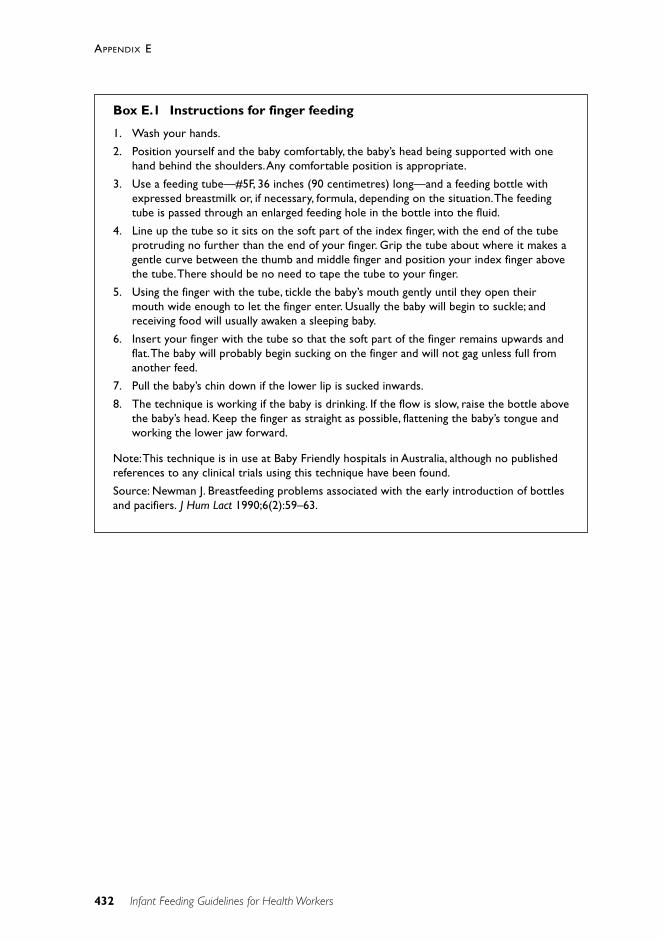
432
APPENDIX E
Infant Feeding Guidelines for Health Workers
Box E.1 Instructions for finger feeding
1. Wash your hands.
2. Position yourself and the baby comfortably, the baby’s head being supported with onehand behind the shoulders. Any comfortable position is appropriate.
3. Use a feeding tube—#5F, 36 inches (90 centimetres) long—and a feeding bottle withexpressed breastmilk or, if necessary, formula, depending on the situation. The feedingtube is passed through an enlarged feeding hole in the bottle into the fluid.
4. Line up the tube so it sits on the soft part of the index finger, with the end of the tubeprotruding no further than the end of your finger. Grip the tube about where it makes agentle curve between the thumb and middle finger and position your index finger abovethe tube. There should be no need to tape the tube to your finger.
5. Using the finger with the tube, tickle the baby’s mouth gently until they open theirmouth wide enough to let the finger enter. Usually the baby will begin to suckle; andreceiving food will usually awaken a sleeping baby.
6. Insert your finger with the tube so that the soft part of the finger remains upwards andflat. The baby will probably begin sucking on the finger and will not gag unless full fromanother feed.
7. Pull the baby’s chin down if the lower lip is sucked inwards.
8. The technique is working if the baby is drinking. If the flow is slow, raise the bottle abovethe baby’s head. Keep the finger as straight as possible, flattening the baby’s tongue andworking the lower jaw forward.
Note: This technique is in use at Baby Friendly hospitals in Australia, although no publishedreferences to any clinical trials using this technique have been found.
Source: Newman J. Breastfeeding problems associated with the early introduction of bottlesand pacifiers. J Hum Lact 1990;6(2):59–63.
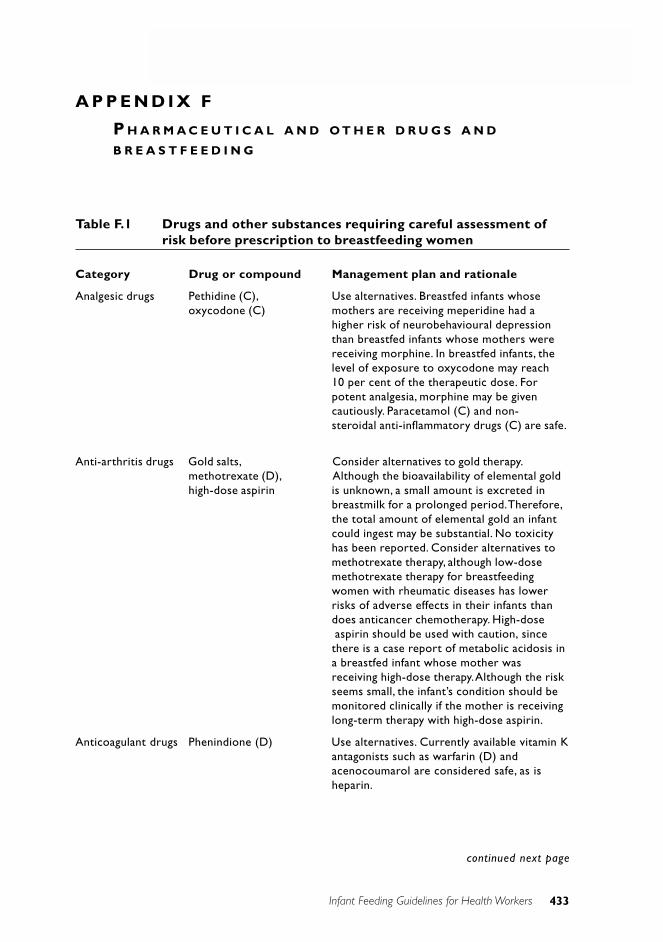
433
APPENDIX D
Infant Feeding Guidelines for Health Workers
A P P E N D I X F
P H A R M A C E U T I C A L A N D O T H E R D R U G S A N D
B R E A S T F E E D I N G
Table F.1 Drugs and other substances requiring careful assessment ofrisk before prescription to breastfeeding women
Category Drug or compound Management plan and rationale
Analgesic drugs Pethidine (C), Use alternatives. Breastfed infants whoseoxycodone (C) mothers are receiving meperidine had a
higher risk of neurobehavioural depressionthan breastfed infants whose mothers werereceiving morphine. In breastfed infants, thelevel of exposure to oxycodone may reach10 per cent of the therapeutic dose. Forpotent analgesia, morphine may be givencautiously. Paracetamol (C) and non-steroidal anti-inflammatory drugs (C) are safe.
Anti-arthritis drugs Gold salts, Consider alternatives to gold therapy.methotrexate (D), Although the bioavailability of elemental goldhigh-dose aspirin is unknown, a small amount is excreted in
breastmilk for a prolonged period. Therefore,the total amount of elemental gold an infantcould ingest may be substantial. No toxicityhas been reported. Consider alternatives tomethotrexate therapy, although low-dosemethotrexate therapy for breastfeedingwomen with rheumatic diseases has lowerrisks of adverse effects in their infants thandoes anticancer chemotherapy. High-doseaspirin should be used with caution, sincethere is a case report of metabolic acidosis ina breastfed infant whose mother wasreceiving high-dose therapy. Although the riskseems small, the infant’s condition should bemonitored clinically if the mother is receivinglong-term therapy with high-dose aspirin.
Anticoagulant drugs Phenindione (D) Use alternatives. Currently available vitamin Kantagonists such as warfarin (D) andacenocoumarol are considered safe, as isheparin.
continued next page
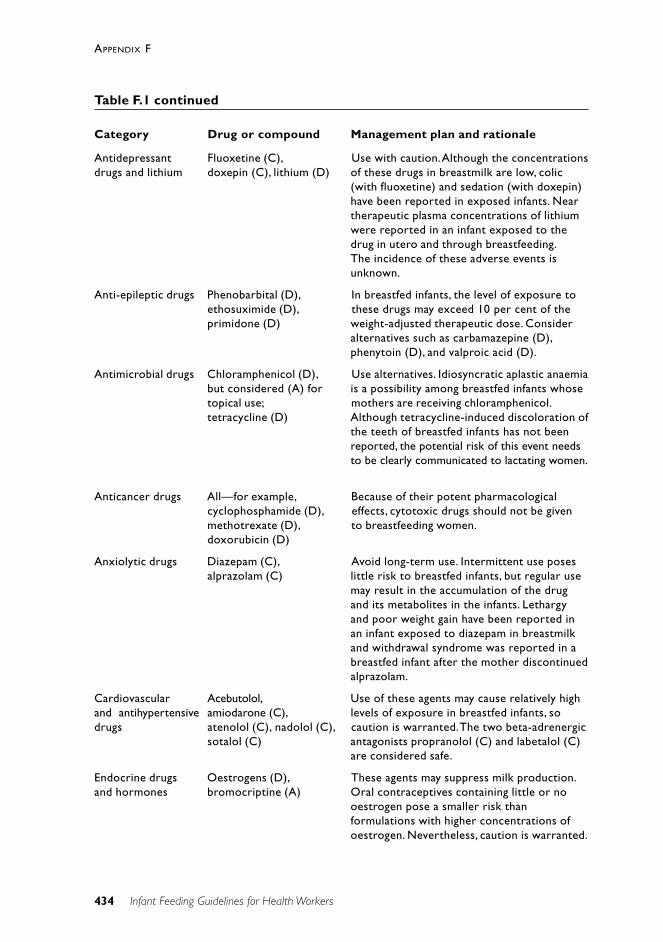
434
APPENDIX F
Infant Feeding Guidelines for Health Workers
Antidepressant Fluoxetine (C), Use with caution. Although the concentrationsdrugs and lithium doxepin (C), lithium (D) of these drugs in breastmilk are low, colic
(with fluoxetine) and sedation (with doxepin)have been reported in exposed infants. Neartherapeutic plasma concentrations of lithiumwere reported in an infant exposed to thedrug in utero and through breastfeeding.The incidence of these adverse events isunknown.
Anti-epileptic drugs Phenobarbital (D), In breastfed infants, the level of exposure toethosuximide (D), these drugs may exceed 10 per cent of theprimidone (D) weight-adjusted therapeutic dose. Consider
alternatives such as carbamazepine (D),phenytoin (D), and valproic acid (D).
Antimicrobial drugs Chloramphenicol (D), Use alternatives. Idiosyncratic aplastic anaemiabut considered (A) for is a possibility among breastfed infants whosetopical use; mothers are receiving chloramphenicol.tetracycline (D) Although tetracycline-induced discoloration of
the teeth of breastfed infants has not beenreported, the potential risk of this event needsto be clearly communicated to lactating women.
Anticancer drugs All—for example, Because of their potent pharmacologicalcyclophosphamide (D), effects, cytotoxic drugs should not be givenmethotrexate (D), to breastfeeding women.doxorubicin (D)
Anxiolytic drugs Diazepam (C), Avoid long-term use. Intermittent use posesalprazolam (C) little risk to breastfed infants, but regular use
may result in the accumulation of the drugand its metabolites in the infants. Lethargyand poor weight gain have been reported inan infant exposed to diazepam in breastmilkand withdrawal syndrome was reported in abreastfed infant after the mother discontinuedalprazolam.
Cardiovascular Acebutolol, Use of these agents may cause relatively highand antihypertensive amiodarone (C), levels of exposure in breastfed infants, sodrugs atenolol (C), nadolol (C), caution is warranted. The two beta-adrenergic
sotalol (C) antagonists propranolol (C) and labetalol (C)are considered safe.
Endocrine drugs Oestrogens (D), These agents may suppress milk production.and hormones bromocriptine (A) Oral contraceptives containing little or no
oestrogen pose a smaller risk thanformulations with higher concentrations ofoestrogen. Nevertheless, caution is warranted.
Table F.1 continued
Category Drug or compound Management plan and rationale
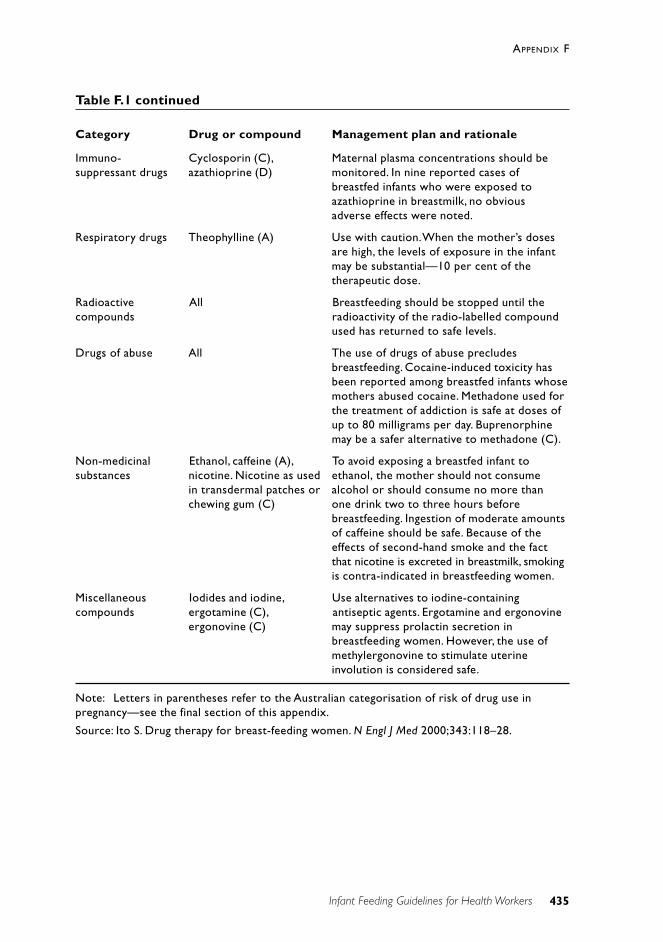
435
APPENDIX F
Infant Feeding Guidelines for Health Workers
Immuno- Cyclosporin (C), Maternal plasma concentrations should besuppressant drugs azathioprine (D) monitored. In nine reported cases of
breastfed infants who were exposed toazathioprine in breastmilk, no obviousadverse effects were noted.
Respiratory drugs Theophylline (A) Use with caution. When the mother’s dosesare high, the levels of exposure in the infantmay be substantial—10 per cent of thetherapeutic dose.
Radioactive All Breastfeeding should be stopped until thecompounds radioactivity of the radio-labelled compound
used has returned to safe levels.
Drugs of abuse All The use of drugs of abuse precludesbreastfeeding. Cocaine-induced toxicity hasbeen reported among breastfed infants whosemothers abused cocaine. Methadone used forthe treatment of addiction is safe at doses ofup to 80 milligrams per day. Buprenorphinemay be a safer alternative to methadone (C).
Non-medicinal Ethanol, caffeine (A), To avoid exposing a breastfed infant tosubstances nicotine. Nicotine as used ethanol, the mother should not consume
in transdermal patches or alcohol or should consume no more thanchewing gum (C) one drink two to three hours before
breastfeeding. Ingestion of moderate amountsof caffeine should be safe. Because of theeffects of second-hand smoke and the factthat nicotine is excreted in breastmilk, smokingis contra-indicated in breastfeeding women.
Miscellaneous Iodides and iodine, Use alternatives to iodine-containingcompounds ergotamine (C), antiseptic agents. Ergotamine and ergonovine
ergonovine (C) may suppress prolactin secretion inbreastfeeding women. However, the use ofmethylergonovine to stimulate uterineinvolution is considered safe.
Note: Letters in parentheses refer to the Australian categorisation of risk of drug use inpregnancy—see the final section of this appendix.
Source: Ito S. Drug therapy for breast-feeding women. N Engl J Med 2000;343:118–28.
Table F.1 continued
Category Drug or compound Management plan and rationale
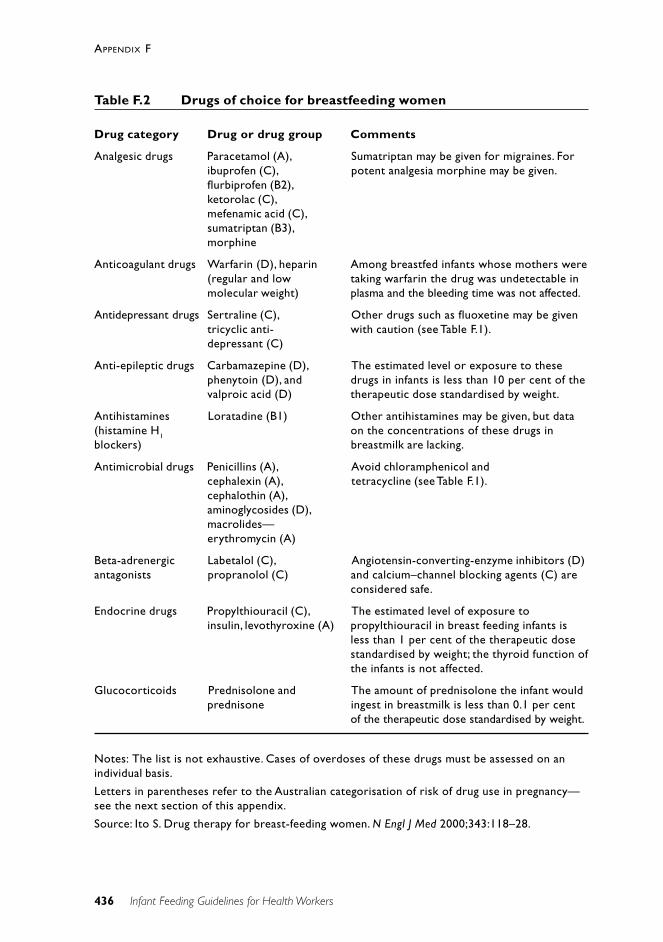
436
APPENDIX F
Infant Feeding Guidelines for Health Workers
Table F.2 Drugs of choice for breastfeeding women
Drug category Drug or drug group Comments
Analgesic drugs Paracetamol (A), Sumatriptan may be given for migraines. Foribuprofen (C), potent analgesia morphine may be given.flurbiprofen (B2),ketorolac (C),mefenamic acid (C),sumatriptan (B3),morphine
Anticoagulant drugs Warfarin (D), heparin Among breastfed infants whose mothers were(regular and low taking warfarin the drug was undetectable inmolecular weight) plasma and the bleeding time was not affected.
Antidepressant drugs Sertraline (C), Other drugs such as fluoxetine may be giventricyclic anti- with caution (see Table F.1).depressant (C)
Anti-epileptic drugs Carbamazepine (D), The estimated level or exposure to thesephenytoin (D), and drugs in infants is less than 10 per cent of thevalproic acid (D) therapeutic dose standardised by weight.
Antihistamines Loratadine (B1) Other antihistamines may be given, but data(histamine H1 on the concentrations of these drugs inblockers) breastmilk are lacking.
Antimicrobial drugs Penicillins (A), Avoid chloramphenicol andcephalexin (A), tetracycline (see Table F.1).cephalothin (A),aminoglycosides (D),macrolides—erythromycin (A)
Beta-adrenergic Labetalol (C), Angiotensin-converting-enzyme inhibitors (D)antagonists propranolol (C) and calcium–channel blocking agents (C) are
considered safe.
Endocrine drugs Propylthiouracil (C), The estimated level of exposure toinsulin, levothyroxine (A) propylthiouracil in breast feeding infants is
less than 1 per cent of the therapeutic dosestandardised by weight; the thyroid function ofthe infants is not affected.
Glucocorticoids Prednisolone and The amount of prednisolone the infant wouldprednisone ingest in breastmilk is less than 0.1 per cent
of the therapeutic dose standardised by weight.
Notes: The list is not exhaustive. Cases of overdoses of these drugs must be assessed on anindividual basis.
Letters in parentheses refer to the Australian categorisation of risk of drug use in pregnancy—see the next section of this appendix.
Source: Ito S. Drug therapy for breast-feeding women. N Engl J Med 2000;343:118–28.
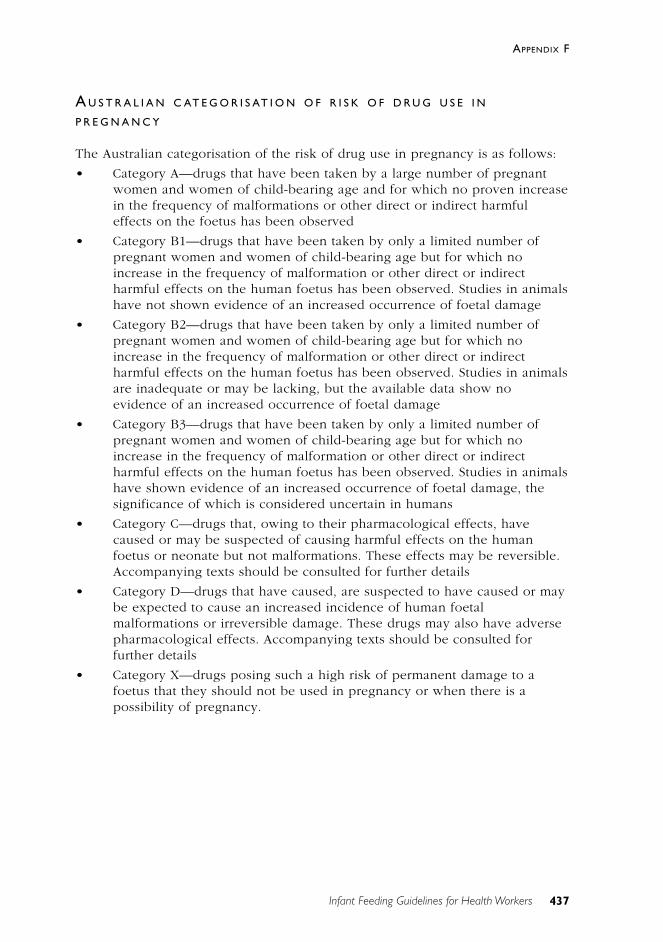
437
APPENDIX F
Infant Feeding Guidelines for Health Workers
A U S T R A L I A N C AT E G O R I S AT I O N O F R I S K O F D R U G U S E I N
P R E G N A N C Y
The Australian categorisation of the risk of drug use in pregnancy is as follows:
• Category A—drugs that have been taken by a large number of pregnantwomen and women of child-bearing age and for which no proven increasein the frequency of malformations or other direct or indirect harmfuleffects on the foetus has been observed
• Category B1—drugs that have been taken by only a limited number ofpregnant women and women of child-bearing age but for which noincrease in the frequency of malformation or other direct or indirectharmful effects on the human foetus has been observed. Studies in animalshave not shown evidence of an increased occurrence of foetal damage
• Category B2—drugs that have been taken by only a limited number ofpregnant women and women of child-bearing age but for which noincrease in the frequency of malformation or other direct or indirectharmful effects on the human foetus has been observed. Studies in animalsare inadequate or may be lacking, but the available data show noevidence of an increased occurrence of foetal damage
• Category B3—drugs that have been taken by only a limited number ofpregnant women and women of child-bearing age but for which noincrease in the frequency of malformation or other direct or indirectharmful effects on the human foetus has been observed. Studies in animalshave shown evidence of an increased occurrence of foetal damage, thesignificance of which is considered uncertain in humans
• Category C—drugs that, owing to their pharmacological effects, havecaused or may be suspected of causing harmful effects on the humanfoetus or neonate but not malformations. These effects may be reversible.Accompanying texts should be consulted for further details
• Category D—drugs that have caused, are suspected to have caused or maybe expected to cause an increased incidence of human foetalmalformations or irreversible damage. These drugs may also have adversepharmacological effects. Accompanying texts should be consulted forfurther details
• Category X—drugs posing such a high risk of permanent damage to afoetus that they should not be used in pregnancy or when there is apossibility of pregnancy.
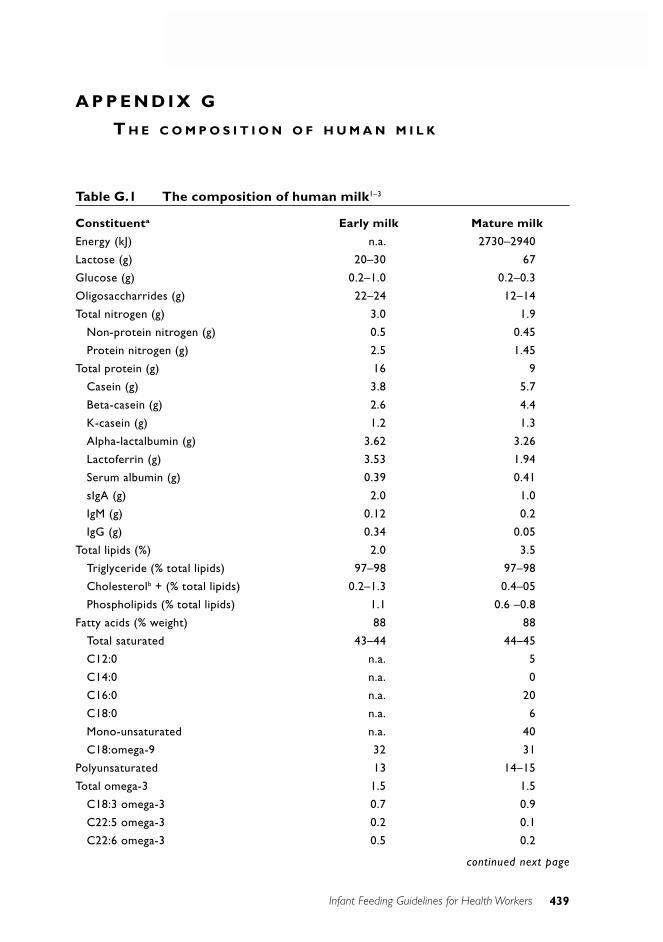
439
APPENDIX F
Infant Feeding Guidelines for Health Workers
A P P E N D I X G
T H E C O M P O S I T I O N O F H U M A N M I L K
Table G.1 The composition of human milk1–3
Constituenta Early milk Mature milk
Energy (kJ) n.a. 2730–2940
Lactose (g) 20–30 67
Glucose (g) 0.2–1.0 0.2–0.3
Oligosaccharrides (g) 22–24 12–14
Total nitrogen (g) 3.0 1.9
Non-protein nitrogen (g) 0.5 0.45
Protein nitrogen (g) 2.5 1.45
Total protein (g) 16 9
Casein (g) 3.8 5.7
Beta-casein (g) 2.6 4.4
K-casein (g) 1.2 1.3
Alpha-lactalbumin (g) 3.62 3.26
Lactoferrin (g) 3.53 1.94
Serum albumin (g) 0.39 0.41
sIgA (g) 2.0 1.0
IgM (g) 0.12 0.2
IgG (g) 0.34 0.05
Total lipids (%) 2.0 3.5
Triglyceride (% total lipids) 97–98 97–98
Cholesterolb + (% total lipids) 0.2–1.3 0.4–05
Phospholipids (% total lipids) 1.1 0.6 –0.8
Fatty acids (% weight) 88 88
Total saturated 43–44 44–45
C12:0 n.a. 5
C14:0 n.a. 0
C16:0 n.a. 20
C18:0 n.a. 6
Mono-unsaturated n.a. 40
C18:omega-9 32 31
Polyunsaturated 13 14–15
Total omega-3 1.5 1.5
C18:3 omega-3 0.7 0.9
C22:5 omega-3 0.2 0.1
C22:6 omega-3 0.5 0.2
continued next page
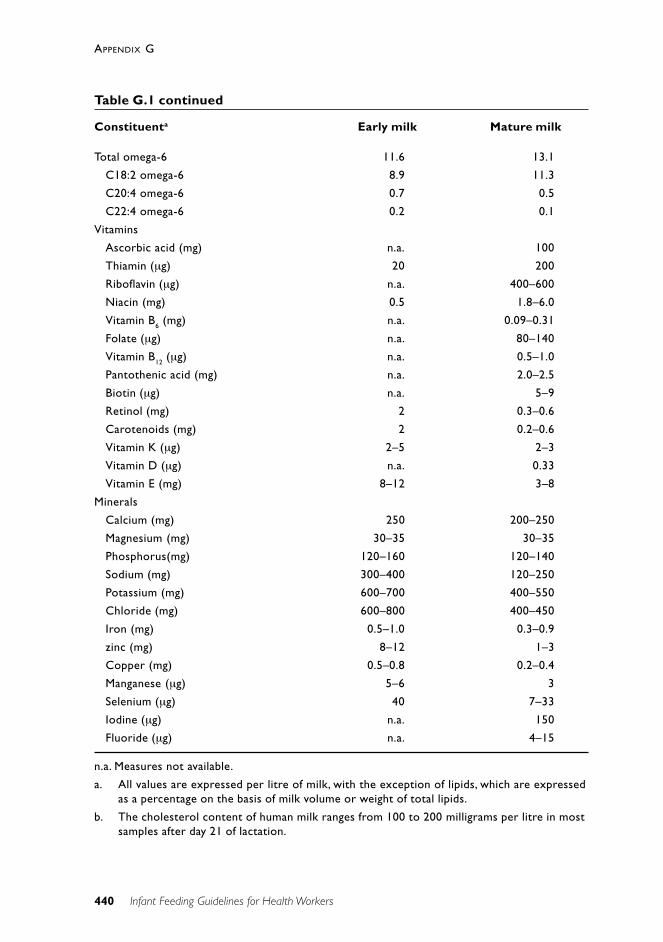
440
APPENDIX G
Infant Feeding Guidelines for Health Workers
Total omega-6 11.6 13.1
C18:2 omega-6 8.9 11.3
C20:4 omega-6 0.7 0.5
C22:4 omega-6 0.2 0.1
Vitamins
Ascorbic acid (mg) n.a. 100
Thiamin (µg) 20 200
Riboflavin (µg) n.a. 400–600
Niacin (mg) 0.5 1.8–6.0
Vitamin B6 (mg) n.a. 0.09–0.31
Folate (µg) n.a. 80–140
Vitamin B12 (µg) n.a. 0.5–1.0
Pantothenic acid (mg) n.a. 2.0–2.5
Biotin (µg) n.a. 5–9
Retinol (mg) 2 0.3–0.6
Carotenoids (mg) 2 0.2–0.6
Vitamin K (µg) 2–5 2–3
Vitamin D (µg) n.a. 0.33
Vitamin E (mg) 8–12 3–8
Minerals
Calcium (mg) 250 200–250
Magnesium (mg) 30–35 30–35
Phosphorus(mg) 120–160 120–140
Sodium (mg) 300–400 120–250
Potassium (mg) 600–700 400–550
Chloride (mg) 600–800 400–450
Iron (mg) 0.5–1.0 0.3–0.9
zinc (mg) 8–12 1–3
Copper (mg) 0.5–0.8 0.2–0.4
Manganese (µg) 5–6 3
Selenium (µg) 40 7–33
Iodine (µg) n.a. 150
Fluoride (µg) n.a. 4–15
n.a. Measures not available.
a. All values are expressed per litre of milk, with the exception of lipids, which are expressedas a percentage on the basis of milk volume or weight of total lipids.
b. The cholesterol content of human milk ranges from 100 to 200 milligrams per litre in mostsamples after day 21 of lactation.
Table G.1 continued
Constituenta Early milk Mature milk
441
APPENDIX G
Infant Feeding Guidelines for Health Workers
R E F E R E N C E S
1. Jensen RG. Handbook of milk composition. San Diego: Academic Press,1995.
2. Koletzko B, Rodriguez-Palermo M. Polyunsaturated fatty acids in humanmilk and their role in early development. J Mamm Gland Biol Neopl1999;4:269.
3. Cuilliere ML, Tregoat V, Bene MC, Faure G, Montagne P. Changes in thekappa casein and beta-casein concentrations in human milk duringlactation. J Clin Lab Anal 1999;13(5):213–18.
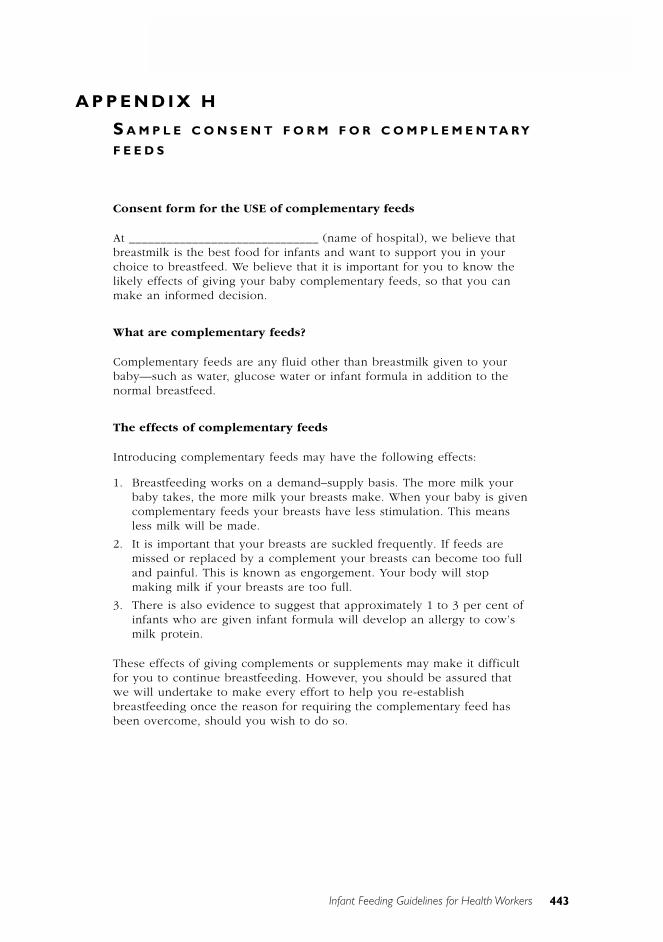
443
APPENDIX G
Infant Feeding Guidelines for Health Workers
A P P E N D I X H
S A M P L E C O N S E N T F O R M F O R C O M P L E M E N TA RY
F E E D S
Consent form for the USE of complementary feeds
At ______________________________ (name of hospital), we believe thatbreastmilk is the best food for infants and want to support you in yourchoice to breastfeed. We believe that it is important for you to know thelikely effects of giving your baby complementary feeds, so that you canmake an informed decision.
What are complementary feeds?
Complementary feeds are any fluid other than breastmilk given to yourbaby—such as water, glucose water or infant formula in addition to thenormal breastfeed.
The effects of complementary feeds
Introducing complementary feeds may have the following effects:
1. Breastfeeding works on a demand–supply basis. The more milk yourbaby takes, the more milk your breasts make. When your baby is givencomplementary feeds your breasts have less stimulation. This meansless milk will be made.
2. It is important that your breasts are suckled frequently. If feeds aremissed or replaced by a complement your breasts can become too fulland painful. This is known as engorgement. Your body will stopmaking milk if your breasts are too full.
3. There is also evidence to suggest that approximately 1 to 3 per cent ofinfants who are given infant formula will develop an allergy to cow’smilk protein.
These effects of giving complements or supplements may make it difficultfor you to continue breastfeeding. However, you should be assured thatwe will undertake to make every effort to help you re-establishbreastfeeding once the reason for requiring the complementary feed hasbeen overcome, should you wish to do so.
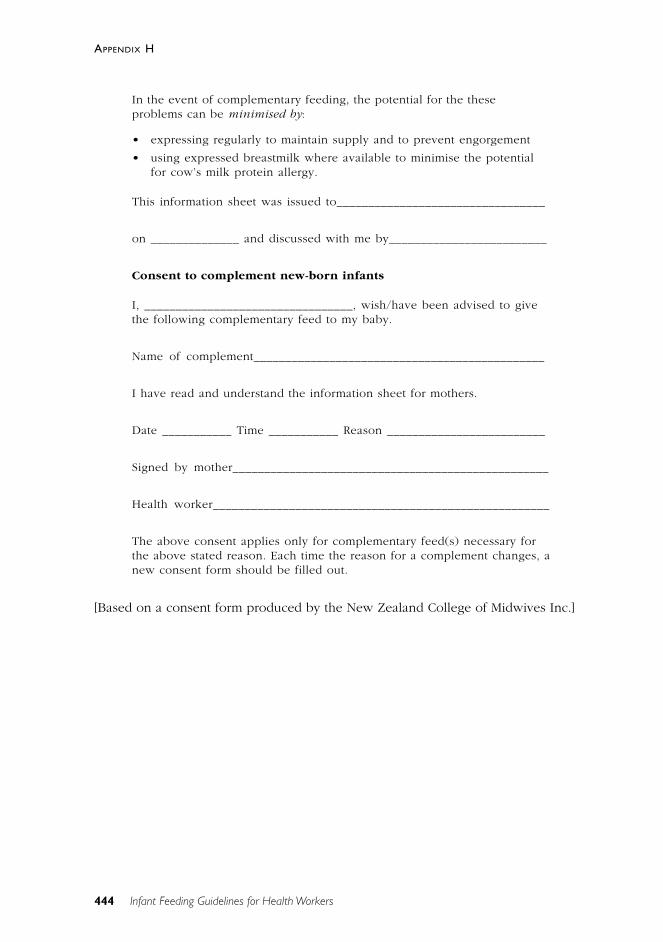
444
APPENDIX H
Infant Feeding Guidelines for Health Workers
In the event of complementary feeding, the potential for the theseproblems can be minimised by:
• expressing regularly to maintain supply and to prevent engorgement
• using expressed breastmilk where available to minimise the potentialfor cow’s milk protein allergy.
This information sheet was issued to_________________________________
on ______________ and discussed with me by_________________________
Consent to complement new-born infants
I, _________________________________, wish/have been advised to givethe following complementary feed to my baby.
Name of complement______________________________________________
I have read and understand the information sheet for mothers.
Date ___________ Time ___________ Reason _________________________
Signed by mother__________________________________________________
Health worker_____________________________________________________
The above consent applies only for complementary feed(s) necessary forthe above stated reason. Each time the reason for a complement changes, anew consent form should be filled out.
[Based on a consent form produced by the New Zealand College of Midwives Inc.]
445
APPENDIX H
Infant Feeding Guidelines for Health Workers
A P P E N D I X I
A U S T R A L I A N N U T R I T I O N A N D B R E A S T F E E D I N G
R E S O U R C E S A N D W E B S I T E S
The following websites provide relevant nutrition information in Australia.
National Health and Medical Research Council• NHMRC nutrition publications—www.health.gov.au/nhmrc/publications/
nhome.htm
• NHMRC clinical practice publications—www.health.gov.au/nhmrc/publications/cphome.htm
Commonwealth Department of Health and Ageing population healthstrategies• www.health.gov.au/hfs/pubhlth/strateg/
– National Breastfeeding Strategy—www.health.gov.au/hfs/pubhlth/strateg/brfeed/
– National Public Health Nutrition Strategy—www.health.gov.au/hfs/pubhlth/strateg/food/index.htm
– Promoting Healthy Weight—www.health.gov.au/hfs/pubhlth/strateg/pp/hlthwt/index.htm
SIGNAL—the Strategic Intergovernmental Nutrition Alliance• www.dhs.vic.gov.au/nphp/signal/
– Food Chain newsletter
– www.dhs.vic.gov.au/nphp/signal/priority.htm
– Eat Well Australia: an agenda for action in public health nutrition,2000–2010 (draft) 135 pages, PDF file, 793k
– National Aboriginal and Torres Strait Islander Nutrition Strategy andAction Plan, 2000–2010 (draft) 56 pages, PDF file, 456k
Other government sites• NSW Health—www.health.nsw.gov.au
www.health.nsw.gov.au/health-public-affairs/publications/breastfeeding.pdf
• Victorian Department of Human Services—www.dhs.vic.gov.au
446
APPENDIX I
Infant Feeding Guidelines for Health Workers
• South Australian Department of Human Services—www.dhs.sa.gov.au/default.asp
• ACT Health—www.health.act.gov.au
• WA Health Department—www.health.wa.gov.auwww.public.health.wa.gov.au/PAGES/SUPCHILD.htmlwww.public.health.wa.gov.au/PAGES/NUTRITION.html
• NT Territory Health Services—www.nt.gov.au/nths
• Queensland Health—www.health.qld.gov.au
• Tasmanian Department of Health and Human Services—www.dhhs.tas.gov.au
• New Zealand Ministry of Health—www.moh.govt.nz/moh.nsf
• Food Standards Australia New Zealand—www.foodstandards.gov.au
• Australian Institute of Health and Welfare—www.aihw.gov.au
• Australian Bureau of Statistics—www.abs.gov.au
Indigenous health and nutrition• Office for Aboriginal and Torres Strait Islander Health—
www.health.gov.au/oatsih/cont.htm
Breastfeeding• Australian Breastfeeding Association—www.breastfeeding.asn.au
• The breastfeeding newsletter of the American Academy of Pediatrics—www.aap.org/advocacy/bf/bfnewsletter.htm
UNICEF• www.UNICEF.org
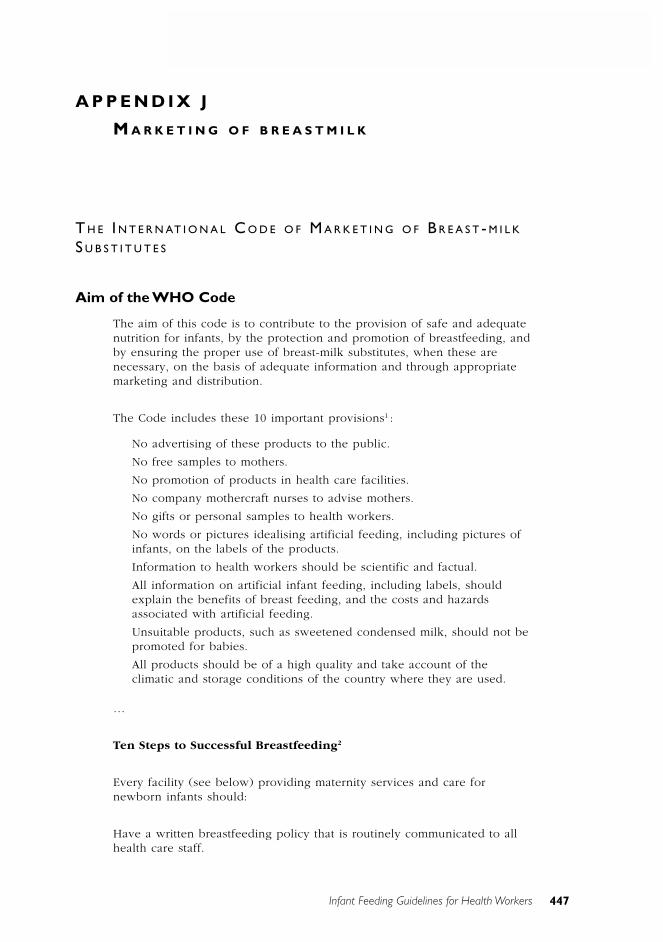
447
APPENDIX I
Infant Feeding Guidelines for Health Workers
A P P E N D I X J
M A R K E T I N G O F B R E A S T M I L K
T H E I N T E R N AT I O N A L C O D E O F M A R K E T I N G O F B R E A S T - M I L K
S U B S T I T U T E S
Aim of the WHO Code
The aim of this code is to contribute to the provision of safe and adequatenutrition for infants, by the protection and promotion of breastfeeding, andby ensuring the proper use of breast-milk substitutes, when these arenecessary, on the basis of adequate information and through appropriatemarketing and distribution.
The Code includes these 10 important provisions1 :
No advertising of these products to the public.
No free samples to mothers.
No promotion of products in health care facilities.
No company mothercraft nurses to advise mothers.
No gifts or personal samples to health workers.
No words or pictures idealising artificial feeding, including pictures ofinfants, on the labels of the products.
Information to health workers should be scientific and factual.
All information on artificial infant feeding, including labels, shouldexplain the benefits of breast feeding, and the costs and hazardsassociated with artificial feeding.
Unsuitable products, such as sweetened condensed milk, should not bepromoted for babies.
All products should be of a high quality and take account of theclimatic and storage conditions of the country where they are used.
…
Ten Steps to Successful Breastfeeding2
Every facility (see below) providing maternity services and care fornewborn infants should:
Have a written breastfeeding policy that is routinely communicated to allhealth care staff.
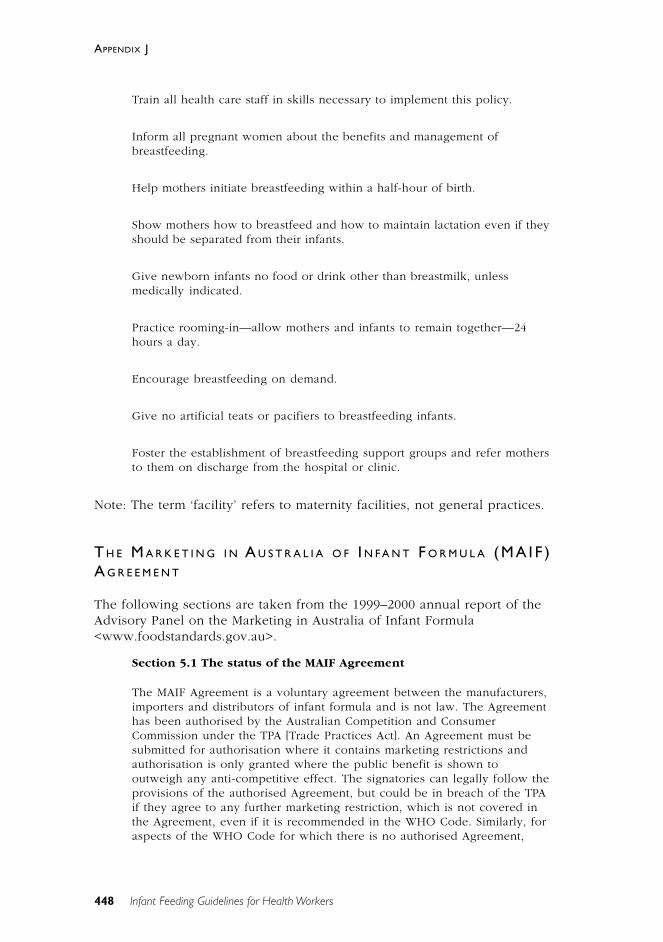
448
APPENDIX J
Infant Feeding Guidelines for Health Workers
Train all health care staff in skills necessary to implement this policy.
Inform all pregnant women about the benefits and management ofbreastfeeding.
Help mothers initiate breastfeeding within a half-hour of birth.
Show mothers how to breastfeed and how to maintain lactation even if theyshould be separated from their infants.
Give newborn infants no food or drink other than breastmilk, unlessmedically indicated.
Practice rooming-in—allow mothers and infants to remain together—24hours a day.
Encourage breastfeeding on demand.
Give no artificial teats or pacifiers to breastfeeding infants.
Foster the establishment of breastfeeding support groups and refer mothersto them on discharge from the hospital or clinic.
Note: The term ‘facility’ refers to maternity facilities, not general practices.
T H E M A R K E T I N G I N A U S T R A L I A O F I N F A N T F O R M U L A (MA I F )A G R E E M E N T
The following sections are taken from the 1999–2000 annual report of theAdvisory Panel on the Marketing in Australia of Infant Formula<www.foodstandards.gov.au>.
Section 5.1 The status of the MAIF Agreement
The MAIF Agreement is a voluntary agreement between the manufacturers,importers and distributors of infant formula and is not law. The Agreementhas been authorised by the Australian Competition and ConsumerCommission under the TPA [Trade Practices Act]. An Agreement must besubmitted for authorisation where it contains marketing restrictions andauthorisation is only granted where the public benefit is shown tooutweigh any anti-competitive effect. The signatories can legally follow theprovisions of the authorised Agreement, but could be in breach of the TPAif they agree to any further marketing restriction, which is not covered inthe Agreement, even if it is recommended in the WHO Code. Similarly, foraspects of the WHO Code for which there is no authorised Agreement,
449
APPENDIX J
Infant Feeding Guidelines for Health Workers
agreements by companies to restrict marketing practices may result inpenalties for breaching the TPA.
Section 5.2 APMAIF terms of reference
The aim of APMAIF is to:
• receive and investigate complaints regarding the marketing in Australiaof infant formulas;
• act as a liaison point for issues relating to the marketing in Australia ofinfant formulas;
• develop guidelines on the interpretation and application of the MAIFAgreement; and
• provide advice to the Commonwealth Minister responsible forConsumer Affairs, and the Commonwealth Minister for Health and AgedCare, on the operation of the Agreement.
Section 6 Signatories to the MAIF Agreement
Six manufacturers and distributors signed the MAIF Agreement in 1992,with later entrants to the market signing after that time. In 1998–1999 therewere nine signatories. Amcal Ltd notified APMAIF of its withdrawal frombeing a signatory to the MAIF Agreement. This was due to a change inownership and took effect on 1 July 1999.
The signatories as at 30 June 2000 are:
• Abbott Australasia Pty Ltd
• Bristol-Myers Squibb Australia Pty Ltd (Mead Johnson) *
• HJ Heinz Company Australia Ltd *
• Nestlé Australia Limited *
• Nutricia Australia Pty Ltd*
• Sharpe Laboratories Pty Ltd *
• Snow Brand (Australia) Pty Ltd
• Wyeth Australia Pty Ltd *
*Member companies of IFMAA
APMAIF invited other infant formula companies that are manufacturing anddistributing infant formula, to become signatories to the MAIF Agreement.The Panel has contacted the companies Sigma (Amcal and Guardianbrands) and Fauldings (Chem mart and Health Sense Brands) to invitethem to become signatories to the Agreement. Both companies have infantformula products in the Australian market place. As at 30 June 2000 neitherof these manufacturers have become signatories. Discussions arecontinuing.
450
APPENDIX J
Infant Feeding Guidelines for Health Workers
The Panel has also contacted Snow Brand (Australia) Pty Ltd regarding itsposition in the Australian market. The Panel has asked them to becomefinancial signatories to the MAIF Agreement.
R E F E R E N C E S
1. IOCU–IBFAN. Protecting infant health. A health worker’s guide to theInternational Code of Marketing of Breast-milk Substitutes. Penang,Malaysia: International Organization of Consumers’ Unions & InternationalBaby Food Action Network, 1987:12.
2. WHO–UNICEF. Protecting, promoting and supporting breast-feeding: thespecial role of maternity services—a joint WHO–UNICEF statement. Geneva:World Health Organization, 1989.
452
APPENDIX J
Infant Feeding Guidelines for Health Workers
The National Health and Medical Research Council
The National Health and Medical Research Council (NHMRC) is a statutory body within the portfolio of theCommonwealth Minister for Health and Ageing, established by the National Health and Medical ResearchCouncil Act 1992. The NHMRC advises the Australian community and Commonwealth; State and TerritoryGovernments on standards of individual and public health, and supports research to improve those standards.
The NHMRC advises the Commonwealth Government on the funding of medical and public health research andtraining in Australia and supports many of the medical advances made by Australians.
The NHMRC also develops guidelines and standards for the ethical conduct of health and medical research.
The Council comprises nominees of Commonwealth, State and Territory health authorities, professional andscientific colleges and associations, unions, universities, business, consumer groups, welfare organisations,conservation groups and the Aboriginal and Torres Strait Islander Commission.
The Council meets up to four times a year to consider and make decisions on reports prepared by committeesand working parties following wide consultation on the issue under consideration.
A regular publishing program ensures that Council’s recommendations are widely available to governments, thecommunity, scientific, industrial and educational groups.
The Council publishes extensively in the following areas:
• Aged care • Communicable diseases
• Child health • Clinical practice guidelines
• Dentistry • Diabetes
• Drugs and poisons • Drug and substance abuse
• Environmental health • Ethics – Animal
• Ethics – Human • Health procedures
• Health promotion • Infection control
• Mental health • Men’s health
• NHMRC – National Health and Medical • NutritionResearch Council
• Public health • Research
• Sport/Injury • Women’s health
• Workforce
A list of current publications is available from:
The Publications OfficerNHMRCMDP 100GPO Box 9848Canberra ACT 2601
Phone: (02) 6289 9520 (24-hour answering machine)Toll free: 1800 020 103Fax: (02) 6289 9197E-mail: [email protected]: http://www.nhmrc.gov.au
Related Documents