UNITED NATIONS ECONOMIC COMMISSION FOR EUROPE

Welcome message from author
This document is posted to help you gain knowledge. Please leave a comment to let me know what you think about it! Share it to your friends and learn new things together.
Transcript
UNITED NATIONS ECONOMIC COMMISSION FOR EUROPE

DIESEL ENGINE EXHAUSTS: MYTHS AND REALITIES UNECE
1
Contents List of Figures .......................................................................................................................................... 2
I. Introduction. ................................................................................................................................... 4
II. Analysis of Diesel Engine Exhausts’ main air pollutants. ................................................................ 5
II.1. Main air pollutants. ...................................................................................................................... 5
II.2. Historical Trends. ......................................................................................................................... 6
II.2.1. Canada .................................................................................................................................. 7
II.2.2. Japan ..................................................................................................................................... 7
II.2.3. Republic of Korea .................................................................................................................. 8
II.2.4. United States of America ...................................................................................................... 8
II.2.5. European Union ................................................................................................................... 9
II.2.6 The Trend Worldwide UNECE .............................................................................................. 11
III. Diesel engine exhausts emissions harmful effect on human health and the environment. .... 12
IV. Sources of air pollution that use diesel engines. ...................................................................... 15
IV.1. The role of different economic sectors .................................................................................... 15
IV.1.1. Energy Sector. .................................................................................................................... 18
IV.1.2. Transport Sector. ............................................................................................................... 19
IV.1.3. Households and commercial / institutional buildings. ...................................................... 20
IV.1.4. Industry .............................................................................................................................. 20
IV.1.5. Agricultural Sector. ............................................................................................................ 21
IV.2. The role of Inland Transport. .................................................................................................... 22
IV.2.1. Road Transport. ................................................................................................................. 22
IV.2.2. Rail Transport. .................................................................................................................... 23
IV.2.3. Inland Water Ways. ........................................................................................................... 24
IV.2.4. A diesel engine emission scenario among the three inland transport modes. ................. 27
V. International Agreements and regulations. .................................................................................. 28
V.1. Policy approach to emissions at national and regional level ..................................................... 28
V.1.1. Governments focus. ............................................................................................................ 28
V.1.1.1 Canada ......................................................................................................................... 29
V.1.1.2. Japan ............................................................................................................................ 29
V.1.1.3. Republic of Korea ......................................................................................................... 30
V.1.1.4. United States of America ............................................................................................. 30
V.1.1.5. European Union ........................................................................................................... 31
V.1.2. Transport Focus. ................................................................................................................. 32
DIESEL ENGINE EXHAUSTS: MYTHS AND REALITIES UNECE
2
V.1.3. Diesel engine exhausts focus .............................................................................................. 34
VI. Inland Transport Committee activities ..................................................................................... 36
VI.1. Introduction .............................................................................................................................. 36
VI.1.1. Common test procedures .................................................................................................. 36
VI.2. Regulations setting limit values for pollutant emissions ...................................................... 37
VI.3. Other relevant activities ....................................................................................................... 39
VI.4. Emission regulations and fuel quality parameters ............................................................... 40
VII. Conclusions and recommendations. ......................................................................................... 40
VII.1. Conclusions .............................................................................................................................. 40
VII.2 Recommendations .................................................................................................................... 42
VIII. References ................................................................................................................................ 45
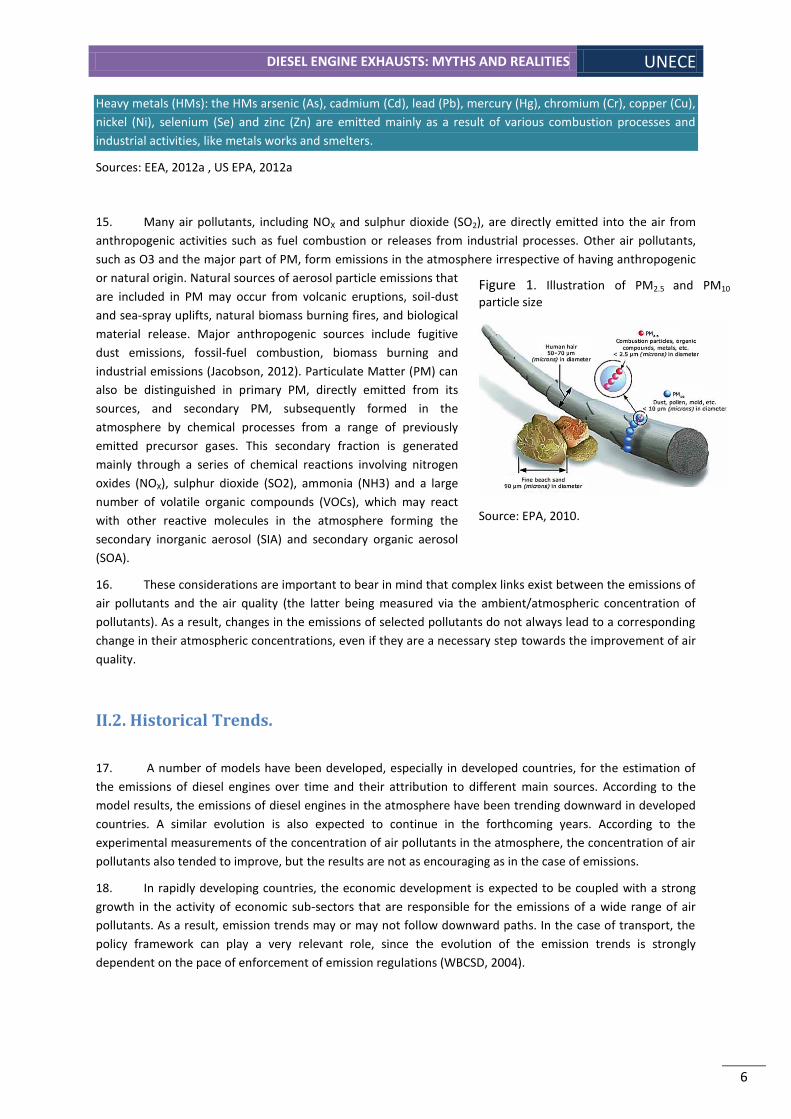
List of Figures Figure 1. Illustration of PM2.5 and PM10 particle size ________________________________________________ 6
Figure 2. Canadian PM emission trends (open and natural sources excluded) ____________________________ 7
Figure 3. Atmospheric concentration of suspended particulate matter in Japan __________________________ 7
Figure 4. Atmospheric concentration of PM in Korea _______________________________________________ 8
Figure 5. PM pollutant emissions trends in the United States of America _______________________________ 8
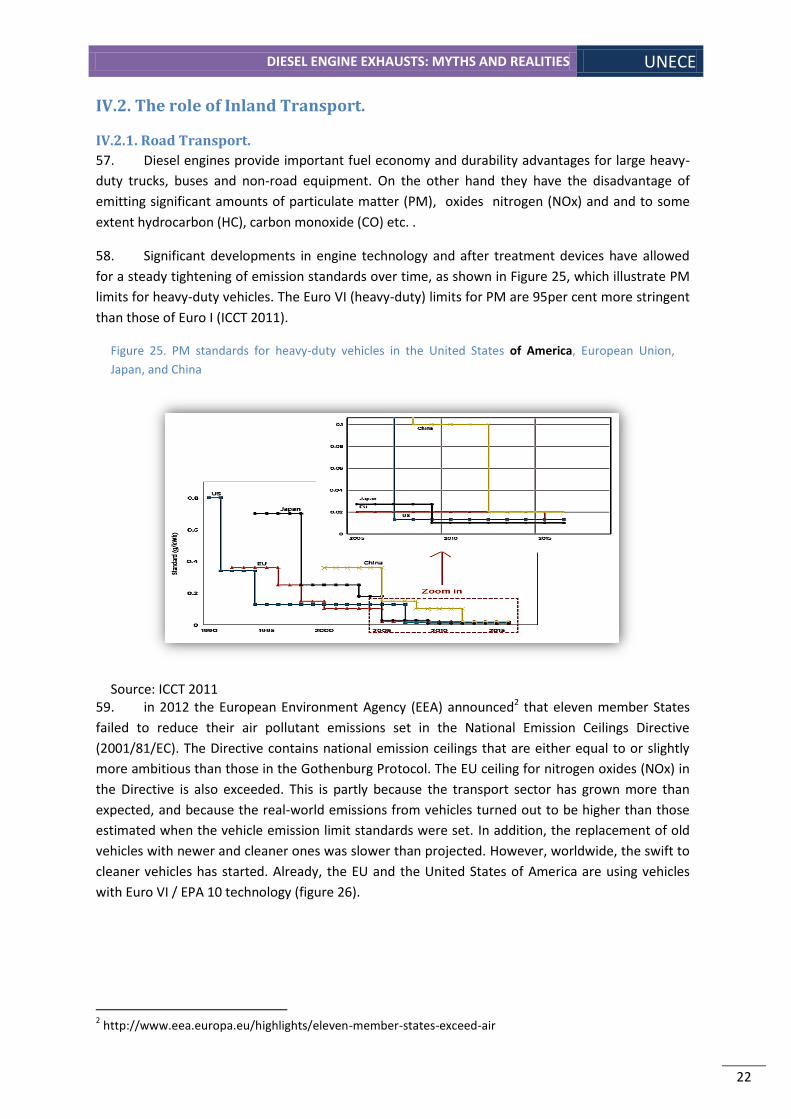
Figure 6. EU-27 emission trends for the particulate matter and other air pollutants ______________________ 9
Figure 7. Indexed trends in air quality ___________________________________________________________ 9
Figure 8 . Percentage change in PM2.5 and PM10 emissions 1990-2010 (EEA member countries) __________ 10
Figure 9. PM10, country level (micrograms per cubic meter)UNECE member States and the World __________ 11
Figure 10. Annual mean concentrations of PM10 in 2011 ___________________________________________ 12
Figure 11. Percentage of the urban population in the EU exposed to PM pollutant concentrations above the EU
and WHO reference levels (2009–2011) _________________________________________________________ 13
Figure 12. key health effects for PM and other air pollutants ________________________________________ 13
Figure 13. Trend in PM2.5 and PM10 emissions from the five most important key categories, 1990–2010; ___ 15
Figure 14. Sector contributions of emissions of primary particulate matter in 2010 (EEA member countries) __ 15
Figure 15. Percentage change in primary PM2.5 particulate matter emissions for each sector and pollutant
between 1990 and 2010. ____________________________________________________________________ 17
Figure 16. Percentage change in primary PM10 particulate matter emissions for each sector and pollutant
between 1990 and 2010. ____________________________________________________________________ 17
Figure 17. Share of emissions of the particulate matter by economic sector in the United Sates ___________ 18
Figure 18. EU-27 emission trends in the sector 'energy production and distribution ______________________ 19
Figure 19. EU-27 emission trends in the sector group 'energy use in industry' ___________________________ 19
Figure 20 EU-27 emission trends in the sector group 'road transport' _________________________________ 19
Figure 21. EU-27 emission trends in the sector group 'non-road transport' _____________________________ 19
Figure 22. EU-27 emission trends in the sector group 'commercial, institutional and households ___________ 20
Figure 23. EU-27 emission trends in the sector group 'industrial processes' ____________________________ 20

DIESEL ENGINE EXHAUSTS: MYTHS AND REALITIES UNECE
3
Figure 24. EU-27 emission trends in the sector group 'agriculture' for NH3 in Gg between 1990 ____________ 21
Figure 25. PM standards for heavy-duty vehicles in the United States of America, European Union, Japan, and
China ____________________________________________________________________________________ 22
Figure 26.Vehicles are getting “cleaner” worldwide _______________________________________________ 23
Figure 27. Heavy-duty vehicle standard adoption timeline in China and European Union. ________________ 23
Figure 28. Total PM Exhaust Emissions from Rail Diesel Traction in EU27 & EFTA, CleanER-D estimation until
2020 _____________________________________________________________________________________ 24
Figure 29. Development of PM2.5 emissions from mobile sources in EU27 _____________________________ 25
Figure 30. Relation between engine year of construction and PM emission profile in Inland Waterways _____ 25
Figure 31. Current emission standards for road transport and IWT: NOx/PM ___________________________ 27
Figure 32. Comparison analysis between road, rail and IWT PM emissions _____________________________ 28

DIESEL ENGINE EXHAUSTS: MYTHS AND REALITIES UNECE
4
I. Introduction.
1. Every day, millions of diesel-powered vehicles busily move consumer goods and raw materials from
ports, distribution centres and rail yards to stores and industrial facilities throughout the world. Diesel
powered ships, trains and trucks play a pivotal role in local, regional and global commerce. Most of the rivers
barges, freight trains and ocean-going ships are also powered by diesel, as are the overwhelming majority of
trucks and lorries. Furthermore, school buses, buses and garbage collector trucks facilitate our daily lives.
2. Diesel-powered equipment is also a major part of the supply chain that moves crops from the farm to
the dinner table. Diesel-powered farm tractors, combines and irrigation pumps are just a few examples of the
types of equipment that literally drive the agriculture sector.
3. Diesel engines are not only fundamental in mobile vehicles and machinery, but also widely employed
in stationary applications such as pipeline pumps, electric and water plants, industrial machinery, mining tools,
factories and oil fields.
4. Unmatched in their reliability, durability, fuel efficiency and mobility, diesel engines play a
fundamental role to allow economic development.
5. However, along with the economically productive role of diesel engines in national economies comes
their emissions’ harmful effect on human health. Emissions from diesel engines found in trucks, boats,
locomotives, busses, agricultural and construction equipment—especially the microscopic soot known as
“particulate matter” (PM)—create serious health problems for adults and have extremely harmful effects on
children and the elderly.
6. The objective of this background note is:
a) to offer a balanced view on the on-going debate about harmful effect of diesel engine exhausts
emissions on human health and the environment
b) to take stock of recent studies on the harmful effects of diesel exhausts to public health;
c) to provide information about diesel emissions by different economic sectors including inland
transport;
d) to inform about recent policy developments on the reduction of pollutant emissions to address health
and environmental concerns and
e) to inform about any technological developments of diesel engines that reduce or even eliminate the
harmful effects to public health.
7. The overview includes information with global relevance and focuses especially on the European
Union, North America, and Japan.
8. Section II contains a list of the main air pollutants from diesel engine exhausts. Section III illustrates
diesel engine exhausts harmful effects on human health and the environment.
9. Section IV provides information on the main sources of air pollution from diesel engines and in
particular the role of different economic sectors as well as of inland transport.
10. Section V focuses on the compliance with existing international agreements, as well as EU legislation.
It reports briefly on an assessment of the atmospheric concentration of the PM pollutants in Europe.
11. Section VI provides an overview of relevant regulatory measures undertaken for the reduction of PM
pollutant emissions of diesel engines in the framework of the Inland Transport Committee and its subsidiary
bodies, particularly by the World Forum for the Harmonization of Vehicle Regulations (WP.29).
12. Section VII provides a set of conclusions and recommendations for consideration by the Governments
and the relevant international organizations.
DIESEL ENGINE EXHAUSTS: MYTHS AND REALITIES UNECE
5
II. Analysis of Diesel Engine Exhausts’ main air pollutants.
II.1. Main air pollutants.
13. The incomplete combustion of diesel fuel creates the particulate matter. Particulate matter’s
composition often includes hundreds of chemical elements, including sulphates, ammonium, nitrates,
elemental carbon, condensed organic compounds, and even carcinogenic compounds and heavy metals such
as arsenic, selenium, cadmium and zinc. Though just a fraction of the width of a human hair, particulate matter
varies in size from coarse particulates (less than 10 microns in diameter) to fine particulates (less than 2.5
microns) to ultrafine particulates (less than 0.1 microns).
14. A recent report from the European Environment Agency (EEA) (EEA, 2012) provides a brief description
(partly reported in Box 1) of Particulate Matter and other air pollutants as well as their effects on human
health and the environment.
Box 1. Description of the main local air pollutants (gases, particulate matter and heavy metals)
Particulate matter (PM): PM is emitted from many sources and is a complex heterogeneous mixture
comprising both primary and secondary PM. Primary PM is the fraction of PM that is emitted directly into the
atmosphere, whereas secondary PM forms in the atmosphere following the oxidation and transformation of
precursor gases (mainly SOX, NOX, NH3 and some volatile organic compounds (VOCs)). From a regulatory
perspective, PM is divided into PM10 and PM2.5, defined (ISO, 2008) as the size fractions where the median
aerodynamic diameter of the particles is respectively 10 and 2.5 microns (this means that 50 per cent of the
particles in these fractions have diameters respectively greater, or smaller, than 10 microns and 2.5 microns.
Sources of coarse particles include crushing or grinding operations, and dust stirred up by vehicles traveling on
roads. Sources of fine particles include all types of combustion, including motor vehicles, power plants,
residential wood burning, forest fires, agricultural burning, and some industrial processes. Considering the
potential to harm human health, PM is one of the most important pollutants as it penetrates into sensitive
regions of the respiratory system. In addition, Black Carbon (BC) is the most strongly light-absorbing
component of PM (US EPA, 2012b). Emitted directly into the atmosphere in the form of fine particles (PM2.5)
and notwithstanding its short lifetime, BC is estimated to have a 20-year global warming potential (GWP) more
than 4000 times higher than the GWP of CO2 and a 100-year GWP 1500 to 2240 times higher than CO2
(Jacobson, 2007). This, combined with the amounts emitted in the atmosphere, is such that BC is likely to be
one of the leading causes of global warming after carbon dioxide (Jacobson, 2007).
Sulphur oxides (SOX): SOX are emitted when fuels containing sulphur are burned. They contribute to acid
deposition, the impacts of which can be significant: adverse effects on aquatic ecosystems in rivers and lakes,
and damage to forests.
Nitrogen oxides (NOX): NOX are emitted during fuel combustion by industrial facilities and the road transport
sector. As with SOX, NOX contribute to acid deposition but also to eutrophication of soil and water.
Ammonia (NH3): NH3, like NOX, contributes to both eutrophication and acidification.
Carbon monoxide (CO): CO is produced as a result of fuel combustion. The road transport, commercial,
household and industry sectors are important sources. Long-term exposure even to low concentrations of CO
can result in neurological problems and potential harm to unborn babies.
Non-methane volatile organic compounds (NMVOC): NMVOC, important O3 precursors, are emitted from a
large number of sources including paint application, road transport, dry-cleaning and other solvent uses.
DIESEL ENGINE EXHAUSTS: MYTHS AND REALITIES UNECE
6
Heavy metals (HMs): the HMs arsenic (As), cadmium (Cd), lead (Pb), mercury (Hg), chromium (Cr), copper (Cu),
nickel (Ni), selenium (Se) and zinc (Zn) are emitted mainly as a result of various combustion processes and
industrial activities, like metals works and smelters.
Sources: EEA, 2012a , US EPA, 2012a
15. Many air pollutants, including NOX and sulphur dioxide (SO2), are directly emitted into the air from
anthropogenic activities such as fuel combustion or releases from industrial processes. Other air pollutants,
such as O3 and the major part of PM, form emissions in the atmosphere irrespective of having anthropogenic
or natural origin. Natural sources of aerosol particle emissions that
are included in PM may occur from volcanic eruptions, soil-dust
and sea-spray uplifts, natural biomass burning fires, and biological
material release. Major anthropogenic sources include fugitive
dust emissions, fossil-fuel combustion, biomass burning and
industrial emissions (Jacobson, 2012). Particulate Matter (PM) can
also be distinguished in primary PM, directly emitted from its
sources, and secondary PM, subsequently formed in the
atmosphere by chemical processes from a range of previously
emitted precursor gases. This secondary fraction is generated
mainly through a series of chemical reactions involving nitrogen
oxides (NOX), sulphur dioxide (SO2), ammonia (NH3) and a large
number of volatile organic compounds (VOCs), which may react
with other reactive molecules in the atmosphere forming the
secondary inorganic aerosol (SIA) and secondary organic aerosol
(SOA).
16. These considerations are important to bear in mind that complex links exist between the emissions of
air pollutants and the air quality (the latter being measured via the ambient/atmospheric concentration of
pollutants). As a result, changes in the emissions of selected pollutants do not always lead to a corresponding
change in their atmospheric concentrations, even if they are a necessary step towards the improvement of air
quality.
II.2. Historical Trends.
17. A number of models have been developed, especially in developed countries, for the estimation of
the emissions of diesel engines over time and their attribution to different main sources. According to the
model results, the emissions of diesel engines in the atmosphere have been trending downward in developed
countries. A similar evolution is also expected to continue in the forthcoming years. According to the
experimental measurements of the concentration of air pollutants in the atmosphere, the concentration of air
pollutants also tended to improve, but the results are not as encouraging as in the case of emissions.
18. In rapidly developing countries, the economic development is expected to be coupled with a strong
growth in the activity of economic sub-sectors that are responsible for the emissions of a wide range of air
pollutants. As a result, emission trends may or may not follow downward paths. In the case of transport, the
policy framework can play a very relevant role, since the evolution of the emission trends is strongly
dependent on the pace of enforcement of emission regulations (WBCSD, 2004).
Figure 1. Illustration of PM2.5 and PM10
particle size
Source: EPA, 2010.
DIESEL ENGINE EXHAUSTS: MYTHS AND REALITIES UNECE
7
II.2.1. Canada
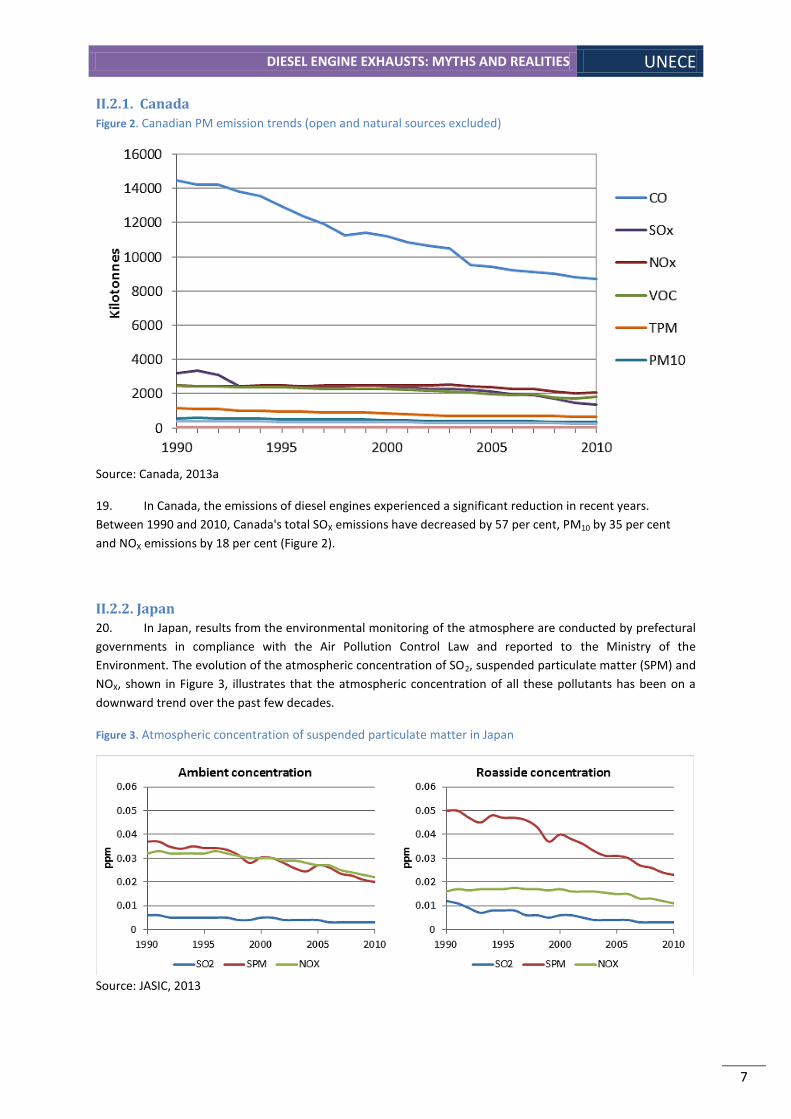
Figure 2. Canadian PM emission trends (open and natural sources excluded)
Source: Canada, 2013a
19. In Canada, the emissions of diesel engines experienced a significant reduction in recent years.
Between 1990 and 2010, Canada's total SOX emissions have decreased by 57 per cent, PM10 by 35 per cent
and NOX emissions by 18 per cent (Figure 2).
II.2.2. Japan
20. In Japan, results from the environmental monitoring of the atmosphere are conducted by prefectural
governments in compliance with the Air Pollution Control Law and reported to the Ministry of the
Environment. The evolution of the atmospheric concentration of SO2, suspended particulate matter (SPM) and
NOX, shown in Figure 3, illustrates that the atmospheric concentration of all these pollutants has been on a
downward trend over the past few decades.
Figure 3. Atmospheric concentration of suspended particulate matter in Japan
Source: JASIC, 2013

DIESEL ENGINE EXHAUSTS: MYTHS AND REALITIES UNECE
8
II.2.3. Republic of Korea 21. In the Republic of Korea (Korea), air pollutants are continuously and automatically measured by using
monitoring equipment. Real time data are collected through the National Ambient air Monitoring Information
System (NMAIS) and published by Air Korea.
22. In 2001, the Ministry of Environment (MOE) published information on the concentration level of air
pollutants such as particulate matter (Figure 4) in the environmental review of Korea. The MOE underlined a
downward trend of sulphur dioxide emissions, thanks to the strengthening of the fuel regulation system. A
higher concentration of nitrogen dioxide in Seoul, was observed where economic activities are concentrated
and traffic is the largest. At the same time, a decrease of the concentration of particulate matter since 2008
was achieved (MOE Korea, 2011).
Figure 4. Atmospheric concentration of PM in Korea
Source: MOE Korea, 2011
II.2.4. United States of America
23. Downward trends are observable in the United States of America (Figure 5), where, between 1990
and 2012, PM (both PM10 and PM2.5) emissions declined by roughly 20 per cent.
Figure 5. PM pollutant emissions trends in the United States of America
Source: US EPA, 2012
0
20000
40000
60000
80000
100000
120000
140000
160000
1990 1995 2000 2005 2010
Tho
usa
nd
to
nn
es
CO
NOX
PM10
PM2.5
SO2
VOC
NH3
DIESEL ENGINE EXHAUSTS: MYTHS AND REALITIES UNECE
9
II.2.5. European Union
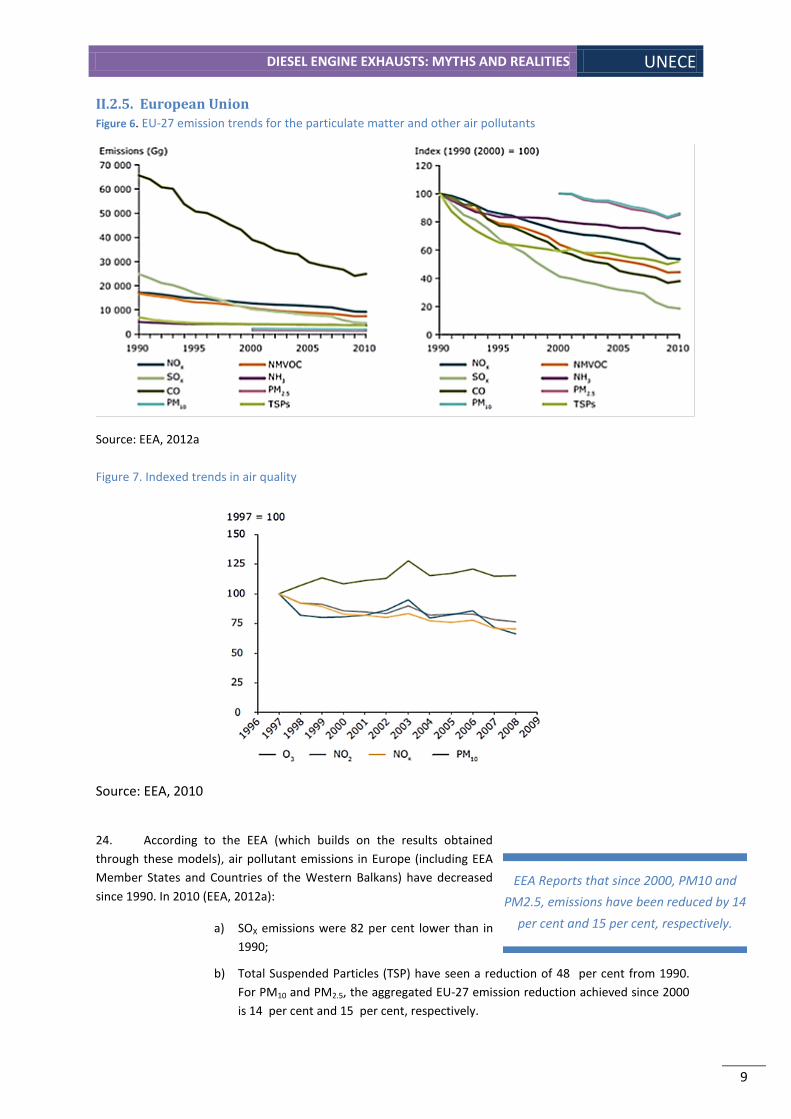
Figure 6. EU-27 emission trends for the particulate matter and other air pollutants
Source: EEA, 2012a
Figure 7. Indexed trends in air quality
Source: EEA, 2010
24. According to the EEA (which builds on the results obtained
through these models), air pollutant emissions in Europe (including EEA
Member States and Countries of the Western Balkans) have decreased
since 1990. In 2010 (EEA, 2012a):
a) SOX emissions were 82 per cent lower than in
1990;
b) Total Suspended Particles (TSP) have seen a reduction of 48 per cent from 1990.
For PM10 and PM2.5, the aggregated EU-27 emission reduction achieved since 2000
is 14 per cent and 15 per cent, respectively.
EEA Reports that since 2000, PM10 and
PM2.5, emissions have been reduced by 14
per cent and 15 per cent, respectively.
DIESEL ENGINE EXHAUSTS: MYTHS AND REALITIES UNECE
10
25. Despite these reductions, measured concentrations of health-relevant pollutants such as PM and O3
have not shown a corresponding improvement (Figure 7) (EEA, 2010).
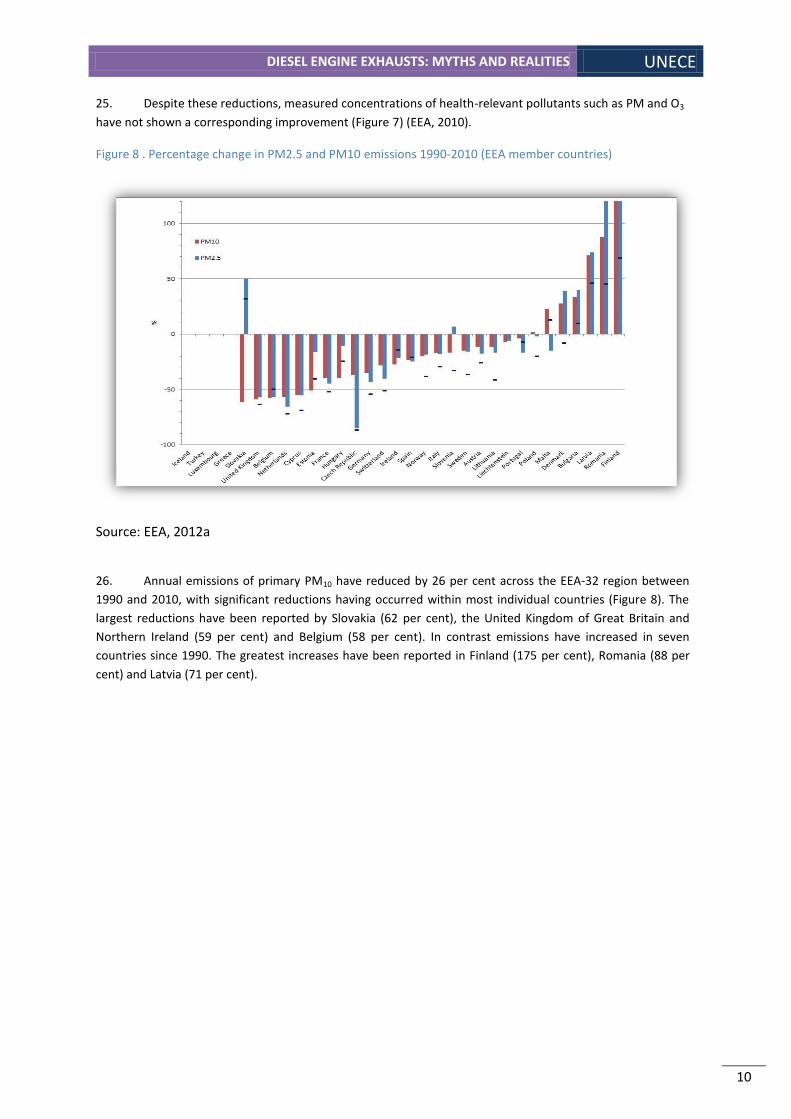
Figure 8 . Percentage change in PM2.5 and PM10 emissions 1990-2010 (EEA member countries)
Source: EEA, 2012a
26. Annual emissions of primary PM10 have reduced by 26 per cent across the EEA-32 region between
1990 and 2010, with significant reductions having occurred within most individual countries (Figure 8). The
largest reductions have been reported by Slovakia (62 per cent), the United Kingdom of Great Britain and
Northern Ireland (59 per cent) and Belgium (58 per cent). In contrast emissions have increased in seven
countries since 1990. The greatest increases have been reported in Finland (175 per cent), Romania (88 per
cent) and Latvia (71 per cent).
DIESEL ENGINE EXHAUSTS: MYTHS AND REALITIES UNECE
11
II.2.6 The Trend Worldwide UNECE
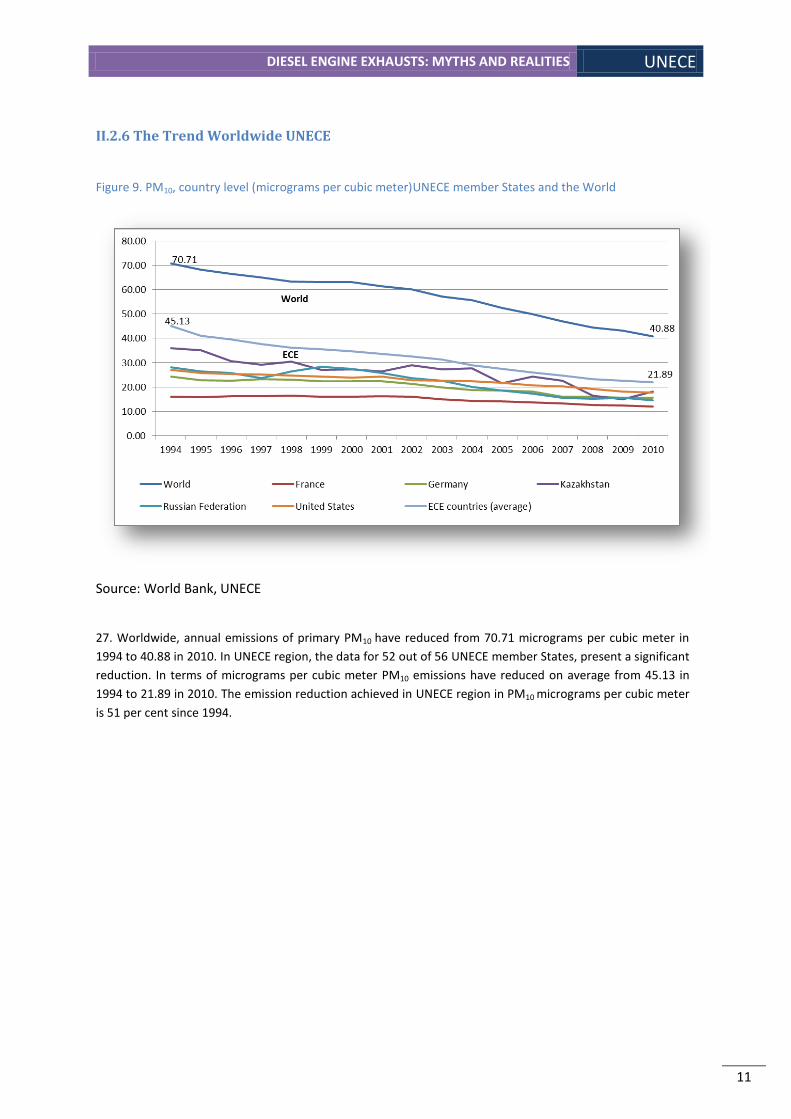
Figure 9. PM10, country level (micrograms per cubic meter)UNECE member States and the World
Source: World Bank, UNECE
27. Worldwide, annual emissions of primary PM10 have reduced from 70.71 micrograms per cubic meter in
1994 to 40.88 in 2010. In UNECE region, the data for 52 out of 56 UNECE member States, present a significant
reduction. In terms of micrograms per cubic meter PM10 emissions have reduced on average from 45.13 in
1994 to 21.89 in 2010. The emission reduction achieved in UNECE region in PM10 micrograms per cubic meter
is 51 per cent since 1994.
DIESEL ENGINE EXHAUSTS: MYTHS AND REALITIES UNECE
12
III. Diesel engine exhausts emissions harmful effect on human
health and the environment.
28. Notwithstanding the progress in reducing anthropogenic emissions of the main air pollutants over
recent decades, poor air quality remains an important public health issue (EEA, 2010). This is particularly
relevant for airborne particulate matter (PM), tropospheric (ground-level) ozone (O3) and nitrogen dioxide
(NO2).
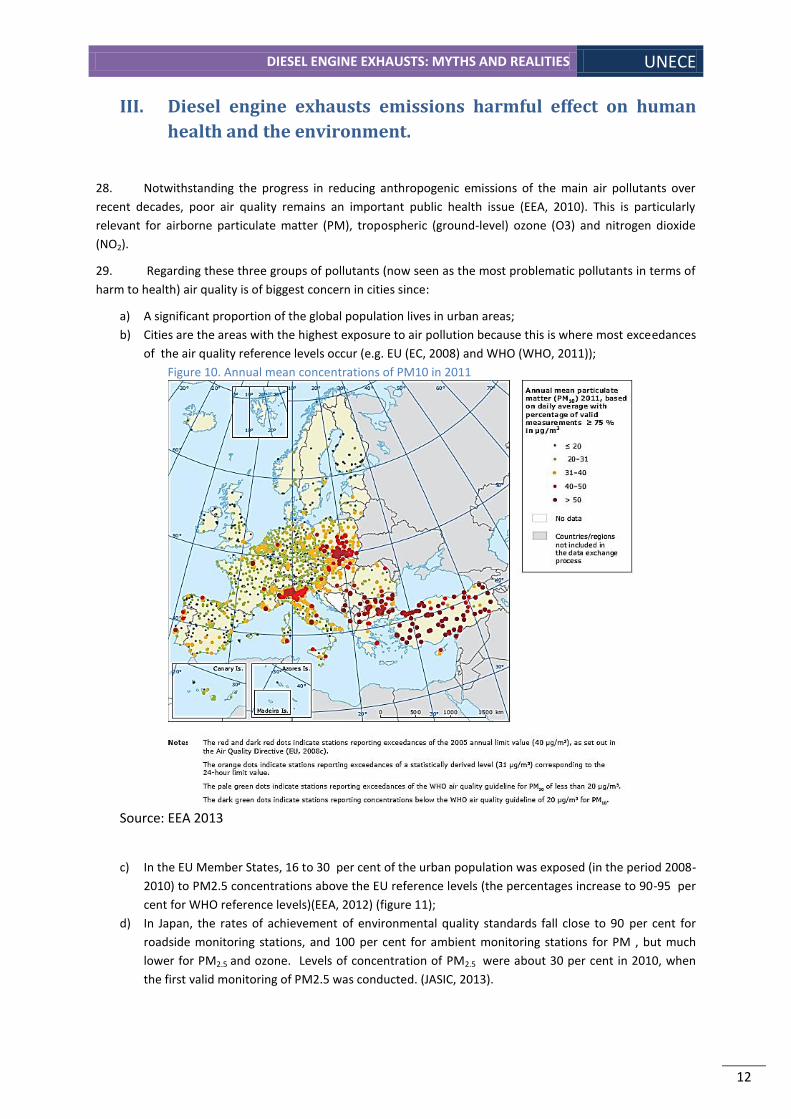
29. Regarding these three groups of pollutants (now seen as the most problematic pollutants in terms of
harm to health) air quality is of biggest concern in cities since:
a) A significant proportion of the global population lives in urban areas;
b) Cities are the areas with the highest exposure to air pollution because this is where most exceedances
of the air quality reference levels occur (e.g. EU (EC, 2008) and WHO (WHO, 2011));
Figure 10. Annual mean concentrations of PM10 in 2011
Source: EEA 2013
c) In the EU Member States, 16 to 30 per cent of the urban population was exposed (in the period 2008-
2010) to PM2.5 concentrations above the EU reference levels (the percentages increase to 90-95 per
cent for WHO reference levels)(EEA, 2012) (figure 11);
d) In Japan, the rates of achievement of environmental quality standards fall close to 90 per cent for
roadside monitoring stations, and 100 per cent for ambient monitoring stations for PM , but much
lower for PM2.5 and ozone. Levels of concentration of PM2.5 were about 30 per cent in 2010, when
the first valid monitoring of PM2.5 was conducted. (JASIC, 2013).
DIESEL ENGINE EXHAUSTS: MYTHS AND REALITIES UNECE
13
30. As pointed out in Section IV, emissions from buildings used for households and
commercial/institutional activities are among the most important contributors to PM ambient concentrations
levels. Other important anthropogenic sources include industrial processes and road transport.
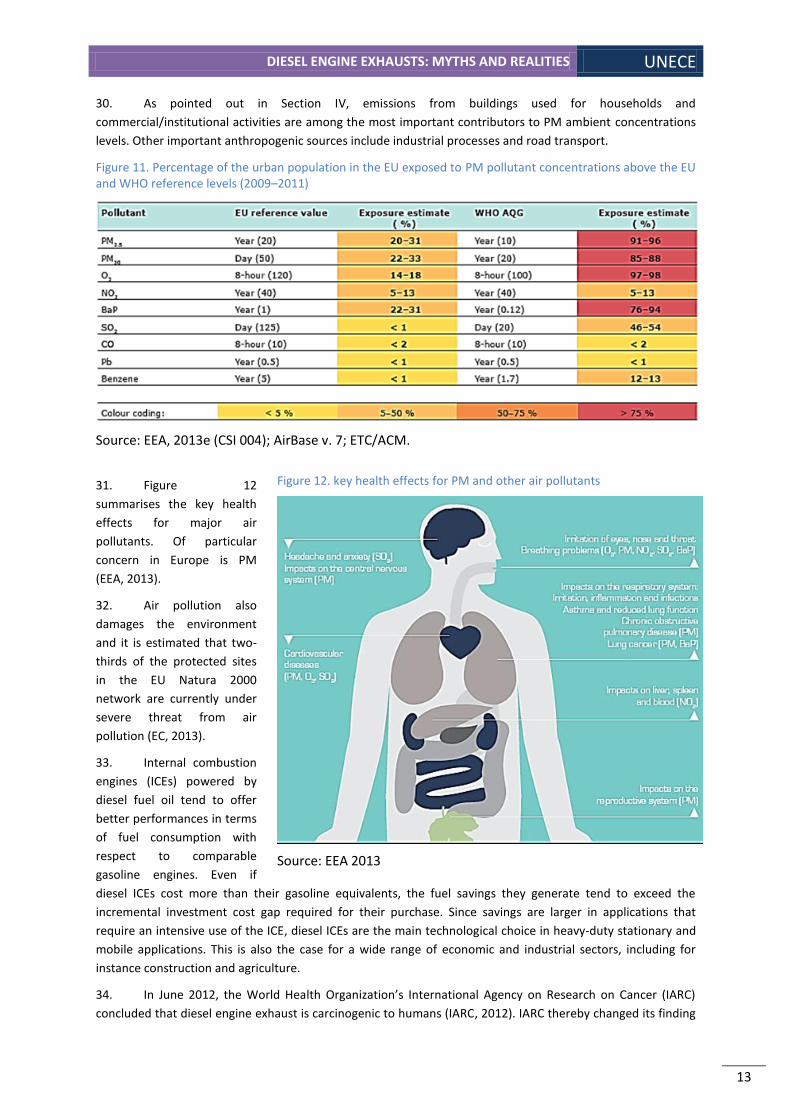
Figure 11. Percentage of the urban population in the EU exposed to PM pollutant concentrations above the EU and WHO reference levels (2009–2011)
Source: EEA, 2013e (CSI 004); AirBase v. 7; ETC/ACM.
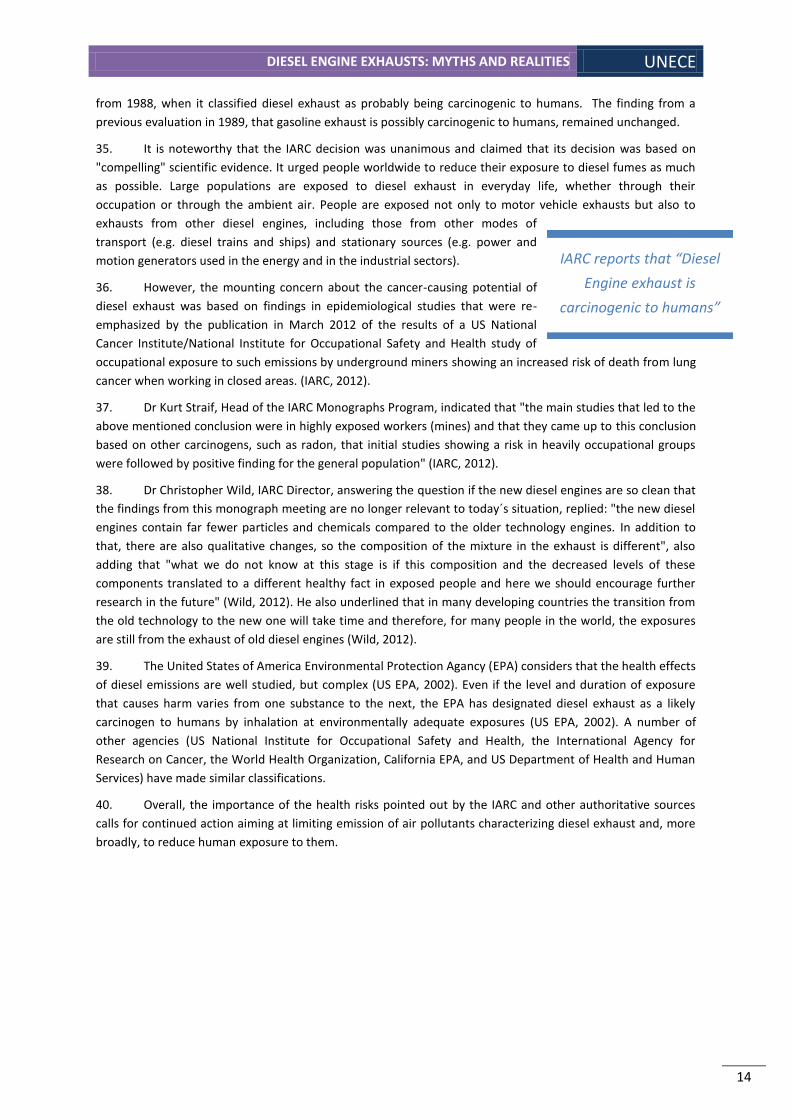
31. Figure 12
summarises the key health
effects for major air
pollutants. Of particular
concern in Europe is PM
(EEA, 2013).
32. Air pollution also
damages the environment
and it is estimated that two-
thirds of the protected sites
in the EU Natura 2000
network are currently under
severe threat from air
pollution (EC, 2013).
33. Internal combustion
engines (ICEs) powered by
diesel fuel oil tend to offer
better performances in terms
of fuel consumption with
respect to comparable
gasoline engines. Even if
diesel ICEs cost more than their gasoline equivalents, the fuel savings they generate tend to exceed the
incremental investment cost gap required for their purchase. Since savings are larger in applications that
require an intensive use of the ICE, diesel ICEs are the main technological choice in heavy-duty stationary and
mobile applications. This is also the case for a wide range of economic and industrial sectors, including for
instance construction and agriculture.
34. In June 2012, the World Health Organization’s International Agency on Research on Cancer (IARC)
concluded that diesel engine exhaust is carcinogenic to humans (IARC, 2012). IARC thereby changed its finding
Figure 12. key health effects for PM and other air pollutants
Source: EEA 2013
DIESEL ENGINE EXHAUSTS: MYTHS AND REALITIES UNECE
14
from 1988, when it classified diesel exhaust as probably being carcinogenic to humans. The finding from a
previous evaluation in 1989, that gasoline exhaust is possibly carcinogenic to humans, remained unchanged.
35. It is noteworthy that the IARC decision was unanimous and claimed that its decision was based on
"compelling" scientific evidence. It urged people worldwide to reduce their exposure to diesel fumes as much
as possible. Large populations are exposed to diesel exhaust in everyday life, whether through their
occupation or through the ambient air. People are exposed not only to motor vehicle exhausts but also to
exhausts from other diesel engines, including those from other modes of
transport (e.g. diesel trains and ships) and stationary sources (e.g. power and
motion generators used in the energy and in the industrial sectors).
36. However, the mounting concern about the cancer-causing potential of
diesel exhaust was based on findings in epidemiological studies that were re-
emphasized by the publication in March 2012 of the results of a US National
Cancer Institute/National Institute for Occupational Safety and Health study of
occupational exposure to such emissions by underground miners showing an increased risk of death from lung
cancer when working in closed areas. (IARC, 2012).
37. Dr Kurt Straif, Head of the IARC Monographs Program, indicated that "the main studies that led to the
above mentioned conclusion were in highly exposed workers (mines) and that they came up to this conclusion
based on other carcinogens, such as radon, that initial studies showing a risk in heavily occupational groups
were followed by positive finding for the general population" (IARC, 2012).
38. Dr Christopher Wild, IARC Director, answering the question if the new diesel engines are so clean that
the findings from this monograph meeting are no longer relevant to today´s situation, replied: "the new diesel
engines contain far fewer particles and chemicals compared to the older technology engines. In addition to
that, there are also qualitative changes, so the composition of the mixture in the exhaust is different", also
adding that "what we do not know at this stage is if this composition and the decreased levels of these
components translated to a different healthy fact in exposed people and here we should encourage further
research in the future" (Wild, 2012). He also underlined that in many developing countries the transition from
the old technology to the new one will take time and therefore, for many people in the world, the exposures
are still from the exhaust of old diesel engines (Wild, 2012).
39. The United States of America Environmental Protection Agancy (EPA) considers that the health effects
of diesel emissions are well studied, but complex (US EPA, 2002). Even if the level and duration of exposure
that causes harm varies from one substance to the next, the EPA has designated diesel exhaust as a likely
carcinogen to humans by inhalation at environmentally adequate exposures (US EPA, 2002). A number of
other agencies (US National Institute for Occupational Safety and Health, the International Agency for
Research on Cancer, the World Health Organization, California EPA, and US Department of Health and Human
Services) have made similar classifications.
40. Overall, the importance of the health risks pointed out by the IARC and other authoritative sources
calls for continued action aiming at limiting emission of air pollutants characterizing diesel exhaust and, more
broadly, to reduce human exposure to them.
IARC reports that “Diesel
Engine exhaust is
carcinogenic to humans”
DIESEL ENGINE EXHAUSTS: MYTHS AND REALITIES UNECE
15
IV. Sources of air pollution that use diesel engines.
IV.1. The role of different economic sectors 41. In addition to total emissions, the EEA estimated the role of different European economic sectors
with respect to the emissions of PM2.5 and PM10 pollutants. The figures 13 and 14 and Table 1 show the trends
and the share of PM2.5 and PM10 emissions by sector groups (EEA, 2012a).
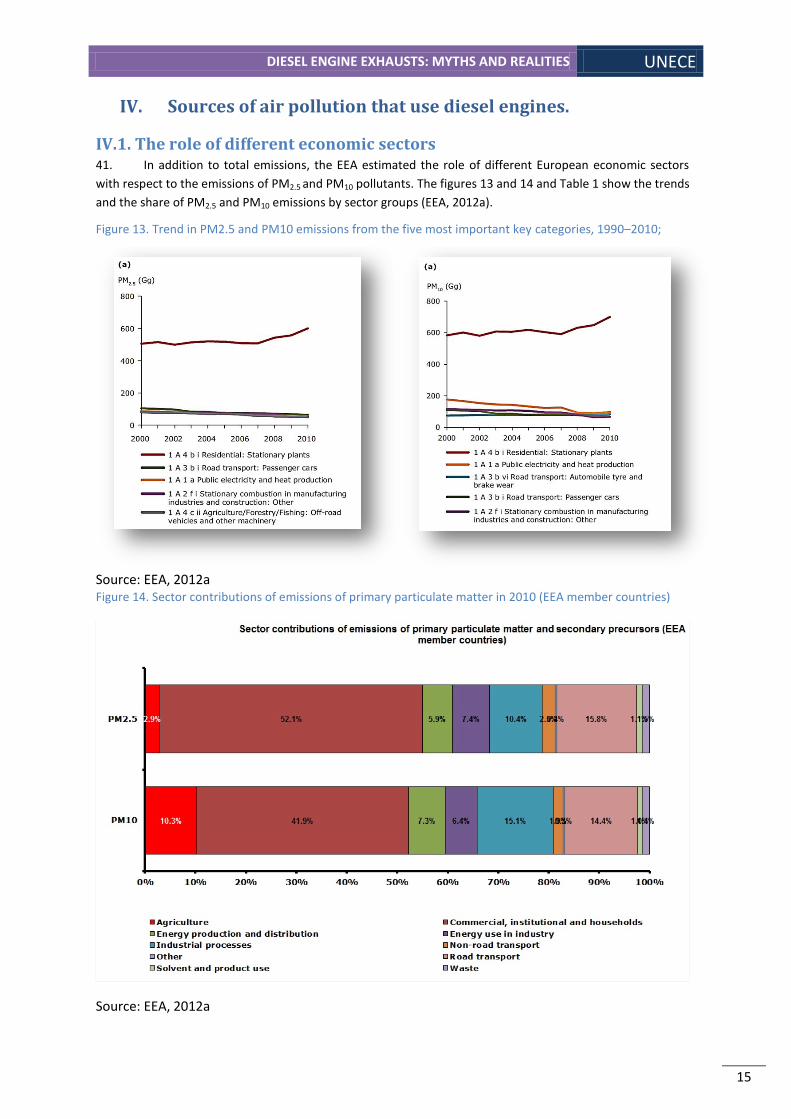
Figure 13. Trend in PM2.5 and PM10 emissions from the five most important key categories, 1990–2010;
Source: EEA, 2012a Figure 14. Sector contributions of emissions of primary particulate matter in 2010 (EEA member countries)
Source: EEA, 2012a
DIESEL ENGINE EXHAUSTS: MYTHS AND REALITIES UNECE
16
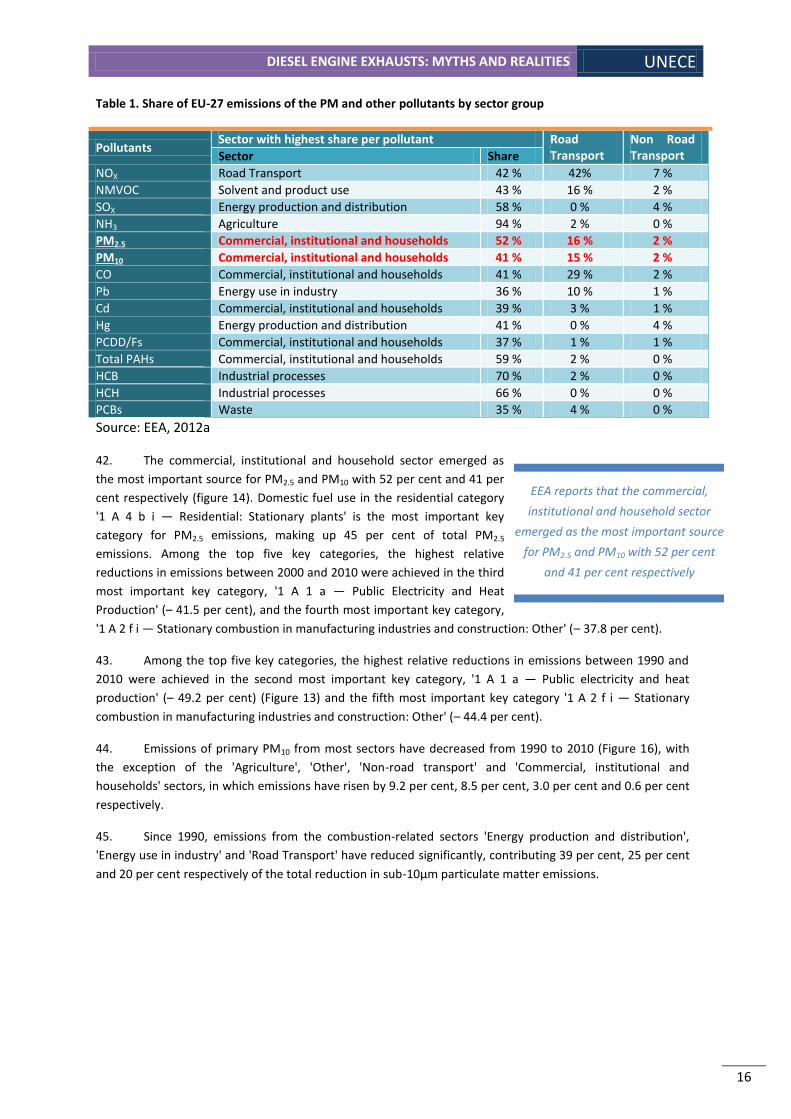
Table 1. Share of EU-27 emissions of the PM and other pollutants by sector group
Pollutants Sector with highest share per pollutant Road
Transport Non Road Transport Sector Share
NOX Road Transport 42 % 42% 7 %
NMVOC Solvent and product use 43 % 16 % 2 %
SOX Energy production and distribution 58 % 0 % 4 %
NH3 Agriculture 94 % 2 % 0 %
PM2.5 Commercial, institutional and households 52 % 16 % 2 %
PM10 Commercial, institutional and households 41 % 15 % 2 %
CO Commercial, institutional and households 41 % 29 % 2 %
Pb Energy use in industry 36 % 10 % 1 %
Cd Commercial, institutional and households 39 % 3 % 1 %
Hg Energy production and distribution 41 % 0 % 4 %
PCDD/Fs Commercial, institutional and households 37 % 1 % 1 %
Total PAHs Commercial, institutional and households 59 % 2 % 0 %
HCB Industrial processes 70 % 2 % 0 %
HCH Industrial processes 66 % 0 % 0 %
PCBs Waste 35 % 4 % 0 %
Source: EEA, 2012a
42. The commercial, institutional and household sector emerged as
the most important source for PM2.5 and PM10 with 52 per cent and 41 per
cent respectively (figure 14). Domestic fuel use in the residential category
'1 A 4 b i — Residential: Stationary plants' is the most important key
category for PM2.5 emissions, making up 45 per cent of total PM2.5
emissions. Among the top five key categories, the highest relative
reductions in emissions between 2000 and 2010 were achieved in the third
most important key category, '1 A 1 a — Public Electricity and Heat
Production' (– 41.5 per cent), and the fourth most important key category,
'1 A 2 f i — Stationary combustion in manufacturing industries and construction: Other' (– 37.8 per cent).
43. Among the top five key categories, the highest relative reductions in emissions between 1990 and
2010 were achieved in the second most important key category, '1 A 1 a — Public electricity and heat
production' (– 49.2 per cent) (Figure 13) and the fifth most important key category '1 A 2 f i — Stationary
combustion in manufacturing industries and construction: Other' (– 44.4 per cent).
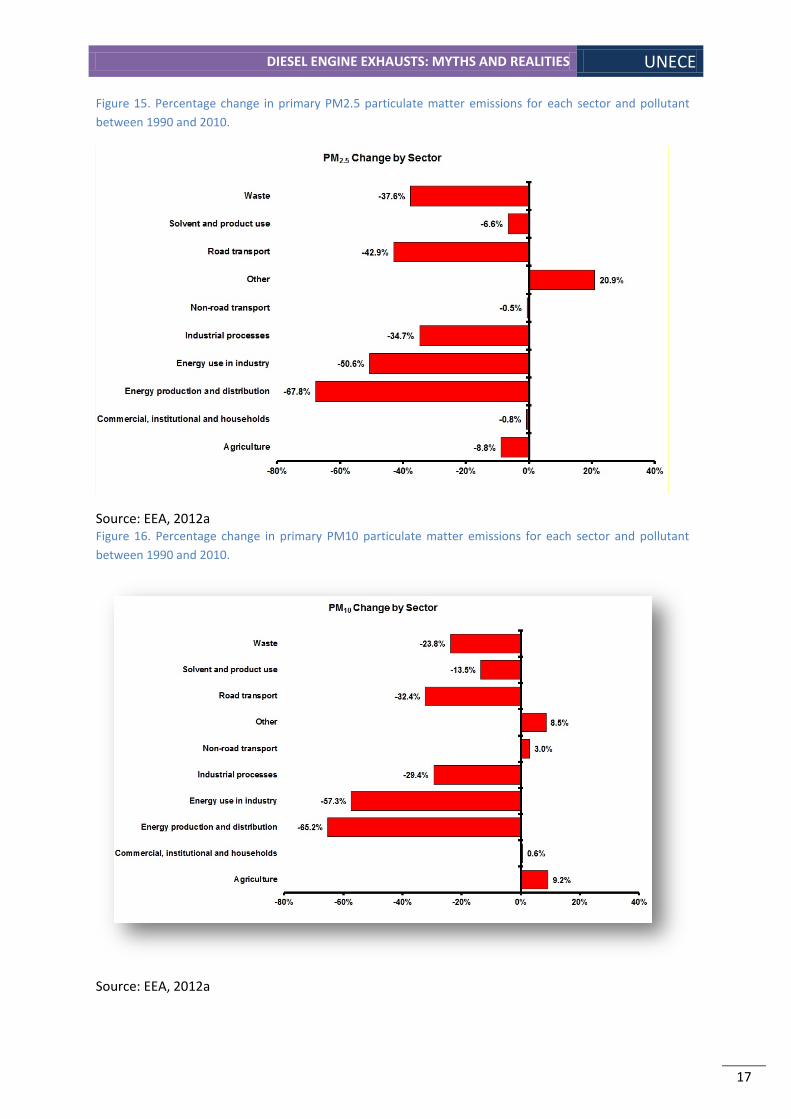
44. Emissions of primary PM10 from most sectors have decreased from 1990 to 2010 (Figure 16), with
the exception of the 'Agriculture', 'Other', 'Non-road transport' and 'Commercial, institutional and
households' sectors, in which emissions have risen by 9.2 per cent, 8.5 per cent, 3.0 per cent and 0.6 per cent
respectively.
45. Since 1990, emissions from the combustion-related sectors 'Energy production and distribution',
'Energy use in industry' and 'Road Transport' have reduced significantly, contributing 39 per cent, 25 per cent
and 20 per cent respectively of the total reduction in sub-10μm particulate matter emissions.
EEA reports that the commercial,
institutional and household sector
emerged as the most important source
for PM2.5 and PM10 with 52 per cent
and 41 per cent respectively
DIESEL ENGINE EXHAUSTS: MYTHS AND REALITIES UNECE
17
Figure 15. Percentage change in primary PM2.5 particulate matter emissions for each sector and pollutant
between 1990 and 2010.
Source: EEA, 2012a Figure 16. Percentage change in primary PM10 particulate matter emissions for each sector and pollutant
between 1990 and 2010.
Source: EEA, 2012a

DIESEL ENGINE EXHAUSTS: MYTHS AND REALITIES UNECE
18
46. In the United States of America, the EPA published similar data, illustrating the evolution of
emissions in different economic sectors. Figure 17 summarizes the information available from the National
Emissions Inventory (NEI) Air Pollutant Emissions Trends Data (US EPA, 2013a). Transport (and especially road
transport) plays a relevant role for what concerns CO and NOX, and it is an
important source of emission for VOC emissions. Notwithstanding different
classifications of the economic sectors, the main difference with the European
shares can be identified in the PM emissions, where road transport has a lower
relevance in the United States of America. This difference can be explained with
the actions taken in North America, where diesel technology, for light vehicles, is
by far less widespread as in other regions, and where stricter PM emission limits
than in Europe have been enforced. As in the case of Europe, low-sulp-hur fuels
allowed achieving very low SO2 emissions in the transport sector.
47. In Canada, emission trends due to transportation follow comparable
patters to those seen in the United States of America, with PM2.5 emissions from the diesel powered on-road
fleet counting less than in Europe and having experienced a 75 per cent decrease between 1985 and 2010. As
in the case of Europe and the United States of America, these changes occurred despite an increase in the
total annual vehicle kilometres travelled by diesel vehicles.
Figure 17. Share of emissions of the particulate matter by economic sector in the United Sates
Source: US EPA, 2013
IV.1.1. Energy Sector.
48. The 'energy production and distribution' sector grouping comprises emissions from a number of
activities involving fuel combustion in order, for example, to produce energy products and electricity. It is an
important source of many pollutants, especially SOX. Despite significant past reductions, this sector group still
contributes 58 per cent of the total EU-271 emissions of this pollutant.
1 Data is based on EEA report of 2013 “EEA (2013), Air quality in Europe report” where EU had 27 member
States
In the United States of America
road transport has lower
relevance regarding PM
emissions (3 per cent share
among the economic sectors)
DIESEL ENGINE EXHAUSTS: MYTHS AND REALITIES UNECE
19
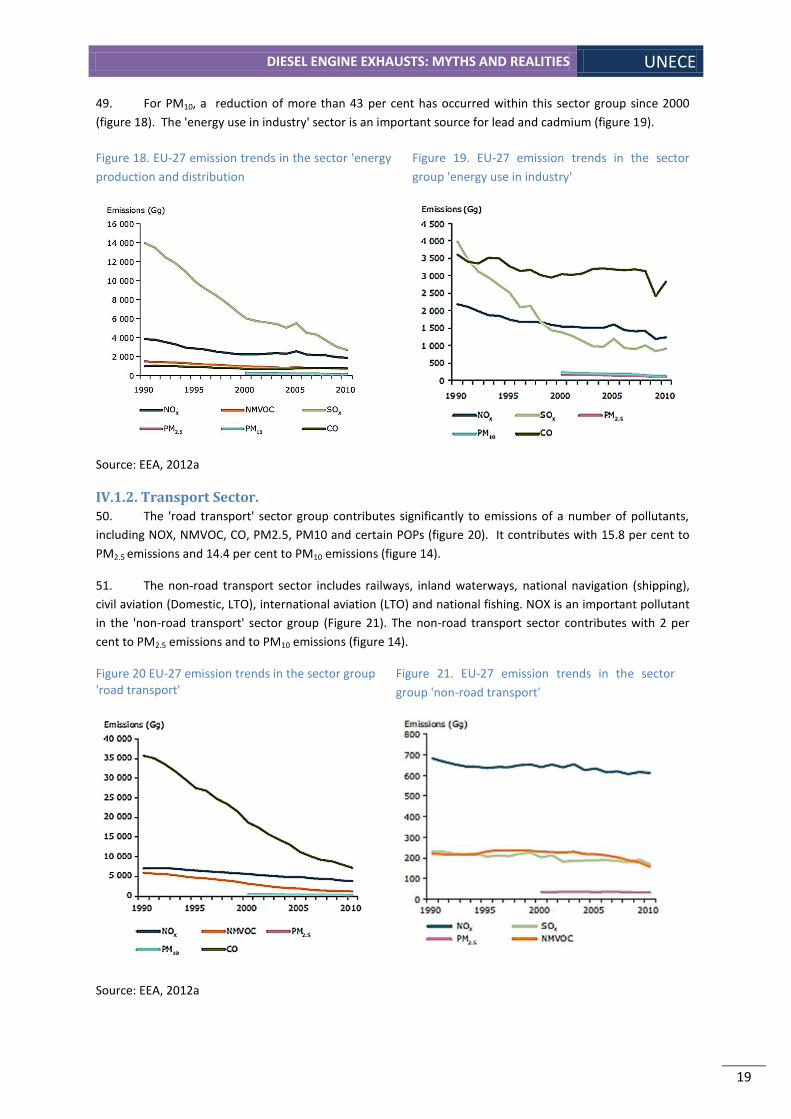
49. For PM10, a reduction of more than 43 per cent has occurred within this sector group since 2000
(figure 18). The 'energy use in industry' sector is an important source for lead and cadmium (figure 19).
IV.1.2. Transport Sector. 50. The 'road transport' sector group contributes significantly to emissions of a number of pollutants,
including NOX, NMVOC, CO, PM2.5, PM10 and certain POPs (figure 20). It contributes with 15.8 per cent to
PM2.5 emissions and 14.4 per cent to PM10 emissions (figure 14).
51. The non-road transport sector includes railways, inland waterways, national navigation (shipping),
civil aviation (Domestic, LTO), international aviation (LTO) and national fishing. NOX is an important pollutant
in the 'non-road transport' sector group (Figure 21). The non-road transport sector contributes with 2 per
cent to PM2.5 emissions and to PM10 emissions (figure 14).
Figure 20 EU-27 emission trends in the sector group 'road transport'
Figure 21. EU-27 emission trends in the sector
group 'non-road transport'
Source: EEA, 2012a
Figure 18. EU-27 emission trends in the sector 'energy
production and distribution
Figure 19. EU-27 emission trends in the sector
group 'energy use in industry'
Source: EEA, 2012a

DIESEL ENGINE EXHAUSTS: MYTHS AND REALITIES UNECE
20
IV.1.3. Households and commercial / institutional buildings.
52. Emissions arising from fuel combustion by
commercial and institutional facilities and
households make a significant contribution to total
emissions of many pollutants. The 'commercial,
institutional and households' sector is an important
source for PAHs, PM2.5, PM10 and CO. For the main
pollutants, the highest relative reduction between
1990 and 2010 for the sector grouping again
occurred for SOX (– 74 per cent) (Figure 22). In
contrast, PM emissions have changed little since
2000. The sector contributes with 52 per cent to
PM2.5 emissions and 41 per cent to PM10 emissions
(figure 14).
IV.1.4. Industry
53. The 'industrial processes' sector grouping
refers to emissions from industrial sources other
than those arising from fuel combustion within the
industrial sector. This sector group is the most
important sector for HCB and HCH emissions and
makes important contributions to emissions of CO,
PM, HMs and POPs (figure 23).
54. The sector contributes with 11 per cent to
PM2.5 emissions and 15 per cent to PM10 emissions
(figure 14).
Figure 22. EU-27 emission trends in the sector group
'commercial, institutional and households
Source: EEA, 2012a
Figure 23. EU-27 emission trends in the sector group
'industrial processes'
Source: EEA, 2012a
DIESEL ENGINE EXHAUSTS: MYTHS AND REALITIES UNECE
21
IV.1.5. Agricultural Sector.
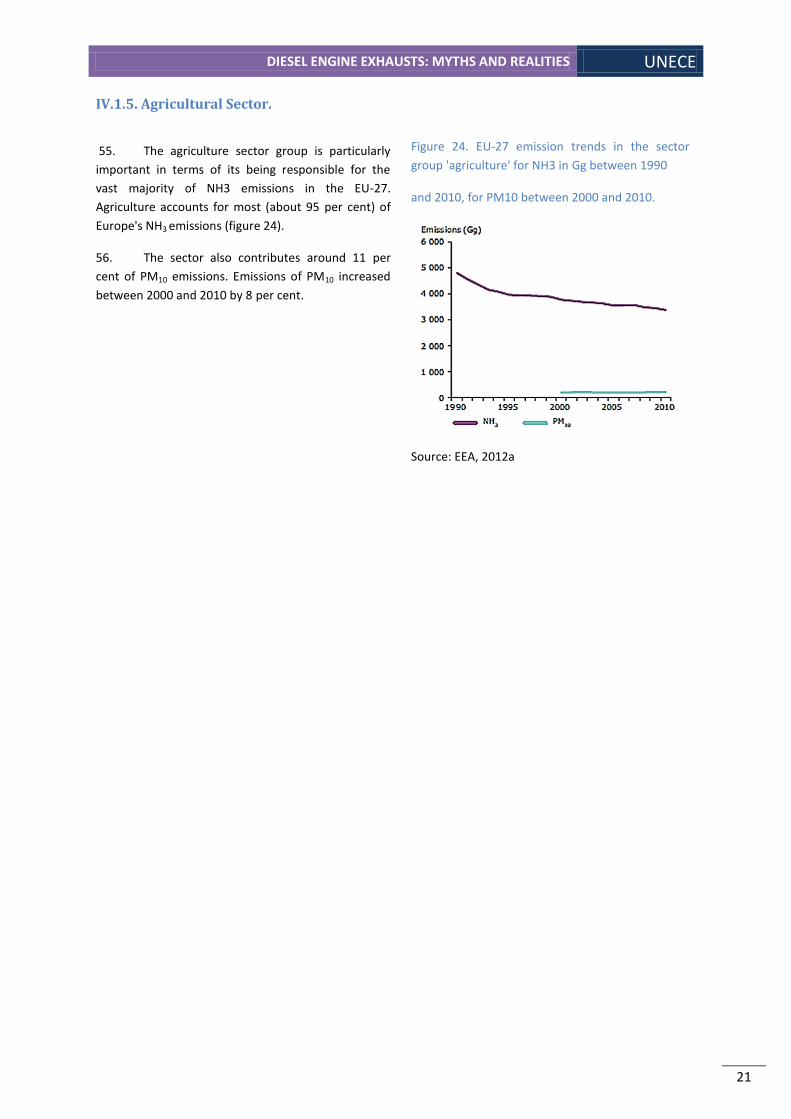
55. The agriculture sector group is particularly
important in terms of its being responsible for the
vast majority of NH3 emissions in the EU-27.
Agriculture accounts for most (about 95 per cent) of
Europe's NH3 emissions (figure 24).
56. The sector also contributes around 11 per
cent of PM10 emissions. Emissions of PM10 increased
between 2000 and 2010 by 8 per cent.
Figure 24. EU-27 emission trends in the sector
group 'agriculture' for NH3 in Gg between 1990
and 2010, for PM10 between 2000 and 2010.
Source: EEA, 2012a
DIESEL ENGINE EXHAUSTS: MYTHS AND REALITIES UNECE
22
IV.2. The role of Inland Transport.
IV.2.1. Road Transport.
57. Diesel engines provide important fuel economy and durability advantages for large heavy-
duty trucks, buses and non-road equipment. On the other hand they have the disadvantage of
emitting significant amounts of particulate matter (PM), oxides nitrogen (NOx) and and to some
extent hydrocarbon (HC), carbon monoxide (CO) etc. .
58. Significant developments in engine technology and after treatment devices have allowed
for a steady tightening of emission standards over time, as shown in Figure 25, which illustrate PM
limits for heavy-duty vehicles. The Euro VI (heavy-duty) limits for PM are 95per cent more stringent
than those of Euro I (ICCT 2011).
Figure 25. PM standards for heavy-duty vehicles in the United States of America, European Union,
Japan, and China
Source: ICCT 2011 59. in 2012 the European Environment Agency (EEA) announced2 that eleven member States
failed to reduce their air pollutant emissions set in the National Emission Ceilings Directive
(2001/81/EC). The Directive contains national emission ceilings that are either equal to or slightly
more ambitious than those in the Gothenburg Protocol. The EU ceiling for nitrogen oxides (NOx) in
the Directive is also exceeded. This is partly because the transport sector has grown more than
expected, and because the real-world emissions from vehicles turned out to be higher than those
estimated when the vehicle emission limit standards were set. In addition, the replacement of old
vehicles with newer and cleaner ones was slower than projected. However, worldwide, the swift to
cleaner vehicles has started. Already, the EU and the United States of America are using vehicles
with Euro VI / EPA 10 technology (figure 26).
2 http://www.eea.europa.eu/highlights/eleven-member-states-exceed-air

DIESEL ENGINE EXHAUSTS: MYTHS AND REALITIES UNECE
23
Figure 26.Vehicles are getting “cleaner” worldwide
Source: The International Council on Clean Transportation, 2012
60. In the late 1990s, China began setting limits for its major vehicle categories following the
Euro pathway, with major cities such as Beijing and Shanghai leading the way with accelerated
adoption of standards. The European Union introduced Euro I in 1992. Figure 27 shows that over
the past 10 years, the adoption time lag between China (not including major cities) and the
European Union has decreased from eight years to just over four years for heavy-duty vehicles.
Figure 27. Heavy-duty vehicle standard adoption timeline in China and European Union.
Source: ICCT 2011
IV.2.2. Rail Transport.
61. Rail exhaust emissions from rail diesel traction in Europe (EU27 & EFTA) are very low. Rail diesel
traction accounts for less than 4.5 per cent particulate matters (EEA 2008) out of the total transport
emissions. The European railways committed to reduce their total exhaust emissions of PM by 40 per cent by
2030. From 1990 to 2008, PM emissions from rail diesel traction already decreased by approximately 35 per
cent. Calculations by the CleanER-D consortium suggest a further substantial decrease of PM by
approximately more than 25 per cent from 2008 to 2020 (UIC, 2013).

DIESEL ENGINE EXHAUSTS: MYTHS AND REALITIES UNECE
24
Figure 28. Total PM Exhaust Emissions from Rail Diesel Traction in EU27 & EFTA, CleanER-D estimation until
2020
Source: UIC, CleanER-D project
62. The reasons for this significantly better future emission performance are mainly:
(a) The introduction of cleaner engine technologies and limit values (NRMM stage IIIB) into the
European vehicle fleet;
(b) A smaller diesel locomotive fleet (UIC statistics indicate that a high share of diesel locomotives in
Europe is not in active service any more) and lower mileages of old vehicles with old engines;
(c) More efficient operation of diesel locomotives and diesel multiple units (DMU);
(d) Further electrification of railway lines (e.g. EU TEN-T corridors).
63. The key factor for further emission reduction is to accelerate the market uptake of IIIB compliant rail
diesel engines into the vehicle fleet, as the fleet scenario highlights a substantial percentage of pre-NRMM
engines in the future. In 2020 the share of stage IIIA and IIIB engines is estimated to be 30 per cent for
locomotives and 41 per cent for DMUs. This share can only be increased if adequate market conditions are
provided, i.e. legislation framework, incentives as well as technologies with low LCC.
IV.2.3. Inland Water Ways.
64. The project PANTEIA which was financed by the European Commission reported that Inland
Waterway Transport (IWT)in Europe is an efficient, safe and environmentally friendly mode of transport.
However, the previously undisputed competitive position of IWT in the field of emissions is increasingly being
contested. The gap between road transport and IWT is rapidly becoming smaller. A major concern thereby, is
the poor progress made on the emission of air pollutants with in particular, the emission of nitrogen oxides
(NOx) and particulate matter (PM). In contrast to the road haulage sector the emission standards for new
engines are much less stringent and the average lifetime of engines in inland vessels is very long.
DIESEL ENGINE EXHAUSTS: MYTHS AND REALITIES UNECE
25
Consequently, inland waterway transport already has higher air pollutant emission levels than road transport
per tonne kilometre for certain vessel types (Panteia 2013).
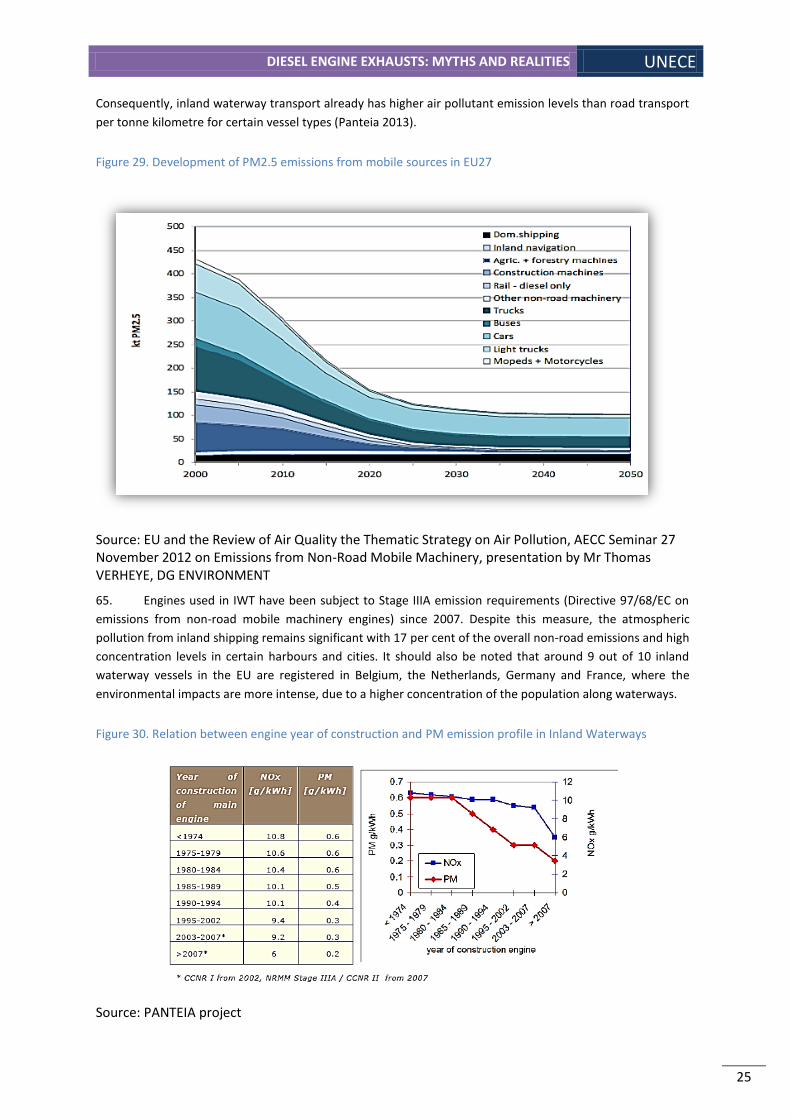
Figure 29. Development of PM2.5 emissions from mobile sources in EU27
Source: EU and the Review of Air Quality the Thematic Strategy on Air Pollution, AECC Seminar 27 November 2012 on Emissions from Non-Road Mobile Machinery, presentation by Mr Thomas VERHEYE, DG ENVIRONMENT
65. Engines used in IWT have been subject to Stage IIIA emission requirements (Directive 97/68/EC on
emissions from non-road mobile machinery engines) since 2007. Despite this measure, the atmospheric
pollution from inland shipping remains significant with 17 per cent of the overall non-road emissions and high
concentration levels in certain harbours and cities. It should also be noted that around 9 out of 10 inland
waterway vessels in the EU are registered in Belgium, the Netherlands, Germany and France, where the
environmental impacts are more intense, due to a higher concentration of the population along waterways.
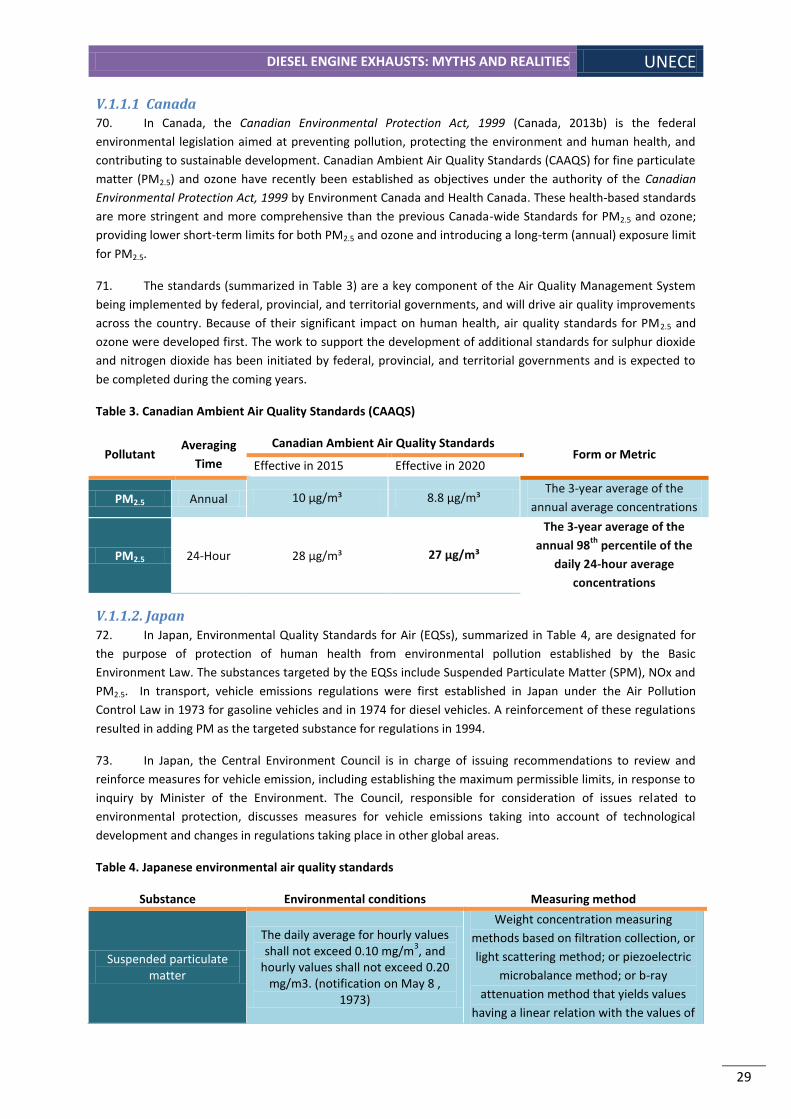
Figure 30. Relation between engine year of construction and PM emission profile in Inland Waterways
Source: PANTEIA project

DIESEL ENGINE EXHAUSTS: MYTHS AND REALITIES UNECE
26
Table 2. Number of IWT Vessels and average age of diesel engines
Country Total number of inland
navigation vessels
age of diesel engines
Num Age (years)
Austria 42 No information
Bulgaria 363
Up to 5 years 3
Up to 10 years 10
Up to 15 years 9
Up to 20 years 7
Up to 25 years 14
Up to 30 years 10
Up to 35 years 24
Up to 40 years 12
Up to 45 years 16
Up to 50 years 6
Over 50 years 26
Czech Republic 14,000 ≤ 25
France 1,395 No information
Lithuania 401 Avg 23 (1957 to
2012)
Luxembourg 39 Avg 37
Russia Federation 30,964 20,964 Avg 30
10,000 Avg 5
Serbia 939 270 Avg43
669 No information
Slovakia 207
27 1945 - 1960
58 1961 - 1970
75 1971 - 1980
32 1981 - 1990
15 1991 – up to now
Ukraine 1,325 No information
Source: UNECE, Working Party on Inland Waterways SC.3
66. The reduction of emission levels of IWT is stagnating in comparison to other modes, because the
innovation rate of engines for those modes is faster. The long lifetime of inland barge engines (30,000 to over

DIESEL ENGINE EXHAUSTS: MYTHS AND REALITIES UNECE
27
200,000 hours, depending on the engine type) results in a slow uptake of the new engines in the fleet.
Breakthrough and large-scale innovations are introduced at a relatively slow pace. The transport vehicles
used in inland waterways are self-propelled dry cargo and tank vessels, push boats, tugs and non-motorized
barges. Inland vessels thereby, have a longer life span than maritime vessels. Bulk vessels on the Rhine are on
average about 50 years old; the average age of liquid cargo ships is about 35 years. A pushed convoy on the
Danube has an average age of 20 years, with the exception of Serbia and Croatia, where the average age of
vessel units is more than 25 years. The pushed convoys of Romania and in particular Ukraine are by far the
largest and youngest on the Danube. In addition, engines of inland vessels have a longer lifespan in
comparison to other modes. According to the International Association the Rhine Ships Register (IVR), , 83
per cent of the vessels is equipped with an engine built before the year 2003 and therefore, has no limits with
respect to emission characteristics. The Central Commission for Navigation on the Rhine (CCNR) norms on
emissions apply since 2003 (CCNR-I) for new engines, while in road freight transport emission restrictions
have been in force since 1992 (Euro I) and Euro VI will be in force from 2014.
IV.2.4. A diesel engine emission scenario among the three inland transport modes.
67. The following scenario provides information on the environmental impacts of goods transported by
truck, rail and inland waterways – all using diesel engines - from Vienna, Austria to Budapest, Hungary. The
calculations are made by using the Ecological Transport Information Tool (EcoTransIT). EcoTransIT compares
the energy consumption, greenhouse gas and exhaust emissions of freight transported by rail, road, ship and
aircraft3.
3 www.ecotransit.org
Figure 31. Current emission standards for road transport and IWT:
NOx/PM
Source: PLATINA, 2012

DIESEL ENGINE EXHAUSTS: MYTHS AND REALITIES UNECE
28
Figure 32. Comparison analysis between road, rail and IWT PM emissions
Primary energy consumption
Particulate matter
68. Figure 32 illustrates the results of the scenario analysis. Road transport consumes more
diesel fuel to travel from Vienna to Budapest. However, Inland Waterways is by far the biggest
polluter regarding particulate matters with 0.64 kilograms comparing to 0.16 of road transport and
0.03 of rail transport.
V. International Agreements and regulations.
V.1. Policy approach to emissions at national and regional level
V.1.1. Governments focus.
69. Several national governments have developed national legislation to offer an umbrella or framework
regulation to monitor and improve air quality.
DIESEL ENGINE EXHAUSTS: MYTHS AND REALITIES UNECE
29
V.1.1.1 Canada 70. In Canada, the Canadian Environmental Protection Act, 1999 (Canada, 2013b) is the federal
environmental legislation aimed at preventing pollution, protecting the environment and human health, and
contributing to sustainable development. Canadian Ambient Air Quality Standards (CAAQS) for fine particulate
matter (PM2.5) and ozone have recently been established as objectives under the authority of the Canadian
Environmental Protection Act, 1999 by Environment Canada and Health Canada. These health-based standards
are more stringent and more comprehensive than the previous Canada-wide Standards for PM2.5 and ozone;
providing lower short-term limits for both PM2.5 and ozone and introducing a long-term (annual) exposure limit
for PM2.5.
71. The standards (summarized in Table 3) are a key component of the Air Quality Management System
being implemented by federal, provincial, and territorial governments, and will drive air quality improvements
across the country. Because of their significant impact on human health, air quality standards for PM2.5 and
ozone were developed first. The work to support the development of additional standards for sulphur dioxide
and nitrogen dioxide has been initiated by federal, provincial, and territorial governments and is expected to
be completed during the coming years.
Table 3. Canadian Ambient Air Quality Standards (CAAQS)
Pollutant Averaging
Time
Canadian Ambient Air Quality Standards Form or Metric
Effective in 2015 Effective in 2020
PM2.5 Annual 10 µg/m³ 8.8 µg/m³ The 3-year average of the
annual average concentrations
PM2.5 24-Hour 28 µg/m³ 27 µg/m³
The 3-year average of the
annual 98th
percentile of the
daily 24-hour average
concentrations
V.1.1.2. Japan
72. In Japan, Environmental Quality Standards for Air (EQSs), summarized in Table 4, are designated for
the purpose of protection of human health from environmental pollution established by the Basic
Environment Law. The substances targeted by the EQSs include Suspended Particulate Matter (SPM), NOx and
PM2.5. In transport, vehicle emissions regulations were first established in Japan under the Air Pollution
Control Law in 1973 for gasoline vehicles and in 1974 for diesel vehicles. A reinforcement of these regulations
resulted in adding PM as the targeted substance for regulations in 1994.
73. In Japan, the Central Environment Council is in charge of issuing recommendations to review and
reinforce measures for vehicle emission, including establishing the maximum permissible limits, in response to
inquiry by Minister of the Environment. The Council, responsible for consideration of issues related to
environmental protection, discusses measures for vehicle emissions taking into account of technological
development and changes in regulations taking place in other global areas.
Table 4. Japanese environmental air quality standards
Substance Environmental conditions Measuring method
Suspended particulate matter
The daily average for hourly values shall not exceed 0.10 mg/m
3, and
hourly values shall not exceed 0.20 mg/m3. (notification on May 8 ,
1973)
Weight concentration measuring
methods based on filtration collection, or
light scattering method; or piezoelectric
microbalance method; or b-ray
attenuation method that yields values
having a linear relation with the values of
DIESEL ENGINE EXHAUSTS: MYTHS AND REALITIES UNECE
30
the above methods
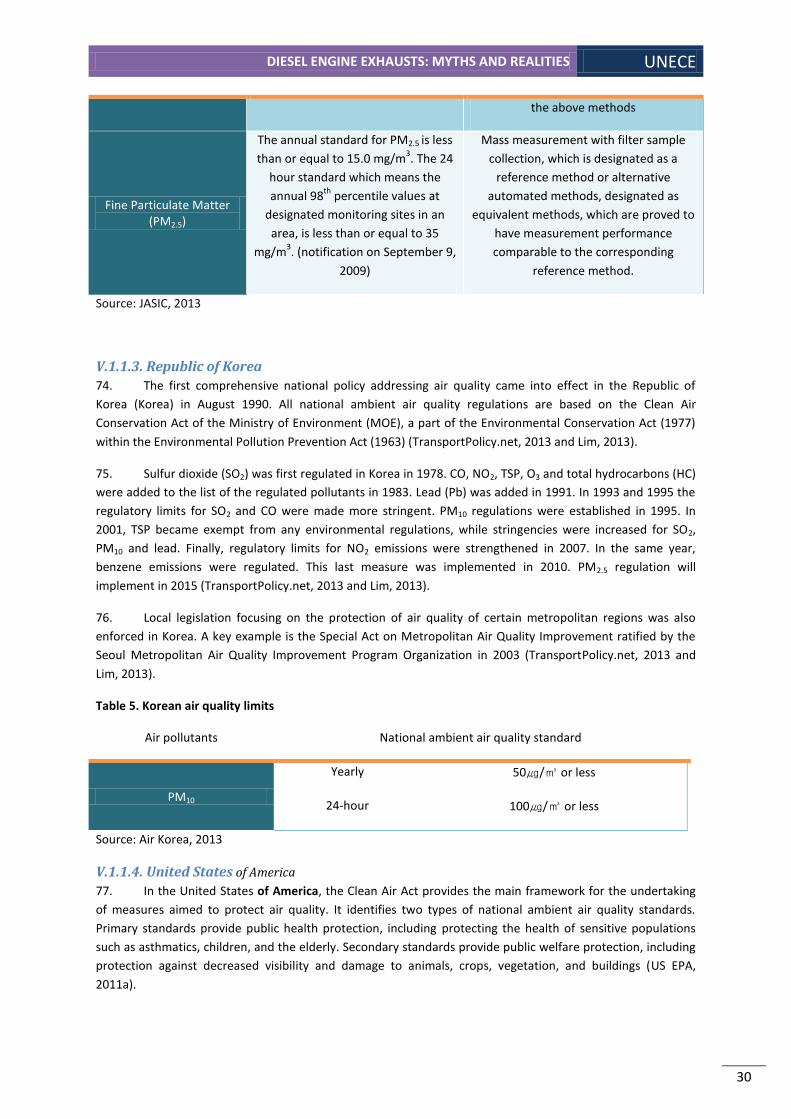
Fine Particulate Matter (PM2.5)
The annual standard for PM2.5 is less
than or equal to 15.0 mg/m3. The 24
hour standard which means the
annual 98th
percentile values at
designated monitoring sites in an
area, is less than or equal to 35
mg/m3. (notification on September 9,
2009)
Mass measurement with filter sample
collection, which is designated as a
reference method or alternative
automated methods, designated as
equivalent methods, which are proved to
have measurement performance
comparable to the corresponding
reference method.
Source: JASIC, 2013
V.1.1.3. Republic of Korea
74. The first comprehensive national policy addressing air quality came into effect in the Republic of
Korea (Korea) in August 1990. All national ambient air quality regulations are based on the Clean Air
Conservation Act of the Ministry of Environment (MOE), a part of the Environmental Conservation Act (1977)
within the Environmental Pollution Prevention Act (1963) (TransportPolicy.net, 2013 and Lim, 2013).
75. Sulfur dioxide (SO2) was first regulated in Korea in 1978. CO, NO2, TSP, O3 and total hydrocarbons (HC)
were added to the list of the regulated pollutants in 1983. Lead (Pb) was added in 1991. In 1993 and 1995 the
regulatory limits for SO2 and CO were made more stringent. PM10 regulations were established in 1995. In
2001, TSP became exempt from any environmental regulations, while stringencies were increased for SO2,
PM10 and lead. Finally, regulatory limits for NO2 emissions were strengthened in 2007. In the same year,
benzene emissions were regulated. This last measure was implemented in 2010. PM2.5 regulation will
implement in 2015 (TransportPolicy.net, 2013 and Lim, 2013).
76. Local legislation focusing on the protection of air quality of certain metropolitan regions was also
enforced in Korea. A key example is the Special Act on Metropolitan Air Quality Improvement ratified by the
Seoul Metropolitan Air Quality Improvement Program Organization in 2003 (TransportPolicy.net, 2013 and
Lim, 2013).
Table 5. Korean air quality limits
Air pollutants National ambient air quality standard
PM10
Yearly 50㎍/㎥ or less
24-hour 100㎍/㎥ or less
Source: Air Korea, 2013
V.1.1.4. United States of America
77. In the United States of America, the Clean Air Act provides the main framework for the undertaking
of measures aimed to protect air quality. It identifies two types of national ambient air quality standards.
Primary standards provide public health protection, including protecting the health of sensitive populations
such as asthmatics, children, and the elderly. Secondary standards provide public welfare protection, including
protection against decreased visibility and damage to animals, crops, vegetation, and buildings (US EPA,
2011a).

DIESEL ENGINE EXHAUSTS: MYTHS AND REALITIES UNECE
31
78. Under the Clean Air Act, EPA's Office of Air Quality Planning and Standards (OAQPS) is responsible for
setting the national ambient air quality standards (NAAQS) for pollutants which are considered harmful to
people and the environment (US EPA, 2011b).
79. The NAAQS set by the United States of America EPA for PM pollutants are summarized in Table 6.
Table 6. National Ambient Air Quality Standards in the United States of America
Pollutant Primary/ Seconary
Averaging Time
Level Form
Particlulate matter (PM)
PM2.5
primary Annual 12 μg/m
3 annual mean, averaged over 3 years
secondary Annual 15 μg/m3 annual mean, averaged over 3 years
primary &
secondary 24-hour 35 μg/m
3 98th percentile, averaged over 3 years
PM10 primary &
24-hour 150 μg/m3
Not to be exceeded more than once per year
on average over 3 years secondary
Source: US EPA, 2011a
V.1.1.5. European Union
80. The European Union (EU) set up a number of instruments aiming to avoid, prevent or reduce
harmful effects on human health and the environment as a whole. The policies in place limit the emissions of
air pollutants, and/or establish objectives for ambient air quality. Key legislative EU instruments include the
following:
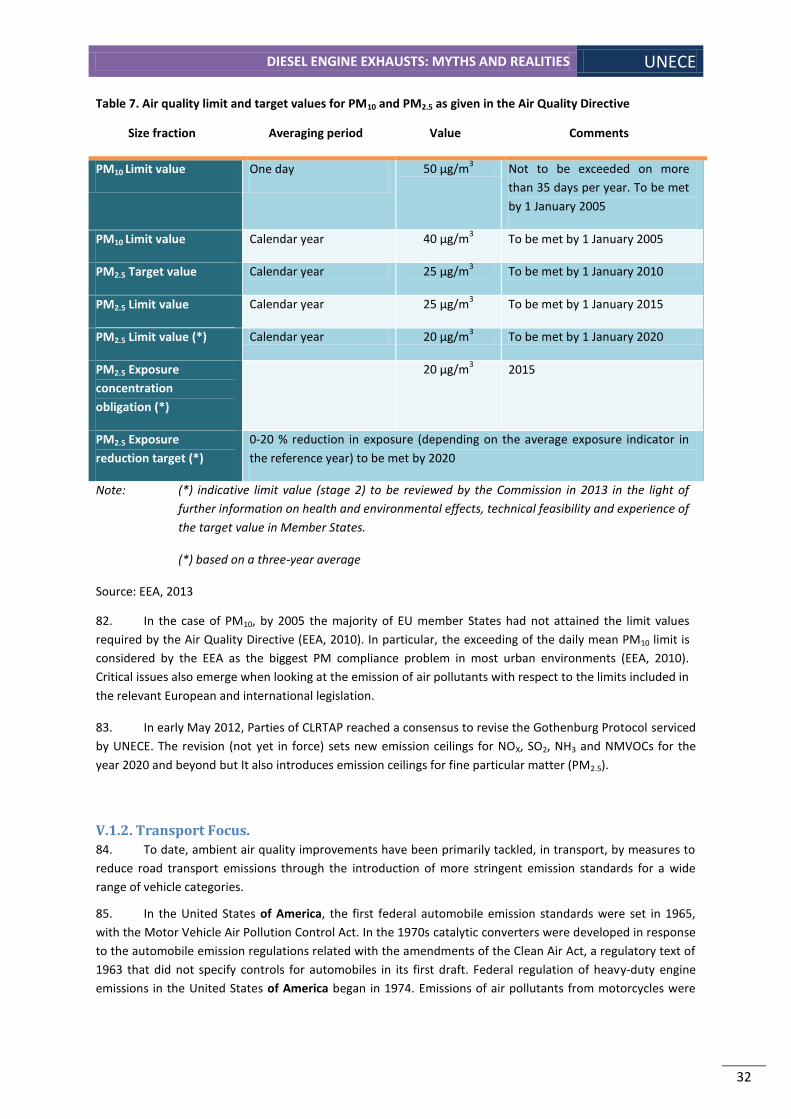
81. In 2008, the Air Quality Directive (EC, 2008) merged most of the existing legislation (EU Directive on
National Emission Ceilings, 2001, Sixth Environment Action Programme (6EAP) 2002, Thematic Strategy on Air
Pollution (EC, 2005)) on air quality (i.e. legislation targeting the ambient concentration of pollutants, with the
exception of target values for the concentration of arsenic, cadmium, nickel and benzo(a)pyrene in ambient
air) into a single directive, with no change to pre-existing air quality objectives. The Air Quality Directive also
introduced new air quality objectives for PM2.5 (fine particles), the possibility to discount natural sources of
pollution when assessing compliance against limit values, and the possibility for time extensions of three
years (PM10) or up to five years (NO2, benzene) for complying with limit values, based on conditions and the
assessment by the European Commission. The limit values for the protection of human health included in the
Air Quality Directive for PM10 and PM2.5 are reported in Table 7.
DIESEL ENGINE EXHAUSTS: MYTHS AND REALITIES UNECE
32
Table 7. Air quality limit and target values for PM10 and PM2.5 as given in the Air Quality Directive
Size fraction Averaging period Value Comments
PM10 Limit value One day 50 μg/m3 Not to be exceeded on more
than 35 days per year. To be met
by 1 January 2005
PM10 Limit value Calendar year 40 μg/m3 To be met by 1 January 2005
PM2.5 Target value Calendar year 25 μg/m3 To be met by 1 January 2010
PM2.5 Limit value Calendar year 25 μg/m3 To be met by 1 January 2015
PM2.5 Limit value (*) Calendar year 20 μg/m3 To be met by 1 January 2020
PM2.5 Exposure
concentration
obligation (*)
20 μg/m3 2015
PM2.5 Exposure
reduction target (*)
0-20 % reduction in exposure (depending on the average exposure indicator in
the reference year) to be met by 2020
Note: (*) indicative limit value (stage 2) to be reviewed by the Commission in 2013 in the light of
further information on health and environmental effects, technical feasibility and experience of
the target value in Member States.
(*) based on a three-year average
Source: EEA, 2013
82. In the case of PM10, by 2005 the majority of EU member States had not attained the limit values
required by the Air Quality Directive (EEA, 2010). In particular, the exceeding of the daily mean PM10 limit is
considered by the EEA as the biggest PM compliance problem in most urban environments (EEA, 2010).
Critical issues also emerge when looking at the emission of air pollutants with respect to the limits included in
the relevant European and international legislation.
83. In early May 2012, Parties of CLRTAP reached a consensus to revise the Gothenburg Protocol serviced
by UNECE. The revision (not yet in force) sets new emission ceilings for NOX, SO2, NH3 and NMVOCs for the
year 2020 and beyond but It also introduces emission ceilings for fine particular matter (PM2.5).
V.1.2. Transport Focus.
84. To date, ambient air quality improvements have been primarily tackled, in transport, by measures to
reduce road transport emissions through the introduction of more stringent emission standards for a wide
range of vehicle categories.
85. In the United States of America, the first federal automobile emission standards were set in 1965,
with the Motor Vehicle Air Pollution Control Act. In the 1970s catalytic converters were developed in response
to the automobile emission regulations related with the amendments of the Clean Air Act, a regulatory text of
1963 that did not specify controls for automobiles in its first draft. Federal regulation of heavy-duty engine
emissions in the United States of America began in 1974. Emissions of air pollutants from motorcycles were
DIESEL ENGINE EXHAUSTS: MYTHS AND REALITIES UNECE
33
first regulated in 1978. Non-road machinery emissions were first regulated in 1994. Amendments and revisions
tightened earlier standards with the aim to ameliorate problems related to air pollution (Jacobson, 2013).
86. Similarly, in Canada, progressively more stringent emission standards have been in place for on-road
and off-road vehicles since 1971.
87. In the EU, the first introduction of measures to be taken against air pollution by emissions from motor
vehicles (Euro 0) dates back to 1970 for light vehicles (Directive 70/220/EEC), the late 1980s (Directive
88/77/EEC) for heavy-duty engines, and the late 1990s for two wheelers and non-road mobile machinery. In
the early 1990s, the "Euro" regulations were first enforced for light vehicles and heavy-duty engines. Updates
were introduced in the years following the first introduction of regulatory measures for all vehicles and engine
categories (TransportPolicy.net, 2013).
88. In Japan, emission limits for light vehicles were first established in 1973. Diesel emission regulations
for heavy commercial vehicles were first enforced in 1974 (JASIC, 2013). Emissions from non-road machinery
were first applied in 2003. As in the case of other developed countries, the regulatory limits have been
tightened over the years. The maximum permissible limit values of emissions from road transport are now
prescribed by the Road Vehicles Act. The Ministry of Land, Infrastructure, Transport and Tourism enforces the
Road Vehicles Act, which prescribes the limit value in consideration of Air Pollution Control Law.
89. Similar regulations on the emissions of air pollutants have also been enforced in transition economies,
to varying degrees.
(a) The limits used for Chinese regulatory measures are similar to European regulations, with a delay in
their implementation and enforcement. In China, nationwide emission controls for light vehicles
began in the late 1990s. China regulates heavy-duty emission since 2001, non-road machinery since
2002, and two wheelers since 2003 (TransportPolicy.net, 2013).
(b) India began to lower the pollution emission limits for road vehicles since 2001, also using European
regulations as a reference. Non-road vehicle emissions in India were first addressed in 1999
(agricultural tractors) and 2007 (construction equipment). Two and three-wheeler emissions
regulations were first enforced in 1991. In the case of two- and three-wheelers, Indian regulations are
not aligned with the European ones (TransportPolicy.net, 2013).
(c) Since 1988, Brazil used to adopt emission regulations for light vehicles that were equivalent to those
applied in the EU. The regulations have been revised and tightened in following years. Emissions from
non-road mobile machinery in Brazil were first regulated in 2011, using the US regulation as a basis.
These limits will be effective between 2015 and 2019. Brazilian standards are used as a base by
neighbouring South American countries (TransportPolicy.net, 2013).
(d) Mexican emission requirements for light and heavy-duty vehicles became effective in 1993. Emission
regulations were tightened in following years, using European and US limit values as a reference
(TransportPolicy.net, 2013).
90. In recent years, the introduction of vehicle emission standards was accompanied by parallel
legislations that established limits for fuel parameters. This is especially relevant for the sulphur content of
fuels, since sulphur in fuels can impair the effectiveness of vehicle technologies for air pollution mitigation
such as three-way catalytic converters, oxidation catalysts, NOX traps and particulate filters.
91. Looking specifically at cleaner fuels, the Partnership for Cleaner Fuels and Vehicles of the United
Nations Environment Program (UNEP-PCFV) was launched in 2002.. The UNEP-PCFV has focused its activities
on the elimination of lead in gasoline, the phase down of sulphur in diesel and gasoline fuels, concurrent with
the adoption of cleaner vehicle technologies.
DIESEL ENGINE EXHAUSTS: MYTHS AND REALITIES UNECE
34
V.1.3. Diesel engine exhausts focus
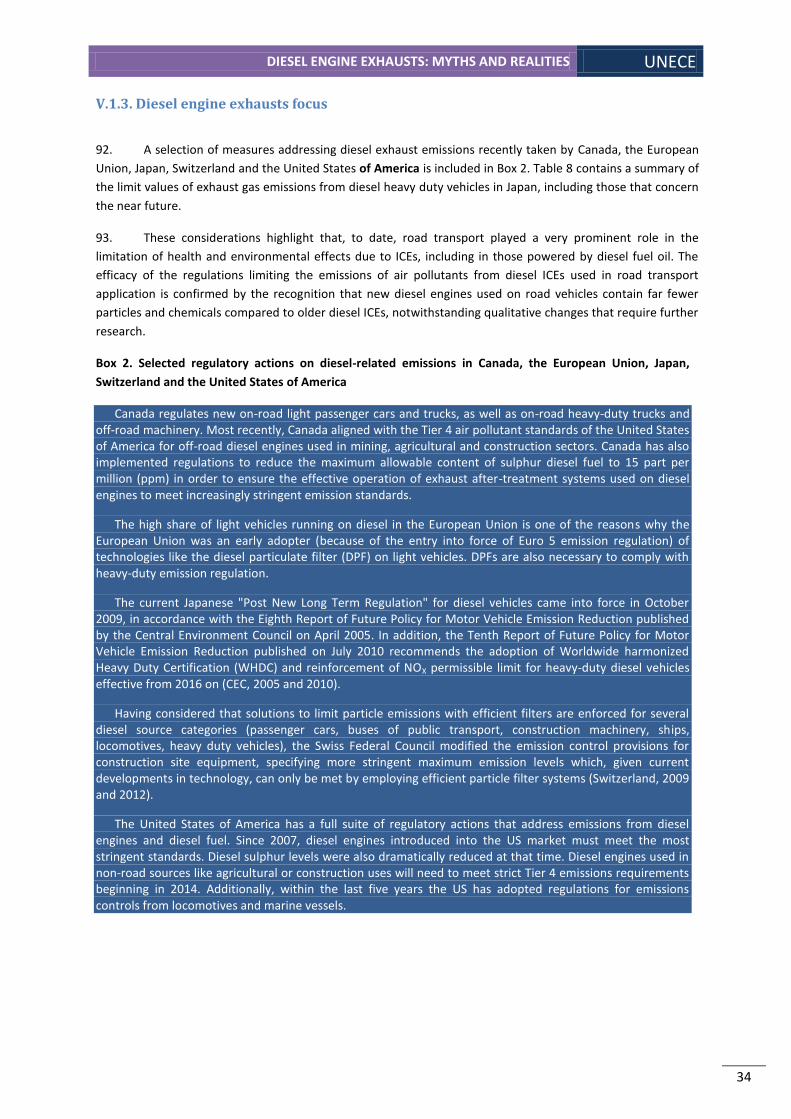
92. A selection of measures addressing diesel exhaust emissions recently taken by Canada, the European
Union, Japan, Switzerland and the United States of America is included in Box 2. Table 8 contains a summary of
the limit values of exhaust gas emissions from diesel heavy duty vehicles in Japan, including those that concern
the near future.
93. These considerations highlight that, to date, road transport played a very prominent role in the
limitation of health and environmental effects due to ICEs, including in those powered by diesel fuel oil. The
efficacy of the regulations limiting the emissions of air pollutants from diesel ICEs used in road transport
application is confirmed by the recognition that new diesel engines used on road vehicles contain far fewer
particles and chemicals compared to older diesel ICEs, notwithstanding qualitative changes that require further
research.
Box 2. Selected regulatory actions on diesel-related emissions in Canada, the European Union, Japan,
Switzerland and the United States of America
Canada regulates new on-road light passenger cars and trucks, as well as on-road heavy-duty trucks and off-road machinery. Most recently, Canada aligned with the Tier 4 air pollutant standards of the United States of America for off-road diesel engines used in mining, agricultural and construction sectors. Canada has also implemented regulations to reduce the maximum allowable content of sulphur diesel fuel to 15 part per million (ppm) in order to ensure the effective operation of exhaust after-treatment systems used on diesel engines to meet increasingly stringent emission standards.
The high share of light vehicles running on diesel in the European Union is one of the reasons why the European Union was an early adopter (because of the entry into force of Euro 5 emission regulation) of technologies like the diesel particulate filter (DPF) on light vehicles. DPFs are also necessary to comply with heavy-duty emission regulation.
The current Japanese "Post New Long Term Regulation" for diesel vehicles came into force in October 2009, in accordance with the Eighth Report of Future Policy for Motor Vehicle Emission Reduction published by the Central Environment Council on April 2005. In addition, the Tenth Report of Future Policy for Motor Vehicle Emission Reduction published on July 2010 recommends the adoption of Worldwide harmonized Heavy Duty Certification (WHDC) and reinforcement of NOX permissible limit for heavy-duty diesel vehicles effective from 2016 on (CEC, 2005 and 2010).
Having considered that solutions to limit particle emissions with efficient filters are enforced for several diesel source categories (passenger cars, buses of public transport, construction machinery, ships, locomotives, heavy duty vehicles), the Swiss Federal Council modified the emission control provisions for construction site equipment, specifying more stringent maximum emission levels which, given current developments in technology, can only be met by employing efficient particle filter systems (Switzerland, 2009 and 2012).
The United States of America has a full suite of regulatory actions that address emissions from diesel engines and diesel fuel. Since 2007, diesel engines introduced into the US market must meet the most stringent standards. Diesel sulphur levels were also dramatically reduced at that time. Diesel engines used in non-road sources like agricultural or construction uses will need to meet strict Tier 4 emissions requirements beginning in 2014. Additionally, within the last five years the US has adopted regulations for emissions controls from locomotives and marine vessels.

DIESEL ENGINE EXHAUSTS: MYTHS AND REALITIES UNECE
35
Table 8. Limit values of exhaust gas emissions from diesel heavy duty vehicles in Japan
94. Some of the opportunities to further reduce emissions are available on stationary engines and the
in-use mobile fleet, since older in-use diesel engines and vehicles can remain in operation for over 20
years. Such measures include retrofitting or removing the older in-use fleet off the road to ensure that newer
engines and vehicles, which are compliant with more recent air pollutant regulations, have a chance to lead
to improved health and environmental outcomes. Some initiatives in this area have already been undertaken
by a number of governments. In particular, the Government of Canada is the co-chair of a pan-Canadian
working group which holds discussions on reducing emissions from the in-use fleet. The working group has
identified off- and on-road diesel emissions as a concern and is now looking at discrete initiatives to achieve
reductions in this area over the next 3 years.
95. In some high exposure areas, there might be the need to set up policy measures aimed at replacing
vehicles equipped with older engine technologies with new vehicles complying with the new regulations or to
retrofit the engines with appropriate emission control devices. In this respect, countries like Canada and the
United States of America are looking at initiatives aimed at exploring the financing options that can help
support heavy-duty fleets to further reduce air pollutant emissions by making the purchase of emission
reduction technologies for their in-use fleets more feasible and affordable.
96. In road transport, accelerating the worldwide rate of introduction of cleaner and more efficient
vehicle technology remains hugely important. Equally important is the parallel introduction of low sulphur
diesel fuels.
97. Regulatory measures aiming to limit pollution from road transport applications were not frequently
mirrored by comparable measures in other transport modes and in other economic domains, such as
residential and commercial/institutional sector. This is especially relevant when looking at pollutants associated
with modern diesel exhausts (namely PM and NOX), since substantial amounts of diesel and residual fuel oil are
combusted in applications widely employed in the energy, industry and residential/commercial sector, and
since a significant fraction of these emissions (namely those originating in the residential and commercial
sector, which is responsible for the largest fraction of PM emissions) is likely to insist on urban agglomerations,
i.e. the areas subject to the largest exposure to air pollution.
1974 1977 1979 1983 1988 1994 1997 2003 2004 2005 2009 2016**
Test WHTC
Unit
CO 790 790 790 790 790 7.4 7.4 2.22 2.22 2.22 2.22 2.22
HC* 510 510 510 510 510 2.9 2.9 0.87 0.87 0.87 0.87 0.87
NOX 770 650 540 470 400 6 4.5 3.38 3.38 2 0.7 0.4
PM - - - - - 0.7 0.25 0.18 0.18 0.03 0.01 0.01
6M 13M JE05
g/kWh
Notes:
ppm
* From 2005 HC is changed to NMHC (Non Methane Hydro-Carbon).
** From 2016 Cold Start will be introduced and the weighting factor of Hot start is 86% while the weighting factor of Cold start is 14%.

DIESEL ENGINE EXHAUSTS: MYTHS AND REALITIES UNECE
36
VI. Inland Transport Committee activities
VI.1. Introduction
98. UNECE World Forum for Harmonization of Vehicle Regulations (WP.29) has already done extensive
work in the field of air pollution containment, with major achievements towards reducing the emissions of air
pollutants from all motor vehicle engines. This work largely benefitted from on the regulatory initiatives
undertaken by the European Union. The work undertaken at the UNECE was particularly relevant to make
significant progress on technical matters, including those concerning the test procedures that are required for
the enforcement of emission control legislation.
VI.1.1. Common test procedures
99. In 1997, a process aimed at the worldwide test cycle harmonization for heavy-duty engines started.
This began with the creation, under the Working Party on Pollution and Energy (GRPE, a subsidiary body of
WP.29), of a working group on the Worldwide Heavy-Duty Certification procedure (WHDC). The work of this
group resulted in the establishment, in 2006, of a harmonized UN Global Technical Regulation (UN GTR No. 4)
on the certification procedure for heavy-duty engines (UNECE, 2013a). This regulatory text provides a common
basis, at global level, for measuring the performance of existing and future heavy-duty engines in terms of
emissions of gaseous pollutants and particulate matter. The UN GTR contains two representative test cycles (a
transient test cycle (WHTC) with both cold and hot start requirements and a hot start steady state test cycle
(WHSC)), closely reflecting world-wide on-road heavy-duty engine operation (a marked improvement in
comparison with earlier approaches).
100. In 2001, the working group worldwide-harmonized Heavy duty On-Board Diagnostics (WWH-OBD)
was established to develop harmonized prescriptions for technical requirements for on-board diagnostic
systems for road vehicles. This activity (now concluded) led to the adoption, in 2006, of the UN GTR No. 5
(UNECE, 2013b), a regulatory text that is directed at OBD requirements for heavy-duty engines/vehicles that
are necessary to maintain emissions-related performance (i.e. emissions-OBD). The text is structured in a
manner that facilitates a wider application of OBD to other vehicle systems in the future.
101. In 2001, WP.29 created the working group on Off-Cycle Emissions (OCE) with the aim to ensure that
off-cycle emissions from heavy-duty engines and vehicles are appropriately controlled over a broad range of
engine and ambient operating conditions potentially encountered during in-use vehicle operation and falling
outside of the scenarios foreseen by WHDC. This work resulted in the adoption, in 2009, of the UN GTR No. 10
(UNECE, 2013c), a text that was designed to be applicable to engines certified or type approved under the test
procedures of UN GTR No. 4 on the Worldwide harmonized Heavy Duty Certification (WHDC).
102. The work initiated for the UN GTR No. 4 and continued with UN GTRs Nos. 5 and 10 is now being
brought forward by the informal working group on Heavy Duty Hybrids (HDH), established in 2010 to develop
new provisions for a hybrid specific engine cycle for the measurement of pollutants and CO2 emission from
heavy-duty hybrids. The focus of this group is again on the development of a test procedure, in order to keep
providing a common technical basis to the Parties having an interest to regulate the emissions of pollutants
and CO2 from heavy-duty vehicles. The HDH working group is expected to finalize its work by the end of 2013.
103. In 2003 for Non-Road Mobile Machinery (NRMM) a working group was created (under WP.29/GRPE)
aiming to develop new worldwide harmonized provisions for NRMM engines. Similarly to the case of heavy
duty vehicles and UN GTR No. 4, the work of the NRMM group led to the establishment, in 2009, of the UN
GTR No. 11 (UNECE; 2013e), containing a common test procedure on the measurement of emissions of
gaseous pollutants (NOX, CO, HC, particles) from NRMM compression-ignition engines.
DIESEL ENGINE EXHAUSTS: MYTHS AND REALITIES UNECE
37
104. The development of a regulatory text with a Worldwide harmonized Light vehicles Test Procedure
(WLTP), covering the measurement procedure for the emissions of gaseous pollutants (NOX, CO, HC) and
particles, as well as fuel consumption and the emissions of CO2, started in 2007, with the creation of a working
group under GRPE. In 2009, a proposal for the development of a UN GTR was adopted. By 2010, the work of
the WLTP groups was organized in sub-groups. Some of the activities originally planned, such as those
concerning Mobile Air Conditioning systems, were considered as a parallel work stream to the main
development of the regulatory text and the related test procedures. The WLTP drafted a preliminary text for
the UN GTR on the light vehicle test (UNECE; 2013f) and is expected to deliver, by 2014, the final regulatory
framework containing harmonized test procedures to enable the certification of existing and future light
vehicles technologies.
VI.2. Regulations setting limit values for pollutant emissions
105. UN Regulations Nos. 49 (heavy duty vehicles) (UNECE, 2013g) and 83 (light vehicles) (UNECE, 2013h)
specify limit values for emissions of particulate matter (expressed, in the last updates, both in terms of
particulate mass and particle number), carbon monoxide, hydrocarbons (also specifying the part of non-
methane hydrocarbons, in the last updates) and oxides of nitrogen. They build on the emission regulations
enforced in the European Union (Euro pollutant emission standards, enacted through directives and, in recent
years, regulations). Tables 9a and 9b summarize the evolution of emission limits of CO, HC, NOX, and PM for
light vehicles (both for the transport of passengers and goods), since the Euro 1 norms, also specifying the EU
regulatory text and the corresponding version of the UN Regulation No. 83 that contain provisions on the
different sets of limit values. Tables 10a and 10b provide a similar summary for heavy-duty vehicles regulated
by UN Regulation No. 49.
106. Similar limit values, for carbon monoxide (CO), hydrocarbons, NOX and PM, have been enforced for
engines of non-road mobile machinery (UN Regulation No. 96) (UNECE, 2013i), i.e. engine fitted to self-
propelled machinery including agricultural/forestry tractors, construction equipment and industrial
equipment. The current limit values for the pollutant emissions of non-road mobile machinery depend on the
net power of the engine. For PM, they range between 0.025 g/kWh (large engines) and 0.8 g/kWh (small
ones). NOX limits range between 2 g/kWh (lowered to 0.4 g/kWh for a large part of the power range,
commencing from 2014) and 8 g/kWh. For CO, the limits are set between 3.5 g/kWh and 5.5 g/kWh.
Hydrocarbon emission limits range between 0.19 g/kWh and 1.5 g/kWh.

DIESEL ENGINE EXHAUSTS: MYTHS AND REALITIES UNECE
38
Table 9a. Emission limits for light vehicles
Table 9b. Regulatory texts for light vehicles
107. In 2010, WP.29/GRPE established an informal working group on Retrofit Emission Control devices
(REC) to evaluate harmonized requirements for the treatment of diesel exhaust emissions with the aim to
develop a new UN Regulation for REC to be installed on heavy-duty vehicles, non-road mobile machinery and
tractors already in use. The activities of the group follow a number of initiatives aiming to contain pollutant
emissions, including in particular the adoption of low emission zones. The technical work of the REC group will
address the need for defined performance requirements for retrofit emission control devices, delivering
uniform provisions applicable to vehicles engaged in cross-border transport and fostering the market entry of
these new technologies. The text of the new UN Regulation on REC has been finalized and the performance-
oriented requirements have been established in November 2013 (UNECE, 2013j).
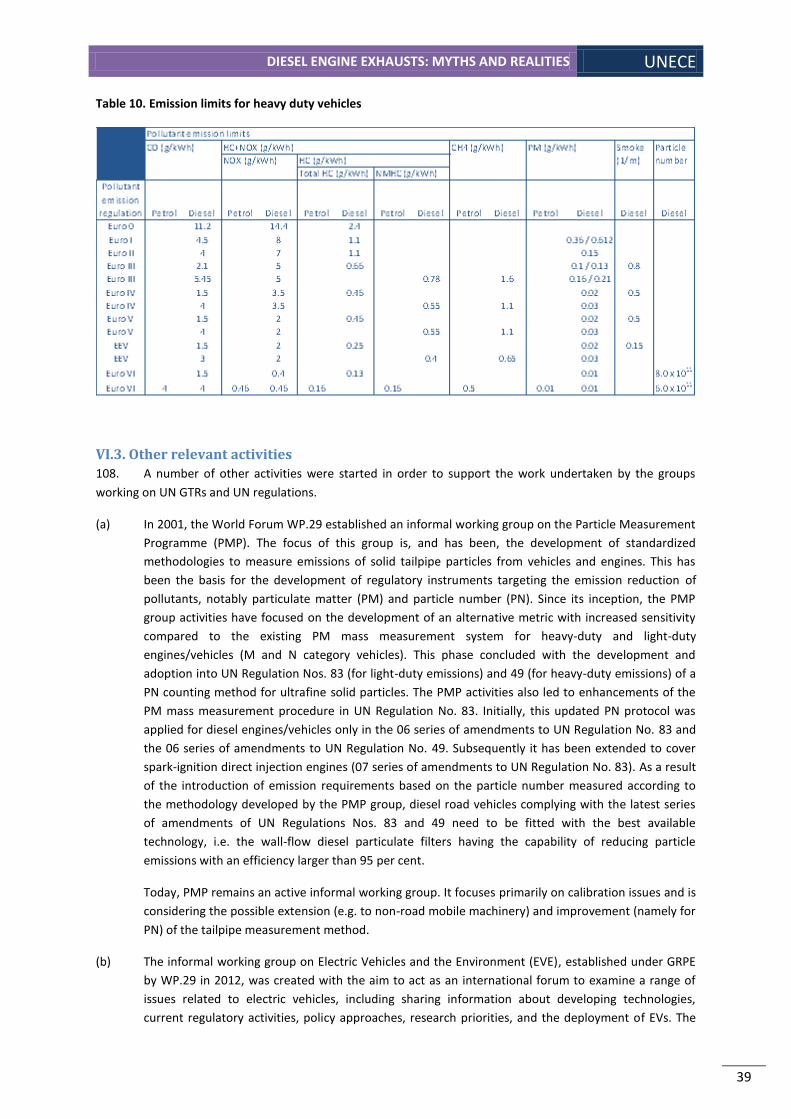
DIESEL ENGINE EXHAUSTS: MYTHS AND REALITIES UNECE
39
Table 10. Emission limits for heavy duty vehicles
VI.3. Other relevant activities
108. A number of other activities were started in order to support the work undertaken by the groups
working on UN GTRs and UN regulations.
(a) In 2001, the World Forum WP.29 established an informal working group on the Particle Measurement
Programme (PMP). The focus of this group is, and has been, the development of standardized
methodologies to measure emissions of solid tailpipe particles from vehicles and engines. This has
been the basis for the development of regulatory instruments targeting the emission reduction of
pollutants, notably particulate matter (PM) and particle number (PN). Since its inception, the PMP
group activities have focused on the development of an alternative metric with increased sensitivity
compared to the existing PM mass measurement system for heavy-duty and light-duty
engines/vehicles (M and N category vehicles). This phase concluded with the development and
adoption into UN Regulation Nos. 83 (for light-duty emissions) and 49 (for heavy-duty emissions) of a
PN counting method for ultrafine solid particles. The PMP activities also led to enhancements of the
PM mass measurement procedure in UN Regulation No. 83. Initially, this updated PN protocol was
applied for diesel engines/vehicles only in the 06 series of amendments to UN Regulation No. 83 and
the 06 series of amendments to UN Regulation No. 49. Subsequently it has been extended to cover
spark-ignition direct injection engines (07 series of amendments to UN Regulation No. 83). As a result
of the introduction of emission requirements based on the particle number measured according to
the methodology developed by the PMP group, diesel road vehicles complying with the latest series
of amendments of UN Regulations Nos. 83 and 49 need to be fitted with the best available
technology, i.e. the wall-flow diesel particulate filters having the capability of reducing particle
emissions with an efficiency larger than 95 per cent.
Today, PMP remains an active informal working group. It focuses primarily on calibration issues and is
considering the possible extension (e.g. to non-road mobile machinery) and improvement (namely for
PN) of the tailpipe measurement method.
(b) The informal working group on Electric Vehicles and the Environment (EVE), established under GRPE
by WP.29 in 2012, was created with the aim to act as an international forum to examine a range of
issues related to electric vehicles, including sharing information about developing technologies,
current regulatory activities, policy approaches, research priorities, and the deployment of EVs. The

DIESEL ENGINE EXHAUSTS: MYTHS AND REALITIES UNECE
40
EVE group is currently developing a global EV Regulatory Reference Guide that will compile
requirements (voluntary, regulatory, etc.) for hybrid, plug-in and electric vehicles for Contracting
Parties and WP.29 informal working groups.
VI.4. Emission regulations and fuel quality parameters
109. Since 2012, the Special Resolution No. 1 (UNECE, 2013k) and the Consolidated Resolution on the
Construction of Vehicles (R.E.3) (UNECE, 2013l), developed in the framework of the 1998 Agreement on UN
Global Technical Regulations and the 1958 Agreement concerning the Adoption of Uniform Technical
Prescriptions, administered by WP.29, contain recommendations developed to guide Governments on
appropriate market fuel quality that is protective of vehicle emission control technologies.
VII. Conclusions and recommendations.
VII.1. Conclusions 110. Diesel fuels are used in many areas of the economy. Farming, mining, forestry and timber industry,
construction, as well as the transport sector rely on diesel fuel. Within transport, freight delivery in most
inland modes today cannot be imagined without the use of diesel. Maritime transport is also a heavy user of
diesel. In addition, bus transit systems both in urban and inter-urban areas are mostly run by diesel driven
vehicles. Consequently, as the economy grows,
more farm and timber machinery is required to produce ever larger amounts of food and wood, and
to increase the productivity and competitiveness of agriculture and forestry economies;
more construction equipment is required to make buildings and to build infrastructure;
more heating boilers will be used to heat houses and buildings;
more trucks, locomotives, and ships are required to move the increasing volume of goods;
more vehicles for public transport/mass transit are to be put in operation to satisfy the increasing
need for mobility in a sustainable manner.
111. While the use of diesel engines has an obvious productive role in national economies, they have
negative externalities, they have a harmful effect on human health. Emissions, especially the microscopic soot
known as particulate matter (PM) from diesel engines in trucks, boats, locomotives, buses, agricultural and
forestry tractors, construction and household equipment can cause serious health problems for adults and
have extremely harmful effects on children and the elderly.
112. In 2012, the World Health Organization’s International Agency on Research on Cancer (IARC)
concluded that diesel engine exhaust is carcinogenic to humans. Research experiments carried out in closed
areas, i.e. indoor sent warning signals and urged people worldwide to reduce their exposure to diesel fumes
as much as possible.
113. Exposure to diesel exhaust gases is complex and due to many resources: stationary sources (e.g.
power and motion generators used in the energy industry), mobile sources (e-g- different modes of transport,
road vehicles, diesel trains and ships). Still diesel driven road vehicles have got in the centre of attention to
the extent that they have become “demonised”.
114. Trends and statistical analysis made by the European Commission, the United States of America and
other countries show that road transport and other modes of transport are not the biggest emitters of
particulate matter among the economic sectors. In fact, road transport counts for only three per cent of diesel
emissions in the United States of America and 15 per cent in the European Union.
DIESEL ENGINE EXHAUSTS: MYTHS AND REALITIES UNECE
41
115. Based on EEA data analysis, the commercial, institutional and household sector emerged as the most
important source of PM2.5 and PM10, with 52 per cent and 41 per cent, respectively. Domestic fuel use in the
residential category '1 A 4 b i — Residential: Stationary plants' is the most important key category for PM2.5
emissions, making up 45 per cent of total PM2.5 emissions.
116. Despite its relative low share in particulate matter emissions, the transport sector has taken
consistent measures to significantly limit its negative effects. The reduction in overall emissions of particulate
matter between 1990 and 2010 was mainly due to the introduction or improvement of abatement measures
across the transport sector, including the strict restrictions. As vehicle technologies are further improved and
stationary fuel combustion emissions are controlled through abatement or use of low-sulphur fuels, such as
natural gas, emissions of primary PM10 are expected to further decrease in the future. The introduction of
particle filters on new vehicles; the introduction of three way catalytic converters for petrol-fuelled cars; and
the introduction of exhaust particle traps for diesel HGVs to meet emission standards EURO V are some of the
factors that have contributed to the reduction of both primary PM10 and secondary particulate matter
emissions.
117. The share of other inland transport modes, such as railways and inland waterways (non-road
transport), is less than 1.5 per cent compared to the other economic sectors. Exhaust emissions from rail diesel
traction in Europe (EU27 & EFTA) are generally very low. European railways are committed to reducing their
total exhaust emissions of nitrogen oxides (NOx) and PM by 40 per cent by 2030. The introduction of cleaner
engine technologies; a smaller diesel locomotive fleet and lower mileages of old vehicles with old engines; a
more efficient operation of diesel locomotives and wider application of diesel multiple units (DMU); as well as
the continued electrification of railway lines (e.g. EU TEN-T corridors) are some of the main factors that will
contribute to the further decrease of railways PM emissions.
118. Contrary to road and rail transport, inland waterways have not done much progress on emissions
reduction. A major concern therein, is the poor progress made on the emission of air pollutants particularly
the emissions of NOx and PM. In contrast to the road haulage sector, the emission standards for new engines
in Inland Waterway Transport (IWT) are much less stringent and the average lifetime of engines in inland
vessels is very long. The share of IWT in the PM emissions comparing to other sectors is very low (1 per cent),
however further actions should be taken to speed up the introduction of new engines and stricter emissions
limitations and targets.
119. From the data and facts mentioned above, we conclude with a high degree of reliability that it is
misleading to claim that people’s exposure to diesel engines of road motor vehicles is the cause of increased
risk of lung cancer. 83 per cent of particulate matters emissions in European Union countries (EEA, 2012a)
and 97 per cent in the United States of America (EPA 2013) and Canada, is generated by other economic
sectors, mainly the commercial, institutional and household sector. Therefore, the claim that emissions from
diesel engine exhausts from road transport are the main cause of lung cancer in humans needs to be
seriously challenged. It does not mean however, that measures to improve the environmental performance
of the transport sector can stop. On the contrary, they must continue and in an aggressively well targeted
way.
120. It also need to be mentioned that in other sectors, such as the household and
commercial/institutional sector, legislative initiatives have been undertaken with less frequency and with
lower ambitions than in road transport. One of the few examples of legislative action in the residential and
commercial area is from Germany, where new, small firing installations, such as stoves, are subject to
regulatory requirements, and where the same legislative framework requires the modernization of existing
installations of the same kind (BMU, 2010).

DIESEL ENGINE EXHAUSTS: MYTHS AND REALITIES UNECE
42
121. Thus to improve the quality of air around us more attention must be given to the primary PM
emitters.
122. Despite the measures taken, it is expected that within many of the urban areas across the EU, PM10
concentrations will still be well above the EU air quality limit value. Further substantial reductions in emissions
will therefore be needed if the limit value set in the EU's Air Quality Directive is to be reached. The 2012
revision of the Gothenburg Protocol to the UNECE LRTAP Convention set emission reduction targets for PM2.5
based on 2005 emission totals, to be met by countries in or before 2020. By 2010, average annual reductions
of PM2.5 emissions in thirteen EEA-32 countries were greater than that required to achieve their targets by
2020, and five countries had already achieved the reductions specified in the protocol. Therefore, more
strategically targeted actions should be taken.
123. In summary, the following conclusions are drawn:
(a) Diesel engines emissions in the air are carcinogenic to humans based on scientific research evidence;
the emission of particulate matters is the most dangerous for humans health; the danger is the
highest in closed areas, such as in-door and in areas with inadequate ventilation;
(b) Diesel engines are currently at the heart of economic growth and of all economic activity and,
therefore, it is not feasible to replace and eliminate them at this stage;
(c) Transport is only one of the sectors using diesel engines. Industrial, agricultural, timber, commercial,
institutional and household sector are some of the other economic sectors that use diesel engines;
(d) The commercial, institutional and household sectors are the most important source of PM2.5 and
PM10 ;
(e) The transport sector is by far not the most significant source of PM emissions, nonetheless up till
now it has been the most rigorous in introducing measures to address this issue;
(f) The transport sector is the most regulated sector where the most intensive initiatives and actions
have been taken. Decisions and performance oriented emission regulations have been adopted that
set limits and targets resulting in the dramatic decrease in PM and other emissions;
(g) Other economic sectors are lagging behind in their initiatives, strategies and actions to address their
share of PM and pollutants emissions.
VII.2 Recommendations
124. Four tracks of actions are recommended:
(a). improved modal split, particularly from individual to public transport in personal mobility and from
roads to rail in long term freight;
(b). improved environmental performance at micro level, i.e. in local freight distribution and movement,
as well as in local passenger transport and mobility;
(c). development of new technologies (vehicle, fuel, traffic management) and global norms and
standards;
(d). acceleration of fleet or at least engine renewal;
125. A. improved modal split, particularly from individual to public transport in personal mobility and from
roads to rail in long term freight;
126. Improvement of public transport, promotion of walking and biking are desired measures to reduce the
use of personal cars. Walking and biking requires appropriate infrastructure to be put in place, which can
be at relatively low cost, but the benefits in terms of impact on health and quality of life are huge. Public
transport on the other hand offers a massive solution both for individual mobility, its environmental
performance and also in reducing congestion. It is also attractive from an economic sustainable
perspective since public transport provides more capacity at less marginal cost Well designed and well-
DIESEL ENGINE EXHAUSTS: MYTHS AND REALITIES UNECE
43
linked modal structure for urban, sub-urban, regional and national public transport using buses, light rail
transit, metro, suburban rail can be a feasible mitigation option for the transport sector.
127. Long distance freight movement definitely favours railways provided the railways services are competitive
for which both investments and reforms may be warranted.
128. B. improved environmental performance at micro level, i.e. in local freight distribution and movement, as
well as in local passenger transport and mobility;
129. More than half of the world's air pollution comes from urban areas. Cities do have their own
microclimates. A number of cities around the world have shown visionary leadership in setting targets and
devising and implementing plans to reduce air pollution. Cities in developed countries as well as in
developing countries offer a wealth of experience regarding good practices and innovative approaches in
this area that other cities can learn from and follow.
130. Urban activities are the leading cause of climate change, and transportation is one of the biggest energy
user. While the transportation sector is one of the contributors to air pollution in urban regions, it should
be noted that vehicles do not operate on their own. Individual travel behaviour and our decisions on when
and how much to drive are subject to the built environment and the transportation options available to
us. Land use and transportation funding policies heavily influence our travel behaviour and travel choices.
Studies show that mixed-use neighbourhood with adequate pedestrian and bicycle facilities linked to
transit services is more likely to be a city with fewer car trips and a greater amount of trips by walking,
cycling, and transit. If, however, funding policies favour road capacity expansion and single-use
development with plentiful parking over compact mixed-use developments and public transportation
(walking, bicycling, transit), then higher levels of single-occupancy vehicle use are inevitable. The
relationship between land use and transportation is closely linked, and it will take bold leadership to
ensure that funding policies support that linkage and provide adequate transportation choices to the
public. Comprehensive, sustainable mobility strategies demand a broad set of coordinated policies that
are beyond transport agencies’ traditional responsibilities.
131. Fuel consumption of vehicles can be also reduced through changes in driving practices. Fuel-efficient
driving practices, with conventional combustion vehicles, include smoother deceleration and acceleration,
keeping engine revolutions low, shutting off the engine when idling (stop-start), reducing maximum
speeds and maintaining proper tyre pressure through tyre pressure monitoring systems.
132. C. Development of new technologies (vehicle, fuel, traffic management) and global norms and standards;
133. Development of new technologies is often seen as the ultimate solution. They are important indeed, but
they are not the only solution. New technologies under development have different goals, such as:
(a). development of energy efficient engines and vehicles, such as electric or hybrid propulsions systems
(b). more fuel efficient and less polluting existing engines;
(c). innovative technologies to control and filter the exhausts emissions;
(d). strengthened requirements for market fuel quality (unleaded fuels, low sulphur content, etc.).
134. The after-treatment technologies could lead to further reduction of emissions. However, there are
implications and trade-offs that can prove to be complex and potentially critical for their implementation,
particularly those related to system integration. In railways, for instance, simulation work in SP6 (Emerging
Technologies) for engines up to 560 kW has shown that such combined designed propulsion unit (BSNOx 1
g/kWh) is about 18 per cent heavier than a conventional Stage IIIB propulsion unit. Similarly, technologies
currently in the research domain for automotive Euro VI heavy-duty application could eventually achieve a
status that would allow them to be the state-of-the-art application for railways in the future. However, it
is estimated that this will not be feasible to achieve before at the very least 2020.
135. Stricter timeframe for the replacement of old technology by new one and adoption of measures that
promote such replacement could be recommendation way to follow. For instance, the replacement of old
engines in inland waterway vessels with new ones could be a challenge. The new technologies have
positive impacts on air quality and it could only be realized if vessel fleets are renewed. Therefore,
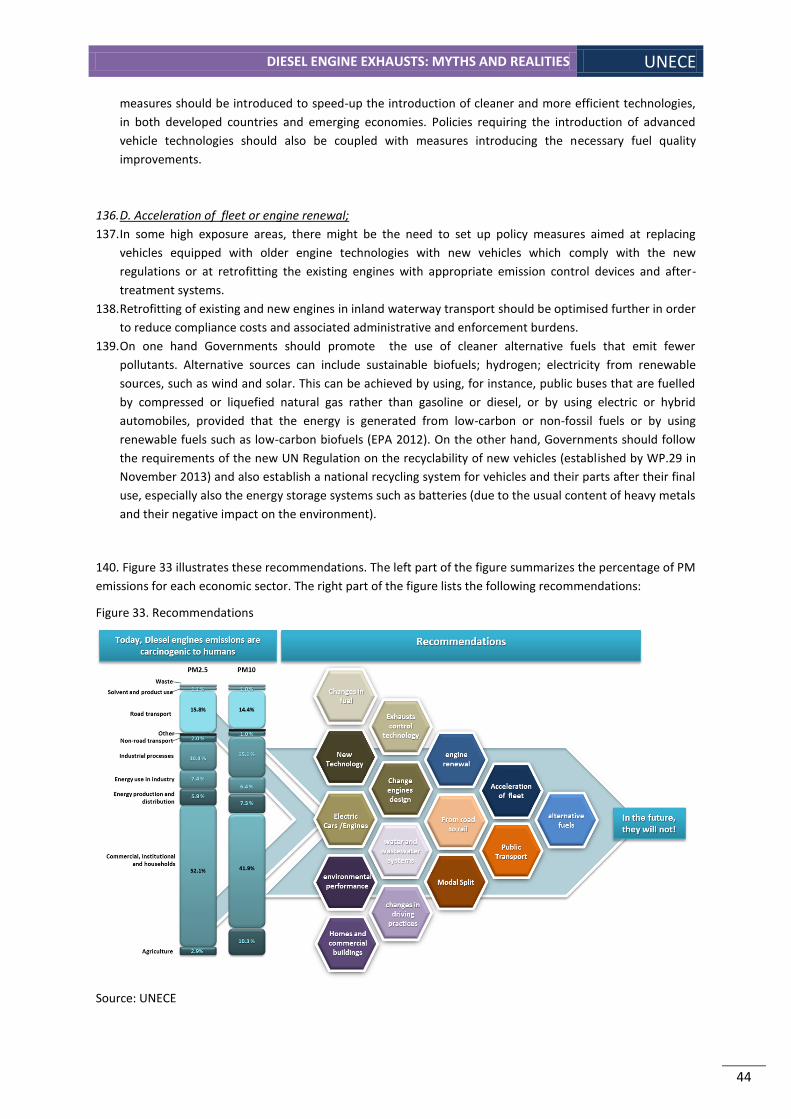
DIESEL ENGINE EXHAUSTS: MYTHS AND REALITIES UNECE
44
measures should be introduced to speed-up the introduction of cleaner and more efficient technologies,
in both developed countries and emerging economies. Policies requiring the introduction of advanced
vehicle technologies should also be coupled with measures introducing the necessary fuel quality
improvements.
136. D. Acceleration of fleet or engine renewal;
137. In some high exposure areas, there might be the need to set up policy measures aimed at replacing
vehicles equipped with older engine technologies with new vehicles which comply with the new
regulations or at retrofitting the existing engines with appropriate emission control devices and after-
treatment systems.
138. Retrofitting of existing and new engines in inland waterway transport should be optimised further in order
to reduce compliance costs and associated administrative and enforcement burdens.
139. On one hand Governments should promote the use of cleaner alternative fuels that emit fewer
pollutants. Alternative sources can include sustainable biofuels; hydrogen; electricity from renewable
sources, such as wind and solar. This can be achieved by using, for instance, public buses that are fuelled
by compressed or liquefied natural gas rather than gasoline or diesel, or by using electric or hybrid
automobiles, provided that the energy is generated from low-carbon or non-fossil fuels or by using
renewable fuels such as low-carbon biofuels (EPA 2012). On the other hand, Governments should follow
the requirements of the new UN Regulation on the recyclability of new vehicles (established by WP.29 in
November 2013) and also establish a national recycling system for vehicles and their parts after their final
use, especially also the energy storage systems such as batteries (due to the usual content of heavy metals
and their negative impact on the environment).
140. Figure 33 illustrates these recommendations. The left part of the figure summarizes the percentage of PM
emissions for each economic sector. The right part of the figure lists the following recommendations:
Figure 33. Recommendations
Source: UNECE
DIESEL ENGINE EXHAUSTS: MYTHS AND REALITIES UNECE
45
VIII. References
ADB (2009), Rethinking Transport and Climate Change, ADB Sustainable Development
Working Paper Series, http://www.adb.org/Documents/Papers/ADB-Working-Paper-Series/ADB-
WP10-Rethinking-Transport-Climate-Change.pdf
AECC (Association for emissions control by catalyst) (2013 ), Contribution to Impact Assessment of Measures for reducing Emissions of Inland Navigation, http://www.aecc.be/content/pdf/130416%20AECC%20comments%20on%20IWT%20emissions%20reduction%20report.pdf
Air Korea (2013), Air Quality Standards, http://www.airkorea.or.kr/airkorea/eng/information/main.jsp?action=standard
BMU (Bundesministerium für Umwelt, Naturschutz und Reaktorsicherheit) (2010), General information Air Pollution Control, http://www.bmu.de/english/air_pollution_control/general_information/doc/4352.php
Central Commission for the Navigation of the Rhine (CCNR) (2012), Possibilities for reducing fuel consumption and greenhouse gas emissions from inland navigation, Summary of the report by the Inspection Regulations Committee for the 2012 Autumn Meeting, http://www.ccr-zkr.org/files/documents/rapports/Thg_zus_en.pdf
Canada (Government of Canada) (2013a), National Pollutant Release Inventory, http://www.ec.gc.ca/inrp-npri/
Canada (2013b), Canadian Environmental Protection Act, 1999, Justice Laws Website, http://laws-lois.justice.gc.ca/eng/acts/c-15.31/
CEC (Central Environment Council) (2005), Future Policy for Motor Vehicle Emission Reduction (Eigth Report), http://www.env.go.jp/en/air/aq/mv/vehicle-8th.pdf
CEC (Central Environment Council) (2010), Future Policy for Motor Vehicle Emission Reduction (Tenth Report), https://www2.env.go.jp/library/materials/37194
CEIP (Centre on Emission Inventories and Projections) (2012), WebDab -EMEP (Co-operative programme for monitoring and evaluation of long range transmission of air pollutants in Europe) database, http://www.ceip.at/webdab-emission-database/
Clean European Rail-Diesel (CleanER-D – UIC)(2013), Recommendations regarding future emission reduction approaches and strategies of rail diesel traction in Europe, http://www.cleaner-d.eu/Sandor_ERR213_proofv4.pdf
Dieselnet (2013a), Emission Standards. Japan. Nonroad Engines (MOT/MOC), http://www.dieselnet.com/standards/jp/nonroad_mot.php
Dieselnet (2013b), Fuel Regulations. Japan: Diesel Fuel, http://www.dieselnet.com/standards/jp/fuel.php
EC (European Commission) (2001a), Directive 2001/81/EC of the European Parliament and of the Council of 23 October 2001 on national emission ceilings for certain atmospheric pollutants, http://eur-lex.europa.eu/LexUriServ/LexUriServ.do?uri=OJ:L:2001:309:0022:0030:EN:PDF
EC (2001b), Directive of the European Parliament and of the Council on the quality of petrol and diesel fuels and amending Directive 98/70/EC, Explanatory memorandum,
DIESEL ENGINE EXHAUSTS: MYTHS AND REALITIES UNECE
46
http://www.unece.org/fileadmin/DAM/trans/doc/2001/wp29grpe/TRANS-WP29-GRPE-42-inf09e.pdf
EC (2005), Thematic Strategy on air pollution, COM(2005) 446, http://eur-lex.europa.eu/LexUriServ/LexUriServ.do?uri=COM:2005:0446:FIN:EN:PDF
EC (2008), Directive 2008/50/EC of the European Parliament and of the Council of 21 May 2008 on ambient air quality and cleaner air for Europe, http://eur-lex.europa.eu/LexUriServ/LexUriServ.do?uri=OJ:L:2008:152:0001:0044:EN:PDF
EC (2011), The Sixth Community Environment Action Programme. Final assessment, COM(2011) 531, http://eur-lex.europa.eu/LexUriServ/LexUriServ.do?uri=COM:2011:0531:FIN:EN:PDF
EC (2012a), European Commission, Environment, Air, Emissions of Air Pollutants, Revision of the National Emission Ceilings Directive, http://ec.europa.eu/environment/air/pollutants/rev_nec_dir.htm
EC (2012b), European Commission, Environment, Air, Emissions of Air Pollutants, National Emission Ceilings, http://ec.europa.eu/environment/air/pollutants/ceilings.htm
EEA (European Environment Agency) (2010), The European environment - state and outlook 2010. Air pollution, http://www.eea.europa.eu/soer/europe/air-pollution/at_download/file
EEA (2012a), European Union emission inventory report 1990–2010 under the UNECE Convention on Long-range Trans boundary Air Pollution (LRTAP), http://www.eea.europa.eu/publications/eu-emission-inventory-report-1990-2010/at_download/file
EEA (2012b), Eleven Member States exceed air emissions limits under LRTAP Convention, http://www.eea.europa.eu/highlights/eleven-member-states-exceed-air
EEA (2013), Air quality in Europe report, http://www.eea.europa.eu/publications/air-quality-in-europe-2013
EGTEI -Expert Group on Techno-Economic Issues, INLAND WATERWAYS SYNOPSIS SHEET, 30 September 2005, www.citepa.org/old/forums/egtei/egtei_index.htm
Intergovernmental panel on climate change (IPCC) (2007), Working Group III: Mitigation of Climate Change, Chapter 5: Transport and its infrastructure, http://www.ipcc.ch/publications_and_data/ar4/wg3/en/ch5.html
International Agency for research on Cancer, World Health Organization (IARC) (2012), IARC: Diesel engines exhaust carcinogenic, press release N° 213, 12 June 2012, http://press.iarc.fr/pr213_E.pdf
International Council on clean transportation (ICCT)(2011), Developing a World Class Technology Pathways Program in China, INTERNATIONAL PRACTICES FOR VEHICLE EMISSION STANDARDS, http://www.theicct.org/sites/default/files/publications/ICCT_ChinaTechPathways_oct11.pdf
International Council on clean transportation (ICCT)(2012), Estimated Cost of Emission Reduction Technologies for Light-Duty Vehicles, http://www.theicct.org/sites/default/files/publications/ICCT_LDVcostsreport_2012.pdf
International Road Transport Union (IRU) 2012, Vehicles are getting cleaner worldwide, quoting a Price Waterhouse Coopers report (2008), personal communication
DIESEL ENGINE EXHAUSTS: MYTHS AND REALITIES UNECE
47
ISO (International Organization for Standardization) (2008), ISO 7708:1995. Air quality -- Particle size fraction definitions for health-related sampling, http://www.iso.org/iso/catalogue_detail.htm?csnumber=14534
Jacobson, M. Z. (2007), Testimony for the Hearing on Black Carbon and Arctic House Committee on Oversight and Government Reform, Unites States House of Representatives, http://oversight-archive.waxman.house.gov/documents/20071018110606.pdf
Jacobson, M. Z. (2012), Air Pollution and Global Warming: History, Science, and Solutions, http://www.cambridge.org/gb/knowledge/isbn/item6633790
JASIC (Japan Automobile Standards Internationalization Center) (2013), direct communication
JCAP (Japan Clean Air Programme) (2007), General Overview of JCAP II. Research Activities, 5th JCAP Conference, http://www.pecj.or.jp/english/jcap/jcap2/pdf/5th/1-1_kadoya.pdf
Lim (2013), personal communication with Yun Sung Lim, Transportation Pollution Research Center, National Institute of Environmental Research, Ministry of Environment
MOE (ministry of Environment) Korea (2011), ECOREA. Environmental Review 2011, Korea, http://eng.me.go.kr/board.do?method=view&docSeq=9728&bbsCode=law_law_paper¤tPage=1&searchType=&searchText=
PANTEIA (2013), Contribution to impact assessment of measures for reducing emissions of inland navigation, http://www.panteia.eu/nl/News/2013/06/Greening-of-inland-waterway-transport-needs-a-boost.aspx
Swizzerland (2009), Information on newly introduced emission control provisions for construction site equipment, http://www.unece.org/fileadmin/DAM/trans/doc/2009/wp29grpe/ECE-TRANS-WP29-GRPE-57-inf04r1e.pdf
Switzerland (2012), Partikelfilter für Maschinen und Geräte/ Filtre à particules pour les machines et engins/ Filtro antiparticolato per macchine e strumenti, http://www.bafu.admin.ch/luft/11025/11027/11318/index.html
TransportPolicy.net (2013), http://transportpolicy.net
UNECE (1979), Convention on Long-range Transboundary Air Pollution, http://www.unece.org/env/lrtap/lrtap_h1.html
UNECE (1999), Gothenburg Protocol to Abate Acidification, Eutrophication and Ground-level Ozone, http://www.unece.org/env/lrtap/multi_h1.html
UNECE (2010), Report of the World Forum for Harmonization of Vehicle Regulations on its 150th session, paragraph 83, http://www.unece.org/fileadmin/DAM/trans/doc/2010/wp29/ECE-TRANS-WP29-1083e.pdf
UNECE (2012), Report of the World Forum for Harmonization of Vehicle Regulations on its 157th session, paragraph 77, http://www.unece.org/fileadmin/DAM/trans/doc/2012/wp29/ECE-TRANS-WP29-1097e_01.pdf
UNECE (2013a), UN Global Technical Regulation No. 4 (worldwide harmonized heavy duty test cycle), http://www.unece.org/trans/main/wp29/wp29wgs/wp29gen/wp29glob_registry.html
UNECE (2013b), UN Global Technical Regulation No. 5 (on-board diagnostic systems for road vehicles), http://www.unece.org/trans/main/wp29/wp29wgs/wp29gen/wp29glob_registry.html
DIESEL ENGINE EXHAUSTS: MYTHS AND REALITIES UNECE
48
UNECE (2013c), UN Global Technical Regulation No. 5 (off-cycle emissions), http://www.unece.org/trans/main/wp29/wp29wgs/wp29gen/wp29glob_registry.html
UNECE (2013d), UN Global Technical Regulation No. 2 (worldwide harmonized motorcycle test cycle), Uhttp://www.unece.org/trans/main/wp29/wp29wgs/wp29gen/wp29glob_registry.html
UNECE (2013e), UN Global Technical Regulation No. 11 (non-road mobile machinery test cycle), http://www.unece.org/trans/main/wp29/wp29wgs/wp29gen/wp29glob_registry.html
UNECE (2013f), WLTP UN GTR: draft texts, https://www2.unece.org/wiki/display/trans/WLTP+UN+GTR%3A+draft+texts
UNECE (2013g), UN Regulation No. 83 (emissions of M1 and N1 vehicles), http://www.unece.org/trans/main/wp29/wp29regs81-100.html
UNECE (2013h), UN Regulation No. 49 (emissions of heavy duty engines),
http://www.unece.org/trans/main/wp29/wp29regs41-60.html
UNECE (2013i), UN Regulation No. 96 (emissions of agricultural tractors and non-road mobile
machinery), http://www.unece.org/trans/main/wp29/wp29regs81-100.html
UNECE (2013j), Retrofit Emission Control devices (REC),
https://www2.unece.org/wiki/pages/viewpage.action?pageId=2523175
UNECE (2013k), Special Resolution No. 1,
http://www.unece.org/trans/main/wp29/wp29wgs/wp29gen/wp29resolutions.html
UNECE (2013l), Consolidated Resolution on the Construction of Vehicles (R.E.3),
http://www.unece.org/trans/main/wp29/wp29wgs/wp29gen/wp29resolutions.html
US EPA (United States Environmental Protection Agency) (1999), EPA's Program for Cleaner Vehicles and Cleaner Gasoline, Regulatory Announcement, http://www.epa.gov/tier2/documents/f99051.pdf
US EPA (2000a), Control of Air Pollution From New Motor Vehicles: Tier 2 Motor Vehicle Emissions Standards and Gasoline Sulphur Control Requirements, http://www.gpo.gov/fdsys/pkg/FR-2000-02-10/pdf/00-19.pdf
US EPA (2000b), Heavy-Duty Engine and Vehicle Standards and Highway Diesel Fuel Sulfur Control Requirements, Regulatory Announcement, http://www.epa.gov/otaq/regs/hd2007/frm/f00057.pdf
US EPA (2002), Diesel Hazard Assessment Document for Diesel Engine Exhaust, EPA600-9-90-057F Office of Research and Development, Washington DC, http://cfpub.epa.gov/ncea/cfm/recordisplay.cfm?deid=29060
US EPA (2011a), National Ambient Air Quality Standards (NAAQS), http://www.epa.gov/air/criteria.html
US EPA (2011b), Air quality, http://www.epa.gov/airquality/cleanair.html
US EPA (2012a), What Are the Six Common Air Pollutants?, http://www.epa.gov/air/urbanair/
US EPA (2012b), Black Carbon. Basic Information, http://www.epa.gov/blackcarbon/basic.html
US EPA (2013a), National Emissions Inventory (NEI) Air Pollutant Emissions Trends Data, http://www.epa.gov/ttn/chief/trends/index.html#tables

DIESEL ENGINE EXHAUSTS: MYTHS AND REALITIES UNECE
49
US EPA (2013b), EPA Proposes Tier 3 Motor Vehicle Emission and Fuel Standards, http://www.epa.gov/otaq/documents/tier3/420f13016a.pdf
US (2010), Climate Action Report, Fifth National Communication of the United States of America Under the United Nations Framework Convention on Climate Change, http://unfccc.int/resource/docs/natc/usa_nc5.pdf
Wild. C. (2012), Videocast, http://www.iarc.fr/en/media-centre/iarcnews/2012/mono105-videocast_Wild.php
WBCSD (World Business Council for Sustainable Development) (2004), Mobility 2030: meeting the challenges to sustainability, http://www.wbcsd.org/pages/edocument/edocumentdetails.aspx?id=69
WHO (World Health Organization) (2011), Air quality and health, Fact sheet N°313, http://www.who.int/mediacentre/factsheets/fs313/en/index.html
WHO (World Health Organization) (2013), Review of evidence on health aspects of air pollution –
REVIHAAP Project, http://www.euro.who.int/__data/assets/pdf_file/0004/193108/REVIHAAP-Final-
technical-report.pdf
Related Documents