Dielectrophoretic sorting on a microfabricated flow cytometer: Label free separation of Babesia bovis infected erythrocytes Elisabete M. Nascimento a, ⁎, Nuno Nogueira a , Tiago Silva a , Thomas Braschler b , Nicolas Demierre b , Philippe Renaud b , Abel G. Oliva a a Instituto de Biologia Experimental e Tecnológica/ITQB, Universidade Nova de Lisboa, 2781-901 Oeiras, Portugal b Laboratory of Microsystems, École Polytechnique Fédérale de Lausanne EPFL, 1015 Lausanne, Switzerland ABSTRACT ARTICLE INFO Article history: Received 31 May 2007 Received in revised form 12 March 2008 Accepted 7 April 2008 Available online 18 April 2008 Keywords: Dielectrophoresis Babesia bovis Infected erythrocytes Microfabricated flow cytometer Label-free sorting Dielectrophoresis is a method that has demonstrated great potential in cell discrimination and isolation. In this study, the dielectrophoretic sorting of normal and Babesia bovis infected erythrocytes was performed using a microfabricated flow cytometer. Separation was possible through exploitation of the dielectric differences between normal and infected erythrocytes, essentially due to the higher ionic membrane permeability of B. bovis infected cells. Sorting experiments were performed inside a microchip made from Pt microelectrodes and SU-8 channels patterned on a glass substrate. Optimum cell separation was achieved at 4 MHz using an in vitro culture of B. bovis suspended in 63 mS/m phosphate buffer and applying a sinusoidal voltage of 15 V peak- to-peak. Normal erythrocytes experienced stronger positive dielectrophoresis (pDEP) than B. bovis infected cells, moving them closer to the microelectrodes. Under these conditions it was possible to enrich the fraction of infected cells from 7 to 50% without the need of extensive sample preparation or labelling. Throughout the experiments very few microliters of sample were used, suggesting that this system may be considered suitable for integration in a low-cost automated device to be used in the in situ diagnostic of babesiosis. © 2008 Elsevier B.V. All rights reserved. 1. Introduction Dielectrophoresis (DEP) is a well known method for manipulation of dielectric particles such as DNA, proteins and cells [1]. In the past few years, there has been extensive research in the manipulation and analysis of biological cells at the microscale and a number of microelectromechanical systems (MEMS) using DEP for selective trapping, manipulation or separation of cells was described [1–4]. The goal has been the development of automated single-cell manipulation and analysis systems to be used in research fields such as immunology, developmental biology, tumour biology and parasi- tology, just to name a few [5]. DEP is defined as the translational motion impaired on uncharged cells or particles, as a result of the polarisation induced by non-uniform electric fields [6]. Using this method, cells can be manipulated to higher and lower electric field regions by means of polarisation forces that induce what is designated as positive and negative dielectrophor- esis (pDEP and nDEP), respectively [1]. The dielectrophoretic force on a cell can be calculated using the following formula: Y F DEP ¼ 2pe m r 3 Re P K CM x ð Þ h i jE 2 RMS ð1Þ where ε m is the permittivity of the medium, r the radius of the cell, Re [K P CM (ω)] the real part of the Clausius–Mossotti (CM) factor and ∇E RMS the gradient of the root mean square value of the electric field. The CM factor K P CM , a complex number, can be written as: P K CM ¼ P e c P e m P e c þ 2 P e m ð2Þ where ε P c and ε P m are the complex permittivities of the cell and me- dium, respectively, and ε P = ε − ( jσ / ω) with σ the conductivity, ɛ the real permittivity, ω the angular frequency of the applied electric field and j ¼ ffiffiffiffiffi ffi 1 p . The value of Re[K P CM (ω)] varies depending on whether the cell is more or less polarisable than the surrounding medium. If Re[K P CM (ω)] is positive, cells are attracted to regions of higher field strength (pDEP) whereas the opposite induces the repulsion of cells from these regions (nDEP) (Fig. 1). As a result, the dielectrophoretic force is dependent on the dielec- tric properties and size of the cell, frequency of the applied electric field and conductivity and permittivity of the medium where the cells are suspended. A careful selection of these parameters can induce cell movement in specific directions according to their dielectrical prop- erties, thus enabling cell manipulation or separation. In this study dielectrophoresis was applied in the separation of B. bovis infected erythrocytes. B. bovis is an intraerythrocytic tick-borne protozoan parasite that infects bovine erythrocytes and is responsible for large Bioelectrochemistry 73 (2008) 123–128 ⁎ Corresponding author. Tel.: +351 21 4469428; fax: +351 21 4421161. E-mail addresses: [email protected] (E.M. Nascimento). 1567-5394/$ – see front matter © 2008 Elsevier B.V. All rights reserved. doi:10.1016/j.bioelechem.2008.04.018 Contents lists available at ScienceDirect Bioelectrochemistry journal homepage: www.elsevier.com/locate/bioelechem

Welcome message from author
This document is posted to help you gain knowledge. Please leave a comment to let me know what you think about it! Share it to your friends and learn new things together.
Transcript
Bioelectrochemistry 73 (2008) 123–128
Contents lists available at ScienceDirect
Bioelectrochemistry
j ourna l homepage: www.e lsev ie r.com/ locate /b ioe lechem
Dielectrophoretic sorting on a microfabricated flow cytometer: Label free separationof Babesia bovis infected erythrocytes
Elisabete M. Nascimento a,⁎, Nuno Nogueira a, Tiago Silva a, Thomas Braschler b, Nicolas Demierre b,Philippe Renaud b, Abel G. Oliva a
a Instituto de Biologia Experimental e Tecnológica/ITQB, Universidade Nova de Lisboa, 2781-901 Oeiras, Portugalb Laboratory of Microsystems, École Polytechnique Fédérale de Lausanne EPFL, 1015 Lausanne, Switzerland
⁎ Corresponding author. Tel.: +351 21 4469428; fax: +E-mail addresses: [email protected] (E.M. Nascim
1567-5394/$ – see front matter © 2008 Elsevier B.V. Aldoi:10.1016/j.bioelechem.2008.04.018
A B S T R A C T
A R T I C L E I N F OArticle history:
Dielectrophoresis is ametho Received 31 May 2007Received in revised form 12 March 2008Accepted 7 April 2008Available online 18 April 2008Keywords:DielectrophoresisBabesia bovisInfected erythrocytesMicrofabricated flow cytometerLabel-free sorting
d that has demonstrated great potential in cell discrimination and isolation. In thisstudy, the dielectrophoretic sorting of normal and Babesia bovis infected erythrocytes was performed using amicrofabricated flow cytometer. Separation was possible through exploitation of the dielectric differencesbetween normal and infected erythrocytes, essentially due to the higher ionic membrane permeability ofB. bovis infected cells. Sorting experiments were performed inside a microchip made from Pt microelectrodesand SU-8 channels patterned on a glass substrate. Optimum cell separationwas achieved at 4 MHz using an invitro culture of B. bovis suspended in 63mS/m phosphate buffer and applying a sinusoidal voltage of 15 V peak-to-peak. Normal erythrocytes experienced stronger positive dielectrophoresis (pDEP) than B. bovis infectedcells, moving them closer to the microelectrodes. Under these conditions it was possible to enrich the fractionof infected cells from 7 to 50% without the need of extensive sample preparation or labelling. Throughout theexperiments very fewmicroliters of sample were used, suggesting that this systemmay be considered suitablefor integration in a low-cost automated device to be used in the in situ diagnostic of babesiosis.
© 2008 Elsevier B.V. All rights reserved.
1. Introduction
Dielectrophoresis (DEP) is a well known method for manipulationof dielectric particles such as DNA, proteins and cells [1].
In the past few years, there has been extensive research in themanipulation and analysis of biological cells at the microscale and anumber of microelectromechanical systems (MEMS) using DEP forselective trapping, manipulation or separation of cells was described[1–4]. The goal has been the development of automated single-cellmanipulation and analysis systems to be used in research fields suchas immunology, developmental biology, tumour biology and parasi-tology, just to name a few [5].
DEP is defined as the translational motion impaired on unchargedcells or particles, as a result of the polarisation induced by non-uniformelectric fields [6]. Using this method, cells can be manipulated tohigher and lower electric field regions by means of polarisation forcesthat inducewhat is designated as positive and negative dielectrophor-esis (pDEP and nDEP), respectively [1].
The dielectrophoretic force on a cell can be calculated using thefollowing formula:
YFDEP ¼ 2pemr3RePK CM xð Þh i
jE2RMS ð1Þ
351 21 4421161.ento).
l rights reserved.
where εm is the permittivity of the medium, r the radius of the cell, Re[KP
CM(ω)] the real part of the Clausius–Mossotti (CM) factor and∇ERMS
the gradient of the root mean square value of the electric field. The CMfactor K
PCM, a complex number, can be written as:
PKCM ¼
Pec �PemPec þ 2Pem
ð2Þ
where εPc and εPm are the complex permittivities of the cell and me-dium, respectively, and εP=ε− ( jσ /ω) with σ the conductivity, ɛ thereal permittivity, ω the angular frequency of the applied electric fieldand j ¼
ffiffiffiffiffiffiffi�1
p.
The value of Re[KP
CM(ω)] varies depending on whether the cell ismore or less polarisable than the surrounding medium. If Re[K
PCM(ω)]
is positive, cells are attracted to regions of higher field strength (pDEP)whereas the opposite induces the repulsion of cells from these regions(nDEP) (Fig. 1).
As a result, the dielectrophoretic force is dependent on the dielec-tric properties and size of the cell, frequency of the applied electricfield and conductivity and permittivity of the mediumwhere the cellsare suspended. A careful selection of these parameters can induce cellmovement in specific directions according to their dielectrical prop-erties, thus enabling cell manipulation or separation. In this studydielectrophoresis was applied in the separation of B. bovis infectederythrocytes. B. bovis is an intraerythrocytic tick-borne protozoanparasite that infects bovine erythrocytes and is responsible for large
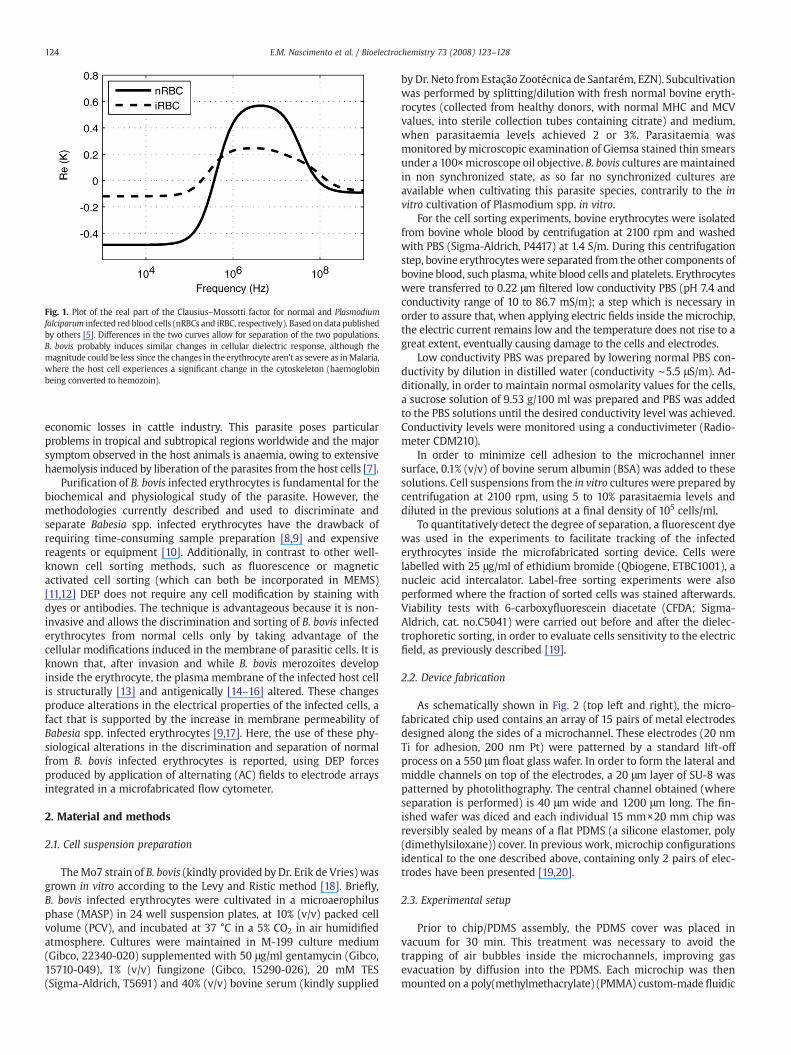
Fig. 1. Plot of the real part of the Clausius–Mossotti factor for normal and Plasmodiumfalciparum infected red blood cells (nRBCs and iRBC, respectively). Based on data publishedby others [5]. Differences in the two curves allow for separation of the two populations.B. bovis probably induces similar changes in cellular dielectric response, although themagnitude could be less since the changes in the erythrocyte aren't as severe as inMalaria,where the host cell experiences a significant change in the cytoskeleton (haemoglobinbeing converted to hemozoin).
124 E.M. Nascimento et al. / Bioelectrochemistry 73 (2008) 123–128
economic losses in cattle industry. This parasite poses particularproblems in tropical and subtropical regions worldwide and the majorsymptom observed in the host animals is anaemia, owing to extensivehaemolysis induced by liberation of the parasites from the host cells [7].
Purification of B. bovis infected erythrocytes is fundamental for thebiochemical and physiological study of the parasite. However, themethodologies currently described and used to discriminate andseparate Babesia spp. infected erythrocytes have the drawback ofrequiring time-consuming sample preparation [8,9] and expensivereagents or equipment [10]. Additionally, in contrast to other well-known cell sorting methods, such as fluorescence or magneticactivated cell sorting (which can both be incorporated in MEMS)[11,12] DEP does not require any cell modification by staining withdyes or antibodies. The technique is advantageous because it is non-invasive and allows the discrimination and sorting of B. bovis infectederythrocytes from normal cells only by taking advantage of thecellular modifications induced in the membrane of parasitic cells. It isknown that, after invasion and while B. bovis merozoites developinside the erythrocyte, the plasma membrane of the infected host cellis structurally [13] and antigenically [14–16] altered. These changesproduce alterations in the electrical properties of the infected cells, afact that is supported by the increase in membrane permeability ofBabesia spp. infected erythrocytes [9,17]. Here, the use of these phy-siological alterations in the discrimination and separation of normalfrom B. bovis infected erythrocytes is reported, using DEP forcesproduced by application of alternating (AC) fields to electrode arraysintegrated in a microfabricated flow cytometer.
2. Material and methods
2.1. Cell suspension preparation
TheMo7 strain of B. bovis (kindly provided by Dr. Erik de Vries) wasgrown in vitro according to the Levy and Ristic method [18]. Briefly,B. bovis infected erythrocytes were cultivated in a microaerophilusphase (MASP) in 24 well suspension plates, at 10% (v/v) packed cellvolume (PCV), and incubated at 37 °C in a 5% CO2 in air humidifiedatmosphere. Cultures were maintained in M-199 culture medium(Gibco, 22340-020) supplemented with 50 μg/ml gentamycin (Gibco,15710-049), 1% (v/v) fungizone (Gibco, 15290-026), 20 mM TES(Sigma-Aldrich, T5691) and 40% (v/v) bovine serum (kindly supplied
byDr. Neto fromEstação Zootécnica de Santarém, EZN). Subcultivationwas performed by splitting/dilution with fresh normal bovine eryth-rocytes (collected from healthy donors, with normal MHC and MCVvalues, into sterile collection tubes containing citrate) and medium,when parasitaemia levels achieved 2 or 3%. Parasitaemia wasmonitored bymicroscopic examination of Giemsa stained thin smearsunder a 100×microscope oil objective. B. bovis cultures aremaintainedin non synchronized state, as so far no synchronized cultures areavailable when cultivating this parasite species, contrarily to the invitro cultivation of Plasmodium spp. in vitro.
For the cell sorting experiments, bovine erythrocytes were isolatedfrom bovine whole blood by centrifugation at 2100 rpm and washedwith PBS (Sigma-Aldrich, P4417) at 1.4 S/m. During this centrifugationstep, bovine erythrocyteswere separated from the other components ofbovine blood, such plasma, white blood cells and platelets. Erythrocyteswere transferred to 0.22 μm filtered low conductivity PBS (pH 7.4 andconductivity range of 10 to 86.7 mS/m); a step which is necessary inorder to assure that, when applying electric fields inside the microchip,the electric current remains low and the temperature does not rise to agreat extent, eventually causing damage to the cells and electrodes.
Low conductivity PBS was prepared by lowering normal PBS con-ductivity by dilution in distilled water (conductivity ∼5.5 μS/m). Ad-ditionally, in order to maintain normal osmolarity values for the cells,a sucrose solution of 9.53 g/100 ml was prepared and PBS was addedto the PBS solutions until the desired conductivity level was achieved.Conductivity levels were monitored using a conductivimeter (Radio-meter CDM210).
In order to minimize cell adhesion to the microchannel innersurface, 0.1% (v/v) of bovine serum albumin (BSA) was added to thesesolutions. Cell suspensions from the in vitro cultures were prepared bycentrifugation at 2100 rpm, using 5 to 10% parasitaemia levels anddiluted in the previous solutions at a final density of 105 cells/ml.
To quantitatively detect the degree of separation, a fluorescent dyewas used in the experiments to facilitate tracking of the infectederythrocytes inside the microfabricated sorting device. Cells werelabelled with 25 μg/ml of ethidium bromide (Qbiogene, ETBC1001), anucleic acid intercalator. Label-free sorting experiments were alsoperformed where the fraction of sorted cells was stained afterwards.Viability tests with 6-carboxyfluorescein diacetate (CFDA; Sigma-Aldrich, cat. no.C5041) were carried out before and after the dielec-trophoretic sorting, in order to evaluate cells sensitivity to the electricfield, as previously described [19].
2.2. Device fabrication
As schematically shown in Fig. 2 (top left and right), the micro-fabricated chip used contains an array of 15 pairs of metal electrodesdesigned along the sides of a microchannel. These electrodes (20 nmTi for adhesion, 200 nm Pt) were patterned by a standard lift-offprocess on a 550 μm float glass wafer. In order to form the lateral andmiddle channels on top of the electrodes, a 20 μm layer of SU-8 waspatterned by photolithography. The central channel obtained (whereseparation is performed) is 40 μm wide and 1200 μm long. The fin-ished wafer was diced and each individual 15 mm×20 mm chip wasreversibly sealed by means of a flat PDMS (a silicone elastomer, poly(dimethylsiloxane)) cover. In previous work, microchip configurationsidentical to the one described above, containing only 2 pairs of elec-trodes have been presented [19,20].
2.3. Experimental setup
Prior to chip/PDMS assembly, the PDMS cover was placed invacuum for 30 min. This treatment was necessary to avoid thetrapping of air bubbles inside the microchannels, improving gasevacuation by diffusion into the PDMS. Each microchip was thenmounted on a poly(methylmethacrylate) (PMMA) custom-made fluidic
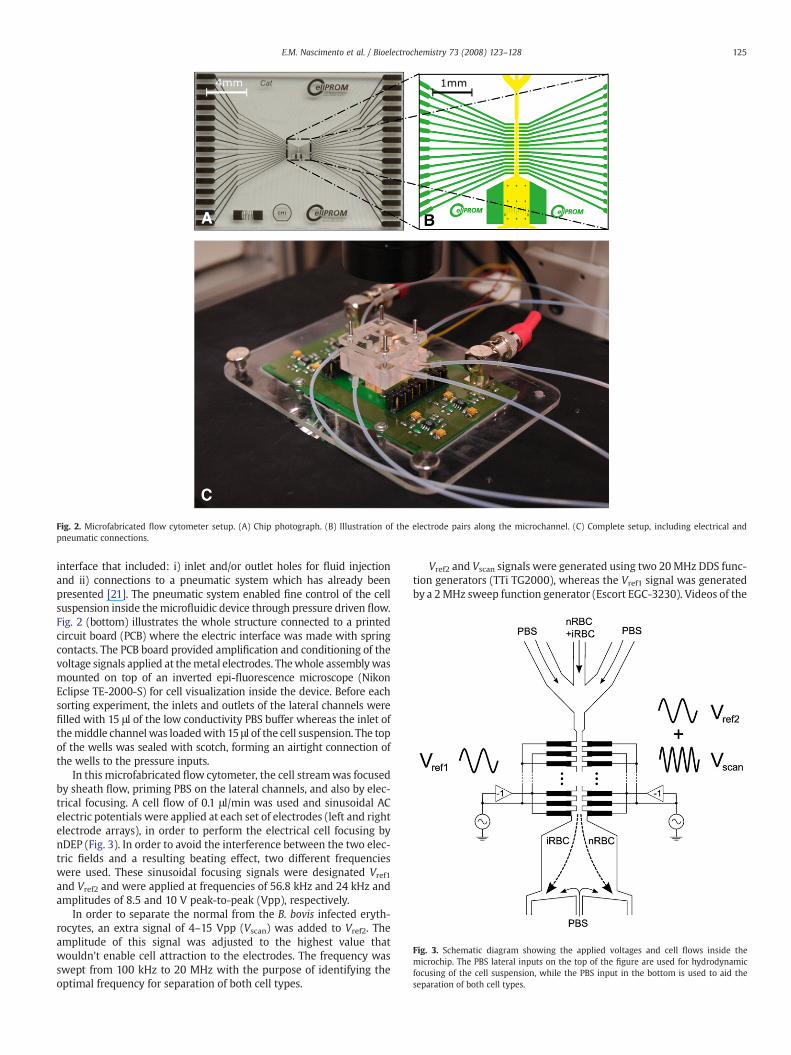
Fig. 3. Schematic diagram showing the applied voltages and cell flows inside themicrochip. The PBS lateral inputs on the top of the figure are used for hydrodynamicfocusing of the cell suspension, while the PBS input in the bottom is used to aid theseparation of both cell types.
Fig. 2. Microfabricated flow cytometer setup. (A) Chip photograph. (B) Illustration of the electrode pairs along the microchannel. (C) Complete setup, including electrical andpneumatic connections.
125E.M. Nascimento et al. / Bioelectrochemistry 73 (2008) 123–128
interface that included: i) inlet and/or outlet holes for fluid injectionand ii) connections to a pneumatic system which has already beenpresented [21]. The pneumatic system enabled fine control of the cellsuspension inside themicrofluidic device through pressure driven flow.Fig. 2 (bottom) illustrates the whole structure connected to a printedcircuit board (PCB) where the electric interface was made with springcontacts. The PCB board provided amplification and conditioning of thevoltage signals applied at themetal electrodes. Thewhole assemblywasmounted on top of an inverted epi-fluorescence microscope (NikonEclipse TE-2000-S) for cell visualization inside the device. Before eachsorting experiment, the inlets and outlets of the lateral channels werefilled with 15 μl of the low conductivity PBS buffer whereas the inlet ofthemiddle channel was loadedwith 15 μl of the cell suspension. The topof the wells was sealed with scotch, forming an airtight connection ofthe wells to the pressure inputs.
In this microfabricated flow cytometer, the cell streamwas focusedby sheath flow, priming PBS on the lateral channels, and also by elec-trical focusing. A cell flow of 0.1 μl/min was used and sinusoidal ACelectric potentials were applied at each set of electrodes (left and rightelectrode arrays), in order to perform the electrical cell focusing bynDEP (Fig. 3). In order to avoid the interference between the two elec-tric fields and a resulting beating effect, two different frequencieswere used. These sinusoidal focusing signals were designated Vref1
and Vref2 and were applied at frequencies of 56.8 kHz and 24 kHz andamplitudes of 8.5 and 10 V peak-to-peak (Vpp), respectively.
In order to separate the normal from the B. bovis infected eryth-rocytes, an extra signal of 4–15 Vpp (Vscan) was added to Vref2. Theamplitude of this signal was adjusted to the highest value thatwouldn't enable cell attraction to the electrodes. The frequency wasswept from 100 kHz to 20 MHz with the purpose of identifying theoptimal frequency for separation of both cell types.
Vref2 and Vscan signals were generated using two 20MHz DDS func-tion generators (TTi TG2000), whereas the Vref1 signal was generatedby a 2MHz sweep function generator (Escort EGC-3230). Videos of the
126 E.M. Nascimento et al. / Bioelectrochemistry 73 (2008) 123–128
separation were acquired using a CCD digital camera (Evolution MPVersion 5.0) and image analysis software (Image Pro Plus version 5.1from Media Cybernetics). Quantification of the separation extent wasperformed by analysis of the captured video sequences obtained ateach sorting experiment.
2.4. Image analysis
A routine for post-processing the captured video sequences waswritten in MATLAB (The Mathworks, Inc.). The program allowed anestimation of the distribution of normal and infected cells along thechannel after sorting, in order to quantify the extent of DEP separationat each frequency.
A thin section of the image sequence, corresponding to the regionof the channel after the sorting, was chosen, where both normal andinfected red blood cells were counted. This sectionwas always locatedin themiddle channel, after the last pair of electrodes. The backgroundis then estimated and removed from each frame, resulting in asequence of images that only contained cells crossing the selectedsection in a specific time frame. For each frame, an image matrix wasobtained containing the colour intensity values for each pixel. Byadding the intensity values along the direction of the channel, a vectorwas obtained. By choosing the section thin enough, one canmake surethat no cells are superimposed when adding. Assuming that thenormal erythrocytes are darker and that the infected (stained with afluorescent marker) are brighter than the background, it is possible toidentify each cell in the obtained vector. By comparison of the bright-
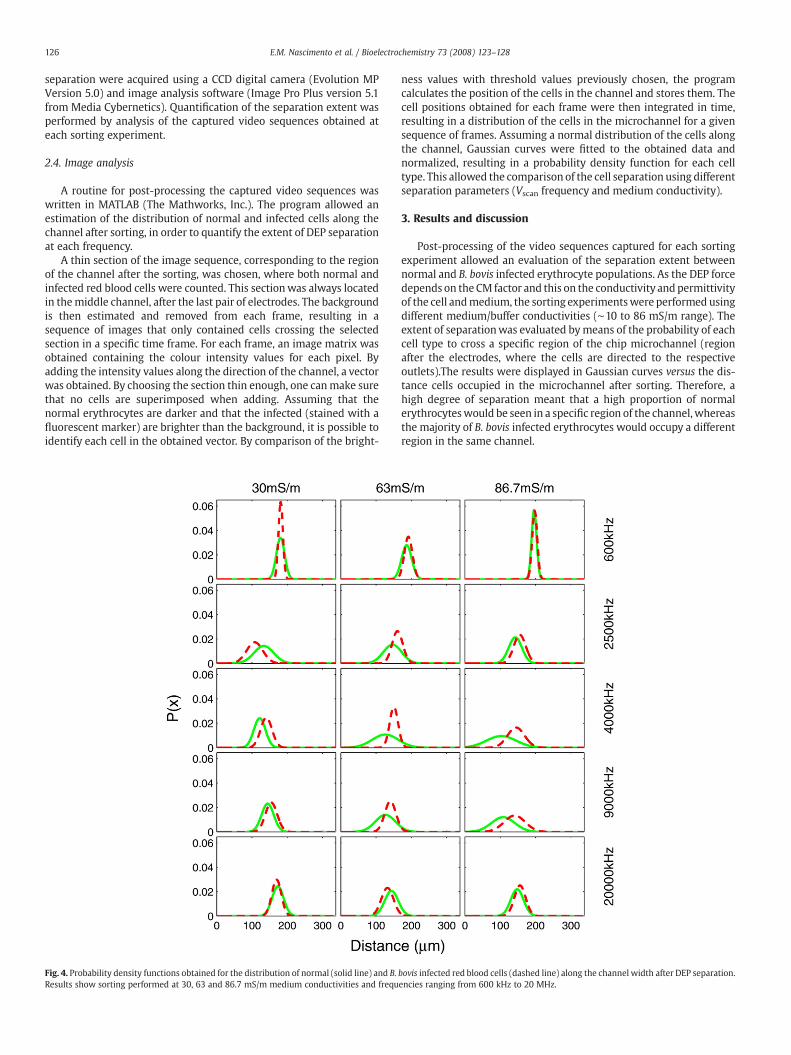
Fig. 4. Probability density functions obtained for the distribution of normal (solid line) and B.Results show sorting performed at 30, 63 and 86.7 mS/m medium conductivities and frequ
ness values with threshold values previously chosen, the programcalculates the position of the cells in the channel and stores them. Thecell positions obtained for each frame were then integrated in time,resulting in a distribution of the cells in the microchannel for a givensequence of frames. Assuming a normal distribution of the cells alongthe channel, Gaussian curves were fitted to the obtained data andnormalized, resulting in a probability density function for each celltype. This allowed the comparison of the cell separation using differentseparation parameters (Vscan frequency and medium conductivity).
3. Results and discussion
Post-processing of the video sequences captured for each sortingexperiment allowed an evaluation of the separation extent betweennormal and B. bovis infected erythrocyte populations. As the DEP forcedepends on the CM factor and this on the conductivity and permittivityof the cell andmedium, the sorting experimentswere performed usingdifferent medium/buffer conductivities (∼10 to 86 mS/m range). Theextent of separationwas evaluated bymeans of the probability of eachcell type to cross a specific region of the chip microchannel (regionafter the electrodes, where the cells are directed to the respectiveoutlets).The results were displayed in Gaussian curves versus the dis-tance cells occupied in the microchannel after sorting. Therefore, ahigh degree of separation meant that a high proportion of normalerythrocyteswould be seen in a specific region of the channel,whereasthe majority of B. bovis infected erythrocytes would occupy a differentregion in the same channel.
bovis infected red blood cells (dashed line) along the channel width after DEP separation.encies ranging from 600 kHz to 20 MHz.
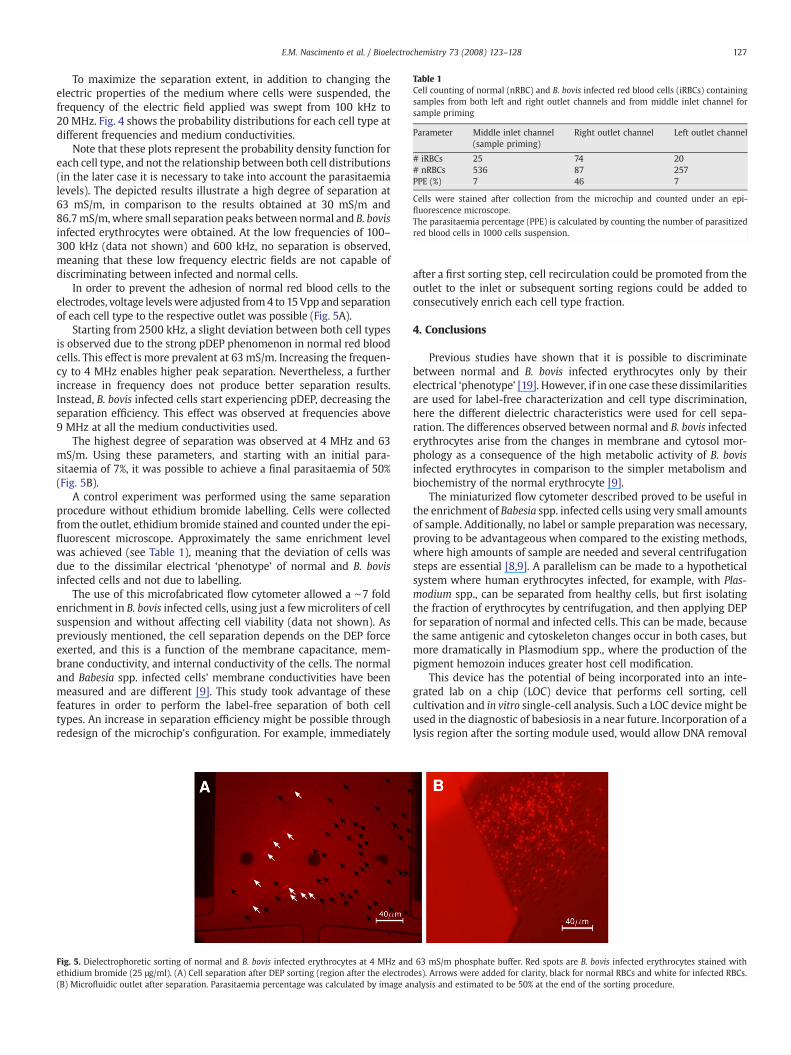
Table 1Cell counting of normal (nRBC) and B. bovis infected red blood cells (iRBCs) containingsamples from both left and right outlet channels and from middle inlet channel forsample priming
Parameter Middle inlet channel(sample priming)
Right outlet channel Left outlet channel
# iRBCs 25 74 20# nRBCs 536 87 257PPE (%) 7 46 7
Cells were stained after collection from the microchip and counted under an epi-fluorescence microscope.The parasitaemia percentage (PPE) is calculated by counting the number of parasitizedred blood cells in 1000 cells suspension.
127E.M. Nascimento et al. / Bioelectrochemistry 73 (2008) 123–128
To maximize the separation extent, in addition to changing theelectric properties of the medium where cells were suspended, thefrequency of the electric field applied was swept from 100 kHz to20 MHz. Fig. 4 shows the probability distributions for each cell type atdifferent frequencies and medium conductivities.
Note that these plots represent the probability density function foreach cell type, and not the relationship between both cell distributions(in the later case it is necessary to take into account the parasitaemialevels). The depicted results illustrate a high degree of separation at63 mS/m, in comparison to the results obtained at 30 mS/m and86.7mS/m,where small separation peaks between normal and B. bovisinfected erythrocytes were obtained. At the low frequencies of 100–300 kHz (data not shown) and 600 kHz, no separation is observed,meaning that these low frequency electric fields are not capable ofdiscriminating between infected and normal cells.
In order to prevent the adhesion of normal red blood cells to theelectrodes, voltage levelswere adjusted from4 to 15Vpp and separationof each cell type to the respective outlet was possible (Fig. 5A).
Starting from 2500 kHz, a slight deviation between both cell typesis observed due to the strong pDEP phenomenon in normal red bloodcells. This effect is more prevalent at 63 mS/m. Increasing the frequen-cy to 4 MHz enables higher peak separation. Nevertheless, a furtherincrease in frequency does not produce better separation results.Instead, B. bovis infected cells start experiencing pDEP, decreasing theseparation efficiency. This effect was observed at frequencies above9 MHz at all the medium conductivities used.
The highest degree of separation was observed at 4 MHz and 63mS/m. Using these parameters, and starting with an initial para-sitaemia of 7%, it was possible to achieve a final parasitaemia of 50%(Fig. 5B).
A control experiment was performed using the same separationprocedure without ethidium bromide labelling. Cells were collectedfrom the outlet, ethidium bromide stained and counted under the epi-fluorescent microscope. Approximately the same enrichment levelwas achieved (see Table 1), meaning that the deviation of cells wasdue to the dissimilar electrical ‘phenotype’ of normal and B. bovisinfected cells and not due to labelling.
The use of this microfabricated flow cytometer allowed a ∼7 foldenrichment in B. bovis infected cells, using just a fewmicroliters of cellsuspension and without affecting cell viability (data not shown). Aspreviously mentioned, the cell separation depends on the DEP forceexerted, and this is a function of the membrane capacitance, mem-brane conductivity, and internal conductivity of the cells. The normaland Babesia spp. infected cells' membrane conductivities have beenmeasured and are different [9]. This study took advantage of thesefeatures in order to perform the label-free separation of both celltypes. An increase in separation efficiency might be possible throughredesign of the microchip's configuration. For example, immediately
Fig. 5. Dielectrophoretic sorting of normal and B. bovis infected erythrocytes at 4 MHz andethidium bromide (25 μg/ml). (A) Cell separation after DEP sorting (region after the electrod(B) Microfluidic outlet after separation. Parasitaemia percentage was calculated by image an
after a first sorting step, cell recirculation could be promoted from theoutlet to the inlet or subsequent sorting regions could be added toconsecutively enrich each cell type fraction.
4. Conclusions
Previous studies have shown that it is possible to discriminatebetween normal and B. bovis infected erythrocytes only by theirelectrical ‘phenotype’ [19]. However, if in one case these dissimilaritiesare used for label-free characterization and cell type discrimination,here the different dielectric characteristics were used for cell sepa-ration. The differences observed between normal and B. bovis infectederythrocytes arise from the changes in membrane and cytosol mor-phology as a consequence of the high metabolic activity of B. bovisinfected erythrocytes in comparison to the simpler metabolism andbiochemistry of the normal erythrocyte [9].
The miniaturized flow cytometer described proved to be useful inthe enrichment of Babesia spp. infected cells using very small amountsof sample. Additionally, no label or sample preparationwas necessary,proving to be advantageous when compared to the existing methods,where high amounts of sample are needed and several centrifugationsteps are essential [8,9]. A parallelism can be made to a hypotheticalsystem where human erythrocytes infected, for example, with Plas-modium spp., can be separated from healthy cells, but first isolatingthe fraction of erythrocytes by centrifugation, and then applying DEPfor separation of normal and infected cells. This can be made, becausethe same antigenic and cytoskeleton changes occur in both cases, butmore dramatically in Plasmodium spp., where the production of thepigment hemozoin induces greater host cell modification.
This device has the potential of being incorporated into an inte-grated lab on a chip (LOC) device that performs cell sorting, cellcultivation and in vitro single-cell analysis. Such a LOC device might beused in the diagnostic of babesiosis in a near future. Incorporation of alysis region after the sorting module used, would allow DNA removal
63 mS/m phosphate buffer. Red spots are B. bovis infected erythrocytes stained withes). Arrows were added for clarity, black for normal RBCs and white for infected RBCs.alysis and estimated to be 50% at the end of the sorting procedure.
128 E.M. Nascimento et al. / Bioelectrochemistry 73 (2008) 123–128
to be used in a hybridization step similar to the reverse line blot tech-nique used for the diagnostic of babesiosis [22]. Such portable devicewould be suitable for the in situ diagnostic of Babesia spp. and similarprotozoan parasites. Most countries affected by the disease lack theequipment and infrastructures that would allow a rapid and efficientdiagnostic and a LOC device would reduce the diagnostics time re-sponse, preventing spread of the disease.
Acknowledgements
B. bovis clonal line Mo7 was kindly provided by Dr. Erik de Vries,from the Department of Infectious Diseases and Immunology, UtrechtUniversity, in the Netherlands.
Bovine blood from healthy donors was kindly provided by Dr. MariaIreneVasques andDr. JoãoMariaNeto fromEstação ZootécnicaNacional(EZN), in Portugal.
This work was supported by the European Community-fundedCellPROM project under the 6th Framework Programme, contract No.NMP4-CT-2004-50039.
References
[1] T. Müller, A. Pfennig, P. Klein, G. Gradl, M. Jäger, T. Schnelle, The potential of di-electrophoresis for single cell experiments, IEEE Eng. Med. Biol. Mag. 22 (6) (2003)51–61.
[2] J. Yang, Y. Huang, X. Wang, F. Becker, P. Gascoyne, Differential analysis of humanleukocytes by dielectrophoretic field-flow-fractionation, Biophys. J. 78 (2000)2680–2689.
[3] J. Gimsa, D. Wachner, A unified resistor-capacitor model for impedance, dielectro-phoresis, electrorotation, and induced transmembrane potential, Biophys. J. 75 (2)(1998) 1107–1116.
[4] P. Gascoyne, R. Pethig, J. Satayavivad, F. Becker, M. Ruchirawat, Dielectrophoreticdetection of changes in erythrocyte membranes following malarial infection,Biochim. Biophys. Acta 1323 (1997) 240–252.
[5] P. Gascoyne, J. Satayavivad, M. Ruchirawat, Microfluidic approaches to malariadetection, Acta Trop. 89 (3) (2004) 357–369.
[6] J.H. Nieuwenhuis, M.J. Vellekoop, Simulation study of dielectrophoretic particlesorters, Sens. Actuators, B 103 (2004) 331–338.
[7] W.C. Brown, J. Norimine, W.L. Goff, C.E. Suarez, T.F. Mcelwain, Prospects for recom-binant vaccines against Babesia bovis and related parasites, Parasite Immunol. 28(2006) 315–327.
[8] S.D. Rodriguez, G.M. Buening, C.A. Vega, C.A. Carson, Babesia bovis: purification andconcentration of merozoites and infected bovine erythrocytes, Exp. Parasitol. 61(1986) 236–243.
[9] A. Alkhalil, D. Hill, S. Desai, Babesia and plasmodia increase host erythrocytepermeability through distinct mechanisms, Cell. Microbiol. 9 (4) (2007) 851–860.
[10] C.R. Wyatt, W. Golf, W.C. Davis, A flow cytometric method for assessing viability ofintraerythrocytic hemoparasites, J. Immunol. Methods 24 (1991) 23–30.
[11] A. Fu, H. Chou, C. Spence, F. Arnold, S. Quake, An integrated microfabricated cellsorter, Anal. Chem. 74 (11) (2002) 2451–2457.
[12] M. Berger, J. Castelino, R. Huang, M. Shah, R. Austin, Design of a microfabricatedmagnetic cell separator, Electrophoresis 22 (2001) 3883–3892.
[13] M. Aikawa, J. Rabbege, S. Uni, M. Ristic, L. Miller, Structural alteration of the mem-brane of erythrocytes infectedwith Babesia bovis, Am. J. Trop. Med. Hyg. 34 (1) (1985)45–49.
[14] D.R. Allred, R.M. Cinque, T.J. Lane, K.P. Ahrens, Antigenic variation of parasite-derivedantigens on the surface of Babesia bovis-infected erythrocytes, Infect. Immun. 62 (1)(1994) 91–98.
[15] D.R. Allred, S.A. Hines, K.P. Ahrens, Isolate-specific parasite antigens of the Babesiabovis-infected erythrocyte surface, Mol. Biochem. Parasitol. 60 (1) (1993) 121–132.
[16] J.A. Curnow, Studies on antigenic changes and strain differences in Babesia argentinainfections, Aust. Vet. J. 49 (6) (1973) 279–283.
[17] J.M. Upston, A.M. Gero, Increased glucose permeability in Babesia bovis-infectederythrocytes, Int. J. Parasitol. 20 (1990) 69–76.
[18] M.G. Levy, M. Ristic, Babesia bovis: continuous cultivation in a microaerophilusstationary phase culture, Science 207 (1980) 1218–1220.
[19] C. Küttel, E. Nascimento, N. Demierre, T. Silva, T. Braschler, P. Renaud, A. Oliva,Label-free detection of Babesia bovis infected red blood cells using impedancespectroscopy on a microfabricated flow cytometer, Acta Trop. 102 (2007) 63–68.
[20] N.Demierre, T. Braschler, P. Linderholm,U. Seger,H. Lintel, P. Renaud,Characterizationand optimization of liquid electrodes for lateral dielectrophoresis, Lab Chip 7 (2007)355–365.
[21] T. Braschler, L. Metref, R. Zvitov-Marabi, H. Lintel, N. Demierre, J. Theytaz, P. Renaud,A simple pneumatic setup for driving microfluidics, Lab Chip 7 (2007) 420–422.
[22] L. Schnittger, H. Yin, B. Qi, M.J. Gubbels, D. Beyer, S. Niemann, F. Jongean, J.S. Ahmed,Simultaneous detection and differentiation of Theileria and Babesia parasitesinfecting small ruminants by reverse line blotting, Parasitol. Res. 92 (3) (2004)189–196.
Related Documents