I TECHNICAL REPORT I TR-76 -27-FEL I DIELECTRIC PROPERTIES OF FOODS Approved for public release; distribution unlimited. Massachusetts Institute of Technology Dept. of Nutrition and Food Science Cambridge, Massachusetts I Project Reference: 1 T762724AH99 I November 1976 I I Food Engineering Laboratory Fel-45

Welcome message from author
This document is posted to help you gain knowledge. Please leave a comment to let me know what you think about it! Share it to your friends and learn new things together.
Transcript

I TECHNICAL REPORT
I TR-76-27-FEL
I
DIELECTRIC PROPERTIES OF FOODS
Approved for public release;
distribution unlimited.
Massachusetts Institute of Technology
Dept. of Nutrition and Food Science
Cambridge, Massachusetts
I Project Reference: 1 T762724AH99
I November 1976
I
I
Food Engineering Laboratory Fel-45

Approved for public release; distribution unlimited.
Citation of trade names in this report does not constitute an official indorsement or approval of the use of such items.
Destroy this report when no longer needed. Do not return it to the originator.

UNCLASSIFIED SECURITY CLASSIFICATION OF THIS PAGE (When Dntn Entered)
REPORT DOCUMENTATION PAGE READ INSTRUCTIONS BEFORE COMPLETING FORM
1. REPORT NUMBER r GOVT ACCESSION NO. 3. R ECIPf ENT'S CATALOG NUMBER
76-27 - FEL 4. TITLE (and Subtitle) 5. TYPE OF R EPORT 11 PERIOD COVERED
Final DIELECTRIC PROPERTIES OF FOODS 14 June 72 - 15 June 75
6. PERF0:1MING ORG. REPORT NUMBER
FEL-45 7. AUTHOR(s) B. CONTRACT OR GRANT NUMB ER(a)
Daniel I . c. Wang and Samuel A. Goldblith DAAG17-72- C-JJ142
9. PERFORMING ORGANIZATION NAME AND ADDRESS 10. PROGRAM ELEMENT, PROJECT, T ASK
Massachusetts Institute of Technology AREA & WORK UNIT NUMBERS
Dept. of Nutrition and Food Science 1'J!762724AH99 Cambridge, Massachusetts 6.2 CA-006
11. CONTROLLING OFFICE NAME AND ADDRESS 12. REPORT DATE
US Army Natick Research and Development Command .August 1975 DmrnM- WS 13. NUMBER OF PAGES
Natick, MA 01760 26 14. MONITORING AGENCY NAME & ADDRESS(If different !tom Controlling Olllcr>) 15. SECURITY CLASS. (of this tepott)
UNCLASSIFIED
I Sa. DECLASSIFICATION/ DOWNGRADING SCHEDULE
16. DISTRIBUTION STATEMENT (of this Rr>porl)
Approved for public release; distribution unlimited.
17. DISTRIBUTION STATEMENT (of tho abstract r>nterod In Block 20, If different from Report)
I~ SUPPLEMENTARYNOTES
19. KEY WORDS (ContlnutJ on reverse side II nocosaary Bnd ldtJntlly by block number)
DIELECTRIC PROPERTIES MOISTURE FREQUENCY MEAT COAXIAL LINE TECHNIQUE FROZEN FOODS FOOD MICROWAVES THAWING TEMPERATURE PENETRATION DEPTHS COMPUTATIONS MEASUREMENT DEPTH HEATING
2Q, ABST'RACT (Coat.&we Cl<ll rever .. •Cd!J ff neceetra<y ami Identify by block numbet)
The purpose of the work reported herein was to provide dielectric properties data needed in the mathematical modelling of meat roasting in those cases involving the use of microwave energy.
Earlier measurements on the dependence of dielectric properties of meats on temperature at the microwave frequgncies of 2450, 915 and 300 ~~z have been extended to cover the range of -40 to +120°C. A coaxial line technique, with a shorted sample holder for frozen samples and quarter-wavelength holders for
DD FORM I JAN 73 UNCLASSIFIED 1473 EDinON OF I NOV 65 IS OBSOLETE
SECURITY CL.ASSIFICATtOI'I OF THIS PAGE (When Data Bntoted)

UNCLASSIFIED SECURITY CLASSIFICATION OF THIS PAGE(II'hon Data Entered)
20. (Abstract (Cont.)
samples above freezing is used for all measurements. The results are in general agreement with published data in the literature. For thawed samples, K' decreases with temperature and frequency but increases with moisture cor:tent.. K" on the other hand increases with temperature and moisture content but decreases with frequency. Calculatior:s using these dielectric data show that at high temperatures the differences in penetration depth and power absorption between the three frequencies are reduced.
UNCLASSIFIED SECURITY C L ASSIFICATION OF THIS PAGE(II'hen Data Entered)

SUMMARY
The dielectric properties of various types of meats have been determined as a function of frequency and temperature. The specific meat products which have been tested include raw beef, pork, chicken breast, chicken thigh, and turkey rolls. The frequencies which were employed in the dielectric measurements were 2450, 915, @Tid 300 ~~Z• The temperature range in these measurements was from -40 to +120 c. In addition, these precooked meats and their juices were also measured with respect to their dielectric properties 5t fre~encies of 2450, 915, and 300 MHz and temperatures ranging from 5 to 65 c.
1


PREFACE
Microwave energy is a technique which could lead to substantial improvements in the cooking process. In order to apply this technology most effectively, it is necessary to have a knowledge of the properties of foods which affect this heating performance. The dielectric constant and dielectric loss factor are the two rr.ost important properties which need to be determined. This report describes the results of measurements of the properties for beef, pork, chicken and turkey as a functior. of microwave frequency and temperature.
The work was performed under Project No. 1T762724AH99, Food Technology, Tech Area AH99C, Food Service Technology, Technical Effort AH99CA, studies on Garrison and Field Food Service Equipment. Dr. Robert v. Decareau and Mr. John c. Perry were the Project Officer and the Alternate Project Officer, respectively, for the US Army Natick Research and Development Command.
2


TABLE OF CONTENTS
Slunmary 0 • • • • 0 • • • • • • • • • • • • • • • • • • • • • • 1
Preface ••••
llst of Figures
llst of Tables
0 • • • • • • • • • • • • • • • • • • • • 0 • •
• • • • • • • • • • • • • • • • • • • • • • • •
• • • • • • • • • • • • • • • • • • • • • • • •
Introductior. • • • • • • • • • • • • • • • • • • • • • • • • •
Mat erials and Methods
2
4
5
6
A. Measurement Techniques and Equipment • • o • • • • • • 7
B. Sample Preparation •• • • • • • • • o• • • • • • • • • 8
Resul ts and Discussion •••••••••••••••••••••
References Cited • • ••••••••••••••• • ••••••
Figures 1 through 6 ••••••••••••••••• o • • ••
Tables 1 through 9 ••••••••••••••••••••• ••
3
8,9, 10
11
12- 17
18-26


LIST OF FIGURES
Figure 1: Schematic diagram of the open circulated low temperature holder for all three frequencies.
Figure 2 : Schematic diagram of the quarter wavelength holder for 2450 MHz, 5° to 65oc.
Figure 3:
Figure 4:
Figure 5:
Figure 6 :
Schematic diagram of the quarter wavelength holder for 900, 300 MHz, roo to 120oc.
Dielectric constant, K', of unsalted meats at 2450 MHz and 915 MHz, 5° to 120°C. Mean and standard deviations.
Dielectric loss, K", of unsalted meats at 2450, 915, and 300 MHz, 5° to 12ooc. Mean and standard deviations.
Half power penetration depth of raw unsalted meats at 2450, 916, and 300 MHz, 5° to 1200C. Mean and standard deviations.
4


LIST OF TABLES
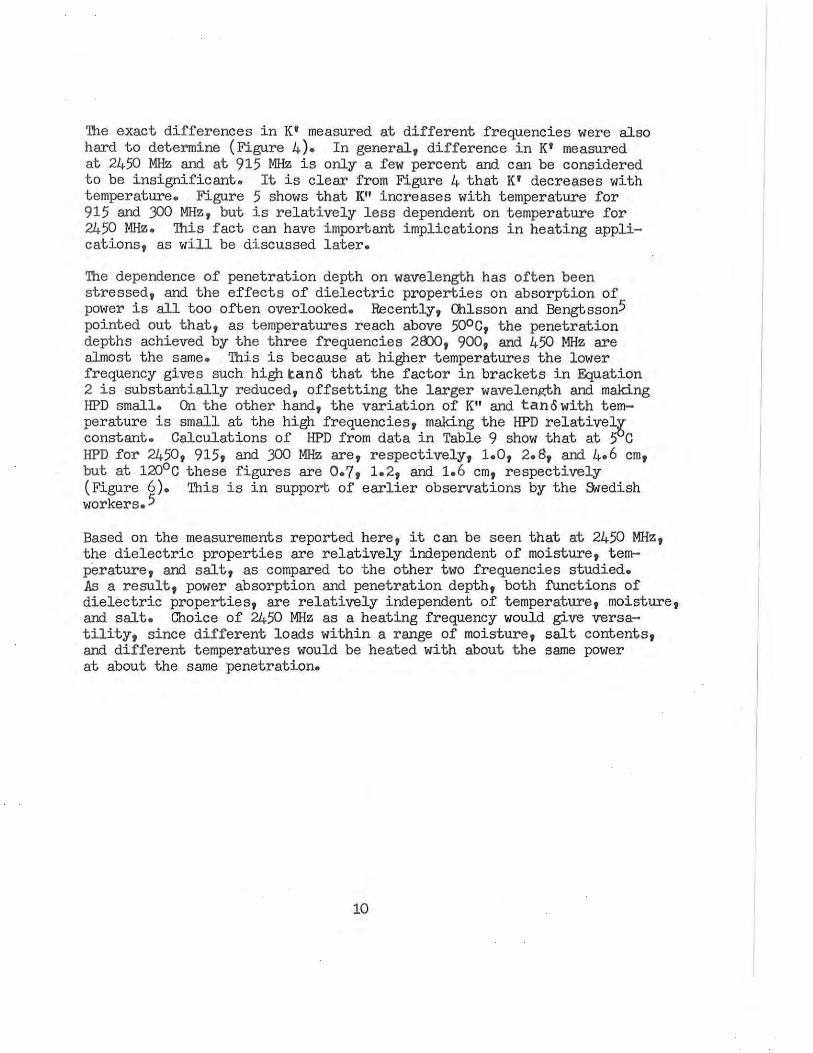
Table 1: Dimensions and Specifications of Coaxial Sample Holders.
Table 2: Dielectric Properties of Water Measured at Three Frequencies and Seven Temperatures.
Table 3: Dielectric Properties of Beef Products at 'lhree Frequencies and Different Temperatures.
Table 4: Dielectric Properties of Pork Products at 'lhree Frequencies and Different Temperatrires.
Table 5: Dielectric Properties of Chicken (Breast) at 'lhree Frequencies and Different Temperatures.
Table 6. Dielectric Properties of Chicken (Thigh) at 'lhree Frequencies and Different Temperatures.
Table 7: Dielectric Properties of 'furkey Products at Three Frequencies and Different Temperatures.
Table 8: Proximate Compositions for All Samples in Percent by Weight. Unsalted Meat Values are Mean ± Standard Deviation for Beef, Pork, Chicken.
Table 9: Dielectric Properties of Unsalted Meats (Beef, Pork, Chicken) at 'lhree Frequencies, Mean ± Standard Deviation.
5

DIELECTRIC PROPERTIES OF FOODS
Introduction
In the use of microwaves to heat foodstuffs, two parameters which determine the rate of heating are the amount of power (P) absorbed by the sample and the depth of penetration by the microwaves into the sample as measured by the half-power- penetration depth (HPD). Power absorption in watts per cubic centimeter is given by: i
P = 55 . 6 X lO - l 4 E2fK" (1)
where E is the electric field strength in volts/em, f the frequency in Hz and K" the relative dielectric loss. The half-power-penetration depth is defi ned as the depth in the sample at which the power level is reduced to 50% of the incident power at the surface. It can be calculated by:2
HPD = A. ln 2 2 (J< 1 ) 1/2
2 1/2 [ 2 1/2 I .J
(l+tal1 o ) - 1 ( 2)
where HPD has the units of"' the wavelength, and the K' is the relative dielectric constant, tan2 c is the ratio K"/K' or the loss tangent. Given a microwave field of fixed intensity and frequency, the dependence of a food's heating ..:haracterist.ics on its dielec·l.ric properties K' and K" are indicated in Equations 1 and 2. Although there have been numerous published data on the dielectric properties of foods3 and agricultural products,4 there was until recently5 no information on the dielectric properties of meat products from the frozen state up to sterilization temperatures. The purpose of this report is to provide a summary of the results of dielectric measurements from the start of this project in June 1972 to date.
1. Goldblith, S.A. Adv. Food Res. 12:277, 1967 I
2. I\ischner, H. Heating and Microwaves; Phillips, Technical Library, Springer-Verlag, New York, 1966.
3· Goldblith, S.A., and R.V. Decareau, An Annotated Bibliography on Microwaves; MIT Press, Cambridge, 1973•
4• Tinga, W.R., And S.O. Nelson. J. Microwave Power g (1):23, 1973•
5o Ohlsson, T., and N.E. Bengtsson. J. Microwave Power 10 (1):93, 1975·
6

II. Materials and Methods
A. Measurement technique and equipment.
Details of the measurement technigue using the coaxial line6 method have been described for high loss? as well as low loss8 samples. For measurements in the temperature range of -400 to +65oc, klystron tubes were used to generate the 2450 and 915 MHz signals and an oscillator (General Radio, Concord, Massach11setts) was used to supply the 300-MHZ signal. For the high temperature measurements, a crystal oscillator (Lektronics Lab, Philadelphia, Pennsylvania) which simultaneously puts out signals at 900 and 300 MHz was used so that the same sample holder could be used to measure one sample at the two lower frequencies. Figures 1 to 3, respectively, show sample holders used to measure frozen samples, thawed samples up to 65°C, and thawed samples from 80°C to 120°C. All holders are constructed of brass with a one-inch inner-diameter outer conductor and a 3/8-inch outer-diameter center conductor. All but the open circuited low loss holder for low temperatures had alumina bottom covers. A total of six sample holders were constructed for these measurements, each with specifications shown in Table 1.
Temperature control was achieved using a constant temperature bath with a Haake E51 thermostated heater. Water was used in the bath for temperatures between 50 and 65oc. Mineral oil was used for higher temperatures. Sample holders were immersed, and ten minutes was allowed for temperature equilibration. For the below-freezing temperatures, a refrigerated bath (Tenney Engineering, Union, New Jersey) was used to circulate cooled denatured ethanol to the styrofoam insulated holder (Figure 1). Because of the size of the sample at these temperatures, one hour was allowed for temperature equilibration. Temperatures in the holder were monitored by a thermocouple with ice/ water reference junction. At temperatures below ambient, dry nitrogen was used to purge the holder and remove moisture condensation which would otherwise markedly affect the measurements.
6. Roberts, s., and A.J. von Hippel. Appl. Phys. 17(6):610, 1946.
7• To, E.C. MS Thesis. MIT, 1974•
8. Pace, W.E. MS Thesis, MIT, 1967.
7

Measurements were started at the low end of the range (5° or 8Qo respectively in the water or oil bath) working up. In low temperature measurements, the sample was cooled to-20~ first, then -4ooc. Calculations were done by computer using the two programs of Westphal and Iglesias.9
B. Sample preparation.
All meat samples were brought fresh from local supermarkets. Turkey roll used was a commercial frozen product (Tbp Frost) which contained added salt. Sample preparation, storage, cooking, and rendering of the cooked juices as well as loading techniques have been described.? For the low temperature measurements, the frozen meat (unground) was allowed to thaw slightly in order to facilitate cutting into blocks. A specially designed borer 1.5 inches in diameter was used to bore out disks about two inches thick• These are cut into one-em disks in a cutter with micrometer advance, and then cut to conform to the dimensions of the coaxial line using a doughnut-shaped cutter. Eight to ten disks were then stacked into the holder to give a sample thickness of about 10 em. The exact sample thickness was obtained by difference in micrometer depth gauge measurements of the empty and filled holder. Thermal expansion of the sample was assumed negligible compared to its length. Moisture content of the samples was determined by vacuum oven drying, 4 to S hours at 95oc . Protein content was determir:::;d by micro- kjeldahl10 and ash content by muffle- furnace at 450°c.10 Fat content was determined by the method of Bligh and Dyer.11
III. Results and Discussion
The coaxial line technique and other forms of dielectric measurement methods such as resonant cavities are accurate only for samples with tano less than one. In such cases the error is estimated at about 3f~12 With foodstuffs, tano of four is common at high temperatures and low frequencies. The accuracy of the method is then reduced, due partly to the fact that very thin samples have to be used, whose thickness have to be accurately known (Table 1).
9· Westphal, W.B., and J. Iglesias. Technical Report A.FML-TR-71-66, Air Force Materials Laboratories, Ohio, 1971.
10. Horwitz, w., ed. Official Methods of Analysis of the AOAC, 11th edition; AOAC, Washington, DC, 1970.
11. Bligh, E.G., and W.J.Dyer. Can. J. Biochem. Physiol. J1~911, 1959·
12. West.phal, W.B. personal corrununication, 1975· g

The method's prec1s1on is determined largely by the degree of homogeneity of the sample and the reproducibility of packing the samples into the holder. The standard deviation of repeatedly packing the same meat sample into a holder has been found to be about 5% of the mean value, 7 and this should serve as an indicator of degree of sample preparation reproducibility. As a calibration check, water is measured at the three frequencies 24501 9151 and 300 MHz from 5° to 65oc (Table 2) . The results were in agreement with values for water at these frequencies calculated using the Debye equations and literature parameters. 1j
Dielectric properties of the five meat. samples are presented ir. Tables 3 through 7 and their proximate compositions are given in Table 9· As has been pointed out? the added salt in turkey gives this sample a significantly higher dielectric loss at all temperatures and frequencies except in the frozen state. Effects of salt on the dielectric constant of thawed samples were also not evident as found in the studies. Taking into account the differences in frequency and possible packing densit~, the data for beef and pork were in agreement with literature values.> ·
The proximate compositions of the four unsalted raw meats (beef, pork, chicken breast, and chicken thigh) are very similar (Table 8). '!heir moisture contents show a standard deviation of 2.3.% of their mean, and the less active dielectric components such as protein and fat show a total standard deviation of 2.6% from their combined mean. Similarly, the cooked meats and cooked meat juices of these meats show proximate compositions very similar to one another. However, as a result of cooking, the variations in the moisture and solids contents were larger than in the case for the raw meats. The standard deviation in the moisture content, the component which has the most effect on dielectric properties, was found to be 5.1% of their combined mean. Based on this, the data for unsalted meats (Tables 4 through 7) are pooled to give the dielectric properties of fresh meat products (Table 9) . It should be mentioned that presenting the data collectively is not construed to mean that the dielectric properties of all meats are identical. The results were presented in this fashion only as a convenient way for achieving a reduced format.
The dependence of dielectric constant and dielectric loss of unsalted raw meats on temperature and frequency are shown in Figures 4 and 5, respectively. In all cases, the standard deviations in K' and K" of the different unsalted meats were less than 101~ · Considering the sensitivity of the coaxial line method and an estimated error of 101~ the slight differences in the dielectric properties of unsalted meats was not detected.
13. Collie, C. H., J .B. Hasted and D.M. Ritson. Proc. Phys. Soc . (I.Dndon) 60(2) :145, 1948.
9
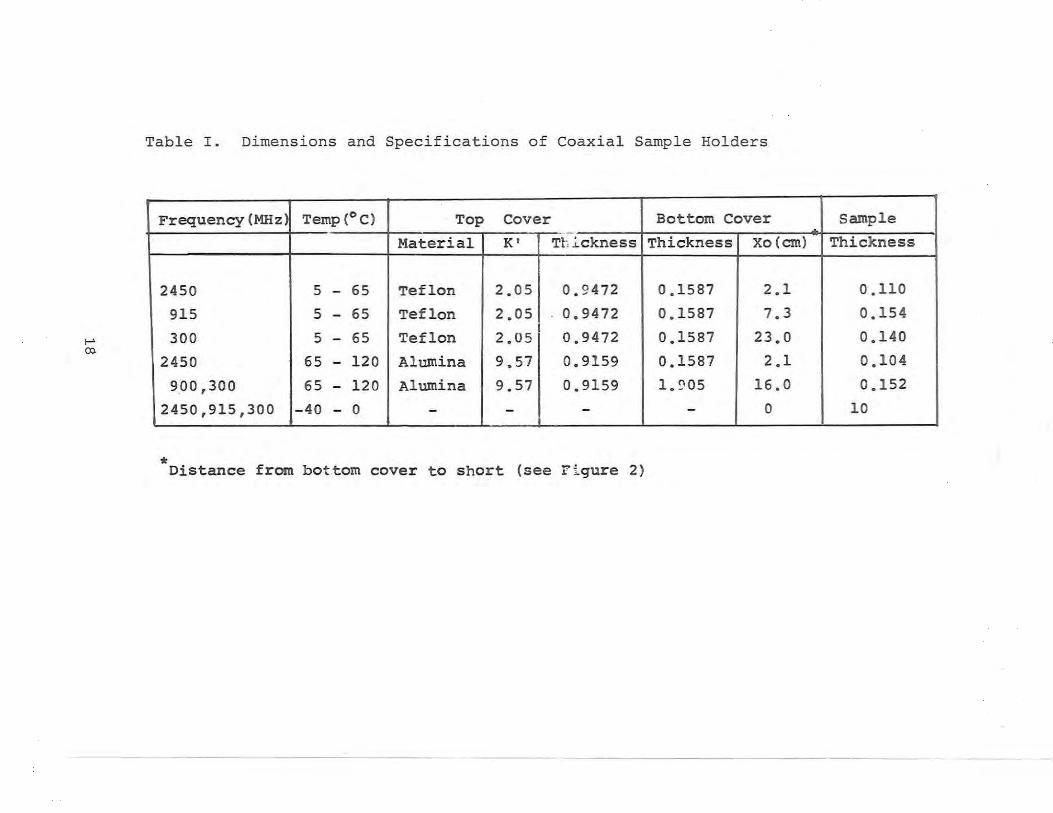
The exact differences in K' measured at different frequencies were also hard to determine (Figure 4). In general, difference in K' measured at 2450 MHz and at 915 MHZ is only a few percent and can be considered to be insignificant. It is clear from Figure 4 that K' decreases with temperature. Figure 5 shows that K" increases with temperature for 915 and .300 MHz, but is relatively less dependent on temperature for 2450 MHz. This fact can have important implications in heating applications, as will be discussed later.
The dependence of penetration depth on wavelength has often been stressed, and the effects of dielectric properties on absorption of power is all too often overlooked. Recently, Ohlsson and Bengtsson5 pointed out that, as temperatures reach above 50oc, the penetration depths achieved by the three frequencies 2800, 900, and 450 MHz are almost the same. This is because at higher temperatures the lower frequency gives such high tano that the factor in brackets in Equation 2 is substantially reduced, offsetting the larger wavelength and making HPD small. On the other hand, the variation of K" and tano with temperature is small at the high frequencies, making the HPD relativel~ constant. Calculations of HPD from data in Table 9 show that at 5 C HPD for 2450, 915, and 300 MHZ are, respectively, 1.0, 2.8, and 4.6 em, but at 120°C these figures are 0.7, 1.2, and 1.6 em, respectively (Figure 6). This is in support of earlier observations by the Swedish workers.5
Based on the measurements reported here, it can be seen that at 2450 MHz, the dielectric properties are relatively independent of moisture, temperature, and salt, as compared to the other two frequencies studied. As a result, power absorption and penetration depth, both functions of dielectric properties, are relatively independent of temperature, moisture, and salt. Choice of 2450 MHz as a heating frequency would give versatility, since different loads within a range of moisture, salt contents, and different temperatures would be heated with about the same power at about the same penetration.
10

References Cited
1. Goldblith, S.A. Adv. Food Res. 12:277, 1967
2. 1\rschner, H. Heating and Microwaves; Fhillips, Technical Library, Springer-Verlag, New York, 1966.
3· Goldblith, S.A., and R.v. Decareau, An Annotated Bibliography on Microwaves; MIT Press, Cambridge, 1973.
4• Tinga, W.R., and S.O. Nelson. J. Microwave Power g (1):23, 1973•
5. Ohlsson, T., and N.E. Bengtsson. J. Microwave Power 10 (1):93, 1975·
6. Roberts, s., and A. J. yon H::.ppel. Appl. Fhys. 17 ( 6) :610, 1946.
7• To, E.C. MS Thesis, MIT, 1974•
e. Pace, W.E. MS Thesis, MIT, 1967.
9• Westphal, W.B., and J. Iglesias. Technical Report .AFML-TR-71-66, Air Force Materials Laboratories, Ohio, 1971.
10. Horwitz, w., ed. Official Methods of Analysis of the AOAC, 11th edition; AOAC, Washington, DC, 1970.
1l. Bligh, E.G., and W.J. Dyer. Can. J. Biochem. Physiol • .lL,:911, 1959·
12. Westphal, W.B. per~onal communication, 1975·
13. Collie( C·r·~ J.B. Hasted and D.M. Ritson. (London) 60 2 :145, 194S.
11
Proc. Fhyso Soc.

...... !\)
. . .
..
NITROGEN IN
WARM WATER COIL
COOLANT OUT
STYROFOAM JACKET
SAMPLE
COOLANT IN
SCREW
THERMOCOUPLE
COOLANT IN
Figure 1: Schematic diagram of the open circulated low temperature holder
for all three frequencies.

..... w
T EFLON COVER
ftEXOLIT E PIN
SAMPLE SPACE
ALUMINA
r-
tl
-= ~ - . .. . . . . . :. . - . . . .
,...- u ·--'-··. ..... '/ -•
,..,
I
I'J
~
. . p . . .. .. . . .
. ·. ~ I ·.· . . .. ......... l-
• ~ ~
x. ~
_l -~
I ~~
r-
--
CENTER CONDUCTOR
NITROGEN IN
BRASS SLEEV£
CLAMP RING
0- RING
WATER OUT
VENT
WATER IN
Figure 2: Schematic diagram of the q uarter wavelength ho lder for 24 50 MHz ,
5 to 65°C .

f-' +-
TOP ALUMINA COVER
SAMPLE SPACE
CLAMP RING
0 - RING
BOTTOM ALUMINA
OIL IN
Figure 3: Schematic diagram of the quarter wavelength holder for 900, 300 MHz,
80 to l20°C.

60
91~ Me
50
K' 24~0
. 40
120
TEMPER A TU R E ( o C )
Figure 4: Dielectric constant K' of unsalted meats at 2450
and 915 MHz , 5 to 120°C. Mean and standard
deviations.
15

150 ~----------------------------------~
100
K"
so
2450 Me
5 65 80 100 120
TEMPERATURE (°C)
Figure 5: Dielectric loss K" of unsalted meats at 2450,
915, and 300 MHz, 5 to 120°C. Mean and standard
deviations .
16

0
-~ 4 l -z ~ Q.
"' 0
z 0 ~ c a:: ~
"' z "' Q.
a::
"' ~ 0 Q.
-~
..J c %
300 Me
0
3 I
2
I~. I l"" •
l 91e Me
0
0------~.------£ -------~ - o ---o 1 ~-..........._
0 .......... ..L o ....
J. ~ .... ~
• l~
• 1" ..... 1 .....
..1. 1
2450 Me
45 65 100 120
TEMPERATURE
Figure 6: Half Power Penetration Depth of raw unsalted
meats at 2450, 915, and 300 MHz , 5 t o l20°C.
Mean a nd standard deviation .
17
I-" ro
Table I. Dimensions and Spe cifications of Coaxial Sample Holders
Frequency (MHz ) Temp (°C) Top Cover Bottom Cover
Material K' Tr, .i..ckness Thickness Xo(cm)
2450 5 - 65 Teflon 2.05 0. 9472 0 . 1587 2.1
915 5 - 65 Teflon 2.05 . 0.9472 0 . 1587 7.3
300 5 - 65 Teflon 2 .05 I
0.9472 0.1587 23.0
2450 65 - 120 Alumina 9.57 0.9159 0.1587 2.1
900,300 65 - 120 Alumina 9.57 0.9159 1.~05 16.0
2450,915,300 - 40 - 0 - - - - 0
* Distance from bottom cover to short (see I' igure 2 )
sample
Thickness ' I
0 . 110
0.154
0.140
0.104
0.152
10

...... -..!)
Table 2 : : Dielectric Properties of Water Measured at Three Frequencies
and Seven Temperatures
Temp. 2450 MHz 915 MHZ 300 MHZ
oc K' K" TAN K' K" TAN K' !<:"
5 81.2 13.8 0.170 85.6 5.98 0.070 81.1 2 . 22
15 80.4 11.7 0.146 82.3 4.47 0.054 77.4 1.69
25 76.7 8.88 0.116 78.1 3.41 0.044 73 . 5 1.40
35 73.6 6.99 0.095 74.6 ·2. 64 0.035 69.4 1 . 09
45 70.6 5 .77 0.082 71.1 2.l7 0.031 65.7 0.89
55 * * * 67 . 7 1.75 0.026 61.8 0.83
65 64.6 3.99 0.062 64.0 1.41 0.022 58.0 0.77
*Data not taken
TAN
0.027
0.022
0 . 019
0. 016 I
0.014
0.013
0.013

Table 3 Dielectric Properties of Beef Products at Three Frequencies
and Different Temperatures
Temp. 2450 HHz 915 MHz 300 MHZ
K' K" TAN K' K" TAN K' K" TAN oc I Sample: Raw Beef I
I
- 40 3.5 0.13 0.037 3.6 0.21 0.058 3.9 0 . 34 0 0 0 87 I
- 20 4.4 0.51 0.120 4.8 0.54 0.110 5.4 0 .97 0 .180 5 52.9 19.3 0.365 57.2 .-. 9.8 0.346 59.3 47.6 0.803
25 52.4 17 . 3 0.330 54.5 22 . 4 0.411 55 . 1 66 . 9 1.21 I
45 51.0 17.5 0.342 53.1 27.7 0.521 49.8 87.5 1. 76 65 47.6 18.1 0.380 50.6 33.2 0.656 43.9 112 2.55 80 44.1 19. 5 0.442 45 .7 33.1 0.720 54.3 110 2 . 03
100 43.2 22.3 0.523 43.0 37.5 0.870 52.8 128 2 . 47 110 42.6 22.8 0.535 41.8 39.8 0.950 51.9 133 2.56
~ 115 40. 5 24.2 0.598 41.1 40.9 0.990 51.4 135 2 . 63 120 39.7 25 . 1 0.632 40.5 42.0 1 . 04 50 . ? 1 40 2.75
Sample: Coo~ed Beef 5 29.0 10.9 0.377 33.5 12.2 0.365 38.0 23.5 0.619
25 31.1 10.3 0.331 35.3 15.0 0.425 39.1 38.1 0.975 45 29.9 1(1.1 0.338 34.9 18.3 0.525 37.7 52.7 1.40 65 26 . 9 9.9 0.369 31.7 19 . 9 0.627 35.8 57.1 1.60
Sample : Cooked Beef Juice 5 68.9 24.0 0.349 82.0 29.8 0.363 87.4 63.6 0.728
25 65.1 22.0 0.337 76.8 35.8 0.466 80.1 94.1 1.17 45 60.0 22.1 0.369 71.3 44.1 0.619 74.7 125 1.67 65 54.3 23.7 0.437 65.7 52.9 0.805 62.4 164 2 . 63

l\) .......
Table 4 : Dielectric Properties of Pork Products at Three
Frequencies and Different Temperatures
Temp. 2450 MHZ 915 MHz
oc K' K" TAN K' K" TAN
sample: Raw Pork -40 3.5 0.13 0.037 3.6 0.15 0.042 -2 0 4.0 0. 56 0.140 4.4 0.63 0.140
5 51.1 18.6 0.363 55.7 19.3 0.345 25 51.4 16.9 0.329 54.3 22.7 0.418 45 50.9 17.7 0.348 53.1 28.2 0.531 65 48.9 19.6 0.400 52.2 34.2 0.654 80 43.3 18.2 0.420 44.6 . 38.4 0.860
100 41.9 21.7 0.518 42.0 44.0 1.05 110 40.8 22.3 0.547 40.5 47.0 1.16 115 40.0 22.8 0. 570 39.6 48.4 1.22 120 38. 1) 23.6 0.620 38.6 49.8 1.29
Sample: Cooked Pork 5 28.8 10.6 0.367 31.4 10.6 0.337
25 30.2 10.1 0.333 32.1 12.7 0.396 45 29.7 10.3 0.346 31.9 15.8 0.494 65 28.0 10.6 0.378 30.2 17.7 0.585
Sample: Cooked Pork Juice 5 69.0 26.2 0.382 82.7 30.8 0.371
25 66.0 25.2 0.381 78.0 38.2 0.489 45 61.7 26.9 0.435 73.1 46.9 0.641 65 56.8 28.7 0.505 67.3 58.8 0.873
300 MHz
K' K" TAN
4.0 0.29 0.073 5 . 5 1.14 0.210
6l.r-: 36.5 0 . 592 61 . 4 53.2 0.866 61.4 74.0 1.21 58.7 92.2 1.57 54.7 91.5 1.67 51.3 109 2.12 49.2 118 2.40 48.0 122 2 . 5 4 46.5 126 2 .71
37.6 20 . 5 0.545 38.9 29.9 0.768 39.7 39.8 1.00 39.2 47. 3 1.21
89.9 69.3 0.770 80.2 104 1.30 76.9 139 1.81 67.8 178 2.63
-

l\) l\)
Table 5: Dielectric Properties of Chicken (Breast ) at Three
Frequencies and Different Temperatures
Temp. 2450 MHZ 915 MHZ
oc K' K" TAN K' K" TAN
Sample: Raw Chicken(B~east) - 40 3.5 0.15 0.043 3.7 0.22 0.059 -20 4.0 0 . 51 0.130 4.6 J.87 0.190
5 54.6 27.0 0.380 61.8 21.7 0.351 25 55.2 19.3 0.349 61.1 25.8 0.422 45 54.1 19.9 0.367 59.7 31.7 0.530 65 52.1 21.8 0.418 57.8 38.5 0.665 80 47.9 20.2 0.422 49.6 32.5 0.650
100 45.6 25.5 0.559 47.6 . 38.0 0.790 110 44.9 27.1 0.604 46.9 42.2 0.900 115 43.5 28.0 0.644 46.2 43.5 0.930 120 43.1 28.9 0.671 45.9 46.1 1.00
Sample: cooked Chicken(Breast) 5 37.7 14.5 0.385 40.4 14.8 0.365
25 39.1 13.7 0.351 41.0 17.7 0.432 45 37.1 13 , 6 0.365 40.9 21.9 0.535 65 34.2 13.9 0.406 38.3 24.5 0.640
Sample: Cooked Chicken(Breast) Juice 5 65.9 27.1 0.411 85.5 32.1 0.375
25 65.9 25.0 0.379 81.7 38.8 0.474 45 61.6 26.9 0.436 77.1 47.4 0.615 65 55.9 28.7 0.513 71.2 56.8 0.798
300 MHZ
K' K" TAN
4.0 0.40 0.100 5.3 1.31 0.250
67.9 40.0 0 . 588 67.4 57 . 5 0.854 66.6 78.8 1.18 64.8 104 1.60 56.7 95,0 1.67 55.0 111 2.02 53.8 125 2.32 53.0 128 2.42 52.5 133 2.54
49.3 29.0 0.589 50.7 42.0 0.827 51.1 55.5 1.09 48.8 63.3 1.30
92.2 65 . 6 0.712 87.4 96.4 1.10 82.4 130 1.58 71.0 167 2.36

l\) \.;.)
Table 6: Dielectric Properties of Chicken (Thigh) at Three
Frequencies and Different Temperatures
Temp. 2450 MHz 915 MHz
K' K" TAN K' K" TAN oc Sample: Raw Chicken(Thigh) - 40 3.5 0.15 0.043 3.7 0.22 0.059 - 20 3.9 0.54 0.140 4.7 0.54 0.110
5 54.4 19.3 0.355 59 . 7 19.3 0.323 25 54.7 17.6 0.322 58 . 5 22.9 0.391 45 53.6 18.2 0.338 57.2 28.1 0.492 65 51.7 20.0 0.386 55.6 34.4 0.618 80 46.3 19.7 0.425 46.9 34.1 0.720
100 43.8 24.0 0.548 45.3 39.8 0.870 110 42.3 26.2 0.619 44.1 43.2 0.960 115 42.0 26.6 0.633 43.8 45.0 1.02 120 41.5 27.0 0.651 43.1 46.1 1.07
Sample: cooked Chicken(Thigh) 5 39.7 13.9 0.350 42.7 13.5 0.315
25 40.9 12.8 0.313 42.7 16.1 0.376 45 39 . 5 12.8 0.323 42.5 20.1 0.472 65 34.5 12.8 0.372 39 .0 22.5 0.576
Sample: Cooked Chicken(Thigh) Juice 5 67.4 23.7 0.352 78.7 24.5 0.311
25 67.5 20.8 0.308 76.0 29.7 0.391 45 63.1 21.4 0.338 71.2 36 . 7 0.514 65 57.8 22.5 0.389 66.2 43 .7 0.660
- --
300 MHZ
K' K" TAN
4.0 0.40 0.100 5.4 1.10 0.200
65.8 38.4 0.582 67.9 57.7 0.849 64.6 76.6 1.19 64.0 102 1.61 50.3 91.0 1 . 82 48.8 107 2.19 48.3 119 2 .46 48.0 125 2.60 47.5 127 2.67
I
49.9 26.6 0.532 50.2 37.8 0.752 50.3 51.3 1.02 47.7 59 . 2 1.24
82.7 53.1 0.641 76.9 76.8 0.997 70.2 106 1.51 63.3 133 2.09

~
Table 7: Dielectric Properties o f Turkey Products at Three
Frequencies and Differ ent Temperatures
Temp . 2450 MHZ 915 MHZ
oc K' K" TAN K' K" TAN
' Sample : Raw Turkey Roll - 40 3.5 0.13 0 . 037 3.6 0.17 0.0 47 - 20 4.1 0 . 61 0.150 4.5 0.73 0.160
5 5 5 .2 21.6 0.406 60 . 2 26 . 4 0. 438 25 53.7 21.5 0 . 399 59 .9 33.2 0 . 555 45 52.5 23.8 0.453 58 . 3 42.8 0.734 65 50.7 26.8 0.629 56 . 6 . 53.1 0.937 80 45.2 25. 0 0 . 553 48.8
I 69.0 1.41
100 44.5 27 .1 0.609 47.9 7 8 .7 1.64 110 42 .4 29 . 2 0.689 47 . 4 83.4 1.76 115 41.8 29.9 0.715 47.2 85.8 1.81 120 39.8 30 . 3 0.761 49.9 88 . 2 1.88
Sample: Cooked Turkey Roll
I 5 38.2 16.1 0.421 41.6 19.7 0.472 25 39.7 16 . 7 0.420 43 .0 ~6. 1 0.607 45 37 . 3 17 . 2 0.459 41. 4 -~2 0 4 0.782 65 34.4 17 . 8 0.517 37 . 7 36 . 9 0.980
sample: Cooked Turkey - Roll Juice 5 70.3 29.7 0.421 j 78.5
44 . 3 0.565 25 67 . 5 30.9 0.4 57 74.5 57.5 0.771 45 62.9 35.4 0 . 563 69.5 74.0 1.06 65 56.8 40 . 1 0.705 62 . 9 90.6 1 .42
------ - - ---- -- - - ------ -- ---------
300 MHZ
K ' K" TAN
:
3.8 0.29 0 .076 5.3 1.21 0.230
67.3 58.1 0 . 860 67. 0 86 . 2 1 . 29 65. 4 118 1. 81 61. 6 159 2 . 59 46. 4 179 3 . 87 43 . 3 205 4 .74 42.9 218 5 . 1 0 41.1 22 4 5. 45 40 .4 231 5. 73
46.5 44. 9 0 . 966 47 . 1 66.7 1. 42 44 . 8 27.5 1.96 36.5 92.8 2.55
86.3 115 1.33 82.1 166 2 . 02 72.9 224 3. 07 62.9 285 4 .53

1\) Vt
Table s ·: Proximate Compositions for all Samples in Percent by Weight.
State
Cooked
Raw
Cooked Juice
Unsalted Meat Values are Mean ± Standard Deviation for
Beef, Pork, Chicken
Sample Moisture Protein Fat
Turkey Roll 66.5 28.7 4.0 Beef 63.9 29.4 5.3 Pork 57 . 2 31.1 10.4 Chicken (Breast) 66.3 32.5 1.5 Chicken (Thigh ) 69.1 27.5 5.7
Unsalted Meats 64.1±5.1 30 .1±2.2 5.7±3.6
Turkey Roll 73.8 22.1 2 . 8 Beef 74.1 22.7 2.6 Pork 69.9 23.2 5.7 Chicken(Breast) 73.6 25.2 1.3 Chicken(Thigh) 75.3 21.1 3.5
Unsalted Meats 73.2±2.3 23.1±1 .7 3 . 3±1.9
Turkey Roll 91.9 5.0 1.4 Beef 93.1 4.6 1.5 Pork 91 .1 3.8 5 .8 Chicken (Breast) 92.3 5.9 1.0 Chi cken (Thigh) 86.4 4.4 8 . 3
Unsalted Meats 90.7±3.0 4.7±0.9 4.2±3 .5
Ash
1.5 1.1 1.3 1.2 1.0
1.2±0.1
1.4 I
1.1 1.2 1.2 1.0
1.1±0.1
2.1 1.3 1.4 1.2 0.9
1.2±0.2 - - ----- --

~
Table :9 .: Dielectric Properties ~f Unsalted Meats (Beef , Pork,
Chicken) at Three Frequencies , Mean ± Standard Deviation
Temp. 2450 MHZ 915 MHZ
oc K' K" K' K" K' . 1
Sample: Raw Uns~lted Meats - 40 3. 5 0 0.14±0.01 3. 64±0 . J 6 0.19±0.03 3.90±0.09 - 20 4.08±0.19 0 .55±0.04 4.60±0.16 0.66±0.14 5 . 30±0 .08
. 5 53.4±1.6 19. 5±0.9 58.6±2 .7 20.0±1.1 63.7±3.9 25 53.4±1.8 17.8±1.1 57.1±3 . 3 23 . 5±1.6 63.0±6.0 45 52.4±1.7 18.3±1.1 55 . 8±3 •. 3 28.9±1.9 60 . 6±7.5 65 50.1±2.2 19 .9 ±1. 5 54.1±3 . 3 35.1±2.3 57.9±10 80 45.4±2.1 19.4±0.9 46.7±2.1 34.5±2.7 52.5±4.1
100 43.6±1.5 23.4±1.7 44.5±2 . 5 39.8±3.0 50.6±4.4 110 42.7±1.7 24.6±2.4 43.3±2.8 43.1±3.0 49.2±4.2 115 41.5±1.6 25 .4±2.3 42.7±2.9 44 . 5±3 . 1 4 8 . 3±4.6 120 40.7±2.0 26.2±2.3 42.0±3.7 46.0±3 .2 47.5±4.7
Sample : Cooked Uns alted Meats 5 33.8±5.7 12. 5 ±2.0 37. 0± 5 •. f, 12.7±1.8 43.7±6.8
25 35.3±5.5 12.2±2.3 37.8±4.) 15 .4±2 .1 44.7±6.6 45 34.1±5.0 11.7±1 . 8 37.6±5 .0 19.0±2 . 6 44.7±7.0 65 30.9±4 . 0 11 . 8±1.9 34.8±4.5 21.1±3 . 0 42.9±6.4
Sample: Cooked Juice of Uns alted Me ats 5 67.8±1.5 25.3±1.7 82.2±2.8 29.3±3.3 88.1±4. 1
25 66.1±1.0 25.3±2 . 2 78 . 1±2.5 35.6±4.2 81 . 2±4 .4 45 61.6±1 . 3 24.3±3 .0 73.2±2 . 8 43.8 ±4.9 76.1±5.1 65 56.2±1. 5 25.9±3 . 3 67.6±2.5 53.1±6.7 66 . 1±4.0
300 MHZ
K"
0.34±0.06 1.14±0.13 40.6±4.9 58.8±5 .8 79 . 2±5.9
103 ±8.2 91 .6±2.5
114 ±9.6 124 ±6.9 128 ±5.6 132 ±6.5
24.9±3 .7 37.0±5.1 49.8±6.9 56 . 7±6 .8
62. ~ ± 7.0 92.8±12
125 ±14 160 ±19
Related Documents