Dicke narrowing in the dispersion mode of detection and in noise-immune cavity-enhanced optical heterodyne molecular spectroscopy—theory and experimental verification Junyang Wang, Patrick Ehlers, Isak Silander, and Ove Axner* Department of Physics, Umeå University, SE-901 87 Umeå, Sweden *Corresponding author: [email protected] Received May 31, 2011; accepted July 21, 2011; posted August 10, 2011 (Doc. ID 148350); published September 6, 2011 Dicke narrowing in both the absorption and dispersion modes of detection have been scrutinized by noise-immune cavity-enhanced optical heterodyne molecular spectroscopy (NICE-OHMS) using an isolated transition in the v 1 þ v 3 þ v 1 4 - v 1 4 band of acetylene [P e ð33Þ at 6439:371 cm -1 ] at room temperature. The results represent the first (to our knowledge) demonstration of Dicke narrowing detected in dispersion, as well as by NICE-OHMS, and the paper provides thereby the first comparison of the Dicke narrowing phenomenon for the two modes of detection. It is shown that Dicke narrowing in dispersion can be described by the dispersive counterparts to the conventional Galatry and Rautian absorption line-shape functions, which are explicitly given. Spectroscopic parameters for the targeted transition were extracted in both absorption and dispersion and found to be in agreement with those previously reported for other lines and bands. The shortcomings of the Galatry model to provide physically relevant parameters in this pressure range are discussed. © 2011 Optical Society of America OCIS codes: 020.3690, 260.2030, 300.1030, 300.6310, 300.6360. 1. INTRODUCTION Spectral line shapes of molecules in the gas phase are deter- mined primarily by two broadening mechanisms, Doppler and pressure broadening. When both of these are present and they are independent of each other, the resulting line shape is given by the Voigt function. However, when the mean free path of the molecules under study is of the same order of magnitude as (or shorter than) the wavelength of the transition, the in- creased collision rate between the molecules affects the velo- city distribution of the molecules, resulting in a narrower Doppler profile. Under these conditions, the Voigt line-shape function does not properly describe the situation. This colli- sional narrowing effect was first predicted by Dicke in 1953 [1], and it is therefore referred to as Dicke narrowing. A large number of investigations (≫100) of the Dicke nar- rowing effect have been performed since then, for example, [2–17]. One work of particular importance is that of Henry et al. [7], who not only performed a methodical investigation of CO perturbed by various collision partners (Xe, Ar, Ne, He, and N 2 ) but also provided a thorough review of the field up to then. Other, more recent works are, for example, concerned with investigations of the pressure broadening of near-IR water spectra in the 935 nm spectral region [9], self-colliding CO 2 molecules [10], and the temperature and pressure depen- dence of broadening coefficients of acetylene [11–14] and methane [15–17]. Despite all these works, no single theoretical description that can account for the effect under all types of conditions has so far been presented. Instead, the phenomen- on is described by a few different theoretical descriptions [18–27], each valid under its own set of experimental condi- tions, of which the Galatry and the Rautian models are the most common (modeling so-called soft and hard types of collisions, respectively) [18,20]. A comprehensive summary of the various models used to describe Dicke narrowing has thereafter also been given by others, e.g., Henry et al. [7] and Casa et al. [10]. Of importance here is also the recent work of Lepère that discusses the limitations and advantages of various line-shape functions [28]. All these works show that when proper assignments of spectroscopic parameters are to be made, or when accurate assessments of species concentra- tions are to be performed, these effects need to be taken into account. However, according to the authors’ knowledge, all the de- monstrations and investigations of the Dicke narrowing effect presented so far have been performed by absorption spectro- metry, modeled by various absorption line-shape functions; there is yet no demonstration or investigation of the Dicke narrowing effect by the dispersion mode of detection. Its influence on dispersion line shapes or dispersive signals is therefore generally not known. The dispersion line shape is the basis for the types of spec- troscopic techniques that rely on interference between two or several modes of light. Examples of such techniques are fre- quency modulation spectroscopy (FMS), and thereby also noise-immune cavity-enhanced optical heterodyne molecular spectroscopy (NICE-OHMS), and Faraday modulation or rotation spectrometry (FAMOS or FRS). In FMS, the phase of cw light is modulated at a high mega- hertz (or a low gigahertz) frequency to create sidebands (normally a pair of sidebands, so as to produce a triplet) [29,30]. At the detector, the modes will interfere coherently with each other, creating two beat signals at the modulation frequency (each formed between the carrier and a sideband), 2390 J. Opt. Soc. Am. B / Vol. 28, No. 10 / October 2011 Wang et al. 0740-3224/11/102390-12$15.00/0 © 2011 Optical Society of America

Welcome message from author
This document is posted to help you gain knowledge. Please leave a comment to let me know what you think about it! Share it to your friends and learn new things together.
Transcript

Dicke narrowing in the dispersion mode of detection andin noise-immune cavity-enhanced optical heterodyne
molecular spectroscopy—theory andexperimental verification
Junyang Wang, Patrick Ehlers, Isak Silander, and Ove Axner*
Department of Physics, Umeå University, SE-901 87 Umeå, Sweden*Corresponding author: [email protected]
Received May 31, 2011; accepted July 21, 2011;posted August 10, 2011 (Doc. ID 148350); published September 6, 2011
Dicke narrowing in both the absorption and dispersionmodes of detection have been scrutinized by noise-immunecavity-enhanced optical heterodyne molecular spectroscopy (NICE-OHMS) using an isolated transition in the v1 þv3 þ v14 − v14 band of acetylene [Peð33Þ at 6439:371 cm−1] at room temperature. The results represent the first (to ourknowledge) demonstration of Dicke narrowing detected in dispersion, as well as by NICE-OHMS, and the paperprovides thereby the first comparison of the Dicke narrowing phenomenon for the two modes of detection. It isshown that Dicke narrowing in dispersion can be described by the dispersive counterparts to the conventionalGalatry and Rautian absorption line-shape functions, which are explicitly given. Spectroscopic parameters for thetargeted transition were extracted in both absorption and dispersion and found to be in agreement with thosepreviously reported for other lines and bands. The shortcomings of the Galatry model to provide physicallyrelevant parameters in this pressure range are discussed. © 2011 Optical Society of America
OCIS codes: 020.3690, 260.2030, 300.1030, 300.6310, 300.6360.
1. INTRODUCTIONSpectral line shapes of molecules in the gas phase are deter-mined primarily by two broadening mechanisms, Doppler andpressure broadening. When both of these are present and theyare independent of each other, the resulting line shape is givenby the Voigt function. However, when the mean free path ofthe molecules under study is of the same order of magnitudeas (or shorter than) the wavelength of the transition, the in-creased collision rate between the molecules affects the velo-city distribution of the molecules, resulting in a narrowerDoppler profile. Under these conditions, the Voigt line-shapefunction does not properly describe the situation. This colli-sional narrowing effect was first predicted by Dicke in 1953[1], and it is therefore referred to as Dicke narrowing.
A large number of investigations (≫100) of the Dicke nar-rowing effect have been performed since then, for example,[2–17]. One work of particular importance is that of Henryet al. [7], who not only performed a methodical investigationof CO perturbed by various collision partners (Xe, Ar, Ne, He,and N2) but also provided a thorough review of the field up tothen. Other, more recent works are, for example, concernedwith investigations of the pressure broadening of near-IRwater spectra in the 935 nm spectral region [9], self-collidingCO2 molecules [10], and the temperature and pressure depen-dence of broadening coefficients of acetylene [11–14] andmethane [15–17]. Despite all these works, no single theoreticaldescription that can account for the effect under all types ofconditions has so far been presented. Instead, the phenomen-on is described by a few different theoretical descriptions[18–27], each valid under its own set of experimental condi-tions, of which the Galatry and the Rautian models are the
most common (modeling so-called soft and hard types ofcollisions, respectively) [18,20]. A comprehensive summaryof the various models used to describe Dicke narrowinghas thereafter also been given by others, e.g., Henry et al.[7] and Casa et al. [10]. Of importance here is also the recentwork of Lepère that discusses the limitations and advantagesof various line-shape functions [28]. All these works show thatwhen proper assignments of spectroscopic parameters are tobe made, or when accurate assessments of species concentra-tions are to be performed, these effects need to be taken intoaccount.
However, according to the authors’ knowledge, all the de-monstrations and investigations of the Dicke narrowing effectpresented so far have been performed by absorption spectro-metry, modeled by various absorption line-shape functions;there is yet no demonstration or investigation of the Dickenarrowing effect by the dispersion mode of detection. Itsinfluence on dispersion line shapes or dispersive signals istherefore generally not known.
The dispersion line shape is the basis for the types of spec-troscopic techniques that rely on interference between two orseveral modes of light. Examples of such techniques are fre-quency modulation spectroscopy (FMS), and thereby alsonoise-immune cavity-enhanced optical heterodyne molecularspectroscopy (NICE-OHMS), and Faraday modulation orrotation spectrometry (FAMOS or FRS).
In FMS, the phase of cw light is modulated at a high mega-hertz (or a low gigahertz) frequency to create sidebands(normally a pair of sidebands, so as to produce a triplet)[29,30]. At the detector, the modes will interfere coherentlywith each other, creating two beat signals at the modulationfrequency (each formed between the carrier and a sideband),
2390 J. Opt. Soc. Am. B / Vol. 28, No. 10 / October 2011 Wang et al.
0740-3224/11/102390-12$15.00/0 © 2011 Optical Society of America

which, in the absence of absorbers, fully cancel. However, asthe modes propagate through a medium consisting of gaseousatomic or molecular species, they will, in the proximity of atransition, experience dissimilar amounts of absorption aswell as dispersion, which will upset this balance and give riseto a net beat signal. By demodulating the detector signal at themodulation frequency at an appropriate phase, either an ab-sorption or a dispersion signal (or a combination thereof) willappear. Advantages of the technique are that it is inherentlybackground-free (it measures differences between pairs ofmodes, which exist solely in the presence of a wavelength-dependent transmission, e.g., from absorbing species) andthat it, by its high modulation frequency, significantly elimi-nates the influence of technical noise.
In NICE-OHMS, FMS is combined with cavity enhancement(CE) to increase the interaction length with the absorber[31–35]. By choosing a modulation frequency equal to the freespectral range (FSR) of the cavity, each laser mode will betransmitted through the cavity through its own cavity mode.Because any laser frequency noise will affect all laser modesequally and the FMS technique is background-free, the tech-nique will be immune to laser frequency noise. The combina-tion of noise reduction (by the FMS technique), increasedinteraction length (by the cavity), and noise immunity (bychoosing a modulation frequency equal to the FSR) impliesthat NICE-OHMS is an exceptionally powerful technique forsensitive trace gas detection [34,35]. As for FMS, the detectedsignal can be demodulated at any phase.
FAMOS, finally, is based upon the principle that a magneticfield lifts the degeneracy of states of a paramagnetic species,addressed by laser light in such a way that left- and right-handed circular polarized light will, in the vicinity of a transi-tion, experience dissimilar indices of refraction and therebybe phase shifted dissimilarly, which is determined by the dis-persion of the medium [36–42]. The signal is proportional tothe tilting of the plane of polarization of linearly polarizedlight, which, in turn, is given by the difference between thephase shifts of the two circularly polarized light componentsand, thereby, also the difference between two (or several)dispersive line-shape functions.
Hence, while FAMOS is a technique that fully relies on dis-persion, the FMS and NICE-OHMS techniques can detect anycombination of absorption and dispersion signal. In reality,though, dispersion is often the preferred mode of detectionfor these techniques also. One reason is that they are oftenaffected by etalon effects, which reduce their sensitivity aswell as the accuracy by which concentration assessments canbe done. Whittaker et al. [43] have shown though that in FMS,background signals from short etalons (primarily those withan FSR that is larger than the modulation frequency) will in-fluence the absorption signal more than its dispersion coun-terpart. Another is that when the frequency modulation isperformed by a fiber-based electro-optic modulator (EOM),as has become commonplace in fiber-based NICE-OHMSinstrumentation [44–49], background signals from cross cou-pling of light with perpendicular directions of polarization canappear [50]. However, as was recently shown by Foltynowiczet al. [51], both these types of background signals can be elimi-nated by the use of a titanium diffusion waveguide EOM withthe DC response controlled by active feedback. A limitation of
this background reducing methodology, though, is that itworks solely for the dispersion mode of detection.
This paper investigates the Dicke narrowing effect in NICE-OHMS at both absorption and dispersion phases, which pre-sumably is the first time the Dicke narrowing effect is detectedin dispersion mode or by NICE-OHMS. Recently, Foltynowiczet al. [52] developed a NICE-OHMS system based on a narrowlinewidth distributed-feedback (DFB) laser with a mode-hop-free tuning range of 65GHz. The wide tunability of thislaser provides the possibility of performing NICE-OHMS un-der a variety of pressures, including the range in which Dickenarrowing is prominent. With a minimum of alterations, theinstrumentation thereby provided a convenient ability to in-vestigate the effect of Dicke narrowing on NICE-OHMS andits influence on dispersion.
It is assumed that the dispersive counterparts to the con-ventional Galatry and Rautian absorption line-shape func-tions, which are explicitly given and here referred to as theGalatry and Rautian dispersion line-shape functions [53], de-scribe the Dicke narrowing effect in dispersion accurately.These line-shape functions are first compared to the corre-sponding (and more familiar) Voigt dispersion line-shapefunction. For reasons of identification, an analysis is then per-formed of the expected residuals when NICE-OHMS signalsbased on the conventional Voigt profile (which thus doesnot account for the narrowing effect) are fitted to signalsaffected by Dicke narrowing (modeled by the Rautian absorp-tion and dispersion line-shape functions).
Using an isolated acetylene transition at 6439:371 cm−1 un-der room temperature conditions, it is experimentally demon-strated that the Dicke narrowing effect appears not only inabsorption but also in the dispersion mode of detection. Byfitting expressions for the NICE-OHMS signal based uponthe Voigt as well as the presumed Galatry and the Rautiandispersion line-shape functions to the acquired data, it wasverified that the two latter types of line-shape functions de-scribe the measured dispersive NICE-OHMS line profiles well(and more accurately than the Voigt profile does) in the typi-cal Dicke narrowing region (i.e., in the 10–40Torr region), andthat these functions thereby also account for the Dickenarrowing effect in dispersion.
In addition, in agreement with previous findings for absorp-tion [10], it is noted that the two types of models (Galatry andRautian) provide dissimilar collisional narrowing coefficients,with the Galatry giving rise to larger coefficients than theRautian, but where the latter shows the best agreement withpredictions made by gas kinetics [54]. Moreover, it is finallyshown that spectroscopic parameters for the narrowing pro-cess assessed by the Rautian model in absorption and disper-sion agree to within a couple of percentage points, and thatthey also agree with those extracted from similar lines inthe same or other vibrational bands. All this supports the formof the Rautian dispersive line-shape function.
2. THEORYA. Line-Shape ModelsAs has been discussed repeatedly in the literature, wheneverDoppler broadening and collisional broadening can be consid-ered to take place independently, the line-shape function isgiven by a convolution of a Gaussian and a Lorentzian lineshape, termed the Voigt line shape. The Voigt absorption
Wang et al. Vol. 28, No. 10 / October 2011 / J. Opt. Soc. Am. B 2391

and dispersion line-shape functions, which are related to eachother according to the Kramers–Kronig relations [55,56], canbe expressed in terms of the real and imaginary parts of acommon complex error function, Wða; bÞ, as
χabsV ¼ffiffiffiffiffiffiffiffiln 2
pcffiffiffiπp ΓDRe½Wðx; yÞ� ð1Þ
and
χdispV ¼ −
ffiffiffiffiffiffiffiffiln 2
pcffiffiffiπp ΓDIm½Wðx; yÞ�; ð2Þ
respectively, where c is the speed of light and ΓD is theDoppler HWHM width [57]. The x and y parameters representthe Doppler-width-normalized detuning and the Doppler-width-normalized collisional broadening (also referred to asthe Voigt parameter), defined as
x ¼ffiffiffiffiffiffiffiffiln 2
p ΔνΓD
ð3Þ
and
y ¼ffiffiffiffiffiffiffiffiln 2
p ΓL
ΓD; ð4Þ
respectively, where Δν is the frequency detuning from the ab-sorption profile center, given by ν − ν0, and ΓL is the collisionwidth (HWHM), which, in turn, is given by the product of apressure broadening coefficient Bp and the gas pressure p.
However, as was alluded to above, collisions do not onlyintroduce spectral line broadening, but they can also narrowspectral profiles due to a velocity-averaging effect [1]. Thiscollisional narrowing effect can be explained by the uncer-tainty principle [2], which says that the position and momen-tum cannot both be measured simultaneously, and that theyobey the inequality
ΔxΔp ≥ ℏ; ð5Þ
where x is now the position, p is the momentum of the mo-lecule, and ℏ is the reduced Planck constant. Since a photoncarries a momentum of h=λ, this implies that it can only pro-vide information about displacements of a molecule largerthan λ=2π. The velocity of a molecule measured by theDoppler shift of a photon will therefore be its mean velocitycomponent (in the direction of observation) for displacementsof λ=2π [2].
For low collision rates, for which the mean free path, Λ, islonger than the wavelength of the light (more precisely, whenΛ ≫ λ=2π), the distribution of molecular velocities is given bythe conventional thermal Maxwellian distribution, which pro-vides the ordinary Doppler profile. However, when the meanfree path Λ ≤ λ=2π, the mean velocity during a collision (i.e.,the time it takes for the molecule to travel the distance Δx) isaveraged due to perturbations from colliding partners, whichresults in a reduced mean velocity. Such a velocity-changingeffect from collisions gives rise to a narrowing of the Dopplerprofile, which constitutes the Dicke narrowing effect.
The most commonly used models for taking collisional nar-rowing effects into account, which model the collisions of themolecules with their collision partners as either soft or hard
types of collisions, give rise to the line-shape functions termedGalatry [18] and Rautian [20], respectively. Although alsoother types of models have been used to investigate the effectof collisional narrowing in absorption, e.g., those includingcorrelations [21], these two models are the ones that are usedin this work to model the Dicke narrowing effect in dispersionand for analysis of the influence of Dicke narrowing onNICE-OHMS.
The soft collision model, proposed by Galatry [18], is basedupon the assumption that the velocity of an absorbing mole-cule is strongly correlated with its velocity prior to a collision.This model thus predominantly considers collisions betweenheavy absorbers and light perturbers. In this case, the absorp-tion line-shape function can be written as
χabsG ¼ffiffiffiffiffiffiffiffiln 2
pc
πΓDRe
�1
ð1=2zÞ þ y − ix
×M
�1; 1þ 1
2z2þ y − ix
z;12z2
��; ð6Þ
where Mða; b; cÞ is a confluent hypergeometric function andx and y are given by Eqs. (3) and (4). The dimensionlessparameter z is defined as
z ¼ffiffiffiffiffiffiffiffiln 2
p βsoftΓD
; ð7Þ
where βsoft is the effective frequency of velocity-changingcollisions, given by βsoft ¼ β0softp, where, in turn, β0soft is thecollisional narrowing coefficient for soft collisions.
The dispersive line-shape function that corresponds to theGalatry absorption line-shape function can be obtained by rea-soning; no explicit derivation is needed. As was mentionedabove, since we are considering a linearly responding med-ium, the absorption and dispersion responses need to be re-lated to each other according to the Kramers–Kronig relations[55,56]. Moreover, since the line-shape function for absorptionis expressed in terms of the real part of a complex line-shapefunction, the corresponding dispersion line shape should, asfor the Voigt profile, be given by the (negative of the) imagin-ary part of the same complex line-shape function. This impliesthat the dispersion line-shape function for the Galatry modelshould be given by
χdispG ¼ −
ffiffiffiffiffiffiffiffiln 2
pc
πΓDIm
�1
ð1=2zÞ þ y − ix
×M
�1; 1þ 1
2z2þ y − ix
z;1
2z2
��: ð8Þ
The model for hard collisions, proposed by Rautian andSobel’man [20], which thus mainly models collisions betweenlight absorbers and heavy perturbers, is based upon the as-sumption that the absorbing molecules completely lose thememory of their physical state (in this case their velocity)before a collision. In this model, the absorption line-shapefunction can be written
χabsR ¼ffiffiffiffiffiffiffiffiln 2
pcffiffiffiπp ΓDRe
�Wðx; yþ ζÞ
1 −ffiffiffiπp ζWðx; yþ ζÞ
�; ð9Þ
2392 J. Opt. Soc. Am. B / Vol. 28, No. 10 / October 2011 Wang et al.
where ζ is a dimensionless parameter defined as
ζ ¼ffiffiffiffiffiffiffiffiln 2
p βhardΓD
: ð10Þ
βhard is the total collision frequency, given by β0hardp, whereβ0hard is the collisional narrowing coefficient for hardcollisions.
Using the same argument as above, this implies that the dis-persion line-shape function for the Rautian model should read
χdispR ¼ −
ffiffiffiffiffiffiffiffiln 2
pcffiffiffiπp ΓDIm
�Wðx; yþ ζÞ
1 −ffiffiffiπp ζWðx; yþ ζÞ
�: ð11Þ
The effective frequency of velocity-changing collisions (forsoft collisions), βsoft, and the total collision frequency for hardcollisions, βhard, which are both given in frequency units, are inthis work henceforth, for simplicity, both referred to as thenarrowing frequencies.
For reasons of comparison and analysis, the narrowing fre-quencies (given in hertz) can be compared to the dynamicalfriction parameter, βdiff , predicted by gas kinetics, which,when also expressed in hertz, is given by [7,10]
βdiff ¼kBT2πmD
; ð12Þ
where kB is the Boltzmann constant (joules/Kelvin), T is thetemperature (Kelvin),m is the mass of the absorbing molecule(in kilograms), and D is the mass diffusion coefficient(centimeters squared per second). SinceD is inversely propor-tional to pressure, βdiff will be proportional to pressure,whereby it is possible to formally express βdiff as β0diffp. Thisimplies, finally, that the collisional narrowing coefficients forsoft and hard collisions, β0soft and β0hard, respectively, canconveniently be compared to β0diff as defined above.
B. NICE-OHMS SignalsAs was discussed above, NICE-OHMS is built upon frequencymodulated (fm) laser light that forms a triplet, i.e., consistingof one carrier and two sidebands, where the various modesare separated by the FSR of the cavity. As is shown by Schmidtet al. [45], the fm NICE-OHMS signal, Sfm-noðΔν; θÞ, demodu-lated at a detection phase θ, can in general be written as acombination of an absorption and a dispersion line-shapefunction, χabsðΔνÞ and χdispðΔνÞ, viz. as
Sfm-noðΔν; θÞ ¼ ηfmFπ J0ðβÞJ1ðβÞP0ScrelpL
× f½χabsðΔν − νmÞ − χabsðΔνþ νmÞ� sin θþ ½χdispðΔν − νmÞ − 2χdispðΔνÞþ χdispðΔνþ νmÞ� cos θg; ð13Þ
where ηfm is an instrumentation factor, F is the cavity finesse,JnðβÞ is a Bessel function of order nwhere β is the modulationindex, P0 is the power incident on the transmission detector, Sis the integrated line strength of the transition addressed,crel is the relative concentration (mole fraction) of absorbers,and L is the cavity length. The expression within the curlybrackets, comprising five separate absorption and dispersion
line-shape functions and the detection phase, is referred to asthe NICE-OHMS line-shape function.
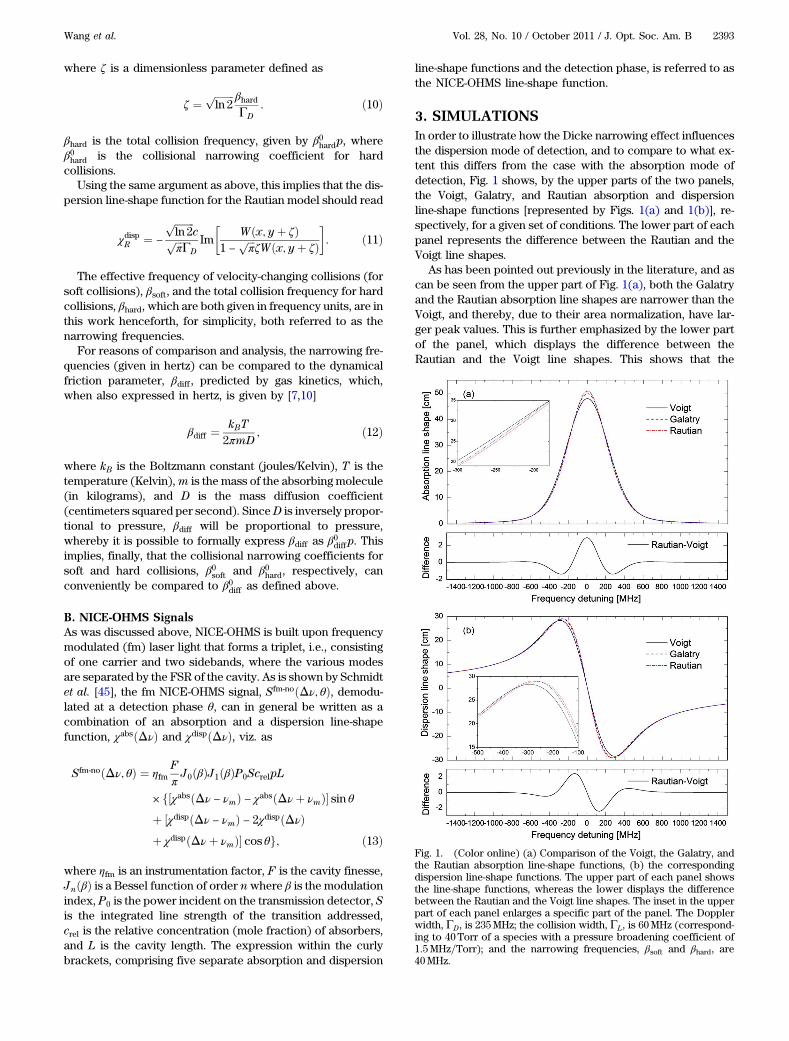
3. SIMULATIONSIn order to illustrate how the Dicke narrowing effect influencesthe dispersion mode of detection, and to compare to what ex-tent this differs from the case with the absorption mode ofdetection, Fig. 1 shows, by the upper parts of the two panels,the Voigt, Galatry, and Rautian absorption and dispersionline-shape functions [represented by Figs. 1(a) and 1(b)], re-spectively, for a given set of conditions. The lower part of eachpanel represents the difference between the Rautian and theVoigt line shapes.
As has been pointed out previously in the literature, and ascan be seen from the upper part of Fig. 1(a), both the Galatryand the Rautian absorption line shapes are narrower than theVoigt, and thereby, due to their area normalization, have lar-ger peak values. This is further emphasized by the lower partof the panel, which displays the difference between theRautian and the Voigt line shapes. This shows that the
Fig. 1. (Color online) (a) Comparison of the Voigt, the Galatry, andthe Rautian absorption line-shape functions, (b) the correspondingdispersion line-shape functions. The upper part of each panel showsthe line-shape functions, whereas the lower displays the differencebetween the Rautian and the Voigt line shapes. The inset in the upperpart of each panel enlarges a specific part of the panel. The Dopplerwidth, ΓD, is 235MHz; the collision width, ΓL, is 60MHz (correspond-ing to 40Torr of a species with a pressure broadening coefficient of1:5MHz=Torr); and the narrowing frequencies, βsoft and βhard, are40MHz.
Wang et al. Vol. 28, No. 10 / October 2011 / J. Opt. Soc. Am. B 2393

difference between the peak values of the two line shapes canbe a few percent of the total line shape (in this case 5%).Figure 1(b) shows that the corresponding Galatry and Rautiandispersion line-shape functions have (in comparison to theVoigt dispersion line-shape function) a steeper slope aroundthe resonance and also a narrower width (their maxima arecloser to the resonance). For this particular case, their slopesdiffer by several percent (17% for the case with Rautian).It can further be noticed that whereas the differences in theabsorption profiles have an even symmetry, the differencesbetween the corresponding dispersion line shapes have anodd symmetry.
In order to illustrate how the Dicke narrowing effect influ-ences NICE-OHMS, simulations of the NICE-OHMS signalbased upon the Rautian profile were made (for the sameset of conditions as used for Fig. 1 and for a cavity FSR of381MHz). NICE-OHMS signals based upon a Voigt profilewere then fitted to the simulated signals (for both the absorp-tion and dispersion modes of detection). Figure 2 shows, inthe upper part of each panel, by the individual markers andthe solid curve, the simulated data and the corresponding fit,respectively, for the absorption and dispersion modes ofdetection [represented by Figs. 2(a) and 2(b), respectively].The residuals are given in the lower part of each panel. Ascan be seen from the figure, the characteristic residuals of theabsorption and dispersion NICE-OHMS signals are similar andcomprise a regular odd symmetry wavelike pattern consistingof a number of peaks and troughs. A difference between thetwo is though that in absorption, the residual peaks in the cen-ter are larger, while the outermost peaks are larger for thedispersion mode of detection. In other words, the absorption
signal deviates the most in the center, whereas the dispersionsignal shows the largest deviations further out.
Since the NICE-OHMS signal is composed of several line-shape functions (two for the absorption mode of detection,three for the dispersion, and five in the general case), the ex-act shape and the strength of the residuals (and thereby theinfluence of Dicke narrowing on NICE-OHMS) do not onlydepend on the detection phase but also on the relative widths(Doppler as well as pressure) of the transition probed withrespect to the FSR of the cavity (i.e., the separation of the la-ser modes). Fits of Voigt profiles to a NICE-OHMS line-shapefunction based upon the Galatry profile provide similar typesof residuals (not shown).
4. EXPERIMENTAL SETUP ANDPROCEDURESThe experimental setup was based on an instrumentation de-veloped by Foltynowicz et al. [52]. As is described in somedetail in [52], this system comprises a narrow linewidthDFB laser (NEL, NLK1C6DAAA) with a mode-hop-free tuningrange of 65GHz, whose light is directed into a cavity consist-ing of high reflectivity mirrors, mounted on piezoelectrictransducers (PZTs) and separated by a Zerodur (SchottAG) spacer by a distance of 39:4 cm, giving rise to an FSRof 381MHz.
As is illustrated by Fig. 3, except for a couple of optical iso-lators, the light from the laser was first sent through a fiber-based acousto-optic modulator (AOM, AA Opto-Electronic,MT110-IIR25-3FIO). The zeroth order output of the AOMwas sent through a fiber-based electro-optic modulator(EOM, General Photonics, LPM-001-15), which produced side-bands for both locking of the laser (at 20MHz) and the FMSdetection (at the frequency equal to the FSR of the cavity), thelatter with a modulation index of 0.44. After passing an outputcoupler, a part of this light was split off by a polarizing beamsplitter (PBS) cube and directed onto a reference detector(PD3, New Focus, model 1611). By feedback to the AOM,the power of the light impinging onto the reference detectorwas stabilized to 0:9mW. The part of the light exiting the EOMthat was not split off was directed toward, and spatially modematched with, the sample cavity. Using the light reflected by
Fig. 2. Theoretical simulations of the influence of Dicke narrowingon NICE-OHMS signals at a pressure of 40Torr detected in (a) absorp-tion and (b) dispersion. The solid markers represent simulated NICE-OHMS signals using Rautian line-shape functions, whereas the solidcurves indicate the corresponding fitted NICE-OHMS signals usingVoigt line-shape functions. The residuals are shown below each panel.The parameter values are the same as in Fig. 1.
Fig. 3. Schematic illustration of the experimental setup. Bold linesare optical fibers, dotted lines are free space beam propagation,and thin lines with arrows are electrical wires. OI, optical isolator;AOM, acousto-optic modulator; EOM, electro-optic modulator; pol.,polarizer; λ=2, half-wave plate; λ=4, quarter-wave plate; PBS, polariz-ing beam splitter; PD, photodetector; Ph, phase shifter; BP, bandpassfilter; LP, low pass filter; DBM, double balanced mixer; col1 and col2,collimators.
2394 J. Opt. Soc. Am. B / Vol. 28, No. 10 / October 2011 Wang et al.

the cavity, detected by a reflection detector (PD1, New Focus,model 1611), the laser was locked to a cavity mode by thePound–Drever–Hall (PDH) technique [58]. When the laser fre-quency was resonant with the cavity mode, the transmittedpower through the cavity (when being empty) was 0:58mW.This light, which, in the presence of absorbers, also containsthe NICE-OHMS signal, was then directed onto a transmissiondetector (PD2, New Focus, model 1611).
The NICE-OHMS signal was produced by demodulating thesignal from the transmission detector at the modulationfrequency (at the appropriate detection phase) by a doublebalanced mixer (DBM, Mini-Circuits, ZLW-1). The signal fromthe mixer was amplified and low-pass-filtered with a band-width of 500Hz.
The modulation frequency was locked to the FSR of thecavity by the DeVoe and Brewer technique [59]. With the laserlocked to a cavity mode, and the modulation frequency lockedto the FSR, scanning was performed by altering the length ofthe cavity by applying a triangular voltage ramp of 1Hz to thePZT glued to the input mirror. The NICE-OHMS signal wascollected by a 16bit data acquisition card and recorded bya personal computer.
Since the laser frequency follows the cavity mode instanta-neously, any nonlinear behavior of the PZTs or their driverswill affect the laser scan. To correct for any possible nonli-nearity of the frequency scale (which is of importance forline-shape investigations), a reference cavity (not scanned)was added to the setup. The reference cavity had a similar de-sign to the sample cavity, implying that it was made fromZerodur onto which a flat input mirror and a concave outputmirror (radius of curvature 1m) were glued. It had a finesse of4800 and length of 39:48 cm, which gave rise to an FSRof 379:92MHz.
The first order output of the AOM was mode matched bythe use of a single lens to fit the TEM00 mode of the referencecavity. After passing the cavity, the light was detected by aphotodetector (PD4, New Focus, model 2033). Since Zeroduris a glass material with an extremely small thermal expansioncoefficient (<10−7 K−1) one order of magnitude below that ofthe best metal alloy, i.e., Invar, it provided stable and well de-fined (narrow) frequency makers (corresponding to longitudi-nal modes of the cavity spaced with the cavity’s FSR) thatcould be used for linearization of the frequency scale. Alow pass filter (of RC type) with a corner frequency of 500Hzwas used to allow for detection of the sharp frequency mar-kers produced by the reference cavity, which were then usedto linearize the frequency scale, using a nonlinear polynomialfit. This frequency linearization procedure had the advantagein comparison with the methodology previously used (inwhich the sample cavity was used to create markers duringa separate scan with the laser unlocked) [52] due to the factthat the laser did not have to be unlocked. Since the repeat-ability of consecutive scans was better than the standard de-viation of the assessed widths of the fits, it sufficed to make anassessment of the frequency scale immediately after eachseries of measurements of NICE-OHMS signals, with the laserfrequency still locked to the sample cavity mode (using thesame instrumentation settings as during the signal acquisi-tion). In addition, to assess the wavelength of the line targeted,a fiber splitter (Thorlabs, 1550 PMC 10=90) was introduced to
split off some of the light from the first order output of theAOM to a wavemeter (Burleigh, WA-1500).
Another modification in the setup was that the positions ofthe optical components were optimized according to the eta-lon immune principle [43,51], which says that a frequencymodulated signal does not contain any background signalsfrom etalons whose FSR is equal to a multiple of the modula-tion frequency in the dispersion phase or a multiple of half themodulation frequency in the absorption phase. Therefore, thefree space optical components were, as far as possible, phy-sically separated by multiples of the cavity length (39:4 cm). Inthe original setup [52], this was realized for a few optical com-ponents, primarily the detectors. Here the positions of theother components were also optimized according to the sameprinciple. By exchanging the input coupling lens to one with afocal length of 75 cm, collimator 1 (col1) could be positioned118 cm from the input cavity mirror (i.e., at three times thecavity length). The beam splitter cube and the polarizer werethen placed 39 cm and 79 cm from the input cavity mirror, re-spectively. The half-wave plate was placed immediately afterthe polarizer so as to be as close as possible to the optimumposition.
Since Dicke narrowing had not previously been detected bydispersion, one of our aims was to correctly verify the pre-sumed Galatry and Rautian dispersion line-shape functions,so experiments were performed on a well isolated transitionof acetylene (which thus has no or little interference fromneighboring lines). However, since the spectrum of C2H2
is fairly dense in the working range of the DFB laser(1549–1555nm), with ample partly overlapping transitions,measurements had to be performed on a line that has notyet been listed or identified in the HITRAN database.
With the laser locked to a cavity mode and its frequencytuned to the center part of the sub-Doppler NICE-OHMS signalin the dispersion phase, the position of the targeted transitionline could be assessed as 6439:371 cm−1 by the use of thewavemeter. The integrated line strength of the transition wasdetermined by comparing its signal size in the Doppler-broadened regime to that of a known line [the Peð4Þ line in thev2 þ v3 þ 2v04 band at 6439:591 cm−1, which has an integratedline strength of 3:827 × 10−24 cm−1=ðmolecules cm−2Þ at23 °C]. The line strength of the targeted line was assessed to5:51 × 10−24 cm−1=ðmolecules cm−2Þ at the same temperature.
A closer analysis of the HITRAN database suggests that thetargeted transition is the Peð33Þ line in the v1 þ v3 þ v14 − v14band. There are several reasons for this. First, the transitionwavelength, which was assessed to 6439:371 cm−1, is veryclose to the predicted position of the Peð33Þ line; the HITRANdatabase lists lines in this band up to rotational quantum num-ber 30, but not longer [60]. A linear extrapolation based on thepositions of the four closest tabulated members of this band,the Peð27Þ to the Peð30Þ lines, predicts that the Peð33Þ lineshould appear at 6439:35 cm−1, solely 0:02 cm−1 (600MHz)from the assessed value of the targeted line. Since the targetedline was chosen because it did not have any detectable neigh-boring lines within a few linewidths (at least �1500MHz), andsince a previous assessment of the Peð30Þ line in the sameband has indicated a difference between the measuredand the tabulated transition wavelengths in HITRAN of0:007 cm−1 (200MHz) [52], it is most plausible that the tar-geted line is the presumed Peð33Þ line. Also, an extrapolation
Wang et al. Vol. 28, No. 10 / October 2011 / J. Opt. Soc. Am. B 2395

of the integrated line strengths for the PeðJÞ series of transi-tions [for which there is an odd–even staggering of linestrengths, opposite to that of the Pf ðJÞ series of transitions,which for the Peð23Þ, Peð25Þ, Peð27Þ, and Peð29Þ lines are1:016 × 10−22, 6:328 × 10−23, 3:741 × 10−23, and 2:101 ×10−23 cm−1=ðmolecules cm−2Þ, respectively] indicates thatthe targeted line should be the suggested Peð33Þ. Yet anotherindication that supports this is that the broadening coefficientfor this line (as is discussed below) is in line with itsexpected value.
The calibration of the detection phase was performed onthe targeted line in the purely Doppler-broadened regimeusing pure acetylene. In order to reduce the influences ofnonlinearities of the detection system and to increase theaccuracy, for each pressure investigated, pure acetylene andnitrogen were mixed to produce a concentration in the ‰
range that yielded a signal with a given peak-to-peak value.The amount of acetylene in the cavity was, however, re-stricted by the assumption that the double-pass absorptionof the analyte should be significantly smaller than theintracavity losses [34,45,46,61,62], i.e., that
αðΔνÞ ≪ πF
ð14Þ
is valid. This implies that the influence of the analyte on thecavity properties could be neglected (it was assumed that thefinesse was constant and that the cavity modes were evenlyspaced). In order to correct for any remaining etalon back-ground signals, a background signal was taken immediatelyafter each measurement by pumping in buffer gas (N2) upto the same pressure as during the measurement and repeat-ing the scan.
5. RESULTS AND DISCUSSIONFigure 4 shows, by the left and right columns, background cor-rected NICE-OHMS absorption and dispersion signals, takenat pressures of 10, 40, and 90Torr, represented by the first,second, and third row of panels, respectively. To reducethe amount of random noise, the measurement data in eachpanel (represented by the solid markers in the uppermost partof each panel) was obtained by averaging 10 consecutivescans. The expression for the NICE-OHMS signal, Eq. (13),was fitted to the measurement data using the Voigt, theGalatry, and the Rautian models for the line-shape function[displayed by (virtually indistinguishable) solid, dashed, anddotted curves], with the center frequency, the collision width,the corresponding narrowing frequency, the signal strength,and a linear background as fitting parameters (while ΓD
was calculated and fixed). The residuals, i.e., the differencesbetween the measured data and the fits of the expression forthe NICE-OHMS signal based upon the various line-shapefunctions (the Voigt, the Galatry, and the Rautian), are shownin separate windows below the data.
For pressures up to 10Torr (not shown in the figure), it wasfound that there is good agreement between the measureddata and the fitted NICE-OHMS signal shapes (giving riseto residuals mostly consisting of random noise) for bothmodes of detection (absorption and dispersion) and all threeline-shape models (Voigt, Galatry, and Rautian). This showsthat there are virtually no (or only small) effects of Dicke nar-rowing in this pressure range.
As can be seen in the first row of panels in Fig. 4, at 10Torr,fits of the expression for the NICE-OHMS signal [Eq. (13)]based on the Voigt line-shape function provided, for bothmodes of detection, slightly structured residuals, indicatingthe existence of small amounts of Dicke narrowing in boththe absorption and dispersion mode of detection. The corre-sponding fits of Eq. (13) based on the Galatry and Rautian line-shape functions gave rise to residuals (again for both theabsorption and the dispersion modes of detection) that lackmost of this structure. This indicates that the observed nar-rowing effect is properly accounted for by the two line-shapemodels used.
The effect of Dicke narrowing on the NICE-OHMS signal,and the ability of the Galatry and Rautian profiles to correctlyaccount for it in both modes of detection, is even more clearlydemonstrated in the subsequent row of panels, correspondingto 40Torr. Here, it is clear that the shape of the residuals fromthe fitting of the Voigt profile is in agreement with the simula-tions given in Fig. 2 above, which actually were performed forthe conditions that prevailed in Figs. 4(c) and 4(d). In addi-tion, it can be noted that their magnitudes are around 3–4%of the signal size, in good agreement with the simulations.The corresponding residuals of the Galatry and Rautianline-shape models, which show no (or possibly a remainingweak) structure demonstrate that these line-shape functionscan again satisfactorily account for Dicke narrowing in NICE-OHMS. Moreover, the fact that the residuals for the dispersionmode of detection are virtually structureless indicates thatthe presumed forms of the dispersion line-shape functionsof the Galatry and the Rautian profiles, i.e., Eqs. (8) and (11),are correct. The possibly remaining structures of the residualsare attributed to uncertainty in the detection phase of the ex-perimental data (which is due to drifts and noise, estimated tobe well within �0:1 rad) or inconsistencies between the as-sumptions for the models (soft collisions, representing colli-sions between heavy absorbers and light perturbers, and hardcollisions, representing collisions between light absorbers andheavy perturbers) and the actual case [similar weight of theabsorber (C2H2) and the perturber (N2)]. On the other hand,it can also be noticed that the Galatry and Rautian models re-produce (at the present noise level) the measured spectraequally well, which can be attributed to the fact that themasses of the perturber and the absorber are similar, wherebythere is no significant difference between the two models [11].
Although not explicitly displayed in Fig. 4, it could beconcluded from similar curves that the Galatry and Rautianmodels could reproduce the measured data well also for pres-sures above 40Torr (with a minimum of structure in the resi-dual). However, as is shown by the last row of panels, whenthe pressure approaches 90Torr, new structures appear in theresiduals (primarily at the wings, and more for the dispersionmode of detection than absorption), indicating that otherpressure-dependent phenomena start to play a role, presum-ably the so-called speed-dependent effects.
From fits such as those given in Fig. 4, it is possible to ex-tract various line-shape parameters for the targeted transition.As was alluded to above, the broadening and narrowing me-chanisms are weak at low pressures. No collision width ornarrowing coefficients were therefore extracted from mea-surements performed at pressures below 10Torr. Moreover,the above-mentioned additional effects start to be prominent
2396 J. Opt. Soc. Am. B / Vol. 28, No. 10 / October 2011 Wang et al.

for higher pressures (90Torr and above), affecting the mea-sured line shapes. Therefore, line-shape parameters were ex-tracted solely from the data for which the fits reproduced themeasured line shapes adequately, which were found to be forpressures in the 10–70Torr range. Figures 5(a) and 5(b) pre-sent the collision width (ΓL) and the narrowing frequencies(βsoft and βhard), respectively, as functions of pressure for thispressure range.
As can be seen from the figure, both the collision width andthe narrowing frequencies increase with pressure. Whenever
the response is linear, the slopes represent, in Fig. 5(a), thepressure broadening coefficient (Bp), and in Fig. 5(b), the nar-rowing coefficients (β0soft and β0hard), respectively. However, asalso can be noted, although the responses are linear for partsof the pressure range, they are not linear over the entire range.Pressure broadening and narrowing coefficients were there-fore extracted solely from the 10–40Torr range, in which bothresponses were found to be linear.
The pressure broadening coefficient, which thus constitu-tes the slopes of the linear fits to the data in Fig. 5(a), was
Fig. 4. (a)—(f) Three rows of panels [(a) and (b), (c) and (d), (e) and (f)] represent NICE-OHMS signals from‰ concentrations of acetylene in N2taken at pressures of 10, 40, and 90Torr, respectively. The two columns [(a), (c), and (e); (b), (d), and (f)] correspond to absorption and dispersionmodes of detection, respectively. The individual markers in the upper window of each panel represent measurements, whereas the three solidcurves denote the best fits of NICE-OHMS signals based on the Voigt, the Galatry, and the Rautian models. The residuals of the fits of each lineshape are given in the lower windows, as marked.
Wang et al. Vol. 28, No. 10 / October 2011 / J. Opt. Soc. Am. B 2397

found to be significantly different for the evaluations thatwere based on the Voigt profiles (square markers) as com-pared to those that were based on the other two models (cir-cular and triangular markers). Using the Voigt model, thepressure broadening coefficients were assessed as 0.92(2)and 0:64ð1ÞMHz=Torr for the absorption and dispersionmodes of detection (solid and open markers), respectively.For the case with the Galatry model (triangular markers), thepressure broadening coefficients were assessed as 1.77(2)and 1:83ð3ÞMHz=Torr, whereas those for the Rautianmodel (circular markers) were found to be 1.55(2) and1:56ð2ÞMHz=Torr (again for the absorption and the dispersionmodes of detection, respectively). This shows first that thepressure broadening coefficients obtained by the Voigt modelare significantly lower than those acquired by the other twomodels; they are only 59% and 41% of those obtained by theRautian model (absorption and dispersion, respectively).Second, it illustrates that the pressure broadening coefficientsfor the absorption and dispersion modes of detection differ tovarious extents; for the Voigt profile they differ significantly,by 44%, which is inadequate, whereas for the Galatry andRautian models they basically agree, differing solely by
3.3% and 1.3%, respectively, which is considered satisfactory(simulations have shown that an alteration of the detectionphase affects the pressure broadening coefficients for the ab-sorption and dispersion modes of detection differently; a shiftof the phase of 1° will result in an alteration of the differenceof the two pressure broadening coefficients of around 2%). Allthis demonstrates that the Voigt model is incapable of accu-rately assessing the pressure broadening of the system in thepertinent pressure regime and that the other models, there-fore, are preferred. It also shows that the pressure broadeningcoefficient can be extracted by the other two models (Galatryand Rautian) equally well by the two modes of detection(absorption and dispersion).
A (HWHM) broadening coefficient of 1:56MHz=Torr (validfor the Rautian line shape) corresponds to 0:040 cm−1 atm−1.This number is smaller than those of all other reported lines inthe same band. However, it has also been found that thebroadening coefficient depends strongly on the rotationalquantum number. For example, it was shown by Arteagaet al. [63] that the (HWHM) pressure broadening for the Pbranch of the v1 þ v3 band of C2H2 with N2, which is foundin the 6554–6572 cm−1 wavelength range, decreases in anonlinear manner from 0:115 cm−1=atm for J ¼ 1 to0:054 cm−1=atm for J ¼ 31. Because it was concluded byArteaga et al. [63] that the pressure broadening coefficientsare insensitive to vibrational excitations, it is plausible toassume that these values should be valid also for the v1 þ v3 þv14 − v14 band studied in this work. Extrapolating the broaden-ing coefficients for the v1 þ v3 band to J ¼ 33 using a sixthorder polynomial provides a broadening coefficient of0:041 cm−1=atm, which agrees very well with the broadeningof the line targeted in this work (0:040 cm−1 atm−1). This vali-dates the methodology (the measurement and evaluation pro-cedures) used in this work for both modes of operation, aswell as the presumed identification of the targeted line[Peð33Þ in the v1 þ v3 þ v14 − v14 band].
Figure 5(b) illustrates, by the triangular and circular mar-kers, the narrowing frequencies for the Galatry and Rautianmodels, respectively (again for the absorption and the disper-sion modes of detection, represented by the solid and openmarkers, respectively). The figure shows that the data is linearonly up to around 40Torr. The nonlinearity is assumed to bedue to speed-dependent effects. It is important to point outthough that although the narrowing frequencies start to showa nonlinear dependence for pressures above 40Torr, thequality of the fits of NICE-OHMS signals based upon theGalatry and the Rautian line shapes to spectra is still good.In addition, even though speed-dependent effects are notmodeled or analyzed in any detail in this work, it can be con-cluded from Fig. 5(b) that they affect the dispersion mode ofdetection more than the absorption. This is also in agreementwith the third row of panels in Fig. 4 (corresponding to90Torr), in which the dispersion mode of detection showsa significantly larger residual than absorption.
The narrowing coefficients for the Rautian model, retrievedfrom the slopes of the fits in Fig. 5(b), were found to be 0.99(2)and 1:01ð3ÞMHz=Torr for the absorption and dispersionmodes of detection, respectively. These values agree well withthe gas kinetic dynamical friction parameter, β0diff , definedclose to Eq. (12), which for our system, containing a mixtureof C2H2 and N2 at 23 °C (for which D ¼ 0:167 cm2 s−1 at 1 atm
Fig. 5. (a) Collision width, ΓL, and (b) the narrowing frequencies(βsoft and βhard) as functions of pressure for Voigt (square markers),Galatry (triangular markers), and Rautian (circular markers) line-shapes models, detected in absorption and dispersion (solid and openmarkers, respectively). Note that there are no “missing” data points inthe panels; seemingly missing open markers are overlapped by solidones.
2398 J. Opt. Soc. Am. B / Vol. 28, No. 10 / October 2011 Wang et al.

[54]), becomes β0diff ¼ 1:17MHz=Torr. Conversely, the narrow-ing coefficients obtained from the Galatry model were foundto be 1.86(3) and 1:85ð5ÞMHz=Torr, respectively. These valuesare almost twice as large as the corresponding coefficients forthe Rautian model and more than 50% larger than the dynami-cal friction parameter. We interpret this in terms of the factthat although the Galatry model is able to fit the measuredspectra well, as could be seen from Fig. 4, it is not capableof modeling correctly the system of C2H2 in N2 in this pressureregime; i.e., it does not provide physically relevant parametervalues. This is in agreement with the previous observation forself-colliding CO2 molecules [10].
Finally, it can be noted from Fig. 5 that there is a consistentdiscrepancy of both the pressure broadening and the narrow-ing frequency between the two modes of detection; both para-meters are smaller for the dispersion mode of detection thanfor absorption. One possible reason for this is that it originatesfrom speed-dependent effects, which are assumed to play arole not only for pressures above the ones for which the fitsare good and the pressure responses are linear (i.e., 40Torr)but in the entire region. However, since such effects are out-side the scope of the present work, this was not investigatedfurther. Another reason is that it originates from a trading inthe fits of the homogeneous broadening with collisionalnarrowing. This could take place if the measurements wereperformed at a slightly incorrect detection phase.
6. SUMMARY AND CONCLUSIONSDicke narrowing effects have been demonstrated in the dis-persion mode of detection and by NICE-OHMS, both forthe first time, according to the authors’ knowledge. Basedon the Galatry and Rautian models for absorption and theknowledge that Kramers–Kronig relations predict that the ab-sorption and dispersion line shapes for a linear medium can bewritten in terms of the real and imaginary parts of a commoncomplex line-shape function, the analytical forms of the cor-responding line-shape functions for dispersion, termed theGalatry and Rautian dispersion line-shape functions, were pre-sumed. Experiments were performed on ‰ concentrationsof acetylene in N2 at pressures of a few tens of torr by aDFB-laser-based NICE-OHMS system.
It was found that Dicke narrowing appeared for both theabsorption and dispersion modes of detection. It was alsofound that the presumed Galatry and Rautian dispersiveline-shape functions provided good fits to the NICE-OHMSsignals in the tens-of-torr region (in which the Voigt profileprovided inadequate fits). This demonstrated the validity ofthe presumed dispersive line-shape functions. It was foundthat the Voigt profile predicted significantly smaller pressurebroadening coefficients than the other two models (almosthalf the value). It was further concluded that although the fits(using the Galatry and the Rautian line-shape functions) couldbe of good quality for the 10–70Torr range, the parameter va-lues of the fits revealed that the measured line shapes couldnot be fully accounted for by the models used in the entirepressure range; above 40Torr, the narrowing parametersdisplayed a nonlinear dependence of pressure. Moreover,although the narrowing frequencies deduced from the Rautianline-shape functions were in line with the dynamic frictionparameter, the narrowing frequencies for the Galatry line-shape functions were consistently larger than the others
(almost by a factor of 2), which suggest that the Galatry lineshape does not provide quantitatively accurate parametervalues for the system investigated. On the other hand, the nar-rowing coefficients from the absorption and dispersion line-shape functions for both the Galatry and the Rautian modelsdiffered by only a couple of percentage points, which indi-cates that there is adequacy between the two modes ofdetection.
All of this indicates that Dicke narrowing is a phenomenonthat does not only affect the absorption mode of detection; italso affects dispersion. The effect can be accounted for by thedispersion counterpart to the ordinary Galatry and Rautian(absorption) line-shape functions, which are given by Eqs. (8)and (11) above and here denoted the Galatry and Rautian dis-persive line-shape functions, respectively. This implies thatwhenever experiments are made in the Dicke narrowing re-gion (in the tens-of-torr range) by the NICE-OHMS technique,and when the highest accuracy is needed, collisional narrow-ing effects need to be taken into account, irrespective of themode of detection.
More work needs to be performed if the pressure region inwhich speed-dependent effects are prominent is also to beconsidered with the highest accuracy.
ACKNOWLEDGMENTSThis work was supported by the Swedish Research Councilunder project 621-2008-3674. The authors would also like toacknowledge the Kempe Foundation and the Carl TryggerFoundation for support.
REFERENCES AND NOTES1. R. H. Dicke, “The effect of collisions upon the Doppler width of
spectral lines,” Phys. Rev. 89, 472–473 (1953).2. J. R. Murray and A. Javan, “Effects of collisions on Raman line
profiles of hydrogen and deuterium gas,” J. Mol. Spectrosc. 42,1–26 (1972).
3. D. R. A. McMahon, “Dicke narrowing reduction of the Dopplercontribution to a linewidth,” Aust. J. Phys. 34, 639–675 (1981).
4. G. C. Corey and F. R. McCourt, “Dicke narrowing and collisionalbroadening of spectral-lines in dilute molecular gases,” J. Chem.Phys. 81, 2318–2329 (1984).
5. R. P. Frueholz and C. H. Volk, “Analysis of Dicke narrowing inwall-coated and buffer-gas-filled atomic storage-cells,” J. Phys. B18, 4055–4067 (1985).
6. D. R. Rao and T. Oka, “Dicke narrowing and pressure broaden-ing in the infrared fundamental-band of HCl perturbed by Ar,” J.Mol. Spectrosc. 122, 16–27 (1987).
7. A. Henry, D. Hurtmans, M. Margottin-Maclou, and A. Valentin,“Confinement narrowing and absorber speed dependent broad-ening effects on CO lines in the fundamental band perturbed byXe, Ar, Ne, He and N2,” J. Quant. Spectrosc. Radiat. Transfer 56,647–671 (1996).
8. G. Dufour, D. Hurtmans, A. Henry, A. Valentin, and M. Lepère,“Line profile study from diode laser spectroscopy in the 12CH42v3 band perturbed by N2, O2, Ar, and He,” J. Mol. Spectrosc.221, 80–92 (2003).
9. J. T. Hodges, D. Lisak, N. Lavrentieva, A. Bykov, L. Sinitsa,J. Tennyson, R. J. Barber, and R. N. Tolchenov, “Comparisonbetween theoretical calculations and high-resolution measure-ments of pressure broadening for near-infrared water spectra,”J. Mol. Spectrosc. 249, 86–94 (2008).
10. G. Casa, R. Wehr, A. Castrillo, E. Fasci, and L. Gianfrani, “Theline shape problem in the near-infrared spectrum of self-colliding CO2 molecules: experimental investigation and testof semiclassical models,” J. Chem. Phys. 130, 184306 (2009).
11. L. Fissiaux, M. Dhyne, and M. Lepère, “Diode-laser spectro-scopy: Pressure dependence of N2-broadening coefficients of
Wang et al. Vol. 28, No. 10 / October 2011 / J. Opt. Soc. Am. B 2399

lines in the ν4 þ ν5 band of C2H2,” J. Mol. Spectrosc. 254,10–15 (2009).
12. M. Dhyne, L. Fissiaux, J. C. Populaire, and M. Lepére, “Tempera-ture dependence of the N2-broadening coefficients of acety-lene,” J. Quant. Spectrosc. Radiat. Transfer 110, 358–366 (2009).
13. M. Dhyne, P. Joubert, J. C. Populaire, and M. Lepére, “Collisionalbroadening and shift coefficients of lines in the ν4 þ ν5 band of12C2H2 diluted in N2 from low to room temperatures,” J. Quant.Spectrosc. Radiat. Transfer 111, 973–989 (2010).
14. M. Dhyne, P. Joubert, J. C. Populaire, and M. Lepère, “Self-collisional broadening and shift coefficients of lines in the ν4 þν5 band of 12C2H2 from 173.2 to 298:2K by diode-laser spectro-scopy,” J. Quant. Spectrosc. Radiat. Transfer 112, 969–979(2011).
15. B. Martin and M. Lepère, “N2-broadening coefficients in the ν4band of 12CH4 at room temperature,” J. Mol. Spectrosc. 250,70–74 (2008).
16. B. Martin and M. Lepére, “O2- and air-broadening coefficients inthe ν4 band of 12CH4 at room temperature,” J. Mol. Spectrosc.255, 6–12 (2009).
17. B. Martin and M. Lepère, “Temperature dependence of N2- andO2-broadening coefficients in the ν4 band of 13CH4,” J. Mol.Spectrosc. 259, 46–55 (2010).
18. L. Galatry, “Simultaneous effect of Doppler and foreign gasbroadening on spectral lines,” Phys. Rev. 122, 1218–1223(1961).
19. M. Nelkin and A. Ghatak, “Simple binary collision model for vanHove’s Gsðr; tÞ,” Phys. Rev. 135, A4–A9 (1964).
20. S. G. Rautian and I. I. Sobel’man, “Effect of collisions on Dopplerbroadening of spectral lines,” Sov. Phys. Usp. 9, 701–716 (1967).
21. P. L. Varghese and R. K. Hanson, “Collisional narrowing effectson spectral-line shapes measured at high-resolution,” Appl. Opt.23, 2376–2385 (1984).
22. E. V. Podivilov and D. A. Shapiro, “Dicke narrowing in aplasma,” JETP Lett. 56, 449–454 (1992).
23. R. Ciurylo, “Shapes of pressure- and Doppler-broadenedspectral lines in the core and near wings,” Phys. Rev. A 58,1029–1039 (1998).
24. D. A. Shapiro, R. Ciurylo, R. Jaworski, and A. D. May, “Modelingthe spectral line shapes with speed-dependent broadening andDicke narrowing,” Can. J. Phys. 79, 1209–1222 (2001).
25. D. A. Shapiro, R. Ciurylo, J. R. Drummond, and A. D. May,“Solving the line-shape problem with speed-dependent broaden-ing and shifting and with Dicke narrowing. I. formalism,” Phys.Rev. A 65, 012501 (2002).
26. R. Ciurylo, D. A. Shapiro, J. R. Drummond, and A. D. May,“Solving the line-shape problem with speed-dependent broaden-ing and shifting and with Dicke narrowing. II. application,” Phys.Rev. A 65, 012502 (2002).
27. C. J. Borde, “On the theory of linear absorption line shapes ingases,” C.R. Physique 10, 866–882 (2009).
28. M. Lepère, “Line profile study with tunable diode laser spectro-meters,” Spectrochim. Acta, Part A 60, 3249–3258 (2004).
29. G. C. Bjorklund, “Frequency-modulation spectroscopy: a newmethod for measuring weak absorptions and dispersions,”Opt. Lett. 5, 15–17 (1980).
30. G. C. Bjorklund, M. D. Levenson, W. Lenth, and C. Oritz, “Fre-quencymodulation (FM) spectroscopy: theory of lineshapes andsignal-to-noise analysis,” Appl. Phys. B 32, 145–152 (1983).
31. J. Ye, L. S. Ma, and J. L. Hall, “Sub-Doppler optical frequencyreference at 1:064 μm by means of ultrasensitive cavity-enhanced frequency modulation spectroscopy of a C2HD over-tone transition,” Opt. Lett. 21, 1000–1002 (1996).
32. J. Ye, L. S. Ma, and J. L. Hall, “Ultrastable optical frequency re-ference at 1:064 μm using a C2HD molecular overtone transi-tion,” IEEE Trans. Instrum. Meas. 46, 178–182 (1997).
33. J. Ye, L. S. Ma, and J. L. Hall, “Ultrasensitive detections in atomicand molecular physics: demonstration in molecular overtonespectroscopy,” J. Opt. Soc. Am. B 15, 6–15 (1998).
34. L. S. Ma, J. Ye, P. Dube, and J. L. Hall, “Ultrasensitive frequency-modulation spectroscopy enhanced by a high-finesse opticalcavity: theory and application to overtone transitions of C2H2and C2HD,” J. Opt. Soc. Am. B 16, 2255–2268 (1999).
35. A. Foltynowicz, F. M. Schmidt, W. Ma, and O. Axner, “Noise-immune cavity-enhanced optical heterodyne molecular
spectroscopy: current status and future potential,” Appl. Phys.B 92, 313–326 (2008).
36. A. Kaldor, A. G. Maki, and W. B. Olson, “Pollution monitor fornitric oxide—laser device based on Zeeman modulation of ab-sorption,” Science 176, 508–510 (1972).
37. G. Litfin, C. R. Pollock, R. F. Curl, and F. K. Tittel, “Sensitivityenhancement of laser-absorption spectroscopy by magnetic ro-tation effect,” J. Chem. Phys. 72, 6602–6605 (1980).
38. T. A. Blake, C. Chackerian, and J. R. Podolske, “Prognosis for amid-infrared magnetic rotation spectrometer for the in situdetection of atmospheric free radicals,” Appl. Opt. 35,973–985 (1996).
39. H. Ganser, W. Urban, and A. M. Brown, “The sensitive detectionof NO by Faraday modulation spectroscopy with a quantumcascade laser,” Mol. Phys. 101, 545–550 (2003).
40. T. Fritsch, M. Horstjann, D. Halmer, Sabana, P. Hering, and M.Murtz, “Magnetic Faraday modulation spectroscopy of the1-0 band of 14NO and 15NO,” Appl. Phys. B 93, 713–723(2008).
41. R. Lewicki, J. H. Doty, R. F. Curl, F. K. Tittel, and G. Wysocki,“Ultrasensitive detection of nitric oxide at 5:33mum by usingexternal cavity quantum cascade laser-based Faraday rotationspectroscopy,” Proc. Natl. Acad. Sci. USA 106, 12587–12592(2009).
42. P. Kluczynski, S. Lundqvist, J. Westberg, and O. Axner, “Faradayrotation spectrometer with sub-second response time for detec-tion of nitric oxide using a cw DFB quantum cascade laser at5:33 μm,” Appl. Phys. B 103, 451–459 (2011).
43. E. A. Whittaker, M. Gehrtz, and G. C. Bjorklund, “Residualamplitude-modulation in laser electro-optic phase modulation,”J. Opt. Soc. Am. B 2, 1320–1326 (1985).
44. A. Foltynowicz, “Fiber-laser-based noise-immune cavity-enhanced optical heterodyne molecular spectrometry,” PhD.thesis (Umeå University, 2009).
45. F. M. Schmidt, A. Foltynowicz, W. Ma, and O. Axner, “Fiber-laser-based noise-immune cavity-enhanced optical heterodynemolecular spectrometry for Doppler-broadened detection ofC2H2 in the parts per trillion range,” J. Opt. Soc. Am. B 24,1392–1405 (2007).
46. F. M. Schmidt, A. Foltynowicz, W. Ma, T. Lock, and O. Axner,“Doppler-broadened fiber-laser-based NICE-OHMS—improveddetectability,” Opt. Express 15, 10822–10831 (2007).
47. A. Foltynowicz, W. Ma, F. M. Schmidt, and O. Axner, “Doppler-broadened noise-immune cavity-enhanced optical heterodynemolecular spectroscopy signals from optically saturated transi-tions under low pressure conditions,” J. Opt. Soc. Am. B 25,1156–1165 (2008).
48. A. Foltynowicz, W. Ma, and O. Axner, “Characterization of fiber-laser-based sub-Doppler NICE-OHMS for trace gas detection,”Opt. Express 16, 14689–14702 (2008).
49. A. Foltynowicz, W. Ma, F. M. Schmidt, and O. Axner, “Wave-length-modulated noise-immune cavity-enhanced optical het-erodyne molecular spectroscopy signal line shapes in theDoppler limit,” J. Opt. Soc. Am. B 26, 1384–1394 (2009).
50. I. Silander, P. Ehlers, J. Wang, and O. Axner, Department ofPhysics, Umeå University, Umeå, Sweden, are preparing amanuscript to be called “Modeling frequency modulation back-ground signals from fiber-based electro optic modulators basedon crosstalk.”
51. A. Foltynowicz, I. Silander, and O. Axner, Department of Phy-sics, Umeå University, Umeå, Sweden, are preparing a manu-script to be called “Reduction of background signals fromfiber-coupled electro-optic modulators in NICE-OHMS.”
52. A. Foltynowicz, J. Y. Wang, P. Ehlers, and O. Axner, “Distributed-feedback-laser-based NICE-OHMS in the pressure-broadenedregime,” Opt. Express 18, 18580–18591 (2010).
53. Note that the terms Voigt, Rautian, and Galatry profiles normallyrefer to absorption line shapes in the literature. In this paper,however, they refer to both absorption and dispersion lineshapes, and these are therefore here referred to as Rautian/Galatry absorption/dispersion line shapes.
54. H. Valipour and D. Zimmermann, “Investigation of J dependenceof line shift, line broadening, and line narrowing coefficients inthe ν1 þ 3ν3 absorption band of acetylene,” J. Chem. Phys. 114,3535–3545 (2001).
2400 J. Opt. Soc. Am. B / Vol. 28, No. 10 / October 2011 Wang et al.

55. H. A. Kramers, “La diffusion de la lumiere par les atomes,” Atti.Congr. Int. Fis. Como. 2, 545–557 (1927).
56. R. L. Kronig, “On the theory of dispersion of x-rays,” J. Opt. Soc.Am. 12, 547–556 (1926).
57. W. Ma, A. Foltynowicz, and O. Axner, “Theoretical descriptionof Doppler-broadened noise-immune cavity-enhanced opticalheterodyne molecular spectroscopy under optically saturatedconditions,” J. Opt. Soc. Am. B 25, 1144–1155 (2008).
58. R. W. P. Drever, J. L. Hall, F. V. Kowalski, J. Hough, G. M. Ford,A. J. Munley, and H. Ward, “Laser phase and frequencystabilization using an optical resonator,” Appl. Phys. B 31,97–105 (1983).
59. R. G. DeVoe and R. G. Brewer, “Laser frequency division andstabilization,” Phys. Rev. A 30, 2827–2829 (1984).
60. L. S. Rothman, I. E. Gordon, A. Barbe, D. C. Benner, P. E.Bernath, M. Birk, V. Boudon, L. R. Brown, A. Campargue,J. P. Champion, K. Chance, L. H. Coudert, V. Dana, V. M. Devi,S. Fally, J. M. Flaud, R. R. Gamache, A. Goldman, D. Jacquemart,I. Kleiner, N. Lacome, W. J. Lafferty, J. Y. Mandin, S. T. Massie,
S. N. Mikhailenko, C. E. Miller, N. Moazzen-Ahmadi, O. V.Naumenko, A. V. Nikitin, J. Orphal, V. I. Perevalov, A. Perrin,A. Predoi-Cross, C. P. Rinsland, M. Rotger, M. Simeckova,M. A. H. Smith, K. Sung, S. A. Tashkun, J. Tennyson, R. A. Toth,A. C. Vandaele, and J. Vander Auwera, “The HITRAN 2008molecular spectroscopic database,” J. Quant. Spectrosc. Radiat.Transfer 110, 533–572 (2009).
61. J. Ye, “Ultrasensitive high resolution laser spectroscopy and itsapplication to optical frequency standards,” PhD. thesis(University of Colorado, 1997).
62. F. M. Schmidt, W. Ma, A. Foltynowicz, and O. Axner, “Highlysensitive dispersion spectroscopy by probing the free spectralrange of an optical cavity using dual-frequency modulation,”Appl. Phys. B 101, 497–509 (2010).
63. S. W. Arteaga, C. M. Bejger, J. L. Gerecke, J. L. Hardwick, Z. T.Martin, J. Mayo, E. A. McIlhattan, J. M. F. Moreau, M. J.Pilkenton, M. J. Polston, B. T. Robertson, and E. N. Wolf, “Linebroadening and shift coefficients of acetylene at 1550nm,” J.Mol. Spectrosc. 243, 253–266 (2007).
Wang et al. Vol. 28, No. 10 / October 2011 / J. Opt. Soc. Am. B 2401
Related Documents