PENNSTATE Product Engineering Today for Tomorrow: Inspirations from Life Sciences S© GEO KREMER Gül E. Kremer, PhD, MBA Professor of Engineering Design & Industrial Engineering The Pennsylvania State University Program Director, National Science Foundation

Diapositivas de la conferencia de Gül Kremer
Jul 15, 2015
Welcome message from author
This document is posted to help you gain knowledge. Please leave a comment to let me know what you think about it! Share it to your friends and learn new things together.
Transcript
PENNSTATE © GEO KREMER
PENNSTATE
Product Engineering Today
for Tomorrow:
Inspirations from Life Sciences
T. W. SIMPSON © GEO KREMER
Gül E. Kremer, PhD, MBA
Professor of Engineering Design & Industrial Engineering
The Pennsylvania State University
Program Director, National Science Foundation
PENNSTATE © GEO KREMER
Outline
• ADAPS Group
• Concept of Sustainability
• Carbon Footprint vs. Cost in Product Development
• Multiple-Generation Product Strategy (MGPS)
Dynamic State Variable Models
Does it fit? Case Study – Apple iPhones
Cannibalization
• NSF - INFEWS
PENNSTATE © GEO KREMER
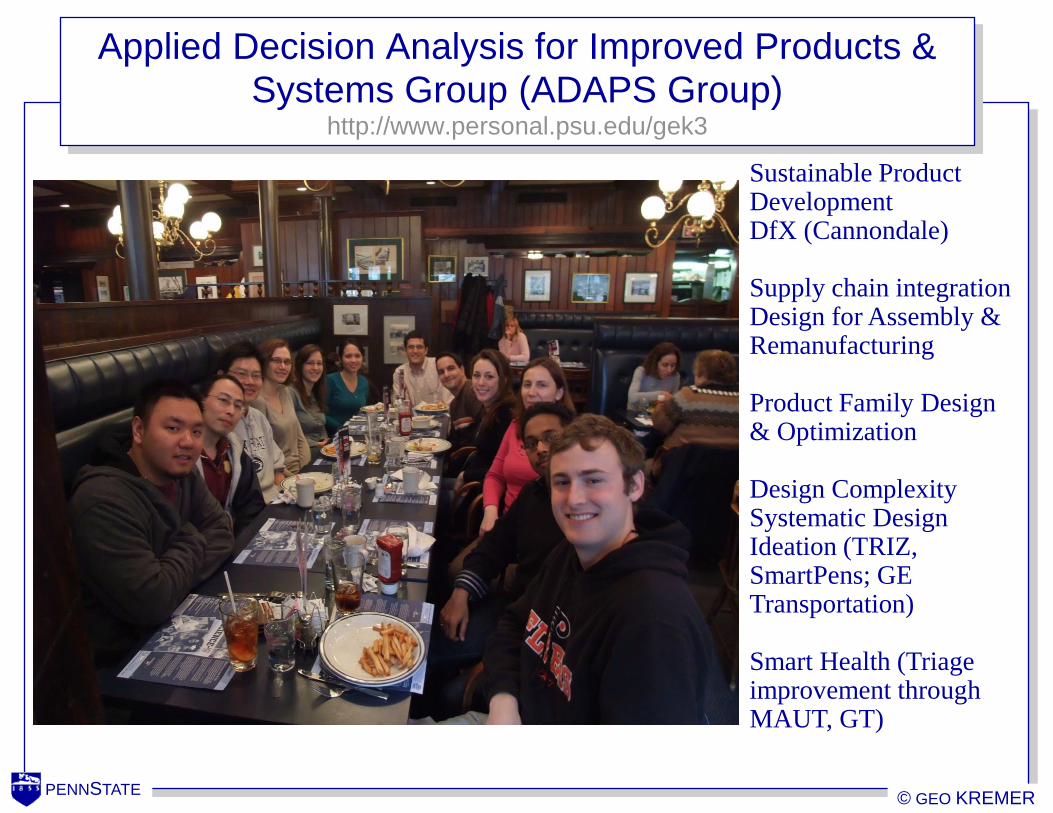
Applied Decision Analysis for Improved Products & Systems Group (ADAPS Group)
http://www.personal.psu.edu/gek3
Sustainable Product Development DfX (Cannondale) Supply chain integration Design for Assembly & Remanufacturing Product Family Design & Optimization Design Complexity Systematic Design Ideation (TRIZ, SmartPens; GE Transportation) Smart Health (Triage improvement through MAUT, GT)

PENNSTATE © GEO KREMER
Mars One mission aims to establish a human settlement on Mars. 1
North and South America as they appear from space 35,000 km above the Earth. 2
PENNSTATE © GEO KREMER
I=PAT
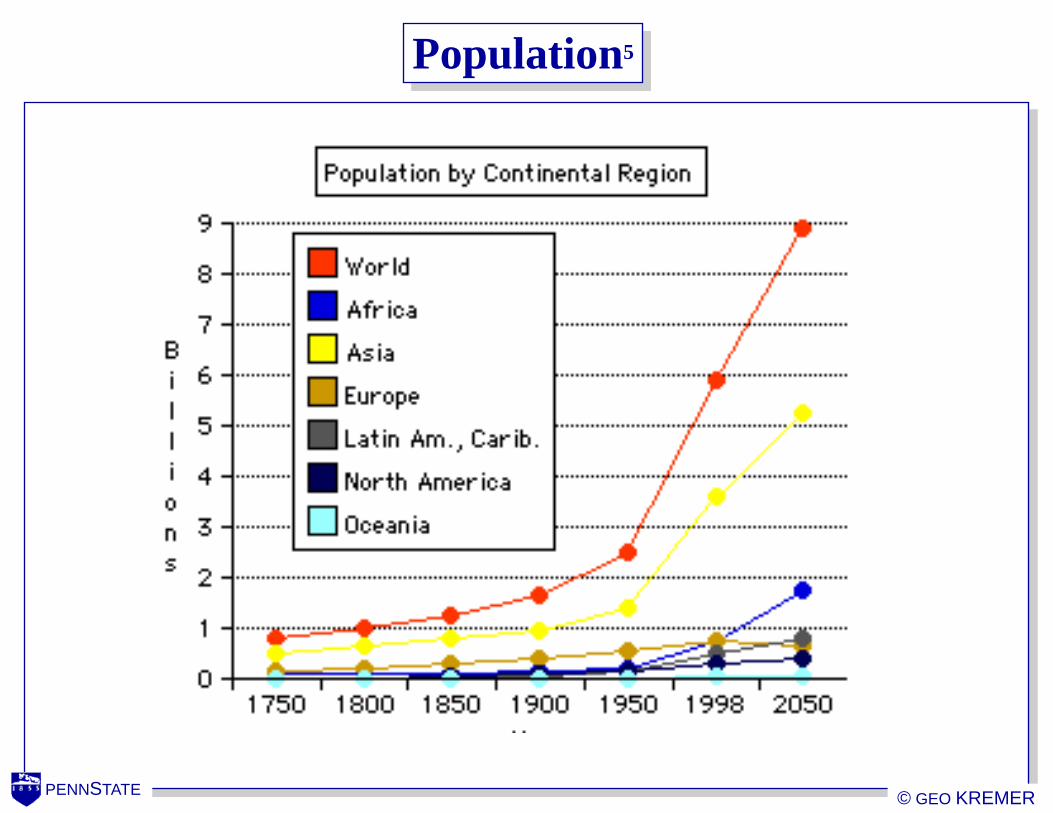
• P - Population. World population reached 6 billion in 1999
and is expected to grow to over 9 billion by 2050 - Can the
earth sustain these numbers? 3
• A - Affluence. How much ‘stuff’ a person has. The US, the
world’s largest consumer society, greatly affects this term.
Is your residence full of stuff that seemed like a good idea to
own at the time of purchase, but you really do not need or
currently use?
• T- Technology. Where engineers play a leading role.
Technology can be used to reduce the ‘impact’ of the
products we produce. For example, fuel-efficient
cars, renewable energy sources, rechargeable
batteries, etc.

PENNSTATE © GEO KREMER
Population4
PENNSTATE © GEO KREMER
Population5
PENNSTATE © GEO KREMER
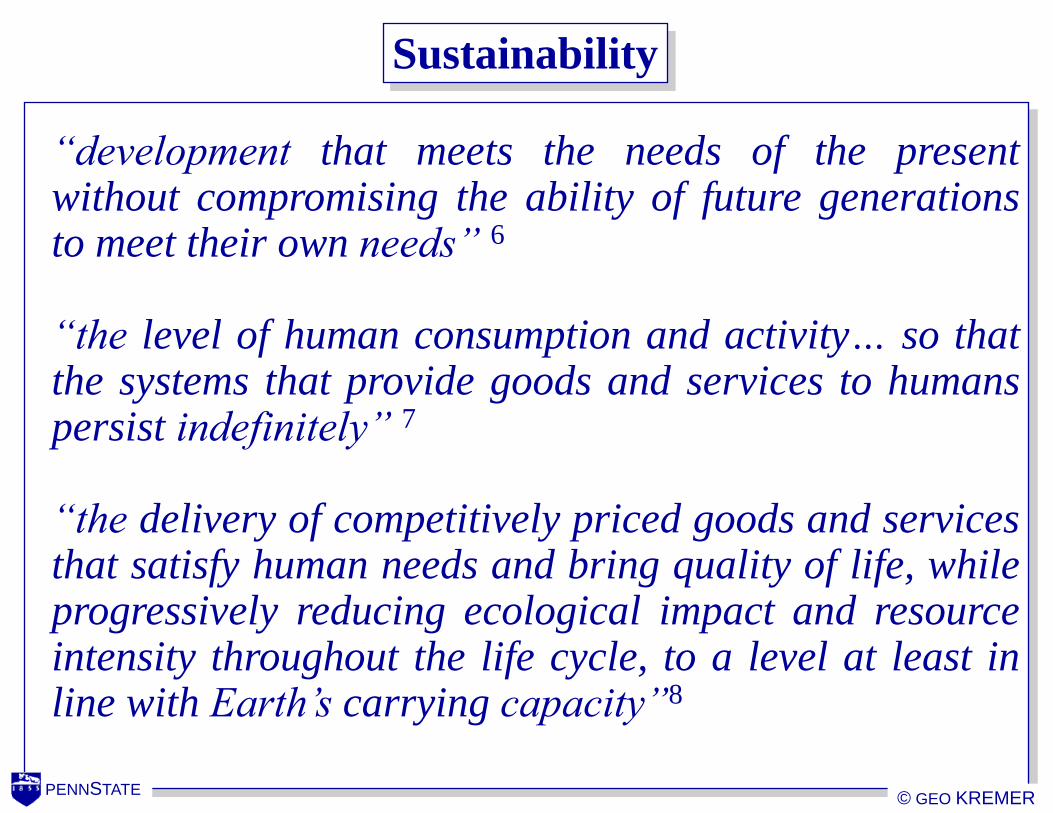
Sustainability
“development that meets the needs of the present without compromising the ability of future generations to meet their own needs” 6
“the level of human consumption and activity… so that the systems that provide goods and services to humans persist indefinitely” 7
“the delivery of competitively priced goods and services that satisfy human needs and bring quality of life, while progressively reducing ecological impact and resource intensity throughout the life cycle, to a level at least in line with Earth’s carrying capacity”8
PENNSTATE © GEO KREMER
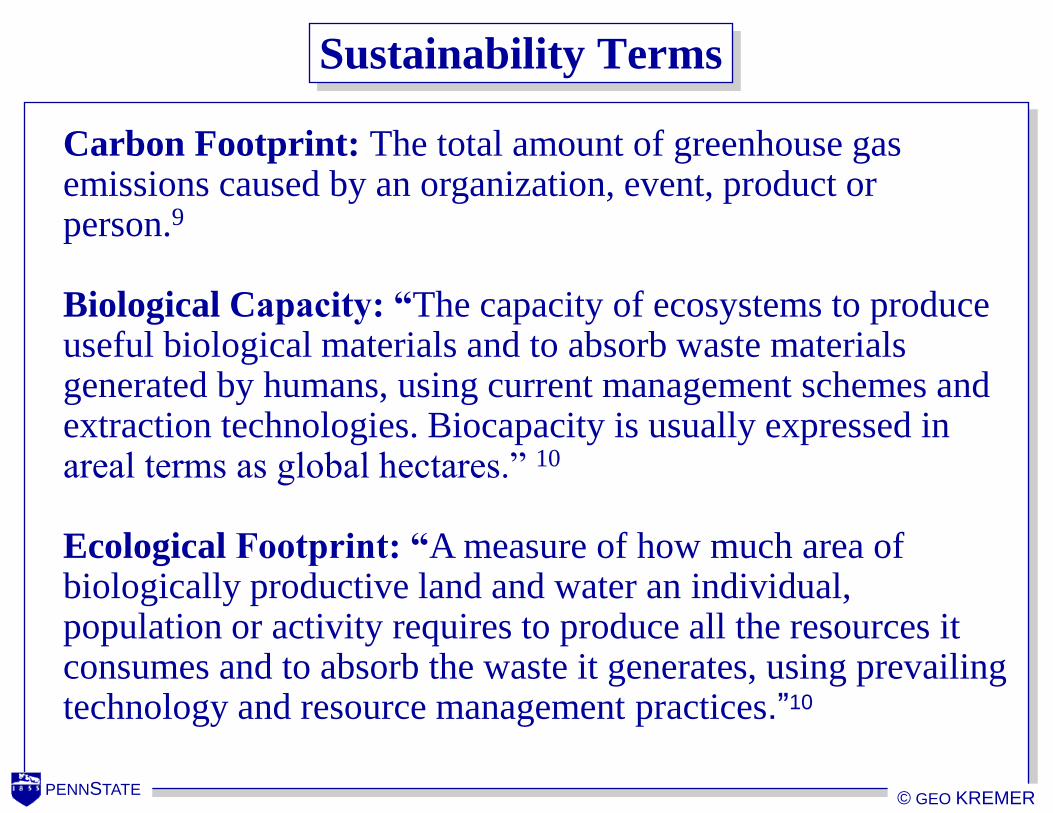
Sustainability Terms
Carbon Footprint: The total amount of greenhouse gas emissions caused by an organization, event, product or person.9
Biological Capacity: “The capacity of ecosystems to produce useful biological materials and to absorb waste materials generated by humans, using current management schemes and extraction technologies. Biocapacity is usually expressed in areal terms as global hectares.” 10
Ecological Footprint: “A measure of how much area of biologically productive land and water an individual, population or activity requires to produce all the resources it consumes and to absorb the waste it generates, using prevailing technology and resource management practices.”10
PENNSTATE © GEO KREMER
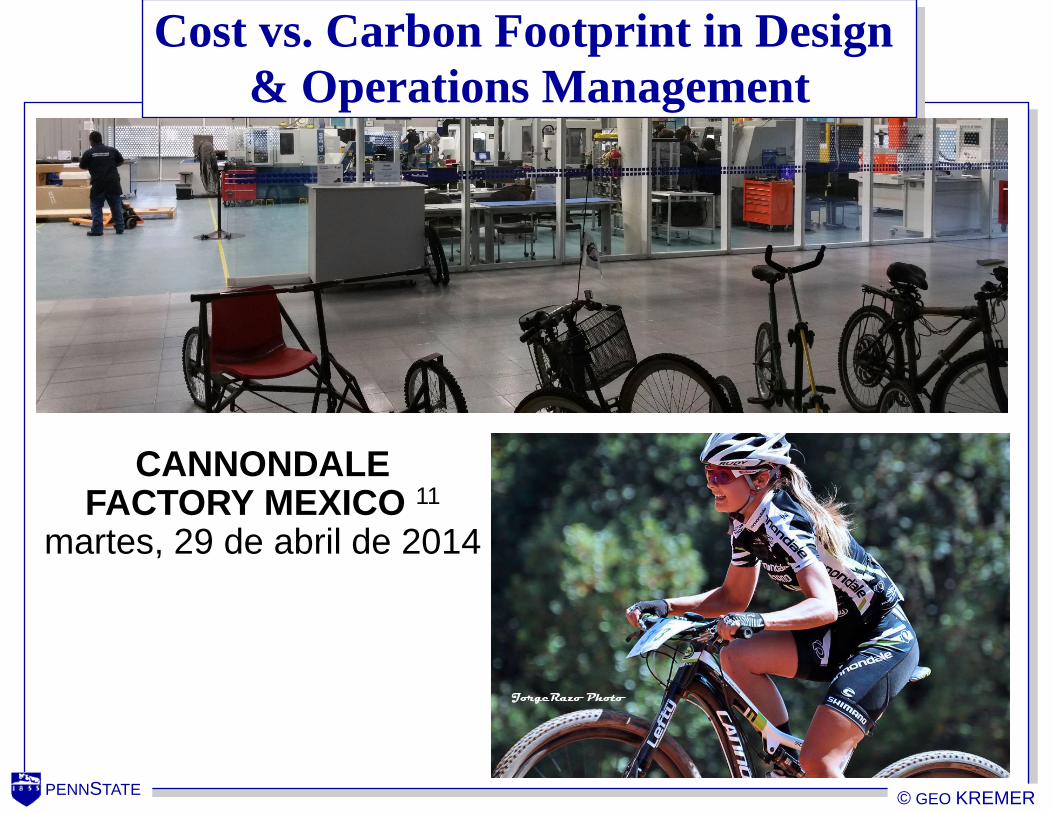
Cost vs. Carbon Footprint in Design
& Operations Management
CANNONDALE FACTORY MEXICO 11
martes, 29 de abril de 2014
PENNSTATE © GEO KREMER
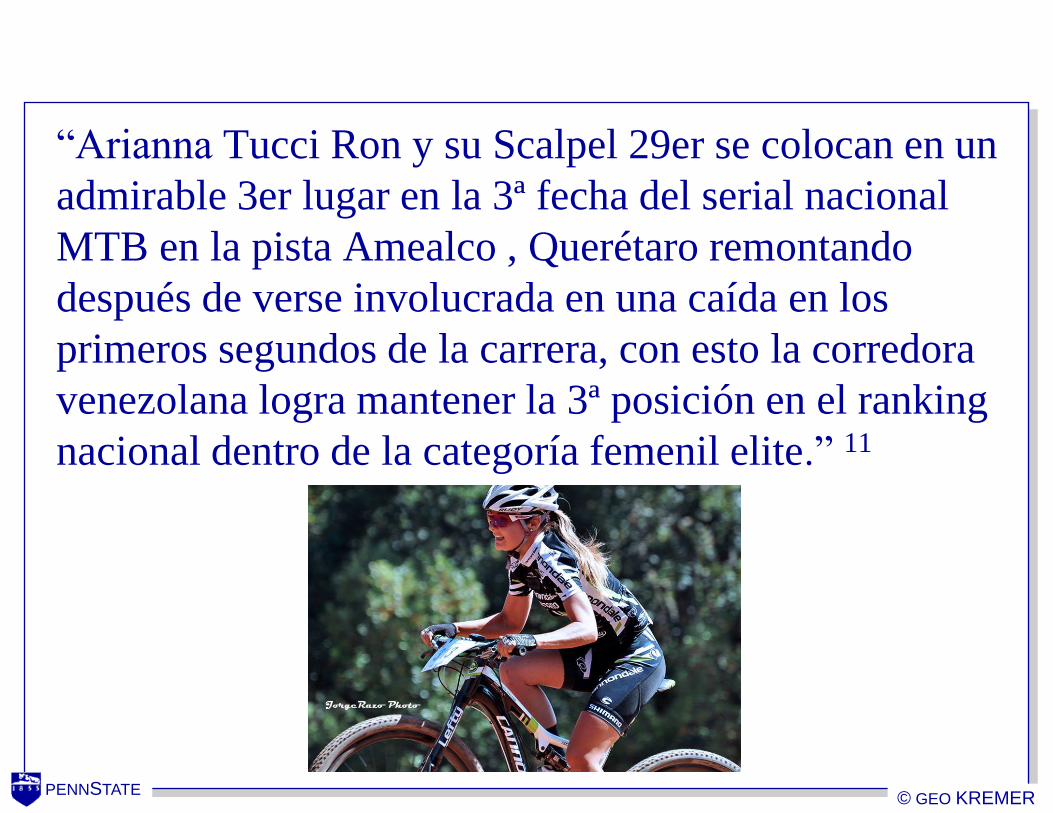
“Arianna Tucci Ron y su Scalpel 29er se colocan en un
admirable 3er lugar en la 3ª fecha del serial nacional
MTB en la pista Amealco , Querétaro remontando
después de verse involucrada en una caída en los
primeros segundos de la carrera, con esto la corredora
venezolana logra mantener la 3ª posición en el ranking
nacional dentro de la categoría femenil elite.” 11
PENNSTATE © GEO KREMER
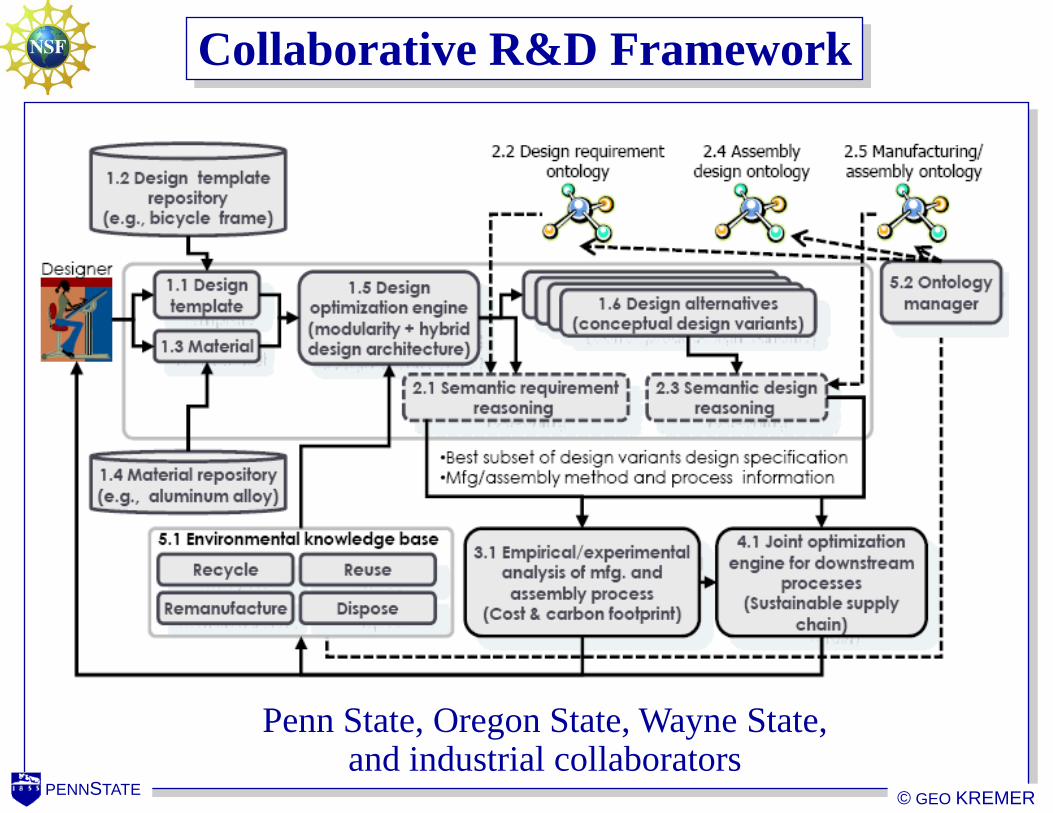
Collaborative R&D Framework
Penn State, Oregon State, Wayne State, and industrial collaborators

PENNSTATE © GEO KREMER
Cost vs. Carbon Footprint in Design
& Operations Management
• Previous work
Included cost and lead time
Design for Assembly (DfA) rankings
Product architecture and modularity
• Previous work is expanded to include kg CO2 equivalent as
a sustainability metric accounting for:
Material extraction
Material processing
Transportation
PENNSTATE © GEO KREMER
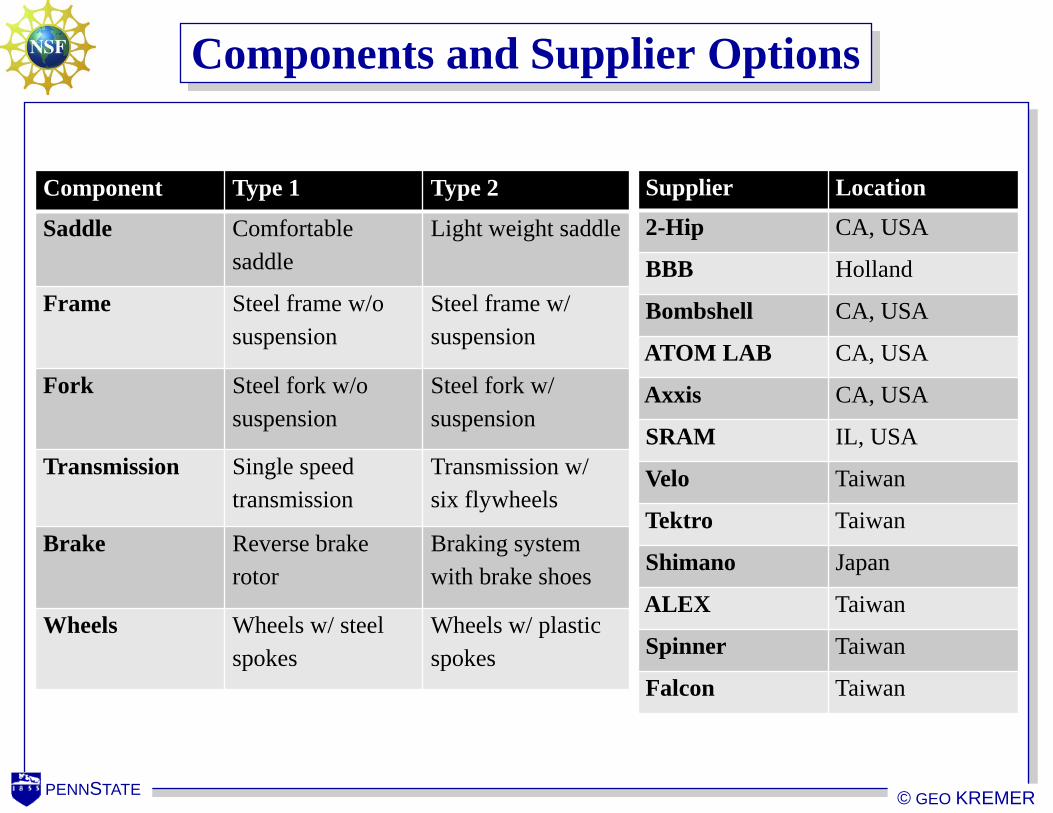
Components and Supplier Options
Component Type 1 Type 2
Saddle Comfortable
saddle
Light weight saddle
Frame Steel frame w/o
suspension
Steel frame w/
suspension
Fork Steel fork w/o
suspension
Steel fork w/
suspension
Transmission Single speed
transmission
Transmission w/
six flywheels
Brake Reverse brake
rotor
Braking system
with brake shoes
Wheels Wheels w/ steel
spokes
Wheels w/ plastic
spokes
Supplier Location
2-Hip CA, USA
BBB Holland
Bombshell CA, USA
ATOM LAB CA, USA
Axxis CA, USA
SRAM IL, USA
Velo Taiwan
Tektro Taiwan
Shimano Japan
ALEX Taiwan
Spinner Taiwan
Falcon Taiwan
PENNSTATE © GEO KREMER
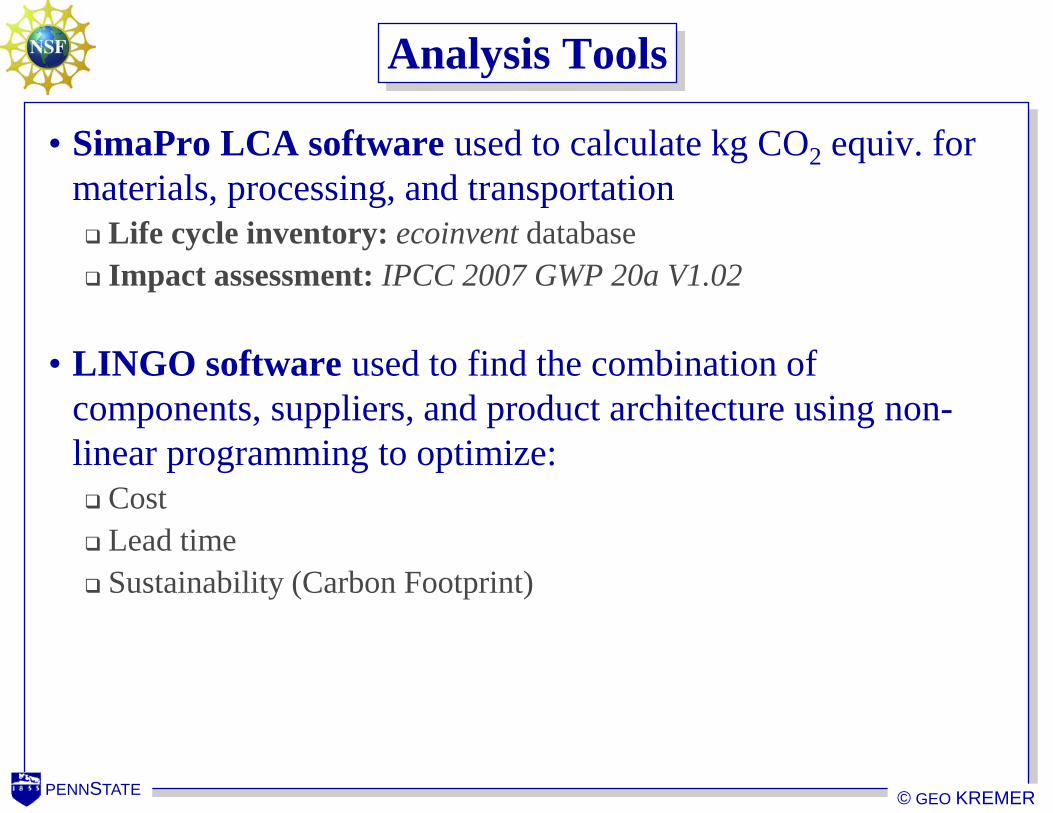
Analysis Tools
• SimaPro LCA software used to calculate kg CO2 equiv. for
materials, processing, and transportation
Life cycle inventory: ecoinvent database
Impact assessment: IPCC 2007 GWP 20a V1.02
• LINGO software used to find the combination of
components, suppliers, and product architecture using non-
linear programming to optimize:
Cost
Lead time
Sustainability (Carbon Footprint)

PENNSTATE © GEO KREMER
Fork Materials and Processes for Life Cycle Inventory
Example: Actual Processes to Produce Steel Fork

PENNSTATE © GEO KREMER
Sustainability: Material Compositions
Material mass (kg) B13 B54 SimaPro Process (ecoinvent database)
Medium carbon steel components
(e.g., frame, fork) 7.5294 5.3464 Steel, low-alloyed, at plant/RER U
Alloy and stainless steel
components (e.g., bearings) 2.47 2.784 Steel, electric, chromium steel 18/8, at plant/RER U
Composite nylon wheels 1.88 Nylon 66, glass-filled, at plant/RER U
Rubber components (e.g., tires and
brake pads) 1.52 1.554 Synthetic rubber, at plant/RER U
Saddle support structure (shell) 0.41 0.4 Polypropylene, granulate, at plant/RER U
Saddle cover 0.08 0.07 Polyvinylchloride, suspension polymerised, at
plant/RER U
Saddle padding 0.033 0.024 Polyurethane, flexible foam, at plant/RER U
Saddle thread 0.006 0.006 Viscose fibres, at plant/GLO U
Paint 0.06 Alkyd paint, white, 60% in H2O, at plant/RER U
Saddle glue 0.02 Acrylic binder, 34% in H2O, at plant/RER U
PENNSTATE © GEO KREMER
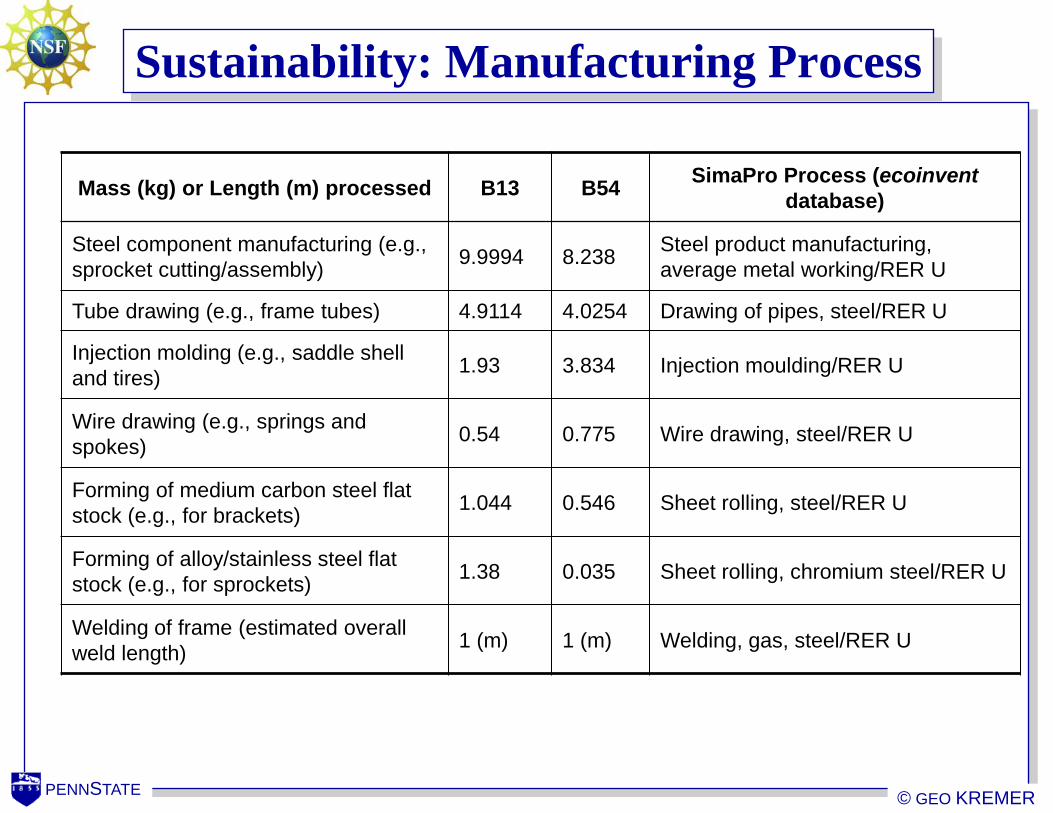
Sustainability: Manufacturing Process
Mass (kg) or Length (m) processed B13 B54 SimaPro Process (ecoinvent
database)
Steel component manufacturing (e.g.,
sprocket cutting/assembly) 9.9994 8.238
Steel product manufacturing,
average metal working/RER U
Tube drawing (e.g., frame tubes) 4.9114 4.0254 Drawing of pipes, steel/RER U
Injection molding (e.g., saddle shell
and tires) 1.93 3.834 Injection moulding/RER U
Wire drawing (e.g., springs and
spokes) 0.54 0.775 Wire drawing, steel/RER U
Forming of medium carbon steel flat
stock (e.g., for brackets) 1.044 0.546 Sheet rolling, steel/RER U
Forming of alloy/stainless steel flat
stock (e.g., for sprockets) 1.38 0.035 Sheet rolling, chromium steel/RER U
Welding of frame (estimated overall
weld length) 1 (m) 1 (m) Welding, gas, steel/RER U
PENNSTATE © GEO KREMER
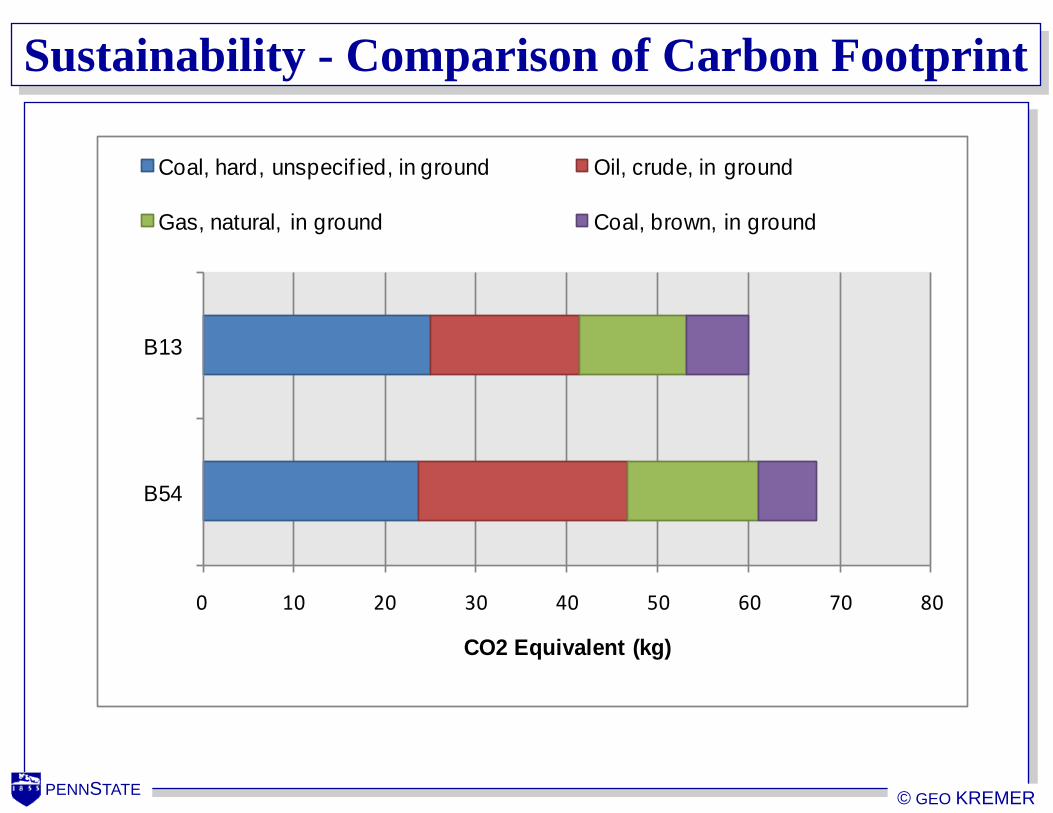
Sustainability - Comparison of Carbon Footprint
0 10 20 30 40 50 60 70 80
B54
B13
CO2 Equivalent (kg)
Coal, hard, unspecif ied, in ground Oil, crude, in ground
Gas, natural, in ground Coal, brown, in ground

PENNSTATE © GEO KREMER
Mathematical Model
Objective Function
Min [Processing (MPCF) + Transportation (TCF)]

PENNSTATE © GEO KREMER
Optimization Results
NUMERICAL RESULTS 12 COST: Product Architecture
Part or
Module Supplier Location
ABCDEF X-Bike PA, USA
AB 2 Hip CA, USA
CD SRAM IL, USA
EF BBB Holland
(A) Saddle ATOM LAB CA, USA
(B) Frame 2 Hip CA, USA
(C) Fork X-Bike PA, USA
(D) Brake SRAM IL, USA
(E) Wheel BBB Holland
(F) Trans. BBB Holland
Op
tim
izin
g
(Min
imiz
ing)
Co
st
(US
Do
llars
)
Lea
d T
ime
(Da
ys)
Ca
rbon
Foo
tpri
nt
(kg
CO
2 e
q.)
Cost 83.74 54.20 60.48
Lead Time 109.3 38.80 65.85
Carbon
Footprint
99.94 172.80 44.18
PENNSTATE © GEO KREMER
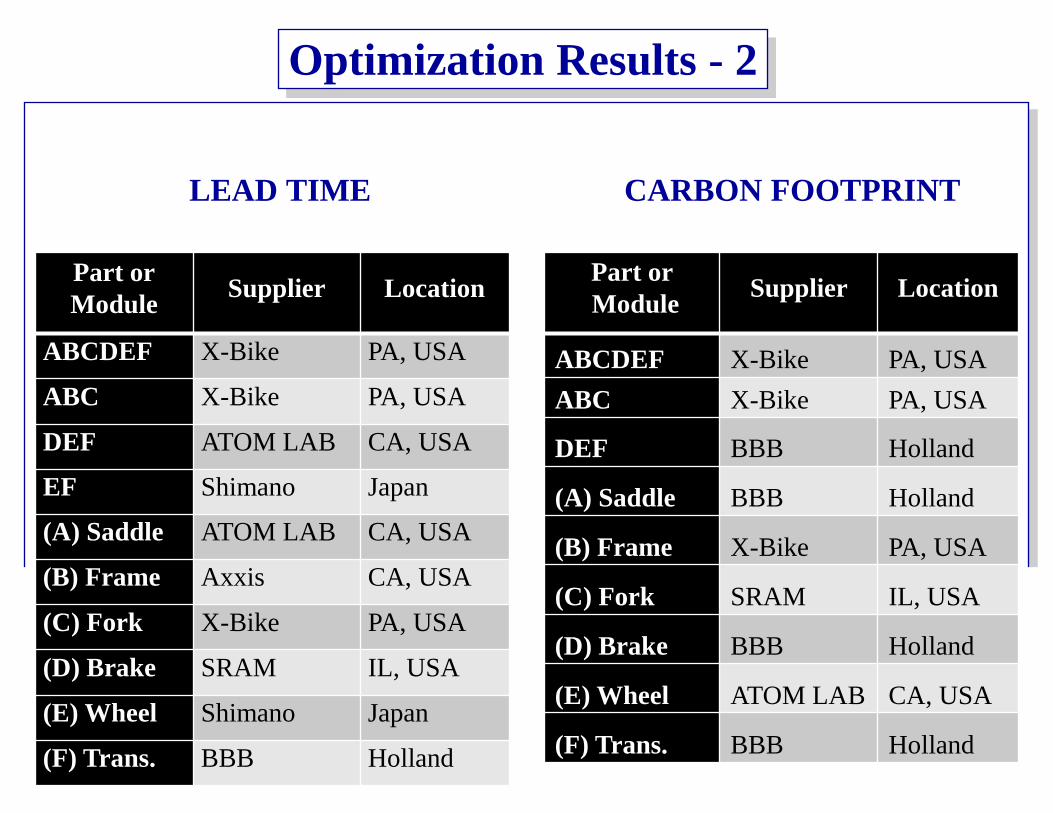
Optimization Results - 2
LEAD TIME CARBON FOOTPRINT
Part or
Module Supplier Location
ABCDEF X-Bike PA, USA
ABC X-Bike PA, USA
DEF ATOM LAB CA, USA
EF Shimano Japan
(A) Saddle ATOM LAB CA, USA
(B) Frame Axxis CA, USA
(C) Fork X-Bike PA, USA
(D) Brake SRAM IL, USA
(E) Wheel Shimano Japan
(F) Trans. BBB Holland
Part or
Module Supplier Location
ABCDEF X-Bike PA, USA
ABC X-Bike PA, USA
DEF BBB Holland
(A) Saddle BBB Holland
(B) Frame X-Bike PA, USA
(C) Fork SRAM IL, USA
(D) Brake BBB Holland
(E) Wheel ATOM LAB CA, USA
(F) Trans. BBB Holland

PENNSTATE © GEO KREMER
Sustainability at the Design Stage
The design stage determines 70% of life cycle costs. It is important that design concurrently consider the
manufacturing of the product and its supply chain so that a company may gain:
The ability to reduce waste or increase recyclability of materials
Supplier selection insight
Integrated modularity options
End of life product recovery plans
Flexibility
Reduced costs
Sustainability for profitability
PENNSTATE © GEO KREMER
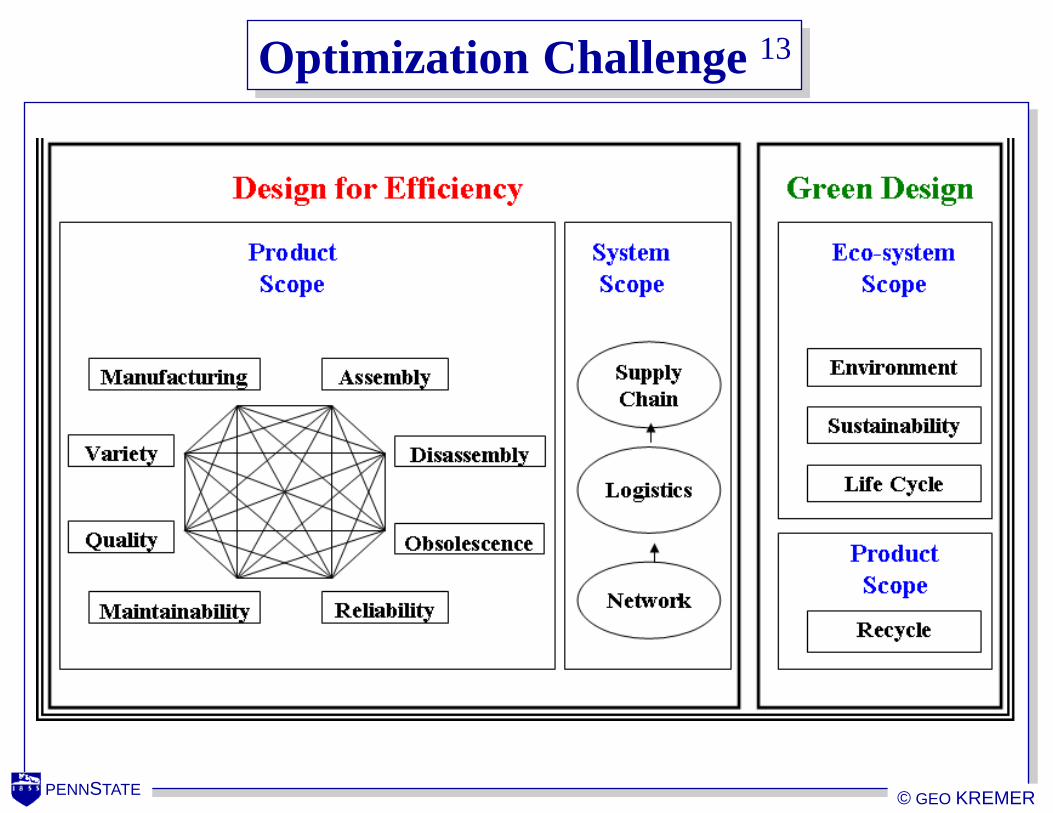
Optimization Challenge 13
PENNSTATE © GEO KREMER
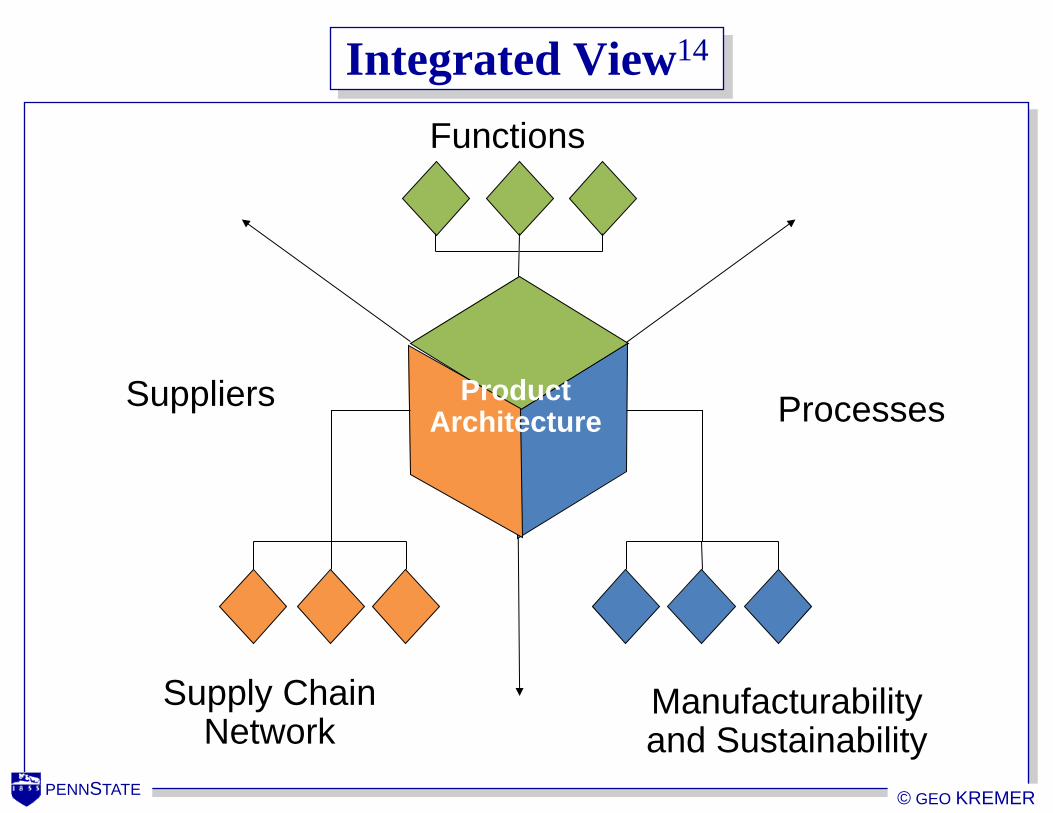
Functions
Manufacturability and Sustainability
Processes Suppliers Product Architecture
Supply Chain Network
Integrated View14
PENNSTATE © GEO KREMER
What is missing?
• Imprints of engineering surround us in products and
systems that provide time-limited satisfaction to our
needs. Eventually we complain about their
obsolescence, then move on to the next widget or
system we deem “the next best thing” or “the must-
have” replacement . Widely varied needs and
resources of 7.3 billion people underlie the
abandoned products and systems affected by this
vicious cycle of waste. Indeed, product engineering
is perhaps harder than ever before because most
products fail soon after their launch. Can product
engineering improve using life science approaches?

PENNSTATE © GEO KREMER
Inspirations from Life Sciences
Gharib Research Group 15
The research on Zebrafish morphogenesis contributed to the development of a new bioinspired concept for pumping at the microscale.
PENNSTATE © GEO KREMER
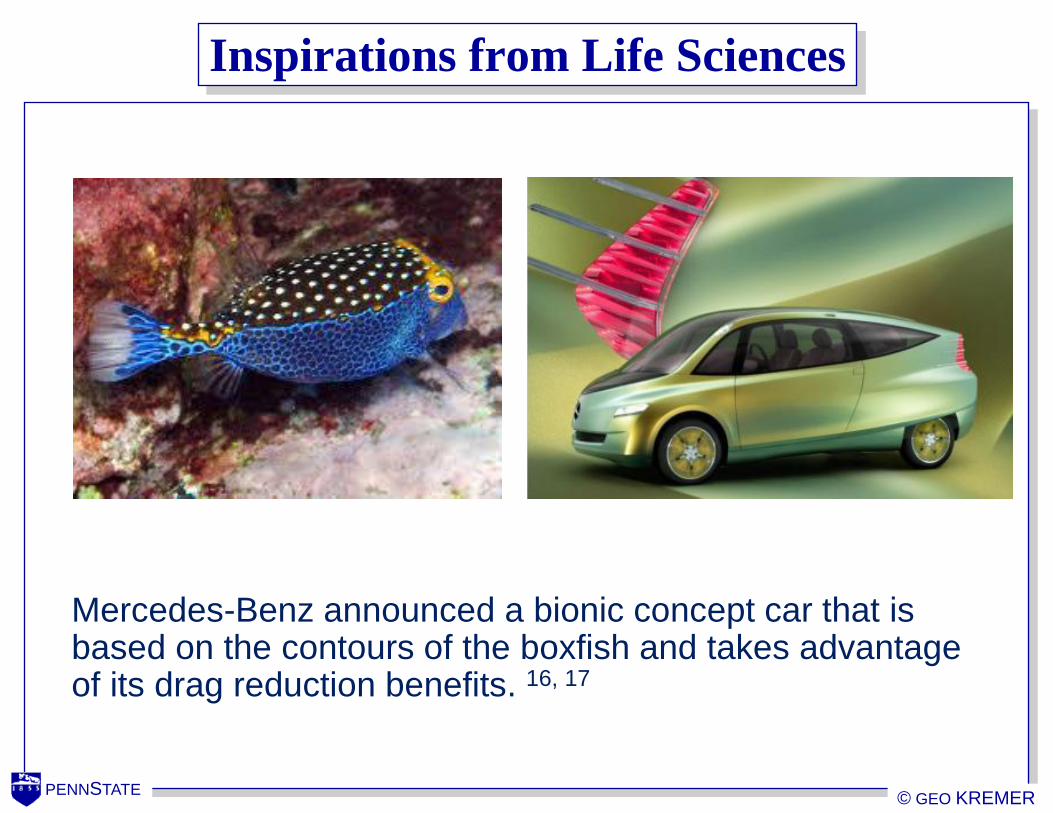
Inspirations from Life Sciences
Mercedes-Benz announced a bionic concept car that is based on the contours of the boxfish and takes advantage of its drag reduction benefits. 16, 17

PENNSTATE © GEO KREMER
Inspirations from Life Sciences 18

PENNSTATE © GEO KREMER
Cook: Apple has "learned not to worry about
cannibalization of our own product” 19
• “I see cannibalization as a huge opportunity for us. … Our
core philosophy is to never fear cannibalization. If we don’t
do it, someone else will. We know that iPhone has
cannibalized some of our iPod business. That doesn’t worry
us. We know that iPad will cannibalize some Macs.”

PENNSTATE © GEO KREMER
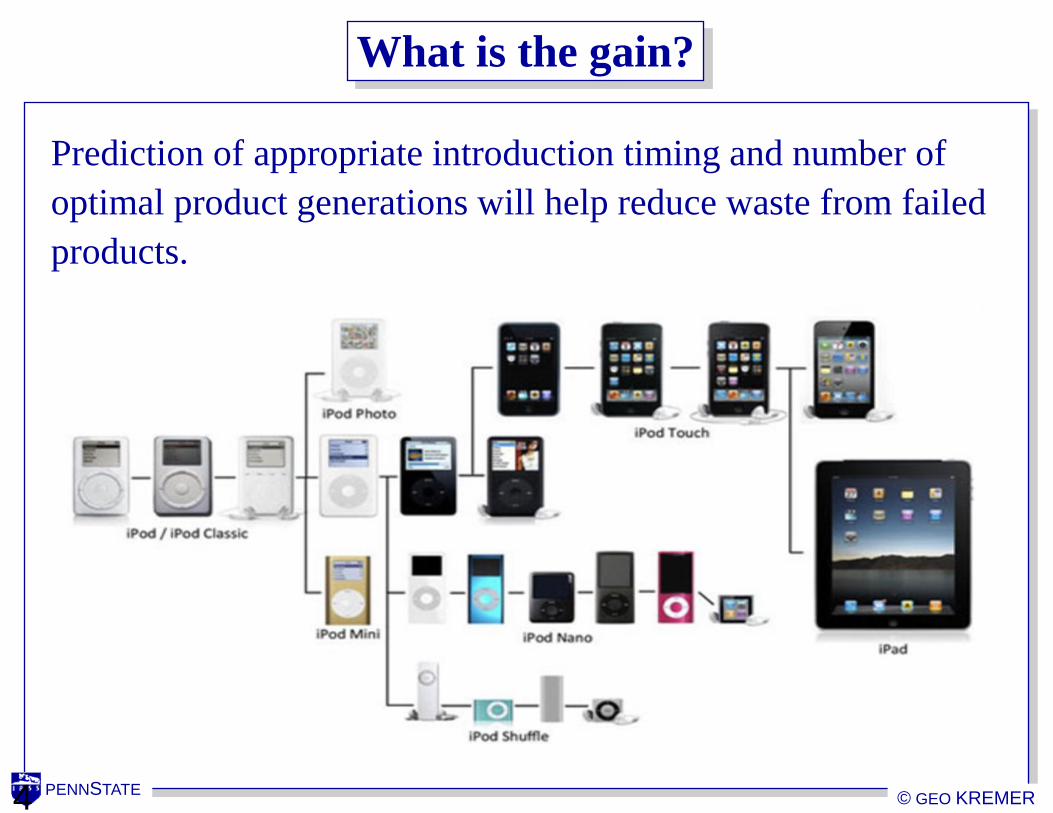
Apple Product Family 20, 21
PENNSTATE © GEO KREMER
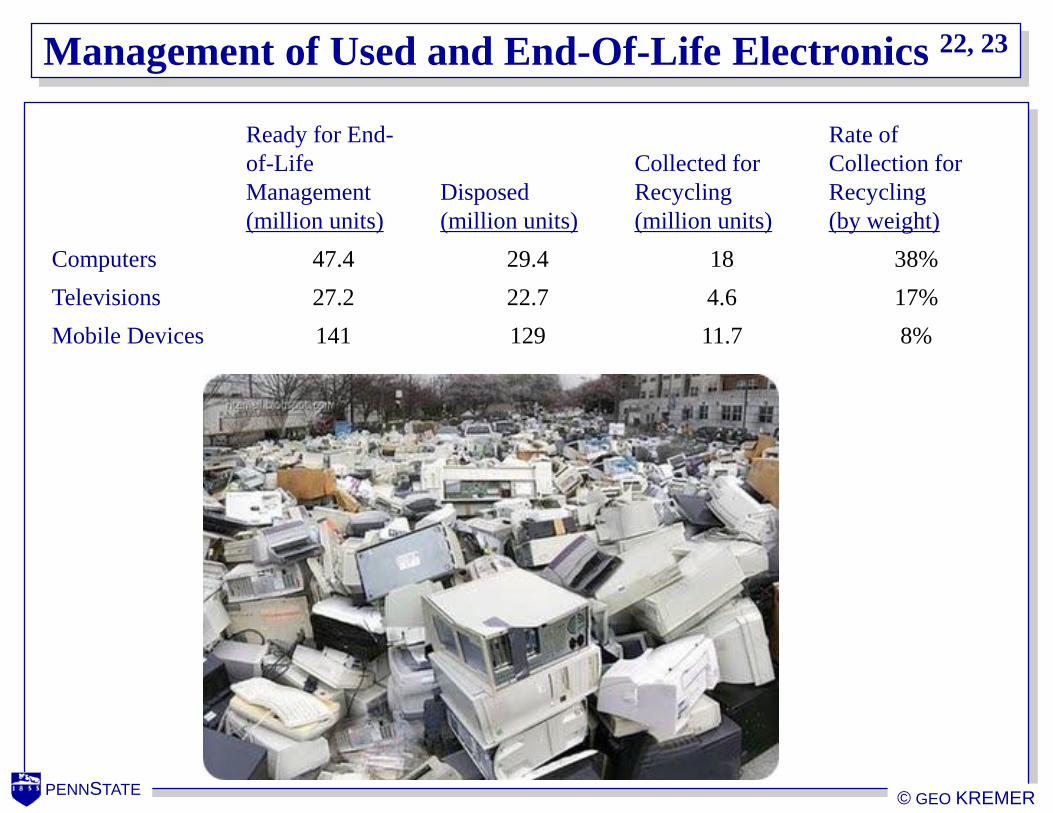
Management of Used and End-Of-Life Electronics 22, 23
Ready for End-
of-Life
Management
(million units)
Disposed
(million units)
Collected for
Recycling
(million units)
Rate of
Collection for
Recycling
(by weight)
Computers 47.4 29.4 18 38%
Televisions 27.2 22.7 4.6 17%
Mobile Devices 141 129 11.7 8%
PENNSTATE © GEO KREMER
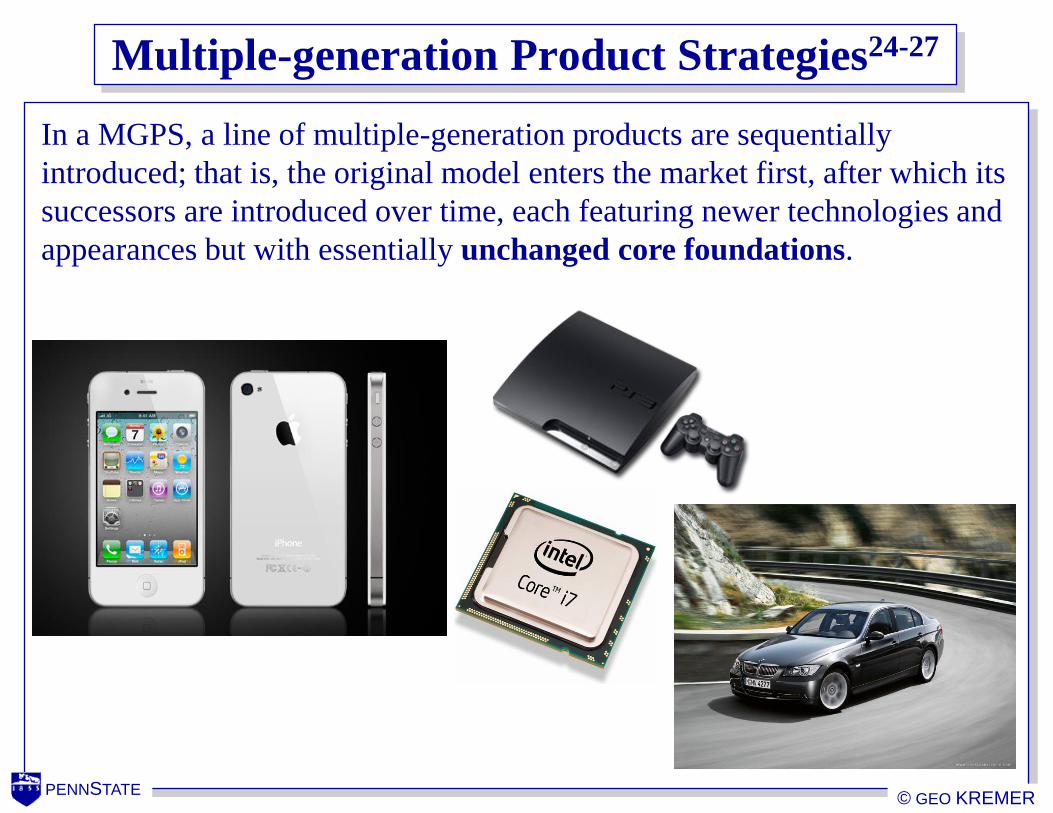
Multiple-generation Product Strategies24-27
In a MGPS, a line of multiple-generation products are sequentially
introduced; that is, the original model enters the market first, after which its
successors are introduced over time, each featuring newer technologies and
appearances but with essentially unchanged core foundations.
PENNSTATE © GEO KREMER 3
4
GE recognized that developing forward looking
MGPSs effectively enabled it to: better apply technologies to generations of products rather than applying
limited extant technologies on a single product;
concentrate R&D on the successive generations.
(Edelheit28)
Morgan et al.29 found that applying a forward looking
MGPS is significantly more profitable: 40% higher than introducing a single generation product;
26% higher than sequentially introducing a single generation product.
Multiple-generation Product Strategies
PENNSTATE © GEO KREMER 3
5
Cannibalization:
The scenario that multiple product generations directly compete with each
other in the same market.
May lead to unanticipated profit loss because less profitable older product
generations divide the market share originally expected to be monopolized
by the latest generation with the highest profit margin.
Market Fluctuations:
Change in customer behaviors/preferences;
Technology evolution.
Multiple-generation Product Strategies
PENNSTATE © GEO KREMER 3
6
Quantitative Models for Multiple-generation of Products
• Quantitative models toward MGPs can be divided into two categories:
1. Behavioral Models
Attempt to simulate and predict the behaviors of multiple-generation
product lines by applying following techniques:
– Bass diffusion model
– Integer programming technique
– Dynamic programming technique
– Fuzzy piecewise regression analysis
2. Dynamic Competition Models
Formulate the dynamic competitive scenarios of market and derive relative
market strategies regarding multiple-generation product lines.
Apply game theory based techniques and optimization.

PENNSTATE © GEO KREMER 3
7
Deficiencies of Existing Quantitative Models
• To develop a thorough MGPS for a forward looking MGPL, we
need a technique that can:
1. Forecast sales.
2. Forecast introduction timings.
3. Automatically determine the appropriate generations of products
for a certain product line lifecycle duration.
4. Generate optimal life time strategies.
• However, none of the existing models simultaneously possess all
the above capabilities.
PENNSTATE © GEO KREMER 3
8
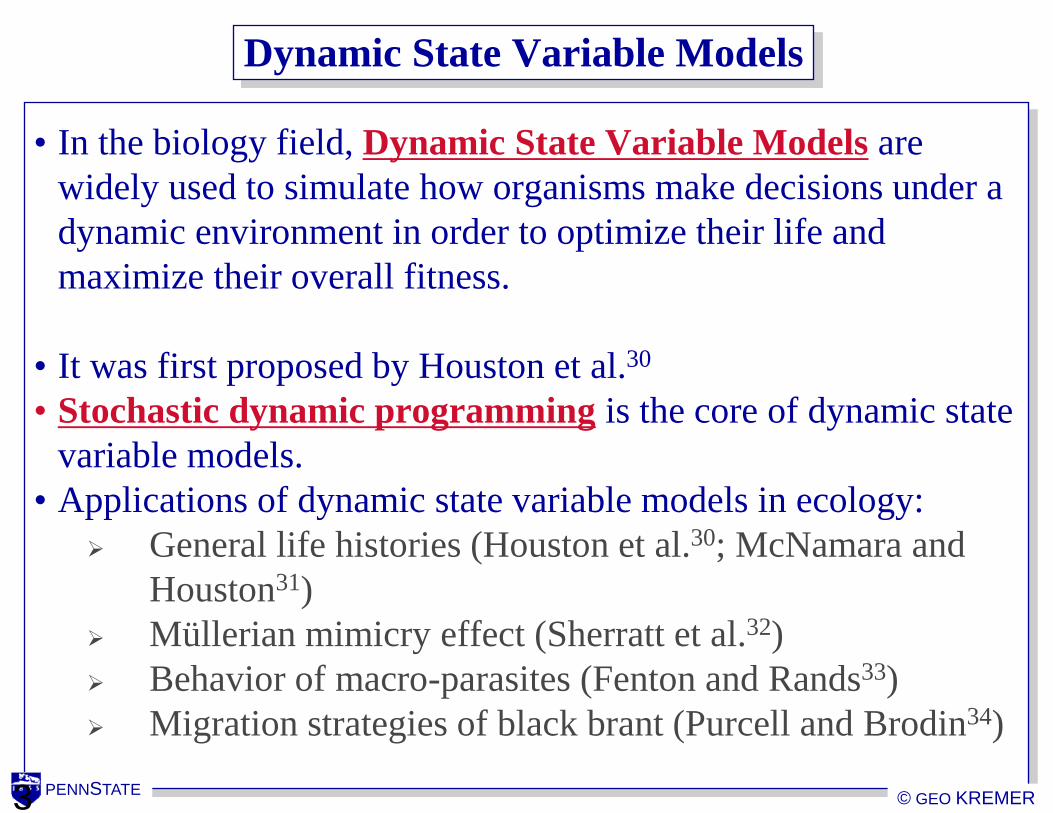
Dynamic State Variable Models
• In the biology field, Dynamic State Variable Models are
widely used to simulate how organisms make decisions under a
dynamic environment in order to optimize their life and
maximize their overall fitness.
• It was first proposed by Houston et al.30
• Stochastic dynamic programming is the core of dynamic state
variable models.
• Applications of dynamic state variable models in ecology:
General life histories (Houston et al.30; McNamara and
Houston31)
Müllerian mimicry effect (Sherratt et al.32)
Behavior of macro-parasites (Fenton and Rands33)
Migration strategies of black brant (Purcell and Brodin34)
PENNSTATE © GEO KREMER 3
9
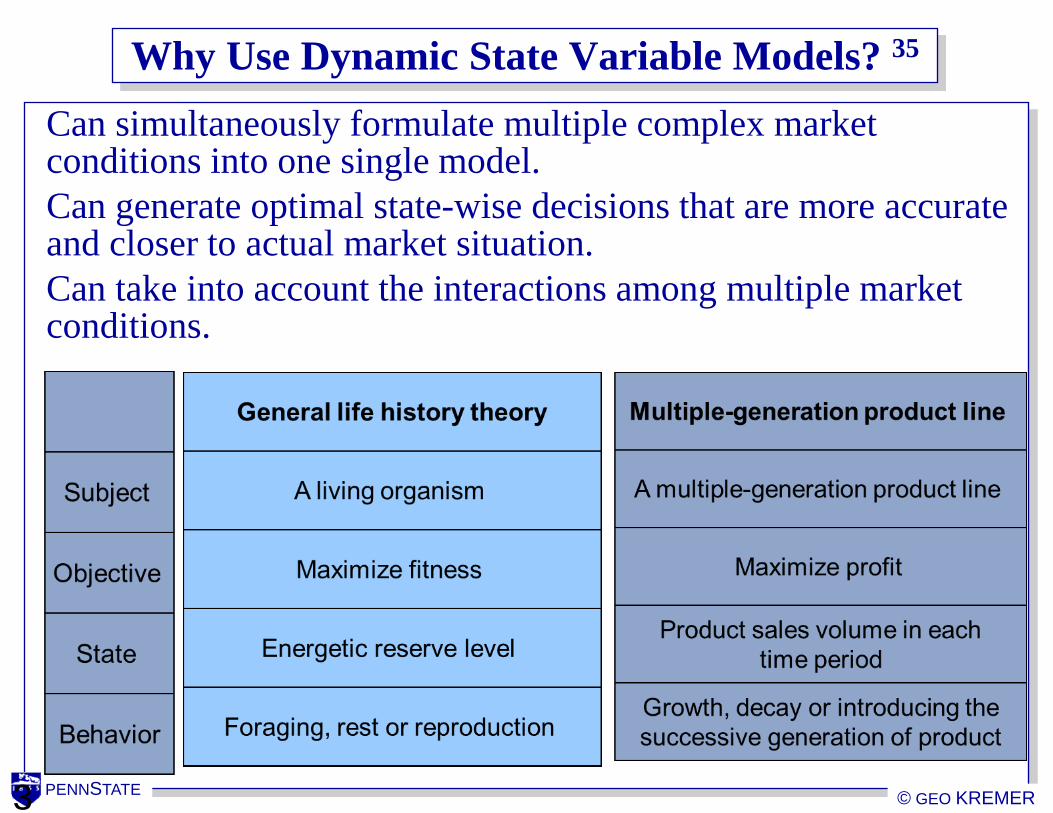
Why Use Dynamic State Variable Models? 35
Can simultaneously formulate multiple complex market conditions into one single model.
Can generate optimal state-wise decisions that are more accurate and closer to actual market situation.
Can take into account the interactions among multiple market conditions.
PENNSTATE © GEO KREMER
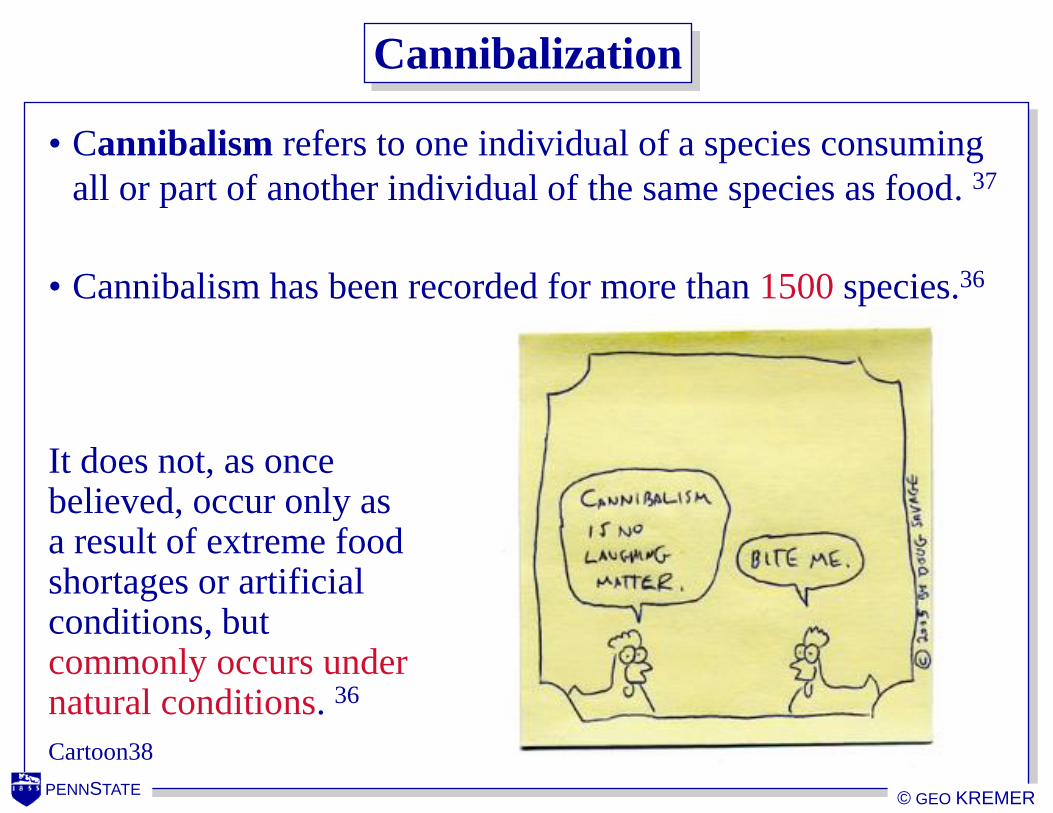
Cannibalization
• Cannibalism refers to one individual of a species consuming
all or part of another individual of the same species as food. 37
• Cannibalism has been recorded for more than 1500 species.36
It does not, as once believed, occur only as a result of extreme food shortages or artificial conditions, but commonly occurs under natural conditions. 36
Cartoon38

PENNSTATE © GEO KREMER 4
1
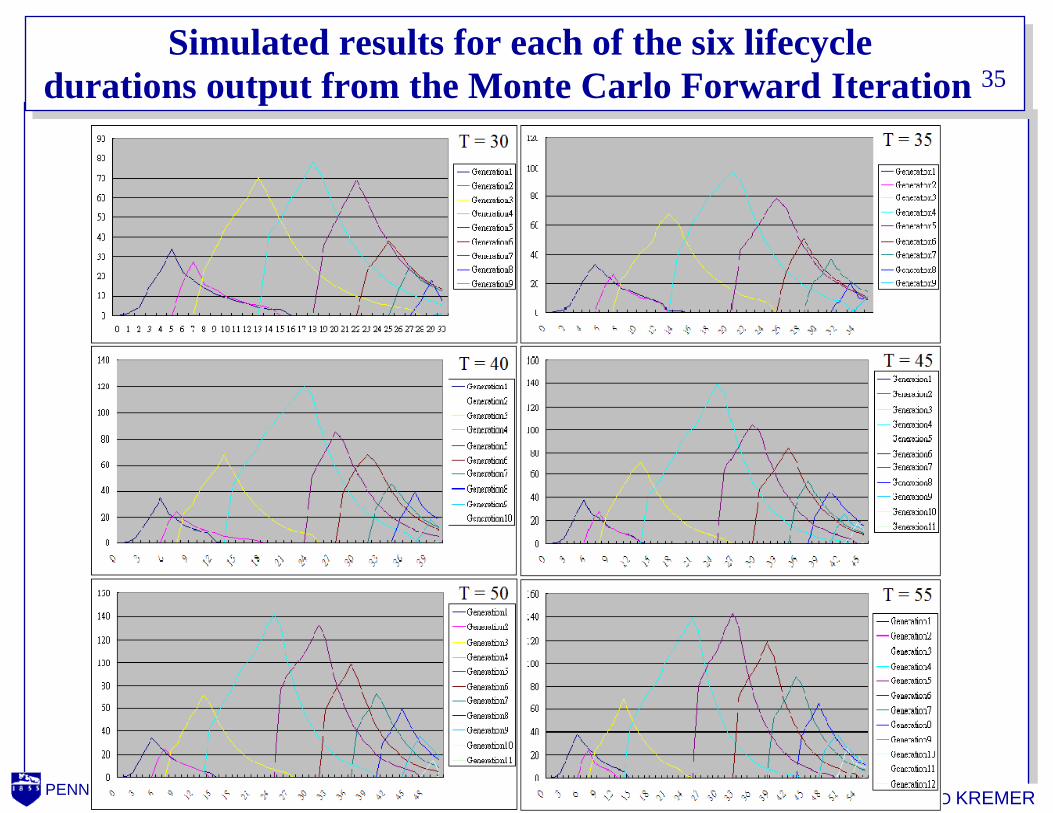
• Model settings for the case study:
1. We run the model with 6 different lifecycle durations T = 30, 35, 40, 45, 50, 55. (each time
period indicates one accounting season).
2. We use 150 states, and each state represents 200,000 units sale.
3. The polymonial boundaries Agg(t) and Th(t) are assumed to be symmetric at t = (T+1)/2.
4. We develop a program written in Excel VBA.
5. We run a Monte Carlo Forward Iteration 50 times to calculate the average introduction
timings.
) Methodology – The Cannibalization Model 35
Predicted introduction timings with different life-cycle durations comparing to the real iPhone product line:
PENNSTATE © GEO KREMER
Simulated results for each of the six lifecycle
durations output from the Monte Carlo Forward Iteration 35
PENNSTATE © GEO KREMER 4
3
What is the gain?
Prediction of appropriate introduction timing and number of
optimal product generations will help reduce waste from failed
products.
PENNSTATE © GEO KREMER
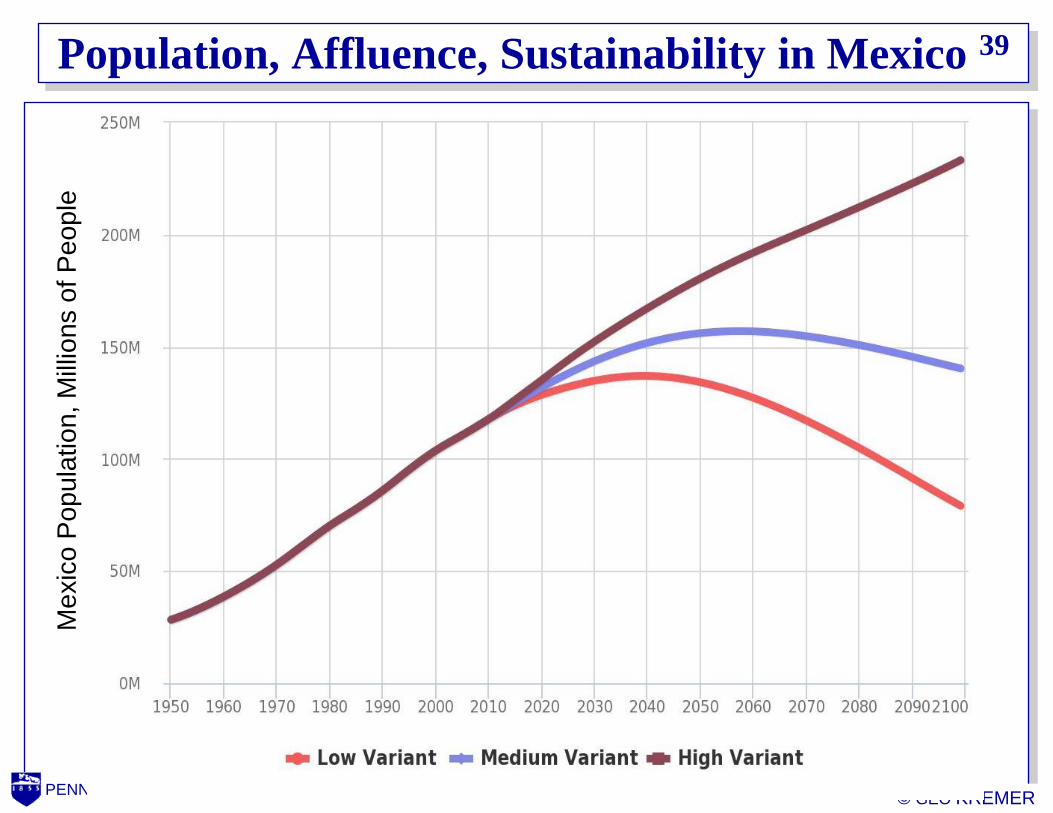
Population, Affluence, Sustainability in Mexico 39 M
exic
o P
op
ula
tio
n, M
illio
ns o
f P
eo
ple
PENNSTATE © GEO KREMER
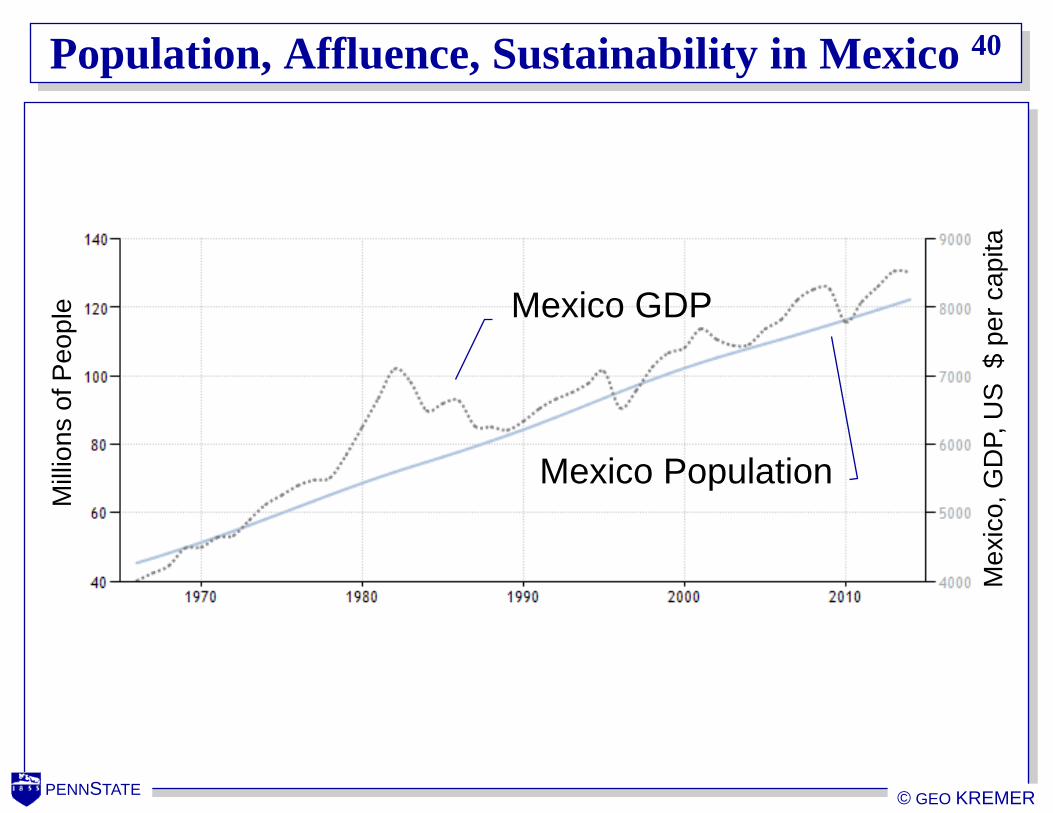
Population, Affluence, Sustainability in Mexico 40 M
illio
ns o
f P
eo
ple
Me
xic
o, G
DP, U
S $
pe
r ca
pita
Mexico GDP
Mexico Population
PENNSTATE © GEO KREMER
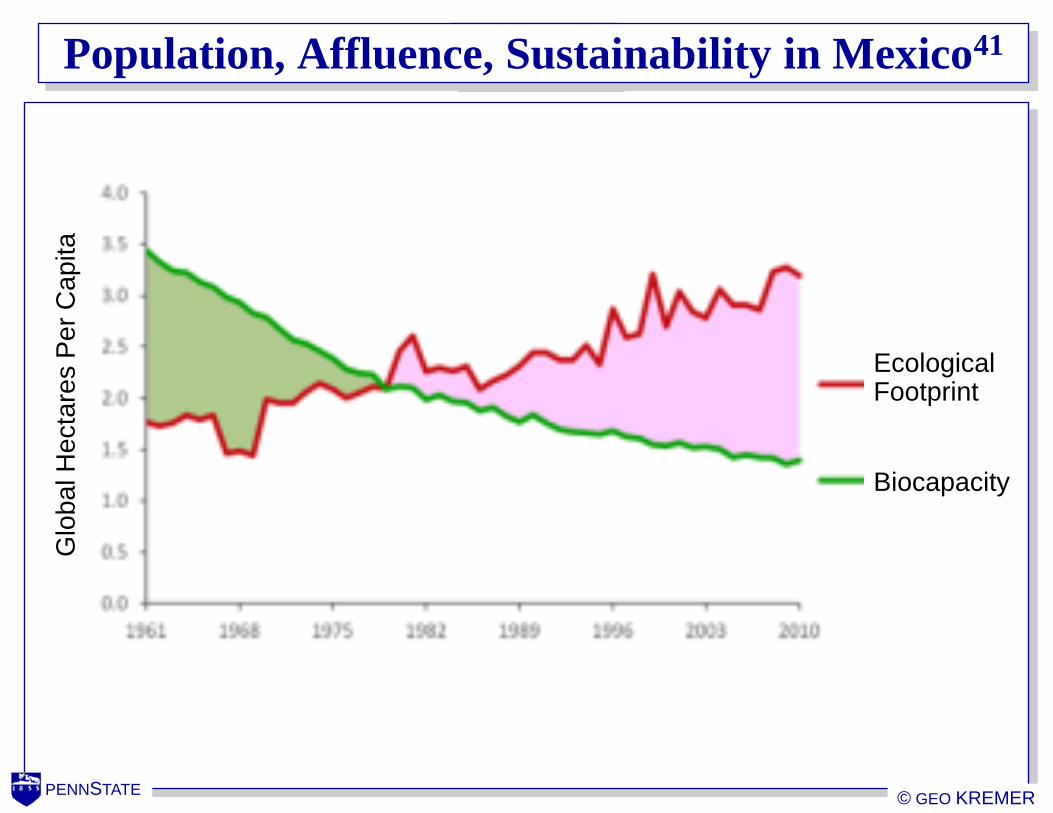
Population, Affluence, Sustainability in Mexico Population, Affluence, Sustainability in Mexico41 G
lobal H
ecta
res P
er
Capita
Ecological Footprint
Biocapacity

PENNSTATE © GEO KREMER
Mexico
Human Welfare and Ecological Footprint Compared 41
PENNSTATE © GEO KREMER
The Question
Are we going to Mars?
PENNSTATE © GEO KREMER
Call for Change
•Let’s infuse every engineering problem
we tackle with sustainability constraints.
•Let’s have our faculty and students
embrace innovation for sustainability.
•INFEWS – Innovations at the Nexus of
Food, Energy and Water Systems

PENNSTATE © GEO KREMER 5
0
1. Photo credit: http://www.mars-one.com/
2. Photo credit: http://earthobservatory.nasa.gov/IOTD/view.php?id=885
3. This formula is attributed to Paul Erlich, Barry Commoner and John Holdren. For further information please see the following:
1. Ehrlich, Paul R.; Holdren, John P. (1971). "Impact of Population Growth". Science (American Association for the
Advancement of Science) 171 (3977): 1212–1217. doi:10.1126/science.171.3977.1212. JSTOR 1731166. edit
2. Barry Commoner (May 1972). "A Bulletin Dialogue: on "The Closing Circle" - Response". Bulletin of the Atomic
Scientists: 17–56.
4. Population counter: http://www.worldometers.info/world-population
5. Graphic credit: http://www.worldpopulationbalance.org/global_population
6. Sustainability definition by the World Commission on Environment and Developmen
7. Sustainability definition by the US National Research Council in Rachuri, S., R. Sriram, and P. Sarkar. 2009. “Metrics, Standards
and Industry Best Practices for Sustainable Manufacturing Systems”. In IEEE International Conference on Automation Science
and Engineering, 472–477.
8. Mosovsky, J., Dickenson, D., and Morabito, J. (2000). “Creating Competitive Advantage Through Resource Productivity, Eco-
efficiency, and Sustainability in the Supply Chain” Proceedings of the International Symposium on Electronics and the
Environment.
9. http://en.wikipedia.org/wiki/Carbon_footprint
10.http://www.footprintnetwork.org/en/index.php/GFN/page/glossary/
11.http://www.windsorsportsgroup.com/news/35/cannondale-factory-mexico
12.Olson, E. , Okudan, G. E., Chiu, M-C., Haapala, K.R. (2011). “Positioning Product Architecture As the Driver for Carbon
Footprint & Efficiency Trade-offs in A Global Supply Chain”, 4th International Conference on Industrial Engineering and
Systems Management (IESM 2011), Metz, France.
13. Chiu, M-C. and Okudan, G.E. (2011). “Investigation of the Applicability of Design for X Tools during Design Concept
Evolution: A Literature Review”, International Journal of Product Development, Vol. 13, No. 2, pp.132-167.
14. Chiu, M-C. (2010). A Graph Theory-Based Integration of Product Design and Supply Chain Design”, PhD Dissertation,
Industrial and Manufacturing Engineering Department, Penn State University, December 2010.
References & Picture/Photo Credits
PENNSTATE © GEO KREMER
References & Picture/Photo Credits
15. http://www.gharib.caltech.edu/bioinspired_design/bio-tech.html
16. http://www.daimler.com/dccom/0-5-1276316-1-1525347-1-0-0-1320821-0-0-135-0-0-0-0-0-0-0-0.html
17. http://reefguide.org/spottedboxfish.html
18. Bill Reed http://www.regenesisgroup.com
19. http://allthingsd.com/20130123/apple-ceo-dont-fear-cannibalization-embrace-it/
20. Graph prepared by Kijung Park
21. http://www.hashslush.com/iwatch-keynote-presentation/
22. http://www.epa.gov/osw/conserve/materials/ecycling/manage.htm
23. http://www.wastemanagement.in/what-is-e-waste-management.html
24. http://cdn4.digitaltrends.com/wp-content/uploads/2010/06/apple-iphone-4-91.jpg
25. http://uk.playstation.com/media/252644/Main_PS3_Image_345w.png
26. http://4.bp.blogspot.com/-3IEa2qaq8vg/TgTYPOMeKiI/AAAAAAAABLI/1knAaoc8ANc/ s1600/BMW-3-Series-
Running-View.jpg
27. http://www.sharkyextreme.com/img/2008/11/core_i7/chip_1.jpg
28. Edelheit L.S.(2004). Perspective on GE research and development. Research Technology Management. Vol. 47(1): 49-
55.
29. Morgan L.O., Morgan R. M., and Moore W.L. (2001). Quality and time to market trade-offs when there are multiple
product generations. Manufacturing & Service Operations Management. Vol. 3(2): 89-104.
30. Houston, A., Clark, C., McNamara, J. and Mangel, M., 1988, “Dynamic Models in Behavioural and Evolutionary
Ecology”, Nature, 332(3), pp. 29-34.
31. McNamara, J.M. and Houston, A.I., 1996, “State-dependent Life Histories”, Nature, 380, pp. 215-221.

PENNSTATE © GEO KREMER
References & Picture/Photo Credits
32. Sherrat, T.N., Speed, M.P. and Ruxton, G.D., 2004, “Natural Selection on Unpalatable Species Imposed by State-
dependent Foraging Behaviour”, Journal of Theoretical Biology, 228, pp. 217-226.
33. Fenton, A. and Rands, S.A., 2004, “Optimal Parasite Infection Strategies: A state-dependent approach”, International
Journal for Parasitology, 34, pp. 813-821.
34. Purcell, J. and Brodin, A., 2007, “Factors Influencing Route Choice by Avian Migrants: A Dynamic Programming Model
of Pacific Brant Migration”, Journal of Theoretical Biology, 249, pp. 804-816.
35. Lin, C-Y. and Okudan, G.E. (2014). “Strategic Decision Making for Multiple-Generation Product Lines Using Dynamic
State Variable Models: The Cannibalization Case”, Computers in Industry, Vol. 65, pp. 79-90,
http://dx.doi.org/10.1016/j.compind.2013.07.010.
36. Polis, G.A. (1981). The evolution and dynamics of intraspecific predation. Annual Review of Ecology and Systematics 12,
225-251.
37. http://en.wikipedia.org/wiki/Cannibalism_(zoology)
38. http://www.savagechickens.com/2005/02/fun-with-cannibalism.html
39. http://worldpopulationreview.com/countries/mexico-population/
40. http://www.tradingeconomics.com/mexico/population
41. From Global Footprint Network website at http://www.footprintnetwork.org/en/index.php/GFN/page/trends/mexico/
42. Modified version by Travelplanner based on data from UN Development Programme and Global Footprint Network (Own
work) [CC BY-SA 3.0 (http://creativecommons.org/licenses/by-sa/3.0) or GFDL (http://www.gnu.org/copyleft/fdl.html)],
via Wikimedia Commons
Related Documents