Semi-Annual Report June 30, 2021 Small Cap Fund Small-Mid Cap Fund Global Fund Mid Cap Fund Short Duration Securitized Bond Fund Large Cap Fund Core Bond Fund All Cap Select Fund Corporate Credit Fund Large Cap Concentrated Fund Long-Short Fund High Yield Fund This material must be preceded or accompanied by a current prospectus. Not FDIC Insured. May Lose Value. No Bank Guarantee. International Fund

Welcome message from author
This document is posted to help you gain knowledge. Please leave a comment to let me know what you think about it! Share it to your friends and learn new things together.
Transcript

Semi-Annual ReportJune 30, 2021
Small Cap Fund
Small-Mid Cap Fund
Global Fund
Mid Cap Fund Short Duration Securitized Bond Fund
Large Cap Fund Core Bond Fund
All Cap Select Fund
Corporate Credit Fund Large Cap Concentrated Fund
Long-Short Fund
High Yield Fund
This material must be preceded or accompanied by a current prospectus. Not FDIC Insured. May Lose Value. No Bank Guarantee.
International Fund

Table of Contents
Vision and Our Shared Investment Principles � � � � � � � � � � � � � � � � � � � � � � � � � � � � � � � � � � � � � � � � � � � � � � � 1
Financial StatementsSchedule of Investments � � � � � � � � � � � � � � � � � � � � � � � � � � � � � � � � � � � � � � � � � � � � � � � � � � � � � � � � � � � � � � � 2Statements of Assets & Liabilities � � � � � � � � � � � � � � � � � � � � � � � � � � � � � � � � � � � � � � � � � � � � � � � � � � � � � � � � 70Statements of Operations � � � � � � � � � � � � � � � � � � � � � � � � � � � � � � � � � � � � � � � � � � � � � � � � � � � � � � � � � � � � � � 73Statements of Changes in Net Assets � � � � � � � � � � � � � � � � � � � � � � � � � � � � � � � � � � � � � � � � � � � � � � � � � � � � � 76Financial Highlights � � � � � � � � � � � � � � � � � � � � � � � � � � � � � � � � � � � � � � � � � � � � � � � � � � � � � � � � � � � � � � � � � � � � 96Notes to Financial Statements � � � � � � � � � � � � � � � � � � � � � � � � � � � � � � � � � � � � � � � � � � � � � � � � � � � � � � � � � � 122Other Items � � � � � � � � � � � � � � � � � � � � � � � � � � � � � � � � � � � � � � � � � � � � � � � � � � � � � � � � � � � � � � � � � � � � � � � � � 139Schedule of Shareholder Expenses � � � � � � � � � � � � � � � � � � � � � � � � � � � � � � � � � � � � � � � � � � � � � � � � � � � � � � � 143Operation and Effectiveness of the Funds’ Liquidity Risk Management Program � � � � � � � � � � � � � � � � � � � 146
Cautionary Statement: At Diamond Hill, we pledge that, “we will communicate with our clients about our investment performance in a manner that will allow them to properly assess whether we are deserving of their trust�” Our views and opinions regarding the investment prospects of our portfolio holdings and Funds are “forward looking statements” which may or may not be accurate over the long term� While we believe we have a reasonable basis for our opinions, actual results may differ materially from those we anticipate� Information provided in this report should not be considered a recommendation to purchase or sell any particular security�
You can identify forward looking statements by words like “believe,” “expect,” “anticipate,” or similar expressions when discussing prospects for particular portfolio holdings and/or one of the Funds� We cannot assure future results� You should not place undue reliance on forward-looking statements, which speak only as of the date of this report� We disclaim any obligation to update or alter any forward-looking statements, whether as a result of new information, future events, or otherwise�
This material is not authorized for distribution to prospective investors unless preceded or accompanied by a Prospectus� Investors should consider the investment objectives, risks, charges, and expenses of the Diamond Hill Funds carefully before investing� The prospectus or summary prospectus contain this and other important information about the Fund(s) and are available at diamond-hill�com or by calling 888�226�5595� Please read the prospectus or summary prospectus carefully before investing� The Diamond Hill Funds are distributed by Foreside Financial Services, LLC (Member FINRA)� Diamond Hill Capital Management, Inc�, a registered investment adviser, serves as Investment Adviser to the Diamond Hill Funds and is paid a fee for its services� Diamond Hill Funds are not FDIC insured, may lose value, and have no bank guarantee�

DIAMOND HILL FUNDS | SEMI-ANNUAL REPORT | JUNE 30, 2021 | DIAMOND-HILL.COM 1
VISIONAt Diamond Hill, our goal is to be an exceptional active investment boutique that our clients trust to deliver excellent long-term investment outcomes from a team aligned with their success.
OUR SHARED INVESTMENT PRINCIPLES
ACTIVE, FUNDAMENTAL APPROACH
We believe we can add the most value with an active, fundamentally driven process.
OWNERSHIP
Our investment professionals approach each investment as long-term owners, and they invest heavily alongside our clients. With every employee an owner of company shares their first day, we promote an ownership mentality throughout the firm.
LONG-TERM
We are long-term oriented in both our investment analysis and the management of our business.
VALUATION DISCIPLINE
We invest with a valuation discipline. We believe in taking an ownership stake in an investment at a discount to what we believe it is worth and waiting patiently for value to be realized.
CAPACITY DISCIPLINE
We are committed to capacity discipline. We believe prudent capacity management puts our clients’ interests first.
DIAMOND HILL FUNDS | SEMI-ANNUAL REPORT | JUNE 30, 2021 | DIAMOND-HILL.COM 1
Vision and Our Shared Investment Principles

2 DIAMOND HILL FUNDS | SEMI-ANNUAL REPORT | JUNE 30, 2021 | DIAMOND-HILL.COM
Shares
Fair Value
Financials — 28.8% continuedReinsurance Group
of America, Inc� 49,024 $ 5,588,736RenaissanceRe
Holdings Ltd� 34,191 5,088,305Sterling Bancorp (a) 1,080,030 26,773,944Triumph Bancorp, Inc� (b) 43,180 3,206,115
166,489,054
Health Care — 2.5%Integer Holdings
Corp� (b) 48,983 4,614,199LivaNova plc (b) 10,745 903,762Natus Medical, Inc� (b) 336,270 8,736,295
14,254,256
Industrials — 16.9%Allegiant Travel Co� (a)(b) 53,461 10,371,434Allied Motion
Technologies, Inc� 85,424 2,949,691Colfax Corp� (a)(b) 486,060 22,266,409Concrete Pumping
Holdings, Inc� (a)(b) 367,461 3,112,395Douglas Dynamics, Inc� 74,682 3,038,811Hyster-Yale Materials
Handling, Inc� 30,735 2,243,040Kirby Corp� (b) 193,912 11,758,824Sensata Technologies
Holding plc (b) 46,185 2,677,344SPX FLOW, Inc� 158,773 10,358,350Stericycle, Inc� (b) 122,522 8,766,449TriMas Corp� (b) 154,117 4,674,369WESCO International,
Inc� (b) 150,667 15,491,58197,708,697
Information Technology — 4.2%Broadridge Financial
Solutions, Inc� 16,757 2,706,758Sanmina Corp� (a)(b) 106,895 4,164,629WNS Holdings
Ltd� - ADR (b) 218,864 17,480,66824,352,055
Materials — 5.4%Ashland Global
Holdings, Inc� 154,079 13,481,912Chase Corp� (a) 53,815 5,521,957UFP Technologies, Inc� (b) 41,323 2,372,767W�R� Grace & Co� 140,000 9,676,800
31,053,436
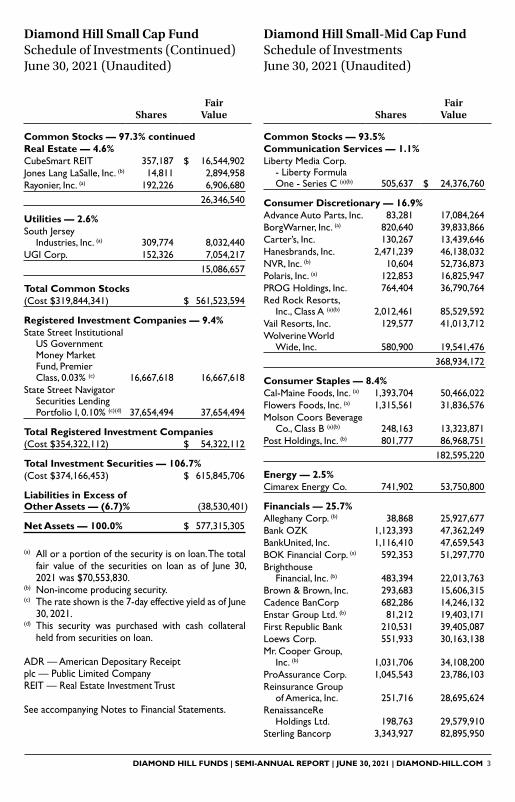
Diamond Hill Small Cap Fund Schedule of Investments June 30, 2021 (Unaudited)
Shares
Fair Value
Common Stocks — 97.3%Communication Services — 1.9%Live Nation
Entertainment, Inc� (a)(b) 124,718 $ 10,924,050
Consumer Discretionary — 16.1%Carter’s, Inc� (a) 49,663 5,123,732Green Brick Partners,
Inc� (a)(b) 494,466 11,244,157Hanesbrands, Inc� (a) 541,629 10,112,213PROG Holdings, Inc� 250,910 12,076,298Red Rock Resorts,
Inc�, Class A (a)(b) 695,535 29,560,237Vail Resorts, Inc� (b) 61,601 19,497,948Wolverine World
Wide, Inc� 160,000 5,382,40092,996,985
Consumer Staples — 11.3%Cal-Maine Foods, Inc� (a) 549,957 19,913,943Flowers Foods, Inc� (a) 333,190 8,063,198Lancaster Colony
Corp� (a) 38,997 7,546,309Post Holdings, Inc� (b) 173,336 18,801,756Seaboard Corp� (a) 2,814 10,886,606
65,211,812
Energy — 3.0%Bonanza Creek
Energy, Inc� (a) 186,727 8,789,240Cimarex Energy Co� 114,711 8,310,812
17,100,052
Financials — 28.8%Altabancorp 105,206 4,556,472Bank OZK 661,901 27,905,746BankUnited, Inc� (a) 125,000 5,336,250BOK Financial Corp� (a) 149,339 12,932,757Cadence BanCorp 600,000 12,528,000Enstar Group Ltd� (b) 74,704 17,848,280First Interstate
BancSystem, Inc�, Class A 115,303 4,823,124
First of Long Island Corp� (The) 178,735 3,794,544
Live Oak Bancshares, Inc� (a) 170,694 10,070,946
Mr� Cooper Group, Inc� (b) 346,487 11,454,860
ProAssurance Corp� 640,922 14,580,975
DIAMOND HILL FUNDS | SEMI-ANNUAL REPORT | JUNE 30, 2021 | DIAMOND-HILL.COM 3
Shares
Fair Value
Common Stocks — 97.3% continuedReal Estate — 4.6%CubeSmart REIT 357,187 $ 16,544,902Jones Lang LaSalle, Inc� (b) 14,811 2,894,958Rayonier, Inc� (a) 192,226 6,906,680
26,346,540
Utilities — 2.6%South Jersey
Industries, Inc� (a) 309,774 8,032,440UGI Corp� 152,326 7,054,217
15,086,657
Total Common Stocks(Cost $319,844,341) $ 561,523,594
Registered Investment Companies — 9.4%State Street Institutional
US Government Money Market Fund, Premier Class, 0�03% (c) 16,667,618 16,667,618
State Street Navigator Securities Lending Portfolio I, 0�10% (c)(d) 37,654,494 37,654,494
Total Registered Investment Companies(Cost $354,322,112) $ 54,322,112
Total Investment Securities — 106.7%(Cost $374,166,453) $ 615,845,706
Liabilities in Excess of Other Assets — (6.7)% (38,530,401)
Net Assets — 100.0% $ 577,315,305
(a) All or a portion of the security is on loan� The total fair value of the securities on loan as of June 30, 2021 was $70,553,830�
(b) Non-income producing security�(c) The rate shown is the 7-day effective yield as of June
30, 2021�(d) This security was purchased with cash collateral
held from securities on loan�
ADR — American Depositary Receiptplc — Public Limited CompanyREIT — Real Estate Investment Trust
See accompanying Notes to Financial Statements�
Diamond Hill Small Cap Fund Schedule of Investments (Continued) June 30, 2021 (Unaudited)
Diamond Hill Small-Mid Cap Fund Schedule of Investments June 30, 2021 (Unaudited)
Shares
Fair Value
Common Stocks — 93.5%Communication Services — 1.1%Liberty Media Corp�
- Liberty Formula One - Series C (a)(b) 505,637 $ 24,376,760
Consumer Discretionary — 16.9%Advance Auto Parts, Inc� 83,281 17,084,264BorgWarner, Inc� (a) 820,640 39,833,866Carter’s, Inc� 130,267 13,439,646Hanesbrands, Inc� 2,471,239 46,138,032NVR, Inc� (b) 10,604 52,736,873Polaris, Inc� (a) 122,853 16,825,947PROG Holdings, Inc� 764,404 36,790,764Red Rock Resorts,
Inc�, Class A (a)(b) 2,012,461 85,529,592Vail Resorts, Inc� 129,577 41,013,712Wolverine World
Wide, Inc� 580,900 19,541,476368,934,172
Consumer Staples — 8.4%Cal-Maine Foods, Inc� (a) 1,393,704 50,466,022Flowers Foods, Inc� (a) 1,315,561 31,836,576Molson Coors Beverage
Co�, Class B (a)(b) 248,163 13,323,871Post Holdings, Inc� (b) 801,777 86,968,751
182,595,220
Energy — 2.5%Cimarex Energy Co� 741,902 53,750,800
Financials — 25.7%Alleghany Corp� (b) 38,868 25,927,677Bank OZK 1,123,393 47,362,249BankUnited, Inc� 1,116,410 47,659,543BOK Financial Corp� (a) 592,353 51,297,770Brighthouse
Financial, Inc� (b) 483,394 22,013,763Brown & Brown, Inc� 293,683 15,606,315Cadence BanCorp 682,286 14,246,132Enstar Group Ltd� (b) 81,212 19,403,171First Republic Bank 210,531 39,405,087Loews Corp� 551,933 30,163,138Mr� Cooper Group,
Inc� (b) 1,031,706 34,108,200ProAssurance Corp� 1,045,543 23,786,103Reinsurance Group
of America, Inc� 251,716 28,695,624RenaissanceRe
Holdings Ltd� 198,763 29,579,910Sterling Bancorp 3,343,927 82,895,950

4 DIAMOND HILL FUNDS | SEMI-ANNUAL REPORT | JUNE 30, 2021 | DIAMOND-HILL.COM
Shares
Fair Value
Common Stocks — 93.5% continuedFinancials — 25.7% continuedSVB Financial Group (b) 85,908 $ 47,801,788
559,952,420
Health Care — 2.4%Boston Scientific
Corp� (b) 326,142 13,945,832Integer Holdings
Corp� (b) 160,226 15,093,289LivaNova plc (b) 286,992 24,138,897
53,178,018
Industrials — 18.3%Alaska Air Group, Inc� (b) 149,751 9,031,483Allegiant Travel Co� (b) 189,463 36,755,822Colfax Corp� (a)(b) 1,819,102 83,333,063Kirby Corp� (b) 837,340 50,776,298Sensata Technologies
Holding plc (b) 1,068,950 61,967,031SPX FLOW, Inc� 334,419 21,817,496Stericycle, Inc� (b) 471,497 33,735,610WESCO International,
Inc� (b) 987,996 101,585,749399,002,552
Information Technology — 3.5%Avnet, Inc� 238,335 9,552,467Broadridge Financial
Solutions, Inc� 65,435 10,569,716Sanmina Corp� (a)(b) 667,685 26,013,008WNS Holdings
Ltd� - ADR (b) 387,310 30,934,45077,069,641
Materials — 3.1%Ashland Global
Holdings, Inc� 448,995 39,287,062W�R� Grace & Co� 418,605 28,933,978
68,221,040
Real Estate — 7.3%CubeSmart REIT 1,613,901 74,755,894Douglas Emmett, Inc� 680,993 22,894,985Jones Lang LaSalle, Inc� (b) 65,694 12,840,549Mid-America Apartment
Communities, Inc� REIT 72,940 12,284,555
Rayonier, Inc� 684,873 24,607,487UDR, Inc� (a) 212,729 10,419,466
157,802,936
Shares
Fair Value
Utilities — 4.3%South Jersey
Industries, Inc� (a) 1,327,529 $ 34,422,827UGI Corp� 1,257,626 58,240,660
92,663,487
Total Common Stocks(Cost $1,353,314,098) $ 2,037,547,046
Registered Investment Companies — 10.5%Diamond Hill Short
Duration Securitized Bond Fund, Class Y (c) 2,676,550 27,247,280
State Street Institutional US Government Money Market Fund, Premier Class, 0�03% (d) 112,976,653 112,976,653
State Street Navigator Securities Lending Portfolio I, 0�10% (d)(e) 89,446,070 89,446,070
Total Registered Investment Companies(Cost $229,329,427) $ 229,670,003
Total Investment Securities — 104.0%(Cost $1,582,643,525) $ 2,267,217,049
Liabilities in Excess of Other Assets — (4.0)% (87,655,873)
Net Assets — 100.0% $ 2,179,561,176
(a) All or a portion of the security is on loan� The total fair value of the securities on loan as of June 30, 2021 was $141,650,496�
(b) Non-income producing security�(c) AffiliatedFund.(d) The rate shown is the 7-day effective yield as of June
30, 2021�(e) This security was purchased with cash collateral
held from securities on loan�
ADR — American Depositary Receiptplc — Public Limited CompanyREIT — Real Estate Investment Trust
See accompanying Notes to Financial Statements�
Diamond Hill Small-Mid Cap Fund Schedule of Investments (Continued) June 30, 2021 (Unaudited)

DIAMOND HILL FUNDS | SEMI-ANNUAL REPORT | JUNE 30, 2021 | DIAMOND-HILL.COM 5
Diamond Hill Mid Cap Fund Schedule of Investments June 30, 2021 (Unaudited)
Shares
Fair Value
Common Stocks — 94.0%Communication Services — 1.1%Liberty Media Corp�
- Liberty Formula One - Series C (a) 65,350 $ 3,150,524
Consumer Discretionary — 16.6%Advance Auto Parts, Inc� 11,184 2,294,286BorgWarner, Inc� 106,576 5,173,199Carter’s, Inc� 13,475 1,390,216Hanesbrands, Inc� 286,457 5,348,152NVR, Inc� (a) 1,349 6,708,982Polaris, Inc� 16,357 2,240,255PROG Holdings, Inc� 73,723 3,548,288Red Rock Resorts,
Inc�, Class A (a) 259,236 11,017,530Vail Resorts, Inc� 16,096 5,094,706VF Corp� 37,685 3,091,677
45,907,291
Consumer Staples — 7.8%Archer-Daniels-
Midland Co� 105,470 6,391,482Flowers Foods, Inc� 115,373 2,792,027Molson Coors Beverage
Co�, Class B (a) 47,531 2,551,939Post Holdings, Inc� (a) 90,670 9,834,975
21,570,423
Energy — 1.9%Cimarex Energy Co� 73,851 5,350,505
Financials — 27.5%Alleghany Corp� (a) 4,019 2,680,954American International
Group, Inc� 132,894 6,325,754Bank OZK 122,619 5,169,617BankUnited, Inc� 108,455 4,629,944BOK Financial Corp� 42,723 3,699,812Brighthouse
Financial, Inc� (a) 67,910 3,092,621Discover Financial
Services 28,277 3,344,886Enstar Group Ltd� (a) 8,758 2,092,461First Republic Bank 43,930 8,222,378Hartford Financial
Services Group, Inc� (The) 74,331 4,606,292
Loews Corp� 169,796 9,279,351Mr� Cooper Group,
Inc� (a) 97,098 3,210,060
Shares
Fair Value
Financials — 27.5% continuedReinsurance Group
of America, Inc� 15,609 $ 1,779,426RenaissanceRe
Holdings Ltd� 16,077 2,392,579Sterling Bancorp 307,099 7,612,984SVB Financial Group (a) 14,302 7,958,062
76,097,181
Health Care — 1.8%Boston Scientific
Corp� (a) 115,250 4,928,090
Industrials — 16.4%Alaska Air Group, Inc� (a) 70,066 4,225,681Colfax Corp� (a) 218,957 10,030,420Kirby Corp� (a) 98,452 5,970,129Parker-Hannifin Corp� 22,343 6,861,759Sensata Technologies
Holding plc (a) 112,903 6,544,987Stericycle, Inc� (a) 61,429 4,395,245WESCO International,
Inc� (a) 73,247 7,531,25745,559,478
Information Technology — 5.8%Avnet, Inc� 32,720 1,311,418Check Point Software
Technologies Ltd� (a) 69,934 8,121,435Cognizant Technology
Solutions Corp�, Class A 52,503 3,636,358
NXP Semiconductors NV 14,250 2,931,510
16,000,721
Materials — 3.4%Ashland Global
Holdings, Inc� 62,880 5,502,000W�R� Grace & Co� 56,707 3,919,588
9,421,588
Real Estate — 7.6%CubeSmart REIT 199,865 9,257,747Douglas Emmett, Inc� 92,102 3,096,469Jones Lang LaSalle, Inc� (a) 8,561 1,673,333Mid-America Apartment
Communities, Inc� REIT 8,165 1,375,149
Rayonier, Inc� 45,162 1,622,671UDR, Inc� 28,488 1,395,342

6 DIAMOND HILL FUNDS | SEMI-ANNUAL REPORT | JUNE 30, 2021 | DIAMOND-HILL.COM
Shares
Fair Value
Common Stocks — 94.0% continuedReal Estate — 7.6% continuedWeyerhaeuser Co� 76,231 $ 2,623,871
21,044,582
Utilities — 4.1%South Jersey
Industries, Inc� 148,950 3,862,274UGI Corp� 159,361 7,380,008
11,242,282
Total Common Stocks(Cost $168,147,158) $ 260,272,665
Registered Investment Companies — 6.0%Diamond Hill Short
Duration Securitized Bond Fund, Class Y (b) 163,413 1,663,549
State Street Institutional US Government Money Market Fund, Premier Class, 0�03% (c) 14,821,125 14,821,125
Total Registered Investment Companies(Cost $16,468,148) $ 16,484,674
Total Investment Securities — 100.0%(Cost $184,615,306) $ 276,757,339
Other Assets in Excess of Liabilities — 0.0% (d) 6,583
Net Assets — 100.0% $ 276,763,922
(a) Non-income producing security�(b) AffiliatedFund.(c) The rate shown is the 7-day effective yield as of June
30, 2021�(d) Percentage rounds to less than 0�1%�
plc — Public Limited CompanyREIT — Real Estate Investment TrustNV — Naamloze Vennootschap
See accompanying Notes to Financial Statements�
Diamond Hill Mid Cap Fund Schedule of Investments (Continued) June 30, 2021 (Unaudited)
Diamond Hill Large Cap Fund Schedule of Investments June 30, 2021 (Unaudited)
Shares
Fair Value
Common Stocks — 98.2%Communication Services — 10.8%Charter
Communications, Inc�, Class A (a)(b) 246,358 $ 177,734,979
Comcast Corp�, Class A 3,086,440 175,988,809Facebook, Inc�, Class A (b) 854,774 297,213,468Verizon
Communications, Inc� 2,196,011 123,042,496Walt Disney Co� (The) (b) 1,954,460 343,535,434Zynga, Inc�, Class A (b) 10,722,349 113,978,570
1,231,493,756
Consumer Discretionary — 11.1%Booking Holdings, Inc� (b) 86,669 189,639,572BorgWarner, Inc� 3,057,576 148,414,739General Motors Co� (b) 4,790,495 283,453,589Hanesbrands, Inc� 7,485,492 139,754,136NVR, Inc� (b) 56,066 278,833,038VF Corp� 2,698,299 221,368,450
1,261,463,524
Consumer Staples — 10.4%Archer-Daniels-
Midland Co� 2,819,829 170,881,637Kimberly-Clark Corp� 660,936 88,420,018Mondelēz International,
Inc�, Class A 5,002,373 312,348,170PepsiCo, Inc� 2,060,992 305,377,185Procter & Gamble
Co� (The) 2,250,701 303,687,0861,180,714,096
Energy — 2.3%Chevron Corp� 2,541,961 266,244,995
Financials — 27.1%American International
Group, Inc� 10,417,481 495,872,096Bank of America Corp� 8,397,430 346,226,039Berkshire Hathaway,
Inc�, Class B (b) 1,367,167 379,963,053Charles Schwab
Corp� (The) 3,343,689 243,453,996First Republic Bank 926,880 173,484,130Hartford Financial
Services Group, Inc� (The) 3,390,102 210,084,621
KKR & Co�, Inc� 6,452,203 382,228,506Marsh & McLennan
Cos�, Inc� 1,319,961 185,692,113

DIAMOND HILL FUNDS | SEMI-ANNUAL REPORT | JUNE 30, 2021 | DIAMOND-HILL.COM 7
Shares
Fair Value
Real Estate — 3.6% continuedWeyerhaeuser Co� 4,601,344 $ 158,378,260
412,562,625
Utilities — 1.2%Dominion Energy, Inc� 1,925,663 141,671,027
Total Common Stocks(Cost $7,778,883,709) $ 11,194,558,257
Registered Investment Companies — 1.9%State Street Institutional
US Government Money Market Fund, Premier Class, 0�03% (c) 208,717,778 208,717,778
State Street Navigator Securities Lending Portfolio I, 0�10% (c)(d) 6,509,399 6,509,399
Total Registered Investment Companies(Cost $215,227,177) $ 215,227,177
Total Investment Securities — 100.1%(Cost $7,994,110,886) $ 11,409,785,434
Liabilities in Excess of Other Assets — (0.1)% (9,593,054)
Net Assets — 100.0% $ 11,400,192,380
(a) All or a portion of the security is on loan� The total fair value of the securities on loan as of June 30, 2021 was $189,971,767�
(b) Non-income producing security�(c) The rate shown is the 7-day effective yield as of June
30, 2021�(d) This security was purchased with cash collateral
held from securities on loan�
plc — Public Limited CompanyREIT — Real Estate Investment Trust
See accompanying Notes to Financial Statements�
Shares
Fair Value
Common Stocks — 98.2% continuedFinancials — 27.1% continuedMetLife, Inc� 2,170,526 $ 129,905,981Morgan Stanley 1,996,783 183,085,033Truist Financial Corp� 4,229,299 234,726,095Wells Fargo & Co� 2,713,641 122,900,801
3,087,622,464
Health Care — 12.6%Abbott Laboratories 3,353,940 388,822,264AbbVie, Inc� 1,222,418 137,693,164Gilead Sciences, Inc� 1,469,756 101,207,398Humana, Inc� 582,688 257,967,631Medtronic plc 2,501,897 310,560,475Pfizer, Inc� 6,239,556 244,341,013
1,440,591,945
Industrials — 8.2%Carrier Global Corp� 3,153,019 153,236,723Caterpillar, Inc� 706,248 153,700,752Deere & Co� 353,895 124,822,305Honeywell
International, Inc� 612,811 134,420,093L3Harris Technologies,
Inc� 645,964 139,625,119Parker-Hannifin Corp� 749,936 230,312,845
936,117,837
Information Technology — 6.2%Cognizant Technology
Solutions Corp�, Class A 3,288,192 227,740,178
Fidelity National Information Services, Inc� 1,491,099 211,243,995
Texas Instruments, Inc� 568,214 109,267,552Visa, Inc�, Class A (a) 659,297 154,156,825
702,408,550
Materials — 4.7%Freeport-McMoRan, Inc� 6,354,100 235,800,651Linde plc 591,073 170,879,204Sherwin-Williams
Co� (The) 466,095 126,987,583533,667,438
Real Estate — 3.6%Public Storage REIT 550,421 165,506,090SBA Communications
Corp� 278,250 88,678,275
Diamond Hill Large Cap Fund Schedule of Investments (Continued) June 30, 2021 (Unaudited)

8 DIAMOND HILL FUNDS | SEMI-ANNUAL REPORT | JUNE 30, 2021 | DIAMOND-HILL.COM
Diamond Hill Large Cap Concentrated Fund Schedule of Investments June 30, 2021 (Unaudited)
Shares
Fair Value
Common Stocks — 96.1%Communication Services — 10.7%Facebook, Inc�, Class A (a) 1,941 $ 674,905Walt Disney Co� (The) (a) 4,667 820,318
1,495,223
Consumer Discretionary — 13.3%General Motors Co� (a) 10,969 649,036NVR, Inc� (a) 136 676,369VF Corp� 6,619 543,023
1,868,428
Consumer Staples — 10.0%Mondelēz International,
Inc�, Class A 11,116 694,083PepsiCo, Inc� 4,733 701,289
1,395,372
Energy — 4.4%Chevron Corp� 5,923 620,375
Financials — 27.9%American International
Group, Inc� 24,015 1,143,114Bank of America Corp� 16,106 664,050Berkshire Hathaway,
Inc�, Class B (a) 3,055 849,045Charles Schwab
Corp� (The) 7,450 542,434KKR & Co�, Inc� 11,846 701,757
3,900,400
Health Care — 14.4%Abbott Laboratories (b) 7,230 838,174Humana, Inc� 1,394 617,152Pfizer, Inc� 14,149 554,075
2,009,401
Industrials — 4.1%Parker-Hannifin Corp� 1,846 566,925
Information Technology — 7.4%Cognizant Technology
Solutions Corp�, Class A 7,597 526,168
Fidelity National Information Services, Inc� 3,634 514,829
1,040,997
Shares
Fair Value
Materials — 3.9%Freeport-McMoRan, Inc� 14,842 $ 550,787
Total Common Stocks(Cost $12,565,020) $ 13,447,908
Registered Investment Companies — 3.9%State Street Institutional
US Government Money Market Fund, Premier Class, 0�03% (c) 548,225 548,225
State Street Navigator Securities Lending Portfolio I, 0�10% (c)(d) 120 120
Total Registered Investment Companies(Cost $548,345) $ 548,345
Total Investment Securities — 100.0%(Cost $13,113,365) $ 13,996,253
Liabilities in Excess of Other Assets — (0.0)% (e) (1,272)
Net Assets — 100.0% $ 13,994,981
(a) Non-income producing security�(b) All or a portion of the security is on loan� The total
fair value of the securities on loan as of June 30, 2021 was $116�
(c) The rate shown is the 7-day effective yield as of June 30, 2021�
(d) This security was purchased with cash collateral held from securities on loan�
(e) Percentage rounds to less than 0�1%�
See accompanying Notes to Financial Statements�

DIAMOND HILL FUNDS | SEMI-ANNUAL REPORT | JUNE 30, 2021 | DIAMOND-HILL.COM 9
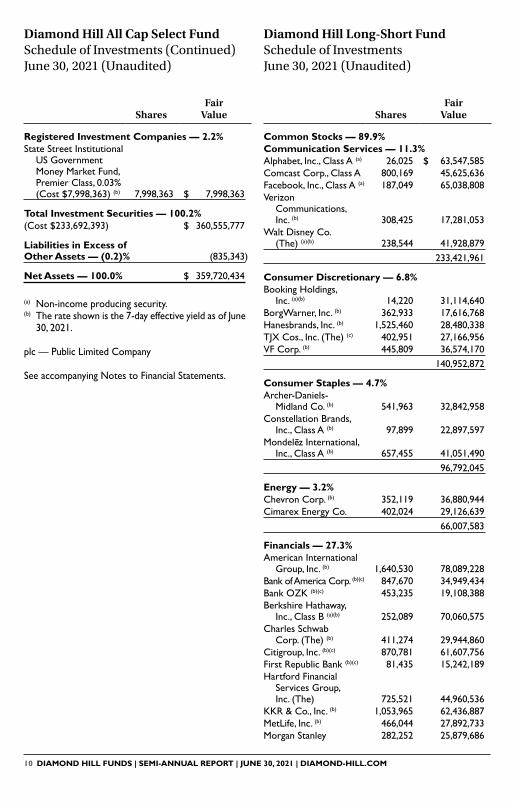
Diamond Hill All Cap Select Fund Schedule of Investments June 30, 2021 (Unaudited)
Shares
Fair Value
Common Stocks — 98.0%Communication Services — 8.8%Facebook, Inc�, Class A (a) 37,812 $ 13,147,611Walt Disney Co� (The) (a) 43,060 7,568,656Zynga, Inc�, Class A (a) 1,016,842 10,809,030
31,525,297
Consumer Discretionary — 10.8%Hanesbrands, Inc� 1,005,061 18,764,489Red Rock Resorts,
Inc�, Class A (a) 296,834 12,615,445VF Corp� 89,027 7,303,775
38,683,709
Consumer Staples — 10.1%Cal-Maine Foods, Inc� 250,990 9,088,348Mondelēz International,
Inc�, Class A 147,524 9,211,399Post Holdings, Inc� (a) 65,552 7,110,425Seaboard Corp� 2,825 10,929,162
36,339,334
Financials — 31.9%Alleghany Corp� (a) 8,089 5,395,929American International
Group, Inc� 477,526 22,730,238Bank OZK 194,803 8,212,894Berkshire Hathaway,
Inc�, Class B (a) 63,852 17,745,748Cadence BanCorp 393,635 8,219,099Charles Schwab
Corp� (The) 74,088 5,394,347KKR & Co�, Inc� 270,830 16,043,969Mr� Cooper Group,
Inc� (a) 635,870 21,021,862Sterling Bancorp 396,127 9,819,988
114,584,074
Health Care — 6.5%AbbVie, Inc� 71,292 8,030,331Boston Scientific
Corp� (a) 165,183 7,063,225Pfizer, Inc� 214,519 8,400,564
23,494,120
Shares
Fair Value
Industrials — 16.8%Cimpress plc (a) 86,507 $ 9,378,224Colfax Corp� (a) 235,735 10,799,020Kirby Corp� (a) 189,119 11,468,176Sensata Technologies
Holding plc (a) 98,199 5,692,596WESCO International,
Inc� (a) 223,690 22,999,80660,337,822
Information Technology — 4.2%Cognizant Technology
Solutions Corp�, Class A 118,210 8,187,225
Fidelity National Information Services, Inc� 49,978 7,080,383
15,267,608
Materials — 6.9%Ashland Global
Holdings, Inc� 60,457 5,289,988Freeport-McMoRan, Inc� 206,435 7,660,803W�R� Grace & Co� 173,590 11,998,541
24,949,332
Utilities — 2.0%UGI Corp� 159,277 7,376,118
Total Common Stocks(Cost $225,694,030) $ 352,557,414
10 DIAMOND HILL FUNDS | SEMI-ANNUAL REPORT | JUNE 30, 2021 | DIAMOND-HILL.COM
Shares
Fair Value
Registered Investment Companies — 2.2%State Street Institutional
US Government Money Market Fund, Premier Class, 0�03% (Cost $7,998,363) (b) 7,998,363 $ 7,998,363
Total Investment Securities — 100.2%(Cost $233,692,393) $ 360,555,777
Liabilities in Excess of Other Assets — (0.2)% (835,343)
Net Assets — 100.0% $ 359,720,434
(a) Non-income producing security�(b) The rate shown is the 7-day effective yield as of June
30, 2021�
plc — Public Limited Company
See accompanying Notes to Financial Statements�
Diamond Hill All Cap Select Fund Schedule of Investments (Continued) June 30, 2021 (Unaudited)
Diamond Hill Long-Short Fund Schedule of Investments June 30, 2021 (Unaudited)
Shares
Fair Value
Common Stocks — 89.9%Communication Services — 11.3%Alphabet, Inc�, Class A (a) 26,025 $ 63,547,585Comcast Corp�, Class A 800,169 45,625,636Facebook, Inc�, Class A (a) 187,049 65,038,808Verizon
Communications, Inc� (b) 308,425 17,281,053
Walt Disney Co� (The) (a)(b) 238,544 41,928,879
233,421,961
Consumer Discretionary — 6.8%Booking Holdings,
Inc� (a)(b) 14,220 31,114,640BorgWarner, Inc� (b) 362,933 17,616,768Hanesbrands, Inc� (b) 1,525,460 28,480,338TJX Cos�, Inc� (The) (c) 402,951 27,166,956VF Corp� (b) 445,809 36,574,170
140,952,872
Consumer Staples — 4.7%Archer-Daniels-
Midland Co� (b) 541,963 32,842,958Constellation Brands,
Inc�, Class A (b) 97,899 22,897,597Mondelēz International,
Inc�, Class A (b) 657,455 41,051,49096,792,045
Energy — 3.2%Chevron Corp� (b) 352,119 36,880,944Cimarex Energy Co� 402,024 29,126,639
66,007,583
Financials — 27.3%American International
Group, Inc� (b) 1,640,530 78,089,228Bank of America Corp� (b)(c) 847,670 34,949,434Bank OZK (b)(c) 453,235 19,108,388Berkshire Hathaway,
Inc�, Class B (a)(b) 252,089 70,060,575Charles Schwab
Corp� (The) (b) 411,274 29,944,860Citigroup, Inc� (b)(c) 870,781 61,607,756First Republic Bank (b)(c) 81,435 15,242,189Hartford Financial
Services Group, Inc� (The) 725,521 44,960,536
KKR & Co�, Inc� (b) 1,053,965 62,436,887MetLife, Inc� (b) 466,044 27,892,733Morgan Stanley 282,252 25,879,686
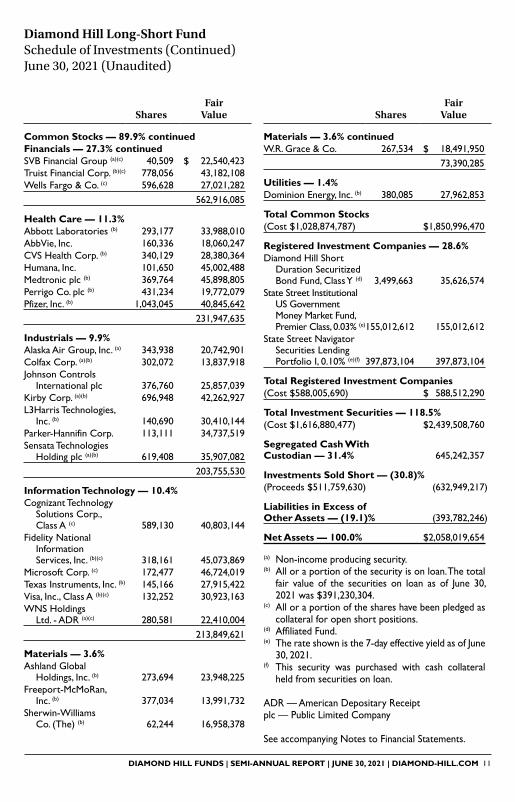
DIAMOND HILL FUNDS | SEMI-ANNUAL REPORT | JUNE 30, 2021 | DIAMOND-HILL.COM 11
Shares
Fair Value
Common Stocks — 89.9% continuedFinancials — 27.3% continuedSVB Financial Group (a)(c) 40,509 $ 22,540,423Truist Financial Corp� (b)(c) 778,056 43,182,108Wells Fargo & Co� (c) 596,628 27,021,282
562,916,085
Health Care — 11.3%Abbott Laboratories (b) 293,177 33,988,010AbbVie, Inc� 160,336 18,060,247CVS Health Corp� (b) 340,129 28,380,364Humana, Inc� 101,650 45,002,488Medtronic plc (b) 369,764 45,898,805Perrigo Co� plc (b) 431,234 19,772,079Pfizer, Inc� (b) 1,043,045 40,845,642
231,947,635
Industrials — 9.9%Alaska Air Group, Inc� (a) 343,938 20,742,901Colfax Corp� (a)(b) 302,072 13,837,918Johnson Controls
International plc 376,760 25,857,039Kirby Corp� (a)(b) 696,948 42,262,927L3Harris Technologies,
Inc� (b) 140,690 30,410,144Parker-Hannifin Corp� 113,111 34,737,519Sensata Technologies
Holding plc (a)(b) 619,408 35,907,082203,755,530
Information Technology — 10.4%Cognizant Technology
Solutions Corp�, Class A (c) 589,130 40,803,144
Fidelity National Information Services, Inc� (b)(c) 318,161 45,073,869
Microsoft Corp� (c) 172,477 46,724,019Texas Instruments, Inc� (b) 145,166 27,915,422Visa, Inc�, Class A (b)(c) 132,252 30,923,163WNS Holdings
Ltd� - ADR (a)(c) 280,581 22,410,004213,849,621
Materials — 3.6%Ashland Global
Holdings, Inc� (b) 273,694 23,948,225Freeport-McMoRan,
Inc� (b) 377,034 13,991,732Sherwin-Williams
Co� (The) (b) 62,244 16,958,378
Diamond Hill Long-Short Fund Schedule of Investments (Continued) June 30, 2021 (Unaudited)
Shares
Fair Value
Materials — 3.6% continuedW�R� Grace & Co� 267,534 $ 18,491,950
73,390,285
Utilities — 1.4%Dominion Energy, Inc� (b) 380,085 27,962,853
Total Common Stocks(Cost $1,028,874,787) $1,850,996,470
Registered Investment Companies — 28.6%Diamond Hill Short
Duration Securitized Bond Fund, Class Y (d) 3,499,663 35,626,574
State Street Institutional US Government Money Market Fund, Premier Class, 0�03% (e)155,012,612 155,012,612
State Street Navigator Securities Lending Portfolio I, 0�10% (e)(f) 397,873,104 397,873,104
Total Registered Investment Companies(Cost $588,005,690) $ 588,512,290
Total Investment Securities — 118.5%(Cost $1,616,880,477) $ 2,439,508,760
Segregated Cash With Custodian — 31.4% 645,242,357
Investments Sold Short — (30.8)%(Proceeds $511,759,630) (632,949,217)
Liabilities in Excess of Other Assets — (19.1)% (393,782,246)
Net Assets — 100.0% $ 2,058,019,654
(a) Non-income producing security�(b) All or a portion of the security is on loan� The total
fair value of the securities on loan as of June 30, 2021 was $391,230,304�
(c) All or a portion of the shares have been pledged as collateral for open short positions�
(d) AffiliatedFund.(e) The rate shown is the 7-day effective yield as of June
30, 2021�(f) This security was purchased with cash collateral
held from securities on loan�
ADR — American Depositary Receiptplc — Public Limited Company
See accompanying Notes to Financial Statements�

12 DIAMOND HILL FUNDS | SEMI-ANNUAL REPORT | JUNE 30, 2021 | DIAMOND-HILL.COM
Diamond Hill Long-Short Fund Schedule of Investments Sold Short June 30, 2021 (Unaudited)
Shares
Fair Value
Common Stocks — 30.8%Communication Services — 1.0%Cogent
Communications Holdings, Inc� 276,595 $ 21,267,390
Consumer Discretionary — 7.0%Best Buy Co�, Inc� 214,906 24,709,892CarMax, Inc� 107,005 13,819,696Cheesecake Factory,
Inc� (The) 115,533 6,259,578Dick’s Sporting
Goods, Inc� 285,646 28,618,873Grand Canyon
Education, Inc� 147,112 13,235,667Macy’s, Inc� 999,805 18,956,303Tesla, Inc� 23,074 15,683,398Under Armour,
Inc�, Class A 256,994 5,435,423Whirlpool Corp� 80,205 17,486,294
144,205,124
Consumer Staples — 4.0%Boston Beer Co�, Inc�
(The), Class A 18,103 18,479,542Brown-Forman
Corp�, Class B 476,330 35,696,170WD-40 Co� 106,567 27,312,056
81,487,768
Financials — 5.0%Bank of Hawaii Corp� 162,645 13,697,962Blackstone Mortgage
Trust, Inc�, Class A 645,515 20,585,473Commerce
Bancshares, Inc� 300,391 22,397,153FactSet Research
Systems, Inc� 18,862 6,330,276First Financial
Bankshares, Inc� 498,388 24,485,802Root, Inc�, Class A 976,790 10,568,868Westamerica BanCorp� 83,265 4,831,868
102,897,402
Health Care — 2.4%Penumbra, Inc� 92,230 25,276,554Waters Corp� 67,075 23,181,791
48,458,345
Industrials — 4.9%Cintas Corp� 48,274 18,440,668PACCAR, Inc� 106,882 9,539,218
Shares
Fair Value
Industrials — 4.9% continuedProto Labs, Inc� 103,420 $ 9,493,956Robert Half
International, Inc� 347,683 30,933,357United Parcel Service,
Inc�, Class B 69,385 14,429,998W�W� Grainger, Inc� 29,685 13,002,030Wabtec Corp� 67,745 5,575,414
101,414,641
Information Technology — 5.0%Badger Meter, Inc� 197,671 19,395,479Blackbaud, Inc� 181,362 13,886,888Cisco Systems, Inc� 176,045 9,330,385j2 Global, Inc� 147,059 20,227,965Oracle Corp� 463,053 36,044,046Western Union
Co� (The) 131,109 3,011,574101,896,337
Materials — 0.3%Silgan Holdings, Inc� 140,710 5,839,465
Utilities — 1.2%Ormat Technologies, Inc� 366,500 25,482,745
Total Investments Sold Short — 30.8%(Proceeds $511,759,630) $ 632,949,217
Percentages disclosed are based on total net assets of the Fund at June 30, 2021�
See accompanying Notes to Financial Statements�

DIAMOND HILL FUNDS | SEMI-ANNUAL REPORT | JUNE 30, 2021 | DIAMOND-HILL.COM 13
Diamond Hill Global Fund Schedule of Investments June 30, 2021 (Unaudited)
Shares
Fair Value
Common Stocks — 97.4%Canada — 5.6%Rogers Communications,
Inc�, Class B (a) 17,946 $ 953,650
China — 3.7%Alibaba Group
Holding Ltd� (b) 19,700 558,568Tencent Holdings Ltd� 800 60,234
618,802
France — 3.3%Safran SA 2,029 281,640Ubisoft Entertainment
SA (b) 3,849 268,968550,608
Germany — 2.5%Beiersdorf AG 3,570 430,996
India — 0.9%HDFC Bank Ltd�
- ADR (b) 2,150 157,208
Israel — 5.8%Check Point Software
Technologies Ltd� (b) 8,525 990,008
Japan — 3.6%KDDI Corp� 9,800 305,353Nintendo Co�
Ltd� - ADR (a) 4,223 306,294611,647
Mexico — 2.5%Fomento Economico
Mexicano SAB de CV 50,965 431,066
South Korea — 0.9%Samsung Electronics
Co� Ltd� 2,025 144,445
Switzerland — 9.0%Novartis AG - ADR (a) 3,240 295,618Roche Holdings AG 2,282 859,926Swatch Group AG (The) 1,094 375,688
1,531,232
Shares
Fair Value
United Kingdom — 12.6%Ashmore Group plc 148,321 $ 790,471Diageo plc 7,045 337,647Sage Group plc (The) 8,924 84,528Unilever plc 15,687 919,561
2,132,207
United States — 47.0%Abbott Laboratories 2,590 300,259Alphabet, Inc�, Class A (b) 145 354,060Berkshire Hathaway,
Inc�, Class B (b) 3,011 836,817Booking Holdings, Inc� (b) 139 304,145Charles Schwab
Corp� (The) 6,449 469,552Chevron Corp� 6,025 631,058Comcast Corp�, Class A 6,004 342,348Constellation Brands,
Inc�, Class A 1,525 356,682Liberty Media Corp�
- Liberty Formula One, Series C (b) 3,800 183,198
Medtronic plc 2,770 343,840Microsoft Corp� 1,340 363,006Mondelēz International,
Inc�, Class A 4,951 309,140NXP Semiconductors
NV 831 170,953PepsiCo, Inc� 3,070 454,882Procter & Gamble
Co� (The) 3,060 412,886Texas Instruments, Inc� 980 188,454Verizon
Communications, Inc� 14,338 803,358Visa, Inc�, Class A (a) 1,395 326,179Walt Disney Co� (The) (b) 2,658 467,197Zynga, Inc�, Class A (b) 31,490 334,739
7,952,753
Total Common Stocks(Cost $13,563,533) $ 16,504,622

14 DIAMOND HILL FUNDS | SEMI-ANNUAL REPORT | JUNE 30, 2021 | DIAMOND-HILL.COM
Diamond Hill Global Fund Schedule of Investments (Continued) June 30, 2021 (Unaudited)
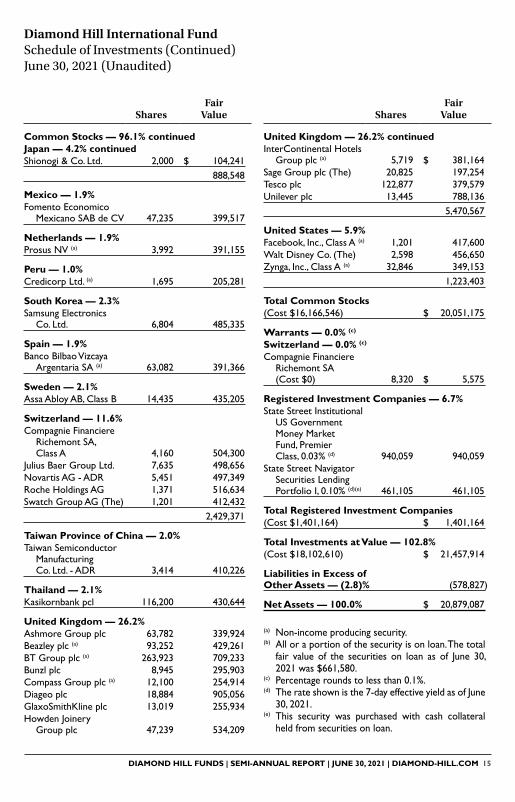
Diamond Hill International Fund Schedule of Investments June 30, 2021 (Unaudited)
Shares
Fair Value
Common Stocks — 96.1%Belgium — 4.4%Anheuser-Busch
InBev SA/NV 9,549 $ 688,497Shurgard Self Storage SA 4,750 229,534
918,031
Canada — 7.4%Aurinia Pharmaceuticals,
Inc� (a)(b) 18,469 239,358BlackBerry Ltd� (a) 15,011 183,434Fairfax Financial
Holdings Ltd� 868 380,597Rogers Communications,
Inc�, Class B (b) 13,950 741,3031,544,692
China — 6.8%Alibaba Group
Holding Ltd� (a) 22,000 623,782Baidu, Inc� - ADR (a) 1,189 242,437Fu Shou Yuan
International Group Ltd� 237,000 231,591
Tencent Holdings Ltd� 4,200 316,2271,414,037
France — 7.4%EssilorLuxottica SA 1,928 356,228LVMH Moet Hennessy
Louis Vuitton SE 354 278,526Safran SA 3,453 479,302Vivendi SE (b) 12,726 427,658
1,541,714
Germany — 0.9%Fuchs Petrolub SE 4,705 182,790
India — 1.3%HDFC Bank Ltd�
- ADR (a) 3,852 281,658
Israel — 3.6%Check Point Software
Technologies Ltd� (a) 6,459 750,084
Italy — 1.2%doValue SpA 23,388 257,551
Japan — 4.2%Astellas Pharma, Inc� 29,500 514,133Nintendo Co� Ltd� - ADR 3,725 270,174
Par Value
Fair Value
Registered Investment Companies — 3.3%State Street Institutional
US Government Money Market Fund, Premier Class, 0�03% (c) 76,265 $ 76,265
State Street Navigator Securities Lending Portfolio I, 0�10% (c)(d) 476,221 476,221
Total Registered Investment Companies(Cost $552,486) $ 552,486
Total Investments at Value — 100.7%(Cost $14,116,019) $ 17,057,108
Liabilities in Excess of Other Assets — (0.7)% (121,311)
Net Assets — 100.0% $ 16,935,797
(a) All or a portion of the security is on loan� The total fair value of the securities on loan as of June 30, 2021 was $758,598�
(b) Non-income producing security�(c) The rate shown is the 7-day effective yield as of June
30, 2021�(d) This security was purchased with cash collateral
held from securities on loan�
ADR — American Depositary ReceiptAG — AktiengesellschaftNV — Naamloze Vennootschapplc — Public Limited CompanySA — Societe AnonymeSAB de CV — Societe Anonima Bursatil de Capital
Variable
See accompanying Notes to Financial Statements�
DIAMOND HILL FUNDS | SEMI-ANNUAL REPORT | JUNE 30, 2021 | DIAMOND-HILL.COM 15
Diamond Hill International Fund Schedule of Investments (Continued) June 30, 2021 (Unaudited)
Shares
Fair Value
Common Stocks — 96.1% continuedJapan — 4.2% continuedShionogi & Co� Ltd� 2,000 $ 104,241
888,548
Mexico — 1.9%Fomento Economico
Mexicano SAB de CV 47,235 399,517
Netherlands — 1.9%Prosus NV (a) 3,992 391,155
Peru — 1.0%Credicorp Ltd� (a) 1,695 205,281
South Korea — 2.3%Samsung Electronics
Co� Ltd� 6,804 485,335
Spain — 1.9%Banco Bilbao Vizcaya
Argentaria SA (a) 63,082 391,366
Sweden — 2.1%Assa Abloy AB, Class B 14,435 435,205
Switzerland — 11.6%Compagnie Financiere
Richemont SA, Class A 4,160 504,300
Julius Baer Group Ltd� 7,635 498,656Novartis AG - ADR 5,451 497,349Roche Holdings AG 1,371 516,634Swatch Group AG (The) 1,201 412,432
2,429,371
Taiwan Province of China — 2.0%Taiwan Semiconductor
Manufacturing Co� Ltd� - ADR 3,414 410,226
Thailand — 2.1%Kasikornbank pcl 116,200 430,644
United Kingdom — 26.2%Ashmore Group plc 63,782 339,924Beazley plc (a) 93,252 429,261BT Group plc (a) 263,923 709,233Bunzl plc 8,945 295,903Compass Group plc (a) 12,100 254,914Diageo plc 18,884 905,056GlaxoSmithKline plc 13,019 255,934Howden Joinery
Group plc 47,239 534,209
Shares
Fair Value
United Kingdom — 26.2% continuedInterContinental Hotels
Group plc (a) 5,719 $ 381,164Sage Group plc (The) 20,825 197,254Tesco plc 122,877 379,579Unilever plc 13,445 788,136
5,470,567
United States — 5.9%Facebook, Inc�, Class A (a) 1,201 417,600Walt Disney Co� (The) 2,598 456,650Zynga, Inc�, Class A (a) 32,846 349,153
1,223,403
Total Common Stocks(Cost $16,166,546) $ 20,051,175
Warrants — 0.0% (c)
Switzerland — 0.0% (c)
Compagnie Financiere Richemont SA (Cost $0) 8,320 $ 5,575
Registered Investment Companies — 6.7%State Street Institutional
US Government Money Market Fund, Premier Class, 0�03% (d) 940,059 940,059
State Street Navigator Securities Lending Portfolio I, 0�10% (d)(e) 461,105 461,105
Total Registered Investment Companies(Cost $1,401,164) $ 1,401,164
Total Investments at Value — 102.8%(Cost $18,102,610) $ 21,457,914
Liabilities in Excess of Other Assets — (2.8)% (578,827)
Net Assets — 100.0% $ 20,879,087
(a) Non-income producing security�(b) All or a portion of the security is on loan� The total
fair value of the securities on loan as of June 30, 2021 was $661,580�
(c) Percentage rounds to less than 0�1%�(d) The rate shown is the 7-day effective yield as of June
30, 2021�(e) This security was purchased with cash collateral
held from securities on loan�

16 DIAMOND HILL FUNDS | SEMI-ANNUAL REPORT | JUNE 30, 2021 | DIAMOND-HILL.COM
Diamond Hill Short Duration Securitized Bond Fund Schedule of Investments June 30, 2021 (Unaudited)
Coupon Maturity
Shares /
Par Value
Fair
Value
Corporate Credit — 1.3%Banking — 0.2%JPMorgan Chase
& Co� (3MO LIBOR + 100) (a) 1�184% 01/15/23 $ 400,000 $ 402,185
JPMorgan Chase & Co� (SOFR + 60) (a) 0�653% 09/16/24 350,000 350,204
Mizuho Financial Group, Inc� 2�273% 09/13/21 500,000 501,909
PNC Bank NA (3MO LIBOR + 32�3) (a)(b) 1�743% 02/24/23 420,000 423,868
Toronto-Dominion Bank (The) (SOFR + 48) (a) 0�530% 01/27/23 375,000 376,940
Truist Financial Corp� (a) 0�410% 06/09/25 800,000 800,928
2,856,034
Capital Goods — 0.0% (c)
Welbilt, Inc� 9�500% 02/15/24 100,000 104,720
Communications — 0.0% (c)
Twenty-First Century Fox, Inc� 4�030% 01/25/24 450,000 487,490
Consumer Cyclical — 0.2%Daimler Finance
LLC (b)(d) 1�750% 03/10/23 1,900,000 1,939,125Ford Motor Credit
Co� LLC 5�584% 03/18/24 250,000 273,800
2,212,925
Electric — 0.0% (c)
DTE Energy Co� 1�050% 06/01/25 500,000 499,861
Energy — 0.2%Devon Energy
Corp� (d) 5�250% 09/15/24 1,000,000 1,113,894Diamondback
Energy, Inc� 5�375% 05/31/25 767,000 788,048Energy Transfer
Operating LP 4�500% 04/15/24 925,000 1,007,075Welltec A/S (d) 9�500% 12/01/22 200,000 204,240
3,113,257
Insurance — 0.3%Athene Global
Funding (d) 2�500% 01/14/25 1,450,000 1,511,196Jackson National
Life Global Funding (d) 2�100% 10/25/21 200,000 201,151
Met Life Global Funding I (d) 1�950% 01/13/23 450,000 460,790
Principal Life Global Funding II (d) 2�375% 11/21/21 400,000 403,332
Diamond Hill International Fund Schedule of Investments (Continued) June 30, 2021 (Unaudited)
AB — AktiebolagADR — American Depositary ReceiptAG — AktiengesellschaftNV — Naamloze Vennootschapplc — Public Limited Companypcl — Public Company LimitedSA — Societe AnonymeSE — Societe EuropaeaSAB de CV — Societe Anonima Bursatil de Capital
VariableSpA — Societa per Azioni
See accompanying Notes to Financial Statements�

DIAMOND HILL FUNDS | SEMI-ANNUAL REPORT | JUNE 30, 2021 | DIAMOND-HILL.COM 17
Diamond Hill Short Duration Securitized Bond Fund Schedule of Investments (Continued) June 30, 2021 (Unaudited)
Coupon Maturity
Shares /
Par Value
Fair
Value
Corporate Credit — 1.3% continuedInsurance — 0.3% continuedProtective Life
Global Funding (d) 0�781% 07/05/24 $ 1,700,000 $ 1,699,528
4,275,997
Technology — 0.1%Dell International
LLC / EMC Corp� 4�000% 07/15/24 500,000 543,690
Transportation — 0.3%Alaska Airlines,
Series 2020-1B, Class A (d) 4�800% 08/15/27 480,403 531,526
American Airlines Pass-Through Trust, Series 2016-2, Class AA 3�200% 12/15/29 1,574,000 1,604,767
United Airlines Pass-Through Trust, Series 2013-1, Class B 5�375% 02/15/23 60,380 60,683
United Airlines Pass-Through Trust, Series 2007-1, Class A 6�636% 01/02/24 88,560 91,438
United Airlines Pass-Through Trust, Series 2020-1, Class A 5�875% 04/15/29 1,141,980 1,267,120
3,555,534
Total Corporate Credit(Cost $16,930,913) $ 17,649,508
Securitized — 83.0%ABS-Other — 6.2%BXG Receivables,
Series 2018-A, Class C (d) 4�440% 02/02/34 1,059,439 1,108,657
Cascade Funding Mortgage Trust, Series 2021-GRN1, Class B (d) 1�830% 03/20/41 3,588,000 3,539,182
Diamond Resorts Owner Trust, Series 2019-1, Class B (d) 3�530% 02/20/32 609,043 629,136
Diamond Resorts Owner Trust, Series 2021-1A, Class B (d) 2�050% 11/21/33 1,868,005 1,885,213
Diamond Resorts Owner Trust, Series 2021-1A, Class C (d) 2�700% 11/21/33 1,401,004 1,418,121
Coupon Maturity
Shares /
Par Value
Fair
Value
ABS-Other — 6.2% continuedFMC GMSR Issuer
Trust, Series 2019-GT2, Class A (d) 4�230% 09/25/24 $ 5,000,000 $ 4,991,946
FMC GMSR Issuer Trust, Series 2020-GT1, Class A (a)(d) 4�450% 01/25/26 3,000,000 3,014,058
Gold Key Resorts LLC, Series 2014-A, Class A (d) 3�220% 03/17/31 54,398 55,057
Helios Issuer LLC, Series 2020-4, Class A (d) 2�980% 06/20/47 1,799,315 1,876,234
Helios Issuer LLC, Series 2021-A, Class A (d) 1�800% 02/20/48 1,245,852 1,237,210
Hero Funding Trust, Series 2016-3B, Class B (d) 5�240% 09/20/42 382,047 382,877
Hero Funding Trust, Series 2016-4B, Class B (d) 4�990% 09/20/47 618,296 630,801
Holiday Inn Timeshare Trust, Series 2020-A, Class C (d) 3�420% 10/09/39 455,559 473,324
Holiday Inn Timeshare Trust, Series 2020-A, Class D (d) 5�500% 10/09/39 792,277 824,820
Holiday Inn Timeshare Trust, Series 2020-A, Class E (d) 6�500% 10/09/39 1,584,554 1,626,865
Loanpal Solar Loan Ltd�, Series 2021-1GS, Class A (d) 2�290% 01/20/48 3,345,936 3,393,773
Loanpal Solar Loan Ltd�, Series 2021-2GS, Class A (d) 2�220% 03/20/48 2,441,286 2,460,578
Mosaic Solar Loans LLC, Series 2017-2A, Class D (d) 0�000% 06/22/43 606,419 601,063
Mosaic Solar Loans LLC, Series 2017-2, Class B (d) 4�770% 06/22/43 602,499 651,348
Mosaic Solar Loans LLC, Series 2020-1, Class A (d) 2�100% 04/20/46 2,206,677 2,247,966
Mosaic Solar Loans LLC, Series 2020-1A, Class B (d) 3�100% 04/20/46 1,765,342 1,848,209
Mosaic Solar Loans LLC, Series 2021-1, Class D (d) 3�710% 12/20/46 895,000 891,179
18 DIAMOND HILL FUNDS | SEMI-ANNUAL REPORT | JUNE 30, 2021 | DIAMOND-HILL.COM
Diamond Hill Short Duration Securitized Bond Fund Schedule of Investments (Continued) June 30, 2021 (Unaudited)
Coupon Maturity
Shares /
Par Value
Fair
Value
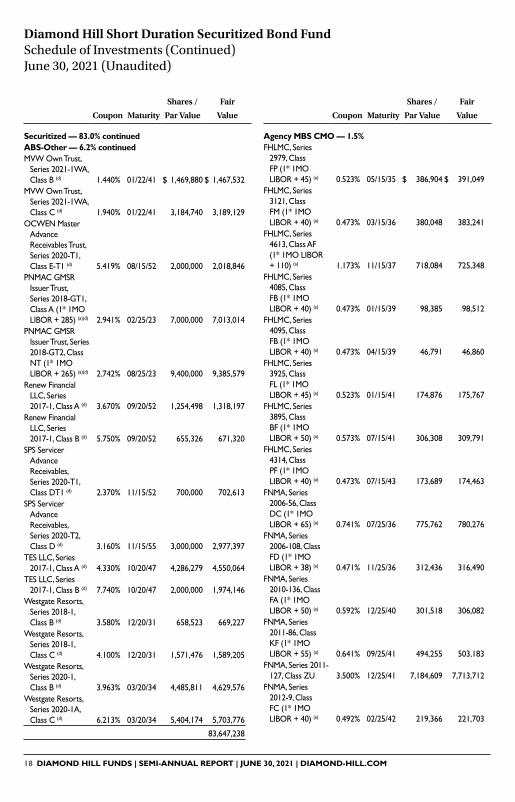
Securitized — 83.0% continuedABS-Other — 6.2% continuedMVW Own Trust,
Series 2021-1WA, Class B (d) 1�440% 01/22/41 $ 1,469,880 $ 1,467,532
MVW Own Trust, Series 2021-1WA, Class C (d) 1�940% 01/22/41 3,184,740 3,189,129
OCWEN Master Advance Receivables Trust, Series 2020-T1, Class E-T1 (d) 5�419% 08/15/52 2,000,000 2,018,846
PNMAC GMSR Issuer Trust, Series 2018-GT1, Class A (1* 1MO LIBOR + 285) (a)(d) 2�941% 02/25/23 7,000,000 7,013,014
PNMAC GMSR Issuer Trust, Series 2018-GT2, Class NT (1* 1MO LIBOR + 265) (a)(d) 2�742% 08/25/23 9,400,000 9,385,579
Renew Financial LLC, Series 2017-1, Class A (d) 3�670% 09/20/52 1,254,498 1,318,197
Renew Financial LLC, Series 2017-1, Class B (d) 5�750% 09/20/52 655,326 671,320
SPS Servicer Advance Receivables, Series 2020-T1, Class DT1 (d) 2�370% 11/15/52 700,000 702,613
SPS Servicer Advance Receivables, Series 2020-T2, Class D (d) 3�160% 11/15/55 3,000,000 2,977,397
TES LLC, Series 2017-1, Class A (d) 4�330% 10/20/47 4,286,279 4,550,064
TES LLC, Series 2017-1, Class B (d) 7�740% 10/20/47 2,000,000 1,974,146
Westgate Resorts, Series 2018-1, Class B (d) 3�580% 12/20/31 658,523 669,227
Westgate Resorts, Series 2018-1, Class C (d) 4�100% 12/20/31 1,571,476 1,589,205
Westgate Resorts, Series 2020-1, Class B (d) 3�963% 03/20/34 4,485,811 4,629,576
Westgate Resorts, Series 2020-1A, Class C (d) 6�213% 03/20/34 5,404,174 5,703,776
83,647,238
Coupon Maturity
Shares /
Par Value
Fair
Value
Agency MBS CMO — 1.5%FHLMC, Series
2979, Class FP (1* 1MO LIBOR + 45) (a) 0�523% 05/15/35 $ 386,904 $ 391,049
FHLMC, Series 3121, Class FM (1* 1MO LIBOR + 40) (a) 0�473% 03/15/36 380,048 383,241
FHLMC, Series 4613, Class AF (1* 1MO LIBOR + 110) (a) 1�173% 11/15/37 718,084 725,348
FHLMC, Series 4085, Class FB (1* 1MO LIBOR + 40) (a) 0�473% 01/15/39 98,385 98,512
FHLMC, Series 4095, Class FB (1* 1MO LIBOR + 40) (a) 0�473% 04/15/39 46,791 46,860
FHLMC, Series 3925, Class FL (1* 1MO LIBOR + 45) (a) 0�523% 01/15/41 174,876 175,767
FHLMC, Series 3895, Class BF (1* 1MO LIBOR + 50) (a) 0�573% 07/15/41 306,308 309,791
FHLMC, Series 4314, Class PF (1* 1MO LIBOR + 40) (a) 0�473% 07/15/43 173,689 174,463
FNMA, Series 2006-56, Class DC (1* 1MO LIBOR + 65) (a) 0�741% 07/25/36 775,762 780,276
FNMA, Series 2006-108, Class FD (1* 1MO LIBOR + 38) (a) 0�471% 11/25/36 312,436 316,490
FNMA, Series 2010-136, Class FA (1* 1MO LIBOR + 50) (a) 0�592% 12/25/40 301,518 306,082
FNMA, Series 2011-86, Class KF (1* 1MO LIBOR + 55) (a) 0�641% 09/25/41 494,255 503,183
FNMA, Series 2011-127, Class ZU 3�500% 12/25/41 7,184,609 7,713,712
FNMA, Series 2012-9, Class FC (1* 1MO LIBOR + 40) (a) 0�492% 02/25/42 219,366 221,703

DIAMOND HILL FUNDS | SEMI-ANNUAL REPORT | JUNE 30, 2021 | DIAMOND-HILL.COM 19
Coupon Maturity
Shares /
Par Value
Fair
Value
Securitized — 83.0% continuedAgency MBS CMO — 1.5% continuedFNMA, Series
2012-33, Class F (1* 1MO LIBOR + 52) (a) 0�611% 04/25/42 $ 182,314 $ 184,439
FNMA, Series 2013-34, Class GP 3�000% 05/25/42 4,567,361 4,677,090
GNMA, Series 2007-18, Class FD (1* 1MO LIBOR + 30) (a) 0�393% 04/20/37 455,507 456,240
GNMA, Series 2008-16, Class FC (1* 1MO LIBOR + 50) (a) 0�593% 02/20/38 372,377 374,708
GNMA, Series 2012-149, Class GF (1* 1MO LIBOR + 30) (a) 0�393% 12/20/42 190,690 191,374
GNMA, Series 2012-H29, Class SA (1* 1MO LIBOR + 51�5) (a) 0�622% 10/20/62 609,439 613,459
GNMA, Series 2012-H23, Class SA (1* 1MO LIBOR + 53) (a) 0�637% 10/20/62 561,262 550,448
GNMA, Series 2016-H11, Class FD (1* 12MO LIBOR + 40) (a) 0�681% 05/20/66 108,588 108,754
GNMA, Series 2017-H11, Class FP (1* 1MO LIBOR + 22) (a) 0�327% 04/20/67 152,845 152,806
19,455,795
Agency MBS CMO Derivatives — 0.3%FHLMC, Series
3946, Class SB (IO) (1* 1MO LIBOR + 675) (a) 6�677% 10/15/26 161,080 17,014
FHLMC, Series 237, Class S14 (IO) (1* 1MO LIBOR + 660) (a) 6�527% 05/15/36 697,655 136,812
FHLMC, Series 4693, Class EI (IO) 3�500% 08/15/42 608,993 3,778
FNMA, Series 2011-75, Class MI (IO) 3�500% 08/25/26 308,951 12,237
FNMA, Series 2012-148, Class IA (IO) 4�000% 01/25/28 2,795,739 225,764
FNMA, Series 301, Class I (PO) 0�000% 04/25/29 274,054 262,623
Diamond Hill Short Duration Securitized Bond Fund Schedule of Investments (Continued) June 30, 2021 (Unaudited)
Coupon Maturity
Shares /
Par Value
Fair
Value
Agency MBS CMO Derivatives — 0.3% continuedFNMA, Series 348,
Class II (IO) 6�000% 01/25/34 $ 669,303 $ 136,250FNMA, Series 2013-
120, Class JI (IO) 4�000% 02/25/40 2,946,073 76,717FNMA, Series
2010-44, Class CS (IO) (1* 1MO LIBOR + 655) (a) 6�459% 05/25/40 543,420 100,368
FNMA, Series 2011-14, Class PI (IO) 5�000% 06/25/40 127,197 4,041
FNMA, Series 3998, Class NS (IO) (1MO LIBOR + 660) (a) 6�527% 09/15/40 3,384,795 196,252
FNMA, Series 2014-45, Class IO (IO) 4�000% 08/25/44 545,817 58,135
GNMA, Series 2011-145, Class QI (IO) 5�000% 11/16/41 1,078,686 167,777
GNMA, Series 2015-16, Class IL (IO) 4�000% 03/20/42 3,685,057 215,138
GNMA, Series 2014-141, Class IE (IO) 4�000% 08/20/43 2,026,693 59,771
GNMA, Series 2010-H01, Class CI (IO) (a) 2�029% 01/20/60 702,479 73,702
GNMA, Series 2012-H02, Class AI (IO) (a) 1�907% 01/20/62 925,773 42,225
GNMA, Series 2013-H13, Class T1 (IO) (a) 0�466% 05/20/63 29,557,348 327,439
GNMA, Series 2016-H20, Class GI (IO) (a) 0�329% 08/20/66 27,794,268 318,586
GNMA, Series 2017-H11, Class PI (IO) (a) 3�948% 04/20/67 826,594 16,842
GNMA, Series 2017-H22, Class ID (IO) (a) 4�004% 11/20/67 219,658 16,263
GNMA, Series 2018-H08, Class NI (IO) (a) 0�817% 05/20/68 16,003,309 394,618
GNMA, Series 2019-H04, Class IO (IO) (a) 1�515% 03/20/69 22,867,773 837,855
3,700,207
Agency MBS Passthrough — 0.1%FHLMC 5�500% 06/01/41 578,350 672,272

20 DIAMOND HILL FUNDS | SEMI-ANNUAL REPORT | JUNE 30, 2021 | DIAMOND-HILL.COM
Coupon Maturity
Shares /
Par Value
Fair
Value
Securitized — 83.0% continuedAuto Loan — 10.8%ACC Trust, Series
2019-2, Class A (d) 2�820% 02/21/23 $ 608,644 $ 611,694ACC Trust, Series
2021-1, Class B (d) 1�430% 07/22/24 4,750,000 4,743,442American Credit
Acceptance Receivables Trust, Series 2020-3, Class F (d) 5�940% 06/14/27 6,750,000 7,140,010
American Credit Acceptance Receivables Trust, Series 2020-4, Class F (d) 5�220% 08/13/27 2,800,000 2,911,796
Arivo Acceptance Auto Loan Receivables Trust, Series 2019-1, Class A (d) 2�990% 07/15/24 414,661 419,195
Arivo Acceptance Auto Loan Receivables Trust, Series 2021-1A, Class A (d) 1�190% 01/15/27 8,081,658 8,096,397
Arivo Acceptance Auto Loan Receivables Trust, Series 2021-1A, Class B (d) 2�020% 02/16/27 2,223,000 2,239,727
Avid Automobile Receivables Trust, Series 2019-1, Class E (d) 6�760% 05/17/27 2,500,000 2,540,343
CarNow Auto Receivables Trust, Series 2021-1A, Class B (d) 1�380% 02/17/26 1,000,000 1,003,104
CarNow Auto Receivables Trust, Series 2021-1A, Class C (d) 2�160% 02/17/26 1,500,000 1,505,581
CarNow Auto Receivables Trust, Series 2021-1A, Class D (d) 3�640% 02/17/26 2,250,000 2,258,399
CarNow Auto Receivables Trust, Series 2021-1A, Class E (d) 5�120% 07/15/27 2,500,000 2,503,866
Carvana Auto Receivable Trust, Series 2020-P1, Class C 1�320% 11/09/26 1,450,000 1,446,517
Diamond Hill Short Duration Securitized Bond Fund Schedule of Investments (Continued) June 30, 2021 (Unaudited)
Coupon Maturity
Shares /
Par Value
Fair
Value
Auto Loan — 10.8% continuedCarvana Auto
Receivable Trust, Series 2020-P1, Class D 1�820% 09/08/27 $ 1,100,000 $ 1,108,645
Chase Credit Linked Notes, Series 2020-1, Class D (d) 1�886% 01/25/28 1,550,156 1,561,116
Chase Credit Linked Notes, Series 2020-2, Class C (d) 1�140% 02/25/28 1,027,442 1,031,489
CIG Auto Receivables Trust, Series 2020-1, Class D (d) 2�350% 01/12/26 2,400,000 2,434,165
CIG Auto Receivables Trust, Series 2019-1, Class D (d) 4�850% 05/15/26 2,120,000 2,178,131
CPS Auto Receivables Trust, Series 2018-C, Class D (d) 4�400% 06/17/24 850,000 869,598
CPS Auto Receivables Trust, Series 2020-B, Class D (d) 4�750% 04/15/26 5,000,000 5,334,179
CPS Auto Receivables Trust, Series 2020-C, Class D (d) 2�410% 11/16/26 2,600,000 2,678,553
Credit Acceptance Auto Loan Trust, Series 2020-2, Class C (d) 2�730% 11/15/29 3,000,000 3,112,019
Credit Acceptance Auto Loan Trust, Series 2020-3A, Class C (d) 2�280% 02/15/30 2,500,000 2,552,448
Credito RL USA, Series 2021-1, Class A (d) 1�350% 02/16/27 5,396,800 5,397,938
DT Auto Owner Trust, Series 2020-2, Class E (d) 4�730% 03/16/26 500,000 542,081
Exeter Automobile Receivables Trust, Series 2020-2, Class D (d) 4�730% 04/15/26 730,000 782,330
FHF Trust, Series 2020-1, Class A (d) 2�590% 12/15/23 1,702,294 1,716,158
FHF Trust, Series 2020-1, Class B (d) 3�100% 09/15/25 4,500,000 4,618,008
DIAMOND HILL FUNDS | SEMI-ANNUAL REPORT | JUNE 30, 2021 | DIAMOND-HILL.COM 21
Coupon Maturity
Shares /
Par Value
Fair
Value
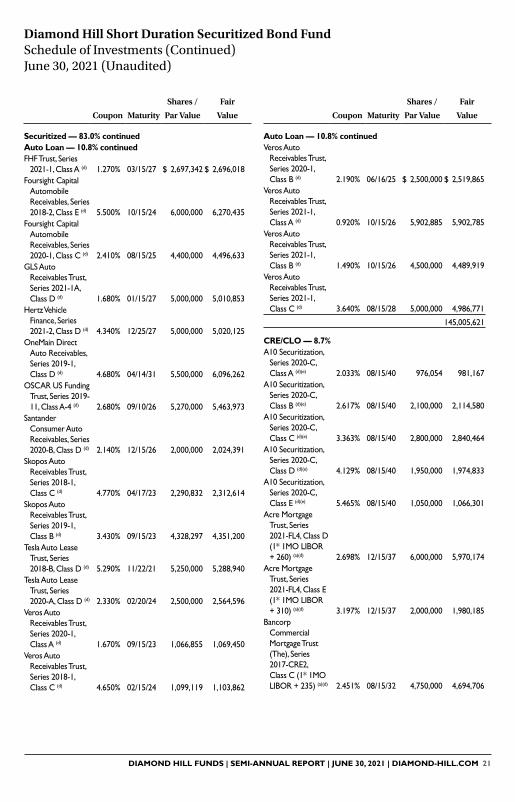
Securitized — 83.0% continuedAuto Loan — 10.8% continuedFHF Trust, Series
2021-1, Class A (d) 1�270% 03/15/27 $ 2,697,342 $ 2,696,018Foursight Capital
Automobile Receivables, Series 2018-2, Class E (d) 5�500% 10/15/24 6,000,000 6,270,435
Foursight Capital Automobile Receivables, Series 2020-1, Class C (d) 2�410% 08/15/25 4,400,000 4,496,633
GLS Auto Receivables Trust, Series 2021-1A, Class D (d) 1�680% 01/15/27 5,000,000 5,010,853
Hertz Vehicle Finance, Series 2021-2, Class D (d) 4�340% 12/25/27 5,000,000 5,020,125
OneMain Direct Auto Receivables, Series 2019-1, Class D (d) 4�680% 04/14/31 5,500,000 6,096,262
OSCAR US Funding Trust, Series 2019-11, Class A-4 (d) 2�680% 09/10/26 5,270,000 5,463,973
Santander Consumer Auto Receivables, Series 2020-B, Class D (d) 2�140% 12/15/26 2,000,000 2,024,391
Skopos Auto Receivables Trust, Series 2018-1, Class C (d) 4�770% 04/17/23 2,290,832 2,312,614
Skopos Auto Receivables Trust, Series 2019-1, Class B (d) 3�430% 09/15/23 4,328,297 4,351,200
Tesla Auto Lease Trust, Series 2018-B, Class D (d) 5�290% 11/22/21 5,250,000 5,288,940
Tesla Auto Lease Trust, Series 2020-A, Class D (d) 2�330% 02/20/24 2,500,000 2,564,596
Veros Auto Receivables Trust, Series 2020-1, Class A (d) 1�670% 09/15/23 1,066,855 1,069,450
Veros Auto Receivables Trust, Series 2018-1, Class C (d) 4�650% 02/15/24 1,099,119 1,103,862
Diamond Hill Short Duration Securitized Bond Fund Schedule of Investments (Continued) June 30, 2021 (Unaudited)
Coupon Maturity
Shares /
Par Value
Fair
Value
Auto Loan — 10.8% continuedVeros Auto
Receivables Trust, Series 2020-1, Class B (d) 2�190% 06/16/25 $ 2,500,000 $ 2,519,865
Veros Auto Receivables Trust, Series 2021-1, Class A (d) 0�920% 10/15/26 5,902,885 5,902,785
Veros Auto Receivables Trust, Series 2021-1, Class B (d) 1�490% 10/15/26 4,500,000 4,489,919
Veros Auto Receivables Trust, Series 2021-1, Class C (d) 3�640% 08/15/28 5,000,000 4,986,771
145,005,621
CRE/CLO — 8.7%A10 Securitization,
Series 2020-C, Class A (d)(e) 2�033% 08/15/40 976,054 981,167
A10 Securitization, Series 2020-C, Class B (d)(e) 2�617% 08/15/40 2,100,000 2,114,580
A10 Securitization, Series 2020-C, Class C (d)(e) 3�363% 08/15/40 2,800,000 2,840,464
A10 Securitization, Series 2020-C, Class D (d)(e) 4�129% 08/15/40 1,950,000 1,974,833
A10 Securitization, Series 2020-C, Class E (d)(e) 5�465% 08/15/40 1,050,000 1,066,301
Acre Mortgage Trust, Series 2021-FL4, Class D (1* 1MO LIBOR + 260) (a)(d) 2�698% 12/15/37 6,000,000 5,970,174
Acre Mortgage Trust, Series 2021-FL4, Class E (1* 1MO LIBOR + 310) (a)(d) 3�197% 12/15/37 2,000,000 1,980,185
Bancorp Commercial Mortgage Trust (The), Series 2017-CRE2, Class C (1* 1MO LIBOR + 235) (a)(d) 2�451% 08/15/32 4,750,000 4,694,706

22 DIAMOND HILL FUNDS | SEMI-ANNUAL REPORT | JUNE 30, 2021 | DIAMOND-HILL.COM
Coupon Maturity
Shares /
Par Value
Fair
Value
Securitized — 83.0% continuedCRE/CLO — 8.7% continuedBancorp
Commercial Mortgage Trust (The), Series 2018-CR3, Class D (1* 1MO LIBOR + 270) (a)(d) 2�801% 03/16/35 $ 4,500,000 $ 4,476,636
Bancorp Commercial Mortgage Trust (The), Series 2017-CRE2, Class D (1* 1MO LIBOR + 375) (a)(d) 3�851% 08/17/32 2,000,000 1,731,867
Bancorp Commercial Mortgage Trust (The), Series 2019-CRE5, Class A (1* 1MO LIBOR + 100) (a)(d) 1�101% 03/17/36 317,054 317,054
BXMT, Series 2021-FL4, Class A (1* 1MO LIBOR + 105) (a)(d) 1�151% 05/17/38 8,250,000 8,250,000
BXMT, Series 2021-FL4, Class D (1* 1MO LIBOR + 225) (a)(d) 2�351% 05/17/38 8,250,000 8,250,000
BXMT Ltd�, Series 2020-FL2, Class D (1* 1MO LIBOR + 195) (a)(d) 2�051% 02/16/37 3,725,000 3,720,348
BXMT Ltd�, Series 2020-FL2, Class E (1* 1MO LIBOR + 205) (a)(d) 2�151% 02/16/37 3,500,000 3,438,796
BXMT Ltd�, Series 2020-FL2, Class B (1* 1MO LIBOR + 140) (a)(d) 1�501% 02/18/38 3,650,000 3,646,580
BXMT Ltd�, Series 2020-FL2, Class C (1* 1MO LIBOR + 165) (a)(d) 1�751% 02/18/38 3,750,000 3,746,486
Exantas Capital Corp�, Series 2020-RS09, Class D (1* 1MO LIBOR + 550) (a)(d)(e) 5�601% 04/17/37 7,151,715 7,262,415
FHLMC, Series 2020-FL3, Class B (1* 1MO LIBOR + 375) (a)(d) 3�874% 07/15/35 5,100,000 5,179,631
Diamond Hill Short Duration Securitized Bond Fund Schedule of Investments (Continued) June 30, 2021 (Unaudited)
Coupon Maturity
Shares /
Par Value
Fair
Value
CRE/CLO — 8.7% continuedFHLMC, Series
2020-FL3, Class C (1* 1MO LIBOR + 450) (a)(d) 4�624% 07/15/35 $ 1,000,000 $ 1,018,112
FHLMC, Series 2020-FL3, Class A-S (1* 1MO LIBOR + 285) (a)(d) 2�974% 07/16/35 1,500,000 1,521,546
KKR Real Estate Finance Trust, Inc�, Series 2018-FL1, Class A (1* 1MO LIBOR + 110) (a)(d) 1�201% 06/15/36 1,772,419 1,772,969
LoanCore Issuer Ltd�, Series 2019-CRE3, Class D (a)(d) 2�573% 05/15/36 2,880,000 2,793,681
MF1 Ltd�, Series 2020-FL3, Class D (1* 1MO LIBOR + 300) (a)(d) 3�124% 07/16/35 5,500,000 5,549,753
Multi Family Housing Mortgage Loan, Series 2019-FL2, Class A (1* 1MO LIBOR + 113) (a)(d) 1�222% 11/27/34 5,956,963 5,956,963
Multi Family Housing Mortgage Loan, Series 2019-FL2, Class C (1* 1MO LIBOR + 200) (a)(d) 2�092% 12/25/34 4,400,000 4,400,000
Multi Family Housing Mortgage Loan, Series 2020-FL4, Class A (1* 1MO LIBOR + 170) (a)(d) 1�824% 11/15/35 4,000,000 4,032,432
PFP III, Series 2021-7, Class D (1* 1MO LIBOR + 240) (a)(d) 2�475% 04/14/38 1,750,000 1,745,644
PFP Ltd�, Series 2019-5, Class B (1* 1MO LIBOR + 165) (a)(d) 1�725% 04/16/36 2,150,000 2,147,334
ReadyCap Commercial Mortgage Trust, Series 2020-FL4, Class A (1* 1MO LIBOR + 215) (a)(d) 2�242% 02/25/35 6,649,712 6,699,325
DIAMOND HILL FUNDS | SEMI-ANNUAL REPORT | JUNE 30, 2021 | DIAMOND-HILL.COM 23
Coupon Maturity
Shares /
Par Value
Fair
Value
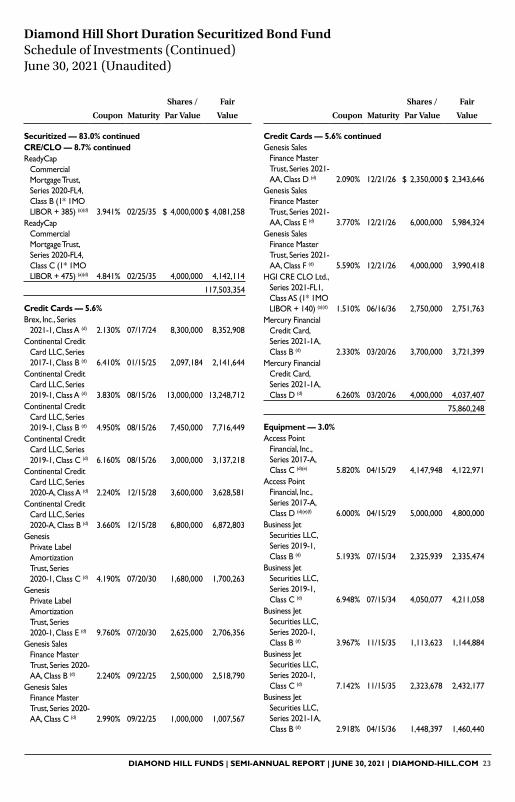
Securitized — 83.0% continuedCRE/CLO — 8.7% continuedReadyCap
Commercial Mortgage Trust, Series 2020-FL4, Class B (1* 1MO LIBOR + 385) (a)(d) 3�941% 02/25/35 $ 4,000,000 $ 4,081,258
ReadyCap Commercial Mortgage Trust, Series 2020-FL4, Class C (1* 1MO LIBOR + 475) (a)(d) 4�841% 02/25/35 4,000,000 4,142,114
117,503,354
Credit Cards — 5.6%Brex, Inc�, Series
2021-1, Class A (d) 2�130% 07/17/24 8,300,000 8,352,908Continental Credit
Card LLC, Series 2017-1, Class B (d) 6�410% 01/15/25 2,097,184 2,141,644
Continental Credit Card LLC, Series 2019-1, Class A (d) 3�830% 08/15/26 13,000,000 13,248,712
Continental Credit Card LLC, Series 2019-1, Class B (d) 4�950% 08/15/26 7,450,000 7,716,449
Continental Credit Card LLC, Series 2019-1, Class C (d) 6�160% 08/15/26 3,000,000 3,137,218
Continental Credit Card LLC, Series 2020-A, Class A (d) 2�240% 12/15/28 3,600,000 3,628,581
Continental Credit Card LLC, Series 2020-A, Class B (d) 3�660% 12/15/28 6,800,000 6,872,803
Genesis Private Label Amortization Trust, Series 2020-1, Class C (d) 4�190% 07/20/30 1,680,000 1,700,263
Genesis Private Label Amortization Trust, Series 2020-1, Class E (d) 9�760% 07/20/30 2,625,000 2,706,356
Genesis Sales Finance Master Trust, Series 2020-AA, Class B (d) 2�240% 09/22/25 2,500,000 2,518,790
Genesis Sales Finance Master Trust, Series 2020-AA, Class C (d) 2�990% 09/22/25 1,000,000 1,007,567
Diamond Hill Short Duration Securitized Bond Fund Schedule of Investments (Continued) June 30, 2021 (Unaudited)
Coupon Maturity
Shares /
Par Value
Fair
Value
Credit Cards — 5.6% continuedGenesis Sales
Finance Master Trust, Series 2021-AA, Class D (d) 2�090% 12/21/26 $ 2,350,000 $ 2,343,646
Genesis Sales Finance Master Trust, Series 2021-AA, Class E (d) 3�770% 12/21/26 6,000,000 5,984,324
Genesis Sales Finance Master Trust, Series 2021-AA, Class F (d) 5�590% 12/21/26 4,000,000 3,990,418
HGI CRE CLO Ltd�, Series 2021-FL1, Class AS (1* 1MO LIBOR + 140) (a)(d) 1�510% 06/16/36 2,750,000 2,751,763
Mercury Financial Credit Card, Series 2021-1A, Class B (d) 2�330% 03/20/26 3,700,000 3,721,399
Mercury Financial Credit Card, Series 2021-1A, Class D (d) 6�260% 03/20/26 4,000,000 4,037,407
75,860,248
Equipment — 3.0%Access Point
Financial, Inc�, Series 2017-A, Class C (d)(e) 5�820% 04/15/29 4,147,948 4,122,971
Access Point Financial, Inc�, Series 2017-A, Class D (d)(e)(f) 6�000% 04/15/29 5,000,000 4,800,000
Business Jet Securities LLC, Series 2019-1, Class B (d) 5�193% 07/15/34 2,325,939 2,335,474
Business Jet Securities LLC, Series 2019-1, Class C (d) 6�948% 07/15/34 4,050,077 4,211,058
Business Jet Securities LLC, Series 2020-1, Class B (d) 3�967% 11/15/35 1,113,623 1,144,884
Business Jet Securities LLC, Series 2020-1, Class C (d) 7�142% 11/15/35 2,323,678 2,432,177
Business Jet Securities LLC, Series 2021-1A, Class B (d) 2�918% 04/15/36 1,448,397 1,460,440
24 DIAMOND HILL FUNDS | SEMI-ANNUAL REPORT | JUNE 30, 2021 | DIAMOND-HILL.COM
Coupon Maturity
Shares /
Par Value
Fair
Value
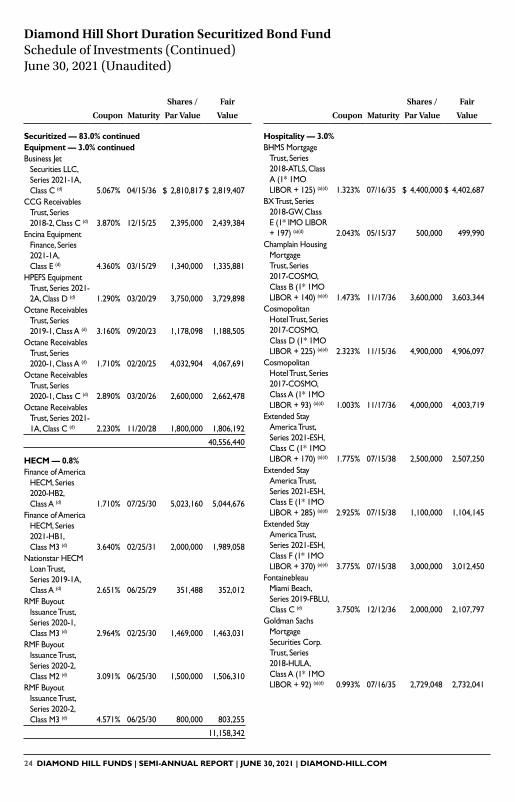
Securitized — 83.0% continuedEquipment — 3.0% continuedBusiness Jet
Securities LLC, Series 2021-1A, Class C (d) 5�067% 04/15/36 $ 2,810,817 $ 2,819,407
CCG Receivables Trust, Series 2018-2, Class C (d) 3�870% 12/15/25 2,395,000 2,439,384
Encina Equipment Finance, Series 2021-1A, Class E (d) 4�360% 03/15/29 1,340,000 1,335,881
HPEFS Equipment Trust, Series 2021-2A, Class D (d) 1�290% 03/20/29 3,750,000 3,729,898
Octane Receivables Trust, Series 2019-1, Class A (d) 3�160% 09/20/23 1,178,098 1,188,505
Octane Receivables Trust, Series 2020-1, Class A (d) 1�710% 02/20/25 4,032,904 4,067,691
Octane Receivables Trust, Series 2020-1, Class C (d) 2�890% 03/20/26 2,600,000 2,662,478
Octane Receivables Trust, Series 2021-1A, Class C (d) 2�230% 11/20/28 1,800,000 1,806,192
40,556,440
HECM — 0.8%Finance of America
HECM, Series 2020-HB2, Class A (d) 1�710% 07/25/30 5,023,160 5,044,676
Finance of America HECM, Series 2021-HB1, Class M3 (d) 3�640% 02/25/31 2,000,000 1,989,058
Nationstar HECM Loan Trust, Series 2019-1A, Class A (d) 2�651% 06/25/29 351,488 352,012
RMF Buyout Issuance Trust, Series 2020-1, Class M3 (d) 2�964% 02/25/30 1,469,000 1,463,031
RMF Buyout Issuance Trust, Series 2020-2, Class M2 (d) 3�091% 06/25/30 1,500,000 1,506,310
RMF Buyout Issuance Trust, Series 2020-2, Class M3 (d) 4�571% 06/25/30 800,000 803,255
11,158,342
Diamond Hill Short Duration Securitized Bond Fund Schedule of Investments (Continued) June 30, 2021 (Unaudited)
Coupon Maturity
Shares /
Par Value
Fair
Value
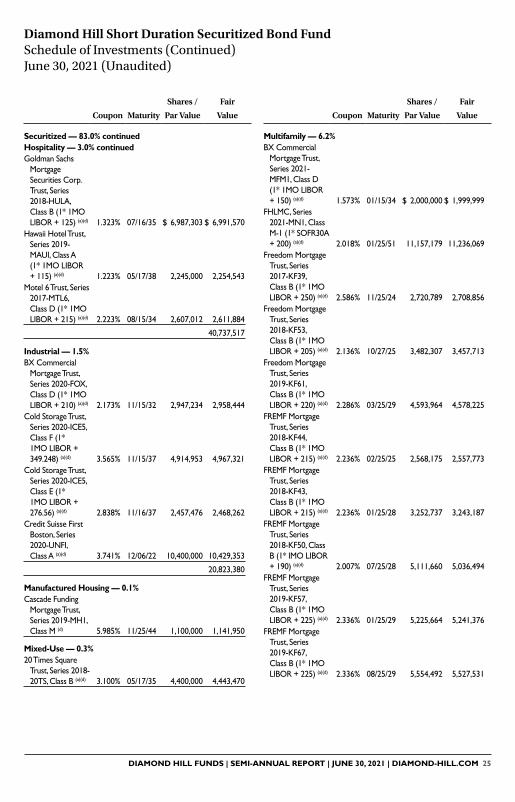
Hospitality — 3.0%BHMS Mortgage
Trust, Series 2018-ATLS, Class A (1* 1MO LIBOR + 125) (a)(d) 1�323% 07/16/35 $ 4,400,000 $ 4,402,687
BX Trust, Series 2018-GW, Class E (1* IMO LIBOR + 197) (a)(d) 2�043% 05/15/37 500,000 499,990
Champlain Housing Mortgage Trust, Series 2017-COSMO, Class B (1* 1MO LIBOR + 140) (a)(d) 1�473% 11/17/36 3,600,000 3,603,344
Cosmopolitan Hotel Trust, Series 2017-COSMO, Class D (1* 1MO LIBOR + 225) (a)(d) 2�323% 11/15/36 4,900,000 4,906,097
Cosmopolitan Hotel Trust, Series 2017-COSMO, Class A (1* 1MO LIBOR + 93) (a)(d) 1�003% 11/17/36 4,000,000 4,003,719
Extended Stay America Trust, Series 2021-ESH, Class C (1* 1MO LIBOR + 170) (a)(d) 1�775% 07/15/38 2,500,000 2,507,250
Extended Stay America Trust, Series 2021-ESH, Class E (1* 1MO LIBOR + 285) (a)(d) 2�925% 07/15/38 1,100,000 1,104,145
Extended Stay America Trust, Series 2021-ESH, Class F (1* 1MO LIBOR + 370) (a)(d) 3�775% 07/15/38 3,000,000 3,012,450
Fontainebleau Miami Beach, Series 2019-FBLU, Class C (d) 3�750% 12/12/36 2,000,000 2,107,797
Goldman Sachs Mortgage Securities Corp� Trust, Series 2018-HULA, Class A (1* 1MO LIBOR + 92) (a)(d) 0�993% 07/16/35 2,729,048 2,732,041
DIAMOND HILL FUNDS | SEMI-ANNUAL REPORT | JUNE 30, 2021 | DIAMOND-HILL.COM 25
Coupon Maturity
Shares /
Par Value
Fair
Value
Securitized — 83.0% continuedHospitality — 3.0% continuedGoldman Sachs
Mortgage Securities Corp� Trust, Series 2018-HULA, Class B (1* 1MO LIBOR + 125) (a)(d) 1�323% 07/16/35 $ 6,987,303 $ 6,991,570
Hawaii Hotel Trust, Series 2019-MAUI, Class A (1* 1MO LIBOR + 115) (a)(d) 1�223% 05/17/38 2,245,000 2,254,543
Motel 6 Trust, Series 2017-MTL6, Class D (1* 1MO LIBOR + 215) (a)(d) 2�223% 08/15/34 2,607,012 2,611,884
40,737,517
Industrial — 1.5%BX Commercial
Mortgage Trust, Series 2020-FOX, Class D (1* 1MO LIBOR + 210) (a)(d) 2�173% 11/15/32 2,947,234 2,958,444
Cold Storage Trust, Series 2020-ICE5, Class F (1* 1MO LIBOR + 349�248) (a)(d) 3�565% 11/15/37 4,914,953 4,967,321
Cold Storage Trust, Series 2020-ICE5, Class E (1* 1MO LIBOR + 276�56) (a)(d) 2�838% 11/16/37 2,457,476 2,468,262
Credit Suisse First Boston, Series 2020-UNFI, Class A (a)(d) 3�741% 12/06/22 10,400,000 10,429,353
20,823,380
Manufactured Housing — 0.1%Cascade Funding
Mortgage Trust, Series 2019-MH1, Class M (d) 5�985% 11/25/44 1,100,000 1,141,950
Mixed-Use — 0.3%20 Times Square
Trust, Series 2018-20TS, Class B (a)(d) 3�100% 05/17/35 4,400,000 4,443,470
Diamond Hill Short Duration Securitized Bond Fund Schedule of Investments (Continued) June 30, 2021 (Unaudited)
Coupon Maturity
Shares /
Par Value
Fair
Value
Multifamily — 6.2%BX Commercial
Mortgage Trust, Series 2021-MFM1, Class D (1* 1MO LIBOR + 150) (a)(d) 1�573% 01/15/34 $ 2,000,000 $ 1,999,999
FHLMC, Series 2021-MN1, Class M-1 (1* SOFR30A + 200) (a)(d) 2�018% 01/25/51 11,157,179 11,236,069
Freedom Mortgage Trust, Series 2017-KF39, Class B (1* 1MO LIBOR + 250) (a)(d) 2�586% 11/25/24 2,720,789 2,708,856
Freedom Mortgage Trust, Series 2018-KF53, Class B (1* 1MO LIBOR + 205) (a)(d) 2�136% 10/27/25 3,482,307 3,457,713
Freedom Mortgage Trust, Series 2019-KF61, Class B (1* 1MO LIBOR + 220) (a)(d) 2�286% 03/25/29 4,593,964 4,578,225
FREMF Mortgage Trust, Series 2018-KF44, Class B (1* 1MO LIBOR + 215) (a)(d) 2�236% 02/25/25 2,568,175 2,557,773
FREMF Mortgage Trust, Series 2018-KF43, Class B (1* 1MO LIBOR + 215) (a)(d) 2�236% 01/25/28 3,252,737 3,243,187
FREMF Mortgage Trust, Series 2018-KF50, Class B (1* IMO LIBOR + 190) (a)(d) 2�007% 07/25/28 5,111,660 5,036,494
FREMF Mortgage Trust, Series 2019-KF57, Class B (1* 1MO LIBOR + 225) (a)(d) 2�336% 01/25/29 5,225,664 5,241,376
FREMF Mortgage Trust, Series 2019-KF67, Class B (1* 1MO LIBOR + 225) (a)(d) 2�336% 08/25/29 5,554,492 5,527,531

26 DIAMOND HILL FUNDS | SEMI-ANNUAL REPORT | JUNE 30, 2021 | DIAMOND-HILL.COM
Coupon Maturity
Shares /
Par Value
Fair
Value
Securitized — 83.0% continuedMultifamily — 6.2% continuedMulti Family
Connecticut Avenue, Series 2019-01, Class M-7 (1* 1MO LIBOR + 170) (a)(d) 1�792% 10/15/49 $ 10,248,914$ 10,240,953
Multi Family Connecticut Avenue, Series 2019-01, Class M10 (1* 1MO LIBOR + 325) (d) 3�341% 10/15/49 3,000,000 3,041,824
Multi Family Connecticut Avenue, Series 2019-01, Class B-10 (1* 1MO LIBOR + 550) (a)(d) 5�591% 10/15/49 1,500,000 1,532,936
Multi Family Connecticut Avenue, Series 2020-01, Class M-7 (1* 1MO LIBOR + 195) (a)(d) 2�041% 03/25/50 5,265,368 5,280,433
Multi Family Connecticut Avenue, Series 2020-01, Class M-10 (1* 1MO LIBOR + 375) (a)(d) 3�841% 03/25/50 15,000,000 15,618,696
Multi Family Connecticut Avenue, Series 2020-01, Class CE (1* 1MO LIBOR + 750) (a)(d) 7�592% 03/25/50 1,500,000 1,649,934
82,951,999
Non-Agency MBS 2.0 — 0.4%J�P� Morgan Wealth
Management, Series 2021-CL1, Class M1 (1* SOFR30A + 130) (a) 1�317% 02/26/71 2,744,776 2,746,505
J�P� Morgan Wealth Management, Series 2021-CL1, Class M3 (1* SOFR30A + 180) (a) 1�817% 02/26/71 2,071,633 2,071,633
4,818,138
Diamond Hill Short Duration Securitized Bond Fund Schedule of Investments (Continued) June 30, 2021 (Unaudited)
Coupon Maturity
Shares /
Par Value
Fair
Value
Non-QM — 0.0% (c)
Citigroup Mortgage Loan Trust, Inc�, Series 2004-UST1, Class A3 (a) 2�226% 08/25/34 $ 6,457 $ 6,614
Office — 1.3%Drop Mortgage
Trust, Series 2021-FILE, Class C (1* 1MO LIBOR + 225) (a)(d) 2�320% 04/15/26 12,000,000 12,037,280
Goldman Sachs Mortgage Securities Corp� Trust, Series 2021-ROSS, Class D (a)(d) 2�573% 05/15/26 5,750,000 5,753,652
17,790,932
Residential Transition Loan — 3.0%AlphaFlow
Transitional Mortgage Co�, Series 2021-WL1, Class A1 (d) 3�280% 03/25/25 6,275,000 6,271,884
AlphaFlow Transitional Mortgage Co�, Series 2021-WL1, Class A2 (d) 5�610% 03/25/25 9,500,000 9,495,203
Antler Mortgage Trust, Series 2021-RTL1, Class M (d) 5�438% 05/25/25 16,188,000 16,118,649
LHFC Depositor LLC, Series 2019-RLT1, Class M (d) 6�899% 10/25/23 4,929,000 4,943,378
LHOME Mortgage Trust, Series 2019-RLT1, Class A2 (d) 4�948% 10/25/23 912,748 913,631
LHOME Mortgage Trust, Series 2021-RTL1, Class M (d) 4�458% 09/25/26 2,750,000 2,749,579
40,492,324
Retail — 3.0%BB-UBS Trust, Series
2012-SHOW, Class A (d) 3�430% 11/05/36 5,000,000 5,296,006
BX Trust, Series 2021-VIEW, Class E (a)(d) 3�750% 06/15/23 2,730,500 2,730,493
BX Trust, Series 2018-EXCL, Class A (1* 1MO LIBOR + 108�763) (a)(d) 1�161% 09/15/37 7,176,642 7,096,192

DIAMOND HILL FUNDS | SEMI-ANNUAL REPORT | JUNE 30, 2021 | DIAMOND-HILL.COM 27
Coupon Maturity
Shares /
Par Value
Fair
Value
Securitized — 83.0% continuedRetail — 3.0% continuedBX Trust, Series
2018-EXCL, Class B (a)(d) 1�417% 09/15/37 $ 621,283 $ 604,185
Citigroup Commercial Mortgage, Series 2017-MDRB, Class D (1* 1MO LIBOR + 325) (a)(d) 3�323% 07/15/30 9,650,000 9,551,059
Citigroup Commercial Mortgage, Series 2017-MDRB, Class A (1* 1MO LIBOR + 110) (a)(d) 1�173% 07/15/30 304,642 303,050
Credit Suisse First Boston, Series 2018-SITE, Class C (a)(d) 4�782% 04/17/36 4,575,000 4,519,279
Wells Fargo Mortgage Trust, Series 2021-SAVE, Class A (1* 1MO LIBOR + 115) (a)(d) 1�223% 02/15/40 2,045,299 2,053,730
Wells Fargo Mortgage Trust, Series 2021-SAVE, Class B (1* 1MO LIBOR + 145) (a)(d) 1�523% 02/15/40 1,818,044 1,824,936
Wells Fargo Mortgage Trust, Series 2021-SAVE, Class C (1* 1MO LIBOR + 180) (a)(d) 1�873% 02/15/40 2,318,006 2,332,360
Wells Fargo Mortgage Trust, Series 2021-SAVE, Class D (1* 1MO LIBOR + 250) (a)(d) 2�573% 02/15/40 1,704,416 1,721,461
Wells Fargo Mortgage Trust, Series 2021-SAVE, Class E (1* 1MO LIBOR + 365) (a)(d) 3�723% 02/15/40 1,681,690 1,698,505
39,731,256
Single Family Rental — 3.6%American Homes 4
Rent, Series 2015-SFR2, Class D (d) 5�036% 10/18/52 1,171,000 1,278,027
AMSR Trust, Series 2020-SFR2, Class G (d) 4�000% 07/17/37 500,000 508,120
Diamond Hill Short Duration Securitized Bond Fund Schedule of Investments (Continued) June 30, 2021 (Unaudited)
Coupon Maturity
Shares /
Par Value
Fair
Value
Single Family Rental — 3.6% continuedColony American
Finance Ltd�, Series 2020-4, Class B (d) 1�707% 12/15/52 $ 4,750,000 $ 4,693,750
Invitation Homes Trust, Series 2017-SFR2, Class A (1* 1MO LIBOR + 85) (a)(d) 0�951% 12/19/36 892,403 893,185
Invitation Homes Trust, Series 2018-SFR1, Class B (1* 1MO LIBOR + 95) (a)(d) 1�051% 03/17/37 6,700,000 6,709,253
Invitation Homes Trust, Series 2018-SFR3, Class A (1* 1MO LIBOR + 100) (a)(d) 1�101% 07/17/37 11,580,485 11,597,528
Progress Residential Trust, Series 2021-SFR1, Class B (d) 1�303% 04/17/38 2,500,000 2,453,114
Progress Residential Trust, Series 2021-SFR1, Class E (d) 2�106% 04/17/38 1,900,000 1,877,631
Star, Series 2021-SFR1, Class E (1* 1MO LIBOR + 170) (a)(d) 1�801% 04/17/38 18,300,000 18,267,289
48,277,897
Small Business — 5.2%Credibility Asset
Securitization, Series 2021-1A, Class A (d) 2�390% 04/15/26 8,000,000 8,058,525
Credibility Asset Securitization, Series 2021-1A, Class C (d) 3�380% 04/15/26 1,375,000 1,383,494
Credibility Asset Securitization, Series 2021-1A, Class B (d) 5�930% 04/15/26 2,676,000 2,691,766
Kabbage Funding LLC, Series 2019-1, Class D (d) 5�688% 03/15/24 249,902 249,889
Newtek Small Business Loan Trust, Series 2018-1, Class A (1* Prime - 55) (a)(d) 2�700% 02/25/44 1,207,725 1,189,041

28 DIAMOND HILL FUNDS | SEMI-ANNUAL REPORT | JUNE 30, 2021 | DIAMOND-HILL.COM
Coupon Maturity
Shares /
Par Value
Fair
Value
Securitized — 83.0% continuedSmall Business — 5.2% continuedNewtek Small
Business Loan Trust, Series 2018-1, Class B (1* Prime + 75) (a)(d) 4�000% 02/25/44 $ 2,656,996 $ 2,568,405
Newtek Small Business Loan Trust, Series 2019-01, Class A (1* Prime - 90) (a)(d) 2�350% 12/25/44 2,853,395 2,811,560
OnDeck Asset Securitization Trust, Series 2021-1A, Class B (d) 2�280% 05/17/27 3,500,000 3,525,215
OnDeck Asset Securitization Trust, Series 2021-1A, Class C (d) 2�970% 05/17/27 3,250,000 3,272,895
OnDeck Asset Securitization Trust, Series 2021-1A, Class D (d) 4�940% 05/17/27 5,000,000 5,051,544
SFS Asset Securitization LLC, Series 2019-1, Class A (d) 4�238% 06/10/25 7,400,000 7,406,079
SFS Asset Securitization LLC, Series 2019-1, Class B (d) 5�023% 06/10/25 2,000,000 2,015,759
SFS Asset Securitization LLC, Series 2019-1, Class C (d) 6�390% 06/10/25 746,000 747,122
Small Business Lending Trust, Series 2019-A, Class A (d) 2�850% 07/15/26 291,624 291,445
Small Business Lending Trust, Series 2019-A, Class B (d) 3�420% 07/15/26 1,902,000 1,894,841
Small Business Lending Trust, Series 2019-A, Class C (d) 4�310% 07/15/26 8,455,000 8,378,648
Small Business Lending Trust, Series 2019-A, Class D (d) 6�300% 07/15/26 5,000,000 4,779,973
Small Business Lending Trust, Series 2020-A, Class A (d) 2�620% 12/15/26 1,541,582 1,546,517
Diamond Hill Short Duration Securitized Bond Fund Schedule of Investments (Continued) June 30, 2021 (Unaudited)
Coupon Maturity
Shares /
Par Value
Fair
Value
Small Business — 5.2% continuedSmall Business
Lending Trust, Series 2020-A, Class B (d) 3�200% 12/15/26 $ 2,000,000 $ 2,009,912
Small Business Lending Trust, Series 2020-A, Class C (d) 5�010% 12/15/26 10,800,000 10,591,504
70,464,134
Specialty — 0.3%BTH Mortgage-
Backed Securities Trust, Series 2018-13, Class A (1* 1MO LIBOR + 250) (a) 2�610% 08/01/21 4,000,000 3,996,508
Student Loan — 1.0%College Ave Student
Loans, Series 2018-A, Class B (d) 4�750% 12/26/47 1,273,546 1,354,739
College Ave Student Loans, Series 2018-A, Class C (d) 5�500% 12/26/47 826,175 865,370
College Ave Student Loans, Series 2019-A, Class C (d) 4�460% 12/28/48 4,000,000 4,122,934
College Ave Student Loans, Series 2021-A, Class B (d) 2�320% 07/25/51 2,500,000 2,516,116
College Ave Student Loans, Series 2021-A, Class D (d) 4�120% 07/25/51 1,250,000 1,265,844
CommonBond Student Loan Trust, Series 2017-BGS, Class C (d) 4�440% 09/25/42 108,526 112,919
Earnest Student Loan Program LLC, Series 2016-C, Class A-2 (d) 2�680% 07/25/35 1,107,815 1,107,815
Earnest Student Loan Program LLC, Series 2016-C, Class A1 (1* 1MO LIBOR + 185) (a)(d) 1�942% 10/27/36 406,962 406,962
Earnest Student Loan Program LLC, Series 2016-D, Class R (d)(e) 0�000% 01/25/41 5,000 65,500

DIAMOND HILL FUNDS | SEMI-ANNUAL REPORT | JUNE 30, 2021 | DIAMOND-HILL.COM 29
Diamond Hill Short Duration Securitized Bond Fund Schedule of Investments (Continued) June 30, 2021 (Unaudited)
Coupon Maturity
Shares /
Par Value
Fair
Value
Securitized — 83.0% continuedStudent Loan — 1.0% continuedLaurel Road Prime
Student Loan, Series 2019-A, Class BFX (d) 3�000% 10/25/48 $ 1,842,378 $ 1,887,123
13,705,322
Unsecured Consumer — 17.1%Avant Loans
Funding Trust, Series 2020-REV1, Class A (d) 2�170% 05/15/29 4,800,000 4,829,653
Avant Loans Funding Trust, Series 2021-REV1, Class C (d) 2�300% 07/15/30 5,000,000 4,984,146
Consumer Loan Underlying Bond Credit Trust, Series 2019-P1, Class C (d) 4�660% 07/15/26 10,000,000 10,230,343
Consumer Loan Underlying Bond Credit Trust, Series 2019-HP1, Class B (d) 3�480% 12/15/26 5,000,000 5,132,627
Freedom Financial, Series 2019-1, Class B (d) 3�870% 06/18/26 1,061,110 1,068,171
Freedom Financial, Series 2019-2, Class C (d) 4�860% 11/18/26 5,500,000 5,668,805
Freedom Financial, Series 2020-FP1, Class B (d) 3�060% 03/18/27 6,750,000 6,843,789
Freedom Financial, Series 2020-FP1, Class C (d) 4�370% 03/18/27 3,250,000 3,327,740
Freedom Financial, Series 2020-2CP, Class A (d) 4�520% 06/18/27 377,605 379,493
Freedom Financial, Series 2020-3FP, Class A (d) 2�400% 09/20/27 1,465,886 1,467,820
Freedom Financial, Series 2020-3FP, Class B (d) 4�180% 09/20/27 4,000,000 4,060,509
Freedom Financial, Series 2020-3FP, Class C (d) 6�960% 09/20/27 2,500,000 2,671,933
Freedom Financial, Series 2021-1CP, Class B (d) 1�410% 03/20/28 4,000,000 4,011,644
Coupon Maturity
Shares /
Par Value
Fair
Value
Unsecured Consumer — 17.1% continuedFreedom Financial,
Series 2021-1CP, Class C (d) 2�830% 03/20/28 $ 3,250,000 $ 3,290,552
Freedom Financial Trust, Series 2020-2CP, Class B (d) 5�500% 06/18/27 2,855,000 2,940,682
Freedom Mortgage Trust, Series 2020-2CP, Class C (d) 6�000% 06/18/27 9,125,000 9,684,817
LendingPoint Asset Securitization Trust, Series 2019-1, Class C (d) 4�504% 08/15/25 1,285,004 1,290,930
LendingPoint Asset Securitization Trust, Series 2019-2, Class B (d) 3�725% 11/10/25 230,641 230,767
LendingPoint Asset Securitization Trust, Series 2020-1, Class B (d) 3�107% 02/10/26 1,558,725 1,561,722
Lendmark Funding Trust, Series 2020-2A, Class C (d) 4�690% 04/21/31 1,000,000 1,049,478
Lendmark Funding Trust, Series 2021-1A, Class D (d) 5�050% 11/20/31 3,000,000 3,056,485
LL ABS Trust, Series 2020-1, Class A (d) 2�330% 07/15/22 3,339,936 3,363,500
LL ABS Trust, Series 2020-1, Class B (d) 3�790% 03/15/23 4,500,000 4,625,465
LL ABS Trust, Series 2020-1, Class C (d) 6�540% 11/15/23 2,200,000 2,310,798
LL ABS Trust, Series 2019-1, Class A (d) 2�870% 03/15/27 185,683 185,821
LL ABS Trust, Series 2019-1, Class B (d) 3�520% 03/15/27 5,550,000 5,602,867
LL ABS Trust, Series 2019-1, Class C (d) 5�070% 03/15/27 4,500,000 4,641,972
Mariner Finance Issuance Trust, Series 2020-A, Class D (d) 5�750% 08/21/34 8,000,000 8,170,422
Mariner Finance Issuance Trust, Series 2019-A, Class C (d) 4�010% 07/20/32 2,120,000 2,154,798
Mariner Finance Issuance Trust, Series 2021-AA, Class D (d) 4�340% 03/20/36 1,390,000 1,431,687
Marlette Funding Trust, Series 2019-4, Class B (d) 2�950% 12/17/29 760,000 772,136
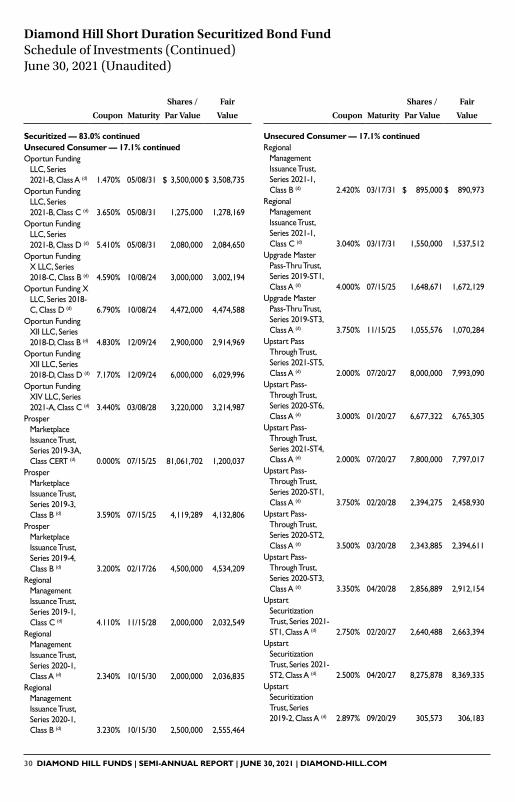
30 DIAMOND HILL FUNDS | SEMI-ANNUAL REPORT | JUNE 30, 2021 | DIAMOND-HILL.COM
Coupon Maturity
Shares /
Par Value
Fair
Value
Securitized — 83.0% continuedUnsecured Consumer — 17.1% continuedOportun Funding
LLC, Series 2021-B, Class A (d) 1�470% 05/08/31 $ 3,500,000 $ 3,508,735
Oportun Funding LLC, Series 2021-B, Class C (d) 3�650% 05/08/31 1,275,000 1,278,169
Oportun Funding LLC, Series 2021-B, Class D (d) 5�410% 05/08/31 2,080,000 2,084,650
Oportun Funding X LLC, Series 2018-C, Class B (d) 4�590% 10/08/24 3,000,000 3,002,194
Oportun Funding X LLC, Series 2018-C, Class D (d) 6�790% 10/08/24 4,472,000 4,474,588
Oportun Funding XII LLC, Series 2018-D, Class B (d) 4�830% 12/09/24 2,900,000 2,914,969
Oportun Funding XII LLC, Series 2018-D, Class D (d) 7�170% 12/09/24 6,000,000 6,029,996
Oportun Funding XIV LLC, Series 2021-A, Class C (d) 3�440% 03/08/28 3,220,000 3,214,987
Prosper Marketplace Issuance Trust, Series 2019-3A, Class CERT (d) 0�000% 07/15/25 81,061,702 1,200,037
Prosper Marketplace Issuance Trust, Series 2019-3, Class B (d) 3�590% 07/15/25 4,119,289 4,132,806
Prosper Marketplace Issuance Trust, Series 2019-4, Class B (d) 3�200% 02/17/26 4,500,000 4,534,209
Regional Management Issuance Trust, Series 2019-1, Class C (d) 4�110% 11/15/28 2,000,000 2,032,549
Regional Management Issuance Trust, Series 2020-1, Class A (d) 2�340% 10/15/30 2,000,000 2,036,835
Regional Management Issuance Trust, Series 2020-1, Class B (d) 3�230% 10/15/30 2,500,000 2,555,464
Coupon Maturity
Shares /
Par Value
Fair
Value
Unsecured Consumer — 17.1% continuedRegional
Management Issuance Trust, Series 2021-1, Class B (d) 2�420% 03/17/31 $ 895,000 $ 890,973
Regional Management Issuance Trust, Series 2021-1, Class C (d) 3�040% 03/17/31 1,550,000 1,537,512
Upgrade Master Pass-Thru Trust, Series 2019-ST1, Class A (d) 4�000% 07/15/25 1,648,671 1,672,129
Upgrade Master Pass-Thru Trust, Series 2019-ST3, Class A (d) 3�750% 11/15/25 1,055,576 1,070,284
Upstart Pass Through Trust, Series 2021-ST5, Class A (d) 2�000% 07/20/27 8,000,000 7,993,090
Upstart Pass-Through Trust, Series 2020-ST6, Class A (d) 3�000% 01/20/27 6,677,322 6,765,305
Upstart Pass-Through Trust, Series 2021-ST4, Class A (d) 2�000% 07/20/27 7,800,000 7,797,017
Upstart Pass-Through Trust, Series 2020-ST1, Class A (d) 3�750% 02/20/28 2,394,275 2,458,930
Upstart Pass-Through Trust, Series 2020-ST2, Class A (d) 3�500% 03/20/28 2,343,885 2,394,611
Upstart Pass-Through Trust, Series 2020-ST3, Class A (d) 3�350% 04/20/28 2,856,889 2,912,154
Upstart Securitization Trust, Series 2021-ST1, Class A (d) 2�750% 02/20/27 2,640,488 2,663,394
Upstart Securitization Trust, Series 2021-ST2, Class A (d) 2�500% 04/20/27 8,275,878 8,369,335
Upstart Securitization Trust, Series 2019-2, Class A (d) 2�897% 09/20/29 305,573 306,183
Diamond Hill Short Duration Securitized Bond Fund Schedule of Investments (Continued) June 30, 2021 (Unaudited)
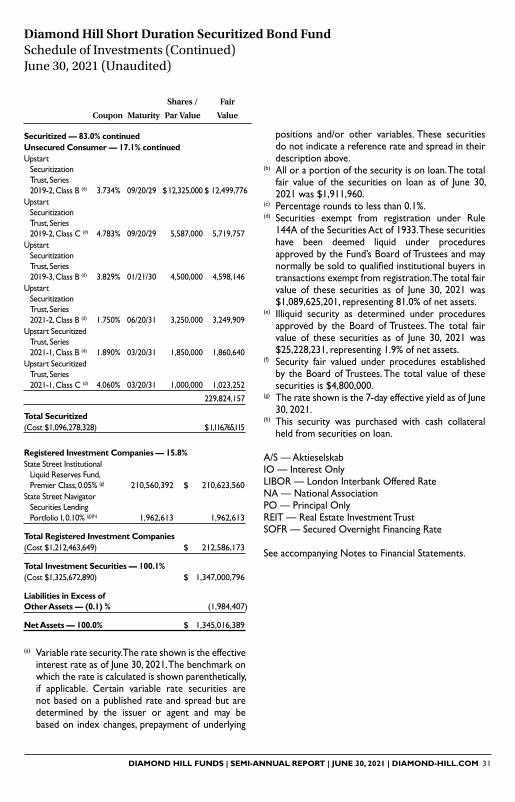
DIAMOND HILL FUNDS | SEMI-ANNUAL REPORT | JUNE 30, 2021 | DIAMOND-HILL.COM 31
Coupon Maturity
Shares /
Par Value
Fair
Value
Securitized — 83.0% continuedUnsecured Consumer — 17.1% continuedUpstart
Securitization Trust, Series 2019-2, Class B (d) 3�734% 09/20/29 $ 12,325,000 $ 12,499,776
Upstart Securitization Trust, Series 2019-2, Class C (d) 4�783% 09/20/29 5,587,000 5,719,757
Upstart Securitization Trust, Series 2019-3, Class B (d) 3�829% 01/21/30 4,500,000 4,598,146
Upstart Securitization Trust, Series 2021-2, Class B (d) 1�750% 06/20/31 3,250,000 3,249,909
Upstart Securitized Trust, Series 2021-1, Class B (d) 1�890% 03/20/31 1,850,000 1,860,640
Upstart Securitized Trust, Series 2021-1, Class C (d) 4�060% 03/20/31 1,000,000 1,023,252
229,824,157
Total Securitized(Cost $1,096,278,328) $ 1,116,765,115
Registered Investment Companies — 15.8% State Street Institutional
Liquid Reserves Fund, Premier Class, 0�05% (g) 210,560,392 $ 210,623,560
State Street Navigator Securities Lending Portfolio I, 0�10% (g)(h) 1,962,613 1,962,613
Total Registered Investment Companies (Cost $1,212,463,649) $ 212,586,173
Total Investment Securities — 100.1% (Cost $1,325,672,890) $ 1,347,000,796
Liabilities in Excess of Other Assets — (0.1) % (1,984,407)
Net Assets — 100.0% $ 1,345,016,389
(a) Variable rate security� The rate shown is the effective interest rate as of June 30, 2021� The benchmark on which the rate is calculated is shown parenthetically, if applicable� Certain variable rate securities are not based on a published rate and spread but are determined by the issuer or agent and may be based on index changes, prepayment of underlying
positions and/or other variables� These securities do not indicate a reference rate and spread in their description above�
(b) All or a portion of the security is on loan� The total fair value of the securities on loan as of June 30, 2021 was $1,911,960�
(c) Percentage rounds to less than 0�1%�(d) Securities exempt from registration under Rule
144A of the Securities Act of 1933� These securities have been deemed liquid under procedures approved by the Fund’s Board of Trustees and may normallybesoldtoqualifiedinstitutionalbuyersintransactions exempt from registration� The total fair value of these securities as of June 30, 2021 was $1,089,625,201, representing 81�0% of net assets�
(e) Illiquid security as determined under procedures approved by the Board of Trustees� The total fair value of these securities as of June 30, 2021 was $25,228,231, representing 1�9% of net assets�
(f) Security fair valued under procedures established by the Board of Trustees� The total value of these securities is $4,800,000�
(g) The rate shown is the 7-day effective yield as of June 30, 2021�
(h) This security was purchased with cash collateral held from securities on loan�
A/S — AktieselskabIO — Interest OnlyLIBOR — London Interbank Offered RateNA — National AssociationPO — Principal OnlyREIT — Real Estate Investment TrustSOFR — Secured Overnight Financing Rate
See accompanying Notes to Financial Statements�
Diamond Hill Short Duration Securitized Bond Fund Schedule of Investments (Continued) June 30, 2021 (Unaudited)

32 DIAMOND HILL FUNDS | SEMI-ANNUAL REPORT | JUNE 30, 2021 | DIAMOND-HILL.COM
Diamond Hill Core Bond Fund Schedule of Investments June 30, 2021 (Unaudited)
Coupon Maturity
Shares /
Par Value
Fair
Value
Corporate Credit — 17.1%Banking — 5.7%Bank of America
Corp� (3MO LIBOR + 102�1) (a) 2�881% 04/24/23 $ 100,000 $ 102,049
Bank of America Corp� (3MO LIBOR + 97) (a) 3�458% 03/15/25 425,000 454,233
Bank of America Corp� 3�875% 08/01/25 300,000 333,317
Bank of America Corp� (3MO LIBOR + 64) (a) 2�015% 02/13/26 400,000 412,419
Bank of America Corp� (SOFR + 115) (a) 1�319% 06/19/26 150,000 150,328
Bank of America Corp� (SOFR + 91) (a) 1�658% 03/11/27 250,000 251,986
Bank of America Corp� (3MO LIBOR + 157�5) (a) 3�824% 01/20/28 100,000 110,963
Bank of America Corp� (SOFR + 215) (a) 2�592% 04/29/31 250,000 257,734
Bank of Montreal France (b) 0�949% 01/22/27 630,000 619,608
Bank of New York Mellon Corp� (The), Series MTN 1�850% 01/27/23 200,000 204,664
Bank of New York Mellon Corp� (The) 3�000% 10/30/28 100,000 109,378
Bank of Nova Scotia 1�950% 02/01/23 130,000 133,281Canadian Imperial
Bank of Commerce (3MO LIBOR + 78�5) (a) 2�606% 07/22/23 100,000 102,298
Capital One Financial Corp� 2�600% 05/15/23 200,000 207,660
Capital One Financial Corp� 3�750% 07/28/26 100,000 110,313
Citigroup, Inc (SOFR + 166�7) (a) 1�678% 05/15/24 500,000 510,566
Citigroup, Inc� (3MO LIBOR + 89�66) (a) 3�352% 04/24/25 200,000 213,111
Citigroup, Inc� 3�300% 04/27/25 100,000 108,728Citigroup, Inc� (3MO
LIBOR + 125) (a) 1�452% 07/01/26 100,000 102,867Citigroup, Inc� (3MO
LIBOR + 156�3) (a) 3�887% 01/10/28 500,000 556,473Citigroup, Inc� 4�125% 07/25/28 150,000 168,981Citigroup, Inc�
(SOFR + 142�2) (a) 2�976% 11/05/30 180,000 190,653Citigroup, Inc�
(SOFR + 454�8) (a) 5�316% 03/26/41 100,000 133,725
Coupon Maturity
Shares /
Par Value
Fair
Value
Banking — 5.7% continuedCitizens Financial
Group 2�850% 07/27/26 $ 225,000 $ 239,797Comerica Bank,
Series BKNT 2�500% 07/23/24 250,000 263,007Cooperatieve
Rabobank UA (c) 2�625% 07/22/24 250,000 263,227Discover Bank 2�700% 02/06/30 250,000 261,399Discover Financial
Services 4�100% 02/09/27 100,000 111,896Fifth Third Bancorp 2�375% 01/28/25 275,000 288,312First Tennessee
Bank 5�750% 05/01/30 250,000 308,241Goldman Sachs
Group, Inc� 0�657% 09/10/24 375,000 374,381Goldman Sachs
Group, Inc� 3�500% 01/23/25 405,000 437,884Goldman Sachs
Group, Inc� 3�500% 04/01/25 250,000 271,224Goldman Sachs
Group, Inc� 3�500% 11/16/26 350,000 380,591Goldman Sachs
Group, Inc� (SOFR + 78�9) (a) 1�093% 12/09/26 250,000 246,118
Goldman Sachs Group, Inc� 2�600% 02/07/30 500,000 518,840
Goldman Sachs Group, Inc� (SOFR + 128�1) (a) 2�615% 04/22/32 800,000 817,254
Huntington Bancshares, Inc� 2�625% 08/06/24 125,000 131,916
JPMorgan Chase & Co� (3MO LIBOR + 100) (a) 1�184% 01/15/23 100,000 100,546
JPMorgan Chase & Co� (SOFR + 60) (a) 0�653% 09/16/24 150,000 150,087
JPMorgan Chase & Co� (3MO LIBOR + 100) (a) 4�023% 12/05/24 550,000 593,630
JPMorgan Chase & Co� (SOFR + 80) (a) 1�045% 11/19/26 500,000 493,671
JPMorgan Chase & Co� (SOFR + 88�5) (a) 1�578% 04/22/27 400,000 402,072
JPMorgan Chase & Co� (3MO LIBOR + 133�7) (a) 3�782% 02/01/28 100,000 111,045
JPMorgan Chase & Co� (3MO LIBOR + 94�5) (a) 3�509% 01/23/29 100,000 110,217
JPMorgan Chase & Co� (SOFR + 151) (a) 2�739% 10/15/30 100,000 104,661

DIAMOND HILL FUNDS | SEMI-ANNUAL REPORT | JUNE 30, 2021 | DIAMOND-HILL.COM 33
Coupon Maturity
Shares /
Par Value
Fair
Value
Banking — 5.7% continuedWells Fargo & Co�
(SOFR + 210) (a) 2�393% 06/02/28 $ 250,000 $ 259,274
22,498,114
Basic Industry — 0.4%Air Products and
Chemicals, Inc� 1�850% 05/15/27 475,000 487,920FMC Corp� 3�450% 10/01/29 300,000 326,145Nucor Corp� 2�000% 06/01/25 250,000 258,693PPG Industries, Inc� 2�400% 08/15/24 110,000 115,209PPG Industries, Inc� 2�550% 06/15/30 300,000 310,741Sherwin-
Williams Co� 2�300% 05/15/30 250,000 252,898
1,751,606
Brokerage Asset Managers Exchanges — 0.3%Ameriprise
Financial, Inc� 3�000% 04/02/25 250,000 267,870CBOE Holdings, Inc� 3�650% 01/12/27 100,000 111,331Charles Schwab
Corp� (The) 0�900% 03/11/26 500,000 496,130International
Exchange, Inc� 0�700% 06/15/23 275,000 276,008
1,151,339
Capital Goods — 0.3%Carrier Global
Corp� 2�700% 02/15/31 250,000 257,404General Electric
Capital Corp� 6�750% 03/15/32 300,000 415,841L3 Harris
Technologies, Inc� 3�850% 12/15/26 50,000 56,078Lennox
International, Inc� 3�000% 11/15/23 100,000 104,805Republic
Services, Inc� 2�500% 08/15/24 200,000 209,894Waste Management,
Inc� 1�150% 03/15/28 300,000 290,667
1,334,689
Communications — 1.3%American Tower
Corp� 2�250% 01/15/22 50,000 50,517American Tower
Corp� 3�800% 08/15/29 100,000 111,422American Tower
Corp� 2�100% 06/15/30 100,000 98,339AT&T, Inc� 2�300% 06/01/27 650,000 672,297AT&T, Inc� (c) 2�550% 12/01/33 114,000 112,933AT&T, Inc� 4�500% 05/15/35 100,000 117,382British
Telecommunications plc (c) 3�250% 11/08/29 275,000 291,972
Comcast Corp� 3�950% 10/15/25 750,000 840,360
Diamond Hill Core Bond Fund Schedule of Investments (Continued) June 30, 2021 (Unaudited)
Coupon Maturity
Shares /
Par Value
Fair
Value
Corporate Credit — 17.1% continuedBanking — 5.7% continuedJPMorgan Chase
& Co� (SOFR + 204) (a) 2�522% 04/22/31 $ 750,000 $ 771,745
KeyBank NA (SOFR + 34) (a)(b) 0�423% 01/03/24 500,000 500,074
KeyCorp (b) 2�550% 10/01/29 385,000 402,868Morgan Stanley
(SOFR + 45�5) (a) 0�529% 01/25/24 500,000 499,747Morgan Stanley
(3MO LIBOR + 84�7) (a) 3�737% 04/24/24 100,000 105,761
Morgan Stanley 3�700% 10/23/24 100,000 109,100Morgan Stanley 3�875% 01/27/26 500,000 558,998Morgan Stanley 3�125% 07/27/26 100,000 108,348Morgan Stanley 3�625% 01/20/27 100,000 110,882Morgan Stanley,
Series GMTN (SOFR + 114�3) (a) 2�699% 01/22/31 175,000 183,190
Morgan Stanley (SOFR + 103�4) (a) 1�794% 02/13/32 500,000 480,406
PNC Bank NA (3MO LIBOR + 32�3) (a) 1�743% 02/24/23 250,000 252,303
PNC Bank NA 2�700% 10/22/29 250,000 264,717PNC Financial
Services 2�600% 07/23/26 250,000 266,448Regions Financial
Corp� 2�250% 05/18/25 275,000 286,358Royal Bank of
Canada, Series GMTN 1�950% 01/17/23 250,000 256,203
Royal Bank of Canada 1�150% 06/10/25 365,000 366,949
State Street Corp� (SOFR + 94) (a) 2�354% 11/01/25 175,000 183,934
Toronto-Dominion Bank (The) (SOFR + 48) (a) 0�530% 01/27/23 425,000 427,199
Toronto-Dominion Bank (The) 0�750% 01/06/26 350,000 345,252
Toronto-Dominion Bank (The) 1�200% 06/03/26 200,000 200,252
Truist Financial Corp� 2�150% 12/06/24 250,000 261,562
Truist Financial Corp� (SOFR + 60�9) (a) 1�267% 03/02/27 600,000 599,326
Truist Financial Corp� 1�887% 06/07/29 500,000 501,515
US Bancorp 2�400% 07/30/24 350,000 368,179Wells Fargo & Co� 3�550% 09/29/25 925,000 1,016,670Wells Fargo & Co�
(SOFR + 200) (a) 2�188% 04/30/26 275,000 285,503

34 DIAMOND HILL FUNDS | SEMI-ANNUAL REPORT | JUNE 30, 2021 | DIAMOND-HILL.COM
Diamond Hill Core Bond Fund Schedule of Investments (Continued) June 30, 2021 (Unaudited)
Coupon Maturity
Shares /
Par Value
Fair
Value
Corporate Credit — 17.1% continuedCommunications — 1.3% continuedComcast Corp� 2�650% 02/01/30 $ 100,000 $ 105,267Comcast Corp� 1�950% 01/15/31 250,000 246,456Comcast Corp� 3�969% 11/01/47 144,000 167,650Deutsche Telekom
International Finance (c) 4�750% 06/21/38 100,000 121,594
Twenty-First Century Fox, Inc� 4�030% 01/25/24 50,000 54,166
Verizon Communications, Inc� 0�750% 03/22/24 750,000 753,508
Verizon Communications, Inc� (3MO LIBOR + 110) (a) 1�256% 05/15/25 100,000 103,133
Verizon Communications, Inc� 4�125% 03/16/27 100,000 113,884
Verizon Communications, Inc� 3�000% 03/22/27 120,000 129,136
Verizon Communications, Inc� 1�750% 01/20/31 500,000 479,169
Verizon Communications, Inc� 2�987% 10/30/56 143,000 134,425
Walt Disney Co� (The) 1�750% 08/30/24 175,000 180,946
Walt Disney Co� (The) (b) 3�800% 03/22/30 100,000 114,196
4,998,752
Consumer Cyclical — 0.9%BMW US Capital,
LLC (c) 3�900% 04/09/25 300,000 330,801CVS Health Corp� 3�750% 04/01/30 500,000 559,535CVS Health Corp� 5�050% 03/25/48 250,000 324,719Daimler Finance
LLC (c) 1�750% 03/10/23 275,000 280,663Ford Motor Co� 4�346% 12/08/26 100,000 107,125Ford Motor Co� 7�450% 07/16/31 75,000 98,625General Motors
Financial Co�, Inc� 4�000% 10/06/26 100,000 110,402Home Depot,
Inc� (The) 3�500% 09/15/56 100,000 111,961Toyota Motor
Credit Corp� 0�500% 06/18/24 500,000 497,799Toyota Motor
Credit Corp� 0�800% 01/09/26 300,000 296,356Volkswagen Group
America (c) 2�500% 09/24/21 200,000 200,993
Coupon Maturity
Shares /
Par Value
Fair
Value
Consumer Cyclical — 0.9% continuedVolkswagen Group
America (c) 0�750% 11/23/22 $ 500,000 $ 501,766Walgreens Boots
Alliance, Inc� (b) 3�200% 04/15/30 250,000 267,401
3,688,146
Consumer Non-Cyclical — 1.0%Abbott
Laboratories 4�750% 11/30/36 100,000 128,767AbbVie, Inc� 2�950% 11/21/26 335,000 360,107AbbVie, Inc� 4�550% 03/15/35 100,000 121,371Amgen, Inc� 2�650% 05/11/22 140,000 142,391Amgen, Inc� 1�900% 02/21/25 310,000 320,944Anheuser-Busch
Cos�, LLC 4�700% 02/01/36 100,000 122,734Anheuser-Busch
InBev SA/NV 4�750% 01/23/29 100,000 119,126Anheuser-Busch
InBev SA/NV 3�500% 06/01/30 600,000 667,431Kimberly-Clark
Corp� 3�950% 11/01/28 100,000 115,650Kroger Co� (The) 2�650% 10/15/26 100,000 106,139Kroger Co� (The) 2�200% 05/01/30 125,000 125,715Kroger Co� (The) (b) 1�700% 01/15/31 550,000 526,074Laboratory Corp�
of American Holdings 1�550% 06/01/26 375,000 376,550
Zoetics, Inc�, Series 4006 2�000% 05/15/30 525,000 522,575
3,755,574
Electric — 1.5%Ameren Corp� (b) 2�500% 09/15/24 130,000 136,703American Electric
Power, Inc� (b) 1�000% 11/01/25 500,000 494,919Berkshire Hathaway
Energy Corp� 1�650% 05/15/31 500,000 479,891CMS Energy Corp� 2�950% 02/15/27 100,000 105,497Dominion
Energy, Inc� 1�450% 04/15/26 750,000 755,293DTE Energy Co�,
Series C 2�529% 10/01/24 150,000 157,900DTE Energy
Co�, Series E 2�850% 10/01/26 100,000 106,845DTE Energy Co�,
Series H 2�950% 03/01/30 125,000 131,807Duke Energy
Indiana LLC 2�750% 04/01/50 370,000 358,084Georgia Power Co�,
Series 2020-A 2�100% 07/30/23 230,000 237,514MidAmerican
Energy Co� 3�650% 04/15/29 350,000 395,760

DIAMOND HILL FUNDS | SEMI-ANNUAL REPORT | JUNE 30, 2021 | DIAMOND-HILL.COM 35
Coupon Maturity
Shares /
Par Value
Fair
Value
Insurance — 2.2% continuedJackson National
Life Global Funding (c) 2�100% 10/25/21 $ 50,000 $ 50,288
Lincoln National Corp� 3�625% 12/12/26 100,000 110,696
MassMutual Global Funding (c) 2�150% 03/09/31 500,000 505,374
Met Life Global Funding I (c) 1�950% 01/13/23 200,000 204,795
Met Life Global Funding I (c) 0�900% 06/08/23 250,000 252,461
Met Life Global Funding I (c) 1�550% 01/07/31 500,000 475,639
New York Life Global Funding (c) 2�900% 01/17/24 100,000 105,927
New York Life Global Funding (c) 2�350% 07/14/26 50,000 52,341
New York Life Global Funding (c) 1�200% 08/07/30 1,250,000 1,171,522
Pacific Life Global Fund II (c) 1�450% 01/20/28 500,000 491,099
Pricoa Global Funding (c) 3�450% 09/01/23 160,000 170,791
Principal Life Global Funding II (c) 2�375% 11/21/21 100,000 100,833
Principal Life Global Funding II (c) 1�250% 06/23/25 525,000 528,170
Principal Life Global Funding II (c) 0�875% 01/12/26 500,000 491,143
Progressive Corp� 3�200% 03/26/30 240,000 263,514Protective Life
Global Funding (c) 1�900% 07/05/28 650,000 650,398Protective Life
Global Funding (c) 1�737% 09/21/30 1,100,000 1,060,862
8,515,724
Natural Gas — 0.1%Atmos Energy
Corp� 2�625% 09/15/29 310,000 323,568
Other Utility — 0.3%American Water
Capital Corp� 2�800% 05/01/30 300,000 317,526American Water
Capital Corp� 2�300% 06/01/31 825,000 838,493
1,156,019
REITS — 1.0%Alexandria
Real Estate Equities, Inc� 3�950% 01/15/28 100,000 112,930
American Campus Communities, Inc� 3�625% 11/15/27 100,000 108,807
American Homes 4 Rent 4�250% 02/15/28 100,000 112,249
Diamond Hill Core Bond Fund Schedule of Investments (Continued) June 30, 2021 (Unaudited)
Coupon Maturity
Shares /
Par Value
Fair
Value
Corporate Credit — 17.1% continuedElectric — 1.5% continuedNorthern States
Power Co� of Wisconsin 2�250% 04/01/31 $ 500,000 $ 514,539
Northern States Power Co� of Wisconsin 2�900% 03/01/50 125,000 127,510
Oncor Electric Delivery Co� LLC 3�750% 04/01/45 490,000 565,985
PECO Energy Co� 3�000% 09/15/49 200,000 209,166PPL Electric Utilities 3�000% 10/01/49 160,000 165,098Public Service
Electric & Gas Co� (b) 2�250% 09/15/26 100,000 105,028
Southwestern Electric Power 2�750% 10/01/26 100,000 105,998
WEC Energy Group Inc� 0�800% 03/15/24 700,000 701,614
5,855,151
Energy — 0.8%BP Capital
Markets plc 3�194% 04/06/25 175,000 188,563Chevron Corp� 1�995% 05/11/27 500,000 515,832Cimarex Energy Co� 3�900% 05/15/27 100,000 110,224Diamondback
Energy, Inc� 3�250% 12/01/26 200,000 214,380Energy Transfer
Operating LP 4�500% 04/15/24 75,000 81,655Exxon Mobil Corp� 2�992% 03/19/25 240,000 257,421Phillips 66
Partners LP 3�700% 04/06/23 250,000 263,943Phillips 66
Partners LP 2�450% 12/15/24 100,000 104,291Phillips 66
Partners LP 3�550% 10/01/26 100,000 108,654Royal Dutch
Shell plc 2�375% 11/07/29 320,000 332,135Shell International
Finance BV 6�375% 12/15/38 73,000 108,244Suncor Energy, Inc� 2�800% 05/15/23 300,000 312,006Total Capital
International SA (b) 2�829% 01/10/30 120,000 128,883Valero Energy Corp� 2�700% 04/15/23 250,000 259,184Valero Energy Corp� 3�400% 09/15/26 100,000 108,291
3,093,706
Insurance — 2.2%Allstate Corp� (The) 0�750% 12/15/25 1,000,000 989,539Athene Global
Funding (c) 2�500% 01/14/25 225,000 234,496Equitable Financial
Life (c) 1�800% 03/08/28 609,000 605,836

36 DIAMOND HILL FUNDS | SEMI-ANNUAL REPORT | JUNE 30, 2021 | DIAMOND-HILL.COM
Diamond Hill Core Bond Fund Schedule of Investments (Continued) June 30, 2021 (Unaudited)
Coupon Maturity
Shares /
Par Value
Fair
Value
Corporate Credit — 17.1% continuedREITS — 1.0% continuedBoston Properties
LP 2�750% 10/01/26 $ 50,000 $ 53,396CubeSmart LP 3�125% 09/01/26 50,000 53,435CubeSmart LP 3�000% 02/15/30 280,000 293,328CubeSmart LP (b) 2�000% 02/15/31 200,000 194,332ERP Operating LP 2�850% 11/01/26 100,000 106,808ERP Operating LP 2�500% 02/15/30 150,000 155,178Life Storage LP 3�875% 12/15/27 100,000 111,528Public Storage (b) 1�850% 05/01/28 800,000 806,166Realty Income
Corp� 3�875% 04/15/25 100,000 110,328Realty Income
Corp� (b) 0�750% 03/15/26 625,000 612,186Realty Income
Corp� 3�000% 01/15/27 100,000 108,032Simon Property
Group LP 2�000% 09/13/24 320,000 331,445Spirit Realty LP 4�450% 09/15/26 100,000 111,521Spirit Realty LP 2�100% 03/15/28 250,000 248,965Spirit Realty LP 4�000% 07/15/29 60,000 66,598Spirit Realty LP 3�200% 02/15/31 250,000 260,548
3,957,780
Technology — 0.6%Amazon�com, Inc� 0�450% 05/12/24 600,000 598,671Apple, Inc� 0�700% 02/08/26 500,000 494,164Apple, Inc� (b) 3�000% 06/20/27 100,000 109,947Apple, Inc� 2�200% 09/11/29 250,000 259,909Apple, Inc� 1�650% 05/11/30 300,000 297,459Dell International
LLC / EMC Corp� (b) 5�300% 10/01/29 100,000 120,663
Fidelity National Information Services 1�650% 03/01/28 300,000 298,300
Oracle Corp� 2�800% 04/01/27 300,000 318,130
2,497,243
Transportation — 0.7%Alaska Airlines,
Series 2020-1B, Class A (c) 4�800% 08/15/27 144,121 159,458
American Airlines Pass-Through Trust, Series 2016-2, Class AA 3�200% 12/15/29 354,150 361,073
CSX Corp� 4�250% 11/01/66 100,000 123,319FedEx Corp� 2�400% 05/15/31 500,000 508,861FedEx Corp� 1�875% 02/20/34 510,963 507,001Kirby Corp� 4�200% 03/01/28 100,000 111,456Southwest
Airlines Co� 3�000% 11/15/26 100,000 106,528
Coupon Maturity
Shares /
Par Value
Fair
Value
Transportation — 0.7% continuedU�S� Airways
Pass-Through Trust, Series 2011-1, Class A 7�125% 04/22/25 $ 30,201 $ 31,875
United Airlines Pass-Through Trust, Series 2013-1, Class B 5�375% 02/15/23 161,013 161,821
United Airlines Pass-Through Trust, Series 2007-1, Class A 6�636% 01/02/24 24,153 24,938
United Airlines Pass-Through Trust, Series 2020-1, Class B 4�875% 07/15/27 485,250 514,549
United Airlines Pass-Through Trust, Series 2020-1, Class A 5�875% 04/15/29 285,495 316,780
2,927,659
Total Corporate Credit(Cost $65,781,055) $ 67,505,070
Government Related — 0.3%Government Guaranteed — 0.1%Tunisian Republic 1�416% 08/05/21 500,000 497,495
Government Owned, No Guarantee — 0.2%Tennessee Valley
Authority 4�625% 09/15/60 525,000 771,705
Total Government Related(Cost $1,272,053) $ 1,269,200
Securitized — 64.2%ABS-Other — 4.8%BXG Receivables,
Series 2018-A, Class C (c) 4�440% 02/02/34 344,662 360,674
Cascade Funding Mortgage Trust, Series 2021-GRN1, Class B (c) 1�830% 03/20/41 1,000,000 986,394
Diamond Resorts Owner Trust, Series 2019-1, Class B (c) 3�530% 02/20/32 146,170 150,993
Diamond Resorts Owner Trust, Series 2021-1A, Class B (c) 2�050% 11/21/33 700,502 706,955
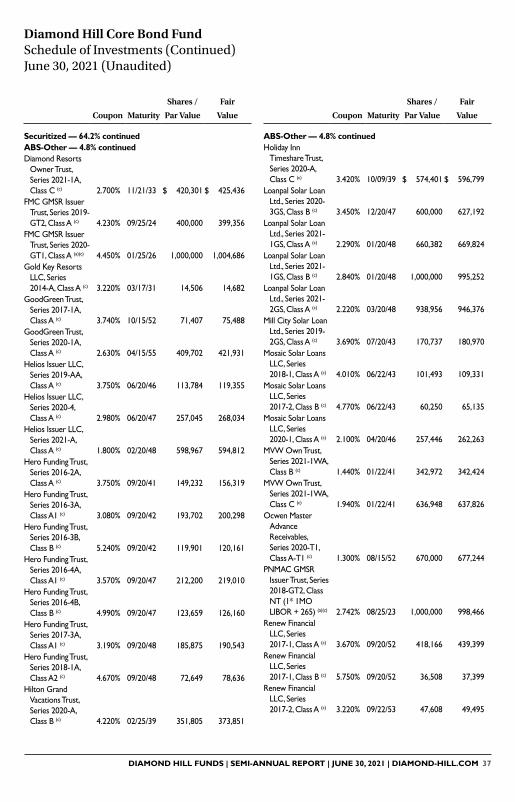
DIAMOND HILL FUNDS | SEMI-ANNUAL REPORT | JUNE 30, 2021 | DIAMOND-HILL.COM 37
Coupon Maturity
Shares /
Par Value
Fair
Value
ABS-Other — 4.8% continuedHoliday Inn
Timeshare Trust, Series 2020-A, Class C (c) 3�420% 10/09/39 $ 574,401 $ 596,799
Loanpal Solar Loan Ltd�, Series 2020-3GS, Class B (c) 3�450% 12/20/47 600,000 627,192
Loanpal Solar Loan Ltd�, Series 2021-1GS, Class A (c) 2�290% 01/20/48 660,382 669,824
Loanpal Solar Loan Ltd�, Series 2021-1GS, Class B (c) 2�840% 01/20/48 1,000,000 995,252
Loanpal Solar Loan Ltd�, Series 2021-2GS, Class A (c) 2�220% 03/20/48 938,956 946,376
Mill City Solar Loan Ltd�, Series 2019-2GS, Class A (c) 3�690% 07/20/43 170,737 180,970
Mosaic Solar Loans LLC, Series 2018-1, Class A (c) 4�010% 06/22/43 101,493 109,331
Mosaic Solar Loans LLC, Series 2017-2, Class B (c) 4�770% 06/22/43 60,250 65,135
Mosaic Solar Loans LLC, Series 2020-1, Class A (c) 2�100% 04/20/46 257,446 262,263
MVW Own Trust, Series 2021-1WA, Class B (c) 1�440% 01/22/41 342,972 342,424
MVW Own Trust, Series 2021-1WA, Class C (c) 1�940% 01/22/41 636,948 637,826
Ocwen Master Advance Receivables, Series 2020-T1, Class A-T1 (c) 1�300% 08/15/52 670,000 677,244
PNMAC GMSR Issuer Trust, Series 2018-GT2, Class NT (1* 1MO LIBOR + 265) (a)(c) 2�742% 08/25/23 1,000,000 998,466
Renew Financial LLC, Series 2017-1, Class A (c) 3�670% 09/20/52 418,166 439,399
Renew Financial LLC, Series 2017-1, Class B (c) 5�750% 09/20/52 36,508 37,399
Renew Financial LLC, Series 2017-2, Class A (c) 3�220% 09/22/53 47,608 49,495
Diamond Hill Core Bond Fund Schedule of Investments (Continued) June 30, 2021 (Unaudited)
Coupon Maturity
Shares /
Par Value
Fair
Value
Securitized — 64.2% continuedABS-Other — 4.8% continuedDiamond Resorts
Owner Trust, Series 2021-1A, Class C (c) 2�700% 11/21/33 $ 420,301 $ 425,436
FMC GMSR Issuer Trust, Series 2019-GT2, Class A (c) 4�230% 09/25/24 400,000 399,356
FMC GMSR Issuer Trust, Series 2020-GT1, Class A (a)(c) 4�450% 01/25/26 1,000,000 1,004,686
Gold Key Resorts LLC, Series 2014-A, Class A (c) 3�220% 03/17/31 14,506 14,682
GoodGreen Trust, Series 2017-1A, Class A (c) 3�740% 10/15/52 71,407 75,488
GoodGreen Trust, Series 2020-1A, Class A (c) 2�630% 04/15/55 409,702 421,931
Helios Issuer LLC, Series 2019-AA, Class A (c) 3�750% 06/20/46 113,784 119,355
Helios Issuer LLC, Series 2020-4, Class A (c) 2�980% 06/20/47 257,045 268,034
Helios Issuer LLC, Series 2021-A, Class A (c) 1�800% 02/20/48 598,967 594,812
Hero Funding Trust, Series 2016-2A, Class A (c) 3�750% 09/20/41 149,232 156,319
Hero Funding Trust, Series 2016-3A, Class A1 (c) 3�080% 09/20/42 193,702 200,298
Hero Funding Trust, Series 2016-3B, Class B (c) 5�240% 09/20/42 119,901 120,161
Hero Funding Trust, Series 2016-4A, Class A1 (c) 3�570% 09/20/47 212,200 219,010
Hero Funding Trust, Series 2016-4B, Class B (c) 4�990% 09/20/47 123,659 126,160
Hero Funding Trust, Series 2017-3A, Class A1 (c) 3�190% 09/20/48 185,875 190,543
Hero Funding Trust, Series 2018-1A, Class A2 (c) 4�670% 09/20/48 72,649 78,636
Hilton Grand Vacations Trust, Series 2020-A, Class B (c) 4�220% 02/25/39 351,805 373,851

38 DIAMOND HILL FUNDS | SEMI-ANNUAL REPORT | JUNE 30, 2021 | DIAMOND-HILL.COM
Diamond Hill Core Bond Fund Schedule of Investments (Continued) June 30, 2021 (Unaudited)
Coupon Maturity
Shares /
Par Value
Fair
Value
Securitized — 64.2% continuedABS-Other — 4.8% continuedSPS Servicer
Advance Receivables, Series 2020-T1, Class DT1 (c) 2�370% 11/15/52 $ 199,000 $ 199,743
SPS Servicer Advance Receivables, Series 2020-T2, Class D (c) 3�160% 11/15/55 494,000 490,278
Sunnova Solar Issuer LLC, Series 2020-2A, Class A (c) 2�730% 11/01/55 1,090,417 1,114,304
TES LLC, Series 2017-1, Class A (c) 4�330% 10/20/47 285,752 303,338
Westgate Resorts, Series 2018-1, Class B (c) 3�580% 12/20/31 74,832 76,049
Westgate Resorts, Series 2018-1, Class C (c) 4�100% 12/20/31 74,832 75,676
Westgate Resorts, Series 2020-1, Class B (c) 3�963% 03/20/34 868,130 895,952
Westgate Resorts, Series 2020-1A, Class C (c) 6�213% 03/20/34 1,229,915 1,298,101
19,082,610
Agency CMBS — 1.3%FNMA 2�370% 10/01/26 127,587 134,906FNMA 3�353% 11/01/26 1,413,867 1,553,516FNMA, Series 2019-
M21, Class 1A1 1�950% 04/25/28 532,527 548,951FNMA 2�550% 12/01/28 274,344 294,683FNMA 2�430% 10/01/29 193,465 206,656FNMA 4�820% 12/01/29 124,050 140,348FNMA 3�550% 08/01/30 172,433 195,353FNMA 3�140% 07/01/32 750,000 844,810FNMA 3�280% 12/01/32 250,000 283,655FNMA 4�870% 10/01/41 128,194 147,289FNMA 4�940% 12/01/43 760,102 902,441
5,252,608
Agency MBS CMO — 20.3%FHLMA, Series
4847, Class CV 3�500% 02/15/30 442,058 477,621FHLMA, Series
4673, Class PH 3�500% 01/15/45 470,375 491,737FHLMA, Series
4531, Class PZ 3�500% 11/15/45 1,329,726 1,465,652
Coupon Maturity
Shares /
Par Value
Fair
Value
Agency MBS CMO — 20.3% continuedFHLMC, Series 306,
Class F3 (1* 1MO LIBOR + 30) (a) 0�373% 05/15/28 $ 75,367 $ 74,378
FHLMC, Series 2646, Class ZH 5�000% 07/15/33 122,241 151,614
FHLMC, Series 4265, Class FD (1* 1MO LIBOR + 40) (a) 0�473% 01/15/35 311,899 314,425
FHLMC, Series 2006-71, Class ZH 6�000% 07/25/36 365,838 431,165
FHLMC, Series 4613, Class AF (1* 1MO LIBOR + 110) (a) 1�173% 11/15/37 102,583 103,621
FHLMC, Series 3605, Class PB 4�500% 11/15/39 90,996 101,563
FHLMC, Series 3617, Class PC 4�500% 12/15/39 97,482 108,833
FHLMC, Series 3740, Class FC (1* 1MO LIBOR + 50) (a) 0�573% 10/15/40 119,014 120,499
FHLMC, Series 3759, Class ME 4�000% 11/15/40 555,000 590,835
FHLMC, Series 3811, Class TA 5�000% 02/15/41 262,142 305,053
FHLMC, Series 3895, Class BF (1* 1MO LIBOR + 50) (a) 0�573% 07/15/41 107,598 108,821
FHLMC, Series 4116, Class UB 2�500% 05/15/42 1,000,000 1,046,157
FHLMC, Series 4074, Class JY 2�500% 07/15/42 475,000 494,618
FHLMC, Series 4165, Class ZT 3�000% 02/15/43 241,841 248,775
FHLMC, Series 4180, Class ZB 3�000% 03/15/43 478,999 485,521
FHLMC, Series 4210, Class Z 3�000% 05/15/43 204,226 212,637
FHLMC, Series 4447, Class YZ 4�000% 08/15/43 1,540,190 1,710,293
FHLMC, Series 4333, Class GL 3�500% 04/15/44 250,000 279,833
FHLMC, Series 4408, Class BC 3�000% 11/15/44 1,020,410 1,072,491
FHLMC, Series 4731, Class EA 3�000% 10/15/45 251,460 262,702
FHLMC, Series 4738, Class TW 3�000% 11/15/46 1,385,000 1,477,485
FHLMC, Series 4857, Class H 4�000% 11/15/46 471,592 494,440
FHLMC, Series 4736, Class CL 3�000% 12/15/47 441,240 473,709

DIAMOND HILL FUNDS | SEMI-ANNUAL REPORT | JUNE 30, 2021 | DIAMOND-HILL.COM 39
Coupon Maturity
Shares /
Par Value
Fair
Value
Agency MBS CMO — 20.3% continuedFNMA, Series
2011-57, Class PD 4�000% 07/25/41 $ 321,407 $ 366,857FNMA, Series
2011-62, Class UA 4�500% 07/25/41 907,683 974,561FNMA, Series
2012-9, Class FC (1* 1MO LIBOR + 40) (a) 0�492% 02/25/42 143,798 145,330
FNMA, Series 2013-34, Class GP 3�000% 05/25/42 622,822 637,785
FNMA, Series 2012-52, Class PQ 3�500% 05/25/42 1,723,989 1,882,812
FNMA, Series 2012-79, Class QB 2�000% 07/25/42 289,118 294,045
FNMA, Series 2003-W2, Class 1-1A 6�500% 07/25/42 787,138 918,199
FNMA, Series 2012-84, Class JL 2�000% 08/25/42 95,482 90,922
FNMA, Series 411, Class A3 3�000% 08/25/42 139,525 148,613
FNMA, Series 2012-99, Class UY 2�500% 09/25/42 329,000 339,037
FNMA, Series 2016-32, Class GO (PO) 0�000% 01/25/43 74,101 56,235
FNMA, Series 2013-35, Class LP 3�000% 01/25/43 352,000 364,138
FNMA, Series 2013-6, Class QA 2�500% 02/25/43 163,649 165,017
FNMA, Series 2013-35, Class CV 3�000% 02/25/43 350,000 374,805
FNMA, Series 2013-13, Class WH 3�500% 03/25/43 1,000,000 1,012,614
FNMA, Series 2013-31, Class NT 3�000% 04/25/43 89,901 90,585
FNMA, Series 2003-W10, Class 3A-5 4�299% 06/25/43 648,395 702,771
FNMA, Series 2013-104, Class CY 5�000% 10/25/43 250,000 305,656
FNMA, Series 2013-115, Class PB 4�500% 11/25/43 300,000 364,628
FNMA, Series 2015-11, Class MZ 4�000% 12/25/43 4,686,195 5,174,128
FNMA, Series 2014-2, Class PB 4�000% 02/25/44 782,705 818,536
FNMA, Series 4473, Class Z 3�000% 05/15/45 383,981 404,625
FNMA, Series 2017-16, Class UW 3�000% 07/25/45 2,044,494 2,219,293
FNMA, Series 2016-68, Class AL 3�000% 10/25/46 850,000 918,490
FNMA, Series 2017-04, Class ZC 3�500% 02/25/47 2,917,272 3,094,160
Diamond Hill Core Bond Fund Schedule of Investments (Continued) June 30, 2021 (Unaudited)
Coupon Maturity
Shares /
Par Value
Fair
Value
Securitized — 64.2% continuedAgency MBS CMO — 20.3% continuedFHLMC, Series
4753, Class EZ 3�500% 12/15/47 $ 1,982,048 $ 2,133,037FHLMC, Series
4745, Class CZ 3�500% 01/15/48 2,599,270 2,844,815FHLMC, Series
4801, Class ZN 4�000% 05/15/48 1,131,029 1,233,085FHLMC, Series
4941, Class NW 2�500% 05/25/49 758,520 762,238FHLMC, Series
4911, Class JM 3�500% 09/25/49 1,000,000 1,112,959FHLMC, Series
5011, Class DB 2�000% 09/25/50 262,000 230,954FHLMC, Series
4377, Class KZ (a) 3�500% 02/15/52 791,637 890,850FNMA, Series 2010-
155, Class JH 4�000% 12/25/28 120,000 131,745FNMA, Series
2013-35, Class YT 6�500% 09/25/32 232,975 272,892FNMA, Series 2012-
129, Class HT 2�000% 12/25/32 104,453 104,965FNMA, Series
2002-86, Class PG 6�000% 12/25/32 76,032 89,755FNMA, Series
2004-56, Class Z 7�500% 03/25/34 137,314 167,418FNMA, Series
2004-17, Class BA 6�000% 04/25/34 224,529 280,274FNMA, Series
2005-3, Class CG 5�500% 02/25/35 167,159 187,396FNMA, Series
2005-62, Class ZL 5�500% 07/25/35 304,572 342,858FNMA, Series
2006-56, Class DC (1* 1MO LIBOR + 65) (a) 0�741% 07/25/36 119,348 120,042
FNMA, Series 2009-19, Class TD 5�000% 08/25/36 99,379 113,139
FNMA, Series 2007-95, Class A3 (a) 0�342% 08/27/36 1,600,000 1,489,991
FNMA, Series 2006-108, Class FD (1* 1MO LIBOR + 38) (a) 0�471% 11/25/36 143,059 144,916
FNMA, Series 2007-39, Class NB 4�250% 05/25/37 139,581 150,149
FNMA, Series 2008-60, Class JC 5�000% 07/25/38 216,237 245,781
FNMA, Series 2009-103, Class MB (a) 2�222% 12/25/39 48,384 50,660
FNMA, Series 2010-2, Class LC 5�000% 02/25/40 200,000 233,705
FNMA, Series 2011-14, Class PB 5�000% 03/25/41 570,000 661,579

40 DIAMOND HILL FUNDS | SEMI-ANNUAL REPORT | JUNE 30, 2021 | DIAMOND-HILL.COM
Diamond Hill Core Bond Fund Schedule of Investments (Continued) June 30, 2021 (Unaudited)
Coupon Maturity
Shares /
Par Value
Fair
Value
Securitized — 64.2% continuedAgency MBS CMO — 20.3% continuedFNMA, Series 2017-
77, Class HZ 3�500% 10/25/47 $ 1,907,734 $ 2,003,524FNMA, Series 2017-
90, Class ZD 3�500% 11/25/47 2,273,439 2,391,411FNMA, Series 2018-
08, Class DZ 3�500% 02/25/48 1,126,831 1,181,502FNMA, Series 2018-
31, Class KQ 3�500% 05/25/48 847,826 905,295FNMA, Series
2018-66, Class PZ 4�000% 09/25/48 536,781 614,460FNMA, Series 2019-
01, Class MH 3�000% 02/25/49 392,231 410,872FNMA, Series
2019-8, Class ZD 3�500% 03/25/49 542,483 612,513FNMA, Series
2019-40, Class PL 4�000% 07/25/49 318,000 358,316FNMA, Series 2019-
60, Class WZ 2�750% 10/25/49 549,525 570,810FNMA, Series
2019-83, Class EB 2�000% 01/25/50 171,000 157,673FNMA, Series
2020-15, Class KY 3�000% 03/25/50 2,077,414 2,269,719GNMA, Series
2015-161, Class AV 3�000% 01/20/29 392,378 414,213
GNMA, Series 2018-139, Class DV 3�500% 01/20/30 478,057 500,839
GNMA, Series 2004-49, Class MZ 6�000% 06/20/34 395,560 463,482
GNMA, Series 2005-13, Class BG 5�000% 02/20/35 258,970 290,904
GNMA, Series 2015-123, Class VB 3�500% 09/20/35 436,000 463,860
GNMA, Series 2006-17, Class JN 6�000% 04/20/36 216,949 247,057
GNMA, Series 2008-51, Class PH 5�250% 06/20/38 133,231 147,777
GNMA, Series 2009-2, Class PA 5�000% 12/20/38 97,725 106,328
GNMA, Series 2010-9, Class FA (1* 1MO LIBOR + 52) (a) 0�595% 01/16/40 133,750 135,080
GNMA, Series 2014-79, Class HU 3�000% 02/16/40 799,105 838,184
GNMA, Series 2010-105, Class ZC 4�500% 08/16/40 488,027 582,231
Coupon Maturity
Shares /
Par Value
Fair
Value
Agency MBS CMO — 20.3% continuedGNMA, Series
2013-22, Class GA 2�500% 10/20/41 $ 26,458 $ 27,308
GNMA, Series 2012-74, Class LY 2�500% 06/20/42 318,000 320,292
GNMA, Series 2012-134, Class KM 2�000% 09/20/42 342,000 334,590
GNMA, Series 2012-113, Class NZ 4�500% 09/20/42 269,622 282,057
GNMA, Series 2013-6, Class PE 2�000% 01/20/43 100,000 96,739
GNMA, Series 2013-5, Class GY 3�000% 01/20/43 532,000 579,924
GNMA, Series 2015-179, Class ZB 2�500% 02/20/45 56,553 56,602
GNMA, Series 2016-37, Class YA 3�000% 12/20/45 1,052,881 1,147,538
GNMA, Series 2016-38, Class ZP 3�500% 03/20/46 72,084 78,421
GNMA, Series 2016-74, Class PL 3�000% 05/20/46 1,511,000 1,584,678
GNMA, Series 2016-111, Class HA 2�500% 08/20/46 47,605 47,469
GNMA, Series 2016-120, Class YZ 3�000% 09/20/46 1,000,000 1,072,807
GNMA, Series 2017-080, Class BZ 3�500% 05/20/47 403,688 447,275
GNMA, Series 2018-006, Class JY 2�750% 01/20/48 284,000 264,762
GNMA, Series 2018-14, Class MZ 3�000% 01/20/48 382,189 389,091
GNMA, Series 2018-097, Class GY 4�000% 07/20/48 1,162,000 1,310,861
GNMA, Series 2018-120, Class PY 3�500% 09/20/48 689,379 730,783
GNMA, Series 2019-20, Class JK 3�500% 02/20/49 250,604 267,406
GNMA, Series 2019-031, Class AZ 5�000% 03/20/49 322,598 365,283
GNMA, Series 2019-052, Class HL 4�000% 04/20/49 490,565 535,452
GNMA, Series 2019-99, Class EW 3�000% 08/20/49 540,446 592,605

DIAMOND HILL FUNDS | SEMI-ANNUAL REPORT | JUNE 30, 2021 | DIAMOND-HILL.COM 41
Coupon Maturity
Shares /
Par Value
Fair
Value
Agency MBS CMO Derivatives — 3.4% continuedFHLMC, Series
3102, Class TA (IO) (1* 1MO LIBOR + 5250) (a) 7�500% 01/15/36 $ 242,985 $ 274,549
FHLMC, Series 3607, Class AO (PO) 0�000% 04/15/36 104,959 95,447
FHLMC, Series 237, Class S14 (IO) (1* 1MO LIBOR + 660) (a) 6�527% 05/15/36 432,546 84,823
FHLMC, Series 3199, Class OC (PO) 0�000% 08/15/36 159,880 147,602
FHLMC, Series 379, Class I (PO) 0�000% 05/25/37 57,821 53,819
FHLMC, Series 3607, Class OP (PO) 0�000% 07/15/37 360,578 324,059
FHLMC, Series 4006, Class IA (IO) 4�500% 09/15/41 583,527 60,819
FHLMC, Series 4422, Class DO (PO) 0�000% 10/15/41 1,716,291 1,621,942
FHLMC, Series 4116, Class LI (IO) 4�500% 02/15/42 1,924,335 240,145
FHLMC, Series 4074, Class SJ (IO) (I* IMO LIBOR + 662) (a) 6�547% 07/15/42 1,098,827 261,847
FHLMC, Class (PO) 0�000% 08/15/42 246,287 219,429FHLMC, Class (PO) 0�000% 09/15/43 400,646 348,821FNMA, Series 2012-
128, Class EI (IO) 3�500% 11/25/27 463,020 30,615FNMA, Series 2012-
148, Class IA (IO) 4�000% 01/25/28 251,416 20,303FNMA, Series
2004-91, Class SP (1* 1MO LIBOR + 1680) (a) 16�580% 11/25/31 223,261 300,381
FNMA, Series 2004-61, Class GO (PO) 0�000% 11/25/32 517,593 487,979
FNMA, Series 2013-89, Class DI (IO) 4�000% 08/25/33 2,176,305 224,175
FNMA, Series 348, Class II (IO) 6�000% 01/25/34 95,500 19,441
FNMA, Series 2015-82, Class AI (IO) 3�500% 06/25/34 1,206,778 103,996
FNMA, Series 2016-28, Class DI (IO) 3�500% 03/25/35 1,059,749 98,278
FNMA, Series 384, Class 11 (IO) 5�000% 03/25/35 785,518 126,220
Diamond Hill Core Bond Fund Schedule of Investments (Continued) June 30, 2021 (Unaudited)
Coupon Maturity
Shares /
Par Value
Fair
Value
Securitized — 64.2% continuedAgency MBS CMO — 20.3% continuedGNMA, Series
2019-99, Class GP 3�500% 08/20/49 $ 517,000 $ 571,709GNMA, Series
2019-162, Class GB 3�000% 12/20/49 450,000 470,034
GNMA, Series 2020-093, Class AZ 3�000% 04/20/50 798,637 854,481
GNMA, Series 2020-097, Class ML 2�500% 07/20/50 1,975,000 1,967,539
GNMA, Series 2017-H18, Class EB (a) 4�419% 06/20/63 297,346 309,533
GNMA, Series 2014-H15, Class FA (1* 1MO LIBOR + 50) (a) 0�607% 07/20/64 85,972 86,618
GNMA, Series 2014-H14, Class FA (1* 1MO LIBOR + 50) (a) 0�610% 07/20/64 340,415 342,693
GNMA, Series 2016-H11, Class FD (1* 12MO LIBOR + 40) (a) 0�681% 05/20/66 246,856 247,234
GNMA, Series 2017-H16, Class DB (a) 4�758% 08/20/67 253,540 261,005
80,272,362
Agency MBS CMO Derivatives — 3.4%FHLMC, Series
3919, Class QS (IO) (1* 1MO LIBOR + 670) (a) 6�627% 08/15/30 1,965,175 271,809
FHLMC, Series 4214, Class CI (IO) 3�000% 06/15/31 833,788 28,605
FHLMC, Series 4114, Class IM (IO) 3�500% 07/15/31 1,286,792 54,876
FHLMC, Series 4169, Class SA (1* 1MO LIBOR + 546) (a) 5�328% 02/15/33 743,281 779,790
FHLMC, Series 226, Class PO (PO) 0�000% 02/01/34 156,123 144,951
FHLMC, Series 3107, Class DC (IO) (1* 1MO LIBOR + 670) (a) 6�627% 06/15/35 2,321,424 141,663

42 DIAMOND HILL FUNDS | SEMI-ANNUAL REPORT | JUNE 30, 2021 | DIAMOND-HILL.COM
Diamond Hill Core Bond Fund Schedule of Investments (Continued) June 30, 2021 (Unaudited)
Coupon Maturity
Shares /
Par Value
Fair
Value
Securitized — 64.2% continuedAgency MBS CMO Derivatives — 3.4% continuedFNMA, Series
2005-52, Class JH (IO) (1* 1MO LIBOR + 660) (a) 6�509% 05/25/35 $ 419,466 $ 64,190
FNMA, Series 378, Class (IO) 5�000% 06/01/35 836,561 132,320
FNMA, Series 2016-24, Class KI (IO) 3�500% 07/25/35 556,902 58,298
FNMA, Series 368, Class (IO) 5�000% 02/01/36 649,322 84,446
FNMA, Series 2006-96, Class MO (PO) 0�000% 10/25/36 52,170 49,794
FNMA, Series 398, Class C5 (IO) 5�000% 05/25/39 896,943 168,968
FNMA, Series 2013-120, Class JI (IO) 4�000% 02/25/40 235,686 6,137
FNMA, Series 2010-44, Class CS (IO) (1* 1MO LIBOR + 655) (a) 6�459% 05/25/40 77,631 14,338
FNMA, Series 2012-63, Class NI (IO) 4�000% 06/25/40 1,354,364 55,575
FNMA, Series 2011-14, Class PI (IO) 5�000% 06/25/40 44,390 1,410
FNMA, Series 2012-100, Class MI (IO) 4�500% 12/25/40 217,955 9,685
FNMA, Series 409, Class C1 4�000% 04/01/42 1,447,530 195,438
FNMA, Series 2012-99, Class QS (1* 1MO LIBOR + 660) (a) 6�509% 09/25/42 2,877,124 586,402
FNMA, Series 2012-128, Class SH (1* 1MO LIBOR + 400) (a) 3�908% 11/25/42 438,940 398,796
FNMA, Series 2016-30, Class IN (IO) 3�500% 02/25/43 2,252,582 150,095
FNMA, Series 2013-30, Class SA (1*1MO LIBOR + 400) (a) 3�890% 04/25/43 562,495 549,123
FNMA, Series 2003-W10, Class 3IO (IO) (a) 0�606% 06/25/43 11,624,667 186,293
FNMA, Series 2013-82, Class SB (1* 1MO LIBOR + 1173�333) (a) 11�440% 08/25/43 350,236 446,725
FNMA, Series 2013-101, Class DO (PO) 0�000% 10/25/43 146,069 127,047
Coupon Maturity
Shares /
Par Value
Fair
Value
Agency MBS CMO Derivatives — 3.4% continuedFNMA, Series
2014-42, Class SN (IO) (1* 1MO LIBOR + 605) (a) 5�959% 07/25/44 $ 592,212 $ 110,697
FNMA, Series 2019-31, Class CI (IO) 4�000% 02/25/47 1,999,808 132,894
FNMA, Series 2018-11B, Class QI 4�000% 01/25/48 3,616,930 324,524
GNMA, Series 2010-47, Class PX (IO) (1* 1MO LIBOR + 670) (a) 6�607% 06/20/37 786,454 155,376
GNMA, Series 2012-146, Class AI (IO) 3�000% 10/20/37 1,859,842 79,975
GNMA, Series 2011-139, Class LS (IO) (a) 4�890% 03/16/38 1,704,118 335,268
GNMA, Series 2008-38, Class ID (IO) 6�000% 03/20/38 274,139 18,155
GNMA, Series 2013-124, Class ES (1* 1MO LIBOR + 866�667) (a) 8�542% 04/20/39 31,115 32,165
GNMA, Series 2013-147, Class SD (1* 1MO LIBOR + 665) (a) 6�557% 12/20/39 1,977,897 414,891
GNMA, Series 2011-21, Class SA (IO) (I* IMO LIBOR + 600) (a) 5�925% 02/16/41 2,324,369 421,765
GNMA, Series 2011-145, Class QI (IO) 5�000% 11/16/41 224,101 34,856
GNMA, Series 2013-113, Class QS (IO) (1* 1MO LIBOR + 620) (a) 6�107% 02/20/42 550,761 74,458
GNMA, Series 2014-141, Class IE (IO) 4�000% 08/20/43 238,099 7,022
GNMA, Series 2017-004, Class WI (IO) 4�000% 02/20/44 1,561,969 128,670
GNMA, Series 2016-32, Class MS (IO) (1* 1MO LIBOR + 605) (a) 5�957% 03/20/46 2,134,857 423,043
GNMA, Series 2019-98, Class BI (IO) 3�000% 06/20/49 847,484 276,052
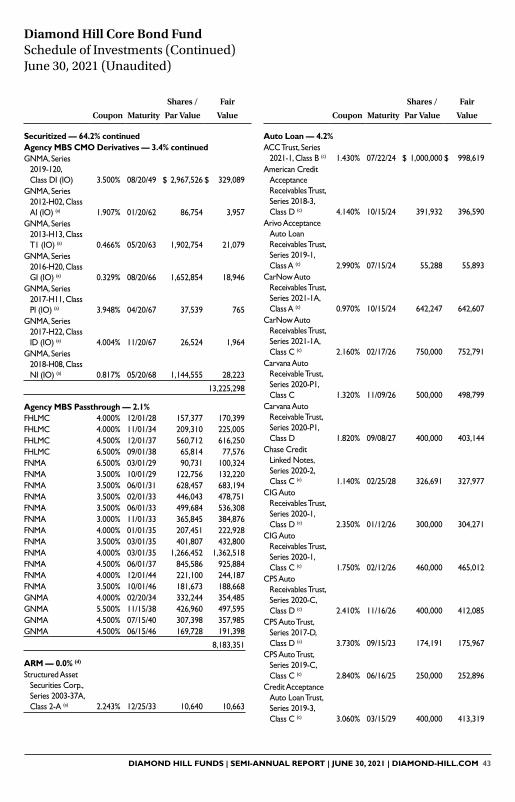
DIAMOND HILL FUNDS | SEMI-ANNUAL REPORT | JUNE 30, 2021 | DIAMOND-HILL.COM 43
Coupon Maturity
Shares /
Par Value
Fair
Value
Securitized — 64.2% continuedAgency MBS CMO Derivatives — 3.4% continuedGNMA, Series
2019-120, Class DI (IO) 3�500% 08/20/49 $ 2,967,526 $ 329,089
GNMA, Series 2012-H02, Class AI (IO) (a) 1�907% 01/20/62 86,754 3,957
GNMA, Series 2013-H13, Class T1 (IO) (a) 0�466% 05/20/63 1,902,754 21,079
GNMA, Series 2016-H20, Class GI (IO) (a) 0�329% 08/20/66 1,652,854 18,946
GNMA, Series 2017-H11, Class PI (IO) (a) 3�948% 04/20/67 37,539 765
GNMA, Series 2017-H22, Class ID (IO) (a) 4�004% 11/20/67 26,524 1,964
GNMA, Series 2018-H08, Class NI (IO) (a) 0�817% 05/20/68 1,144,555 28,223
13,225,298
Agency MBS Passthrough — 2.1%FHLMC 4�000% 12/01/28 157,377 170,399FHLMC 4�000% 11/01/34 209,310 225,005FHLMC 4�500% 12/01/37 560,712 616,250FHLMC 6�500% 09/01/38 65,814 77,576FNMA 6�500% 03/01/29 90,731 100,324FNMA 3�500% 10/01/29 122,756 132,220FNMA 3�500% 06/01/31 628,457 683,194FNMA 3�500% 02/01/33 446,043 478,751FNMA 3�500% 06/01/33 499,684 536,308FNMA 3�000% 11/01/33 365,845 384,876FNMA 4�000% 01/01/35 207,451 222,928FNMA 3�500% 03/01/35 401,807 432,800FNMA 4�000% 03/01/35 1,266,452 1,362,518FNMA 4�500% 06/01/37 845,586 925,884FNMA 4�000% 12/01/44 221,100 244,187FNMA 3�500% 10/01/46 181,673 188,668GNMA 4�000% 02/20/34 332,244 354,485GNMA 5�500% 11/15/38 426,960 497,595GNMA 4�500% 07/15/40 307,398 357,985GNMA 4�500% 06/15/46 169,728 191,398
8,183,351
ARM — 0.0% (d)
Structured Asset Securities Corp�, Series 2003-37A, Class 2-A (a) 2�243% 12/25/33 10,640 10,663
Diamond Hill Core Bond Fund Schedule of Investments (Continued) June 30, 2021 (Unaudited)
Coupon Maturity
Shares /
Par Value
Fair
Value
Auto Loan — 4.2%ACC Trust, Series
2021-1, Class B (c) 1�430% 07/22/24 $ 1,000,000 $ 998,619American Credit
Acceptance Receivables Trust, Series 2018-3, Class D (c) 4�140% 10/15/24 391,932 396,590
Arivo Acceptance Auto Loan Receivables Trust, Series 2019-1, Class A (c) 2�990% 07/15/24 55,288 55,893
CarNow Auto Receivables Trust, Series 2021-1A, Class A (c) 0�970% 10/15/24 642,247 642,607
CarNow Auto Receivables Trust, Series 2021-1A, Class C (c) 2�160% 02/17/26 750,000 752,791
Carvana Auto Receivable Trust, Series 2020-P1, Class C 1�320% 11/09/26 500,000 498,799
Carvana Auto Receivable Trust, Series 2020-P1, Class D 1�820% 09/08/27 400,000 403,144
Chase Credit Linked Notes, Series 2020-2, Class C (c) 1�140% 02/25/28 326,691 327,977
CIG Auto Receivables Trust, Series 2020-1, Class D (c) 2�350% 01/12/26 300,000 304,271
CIG Auto Receivables Trust, Series 2020-1, Class C (c) 1�750% 02/12/26 460,000 465,012
CPS Auto Receivables Trust, Series 2020-C, Class D (c) 2�410% 11/16/26 400,000 412,085
CPS Auto Trust, Series 2017-D, Class D (c) 3�730% 09/15/23 174,191 175,967
CPS Auto Trust, Series 2019-C, Class C (c) 2�840% 06/16/25 250,000 252,896
Credit Acceptance Auto Loan Trust, Series 2019-3, Class C (c) 3�060% 03/15/29 400,000 413,319

44 DIAMOND HILL FUNDS | SEMI-ANNUAL REPORT | JUNE 30, 2021 | DIAMOND-HILL.COM
Diamond Hill Core Bond Fund Schedule of Investments (Continued) June 30, 2021 (Unaudited)
Coupon Maturity
Shares /
Par Value
Fair
Value
Securitized — 64.2% continuedAuto Loan — 4.2% continuedCredit Acceptance
Auto Loan Trust, Series 2020-3A, Class C (c) 2�280% 02/15/30 $ 550,000 $ 561,539
Credito RL USA, Series 2021-1, Class A (c) 1�350% 02/16/27 899,467 899,656
DT Auto Owner Trust, Series 2019-2, Class D (c) 3�480% 02/18/25 195,000 201,228
DT Auto Owner Trust, Series 2019-3, Class D (c) 2�960% 04/15/25 285,000 294,612
DT Auto Owner Trust, Series 2020-2, Class E (c) 4�730% 03/16/26 300,000 325,249
Exeter Automobile Receivables Trust, Series 2020-2, Class D (c) 4�730% 04/15/26 375,000 401,882
FHF Trust, Series 2020-1, Class A (c) 2�590% 12/15/23 349,188 352,032
FHF Trust, Series 2021-1, Class A (c) 1�270% 03/15/27 809,203 808,805
Foursight Capital Automobile Receivables, Series 2018-2, Class E (c) 5�500% 10/15/24 750,000 783,804
OneMain Direct Auto Receivables, Series 2018-1, Class B (c) 3�710% 04/14/25 300,000 303,154
OneMain Direct Auto Receivables, Series 2019-1, Class D (c) 4�680% 04/14/31 675,000 748,178
OSCAR US Funding Trust, Series 2019-11, Class A-4 (c) 2�680% 09/10/26 220,000 228,098
Santander Consumer Auto Receivables, Series 2020-B, Class D (c) 2�140% 12/15/26 400,000 404,878
Santander Drive Auto Trust, Series 2019-3, Class D 2�680% 10/15/25 545,000 558,339
Skopos Auto Receivables Trust, Series 2019-1, Class B (c) 3�430% 09/15/23 432,830 435,120
Tesla Auto Lease Trust, Series 2018-B, Class D (c) 5�290% 11/22/21 250,000 251,854
Coupon Maturity
Shares /
Par Value
Fair
Value
Auto Loan — 4.2% continuedTesla Auto Lease
Trust, Series 2019-A, Class C (c) 2�680% 01/20/23 $ 700,000 $ 716,171
Tesla Auto Lease Trust, Series 2020-A, Class D (c) 2�330% 02/20/24 250,000 256,460
Veros Auto Receivables Trust, Series 2021-1, Class A (c) 0�920% 10/15/26 1,142,494 1,142,475
Veros Auto Receivables Trust, Series 2021-1, Class B (c) 1�490% 10/15/26 1,000,000 997,760
16,771,264
CRE/CLO — 4.7%A10 Securitization,
Series 2020-C, Class A (c)(e) 2�033% 08/15/40 209,155 210,250
A10 Securitization, Series 2020-C, Class B (c)(e) 2�617% 08/15/40 300,000 302,083
A10 Securitization, Series 2020-C, Class D (c)(e) 4�129% 08/15/40 250,000 253,184
A10 Securitization, Series 2020-C, Class E (c)(e) 5�465% 08/15/40 250,000 253,881
Acre Mortgage Trust, Series 2021-FL4, Class D (1* 1MO LIBOR + 260) (a)(c) 2�698% 12/15/37 1,000,000 995,029
Acre Mortgage Trust, Series 2021-FL4, Class E (1* 1MO LIBOR + 310) (a)(c) 3�197% 12/15/37 675,000 668,312
Bancorp Commercial Mortgage Trust (The), Series 2017-CRE2, Class C (1* 1MO LIBOR + 235) (a)(c) 2�451% 08/15/32 250,000 247,090
Bancorp Commercial Mortgage Trust (The), Series 2018-CR3, Class D (1* 1MO LIBOR + 270) (a)(c) 2�801% 03/16/35 324,000 322,318

DIAMOND HILL FUNDS | SEMI-ANNUAL REPORT | JUNE 30, 2021 | DIAMOND-HILL.COM 45
Diamond Hill Core Bond Fund Schedule of Investments (Continued) June 30, 2021 (Unaudited)
Coupon Maturity
Shares /
Par Value
Fair
Value
Securitized — 64.2% continuedCRE/CLO — 4.7% continuedBancorp
Commercial Mortgage Trust (The), Series 2019-CRE6, Class A (1* 1MO LIBOR + 105) (a)(c) 1�151% 09/17/36 $ 167,561 $ 167,456
Bancorp Commercial Mortgage Trust (The), Series 2019-CRE5, Class A (1* 1MO LIBOR + 100) (a)(c) 1�101% 03/17/36 123,299 123,299
BSPRT Issuer Ltd�, Series 2018-FL3, Class A (1* 1MO LIBOR + 105) (a)(c) 1�123% 03/15/28 205,562 205,562
BSPRT Issuer Ltd�, Series 2018-FL4, Class A (1* 1MO LIBOR + 105) (a)(c) 1�123% 09/17/35 522,815 522,815
BXMT, Series 2021-FL4, Class A (1* 1MO LIBOR + 105) (a)(c) 1�151% 05/17/38 750,000 750,000
BXMT, Series 2021-FL4, Class D (1* 1MO LIBOR + 225) (a)(c) 2�351% 05/17/38 750,000 750,000
BXMT Ltd�, Series 2020-FL2, Class D (1* 1MO LIBOR + 195) (a)(c) 2�051% 02/16/37 625,000 624,219
BXMT Ltd�, Series 2020-FL2, Class B (1* 1MO LIBOR + 140) (a)(c) 1�501% 02/18/38 1,000,000 999,063
BXMT Ltd�, Series 2020-FL2, Class C (1* 1MO LIBOR + 165) (a)(c) 1�751% 02/18/38 1,000,000 999,063
Exantas Capital Corp�, Series 2020-RS09, Class D (1* 1MO LIBOR + 550) (a)(c)(e) 5�601% 04/17/37 367,383 373,069
FHLMC, Series 2020-FL3, Class B (1* 1MO LIBOR + 375) (a)(c) 3�874% 07/15/35 1,150,000 1,167,956
Coupon Maturity
Shares /
Par Value
Fair
Value
CRE/CLO — 4.7% continuedFHLMC, Series
2020-FL3, Class A-S (1* 1MO LIBOR + 285) (a)(c) 2�974% 07/16/35 $ 800,000 $ 811,491
KKR Real Estate Finance Trust, Inc�, Series 2018-FL1, Class A (1* 1MO LIBOR + 110) (a)(c) 1�201% 06/15/36 920,737 921,023
LoanCore Issuer Ltd�, Series 2019-CRE3, Class D (a)(c) 2�573% 05/15/36 720,000 698,420
LoanCore Issuer Ltd�, Series 2021-CRE5, Class A (a)(c) 1�373% 07/15/36 1,000,000 1,000,932
MF1 Ltd�, Series 2020-FL3, Class D (1* 1MO LIBOR + 300) (a)(c) 3�124% 07/16/35 775,000 782,011
Multi Family Housing Mortgage Loan, Series 2019-FL2, Class A (1* 1MO LIBOR + 113) (a)(c) 1�222% 11/27/34 354,054 354,054
Multi Family Housing Mortgage Loan, Series 2019-FL2, Class C (1* 1MO LIBOR + 200) (a)(c) 2�092% 12/25/34 300,000 300,000
Multi Family Housing Mortgage Loan, Series 2020-FL4, Class A (1* 1MO LIBOR + 170) (a)(c) 1�824% 11/15/35 600,000 604,865
PFP III, Series 2021-7, Class D (1* 1MO LIBOR + 240) (a)(c) 2�475% 04/14/38 750,000 748,133
PFP Ltd�, Series 2019-5, Class B (1* 1MO LIBOR + 165) (a)(c) 1�725% 04/16/36 650,000 649,194
ReadyCap Commercial Mortgage Trust, Series 2020-FL4, Class A (1* 1MO LIBOR + 215) (a)(c) 2�242% 02/25/35 999,957 1,007,417
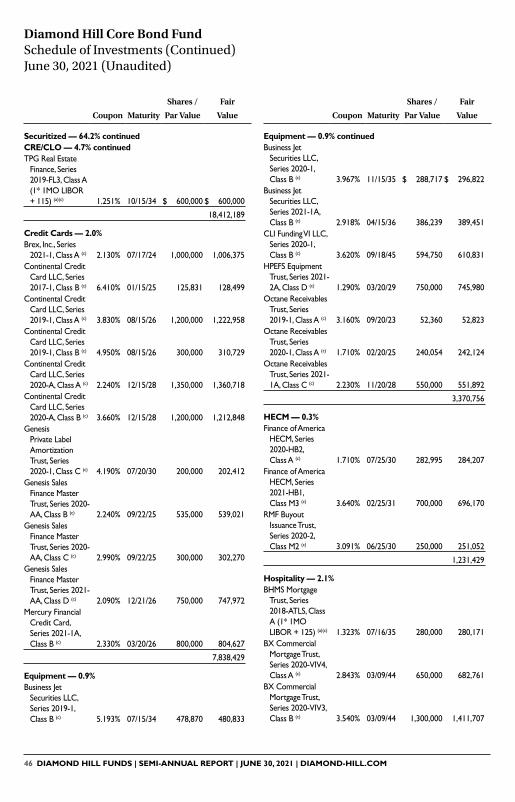
46 DIAMOND HILL FUNDS | SEMI-ANNUAL REPORT | JUNE 30, 2021 | DIAMOND-HILL.COM
Coupon Maturity
Shares /
Par Value
Fair
Value
Securitized — 64.2% continuedCRE/CLO — 4.7% continuedTPG Real Estate
Finance, Series 2019-FL3, Class A (1* 1MO LIBOR + 115) (a)(c) 1�251% 10/15/34 $ 600,000 $ 600,000
18,412,189
Credit Cards — 2.0%Brex, Inc�, Series
2021-1, Class A (c) 2�130% 07/17/24 1,000,000 1,006,375Continental Credit
Card LLC, Series 2017-1, Class B (c) 6�410% 01/15/25 125,831 128,499
Continental Credit Card LLC, Series 2019-1, Class A (c) 3�830% 08/15/26 1,200,000 1,222,958
Continental Credit Card LLC, Series 2019-1, Class B (c) 4�950% 08/15/26 300,000 310,729
Continental Credit Card LLC, Series 2020-A, Class A (c) 2�240% 12/15/28 1,350,000 1,360,718
Continental Credit Card LLC, Series 2020-A, Class B (c) 3�660% 12/15/28 1,200,000 1,212,848
Genesis Private Label Amortization Trust, Series 2020-1, Class C (c) 4�190% 07/20/30 200,000 202,412
Genesis Sales Finance Master Trust, Series 2020-AA, Class B (c) 2�240% 09/22/25 535,000 539,021
Genesis Sales Finance Master Trust, Series 2020-AA, Class C (c) 2�990% 09/22/25 300,000 302,270
Genesis Sales Finance Master Trust, Series 2021-AA, Class D (c) 2�090% 12/21/26 750,000 747,972
Mercury Financial Credit Card, Series 2021-1A, Class B (c) 2�330% 03/20/26 800,000 804,627
7,838,429
Equipment — 0.9%Business Jet
Securities LLC, Series 2019-1, Class B (c) 5�193% 07/15/34 478,870 480,833
Diamond Hill Core Bond Fund Schedule of Investments (Continued) June 30, 2021 (Unaudited)
Coupon Maturity
Shares /
Par Value
Fair
Value
Equipment — 0.9% continuedBusiness Jet
Securities LLC, Series 2020-1, Class B (c) 3�967% 11/15/35 $ 288,717 $ 296,822
Business Jet Securities LLC, Series 2021-1A, Class B (c) 2�918% 04/15/36 386,239 389,451
CLI Funding VI LLC, Series 2020-1, Class B (c) 3�620% 09/18/45 594,750 610,831
HPEFS Equipment Trust, Series 2021-2A, Class D (c) 1�290% 03/20/29 750,000 745,980
Octane Receivables Trust, Series 2019-1, Class A (c) 3�160% 09/20/23 52,360 52,823
Octane Receivables Trust, Series 2020-1, Class A (c) 1�710% 02/20/25 240,054 242,124
Octane Receivables Trust, Series 2021-1A, Class C (c) 2�230% 11/20/28 550,000 551,892
3,370,756
HECM — 0.3%Finance of America
HECM, Series 2020-HB2, Class A (c) 1�710% 07/25/30 282,995 284,207
Finance of America HECM, Series 2021-HB1, Class M3 (c) 3�640% 02/25/31 700,000 696,170
RMF Buyout Issuance Trust, Series 2020-2, Class M2 (c) 3�091% 06/25/30 250,000 251,052
1,231,429
Hospitality — 2.1%BHMS Mortgage
Trust, Series 2018-ATLS, Class A (1* 1MO LIBOR + 125) (a)(c) 1�323% 07/16/35 280,000 280,171
BX Commercial Mortgage Trust, Series 2020-VIV4, Class A (c) 2�843% 03/09/44 650,000 682,761
BX Commercial Mortgage Trust, Series 2020-VIV3, Class B (c) 3�540% 03/09/44 1,300,000 1,411,707

DIAMOND HILL FUNDS | SEMI-ANNUAL REPORT | JUNE 30, 2021 | DIAMOND-HILL.COM 47
Diamond Hill Core Bond Fund Schedule of Investments (Continued) June 30, 2021 (Unaudited)
Coupon Maturity
Shares /
Par Value
Fair
Value
Securitized — 64.2% continuedHospitality — 2.1% continuedBX Trust, Series
2018-GW, Class E (1* IMO LIBOR + 197) (a)(c) 2�043% 05/15/37 $ 150,000 $ 149,997
BX Trust, Series 2019-OC11, Class D (c) 4�075% 12/09/41 225,000 240,732
BX Trust, Series 2019-OC11, Class A (c) 3�202% 12/11/41 1,177,000 1,267,939
Champlain Housing Mortgage Trust, Series 2017-COSMO, Class B (1* 1MO LIBOR + 140) (a)(c) 1�473% 11/17/36 100,000 100,093
Cosmopolitan Hotel Trust, Series 2017-COSMO, Class D (1* 1MO LIBOR + 225) (a)(c) 2�323% 11/15/36 100,000 100,124
Cosmopolitan Hotel Trust, Series 2017-COSMO, Class A (1* 1MO LIBOR + 93) (a)(c) 1�003% 11/17/36 800,000 800,744
Extended Stay America Trust, Series 2021-ESH, Class C (1* 1MO LIBOR + 170) (a)(c) 1�775% 07/15/38 500,000 501,450
Extended Stay America Trust, Series 2021-ESH, Class E (1* 1MO LIBOR +285) (a)(c) 2�925% 07/15/38 250,000 250,942
Fontainebleau Miami Beach, Series 2019-FBLU, Class C (c) 3�750% 12/12/36 750,000 790,424
Goldman Sachs Mortgage Securities Corp� Trust, Series 2018-HULA, Class A (1* 1MO LIBOR + 92) (a)(c) 0�993% 07/16/35 752,841 753,666
Goldman Sachs Mortgage Securities Corp� Trust, Series 2018-HULA, Class B (1* 1MO LIBOR + 125) (a)(c) 1�323% 07/16/35 941,051 941,626
Coupon Maturity
Shares /
Par Value
Fair
Value
Hospitality — 2.1% continuedMotel 6 Trust, Series
2017-MTL6, Class D (1* 1MO LIBOR + 215) (a)(c) 2�223% 08/15/34 $ 185,014 $ 185,360
8,457,736
Industrial — 0.7%BX Commercial
Mortgage Trust, Series 2020-FOX, Class D (1* 1MO LIBOR + 210) (a)(c) 2�173% 11/15/32 1,178,894 1,183,378
Cold Storage Trust, Series 2020-ICE5, Class E (1* 1MO LIBOR + 276�56) (a)(c) 2�838% 11/16/37 491,495 493,652
Credit Suisse First Boston, Series 2020-UNFI, Class A (a)(c) 3�741% 12/06/22 1,000,000 1,002,822
2,679,852
Laboratory — 0.5%Commercial
Mortgage Trust, Series 2020-CX, Class A(c) 2�173% 11/10/46 2,000,000 2,017,630
Manufactured Housing — 0.0% (d)
Cascade Funding Mortgage Trust, Series 2019-MH1, Class M (c) 5�985% 11/25/44 100,000 103,814
Mixed-Use — 0.1%20 Times Square
Trust, Series 2018-20TS, Class B (a)(c) 3�100% 05/17/35 300,000 302,964
Multifamily — 1.6%FHLMC, Series
2021-MN1, Class M-1 (1* SOFR30A + 200) (a)(c) 2�018% 01/25/51 1,120,416 1,128,338
Freedom Mortgage Trust, Series 2016-KF17, Class B (a)(c) 2�587% 03/25/23 609,524 607,790
Freedom Mortgage Trust, Series 2017-KF39, Class B (1* 1MO LIBOR + 250) (a)(c) 2�586% 11/25/24 467,409 465,359
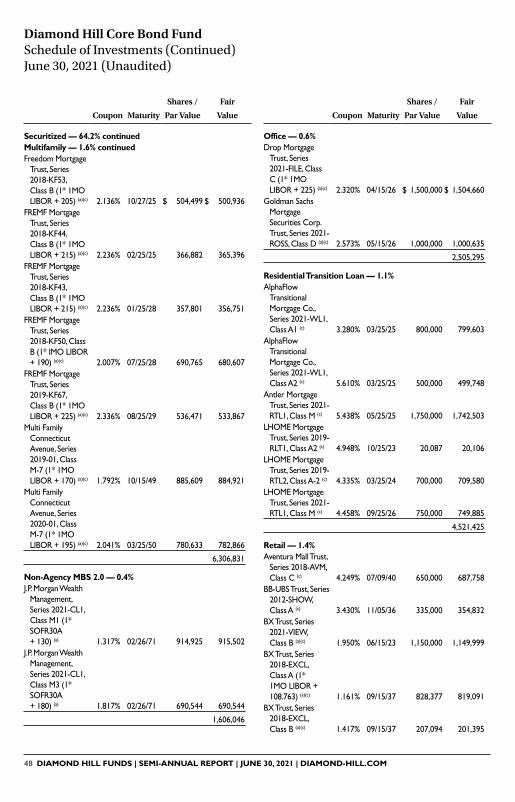
48 DIAMOND HILL FUNDS | SEMI-ANNUAL REPORT | JUNE 30, 2021 | DIAMOND-HILL.COM
Coupon Maturity
Shares /
Par Value
Fair
Value
Securitized — 64.2% continuedMultifamily — 1.6% continuedFreedom Mortgage
Trust, Series 2018-KF53, Class B (1* 1MO LIBOR + 205) (a)(c) 2�136% 10/27/25 $ 504,499 $ 500,936
FREMF Mortgage Trust, Series 2018-KF44, Class B (1* 1MO LIBOR + 215) (a)(c) 2�236% 02/25/25 366,882 365,396
FREMF Mortgage Trust, Series 2018-KF43, Class B (1* 1MO LIBOR + 215) (a)(c) 2�236% 01/25/28 357,801 356,751
FREMF Mortgage Trust, Series 2018-KF50, Class B (1* IMO LIBOR + 190) (a)(c) 2�007% 07/25/28 690,765 680,607
FREMF Mortgage Trust, Series 2019-KF67, Class B (1* 1MO LIBOR + 225) (a)(c) 2�336% 08/25/29 536,471 533,867
Multi Family Connecticut Avenue, Series 2019-01, Class M-7 (1* 1MO LIBOR + 170) (a)(c) 1�792% 10/15/49 885,609 884,921
Multi Family Connecticut Avenue, Series 2020-01, Class M-7 (1* 1MO LIBOR + 195) (a)(c) 2�041% 03/25/50 780,633 782,866
6,306,831
Non-Agency MBS 2.0 — 0.4%J�P� Morgan Wealth
Management, Series 2021-CL1, Class M1 (1* SOFR30A + 130) (a) 1�317% 02/26/71 914,925 915,502
J�P� Morgan Wealth Management, Series 2021-CL1, Class M3 (1* SOFR30A + 180) (a) 1�817% 02/26/71 690,544 690,544
1,606,046
Coupon Maturity
Shares /
Par Value
Fair
Value
Office — 0.6%Drop Mortgage
Trust, Series 2021-FILE, Class C (1* 1MO LIBOR + 225) (a)(c) 2�320% 04/15/26 $ 1,500,000 $ 1,504,660
Goldman Sachs Mortgage Securities Corp� Trust, Series 2021-ROSS, Class D (a)(c) 2�573% 05/15/26 1,000,000 1,000,635
2,505,295
Residential Transition Loan — 1.1%AlphaFlow
Transitional Mortgage Co�, Series 2021-WL1, Class A1 (c) 3�280% 03/25/25 800,000 799,603
AlphaFlow Transitional Mortgage Co�, Series 2021-WL1, Class A2 (c) 5�610% 03/25/25 500,000 499,748
Antler Mortgage Trust, Series 2021-RTL1, Class M (c) 5�438% 05/25/25 1,750,000 1,742,503
LHOME Mortgage Trust, Series 2019-RLT1, Class A2 (c) 4�948% 10/25/23 20,087 20,106
LHOME Mortgage Trust, Series 2019-RTL2, Class A-2 (c) 4�335% 03/25/24 700,000 709,580
LHOME Mortgage Trust, Series 2021-RTL1, Class M (c) 4�458% 09/25/26 750,000 749,885
4,521,425
Retail — 1.4%Aventura Mall Trust,
Series 2018-AVM, Class C (c) 4�249% 07/09/40 650,000 687,758
BB-UBS Trust, Series 2012-SHOW, Class A (c) 3�430% 11/05/36 335,000 354,832
BX Trust, Series 2021-VIEW, Class B (a)(c) 1�950% 06/15/23 1,150,000 1,149,999
BX Trust, Series 2018-EXCL, Class A (1* 1MO LIBOR + 108�763) (a)(c) 1�161% 09/15/37 828,377 819,091
BX Trust, Series 2018-EXCL, Class B (a)(c) 1�417% 09/15/37 207,094 201,395
Diamond Hill Core Bond Fund Schedule of Investments (Continued) June 30, 2021 (Unaudited)
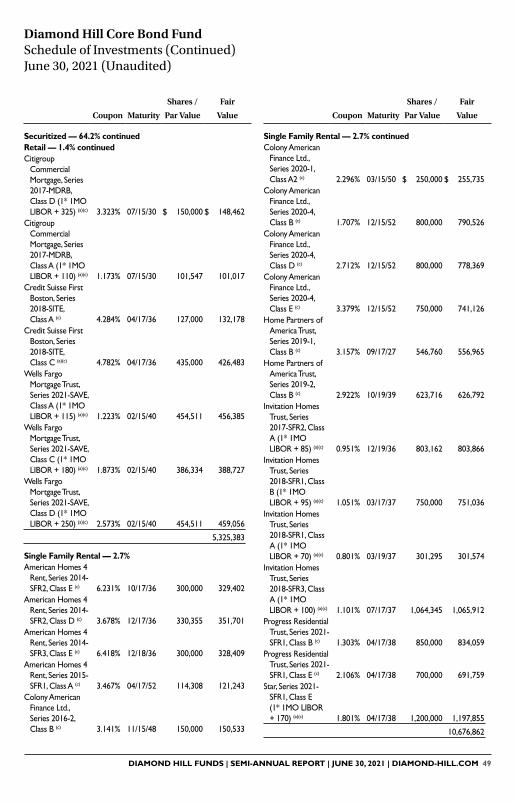
DIAMOND HILL FUNDS | SEMI-ANNUAL REPORT | JUNE 30, 2021 | DIAMOND-HILL.COM 49
Coupon Maturity
Shares /
Par Value
Fair
Value
Securitized — 64.2% continuedRetail — 1.4% continuedCitigroup
Commercial Mortgage, Series 2017-MDRB, Class D (1* 1MO LIBOR + 325) (a)(c) 3�323% 07/15/30 $ 150,000 $ 148,462
Citigroup Commercial Mortgage, Series 2017-MDRB, Class A (1* 1MO LIBOR + 110) (a)(c) 1�173% 07/15/30 101,547 101,017
Credit Suisse First Boston, Series 2018-SITE, Class A (c) 4�284% 04/17/36 127,000 132,178
Credit Suisse First Boston, Series 2018-SITE, Class C (a)(c) 4�782% 04/17/36 435,000 426,483
Wells Fargo Mortgage Trust, Series 2021-SAVE, Class A (1* 1MO LIBOR + 115) (a)(c) 1�223% 02/15/40 454,511 456,385
Wells Fargo Mortgage Trust, Series 2021-SAVE, Class C (1* 1MO LIBOR + 180) (a)(c) 1�873% 02/15/40 386,334 388,727
Wells Fargo Mortgage Trust, Series 2021-SAVE, Class D (1* 1MO LIBOR + 250) (a)(c) 2�573% 02/15/40 454,511 459,056
5,325,383
Single Family Rental — 2.7%American Homes 4
Rent, Series 2014-SFR2, Class E (c) 6�231% 10/17/36 300,000 329,402
American Homes 4 Rent, Series 2014-SFR2, Class D (c) 3�678% 12/17/36 330,355 351,701
American Homes 4 Rent, Series 2014-SFR3, Class E (c) 6�418% 12/18/36 300,000 328,409
American Homes 4 Rent, Series 2015-SFR1, Class A (c) 3�467% 04/17/52 114,308 121,243
Colony American Finance Ltd�, Series 2016-2, Class B (c) 3�141% 11/15/48 150,000 150,533
Coupon Maturity
Shares /
Par Value
Fair
Value
Single Family Rental — 2.7% continuedColony American
Finance Ltd�, Series 2020-1, Class A2 (c) 2�296% 03/15/50 $ 250,000 $ 255,735
Colony American Finance Ltd�, Series 2020-4, Class B (c) 1�707% 12/15/52 800,000 790,526
Colony American Finance Ltd�, Series 2020-4, Class D (c) 2�712% 12/15/52 800,000 778,369
Colony American Finance Ltd�, Series 2020-4, Class E (c) 3�379% 12/15/52 750,000 741,126
Home Partners of America Trust, Series 2019-1, Class B (c) 3�157% 09/17/27 546,760 556,965
Home Partners of America Trust, Series 2019-2, Class B (c) 2�922% 10/19/39 623,716 626,792
Invitation Homes Trust, Series 2017-SFR2, Class A (1* 1MO LIBOR + 85) (a)(c) 0�951% 12/19/36 803,162 803,866
Invitation Homes Trust, Series 2018-SFR1, Class B (1* 1MO LIBOR + 95) (a)(c) 1�051% 03/17/37 750,000 751,036
Invitation Homes Trust, Series 2018-SFR1, Class A (1* 1MO LIBOR + 70) (a)(c) 0�801% 03/19/37 301,295 301,574
Invitation Homes Trust, Series 2018-SFR3, Class A (1* 1MO LIBOR + 100) (a)(c) 1�101% 07/17/37 1,064,345 1,065,912
Progress Residential Trust, Series 2021-SFR1, Class B (c) 1�303% 04/17/38 850,000 834,059
Progress Residential Trust, Series 2021-SFR1, Class E (c) 2�106% 04/17/38 700,000 691,759
Star, Series 2021-SFR1, Class E (1* 1MO LIBOR + 170) (a)(c) 1�801% 04/17/38 1,200,000 1,197,855
10,676,862
Diamond Hill Core Bond Fund Schedule of Investments (Continued) June 30, 2021 (Unaudited)

50 DIAMOND HILL FUNDS | SEMI-ANNUAL REPORT | JUNE 30, 2021 | DIAMOND-HILL.COM
Coupon Maturity
Shares /
Par Value
Fair
Value
Securitized — 64.2% continuedSmall Business — 1.6%Credibility Asset
Securitization, Series 2021-1A, Class A (c) 2�390% 04/15/26 $ 1,000,000 $ 1,007,316
Credibility Asset Securitization, Series 2021-1A, Class C (c) 3�380% 04/15/26 500,000 503,089
Newtek Small Business Loan Trust, Series 2018-1, Class A (1* Prime - 55) (a)(c) 2�700% 02/25/44 688,403 677,754
Newtek Small Business Loan Trust, Series 2018-1, Class B (1* Prime + 75) (a)(c) 4�000% 02/25/44 181,159 175,119
Newtek Small Business Loan Trust, Series 2019-01, Class A (1* Prime - 90) (a)(c) 2�350% 12/25/44 673,129 663,260
Newtek Small Business Loan Trust, Series 2019-01, Class B (1* Prime + 25) (a)(c) 3�500% 12/25/44 286,080 274,275
OnDeck Asset Securitization Trust, Series 2021-1A, Class B (c) 2�280% 05/17/27 750,000 755,403
OnDeck Asset Securitization Trust, Series 2021-1A, Class C (c) 2�970% 05/17/27 650,000 654,579
SFS Asset Securitization LLC, Series 2019-1, Class A (c) 4�238% 06/10/25 800,000 800,657
SFS Asset Securitization LLC, Series 2019-1, Class B (c) 5�023% 06/10/25 150,000 151,182
Small Business Lending Trust, Series 2019-A, Class A (c) 2�850% 07/15/26 60,597 60,560
Small Business Lending Trust, Series 2020-A, Class B (c) 3�200% 12/15/26 746,000 749,697
6,472,891
Diamond Hill Core Bond Fund Schedule of Investments (Continued) June 30, 2021 (Unaudited)
Coupon Maturity
Shares /
Par Value
Fair
Value
Student Loan — 1.4%College Ave Student
Loans, Series 2018-A, Class B (c) 4�750% 12/26/47 $ 93,840 $ 99,823
College Ave Student Loans, Series 2018-A, Class C (c) 5�500% 12/26/47 91,797 96,152
College Ave Student Loans, Series 2019-A, Class A1 (1* 1MO LIBOR + 140) (a)(c) 1�492% 12/28/48 137,644 139,140
College Ave Student Loans, Series 2019-A, Class C (c) 4�460% 12/28/48 250,000 257,683
College Ave Student Loans, Series 2021-A, Class B (c) 2�320% 07/25/51 675,000 679,351
College Ave Student Loans, Series 2021-A, Class D (c) 4�120% 07/25/51 500,000 506,338
Earnest Student Loan Program LLC, Series 2016-C, Class A-2 (c) 2�680% 07/25/35 133,902 133,902
Earnest Student Loan Program LLC, Series 2017-A, Class B (c) 3�590% 01/25/41 78,289 78,541
Laurel Road Prime Student Loan, Series 2018-B, Class A2 (c) 3�540% 05/26/43 45,848 46,748
Laurel Road Prime Student Loan, Series 2019-A, Class A2FX (c) 2�730% 10/25/48 147,268 150,025
SMB Private Education Loan Trust, Series 2018-C, Class B (c) 4�000% 11/17/42 200,000 213,051
Social Professional Loan Program, Series 2016-C, Class A-2B (c) 2�360% 12/27/32 59,659 60,222
Social Professional Loan Program, Series 2015-D, Class B (c) 3�590% 10/26/37 79,826 80,544
Social Professional Loan Program, Series 2017-B, Class CFX (c) 4�440% 05/25/40 150,000 156,767

DIAMOND HILL FUNDS | SEMI-ANNUAL REPORT | JUNE 30, 2021 | DIAMOND-HILL.COM 51
Coupon Maturity
Shares /
Par Value
Fair
Value
Securitized — 64.2% continuedStudent Loan — 1.4% continuedSocial Professional
Loan Program, Series 2017-E, Class A-2B (c) 2�720% 11/26/40 $ 106,767 $ 108,633
Social Professional Loan Program, Series 2017-E, Class C (c) 4�160% 11/26/40 700,000 732,669
Social Professional Loan Program, Series 2016-E, Class C (c) 4�430% 10/25/41 200,000 207,610
Social Professional Loan Program, Series 2018-A, Class A-1 (1* 1MO LIBOR + 35) (a)(c) 0�442% 02/25/42 55,621 55,348
Social Professional Loan Program, Series 2020-A, Class BFX (c) 3�120% 05/15/46 425,000 438,084
Social Professional Loan Program, Series 2018-D, Class BFX (c) 4�140% 02/25/48 500,000 522,055
Social Professional Loan Program, Series 2019-C, Class BFX (c) 3�050% 11/16/48 730,000 737,750
5,500,436
Unsecured Consumer — 6.0%Avant Loans
Funding Trust, Series 2020-REV1, Class A (c) 2�170% 05/15/29 200,000 201,236
Avant Loans Funding Trust, Series 2021-REV1, Class C (c) 2�300% 07/15/30 800,000 797,463
Freedom Financial, Series 2019-1, Class B (c) 3�870% 06/18/26 223,392 224,878
Freedom Financial, Series 2020-FP1, Class A (c) 2�520% 03/18/27 166,360 167,199
Freedom Financial, Series 2020-FP1, Class B (c) 3�060% 03/18/27 575,000 582,989
Freedom Financial, Series 2020-2CP, Class A (c) 4�520% 06/18/27 52,689 52,953
Coupon Maturity
Shares /
Par Value
Fair
Value
Unsecured Consumer — 6.0% continuedFreedom Financial,
Series 2020-3FP, Class A (c) 2�400% 09/20/27 $ 24,892 $ 24,925
Freedom Financial, Series 2020-3FP, Class B (c) 4�180% 09/20/27 1,000,000 1,015,127
Freedom Financial, Series 2021-1CP, Class C (c) 2�830% 03/20/28 425,000 430,303
Freedom Mortgage Trust, Series 2020-2CP, Class C (c) 6�000% 06/18/27 1,484,000 1,575,043
LendingPoint Asset Securitization Trust, Series 2020-1, Class B (c) 3�107% 02/10/26 146,457 146,739
Lendmark Funding Trust, Series 2020-2A, Class C (c) 4�690% 04/21/31 550,000 577,213
Lendmark Funding Trust, Series 21-1A, Class B (c) 2�470% 11/20/31 1,150,000 1,161,387
Lendmark Funding Trust, Series 21-1A, Class C (c) 3�410% 11/20/31 750,000 759,088
LL ABS Trust, Series 2020-1, Class A (c) 2�330% 07/15/22 322,065 324,338
LL ABS Trust, Series 2020-1, Class B (c) 3�790% 03/15/23 1,200,000 1,233,457
LL ABS Trust, Series 2019-1, Class A (c) 2�870% 03/15/27 27,714 27,734
LL ABS Trust, Series 2019-1, Class B (c) 3�520% 03/15/27 150,000 151,429
Mariner Finance Issuance Trust, Series 2021-AA, Class D (c) 4�340% 03/20/36 1,000,000 1,029,991
Marlette Funding Trust, Series 2019-4, Class B (c) 2�950% 12/17/29 125,000 126,996
Oportun Funding LLC, Series 2020-1, Class B (c) 3�450% 05/15/24 800,000 816,853
Oportun Funding LLC, Series 2021-B, Class A (c) 1�470% 05/08/31 750,000 751,872
Oportun Funding LLC, Series 2021-B, Class C (c) 3�650% 05/08/31 650,000 651,616
Oportun Funding VII LLC, Series 2018-C, Class A c) 4�100% 10/08/24 300,000 300,220
Oportun Funding XII LLC, Series 2018-D, Class B (c) 4�830% 12/09/24 100,000 100,516
Diamond Hill Core Bond Fund Schedule of Investments (Continued) June 30, 2021 (Unaudited)

52 DIAMOND HILL FUNDS | SEMI-ANNUAL REPORT | JUNE 30, 2021 | DIAMOND-HILL.COM
Coupon Maturity
Shares /
Par Value
Fair
Value
Securitized — 64.2% continuedUnsecured Consumer — 6.0% continuedOportun Funding
XIII LLC, Series 2019-13, Class B (c) 3�870% 08/08/25 $ 500,000 $ 510,870
Oportun Funding XIV LLC, Series 2021-A, Class C (c) 3�440% 03/08/28 900,000 898,599
Prosper Marketplace Issuance Trust, Series 2019-3, Class B (c) 3�590% 07/15/25 81,302 81,569
Prosper Marketplace Issuance Trust, Series 2019-4, Class B (c) 3�200% 02/17/26 200,000 201,520
Regional Management Issuance Trust, Series 2019-1, Class C (c) 4�110% 11/15/28 200,000 203,255
Regional Management Issuance Trust, Series 2020-1, Class A (c) 2�340% 10/15/30 250,000 254,604
Regional Management Issuance Trust, Series 2021-1, Class C (c) 3�040% 03/17/31 625,000 619,965
Upgrade Master Pass-Thru Trust, Series 2019-ST1, Class A (c) 4�000% 07/15/25 176,910 179,427
Upgrade Master Pass-Thru Trust, Series 2019-ST3, Class A (c) 3�750% 11/15/25 67,557 68,498
Upgrade Receivables Trust, Series 2019-2, Class B (c) 3�510% 10/15/25 195,124 195,407
Upstart Pass-Through Trust, Series 2020-ST6, Class A (c) 3�000% 01/20/27 555,794 563,117
Upstart Pass-Through Trust, Series 2021-ST4, Class A (c) 2�000% 07/20/27 1,500,000 1,499,426
Coupon Maturity
Shares /
Par Value
Fair
Value
Unsecured Consumer — 6.0% continuedUpstart Pass-
Through Trust, Series 2020-ST1, Class A (c) 3�750% 02/20/28 $ 150,497 $ 154,561
Upstart Pass-Through Trust, Series 2020-ST2, Class A (c)(a) 3�500% 03/20/28 234,388 239,461
Upstart Pass-Through Trust, Series 2020-ST3, Class A (c) 3�350% 04/20/28 121,570 123,921
Upstart Securitization Trust, Series 2021-ST1, Class A (c) 2�750% 02/20/27 880,163 887,798
Upstart Securitization Trust, Series 2021-ST2, Class A (c) 2�500% 04/20/27 1,149,427 1,162,408
Upstart Securitization Trust, Series 2019-2, Class A (c) 2�897% 09/20/29 17,297 17,331
Upstart Securitization Trust, Series 2019-2, Class B (c) 3�734% 09/20/29 1,000,000 1,014,181
Upstart Securitization Trust, Series 2019-3, Class B (c) 3�829% 01/21/30 600,000 613,086
Upstart Securitization Trust, Series 2021-2, Class B (c) 1�750% 06/20/31 1,000,000 999,972
23,720,541
Total Securitized(Cost $251,499,667) $253,848,665
Treasury — 17.6%U�S� Treasury
Notes (b) 2�000% 11/30/22 1,500,000 1,538,789U�S� Treasury
Bonds (b) 1�500% 03/31/23 1,225,000 1,252,323U�S� Treasury
Notes (b) 1�625% 04/30/23 100,000 102,531U�S� Treasury Notes 2�500% 05/15/24 750,000 794,443U�S� Treasury
Notes (b) 2�250% 11/15/24 250,000 264,277U�S� Treasury
STRIPS (b) 0�000% 02/15/25 300,000 292,853
Diamond Hill Core Bond Fund Schedule of Investments (Continued) June 30, 2021 (Unaudited)

DIAMOND HILL FUNDS | SEMI-ANNUAL REPORT | JUNE 30, 2021 | DIAMOND-HILL.COM 53
Coupon Maturity
Shares /
Par Value
Fair
Value
Treasury — 17.6% continuedU�S� Treasury
Notes (b) 2�000% 08/15/25 $ 1,000,000 $ 1,052,344U�S� Treasury
Notes (b) 2�250% 11/15/25 2,000,000 2,127,813U�S� Treasury
Notes (b) 1�625% 02/15/26 3,750,000 3,887,109U�S� Treasury
Notes (b) 0�625% 03/31/27 1,000,000 978,359U�S� Treasury
STRIPS 0�000% 05/15/28 1,000,000 913,637U�S� Treasury Notes 2�875% 08/15/28 2,000,000 2,224,297U�S� Treasury Notes 0�625% 08/15/30 4,563,900 4,251,915U�S� Treasury
Notes (b) 0�875% 11/15/30 7,500,000 7,132,031U�S� Treasury
STRIPS 0�000% 11/15/31 2,000,000 1,681,215U�S� Treasury
STRIPS 0�000% 02/15/33 800,000 651,267U�S� Treasury
STRIPS 0�000% 08/15/34 750,000 588,296U�S� Treasury
STRIPS 0�000% 05/15/35 3,000,000 2,311,232U�S� Treasury
STRIPS 0�000% 02/15/36 2,000,000 1,510,586U�S� Treasury
STRIPS 0�000% 02/15/37 3,000,000 2,209,163U�S� Treasury Notes 4�750% 02/15/37 150,000 212,930U�S� Treasury
STRIPS 0�000% 11/15/38 4,000,000 2,796,981U�S� Treasury Bonds 3�500% 02/15/39 235,000 293,961U�S� Treasury Bonds 4�250% 05/15/39 500,000 684,238U�S� Treasury Bonds 1�125% 08/15/40 7,200,000 6,194,250U�S� Treasury Bonds 3�875% 08/15/40 550,000 723,100U�S� Treasury Bonds 1�375% 11/15/40 1,000,000 898,281U�S� Treasury
Notes (b) 4�250% 11/15/40 1,050,000 1,448,426U�S� Treasury Bonds 4�750% 02/15/41 700,000 1,026,512U�S� Treasury
STRIPS (b) 0�000% 08/15/41 500,000 323,608U�S� Treasury Bonds 2�750% 11/15/42 600,000 675,633U�S� Treasury Bonds 3�750% 11/15/43 1,500,000 1,968,984U�S� Treasury Bonds 2�250% 08/15/46 1,780,000 1,840,492U�S� Treasury Bonds 3�000% 02/15/48 1,975,000 2,354,262U�S� Treasury Bonds 2�375% 11/15/49 1,750,000 1,863,477U�S� Treasury Bonds 2�000% 02/15/50 2,350,000 2,308,691U�S� Treasury Bonds 1�250% 05/15/50 10,050,000 8,206,061
Total Treasury(Cost $71,615,319) $ 69,584,367
Diamond Hill Core Bond Fund Schedule of Investments (Continued) June 30, 2021 (Unaudited)
Shares
Fair
Value
Registered Investment Companies — 5.3% State Street Institutional
Liquid Reserves Fund, Premier Class, 0�05% (f) 5,125,567 $ 5,127,105
State Street Navigator Securities Lending Portfolio I, 0�10% (f)(g) 15,759,760 15,759,760
Total Registered Investment Companies(Cost $20,884,187) $ 20,886,865
Total Investment Securities — 104.5% (Cost $411,052,281) $ 413,094,167
Liabilities in Excess of Other Assets — (4.5) % (17,818,658)
Net Assets — 100.0% $ 395,275,509
(a) Variable rate security� The rate shown is the effective interest rate as of June 30, 2021� The benchmark on which the rate is calculated is shown parenthetically, if applicable� Certain variable rate securities are not based on a published rate and spread but are determined by the issuer or agent and may be based on index changes, prepayment of underlying positions and/or other variables� These securities do not indicate a reference rate and spread in their description above�
(b) All or a portion of the security is on loan� The total fair value of the securities on loan as of June 30, 2021 was $23,204,522�
(c) Securities exempt from registration under Rule 144A of the Securities Act of 1933� These securities have been deemed liquid under procedures approved by the Fund’s Board of Trustees and may normallybesoldtoqualifiedinstitutionalbuyersintransactions exempt from registration� The total fair value of these securities as of June 30, 2021 was $153,253,437, representing 38�8% of net assets�
(d) Percentage rounds to less than 0�1%�(e) Illiquid security as determined under procedures
approved by the Board of Trustees� The total fair value of these securities as of June 30, 2021 was $1,392,467, representing 0�4% of net assets�
(f) The rate shown is the 7-day effective yield as of June 30, 2021�
(g) This security was purchased with cash collateral held from securities on loan�

54 DIAMOND HILL FUNDS | SEMI-ANNUAL REPORT | JUNE 30, 2021 | DIAMOND-HILL.COM
BV — Besloten VennootschapIO — Interest OnlyLIBOR — London Interbank Offered RateNA — National AssociationNV — Naamloze Vennootschapplc — Public Limited CompanyPO — Principal OnlyREIT — Real Estate Investment TrustSA — Societe AnonymeSOFR — Secured Overnight Financing RateUA — Uitgesloten Aansprakelijkheid
See accompanying Notes to Financial Statements�
Diamond Hill Core Bond Fund Schedule of Investments (Continued) June 30, 2021 (Unaudited)
Diamond Hill Corporate Credit Fund Schedule of Investments June 30, 2021 (Unaudited)
Coupon Maturity
Shares /
Par Value
Fair
Value
Common Stocks — 0.0%Energy — 0.0%Floatel International Ltd�
(Cost $1,138,496) (a)(b)(c) 687,166 $ 0
Warrants — 0.0%Floatel International Ltd�
(Cost $3,927,584) (a)(b) 662,476 $ 0
Collateralized Debt Obligations — 0.1%Financials — 0.1%Alesco Preferred
Funding Ltd�, Class PNNE * 03/23/35 $ 336,608 151,802
Alesco Preferred Funding Ltd� VI, Class PNN * 03/23/35 621,631 294,101
Fort Sheridan ABS CDO Ltd�, Series 05-1A, Class PPN2 * 11/05/41 611,948 348,619
Taberna Preferred Funding Ltd�, Class PPN2 * 07/05/35 1,175,564 555,481
Total Collateralized Debt Obligations(Cost $2,535,851) 1,350,003
Corporate Bonds — 90.1%Banking — 1.7%Popular, Inc� 6�125% 09/14/23 15,642,000 16,877,719Western Alliance
Bancorp (SOFR + 512) (d) 5�250% 06/01/30 11,135,000 12,093,966
Western Alliance Bancorp 3�000% 06/15/31 9,910,000 9,980,194
38,951,879
Basic Industry — 4.5%Ashland Global
Holdings, Inc� 6�875% 05/15/43 7,924,000 9,964,430Century
Communities, Inc� 5�875% 07/15/25 1,069,000 1,105,581First Quantum
Minerals Ltd� (e) 6�500% 03/01/24 10,271,000 10,476,420First Quantum
Minerals Ltd� (e) 7�500% 04/01/25 7,375,000 7,651,563GCP Applied
Technologies, Inc� (e) 5�500% 04/15/26 37,869,000 38,950,160
Schweitzer-Mauduit International, Inc� (e) 6�875% 10/01/26 31,152,000 32,982,180
101,130,334

DIAMOND HILL FUNDS | SEMI-ANNUAL REPORT | JUNE 30, 2021 | DIAMOND-HILL.COM 55
Diamond Hill Corporate Credit Fund Schedule of Investments (Continued) June 30, 2021 (Unaudited)
Coupon Maturity
Shares /
Par Value
Fair
Value
Financial Services — 13.0% continuedCredit Acceptance
Corp� (e) 5�125% 12/31/24 $ 13,914,000$ 14,418,382Credit Acceptance
Corp� (f) 6�625% 03/15/26 10,793,000 11,359,633Freedom Mortgage
Corp� (e) 8�125% 11/15/24 43,984,000 45,468,459Freedom Mortgage
Corp� (e) 8�250% 04/15/25 17,938,000 18,722,788Freedom Mortgage
Corp� (e) 7�625% 05/01/26 11,079,000 11,533,239Freedom Mortgage
Corp� (e) 6�625% 01/15/27 5,630,000 5,665,188Hightower
Holding LLC (e) 6�750% 04/15/29 12,137,000 12,379,740LD Holdings
Group LLC (e)(f) 6�500% 11/01/25 43,372,000 44,534,370LD Holdings
Group LLC (e)(f) 6�125% 04/01/28 20,124,000 20,098,845Nationstar
Mortgage LLC (e) 6�000% 01/15/27 8,554,000 8,864,339Quicken Loans
LLC (e) 5�250% 01/15/28 20,255,000 21,267,750United Wholesale
Mortgage LLC (e) 5�500% 04/15/29 39,167,000 39,157,992
294,825,532
Health Care — 8.1%Akumin, Inc� (e) 7�000% 11/01/25 29,085,000 30,195,756Davita, Inc� (e) 3�750% 02/15/31 17,984,000 17,264,640Endo Financial
LLC (e)(f) 5�875% 10/15/24 4,877,000 4,791,653Horizon Pharma
USA, Inc� (e) 5�500% 08/01/27 36,126,000 38,338,717Jaguar Holdings
Co� (e) 5�000% 06/15/28 2,696,000 2,922,248P&L Development
LLC (e) 7�750% 11/15/25 15,792,000 16,581,600Par Pharmaceutical,
Inc� (e) 7�500% 04/01/27 21,903,000 22,392,094Providence Service
Corp� (The) (e) 5�875% 11/15/25 18,875,000 20,196,250Syneos Health,
Inc� (e) 3�625% 01/15/29 31,882,000 31,563,180
184,246,138
Insurance — 6.7%Amwins Group,
Inc� (e) 7�750% 07/01/26 28,748,000 30,491,566AssuredPartners,
Inc� (e) 7�000% 08/15/25 32,528,000 33,219,220Broadstreet
Partners, Inc� (e) 5�875% 04/15/29 10,000,000 10,200,000MGIC Investment
Corp� 5�250% 08/15/28 26,552,000 28,145,121
Coupon Maturity
Shares /
Par Value
Fair
Value
Corporate Bonds — 90.1% continuedCapital Goods — 2.2%ATS Automation
Tooling Systems (e)(f) 4�125% 12/15/28 $ 20,990,000$ 21,488,513
TransDigm UK Holdings (f) 6�875% 05/15/26 12,917,000 13,627,435
TransDigm, Inc� (e) 6�250% 03/15/26 14,122,000 14,898,710
50,014,658
Consumer Goods — 4.0%C&S Group
Enterprises LLC (e) 5�000% 12/15/28 17,770,000 17,614,513Cooke Omega
Investments, Inc� / Alpha VesselCo Holdings, Inc� (e) 8�500% 12/15/22 26,774,000 27,476,817
Pilgrim’s Pride Corp� (e)(f) 5�875% 09/30/27 11,053,000 11,771,445
Post Holdings, Inc� (e) 5�500% 12/15/29 1,150,000 1,231,938Post Holdings, Inc� (e) 4�625% 04/15/30 5,779,000 5,876,261Turning Point
Brands, Inc� (e) 5�625% 02/15/26 15,799,000 16,312,467Vector Group (e) 5�750% 02/01/29 10,551,000 10,748,409
91,031,850
Energy — 10.2%Apergy Corp� 6�375% 05/01/26 21,500,000 22,519,099Energean Israel
Finance 5�375% 03/30/28 5,611,000 5,758,850Energen Corp� (b) 7�125% 02/15/28 22,389,000 27,242,165Floatel International
Ltd� 6�000% 09/24/26 1,600,000 712,000Floatel International
Ltd� 10�000% 09/24/26 1,600,000 632,000LBC Tank Terminals
Holdings Netherlands BV (e) 6�875% 05/15/23 12,321,000 12,290,198
Leviathan Energy 5�750% 06/30/23 995,000 1,040,002Leviathan Energy 6�500% 06/30/27 11,584,000 12,858,240Magnolia Oil &
Gas Corp� (e) 6�000% 08/01/26 52,581,000 54,224,156New Fortress
Energy, Inc� (e) 6�750% 09/15/25 35,291,000 36,129,162Rattler Midstream
LP (e) 5�625% 07/15/25 17,197,000 18,078,346Teine Energy Ltd� (e) 6�875% 04/15/29 12,155,000 12,474,069Welltec A/S (e) 9�500% 12/01/22 26,159,000 26,713,571
230,671,858
Financial Services — 13.0%Alliance Data
Systems Corp� (e)(f) 7�000% 01/15/26 22,898,000 24,529,482Burford Capital
Global Finance LLC (e)(f) 6�250% 04/15/28 16,020,000 16,825,325

56 DIAMOND HILL FUNDS | SEMI-ANNUAL REPORT | JUNE 30, 2021 | DIAMOND-HILL.COM
Coupon Maturity
Shares /
Par Value
Fair
Value
Corporate Bonds — 90.1% continuedInsurance — 6.7% continuedNational Financial
Partners Corp� (e) 4�875% 08/15/28 $ 6,360,000 $ 6,462,650National Financial
Partners Corp� (e) 6�875% 08/31/28 20,011,000 21,065,780USIS Merger
Subordinated, Inc� (e) 6�875% 05/01/25 21,640,000 21,911,149
151,495,486
Leisure — 10.0%Affinity Gaming (e) 6�875% 12/15/27 10,436,000 11,075,205Carnival Corp� (e) 11�500% 04/01/23 5,729,000 6,447,417Carnival Corp� (e)(f) 10�500% 02/01/26 4,830,000 5,623,328Live Nation
Entertainment, Inc� (e) 4�875% 11/01/24 16,049,000 16,305,784
Live Nation Entertainment, Inc� (e) 5�625% 03/15/26 11,918,000 12,411,172
Live Nation Entertainment, Inc� (e) 6�500% 05/15/27 5,001,000 5,550,110
Live Nation Entertainment, Inc� (e)(f) 3�750% 01/15/28 6,623,000 6,652,274
Midwest Gaming Borrower LLC (e) 4�875% 05/01/29 9,785,000 9,797,231
Peninsula Pacific Entertainment LLC (e) 8�500% 11/15/27 17,405,000 18,692,970
Playtika Holdings Corp� (e) 4�250% 03/15/29 20,204,000 20,190,059
Speedway Motorsports LLC (e)(f) 4�875% 11/01/27 13,691,000 13,810,796
Stars Group Holdings (e) 7�000% 07/15/26 31,156,000 32,247,705
Station Casinos LLC (e) 5�000% 10/01/25 19,174,000 19,461,610
Station Casinos LLC (e)(f) 4�500% 02/15/28 5,478,000 5,571,373
Viking Cruises Ltd� (e) 6�250% 05/15/25 19,134,000 19,038,329
Viking Cruises Ltd� (e) 13�000% 05/15/25 8,108,000 9,538,576
XHR LP (e) 6�375% 08/15/25 13,722,000 14,596,778
227,010,717
Media — 2.8%Cimpress plc (e) 7�000% 06/15/26 36,718,000 38,707,014Match Group, Inc� (e) 4�625% 06/01/28 14,907,000 15,501,342UPC Broadband
Finco BV (e) 4�875% 07/15/31 9,894,000 9,916,756
64,125,112
Coupon Maturity
Shares /
Par Value
Fair
Value
Real Estate — 1.5%Forestar Group,
Inc� (e) 5�000% 03/01/28 $ 9,462,000 $ 9,793,170New Residential
Investment Corp� (e) 6�250% 10/15/25 23,177,000 23,199,018
32,992,188
Retail — 8.5%Ambience Merger (e) 7�125% 07/15/29 8,939,000 9,028,390ANGI Group
LLC (e) 3�875% 08/15/28 35,336,000 35,115,150Carvana Co� (e) 5�625% 10/01/25 14,376,000 14,933,070GrubHub
Holdings, Inc� (e) 5�500% 07/01/27 32,385,000 34,044,731IRB Holding
Corp� (e) 7�000% 06/15/25 12,671,000 13,684,933Liberty Interactive
LLC 8�500% 07/15/29 8,971,000 10,223,531LSF9 Atlanta
Holdings / Victoria Financial (e) 7�750% 02/15/26 25,243,000 26,178,506
Nathan’s Famous, Inc� (e) 6�625% 11/01/25 22,628,000 23,221,985
QVC, Inc� 5�450% 08/15/34 23,925,000 24,915,615
191,345,911
Services — 4.1%Adtalem Escrow
Corp� (e) 5�500% 03/01/28 18,800,000 19,092,340Graham Holdings
Co� (e) 5�750% 06/01/26 5,674,000 5,900,960IAA Spinco, Inc� (e) 5�500% 06/15/27 12,427,000 13,044,870KAR Auction
Services, Inc� (e) 5�125% 06/01/25 13,737,000 14,096,909Korn Ferry
International (e) 4�625% 12/15/27 11,544,000 11,991,330Uber Technologies,
Inc� (e)(f) 8�000% 11/01/26 27,323,000 29,440,533
93,566,942
Technology & Electronics — 7.3%Black Knight
Infoserv LLC (e) 3�625% 09/01/28 24,942,000 24,816,292Clarivate Science
Holdings Corp� (e) 3�875% 06/30/28 7,000,000 7,063,770CoreLogic Inc� (e) 4�500% 05/01/28 8,700,000 8,623,875GoDaddy, Inc� (e) 3�500% 03/01/29 8,121,000 8,068,214Logan Merger
Sub, Inc� (e) 5�500% 09/01/27 27,442,000 28,403,842NCR Corp� (e) 5�000% 10/01/28 25,758,000 26,635,575Seagate Holdings (e) 4�091% 06/01/29 1,750,000 1,791,650Seagate Holdings (e) 3�125% 07/15/29 5,125,000 4,965,689Shift4 Payments
LLC (e) 4�625% 11/01/26 7,297,000 7,616,244
Diamond Hill Corporate Credit Fund Schedule of Investments (Continued) June 30, 2021 (Unaudited)

DIAMOND HILL FUNDS | SEMI-ANNUAL REPORT | JUNE 30, 2021 | DIAMOND-HILL.COM 57
Coupon Maturity
Shares /
Par Value
Fair
Value
Corporate Bonds — 90.1% continuedTechnology & Electronics — 7.3% continuedTrinet Group, Inc� (e) 3�500% 03/01/29 $ 26,762,000$ 26,387,332ZoomInfo
Technologies LLC (e) 3�875% 02/01/29 21,872,000 21,735,300
166,107,783
Telecommunications — 5.0%CB Escrow Corp� (e) 8�000% 10/15/25 18,088,000 19,015,010Cogent
Communications Holdings, Inc� (e)(f) 3�500% 05/01/26 8,980,000 9,182,050
Frontier Communications Corp� (e) 5�875% 10/15/27 7,743,000 8,294,689
HTA Group Ltd� (e)(f) 7�000% 12/18/25 18,575,000 19,759,714LCPR Senior
Secured Financing Designated Activity Co� (e) 6�750% 10/15/27 16,422,000 17,697,989
Viasat, Inc� (e) 5�625% 09/15/25 16,985,000 17,307,715Viasat, Inc� (e) 5�625% 04/15/27 20,456,000 21,352,586
112,609,753
Transportation — 0.5%Air Canada, Series
2020-2, Class A (e) 5�250% 10/01/30 6,542,233 7,094,331Air Canada,
Series 2017-1, Class AA (e) 3�300% 07/15/31 3,012,760 3,047,970
United Airlines Pass-Through Trust, Series 2013-1, Class B 5�375% 02/15/23 170,271 171,126
United Airlines, Inc� (e) 4�625% 04/15/29 1,636,000 1,693,260
12,006,687
Total Corporate Bonds(Cost $2,001,013,244) $2,042,132,828
Diamond Hill Corporate Credit Fund Schedule of Investments (Continued) June 30, 2021 (Unaudited)
Shares
Fair
Value
Registered Investment Companies — 10.2%State Street Institutional US
Government Money Market Fund, Premier Class, 0�03% (g) 200,802,988 $ 200,802,988
State Street Navigator Securities Lending Portfolio I, 0�10% (g)(h) 31,054,575 31,054,575
Total Registered Investment Companies(Cost $231,857,563) $ 231,857,563
Total Investment Securities — 100.4% (Cost $2,240,472,738) $ 2,275,340,394
Liabilities in Excess of Other Assets — (0.4) % (9,595,623)
Net Assets — 100.0% $ 2,265,744,771
(a) Security fair valued under procedures established by the Board of Trustees� The total value of these securities is $0�
(b) Illiquid security as determined under procedures approved by the Board of Trustees� The total fair value of these securities as of June 30, 2021 was $27,242,165, representing 1�2% of net assets�
(c) Non-income producing security�(d) Variable rate security� The rate shown is the effective
interest rate as of June 30, 2021� The benchmark on which the rate is calculated is shown parenthetically, if applicable� Certain variable rate securities are not based on a published rate and spread but are determined by the issuer or agent and may be based on index changes, prepayment of underlying positions and/or other variables� These securities do not indicate a reference rate and spread in their description above�
(e) Securities exempt from registration under Rule 144A of the Securities Act of 1933� These securities have been deemed liquid under procedures approved by the Fund’s Board of Trustees and may normallybesoldtoqualifiedinstitutionalbuyersintransactions exempt from registration� The total fair value of these securities as of June 30, 2021 was $1,832,906,121, representing 80�9% of net assets�
(f) All or a portion of the security is on loan� The total fair value of the securities on loan as of June 30, 2021 was $30,360,474�
(g) The rate shown is the 7-day effective yield as of June 30, 2021�
(h) This security was purchased with cash collateral held from securities on loan�
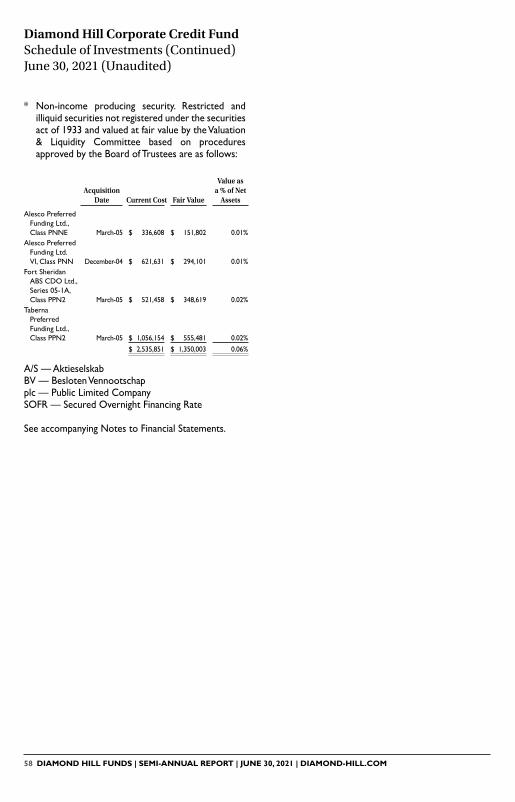
58 DIAMOND HILL FUNDS | SEMI-ANNUAL REPORT | JUNE 30, 2021 | DIAMOND-HILL.COM
* Non-income producing security� Restricted and illiquid securities not registered under the securities act of 1933 and valued at fair value by the Valuation & Liquidity Committee based on procedures approved by the Board of Trustees are as follows:
Acquisition Date Current Cost Fair Value
Value as a % of Net
Assets
Alesco Preferred Funding Ltd�, Class PNNE March-05 $ 336,608 $ 151,802 0�01%
Alesco Preferred Funding Ltd� VI, Class PNN December-04 $ 621,631 $ 294,101 0�01%
Fort Sheridan ABS CDO Ltd�, Series 05-1A, Class PPN2 March-05 $ 521,458 $ 348,619 0�02%
Taberna Preferred Funding Ltd�, Class PPN2 March-05 $ 1,056,154 $ 555,481 0�02%
$ 2,535,851 $ 1,350,003 0�06%
A/S — AktieselskabBV — Besloten Vennootschapplc — Public Limited CompanySOFR — Secured Overnight Financing Rate
See accompanying Notes to Financial Statements�
Diamond Hill Corporate Credit Fund Schedule of Investments (Continued) June 30, 2021 (Unaudited)

DIAMOND HILL FUNDS | SEMI-ANNUAL REPORT | JUNE 30, 2021 | DIAMOND-HILL.COM 59
Diamond Hill High Yield Fund Schedule of Investments June 30, 2021 (Unaudited)
Coupon Maturity
Shares /
Par Value
Fair
Value
Common Stocks — 0.0%Energy — 0.0%Floatel International Ltd�
(Cost $106,733) (a)(b)(c) 64,421 $ 0
Warrants — 0.0%Floatel International Ltd�
(Cost $693,103) (a)(b) 116,908 $ 0
Corporate Bonds — 94.9%Banking — 1.0%Cadence Bancorp
(3MO LIBOR + 303) (d) 4�750% 06/30/29 $ 10,750,000 11,222,393
Basic Industry — 4.2%Brundage-Bond
Concrete Pumping (e) 6�000% 02/01/26 7,795,000 8,205,796
First Quantum Minerals Ltd� (e) 7�250% 04/01/23 6,693,000 6,822,710
First Quantum Minerals Ltd� (e) 7�500% 04/01/25 4,000,000 4,150,000
GCP Applied Technologies, Inc� (e) 5�500% 04/15/26 14,000,000 14,399,700
Schweitzer-Mauduit International, Inc� (e) 6�875% 10/01/26 14,230,000 15,066,013
48,644,219
Capital Goods — 1.9%ATS Automation
Tooling Systems (e) 4�125% 12/15/28 12,312,000 12,604,410TransDigm, Inc� 6�375% 06/15/26 7,862,000 8,144,796Welbilt, Inc� 9�500% 02/15/24 1,000,000 1,047,200
21,796,406
Consumer Goods — 5.4%C&S Group
Enterprises LLC (e)(f) 5�000% 12/15/28 11,700,000 11,597,625
Cooke Omega Investments, Inc� / Alpha VesselCo Holdings, Inc� (e) 8�500% 12/15/22 12,200,000 12,520,250
Peleton Interactive, Inc� (e) 0�000% 02/15/26 2,000,000 1,933,750
Pilgrim’s Pride Corp� (e) 5�875% 09/30/27 8,500,000 9,052,500
Turning Point Brands, Inc� (e) 5�625% 02/15/26 10,525,000 10,867,063
Vector Group Ltd� (e) 10�500% 11/01/26 14,502,000 15,390,248
61,361,436
Energy — 13.1%Apergy Corp� 6�375% 05/01/26 8,896,000 9,317,670
Coupon Maturity
Shares /
Par Value
Fair
Value
Energy — 13.1% continuedBonanza Creek
Energy, Inc� 7�500% 04/30/26 $ 2,126,354 $ 2,141,196Delek Overriding
Royalty Leviathan Ltd� 7�494% 12/30/23 10,863,000 11,101,986
Encino Acquisition Partners (e)(f) 8�500% 05/01/28 6,840,000 6,976,800
Energean Israel Finance 4�500% 03/30/24 400,000 408,500
Energean Israel Finance 4�875% 03/30/26 400,000 409,508
Energean Israel Finance 5�875% 03/30/31 8,977,000 9,219,379
Energen Corp� 7�125% 02/15/28 4,375,000 5,323,350Floatel International
Ltd� 6�000% 09/24/26 150,000 66,750Floatel International
Ltd� 10�000% 09/24/26 150,000 59,250LBC Tank Terminals
Holdings Netherlands BV (e) 6�875% 05/15/23 10,000,000 9,975,000
Leviathan Energy 6�750% 06/30/30 7,605,000 8,574,637Magnolia Oil &
Gas Corp� (e) 6�000% 08/01/26 23,500,000 24,234,375New Fortress
Energy, Inc� (e) 6�750% 09/15/25 14,000,000 14,332,500New Fortress
Energy, Inc� (e) 6�500% 09/30/26 7,633,000 7,799,399Solaris Midstream
Holdings (e)(f) 7�625% 04/01/26 8,439,000 8,945,340Talo Production, Inc� 12�000% 01/15/26 3,597,000 3,830,805Teine Energy Ltd� (e) 6�875% 04/15/29 9,500,000 9,749,375Viper Energy
Partners LP (e)(f) 5�375% 11/01/27 3,501,000 3,647,027Welltec A/S (e) 9�500% 12/01/22 14,300,000 14,603,160
150,716,007
Financial Services — 15.2%Alliance Data
Systems Corp� (e) 7�000% 01/15/26 16,650,000 17,836,312Burford Capital
Global Finance LLC (e) 6�250% 04/15/28 10,750,000 11,290,402
Cargo Aircraft Management, Inc� (e) 4�750% 02/01/28 9,175,000 9,356,940
Credit Acceptance Corp� (e) 5�125% 12/31/24 1,500,000 1,554,375
Credit Acceptance Corp� (f) 6�625% 03/15/26 10,250,000 10,788,125
Freedom Mortgage Corp� (e) 8�125% 11/15/24 13,500,000 13,955,625

60 DIAMOND HILL FUNDS | SEMI-ANNUAL REPORT | JUNE 30, 2021 | DIAMOND-HILL.COM
Coupon Maturity
Shares /
Par Value
Fair
Value
Insurance — 7.2% continuedUSIS Merger
Subordinated, Inc� (e) 6�875% 05/01/25 $ 8,000,000 $ 8,100,240
82,184,012
Leisure — 12.4%Affinity Gaming (e) 6�875% 12/15/27 6,700,000 7,110,375Carnival Corp� (e)(f) 10�500% 02/01/26 8,000,000 9,314,000CCM Merger, Inc� (e) 6�375% 05/01/26 6,389,000 6,708,450Golden Nugget,
Inc� (e) 6�750% 10/15/24 4,764,000 4,812,688Live Nation
Entertainment, Inc� (e) 4�875% 11/01/24 4,500,000 4,572,000
Live Nation Entertainment, Inc� (e) 5�625% 03/15/26 11,600,000 12,080,013
Midwest Gaming Borrower LLC (e) 4�875% 05/01/29 8,700,000 8,710,875
Peninsula Pacific Entertainment LLC (e) 8�500% 11/15/27 15,250,000 16,378,500
Playtika Holdings Corp� (e) 4�250% 03/15/29 15,000,000 14,989,650
Speedway Motorsports LLC (e) 4�875% 11/01/27 10,000,000 10,087,500
Stars Group Holdings (e) 7�000% 07/15/26 12,250,000 12,679,240
Station Casinos LLC (e) 5�000% 10/01/25 4,700,000 4,770,500
Vail Resorts, Inc� (e)(f) 0�000% 01/01/26 1,000,000 1,037,500Viking Cruises
Ltd� (e) 6�250% 05/15/25 12,225,000 12,163,875Viking Cruises
Ltd� (e) 13�000% 05/15/25 7,300,000 8,588,012XHR LP (e) 6�375% 08/15/25 7,803,000 8,300,441
142,303,619
Media — 3.1%Cimpress plc (e) 7�000% 06/15/26 16,000,000 16,866,720Match Group, Inc� (e) 4�125% 08/01/30 9,365,000 9,528,888UPC Broadband
Finco BV (e) 4�875% 07/15/31 8,560,000 8,579,688
34,975,296
Real Estate — 1.6%Forestar Group,
Inc� (e) 5�000% 03/01/28 2,625,000 2,716,875New Residential
Investment Corp� (e) 6�250% 10/15/25 16,100,000 16,115,295
18,832,170
Coupon Maturity
Shares /
Par Value
Fair
Value
Corporate Bonds — 94.9% continuedFinancial Services — 15.2% continuedFreedom Mortgage
Corp� (e) 8�250% 04/15/25 $ 10,800,000$ 11,272,500Freedom Mortgage
Corp� (e) 7�625% 05/01/26 12,500,000 13,012,500Freedom Mortgage
Corp� (e) 6�625% 01/15/27 9,000,000 9,056,250Hightower
Holding LLC (e) 6�750% 04/15/29 9,850,000 10,047,000LD Holdings
Group LLC (e) 6�500% 11/01/25 2,500,000 2,567,000LD Holdings
Group LLC (e) 6�125% 04/01/28 25,000,000 24,968,750Midcap Financial
Issuer Trust (e) 6�500% 05/01/28 2,000,000 2,093,080Nationstar
Mortgage LLC (e) 6�000% 01/15/27 5,100,000 5,285,028Nationstar
Mortgage LLC (e) 5�500% 08/15/28 4,655,000 4,692,845United Wholesale
Mortgage LLC (e) 5�500% 04/15/29 26,750,000 26,743,848
174,520,580
Health Care — 7.2%Akumin, Inc� (e) 7�000% 11/01/25 17,600,000 18,272,144Davita, Inc� (e) 3�750% 02/15/31 9,750,000 9,360,000Endo Finance
LLC (e) 5�750% 01/15/22 5,555,000 5,124,487Horizon Pharma
USA, Inc� (e) 5�500% 08/01/27 10,600,000 11,249,250P&L Development
LLC (e) 7�750% 11/15/25 11,000,000 11,550,000Par Pharmaceutical,
Inc� (e) 7�500% 04/01/27 4,700,000 4,804,951Providence Service
Corp� (The) (e) 5�875% 11/15/25 6,800,000 7,276,000Syneos Health,
Inc� (e) 3�625% 01/15/29 15,200,000 15,048,000
82,684,832
Insurance — 7.2%Amwins Group,
Inc� (e) 7�750% 07/01/26 7,723,000 8,191,400AssuredPartners,
Inc� (e) 7�000% 08/15/25 12,990,000 13,266,037Broadstreet
Partners, Inc� (e) 5�875% 04/15/29 8,725,000 8,899,500GTCR AP
Finance, Inc� (e) 8�000% 05/15/27 6,537,000 6,961,905Hub International
Ltd� (e) 7�000% 05/01/26 6,440,000 6,678,860MGIC Investment
Corp� 5�250% 08/15/28 11,500,000 12,190,000National Financial
Partners Corp� (e) 6�875% 08/31/28 17,000,000 17,896,070
Diamond Hill High Yield Fund Schedule of Investments (Continued) June 30, 2021 (Unaudited)
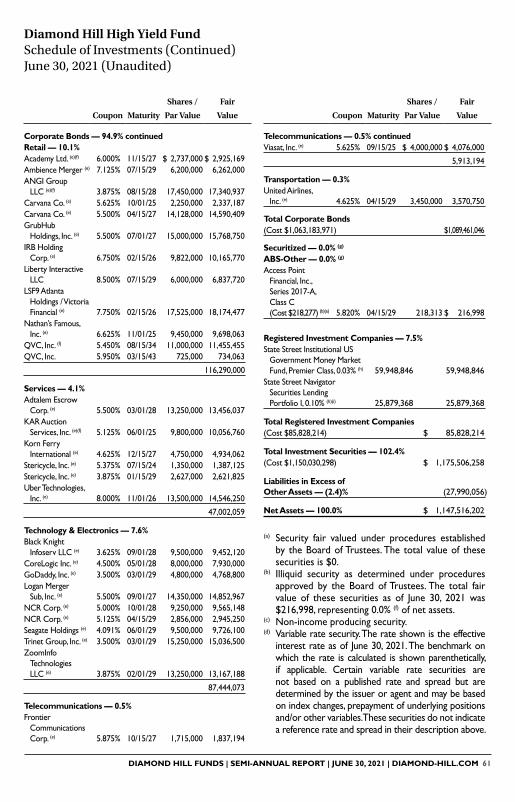
DIAMOND HILL FUNDS | SEMI-ANNUAL REPORT | JUNE 30, 2021 | DIAMOND-HILL.COM 61
Coupon Maturity
Shares /
Par Value
Fair
Value
Corporate Bonds — 94.9% continuedRetail — 10.1%Academy Ltd� (e)(f) 6�000% 11/15/27 $ 2,737,000 $ 2,925,169Ambience Merger (e) 7�125% 07/15/29 6,200,000 6,262,000ANGI Group
LLC (e)(f) 3�875% 08/15/28 17,450,000 17,340,937Carvana Co� (e) 5�625% 10/01/25 2,250,000 2,337,187Carvana Co� (e) 5�500% 04/15/27 14,128,000 14,590,409GrubHub
Holdings, Inc� (e) 5�500% 07/01/27 15,000,000 15,768,750IRB Holding
Corp� (e) 6�750% 02/15/26 9,822,000 10,165,770Liberty Interactive
LLC 8�500% 07/15/29 6,000,000 6,837,720LSF9 Atlanta
Holdings / Victoria Financial (e) 7�750% 02/15/26 17,525,000 18,174,477
Nathan’s Famous, Inc� (e) 6�625% 11/01/25 9,450,000 9,698,063
QVC, Inc� (f) 5�450% 08/15/34 11,000,000 11,455,455QVC, Inc� 5�950% 03/15/43 725,000 734,063
116,290,000
Services — 4.1%Adtalem Escrow
Corp� (e) 5�500% 03/01/28 13,250,000 13,456,037KAR Auction
Services, Inc� (e)(f) 5�125% 06/01/25 9,800,000 10,056,760Korn Ferry
International (e) 4�625% 12/15/27 4,750,000 4,934,062Stericycle, Inc� (e) 5�375% 07/15/24 1,350,000 1,387,125Stericycle, Inc� (e) 3�875% 01/15/29 2,627,000 2,621,825Uber Technologies,
Inc� (e) 8�000% 11/01/26 13,500,000 14,546,250
47,002,059
Technology & Electronics — 7.6%Black Knight
Infoserv LLC (e) 3�625% 09/01/28 9,500,000 9,452,120CoreLogic Inc� (e) 4�500% 05/01/28 8,000,000 7,930,000GoDaddy, Inc� (e) 3�500% 03/01/29 4,800,000 4,768,800Logan Merger
Sub, Inc� (e) 5�500% 09/01/27 14,350,000 14,852,967NCR Corp� (e) 5�000% 10/01/28 9,250,000 9,565,148NCR Corp� (e) 5�125% 04/15/29 2,856,000 2,945,250Seagate Holdings (e) 4�091% 06/01/29 9,500,000 9,726,100Trinet Group, Inc� (e) 3�500% 03/01/29 15,250,000 15,036,500ZoomInfo
Technologies LLC (e) 3�875% 02/01/29 13,250,000 13,167,188
87,444,073
Telecommunications — 0.5%Frontier
Communications Corp� (e) 5�875% 10/15/27 1,715,000 1,837,194
Coupon Maturity
Shares /
Par Value
Fair
Value
Telecommunications — 0.5% continuedViasat, Inc� (e) 5�625% 09/15/25 $ 4,000,000 $ 4,076,000
5,913,194
Transportation — 0.3%United Airlines,
Inc� (e) 4�625% 04/15/29 3,450,000 3,570,750
Total Corporate Bonds(Cost $1,063,183,971) $1,089,461,046
Securitized — 0.0% (g)
ABS-Other — 0.0% (g)
Access Point Financial, Inc�, Series 2017-A, Class C (Cost $218,277) (b)(e) 5�820% 04/15/29 218,313 $ 216,998
Registered Investment Companies — 7.5% State Street Institutional US
Government Money Market Fund, Premier Class, 0�03% (h) 59,948,846 59,948,846
State Street Navigator Securities Lending Portfolio I, 0�10% (h)(i) 25,879,368 25,879,368
Total Registered Investment Companies(Cost $85,828,214) $ 85,828,214
Total Investment Securities — 102.4% (Cost $1,150,030,298) $ 1,175,506,258
Liabilities in Excess of Other Assets — (2.4)% (27,990,056)
Net Assets — 100.0% $ 1,147,516,202
(a) Security fair valued under procedures established by the Board of Trustees� The total value of these securities is $0�
(b) Illiquid security as determined under procedures approved by the Board of Trustees� The total fair value of these securities as of June 30, 2021 was $216,998, representing 0�0% (f) of net assets�
(c) Non-income producing security�(d) Variable rate security� The rate shown is the effective
interest rate as of June 30, 2021� The benchmark on which the rate is calculated is shown parenthetically, if applicable� Certain variable rate securities are not based on a published rate and spread but are determined by the issuer or agent and may be based on index changes, prepayment of underlying positions and/or other variables� These securities do not indicate a reference rate and spread in their description above�
Diamond Hill High Yield Fund Schedule of Investments (Continued) June 30, 2021 (Unaudited)

62 DIAMOND HILL FUNDS | SEMI-ANNUAL REPORT | JUNE 30, 2021 | DIAMOND-HILL.COM
Diamond Hill High Yield Fund Schedule of Investments (Continued) June 30, 2021 (Unaudited)
(e) Securities exempt from registration under Rule 144A of the Securities Act of 1933� These securities have been deemed liquid under procedures approved by the Fund’s Board of Trustees and may normallybesoldtoqualifiedinstitutionalbuyersintransactions exempt from registration� The total fair value of these securities as of June 30, 2021 was $976,805,261, representing 85�1% of net assets�
(f) All or a portion of the security is on loan� The total fair value of the securities on loan as of June 30, 2021 was $24,963,554�
(g) Percentage rounds to less than 0�1%�(h) The rate shown is the 7-day effective yield as of June
30, 2021�(i) This security was purchased with cash collateral
held from securities on loan�
A/S — AktieselskabBV — Besloten VennootschapLIBOR — London Interbank Offered Rateplc — Public Limited Company
See accompanying Notes to Financial Statements�

DIAMOND HILL FUNDS | SEMI-ANNUAL REPORT | JUNE 30, 2021 | DIAMOND-HILL.COM 63
Diamond Hill Funds Tabular Presentation of Schedules of Investments June 30, 2021 (Unaudited)
Diamond Hill Small Cap Fund
Sector Allocation% of
Net Assets
Financials 28�8%Industrials 16�9%Consumer Discretionary 16�1%Consumer Staples 11�3%Materials 5�4%Real Estate 4�6%Information Technology 4�2%Energy 3�0%Utilities 2�6%Health Care 2�5%Communication Services 1�9%Registered Investment Companies 9�4%Other
Net Other Assets (Liabilities) -6�7%100�0%
Russell 2000 Index Sector Allocation
% of Index
Financials 14�8%Industrials 14�1%Consumer Discretionary 12�0%Consumer Staples 3�2%Materials 3�8%Real Estate 6�9%Information Technology 13�6%Energy 4�3%Utilities 2�4%Health Care 21�2%Communication Services 3�7%
100�0%
Diamond Hill Small-Mid Cap Fund
Sector Allocation% of
Net Assets
Financials 25�7%Industrials 18�3%Consumer Discretionary 16�9%Consumer Staples 8�4%Real Estate 7�3%Utilities 4�3%Information Technology 3�5%Materials 3�1%Energy 2�5%Health Care 2�4%Communication Services 1�1%Registered Investment Companies 10�5%Other
Net Other Assets (Liabilities) -4�0%100�0%
Russell 2500 Index Sector Allocation
% of Index
Financials 13�7%Industrials 15�8%Consumer Discretionary 12�8%Consumer Staples 3�1%Real Estate 8�2%Utilities 2�4%Information Technology 16�3%Materials 5�3%Energy 3�6%Health Care 15�8%Communication Services 3�0%
100�0%

64 DIAMOND HILL FUNDS | SEMI-ANNUAL REPORT | JUNE 30, 2021 | DIAMOND-HILL.COM
Diamond Hill Funds Tabular Presentation of Schedules of Investments (Continued) June 30, 2021 (Unaudited)
Diamond Hill Mid Cap Fund
Sector Allocation% of
Net Assets
Financials 27�5%Consumer Discretionary 16�6%Industrials 16�4%Consumer Staples 7�8%Real Estate 7�6%Information Technology 5�8%Utilities 4�1%Materials 3�4%Energy 1�9%Health Care 1�8%Communication Services 1�1%Registered Investment Companies 6�0%Other
Net Other Assets (Liabilities) 0�0%*100�0%
Russell Midcap Index Sector Allocation
% of Index
Financials 11�8%Consumer Discretionary 12�8%Industrials 15�4%Consumer Staples 3�5%Real Estate 7�3%Information Technology 18�7%Utilities 4�5%Materials 5�4%Energy 3�8%Health Care 12�0%Communication Services 4�8%
100�0%
* Percentage rounds to less than 0�1%�
Diamond Hill Large Cap Fund
Sector Allocation% of
Net Assets
Financials 27�1%Health Care 12�6%Consumer Discretionary 11�1%Communication Services 10�8%Consumer Staples 10�4%Industrials 8�2%Information Technology 6�2%Materials 4�7%Real Estate 3�6%Energy 2�3%Utilities 1�2%Registered Investment Companies 1�9%Other
Net Other Assets (Liabilities) -0�1%100�0%
Russell 1000 Index Sector Allocation
% of Index
Financials 11�4%Health Care 13�1%Consumer Discretionary 12�3%Communication Services 10�6%Consumer Staples 5�5%Industrials 9�1%Information Technology 27�6%Materials 2�4%Real Estate 3�1%Energy 2�7%Utilities 2�2%
100�0%
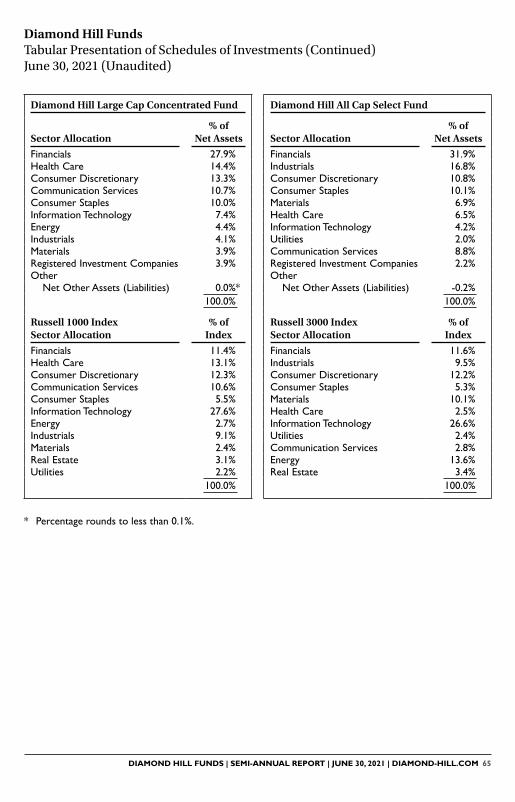
DIAMOND HILL FUNDS | SEMI-ANNUAL REPORT | JUNE 30, 2021 | DIAMOND-HILL.COM 65
Diamond Hill Funds Tabular Presentation of Schedules of Investments (Continued) June 30, 2021 (Unaudited)
Diamond Hill Large Cap Concentrated Fund
Sector Allocation% of
Net Assets
Financials 27�9%Health Care 14�4%Consumer Discretionary 13�3%Communication Services 10�7%Consumer Staples 10�0%Information Technology 7�4%Energy 4�4%Industrials 4�1%Materials 3�9%Registered Investment Companies 3�9%Other
Net Other Assets (Liabilities) 0�0%*100�0%
Russell 1000 Index Sector Allocation
% of Index
Financials 11�4%Health Care 13�1%Consumer Discretionary 12�3%Communication Services 10�6%Consumer Staples 5�5%Information Technology 27�6%Energy 2�7%Industrials 9�1%Materials 2�4%Real Estate 3�1%Utilities 2�2%
100�0%
* Percentage rounds to less than 0�1%�
Diamond Hill All Cap Select Fund
Sector Allocation% of
Net Assets
Financials 31�9%Industrials 16�8%Consumer Discretionary 10�8%Consumer Staples 10�1%Materials 6�9%Health Care 6�5%Information Technology 4�2%Utilities 2�0%Communication Services 8�8%Registered Investment Companies 2�2%Other
Net Other Assets (Liabilities) -0�2%100�0%
Russell 3000 Index Sector Allocation
% of Index
Financials 11�6%Industrials 9�5%Consumer Discretionary 12�2%Consumer Staples 5�3%Materials 10�1%Health Care 2�5%Information Technology 26�6%Utilities 2�4%Communication Services 2�8%Energy 13�6%Real Estate 3�4%
100�0%

66 DIAMOND HILL FUNDS | SEMI-ANNUAL REPORT | JUNE 30, 2021 | DIAMOND-HILL.COM
Diamond Hill Funds Tabular Presentation of Schedules of Investments (Continued) June 30, 2021 (Unaudited)
Diamond Hill Long-Short Fund
Long Portfolio Sector Allocation
% of Net Assets
Financials 27�3%Communication Services 11�3%Health Care 11�3%Information Technology 10�4%Industrials 9�9%Consumer Discretionary 6�8%Consumer Staples 4�7%Materials 3�6%Energy 3�2%Utilities 1�4%Registered Investment Companies 28�6%
Short Portfolio Sector Allocation
% of Net Assets
Consumer Discretionary -7�0%Financials -5�0%Information Technology -5�0%Industrials -4�9%Consumer Staples -4�0%Health Care -2�4%Utilities -1�2%Communication Services -1�0%Materials -0�3%Other
Segregated Cash With Custodian 31�4%Net Other Assets (Liabilities) -19�1%
100�0%
Russell 1000 Index Sector Allocation
% of Index
Financials 11�4%Communication Services 13�1%Health Care 10�6%Information Technology 27�6%Industrials 9�1%Consumer Discretionary 12�3%Consumer Staples 5�5%Materials 2�4%Energy 2�7%Utilities 2�4%Real Estate 2�9%
100�0%
Diamond Hill Global Fund
Sector Allocation% of
Net Assets
Communication Services 25�9%Consumer Staples 21�6%Information Technology 13�4%Financials 13�3%Health Care 10�6%Consumer Discretionary 7�3%Energy 3�7%Industrials 1�6%Registered Investment Companies 3�3%Other
Net Other Assets (Liabilities) -0�7%100�0%
Morningstar Global Markets Index Sector Allocation
% of Index
Communication Services 8�7%Consumer Staples 6�6%Information Technology 20�5%Financials 14�1%Health Care 11�5%Consumer Discretionary 12�9%Energy 3�3%Industrials 11�1%Materials 5�4%Real Estate 3�4%Utilities 2�5%
100�0%
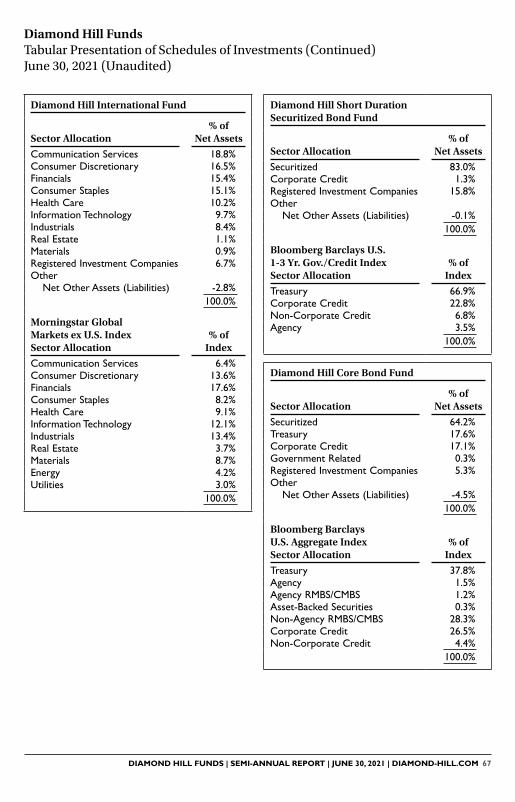
DIAMOND HILL FUNDS | SEMI-ANNUAL REPORT | JUNE 30, 2021 | DIAMOND-HILL.COM 67
Diamond Hill Funds Tabular Presentation of Schedules of Investments (Continued) June 30, 2021 (Unaudited)
Diamond Hill International Fund
Sector Allocation% of
Net Assets
Communication Services 18�8%Consumer Discretionary 16�5%Financials 15�4%Consumer Staples 15�1%Health Care 10�2%Information Technology 9�7%Industrials 8�4%Real Estate 1�1%Materials 0�9%Registered Investment Companies 6�7%Other
Net Other Assets (Liabilities) -2�8%100�0%
Morningstar Global Markets ex U.S. Index Sector Allocation
% of Index
Communication Services 6�4%Consumer Discretionary 13�6%Financials 17�6%Consumer Staples 8�2%Health Care 9�1%Information Technology 12�1%Industrials 13�4%Real Estate 3�7%Materials 8�7%Energy 4�2%Utilities 3�0%
100�0%
Diamond Hill Short Duration Securitized Bond Fund
Sector Allocation% of
Net Assets
Securitized 83�0%Corporate Credit 1�3%Registered Investment Companies 15�8%Other
Net Other Assets (Liabilities) -0�1%100�0%
Bloomberg Barclays U.S. 1-3 Yr. Gov./Credit Index Sector Allocation
% of Index
Treasury 66�9%Corporate Credit 22�8%Non-Corporate Credit 6�8%Agency 3�5%
100�0%
Diamond Hill Core Bond Fund
Sector Allocation% of
Net Assets
Securitized 64�2%Treasury 17�6%Corporate Credit 17�1%Government Related 0�3%Registered Investment Companies 5�3%Other
Net Other Assets (Liabilities) -4�5%100�0%
Bloomberg Barclays U.S. Aggregate Index Sector Allocation
% of Index
Treasury 37�8%Agency 1�5%Agency RMBS/CMBS 1�2%Asset-Backed Securities 0�3%Non-Agency RMBS/CMBS 28�3%Corporate Credit 26�5%Non-Corporate Credit 4�4%
100�0%

68 DIAMOND HILL FUNDS | SEMI-ANNUAL REPORT | JUNE 30, 2021 | DIAMOND-HILL.COM
Diamond Hill Funds Tabular Presentation of Schedules of Investments (Continued) June 30, 2021 (Unaudited)
Diamond Hill Corporate Credit Fund
Sector Allocation% of
Net Assets
Financial Services 13�0%Energy 10�2%Leisure 10�0%Retail 8�5%Health Care 8�1%Technology & Electronics 7�3%Insurance 6�7%Telecommunications 5�0%Basic Industry 4�5%Services 4�1%Consumer Goods 4�0%Media 2�8%Capital Goods 2�2%Banking 1�7%Real Estate 1�5%Transportation 0�5%Registered Investment Companies 10�2%Other
Collateralized Debt Obligations 0�1%Net Other Assets (Liabilities) -0�4%
100�0%
ICE BofA U.S. Corporate & High Yield Index Sector Allocation
% of Index
Financial Services 7�7%Energy 10�2%Leisure 1�4%Retail 3�9%Health Care 9�4%Technology & Electronics 6�3%Insurance 3�9%Telecommunications 4�8%Basic Industry 4�5%Services 1�8%Consumer Goods 5�5%Media 4�6%Capital Goods 5�3%Banking 14�0%Real Estate 3�4%Transportation 2�4%Utilities 8�0%Automotive 2�9%
100�0%
Diamond Hill High Yield Fund
Sector Allocation% of
Net Assets
Financial Services 15�2%Energy 13�1%Leisure 12�4%Retail 10�1%Technology & Electronics 7�6%Health Care 7�2%Insurance 7�2%Consumer Goods 5�4%Basic Industry 4�2%Services 4�1%Media 3�1%Capital Goods 1�9%Real Estate 1�6%Banking 1�0%Telecommunications 0�5%Transportation 0�3%Securitized 0�0%*Registered Investment Companies 7�5%Other
Net Other Assets (Liabilities) -2�4%100�0%
ICE BofA U.S. High Yield Index Sector Allocation
% of Index
Financial Services 4�3%Energy 13�6%Leisure 6�7%Retail 4�9%Technology & Electronics 4�8%Health Care 8�7%Insurance 1�1%Consumer Goods 4�8%Basic Industry 8�1%Services 5�3%Media 8�9%Capital Goods 6�4%Real Estate 4�2%Banking 1�4%Telecommunications 7�0%Transportation 1�9%Automotive 5�0%Utilities 2�9%
100�0%
* Percentage rounds to less than 0�1%�

DIAMOND HILL FUNDS | SEMI-ANNUAL REPORT | JUNE 30, 2021 | DIAMOND-HILL.COM 69
(Page intentionally left blank)
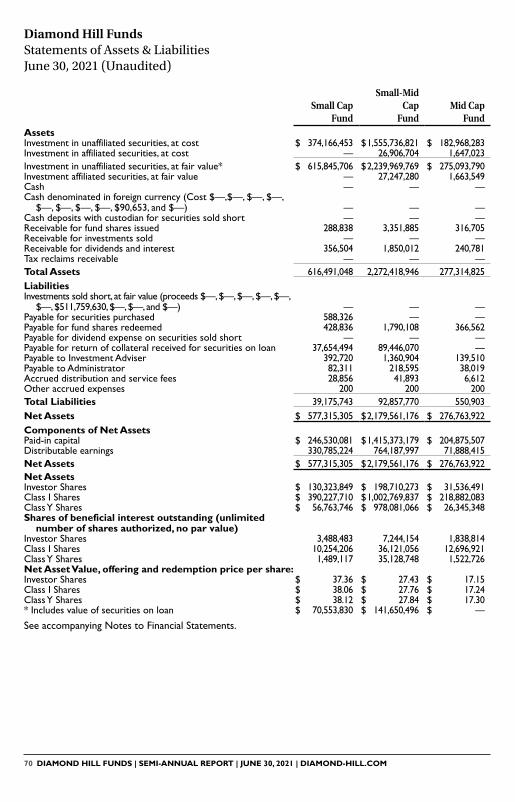
70 DIAMOND HILL FUNDS | SEMI-ANNUAL REPORT | JUNE 30, 2021 | DIAMOND-HILL.COM
Diamond Hill Funds Statements of Assets & Liabilities June 30, 2021 (Unaudited)
Small Cap Fund
Small-Mid Cap
FundMid Cap
FundLarge Cap
Fund
Large Cap Concentrated
Fund
All Cap Select Fund
Long-Short Fund
Global Fund
International Fund
Short Duration Securitized Bond Fund
AssetsInvestment in unaffiliated securities, at cost $ 374,166,453 $ 1,555,736,821 $ 182,968,283 $ 7,994,110,886 $ 13,113,365 $ 233,692,393 $ 1,581,760,502 $ 14,116,019 $ 18,102,610 $ 1,325,672,890Investment in affiliated securities, at cost — 26,906,704 1,647,023 — — — 35,119,975 — — —Investment in unaffiliated securities, at fair value* $ 615,845,706 $ 2,239,969,769 $ 275,093,790 $ 11,409,785,434 $ 13,996,253 $ 360,555,777 $ 2,403,882,186 $ 17,057,108 $ 21,457,914 $ 1,347,000,796Investment affiliated securities, at fair value — 27,247,280 1,663,549 — — — 35,626,574 — — —Cash — — — — — — — — 43,048Cash denominated in foreign currency (Cost $—,$—, $—, $—,
$—, $—, $—, $—, $90,653, and $—) — — — — — — — — 84,149 —Cash deposits with custodian for securities sold short — — — — — — 645,242,357 — — —Receivable for fund shares issued 288,838 3,351,885 316,705 25,980,827 500 254,383 986,959 — — 7,347,024Receivable for investments sold — — — — — — 9,249,356 685,267 263,481 —Receivable for dividends and interest 356,504 1,850,012 240,781 6,406,034 4,492 106,416 708,921 13,900 23,586 1,874,922Tax reclaims receivable — — — — — — 711 9,261 8,851 —Total Assets 616,491,048 2,272,418,946 277,314,825 11,442,172,295 14,001,245 360,916,576 3,095,697,064 17,765,536 21,881,029 1,356,222,742LiabilitiesInvestments sold short, at fair value (proceeds $—, $—, $—, $—, $—,
$—, $511,759,630, $—, $—, and $—) — — — — — — 632,949,217 — — —Payable for securities purchased 588,326 — — 22,579,909 — — 3,403,412 343,025 527,212 8,314,062Payable for fund shares redeemed 428,836 1,790,108 366,562 6,632,507 — 942,676 875,576 — — 362,810Payable for dividend expense on securities sold short — — — — — — 710,913 — — —Payable for return of collateral received for securities on loan 37,654,494 89,446,070 — 6,509,399 120 — 397,873,104 476,221 461,105 1,962,613Payable to Investment Adviser 392,720 1,360,904 139,510 4,710,609 5,332 212,868 1,532,942 9,111 11,279 384,737Payable to Administrator 82,311 218,595 38,019 1,347,008 609 37,198 290,569 936 1,410 172,822Accrued distribution and service fees 28,856 41,893 6,612 200,283 3 3,200 36,419 26 86 9,109Other accrued expenses 200 200 200 200 200 200 5,258 420 850 200Total Liabilities 39,175,743 92,857,770 550,903 41,979,915 6,264 1,196,142 1,037,677,410 829,739 1,001,942 11,206,353Net Assets $ 577,315,305 $ 2,179,561,176 $ 276,763,922 $ 11,400,192,380 $ 13,994,981 $ 359,720,434 $ 2,058,019,654 $ 16,935,797 $ 20,879,087 $ 1,345,016,389Components of Net AssetsPaid-in capital $ 246,530,081 $ 1,415,373,179 $ 204,875,507 $ 7,552,033,487 $ 13,014,430 $ 198,908,245 $ 1,201,227,672 $ 14,511,229 $ 15,864,705 $ 1,326,669,972Distributable earnings 330,785,224 764,187,997 71,888,415 3,848,158,893 980,551 160,812,189 856,791,982 2,424,568 5,014,382 18,346,417Net Assets $ 577,315,305 $ 2,179,561,176 $ 276,763,922 $ 11,400,192,380 $ 13,994,981 $ 359,720,434 $ 2,058,019,654 $ 16,935,797 $ 20,879,087 $ 1,345,016,389Net AssetsInvestor Shares $ 130,323,849 $ 198,710,273 $ 31,536,491 $ 977,742,981 $ 21,928 $ 16,058,886 $ 175,185,836 $ 125,936 $ 412,526 $ 43,417,261Class I Shares $ 390,227,710 $ 1,002,769,837 $ 218,882,083 $ 7,516,605,585 $ 1,722,189 $ 199,603,628 $ 1,816,179,262 $ 2,178,305 $ 4,879,127 $ 1,148,112,137Class Y Shares $ 56,763,746 $ 978,081,066 $ 26,345,348 $ 2,905,843,814 $ 12,250,864 $ 144,057,920 $ 66,654,556 $ 14,631,556 $ 15,587,434 $ 153,486,991Shares of beneficial interest outstanding (unlimited
number of shares authorized, no par value)Investor Shares 3,488,483 7,244,154 1,838,814 27,915,688 1,998 712,487 5,979,643 7,476 23,235 4,267,030Class I Shares 10,254,206 36,121,056 12,696,921 213,265,916 156,740 8,759,274 60,288,905 128,552 273,880 112,833,153Class Y Shares 1,489,117 35,128,748 1,522,726 82,344,761 1,114,772 6,297,291 2,201,898 863,106 874,177 15,069,964Net Asset Value, offering and redemption price per share:Investor Shares $ 37�36 $ 27�43 $ 17�15 $ 35�02 $ 10�98 $ 22�54 $ 29�30 $ 16�85 $ 17�75 $ 10�18Class I Shares $ 38�06 $ 27�76 $ 17�24 $ 35�25 $ 10�99 $ 22�79 $ 30�12 $ 16�94 $ 17�81 $ 10�18Class Y Shares $ 38�12 $ 27�84 $ 17�30 $ 35�29 $ 10�99 $ 22�88 $ 30�27 $ 16�95 $ 17�83 $ 10�18* Includes value of securities on loan $ 70,553,830 $ 141,650,496 $ — $ 189,971,767 $ 116 $ — $ 391,230,304 $ 758,598 $ 661,580 $ 1,911,960
See accompanying Notes to Financial Statements�
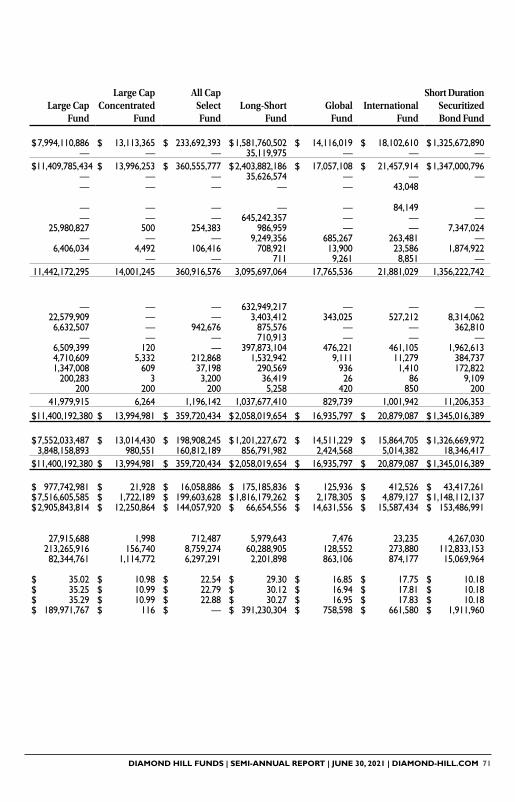
DIAMOND HILL FUNDS | SEMI-ANNUAL REPORT | JUNE 30, 2021 | DIAMOND-HILL.COM 71
Small Cap Fund
Small-Mid Cap
FundMid Cap
FundLarge Cap
Fund
Large Cap Concentrated
Fund
All Cap Select Fund
Long-Short Fund
Global Fund
International Fund
Short Duration Securitized Bond Fund
AssetsInvestment in unaffiliated securities, at cost $ 374,166,453 $ 1,555,736,821 $ 182,968,283 $ 7,994,110,886 $ 13,113,365 $ 233,692,393 $ 1,581,760,502 $ 14,116,019 $ 18,102,610 $ 1,325,672,890Investment in affiliated securities, at cost — 26,906,704 1,647,023 — — — 35,119,975 — — —Investment in unaffiliated securities, at fair value* $ 615,845,706 $ 2,239,969,769 $ 275,093,790 $ 11,409,785,434 $ 13,996,253 $ 360,555,777 $ 2,403,882,186 $ 17,057,108 $ 21,457,914 $ 1,347,000,796Investment affiliated securities, at fair value — 27,247,280 1,663,549 — — — 35,626,574 — — —Cash — — — — — — — — 43,048Cash denominated in foreign currency (Cost $—,$—, $—, $—,
$—, $—, $—, $—, $90,653, and $—) — — — — — — — — 84,149 —Cash deposits with custodian for securities sold short — — — — — — 645,242,357 — — —Receivable for fund shares issued 288,838 3,351,885 316,705 25,980,827 500 254,383 986,959 — — 7,347,024Receivable for investments sold — — — — — — 9,249,356 685,267 263,481 —Receivable for dividends and interest 356,504 1,850,012 240,781 6,406,034 4,492 106,416 708,921 13,900 23,586 1,874,922Tax reclaims receivable — — — — — — 711 9,261 8,851 —Total Assets 616,491,048 2,272,418,946 277,314,825 11,442,172,295 14,001,245 360,916,576 3,095,697,064 17,765,536 21,881,029 1,356,222,742LiabilitiesInvestments sold short, at fair value (proceeds $—, $—, $—, $—, $—,
$—, $511,759,630, $—, $—, and $—) — — — — — — 632,949,217 — — —Payable for securities purchased 588,326 — — 22,579,909 — — 3,403,412 343,025 527,212 8,314,062Payable for fund shares redeemed 428,836 1,790,108 366,562 6,632,507 — 942,676 875,576 — — 362,810Payable for dividend expense on securities sold short — — — — — — 710,913 — — —Payable for return of collateral received for securities on loan 37,654,494 89,446,070 — 6,509,399 120 — 397,873,104 476,221 461,105 1,962,613Payable to Investment Adviser 392,720 1,360,904 139,510 4,710,609 5,332 212,868 1,532,942 9,111 11,279 384,737Payable to Administrator 82,311 218,595 38,019 1,347,008 609 37,198 290,569 936 1,410 172,822Accrued distribution and service fees 28,856 41,893 6,612 200,283 3 3,200 36,419 26 86 9,109Other accrued expenses 200 200 200 200 200 200 5,258 420 850 200Total Liabilities 39,175,743 92,857,770 550,903 41,979,915 6,264 1,196,142 1,037,677,410 829,739 1,001,942 11,206,353Net Assets $ 577,315,305 $ 2,179,561,176 $ 276,763,922 $ 11,400,192,380 $ 13,994,981 $ 359,720,434 $ 2,058,019,654 $ 16,935,797 $ 20,879,087 $ 1,345,016,389Components of Net AssetsPaid-in capital $ 246,530,081 $ 1,415,373,179 $ 204,875,507 $ 7,552,033,487 $ 13,014,430 $ 198,908,245 $ 1,201,227,672 $ 14,511,229 $ 15,864,705 $ 1,326,669,972Distributable earnings 330,785,224 764,187,997 71,888,415 3,848,158,893 980,551 160,812,189 856,791,982 2,424,568 5,014,382 18,346,417Net Assets $ 577,315,305 $ 2,179,561,176 $ 276,763,922 $ 11,400,192,380 $ 13,994,981 $ 359,720,434 $ 2,058,019,654 $ 16,935,797 $ 20,879,087 $ 1,345,016,389Net AssetsInvestor Shares $ 130,323,849 $ 198,710,273 $ 31,536,491 $ 977,742,981 $ 21,928 $ 16,058,886 $ 175,185,836 $ 125,936 $ 412,526 $ 43,417,261Class I Shares $ 390,227,710 $ 1,002,769,837 $ 218,882,083 $ 7,516,605,585 $ 1,722,189 $ 199,603,628 $ 1,816,179,262 $ 2,178,305 $ 4,879,127 $ 1,148,112,137Class Y Shares $ 56,763,746 $ 978,081,066 $ 26,345,348 $ 2,905,843,814 $ 12,250,864 $ 144,057,920 $ 66,654,556 $ 14,631,556 $ 15,587,434 $ 153,486,991Shares of beneficial interest outstanding (unlimited
number of shares authorized, no par value)Investor Shares 3,488,483 7,244,154 1,838,814 27,915,688 1,998 712,487 5,979,643 7,476 23,235 4,267,030Class I Shares 10,254,206 36,121,056 12,696,921 213,265,916 156,740 8,759,274 60,288,905 128,552 273,880 112,833,153Class Y Shares 1,489,117 35,128,748 1,522,726 82,344,761 1,114,772 6,297,291 2,201,898 863,106 874,177 15,069,964Net Asset Value, offering and redemption price per share:Investor Shares $ 37�36 $ 27�43 $ 17�15 $ 35�02 $ 10�98 $ 22�54 $ 29�30 $ 16�85 $ 17�75 $ 10�18Class I Shares $ 38�06 $ 27�76 $ 17�24 $ 35�25 $ 10�99 $ 22�79 $ 30�12 $ 16�94 $ 17�81 $ 10�18Class Y Shares $ 38�12 $ 27�84 $ 17�30 $ 35�29 $ 10�99 $ 22�88 $ 30�27 $ 16�95 $ 17�83 $ 10�18* Includes value of securities on loan $ 70,553,830 $ 141,650,496 $ — $ 189,971,767 $ 116 $ — $ 391,230,304 $ 758,598 $ 661,580 $ 1,911,960
See accompanying Notes to Financial Statements�

72 DIAMOND HILL FUNDS | SEMI-ANNUAL REPORT | JUNE 30, 2021 | DIAMOND-HILL.COM
Diamond Hill Funds Statements of Assets & Liabilities (Continued) June 30, 2021 (Unaudited)
Core Bond Fund
Corporate Credit Fund
High Yield Fund
AssetsInvestment in unaffiliated securities, at cost $ 411,052,281 $ 2,240,472,738 $ 1,150,030,298Investment in unaffiliated securities, at fair value* 413,094,167 2,275,340,394 1,175,506,258Cash 163,129 — 5,490,679Receivable for fund shares issued 1,296,947 6,755,194 2,591,524Receivable for investments sold — 28,238,627 10,679,162Receivable for dividends and interest 1,256,214 29,521,950 15,855,655Prepaid expenses and other assets — 371 —Total Assets 415,810,457 2,339,856,536 1,210,123,278
LiabilitiesPayable for securities purchased 4,562,173 38,685,540 34,957,242Payable for fund shares redeemed 60,649 3,180,416 1,138,690Payable for return of collateral received for securities on loan 15,759,760 31,054,575 25,879,368Payable to Investment Adviser 96,076 827,217 456,030Payable to Administrator 49,341 309,812 152,728Accrued distribution and service fees 6,749 44,583 15,132Other accrued expenses 200 9,622 7,886Total Liabilities 20,534,948 74,111,765 62,607,076
Net Assets $ 395,275,509 $ 2,265,744,771 $ 1,147,516,202
Components of Net AssetsPaid-in capital $ 393,116,640 $ 2,180,587,407 $ 1,098,505,063Distributable earnings 2,158,869 85,157,364 49,011,139Net Assets $ 395,275,509 $ 2,265,744,771 $ 1,147,516,202Net AssetsInvestor Shares $ 32,953,221 $ 219,415,548 $ 77,936,913Class I Shares $ 299,710,790 $ 1,942,577,386 $ 1,020,850,680Class Y Shares $ 62,611,498 $ 103,751,837 $ 48,728,609Shares of beneficial interest outstanding (unlimited
number of shares authorized, no par value)Investor Shares 3,138,544 18,497,286 6,752,922Class I Shares 28,555,612 164,373,584 88,401,024Class Y Shares 5,961,150 8,782,893 4,214,654Net Asset Value, offering and redemption price per share:Investor Shares $ 10�50 $ 11�86 $ 11�54Class I Shares $ 10�50 $ 11�82 $ 11�55Class Y Shares $ 10�50 $ 11�81 $ 11�56* Includes value of securities on loan $ 23,204,522 $ 30,360,474 $ 24,963,554
See accompanying Notes to Financial Statements�

DIAMOND HILL FUNDS | SEMI-ANNUAL REPORT | JUNE 30, 2021 | DIAMOND-HILL.COM 73
Small Cap Fund
Small-Mid Cap
FundMid Cap
FundLarge Cap
Fund
Large Cap Concentrated
FundInvestment IncomeDividends $ 2,906,809 $ 10,708,742 $ 1,519,477 $ 88,577,410 $ 64,668Income distributions from
affiliated investments — 392,782 23,981 — —Securities lending income 11,964 52,323 40 84,822 104Foreign taxes withheld — — (2,719) (7,245) —Total Investment Income 2,918,773 11,153,847 1,540,779 88,654,987 64,772
ExpensesInvestment advisory fees 2,326,820 8,064,174 825,653 25,606,773 19,154Administration fees 485,436 1,282,829 225,110 7,282,818 1,998Distribution and service fees —
Investor 168,867 240,994 41,961 1,116,449 10Distribution and service fees —
Class C 10,258 21,198 — 97,926 —Other fees 1,554 4,098 1,083 19,180 419Total Expenses 2,992,935 9,613,293 1,093,807 34,123,146 21,581Advisory fees waived by Adviser — (46,927) (2,865) — —Net Expenses 2,992,935 9,566,366 1,090,942 34,123,146 21,581
Net Investment Income (Loss) (74,162) 1,587,481 449,837 54,531,841 43,191
Realized and Unrealized Gains on Investments
Net realized gains on investment transactions 82,743,584 86,850,420 8,713,504 308,174,105 54,472
Net realized gains from in-kind redemptions — — — 33,460,273 —
Net change in unrealized appreciation (depreciation) on unaffiliated investments 25,494,976 316,224,250 41,231,754 1,016,094,083 882,888
Net change in unrealized appreciation (depreciation) on affiliated investments — 211,179 12,893 — —
Net Realized and Unrealized Gains on Investments 108,238,560 403,285,849 49,958,151 1,357,728,461 937,360
Change in Net Assets from Operations $ 108,164,398 $ 404,873,330 $ 50,407,988 $ 1,412,260,302 $ 980,551
(a) Except for the Diamond Hill Large Cap Concentrated Fund, which represents the period from the commencement of operations (February 26, 2021) through June 30, 2021�
See accompanying Notes to Financial Statements�
Diamond Hill Funds Statements of Operations For the six months ended June 30, 2021 (Unaudited)(a)
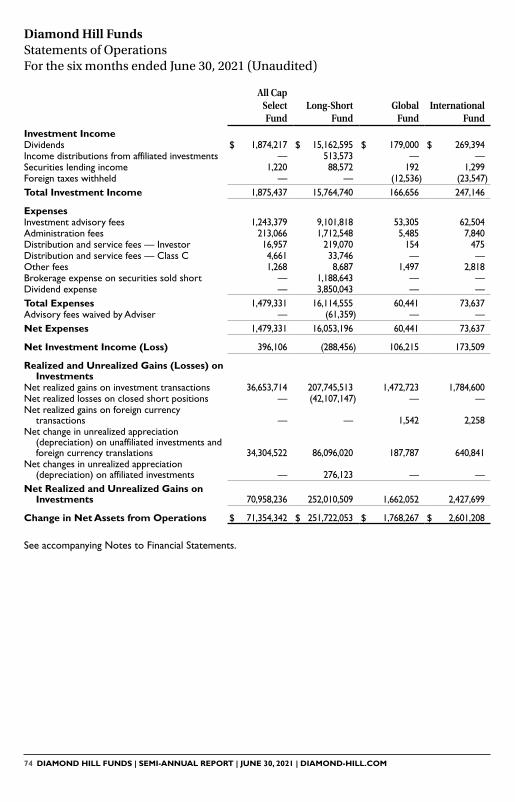
74 DIAMOND HILL FUNDS | SEMI-ANNUAL REPORT | JUNE 30, 2021 | DIAMOND-HILL.COM
Diamond Hill Funds Statements of Operations For the six months ended June 30, 2021 (Unaudited)
All Cap Select Fund
Long-Short Fund
Global Fund
International Fund
Investment IncomeDividends $ 1,874,217 $ 15,162,595 $ 179,000 $ 269,394Income distributions from affiliated investments — 513,573 — —Securities lending income 1,220 88,572 192 1,299Foreign taxes withheld — — (12,536) (23,547)Total Investment Income 1,875,437 15,764,740 166,656 247,146
ExpensesInvestment advisory fees 1,243,379 9,101,818 53,305 62,504Administration fees 213,066 1,712,548 5,485 7,840Distribution and service fees — Investor 16,957 219,070 154 475Distribution and service fees — Class C 4,661 33,746 — —Other fees 1,268 8,687 1,497 2,818Brokerage expense on securities sold short — 1,188,643 — —Dividend expense — 3,850,043 — —Total Expenses 1,479,331 16,114,555 60,441 73,637Advisory fees waived by Adviser — (61,359) — —Net Expenses 1,479,331 16,053,196 60,441 73,637
Net Investment Income (Loss) 396,106 (288,456) 106,215 173,509
Realized and Unrealized Gains (Losses) on Investments
Net realized gains on investment transactions 36,653,714 207,745,513 1,472,723 1,784,600Net realized losses on closed short positions — (42,107,147) — —Net realized gains on foreign currency
transactions — — 1,542 2,258Net change in unrealized appreciation
(depreciation) on unaffiliated investments and foreign currency translations 34,304,522 86,096,020 187,787 640,841
Net changes in unrealized appreciation (depreciation) on affiliated investments — 276,123 — —
Net Realized and Unrealized Gains on Investments 70,958,236 252,010,509 1,662,052 2,427,699
Change in Net Assets from Operations $ 71,354,342 $ 251,722,053 $ 1,768,267 $ 2,601,208
See accompanying Notes to Financial Statements�

DIAMOND HILL FUNDS | SEMI-ANNUAL REPORT | JUNE 30, 2021 | DIAMOND-HILL.COM 75
Diamond Hill Funds Statements of Operations For the six months ended June 30, 2021 (Unaudited)
Short Duration Securitized Bond Fund
Core Bond Fund
Corporate Credit Fund
High Yield Fund
Investment IncomeDividends $ 72,896 $ 3,466 $ 23,937 $ 6,988Securities lending income 1,242 17,274 43,392 22,705Interest 20,052,330 4,698,226 55,419,695 27,802,084Total Investment Income 20,126,468 4,718,966 55,487,024 27,831,777
ExpensesInvestment advisory fees 2,181,815 538,479 4,812,316 2,372,304Administration fees 963,136 272,535 1,799,453 793,088Distribution and service fees — Investor 57,859 29,949 240,279 76,521Distribution and service fees — Class C — — 41,640 —Borrowing costs — — — —Other fees 2,660 1,204 14,043 10,420Total Expenses 3,205,470 842,167 6,907,731 3,252,333Advisory fees waived by Adviser — — —Net Expenses 3,205,470 842,167 6,907,731 3,252,333
Net Investment Income 16,920,998 3,876,799 48,579,293 24,579,444
Realized and Unrealized Gains (Losses) on Investments
Net realized gains on investment transactions 5,034,896 765,252 46,539,856 20,177,231Net change in unrealized appreciation
(depreciation) on investments 5,336,074 (7,670,360) (35,798,253) (7,831,635)Net Realized and Unrealized Gains on
Investments 10,370,970 (6,905,108) 10,741,603 12,345,596
Change in Net Assets from Operations $ 27,291,968 $ (3,028,309) $ 59,320,896 $ 36,925,040
See accompanying Notes to Financial Statements�

76 DIAMOND HILL FUNDS | SEMI-ANNUAL REPORT | JUNE 30, 2021 | DIAMOND-HILL.COM
Small Cap Fund Small-Mid Cap FundFor the
six months ended
June 30, 2021 (Unaudited)
For the year ended
December 31, 2020
For the six months
ended June 30, 2021 (Unaudited)
For the year ended
December 31, 2020
From OperationsNet investment income $ (74,162) $ 1,386,988 $ 1,587,481 $ 9,330,097Net realized gains on investment transactions 82,743,584 27,434,258 86,850,420 20,356,175Net realized losses on sales from affiliated
investments — — — (9,028)Net change in unrealized appreciation
(depreciation) on investments 25,494,976 (59,087,783) 316,435,429 (113,906,866)Change in Net Assets from Operations 108,164,398 (30,266,537) 404,873,330 (84,229,622)
Distributions to ShareholdersInvestor — (375,118) — (794,357)Class C — — — (7,160)Class I — (2,149,700) — (6,470,465)Class Y — (400,788) — (7,445,410)
Change in Net Assets from Distributions to Shareholders — (2,925,606) — (14,717,393)
Change in Net Assets from Capital Transactions (62,222,840) (188,317,587) (180,592,116) (382,235,477)
Total Change in Net Assets 45,941,558 (221,509,730) 224,281,214 (481,182,492)
Net Assets:Beginning of period 531,373,747 752,883,477 1,955,279,962 2,436,462,454End of period $ 577,315,305 $ 531,373,747 $ 2,179,561,176 $ 1,955,279,962
See accompanying Notes to Financial Statements�
Diamond Hill Funds Statements of Changes in Net Assets
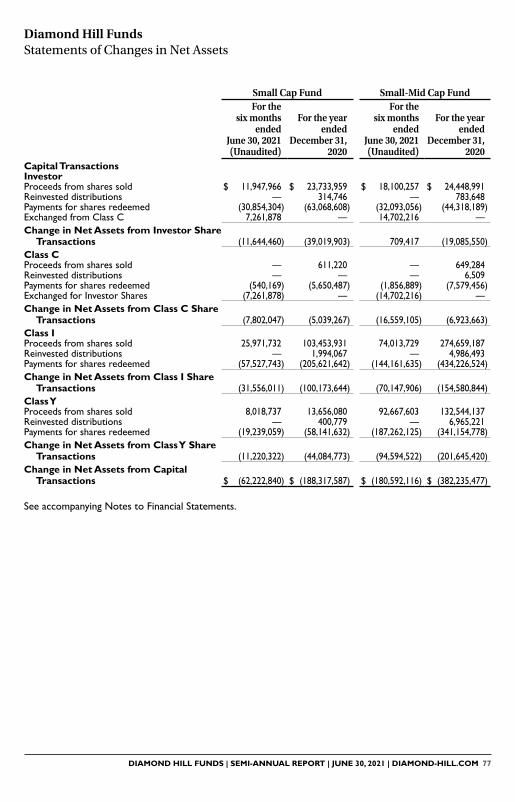
DIAMOND HILL FUNDS | SEMI-ANNUAL REPORT | JUNE 30, 2021 | DIAMOND-HILL.COM 77
Small Cap Fund Small-Mid Cap FundFor the
six months ended
June 30, 2021 (Unaudited)
For the year ended
December 31, 2020
For the six months
ended June 30, 2021 (Unaudited)
For the year ended
December 31, 2020
Capital Transactions InvestorProceeds from shares sold $ 11,947,966 $ 23,733,959 $ 18,100,257 $ 24,448,991Reinvested distributions — 314,746 — 783,648Payments for shares redeemed (30,854,304) (63,068,608) (32,093,056) (44,318,189)Exchanged from Class C 7,261,878 — 14,702,216 —Change in Net Assets from Investor Share
Transactions (11,644,460) (39,019,903) 709,417 (19,085,550)Class CProceeds from shares sold — 611,220 — 649,284Reinvested distributions — — — 6,509Payments for shares redeemed (540,169) (5,650,487) (1,856,889) (7,579,456)Exchanged for Investor Shares (7,261,878) — (14,702,216) —Change in Net Assets from Class C Share
Transactions (7,802,047) (5,039,267) (16,559,105) (6,923,663)Class IProceeds from shares sold 25,971,732 103,453,931 74,013,729 274,659,187Reinvested distributions — 1,994,067 — 4,986,493Payments for shares redeemed (57,527,743) (205,621,642) (144,161,635) (434,226,524)Change in Net Assets from Class I Share
Transactions (31,556,011) (100,173,644) (70,147,906) (154,580,844)Class YProceeds from shares sold 8,018,737 13,656,080 92,667,603 132,544,137Reinvested distributions — 400,779 — 6,965,221Payments for shares redeemed (19,239,059) (58,141,632) (187,262,125) (341,154,778)Change in Net Assets from Class Y Share
Transactions (11,220,322) (44,084,773) (94,594,522) (201,645,420)Change in Net Assets from Capital
Transactions $ (62,222,840) $ (188,317,587) $ (180,592,116) $ (382,235,477)
Diamond Hill Funds Statements of Changes in Net Assets
See accompanying Notes to Financial Statements�

78 DIAMOND HILL FUNDS | SEMI-ANNUAL REPORT | JUNE 30, 2021 | DIAMOND-HILL.COM
Diamond Hill Funds Statements of Changes in Net Assets
Small Cap Fund Small-Mid Cap FundFor the
six months ended
June 30, 2021 (Unaudited)
For the year ended
December 31, 2020
For the six months
ended June 30, 2021 (Unaudited)
For the year ended
December 31, 2020
Share Transactions:InvestorIssued 330,504 1,333,737 743,364 1,410,527Reinvested — 296,221 — 34,702Redeemed (849,685) (4,136,880) (1,253,656) (2,426,981)Exchanged from Class C 212,296 — 587,472 —Change in Shares Outstanding (306,885) (2,506,922) 77,180 (981,752)Class CIssued — 6,934 — 38,307Reinvested — 33,444 — 329Redeemed (19,676) (594,042) (86,902) (450,222)Exchanged for Investor Shares (253,200) — (653,293) —Change in Shares Outstanding (272,876) (553,664) (740,195) (411,586)Class IIssued 722,977 3,294,020 2,802,692 15,498,884Reinvested — 943,203 — 218,333Redeemed (1,595,626) (12,106,669) (5,451,728) (24,395,824)Change in Shares Outstanding (872,649) (7,869,446) (2,649,036) (8,678,607)Class YIssued 217,353 665,331 3,416,681 7,249,838Reinvested — 225,846 — 304,225Redeemed (518,009) (2,849,504) (6,935,807) (19,138,809)Change in Shares Outstanding (300,656) (1,958,327) (3,519,126) (11,584,746)Change in Total Shares Outstanding (1,753,066) (12,888,359) (6,831,177) (21,656,691)
See accompanying Notes to Financial Statements�

DIAMOND HILL FUNDS | SEMI-ANNUAL REPORT | JUNE 30, 2021 | DIAMOND-HILL.COM 79
Diamond Hill Funds Statements of Changes in Net Assets
Mid Cap Fund Large Cap FundFor the
six months ended
June 30, 2021 (Unaudited)
For the year ended
December 31, 2020
For the six months
ended June 30, 2021 (Unaudited)
For the year ended
December 31, 2020
From OperationsNet investment income $ 449,837 $ 1,523,789 $ 54,531,841 $ 86,692,884Net realized gains (losses) on investment
transactions 8,713,504 (28,759,549) 341,634,378 294,727,927Net realized losses on sales from affiliated
investments — (75,396) — —Net change in unrealized appreciation
(depreciation) on investments 41,244,647 23,469,866 1,016,094,083 365,974,269Change in Net Assets from Operations 50,407,988 (3,841,290) 1,412,260,302 747,395,080
Distributions to ShareholdersInvestor — (175,191) — (22,298,991)Class C — — — (1,861,129)Class I — (1,482,682) — (174,347,503)Class Y — (213,621) — (80,994,298)
Change in Net Assets from Distributions to Shareholders — (1,871,494) — (279,501,921)
Change in Net Assets from Capital Transactions (24,424,273) 26,506,292 1,676,166,314 1,071,050,896
Total Change in Net Assets 25,983,715 20,793,508 3,088,426,616 1,538,944,055
Net Assets:Beginning of period 250,780,207 229,986,699 8,311,765,764 6,772,821,709End of period $ 276,763,922 $ 250,780,207 $ 11,400,192,380 $ 8,311,765,764
See accompanying Notes to Financial Statements�

80 DIAMOND HILL FUNDS | SEMI-ANNUAL REPORT | JUNE 30, 2021 | DIAMOND-HILL.COM
Diamond Hill Funds Statements of Changes in Net Assets
Mid Cap Fund Large Cap FundFor the
six months ended
June 30, 2021 (Unaudited)
For the year ended
December 31, 2020
For the six months
ended June 30, 2021 (Unaudited)
For the year ended
December 31, 2020
Capital TransactionsInvestorProceeds from shares sold $ 6,028,513 $ 13,431,553 $ 106,237,141 $ 149,464,843Reinvested distributions — 164,900 — 21,250,713Payments for shares redeemed (13,951,903) (13,070,139) (84,032,315) (690,852,940)Exchanged from Class C — — 68,882,202 —Change in Net Assets from Investor Share
Transactions (7,923,390) 526,314 91,087,028 (520,137,384)Class CProceeds from shares sold — — 12 6,876,257Reinvested distributions — — — 1,704,162Payments for shares redeemed — — (2,762,175) (24,373,041)Exchanged for Investor Shares — — (68,882,202) —Change in Net Assets from Class C Share
Transactions — — (71,644,365) (15,792,622)Class IProceeds from shares sold 22,765,762 150,185,900 2,208,448,210 2,084,600,703Reinvested distributions — 1,419,804 — 131,982,936Payments for shares redeemed (37,711,205) (127,460,056) (743,074,108) (1,275,039,176)Change in Net Assets from Class I Share
Transactions (14,945,443) 24,145,648 1,465,374,102 941,544,463Class YProceeds from shares sold 2,984,570 10,272,471 473,412,174 975,327,302Reinvested distributions — 177,984 — 73,568,411Payments for shares redeemed (4,540,010) (8,616,125) (282,062,625) (383,459,274)Change in Net Assets from Class Y Share
Transactions (1,555,440) 1,834,330 191,349,549 665,436,439Change in Net Assets from Capital
Transactions $ (24,424,273) $ 26,506,292 $ 1,676,166,314 $ 1,071,050,896
See accompanying Notes to Financial Statements�

DIAMOND HILL FUNDS | SEMI-ANNUAL REPORT | JUNE 30, 2021 | DIAMOND-HILL.COM 81
Diamond Hill Funds Statements of Changes in Net Assets
Mid Cap Fund Large Cap FundFor the
six months ended
June 30, 2021 (Unaudited)
For the year ended
December 31, 2020
For the six months
ended June 30, 2021 (Unaudited)
For the year ended
December 31, 2020
Share Transactions:InvestorIssued 365,555 1,216,594 3,201,566 5,690,207Reinvested — 11,690 — 711,742Redeemed (852,310) (1,087,987) (2,529,252) (24,420,335)Exchanged from Class C — — 2,174,100 —Change in Shares Outstanding (486,755) 140,297 2,846,414 (18,018,386)Class CIssued — — 1 272,394Reinvested — — — 61,118Redeemed — — (95,010) (1,003,488)Exchanged for Investor Shares — — (2,315,245) —Change in Shares Outstanding — — (2,410,254) (669,976)Class IIssued 1,412,874 12,972,552 67,116,192 79,573,495Reinvested — 99,970 — 4,378,428Redeemed (2,288,514) (11,587,276) (22,005,747) (49,291,182)Change in Shares Outstanding (875,640) 1,485,246 45,110,445 34,660,741Class YIssued 191,602 867,672 14,188,182 34,446,877Reinvested — 12,497 — 2,436,886Redeemed (287,460) (649,898) (8,329,024) (14,332,012)Change in Shares Outstanding (95,858) 230,271 5,859,158 22,551,751Change in Total Shares Outstanding (1,458,253) 1,855,814 51,405,763 38,524,130
See accompanying Notes to Financial Statements�
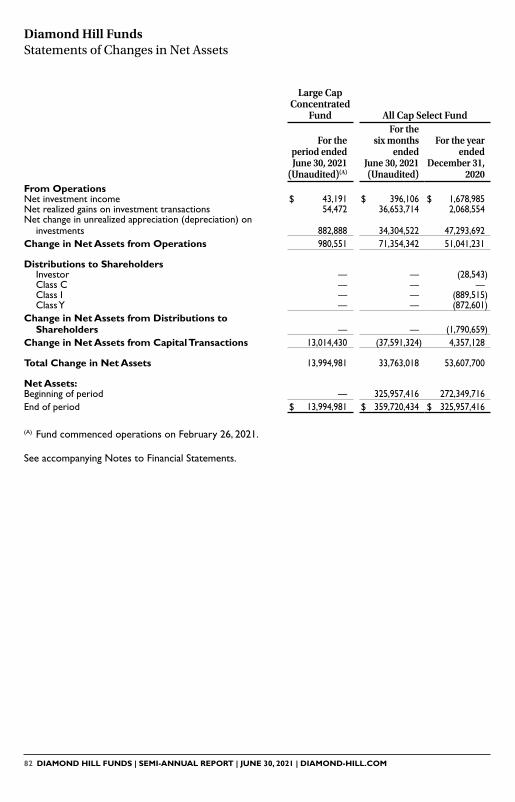
82 DIAMOND HILL FUNDS | SEMI-ANNUAL REPORT | JUNE 30, 2021 | DIAMOND-HILL.COM
Diamond Hill Funds Statements of Changes in Net Assets
Large Cap Concentrated
Fund All Cap Select Fund
For the period ended June 30, 2021
(Unaudited)(A)
For the six months
ended June 30, 2021 (Unaudited)
For the year ended
December 31, 2020
From OperationsNet investment income $ 43,191 $ 396,106 $ 1,678,985Net realized gains on investment transactions 54,472 36,653,714 2,068,554Net change in unrealized appreciation (depreciation) on
investments 882,888 34,304,522 47,293,692Change in Net Assets from Operations 980,551 71,354,342 51,041,231
Distributions to ShareholdersInvestor — — (28,543)Class C — — —Class I — — (889,515)Class Y — — (872,601)
Change in Net Assets from Distributions to Shareholders — — (1,790,659)
Change in Net Assets from Capital Transactions 13,014,430 (37,591,324) 4,357,128
Total Change in Net Assets 13,994,981 33,763,018 53,607,700
Net Assets:Beginning of period — 325,957,416 272,349,716End of period $ 13,994,981 $ 359,720,434 $ 325,957,416
(A) Fund commenced operations on February 26, 2021�
See accompanying Notes to Financial Statements�
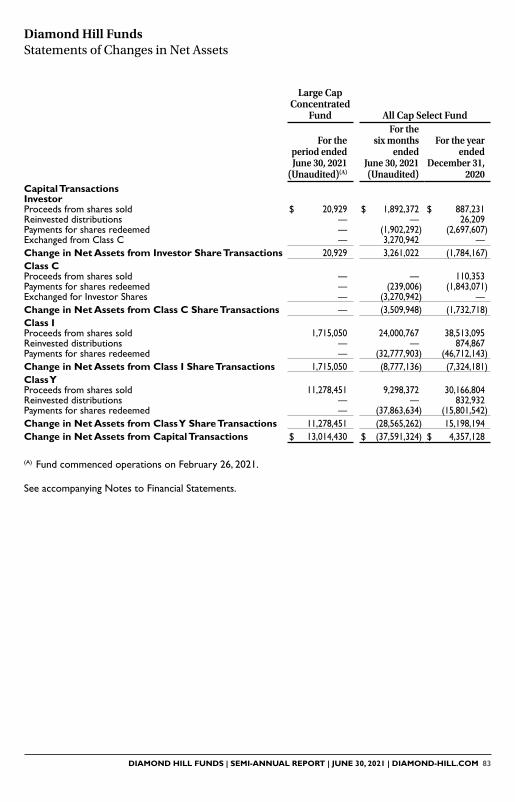
DIAMOND HILL FUNDS | SEMI-ANNUAL REPORT | JUNE 30, 2021 | DIAMOND-HILL.COM 83
Large Cap Concentrated
Fund All Cap Select Fund
For the period ended June 30, 2021
(Unaudited)(A)
For the six months
ended June 30, 2021 (Unaudited)
For the year ended
December 31, 2020
Capital TransactionsInvestorProceeds from shares sold $ 20,929 $ 1,892,372 $ 887,231Reinvested distributions — — 26,209Payments for shares redeemed — (1,902,292) (2,697,607)Exchanged from Class C — 3,270,942 —Change in Net Assets from Investor Share Transactions 20,929 3,261,022 (1,784,167)Class CProceeds from shares sold — — 110,353Payments for shares redeemed — (239,006) (1,843,071)Exchanged for Investor Shares — (3,270,942) —Change in Net Assets from Class C Share Transactions — (3,509,948) (1,732,718)Class IProceeds from shares sold 1,715,050 24,000,767 38,513,095Reinvested distributions — — 874,867Payments for shares redeemed — (32,777,903) (46,712,143)Change in Net Assets from Class I Share Transactions 1,715,050 (8,777,136) (7,324,181)Class YProceeds from shares sold 11,278,451 9,298,372 30,166,804Reinvested distributions — — 832,932Payments for shares redeemed — (37,863,634) (15,801,542)Change in Net Assets from Class Y Share Transactions 11,278,451 (28,565,262) 15,198,194Change in Net Assets from Capital Transactions $ 13,014,430 $ (37,591,324) $ 4,357,128
Diamond Hill Funds Statements of Changes in Net Assets
(A) Fund commenced operations on February 26, 2021�
See accompanying Notes to Financial Statements�

84 DIAMOND HILL FUNDS | SEMI-ANNUAL REPORT | JUNE 30, 2021 | DIAMOND-HILL.COM
Diamond Hill Funds Statements of Changes in Net Assets
Large Cap Concentrated
Fund All Cap Select Fund
For the period ended June 30, 2021
(Unaudited)(A)
For the six months
ended June 30, 2021 (Unaudited)
For the year ended
December 31, 2020
Share Transactions:InvestorIssued 1,998 84,624 62,432Reinvested — — 1,429Redeemed — (89,476) (193,208)Exchanged from Class C — 163,425 —Change in Shares Outstanding 1,998 158,573 (129,347)Class CIssued — — 8,726Redeemed — (13,473) (134,671)Exchanged for Investor Shares — (177,396) —Change in Shares Outstanding — (190,869) (125,945)Class IIssued 156,740 1,071,883 3,286,070Reinvested — — 47,239Redeemed — (1,518,578) (3,477,940)Change in Shares Outstanding 156,740 (446,695) (144,631)Class YIssued 1,114,772 448,858 2,233,911Reinvested — — 44,829Redeemed — (1,719,260) (1,062,608)Change in Shares Outstanding 1,114,772 (1,270,402) 1,216,132Change in Total Shares Outstanding 1,273,510 (1,749,393) 816,209
(A) Fund commenced operations on February 26, 2021�
See accompanying Notes to Financial Statements�
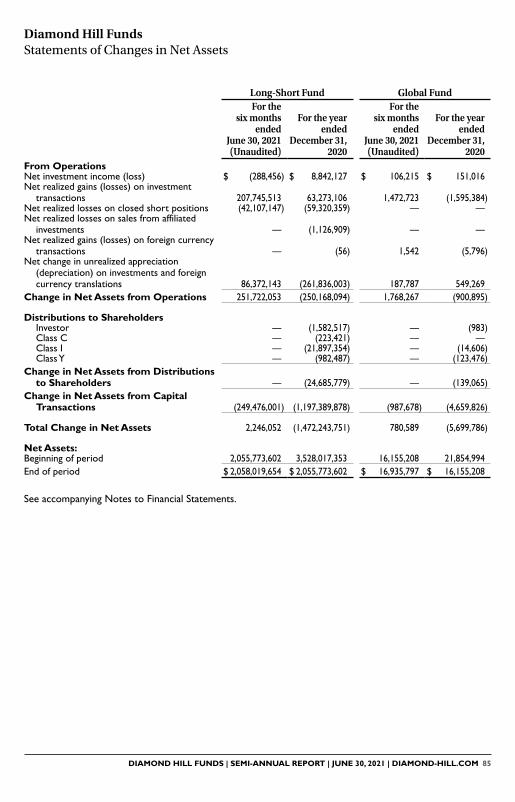
DIAMOND HILL FUNDS | SEMI-ANNUAL REPORT | JUNE 30, 2021 | DIAMOND-HILL.COM 85
Long-Short Fund Global FundFor the
six months ended
June 30, 2021 (Unaudited)
For the year ended
December 31, 2020
For the six months
ended June 30, 2021 (Unaudited)
For the year ended
December 31, 2020
From OperationsNet investment income (loss) $ (288,456) $ 8,842,127 $ 106,215 $ 151,016Net realized gains (losses) on investment
transactions 207,745,513 63,273,106 1,472,723 (1,595,384)Net realized losses on closed short positions (42,107,147) (59,320,359) — —Net realized losses on sales from affiliated
investments — (1,126,909) — —Net realized gains (losses) on foreign currency
transactions — (56) 1,542 (5,796)Net change in unrealized appreciation
(depreciation) on investments and foreign currency translations 86,372,143 (261,836,003) 187,787 549,269
Change in Net Assets from Operations 251,722,053 (250,168,094) 1,768,267 (900,895)
Distributions to ShareholdersInvestor — (1,582,517) — (983)Class C — (223,421) — —Class I — (21,897,354) — (14,606)Class Y — (982,487) — (123,476)
Change in Net Assets from Distributions to Shareholders — (24,685,779) — (139,065)
Change in Net Assets from Capital Transactions (249,476,001) (1,197,389,878) (987,678) (4,659,826)
Total Change in Net Assets 2,246,052 (1,472,243,751) 780,589 (5,699,786)
Net Assets:Beginning of period 2,055,773,602 3,528,017,353 16,155,208 21,854,994End of period $ 2,058,019,654 $ 2,055,773,602 $ 16,935,797 $ 16,155,208
See accompanying Notes to Financial Statements�
Diamond Hill Funds Statements of Changes in Net Assets

86 DIAMOND HILL FUNDS | SEMI-ANNUAL REPORT | JUNE 30, 2021 | DIAMOND-HILL.COM
Long-Short Fund Global FundFor the
six months ended
June 30, 2021 (Unaudited)
For the year ended
December 31, 2020
For the six months
ended June 30, 2021 (Unaudited)
For the year ended
December 31, 2020
Capital TransactionsInvestorProceeds from shares sold $ 6,931,947 $ 25,128,153 $ — $ 74,461Reinvested distributions — 1,385,332 — 983Payments for shares redeemed (39,564,440) (91,047,343) (47,016) (36,612)Net assets received in conjunction with fund
merger — 5,435,645 — —Exchanged from Class C 23,084,351 — — —Change in Net Assets from Investor Share
Transactions (9,548,142) (59,098,213) (47,016) 38,832Class CProceeds from shares sold — 1,481,104 — —Reinvested distributions — 210,563 — —Payments for shares redeemed (2,012,571) (16,999,894) — —Net assets received in conjunction with fund
merger — 762,183 — —Exchanged for Investor Shares (23,084,351) — — —Change in Net Assets from Class C Share
Transactions (25,096,922) (14,546,044) — —Class IProceeds from shares sold 123,331,926 483,242,457 183,985 583,366Reinvested distributions — 17,182,498 — 14,606Payments for shares redeemed (320,533,545) (1,457,248,575) (459,323) (3,728,266)Net assets received in conjunction with fund
merger — 12,333,406 — —Change in Net Assets from Class I Share
Transactions (197,201,619) (944,490,214) (275,338) (3,130,294)Class YProceeds from shares sold 1,624,415 12,232,813 118,560 314,490Reinvested distributions — 667,666 — 123,476Payments for shares redeemed (19,253,733) (208,868,989) (783,884) (2,006,330)Net assets received in conjunction with fund
merger — 16,713,103 — —Change in Net Assets from Class Y Share
Transactions (17,629,318) (179,255,407) (665,324) (1,568,364)Change in Net Assets from Capital
Transactions $ (249,476,001) $ (1,197,389,878) $ (987,678) $ (4,659,826)
Diamond Hill Funds Statements of Changes in Net Assets
See accompanying Notes to Financial Statements�

DIAMOND HILL FUNDS | SEMI-ANNUAL REPORT | JUNE 30, 2021 | DIAMOND-HILL.COM 87
Diamond Hill Funds Statements of Changes in Net Assets
Long-Short Fund Global FundFor the
six months ended
June 30, 2021 (Unaudited)
For the year ended
December 31, 2020
For the six months
ended June 30, 2021 (Unaudited)
For the year ended
December 31, 2020
Share Transactions:InvestorIssued 252,919 1,072,538 — 6,083Reinvested — 54,303 — 65Redeemed (1,407,468) (4,006,508) (3,054) (2,972)Received in conjunction with fund merger — 226,265 — —Exchanged from Class C 865,791 — — —Change in Shares Outstanding (288,758) (2,653,402) (3,054) 3,176Class CIssued — 70,563 — —Reinvested — 9,498 — —Redeemed (88,225) (842,802) — —Received in conjunction with fund merger — 36,363 — —Exchanged for Investor Shares (993,908) — — —Change in Shares Outstanding (1,082,133) (726,378) — —Class IIssued 4,237,160 20,035,736 11,470 38,969Reinvested — 653,624 — 958Redeemed (11,445,362) (63,402,777) (28,588) (306,392)Received in conjunction with fund merger — 499,138 — —Change in Shares Outstanding (7,208,202) (42,214,279) (17,118) (266,465)Class YIssued 56,736 484,890 7,240 22,743Reinvested — 25,279 — 8,102Redeemed (664,923) (9,140,669) (48,938) (154,682)Received in conjunction with fund merger — 672,947 — —Change in Shares Outstanding (608,187) (7,957,553) (41,698) (123,837)Change in Total Shares Outstanding (9,187,280) (53,551,612) (61,870) (387,126)
See accompanying Notes to Financial Statements�

88 DIAMOND HILL FUNDS | SEMI-ANNUAL REPORT | JUNE 30, 2021 | DIAMOND-HILL.COM
Diamond Hill Funds Statements of Changes in Net Assets
International FundShort Duration
Securitized Bond FundFor the
six months ended
June 30, 2021 (Unaudited)
For the year ended
December 31, 2020
For the six months
ended June 30, 2021 (Unaudited)
For the year ended
December 31, 2020
From OperationsNet investment income $ 173,509 $ 110,613 $ 16,920,998 $ 26,871,333Net realized gains (losses) on investment
transactions 1,784,600 (295,613) 5,034,896 (7,018,420)Net realized gains (losses) on foreign currency
transactions 2,258 (2,926) — —Net change in unrealized appreciation
(depreciation) on investments 640,841 1,492,806 5,336,074 14,436,789Change in Net Assets from Operations 2,601,208 1,304,880 27,291,968 34,289,702
Distributions to ShareholdersInvestor — (2,988) (579,704) (1,533,265)Class I — (41,683) (14,528,910) (22,083,714)Class Y — (144,229) (2,563,981) (6,492,319)
Change in Net Assets from Distributions to Shareholders — (188,900) (17,672,595) (30,109,298)
Change in Net Assets from Capital Transactions 1,410,093 2,261,513 202,931,085 319,626,459
Total Change in Net Assets 4,011,301 3,377,493 212,550,458 323,806,863
Net Assets:Beginning of period 16,867,786 13,490,293 1,132,465,931 808,659,068End of period $ 20,879,087 $ 16,867,786 $ 1,345,016,389 $ 1,132,465,931
See accompanying Notes to Financial Statements�
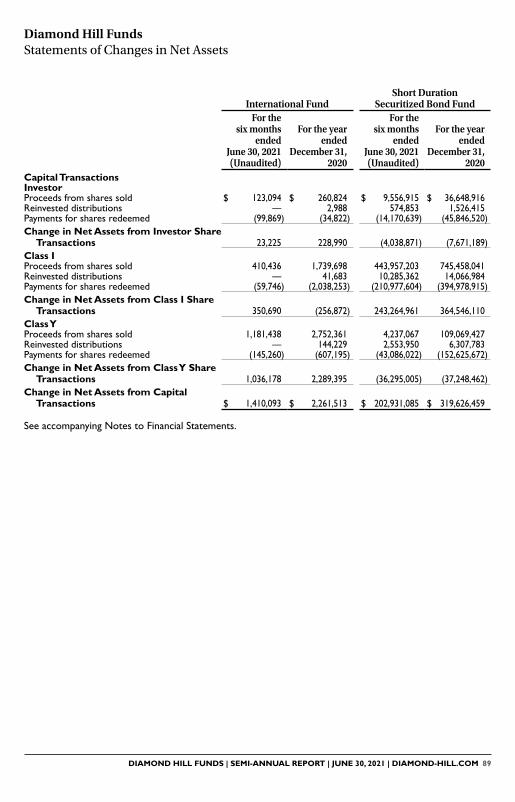
DIAMOND HILL FUNDS | SEMI-ANNUAL REPORT | JUNE 30, 2021 | DIAMOND-HILL.COM 89
International FundShort Duration
Securitized Bond FundFor the
six months ended
June 30, 2021 (Unaudited)
For the year ended
December 31, 2020
For the six months
ended June 30, 2021 (Unaudited)
For the year ended
December 31, 2020
Capital TransactionsInvestorProceeds from shares sold $ 123,094 $ 260,824 $ 9,556,915 $ 36,648,916Reinvested distributions — 2,988 574,853 1,526,415Payments for shares redeemed (99,869) (34,822) (14,170,639) (45,846,520)Change in Net Assets from Investor Share
Transactions 23,225 228,990 (4,038,871) (7,671,189)Class IProceeds from shares sold 410,436 1,739,698 443,957,203 745,458,041Reinvested distributions — 41,683 10,285,362 14,066,984Payments for shares redeemed (59,746) (2,038,253) (210,977,604) (394,978,915)Change in Net Assets from Class I Share
Transactions 350,690 (256,872) 243,264,961 364,546,110Class YProceeds from shares sold 1,181,438 2,752,361 4,237,067 109,069,427Reinvested distributions — 144,229 2,553,950 6,307,783Payments for shares redeemed (145,260) (607,195) (43,086,022) (152,625,672)Change in Net Assets from Class Y Share
Transactions 1,036,178 2,289,395 (36,295,005) (37,248,462)Change in Net Assets from Capital
Transactions $ 1,410,093 $ 2,261,513 $ 202,931,085 $ 319,626,459
Diamond Hill Funds Statements of Changes in Net Assets
See accompanying Notes to Financial Statements�

90 DIAMOND HILL FUNDS | SEMI-ANNUAL REPORT | JUNE 30, 2021 | DIAMOND-HILL.COM
Diamond Hill Funds Statements of Changes in Net Assets
International FundShort Duration
Securitized Bond FundFor the
six months ended
June 30, 2021 (Unaudited)
For the year ended
December 31, 2020
For the six months
ended June 30, 2021 (Unaudited)
For the year ended
December 31, 2020
Share Transactions:InvestorIssued 7,308 20,908 939,172 3,680,417Reinvested — 196 56,546 156,709Redeemed (5,933) (2,340) (1,392,934) (4,683,727)Change in Shares Outstanding 1,375 18,764 (397,216) (846,601)Class IIssued 25,082 133,427 43,633,617 76,022,724Reinvested — 2,713 1,011,705 1,438,429Redeemed (3,585) (144,348) (20,728,951) (40,544,177)Change in Shares Outstanding 21,497 (8,208) 23,916,371 36,916,976Class YIssued 69,501 197,656 416,079 11,362,853Reinvested — 9,375 250,974 645,835Redeemed (8,680) (48,413) (4,227,011) (15,797,601)Change in Shares Outstanding 60,821 158,618 (3,559,958) (3,788,913)Change in Total Shares Outstanding 83,693 169,174 19,959,197 32,281,462
See accompanying Notes to Financial Statements�

DIAMOND HILL FUNDS | SEMI-ANNUAL REPORT | JUNE 30, 2021 | DIAMOND-HILL.COM 91
Core Bond Fund Corporate Credit FundFor the
six months ended
June 30, 2021 (Unaudited)
For the year ended
December 31, 2020
For the six months
ended June 30, 2021 (Unaudited)
For the year ended
December 31, 2020
From OperationsNet investment income $ 3,876,799 $ 4,782,107 $ 48,579,293 $ 67,153,877Net realized gains on investment transactions 765,252 532,828 46,539,856 36,251,469Net realized losses on sales from affiliated
investments — — — (4,046,880)Net change in unrealized appreciation
(depreciation) on investments (7,670,360) 8,109,845 (35,798,253) 56,877,380Change in Net Assets from Operations (3,028,309) 13,424,780 59,320,896 156,235,846
Distributions to ShareholdersInvestor (279,897) (247,377) (4,322,611) (8,779,645)Class C — — (91,613) (1,541,137)Class I (3,506,459) (3,229,425) (43,470,542) (82,515,313)Class Y (837,228) (1,529,783) (2,332,287) (5,695,767)
Change in Net Assets from Distributions to Shareholders (4,623,584) (5,006,585) (50,217,053) (98,531,862)
Change in Net Assets from Capital Transactions 65,682,652 206,778,242 236,521,975 821,687,269
Total Change in Net Assets 58,030,759 215,196,437 245,625,818 879,391,253
Net Assets:Beginning of period 337,244,750 122,048,313 2,020,118,953 1,140,727,700End of period $ 395,275,509 $ 337,244,750 $ 2,265,744,771 $ 2,020,118,953
See accompanying Notes to Financial Statements�
Diamond Hill Funds Statements of Changes in Net Assets
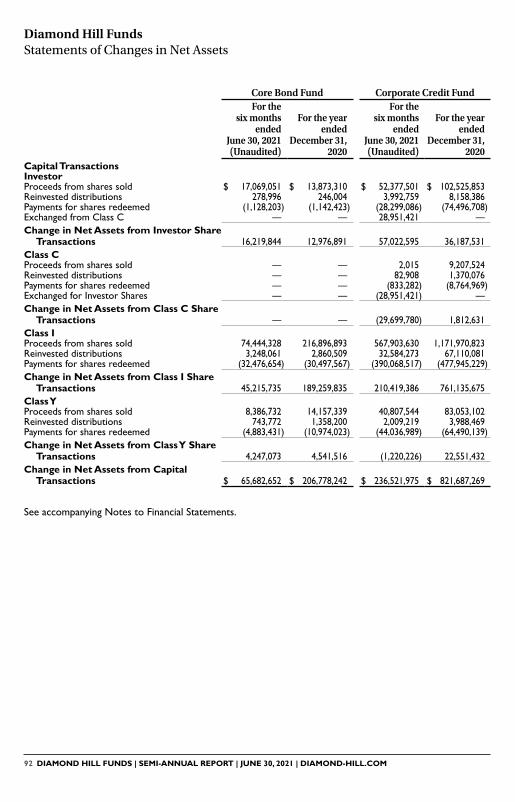
92 DIAMOND HILL FUNDS | SEMI-ANNUAL REPORT | JUNE 30, 2021 | DIAMOND-HILL.COM
Core Bond Fund Corporate Credit FundFor the
six months ended
June 30, 2021 (Unaudited)
For the year ended
December 31, 2020
For the six months
ended June 30, 2021 (Unaudited)
For the year ended
December 31, 2020
Capital TransactionsInvestorProceeds from shares sold $ 17,069,051 $ 13,873,310 $ 52,377,501 $ 102,525,853Reinvested distributions 278,996 246,004 3,992,759 8,158,386Payments for shares redeemed (1,128,203) (1,142,423) (28,299,086) (74,496,708)Exchanged from Class C — — 28,951,421 —Change in Net Assets from Investor Share
Transactions 16,219,844 12,976,891 57,022,595 36,187,531Class CProceeds from shares sold — — 2,015 9,207,524Reinvested distributions — — 82,908 1,370,076Payments for shares redeemed — — (833,282) (8,764,969)Exchanged for Investor Shares — — (28,951,421) —Change in Net Assets from Class C Share
Transactions — — (29,699,780) 1,812,631Class IProceeds from shares sold 74,444,328 216,896,893 567,903,630 1,171,970,823Reinvested distributions 3,248,061 2,860,509 32,584,273 67,110,081Payments for shares redeemed (32,476,654) (30,497,567) (390,068,517) (477,945,229)Change in Net Assets from Class I Share
Transactions 45,215,735 189,259,835 210,419,386 761,135,675Class YProceeds from shares sold 8,386,732 14,157,339 40,807,544 83,053,102Reinvested distributions 743,772 1,358,200 2,009,219 3,988,469Payments for shares redeemed (4,883,431) (10,974,023) (44,036,989) (64,490,139)Change in Net Assets from Class Y Share
Transactions 4,247,073 4,541,516 (1,220,226) 22,551,432Change in Net Assets from Capital
Transactions $ 65,682,652 $ 206,778,242 $ 236,521,975 $ 821,687,269
Diamond Hill Funds Statements of Changes in Net Assets
See accompanying Notes to Financial Statements�

DIAMOND HILL FUNDS | SEMI-ANNUAL REPORT | JUNE 30, 2021 | DIAMOND-HILL.COM 93
Diamond Hill Funds Statements of Changes in Net Assets
Core Bond Fund Corporate Credit FundFor the
six months ended
June 30, 2021 (Unaudited)
For the year ended
December 31, 2020
For the six months
ended June 30, 2021 (Unaudited)
For the year ended
December 31, 2020
Share Transactions:InvestorIssued 1,634,834 1,315,970 4,428,669 9,138,716Reinvested 26,652 23,010 338,239 717,323Redeemed (107,483) (107,686) (2,392,539) (6,626,577)Exchanged from Class C — — 2,434,393 —Change in Shares Outstanding 1,554,003 1,231,294 4,808,762 3,229,462Class CIssued — — 172 835,155Reinvested — — 7,050 120,967Redeemed — — (70,688) (780,780)Exchanged for Investor Shares — — (2,445,988) —Change in Shares Outstanding — — (2,509,454) 175,342Class IIssued 7,087,680 20,345,170 48,186,024 104,536,452Reinvested 310,121 268,174 2,770,516 5,895,527Redeemed (3,083,262) (2,867,968) (33,116,806) (43,605,967)Change in Shares Outstanding 4,314,539 17,745,376 17,839,734 66,826,012Class YIssued 787,953 1,341,553 3,467,670 7,241,453Reinvested 70,979 127,759 170,901 349,182Redeemed (466,073) (1,028,435) (3,744,318) (5,921,372)Change in Shares Outstanding 392,859 440,877 (105,747) 1,669,263Change in Total Shares Outstanding 6,261,401 19,417,547 20,033,295 71,900,079
See accompanying Notes to Financial Statements�

94 DIAMOND HILL FUNDS | SEMI-ANNUAL REPORT | JUNE 30, 2021 | DIAMOND-HILL.COM
High Yield FundFor the
six months ended
June 30, 2021 (Unaudited)
For the year ended
December 31, 2020
From OperationsNet investment income $ 24,579,444 $ 22,587,848Net realized gains on investment transactions 20,177,231 31,258,338Net change in unrealized appreciation (depreciation) on investments (7,831,635) 31,260,240Change in Net Assets from Operations 36,925,040 85,106,426
Distributions to ShareholdersInvestor (1,605,754) (2,882,219)Class I (22,948,855) (44,898,316)Class Y (1,163,737) (1,835,089)
Change in Net Assets from Distributions to Shareholders (25,718,346) (49,615,624)Change in Net Assets from Capital Transactions 412,806,560 553,254,683
Total Change in Net Assets 424,013,254 588,745,485
Net Assets:Beginning of period 723,502,948 134,757,463End of period $ 1,147,516,202 $ 723,502,948
See accompanying Notes to Financial Statements�
Diamond Hill Funds Statements of Changes in Net Assets

DIAMOND HILL FUNDS | SEMI-ANNUAL REPORT | JUNE 30, 2021 | DIAMOND-HILL.COM 95
High Yield FundFor the
six months ended
June 30, 2021 (Unaudited)
For the year ended
December 31, 2020
Capital TransactionsInvestorProceeds from shares sold $ 51,494,513 $ 46,859,794Reinvested distributions 1,572,917 2,840,041Payments for shares redeemed (15,295,940) (29,308,482)Change in Net Assets from Investor Share Transactions 37,771,490 20,391,353Class IProceeds from shares sold 506,596,913 714,879,550Reinvested distributions 18,607,685 33,262,831Payments for shares redeemed (166,198,005) (227,531,786)Change in Net Assets from Class I Share Transactions 359,006,593 520,610,595Class YProceeds from shares sold 21,804,199 36,139,761Reinvested distributions 1,163,737 1,835,088Payments for shares redeemed (6,939,459) (25,722,114)Change in Net Assets from Class Y Share Transactions 16,028,477 12,252,735Change in Net Assets from Capital Transactions $ 412,806,560 $ 553,254,683
Share Transactions:InvestorIssued 4,483,265 4,280,516Reinvested 137,225 253,026Redeemed (1,332,552) (2,702,357)Change in Shares Outstanding 3,287,938 1,831,185Class IIssued 44,108,705 65,986,467Reinvested 1,622,639 2,945,718Redeemed (14,484,275) (20,535,794)Change in Shares Outstanding 31,247,069 48,396,391Class YIssued 1,900,906 3,248,053Reinvested 101,361 163,012Redeemed (605,311) (2,424,537)Change in Shares Outstanding 1,396,956 986,528Change in Total Shares Outstanding 35,931,963 51,214,104
See accompanying Notes to Financial Statements�
Diamond Hill Funds Statements of Changes in Net Assets

96 DIAMOND HILL FUNDS | SEMI-ANNUAL REPORT | JUNE 30, 2021 | DIAMOND-HILL.COM
Small Cap Fund
Net asset value,
beginning of period
Net investment
income (loss)(A)
Net realized and
unrealized gains
(losses) on investments
Total from investment operations
Dividends from net
investment income
Distributions from net realized
capital gainsTotal
distributions
Net asset value, end of
periodTotal
return(B)
Net assets, end of period (000’s)
Ratio of total net expenses
to average net assets
Ratio of total gross
expenses to average net
assets(C)
Ratio of net investment
income (loss) to
average net assets
Portfolio turnover
rate(D)
Investor (formerly Class A)For the six months ended June 30, 2021 (Unaudited) $ 30�96 (0�05) 6�45 6�40 — — — $ 37�36 20�67%(E) $ 130,324 1�26%(F) 1�26%(F) (0�26)%(F) 14%(E)
For the year ended December 31, 2020 $ 31�23 0�01 (0�18) (0�17) (0�10) — (0�10) $ 30�96 (0�55)% $ 117,491 1�26% 1�26% 0�05% 34%For the year ended December 31, 2019 $ 27�54 0�06 5�80 5�86 (0�34) (1�83) (2�17) $ 31�23 21�36% $ 165,339 1�27% 1�27% 0�23% 22%For the year ended December 31, 2018 $ 35�62 0�12 (5�37) (5�25) — (2�83) (2�83) $ 27�54 (15�12)% $ 214,831 1�25% 1�26% 0�31% 23%For the year ended December 31, 2017 $ 34�39 0�06 3�55 3�61 (0�13) (2�25) (2�38) $ 35�62 10�62% $ 357,512 1�27% 1�28% 0�11% 7%For the year ended December 31, 2016 $ 30�89 0�00(G) 4�36 4�36 — (0�86) (0�86) $ 34�39 14�10% $ 439,681 1�29% 1�29% 0�00%(H) 15%
Class IFor the six months ended June 30, 2021 (Unaudited) $ 31�49 0�01 6�56 6�57 — — — $ 38�06 20�86%(E) $ 390,228 0�97%(F) 0�97%(F) 0�03%(F) 14%(E)
For the year ended December 31, 2020 $ 31�77 0�09 (0�18) (0�09) (0�19) — (0�19) $ 31�49 (0�28)% $ 350,375 0�97% 0�97% 0�33% 34%For the year ended December 31, 2019 $ 27�98 0�16 5�90 6�06 (0�44) (1�83) (2�27) $ 31�77 21�75% $ 469,014 0�98% 0�98% 0�52% 22%For the year ended December 31, 2018 $ 36�15 0�23 (5�48) (5�25) (0�09) (2�83) (2�92) $ 27�98 (14�88)% $ 633,323 0�96% 0�97% 0�64% 23%For the year ended December 31, 2017 $ 34�87 0�17 3�61 3�78 (0�25) (2�25) (2�50) $ 36�15 10�95% $ 877,913 0�97% 0�98% 0�41% 7%For the year ended December 31, 2016 $ 31�28 0�10 4�42 4�52 (0�07) (0�86) (0�93) $ 34�87 14�45% $ 1,073,671 0�99% 0�99% 0�32% 15%
Class YFor the six months ended June 30, 2021 (Unaudited) $ 31�52 0�03 6�57 6�60 — — — $ 38�12 20�94%(E) $ 56,764 0�85%(F) 0�85%(F) 0�15%(F) 14%(E)
For the year ended December 31, 2020 $ 31�80 0�12 (0�17) (0�05) (0�23) — (0�23) $ 31�52 (0�17)% $ 56,417 0�85% 0�85% 0�46% 34%For the year ended December 31, 2019 $ 28�01 0�19 5�91 6�10 (0�48) (1�83) (2�31) $ 31�80 21�88% $ 105,030 0�86% 0�86% 0�62% 22%For the year ended December 31, 2018 $ 36�17 0�27 (5�48) (5�21) (0�12) (2�83) (2�95) $ 28�01 (14�79)% $ 147,363 0�84% 0�85% 0�74% 23%For the year ended December 31, 2017 $ 34�89 0�20 3�62 3�82 (0�29) (2�25) (2�54) $ 36�17 11�06% $ 207,770 0�87% 0�88% 0�53% 7%For the year ended December 31, 2016 $ 31�29 0�13 4�43 4�56 (0�10) (0�86) (0�96) $ 34�89 14�57% $ 221,827 0�89% 0�89% 0�40% 15%
(A) Net investment income (loss) per share has been calculated using the average daily shares outstanding during the period�
(B) Total returns shown exclude the effect of applicable sales charges for periods prior to June 30, 2021�(C) The Fund’s adviser has contractually agreed to waive fees in the pro-rata amount of the management fee charged
by the underlying Diamond Hill Fund on each Fund’s investment in such other Diamond Hill Fund� If such fee waiver had not occurred, the ratios would have been as indicated�
See accompanying Notes to Financial Statements�
Small Cap Fund Financial Highlights
Selected data for a share outstanding throughout the periods indicated
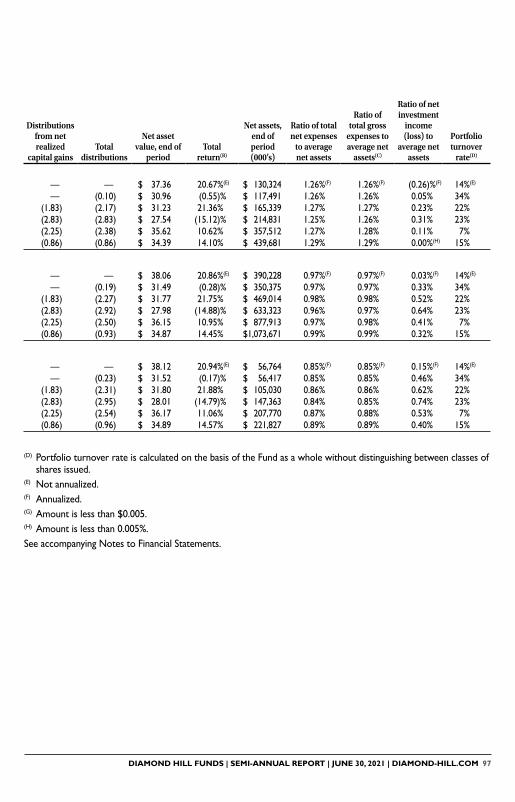
DIAMOND HILL FUNDS | SEMI-ANNUAL REPORT | JUNE 30, 2021 | DIAMOND-HILL.COM 97
Small Cap Fund
Net asset value,
beginning of period
Net investment
income (loss)(A)
Net realized and
unrealized gains
(losses) on investments
Total from investment operations
Dividends from net
investment income
Distributions from net realized
capital gainsTotal
distributions
Net asset value, end of
periodTotal
return(B)
Net assets, end of period (000’s)
Ratio of total net expenses
to average net assets
Ratio of total gross
expenses to average net
assets(C)
Ratio of net investment
income (loss) to
average net assets
Portfolio turnover
rate(D)
Investor (formerly Class A)For the six months ended June 30, 2021 (Unaudited) $ 30�96 (0�05) 6�45 6�40 — — — $ 37�36 20�67%(E) $ 130,324 1�26%(F) 1�26%(F) (0�26)%(F) 14%(E)
For the year ended December 31, 2020 $ 31�23 0�01 (0�18) (0�17) (0�10) — (0�10) $ 30�96 (0�55)% $ 117,491 1�26% 1�26% 0�05% 34%For the year ended December 31, 2019 $ 27�54 0�06 5�80 5�86 (0�34) (1�83) (2�17) $ 31�23 21�36% $ 165,339 1�27% 1�27% 0�23% 22%For the year ended December 31, 2018 $ 35�62 0�12 (5�37) (5�25) — (2�83) (2�83) $ 27�54 (15�12)% $ 214,831 1�25% 1�26% 0�31% 23%For the year ended December 31, 2017 $ 34�39 0�06 3�55 3�61 (0�13) (2�25) (2�38) $ 35�62 10�62% $ 357,512 1�27% 1�28% 0�11% 7%For the year ended December 31, 2016 $ 30�89 0�00(G) 4�36 4�36 — (0�86) (0�86) $ 34�39 14�10% $ 439,681 1�29% 1�29% 0�00%(H) 15%
Class IFor the six months ended June 30, 2021 (Unaudited) $ 31�49 0�01 6�56 6�57 — — — $ 38�06 20�86%(E) $ 390,228 0�97%(F) 0�97%(F) 0�03%(F) 14%(E)
For the year ended December 31, 2020 $ 31�77 0�09 (0�18) (0�09) (0�19) — (0�19) $ 31�49 (0�28)% $ 350,375 0�97% 0�97% 0�33% 34%For the year ended December 31, 2019 $ 27�98 0�16 5�90 6�06 (0�44) (1�83) (2�27) $ 31�77 21�75% $ 469,014 0�98% 0�98% 0�52% 22%For the year ended December 31, 2018 $ 36�15 0�23 (5�48) (5�25) (0�09) (2�83) (2�92) $ 27�98 (14�88)% $ 633,323 0�96% 0�97% 0�64% 23%For the year ended December 31, 2017 $ 34�87 0�17 3�61 3�78 (0�25) (2�25) (2�50) $ 36�15 10�95% $ 877,913 0�97% 0�98% 0�41% 7%For the year ended December 31, 2016 $ 31�28 0�10 4�42 4�52 (0�07) (0�86) (0�93) $ 34�87 14�45% $ 1,073,671 0�99% 0�99% 0�32% 15%
Class YFor the six months ended June 30, 2021 (Unaudited) $ 31�52 0�03 6�57 6�60 — — — $ 38�12 20�94%(E) $ 56,764 0�85%(F) 0�85%(F) 0�15%(F) 14%(E)
For the year ended December 31, 2020 $ 31�80 0�12 (0�17) (0�05) (0�23) — (0�23) $ 31�52 (0�17)% $ 56,417 0�85% 0�85% 0�46% 34%For the year ended December 31, 2019 $ 28�01 0�19 5�91 6�10 (0�48) (1�83) (2�31) $ 31�80 21�88% $ 105,030 0�86% 0�86% 0�62% 22%For the year ended December 31, 2018 $ 36�17 0�27 (5�48) (5�21) (0�12) (2�83) (2�95) $ 28�01 (14�79)% $ 147,363 0�84% 0�85% 0�74% 23%For the year ended December 31, 2017 $ 34�89 0�20 3�62 3�82 (0�29) (2�25) (2�54) $ 36�17 11�06% $ 207,770 0�87% 0�88% 0�53% 7%For the year ended December 31, 2016 $ 31�29 0�13 4�43 4�56 (0�10) (0�86) (0�96) $ 34�89 14�57% $ 221,827 0�89% 0�89% 0�40% 15%
(D) Portfolio turnover rate is calculated on the basis of the Fund as a whole without distinguishing between classes of shares issued�
(E) Not annualized�(F) Annualized�(G) Amount is less than $0�005�(H) Amount is less than 0�005%�See accompanying Notes to Financial Statements�

98 DIAMOND HILL FUNDS | SEMI-ANNUAL REPORT | JUNE 30, 2021 | DIAMOND-HILL.COM
Small-Mid Cap Fund
Net asset value,
beginning of period
Net investment
income (loss)(A)
Net realized and
unrealized gains
(losses) on investments
Total from investment operations
Dividends from net
investment income
Distributions from net realized
capital gainsTotal
distributions
Net asset value, end of
periodTotal
return(B)
Net assets, end of period (000’s)
Ratio of total net expenses
to average net assets
Ratio of total gross
expenses to average net
assets(C)
Ratio of net investment
income (loss) to
average net assets
Portfolio turnover
rate(D)
Investor (formerly Class A)For the six months ended June 30, 2021 (Unaudited) $ 22�69 (0�02) 4�76 4�74 — — — $ 27�43 20�89%(E) $ 198,710 1�21%(F) 1�21%(F) (0�16)%(F) 6%(E)
For the year ended December 31, 2020 $ 22�57 0�03 0�20 0�23 (0�10) (0�01) (0�11) $ 22�69 1�03% $ 162,637 1�20% 1�21% 0�19% 31%(G)
For the year ended December 31, 2019 $ 18�59 0�04 5�02 5�06 (0�14) (0�94) (1�08) $ 22�57 27�33% $ 183,914 1�21% 1�22% 0�21% 14%For the year ended December 31, 2018 $ 22�24 0�05 (2�86) (2�81) (0�04) (0�80) (0�84) $ 18�59 (12�80)% $ 164,037 1�20% 1�21% 0�21% 26%For the year ended December 31, 2017 $ 21�18 0�03 1�73 1�76 (0�03) (0�67) (0�70) $ 22�24 8�35% $ 229,411 1�22% 1�23% 0�09% 15%For the year ended December 31, 2016 $ 18�29 0�01 3�25 3�26 (0�01) (0�36) (0�37) $ 21�18 17�81% $ 288,634 1�24% 1�24% 0�12% 17%
Class IFor the six months ended June 30, 2021 (Unaudited) $ 22�93 0�02 4�81 4�83 — — — $ 27�76 21�06%(E) $ 1,002,770 0�92%(F) 0�92%(F) 0�12%(F) 6%(E)
For the year ended December 31, 2020 $ 22�80 0�09 0�21 0�30 (0�16) (0�01) (0�17) $ 22�93 1�31% $ 889,148 0�91% 0�92% 0�49% 31%(G)
For the year ended December 31, 2019 $ 18�76 0�11 5�08 5�19 (0�21) (0�94) (1�15) $ 22�80 27�74% $ 1,081,619 0�92% 0�93% 0�50% 14%For the year ended December 31, 2018 $ 22�45 0�12 (2�91) (2�79) (0�10) (0�80) (0�90) $ 18�76 (12�56)% $ 889,471 0�91% 0�92% 0�52% 26%For the year ended December 31, 2017 $ 21�39 0�10 1�74 1�84 (0�11) (0�67) (0�78) $ 22�45 8�63% $ 1,114,337 0�92% 0�93% 0�41% 15%For the year ended December 31, 2016 $ 18�46 0�07 3�29 3�36 (0�07) (0�36) (0�43) $ 21�39 18�18% $ 1,015,403 0�94% 0�94% 0�41% 17%
Class YFor the six months ended June 30, 2021 (Unaudited) $ 22�99 0�03 4�82 4�85 — — — $ 27�84 21�10%(E) $ 978,081 0�80%(F) 0�80%(F) 0�24%(F) 6%(E)
For the year ended December 31, 2020 $ 22�84 0�12 0�22 0�34 (0�18) (0�01) (0�19) $ 22�99 1�50% $ 888,375 0�79% 0�80% 0�61% 31%(G)
For the year ended December 31, 2019 $ 18�80 0�13 5�08 5�21 (0�23) (0�94) (1�17) $ 22�84 27�82% $ 1,147,458 0�80% 0�81% 0�62% 14%For the year ended December 31, 2018 $ 22�49 0�15 (2�91) (2�76) (0�13) (0�80) (0�93) $ 18�80 (12�42)% $ 924,995 0�79% 0�80% 0�63% 26%For the year ended December 31, 2017 $ 21�42 0�12 1�75 1�87 (0�13) (0�67) (0�80) $ 22�49 8�77% $ 1,131,583 0�82% 0�83% 0�51% 15%For the year ended December 31, 2016 $ 18�48 0�09 3�29 3�38 (0�08) (0�36) (0�44) $ 21�42 18�29% $ 961,721 0�84% 0�84% 0�49% 17%
Small-Mid Cap Fund Financial Highlights
Selected data for a share outstanding throughout the periods indicated
(A) Net investment income (loss) per share has been calculated using the average daily shares outstanding during the period�
(B) Total returns shown exclude the effect of applicable sales charges for periods prior to June 30, 2021�(C) The Fund’s adviser has contractually agreed to waive fees in the pro-rata amount of the management fee charged
by the underlying Diamond Hill Fund on each Fund’s investment in such other Diamond Hill Fund� If such fee waiver had not occurred, the ratios would have been as indicated�
See accompanying Notes to Financial Statements�

DIAMOND HILL FUNDS | SEMI-ANNUAL REPORT | JUNE 30, 2021 | DIAMOND-HILL.COM 99
Small-Mid Cap Fund
Net asset value,
beginning of period
Net investment
income (loss)(A)
Net realized and
unrealized gains
(losses) on investments
Total from investment operations
Dividends from net
investment income
Distributions from net realized
capital gainsTotal
distributions
Net asset value, end of
periodTotal
return(B)
Net assets, end of period (000’s)
Ratio of total net expenses
to average net assets
Ratio of total gross
expenses to average net
assets(C)
Ratio of net investment
income (loss) to
average net assets
Portfolio turnover
rate(D)
Investor (formerly Class A)For the six months ended June 30, 2021 (Unaudited) $ 22�69 (0�02) 4�76 4�74 — — — $ 27�43 20�89%(E) $ 198,710 1�21%(F) 1�21%(F) (0�16)%(F) 6%(E)
For the year ended December 31, 2020 $ 22�57 0�03 0�20 0�23 (0�10) (0�01) (0�11) $ 22�69 1�03% $ 162,637 1�20% 1�21% 0�19% 31%(G)
For the year ended December 31, 2019 $ 18�59 0�04 5�02 5�06 (0�14) (0�94) (1�08) $ 22�57 27�33% $ 183,914 1�21% 1�22% 0�21% 14%For the year ended December 31, 2018 $ 22�24 0�05 (2�86) (2�81) (0�04) (0�80) (0�84) $ 18�59 (12�80)% $ 164,037 1�20% 1�21% 0�21% 26%For the year ended December 31, 2017 $ 21�18 0�03 1�73 1�76 (0�03) (0�67) (0�70) $ 22�24 8�35% $ 229,411 1�22% 1�23% 0�09% 15%For the year ended December 31, 2016 $ 18�29 0�01 3�25 3�26 (0�01) (0�36) (0�37) $ 21�18 17�81% $ 288,634 1�24% 1�24% 0�12% 17%
Class IFor the six months ended June 30, 2021 (Unaudited) $ 22�93 0�02 4�81 4�83 — — — $ 27�76 21�06%(E) $ 1,002,770 0�92%(F) 0�92%(F) 0�12%(F) 6%(E)
For the year ended December 31, 2020 $ 22�80 0�09 0�21 0�30 (0�16) (0�01) (0�17) $ 22�93 1�31% $ 889,148 0�91% 0�92% 0�49% 31%(G)
For the year ended December 31, 2019 $ 18�76 0�11 5�08 5�19 (0�21) (0�94) (1�15) $ 22�80 27�74% $ 1,081,619 0�92% 0�93% 0�50% 14%For the year ended December 31, 2018 $ 22�45 0�12 (2�91) (2�79) (0�10) (0�80) (0�90) $ 18�76 (12�56)% $ 889,471 0�91% 0�92% 0�52% 26%For the year ended December 31, 2017 $ 21�39 0�10 1�74 1�84 (0�11) (0�67) (0�78) $ 22�45 8�63% $ 1,114,337 0�92% 0�93% 0�41% 15%For the year ended December 31, 2016 $ 18�46 0�07 3�29 3�36 (0�07) (0�36) (0�43) $ 21�39 18�18% $ 1,015,403 0�94% 0�94% 0�41% 17%
Class YFor the six months ended June 30, 2021 (Unaudited) $ 22�99 0�03 4�82 4�85 — — — $ 27�84 21�10%(E) $ 978,081 0�80%(F) 0�80%(F) 0�24%(F) 6%(E)
For the year ended December 31, 2020 $ 22�84 0�12 0�22 0�34 (0�18) (0�01) (0�19) $ 22�99 1�50% $ 888,375 0�79% 0�80% 0�61% 31%(G)
For the year ended December 31, 2019 $ 18�80 0�13 5�08 5�21 (0�23) (0�94) (1�17) $ 22�84 27�82% $ 1,147,458 0�80% 0�81% 0�62% 14%For the year ended December 31, 2018 $ 22�49 0�15 (2�91) (2�76) (0�13) (0�80) (0�93) $ 18�80 (12�42)% $ 924,995 0�79% 0�80% 0�63% 26%For the year ended December 31, 2017 $ 21�42 0�12 1�75 1�87 (0�13) (0�67) (0�80) $ 22�49 8�77% $ 1,131,583 0�82% 0�83% 0�51% 15%For the year ended December 31, 2016 $ 18�48 0�09 3�29 3�38 (0�08) (0�36) (0�44) $ 21�42 18�29% $ 961,721 0�84% 0�84% 0�49% 17%
(D) Portfolio turnover rate is calculated on the basis of the Fund as a whole without distinguishing between classes of shares issued�
(E) Not annualized�(F) Annualized�(G) Portfolio turnover does not include redemptions in-kind�See accompanying Notes to Financial Statements�
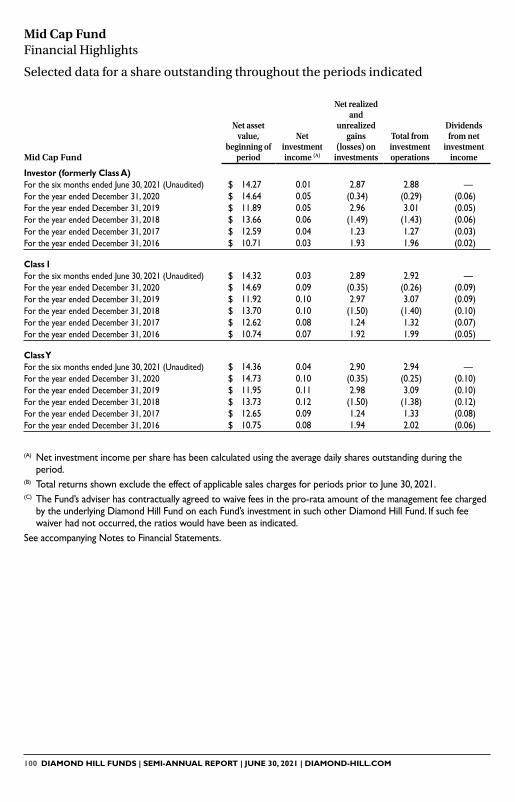
100 DIAMOND HILL FUNDS | SEMI-ANNUAL REPORT | JUNE 30, 2021 | DIAMOND-HILL.COM
Mid Cap Fund
Net asset value,
beginning of period
Net investment income (A)
Net realized and
unrealized gains
(losses) on investments
Total from investment operations
Dividends from net
investment income
Distributions from net realized
capital gainsTotal
distributions
Net asset value, end of
periodTotal
return(B)
Net assets, end of period (000’s)
Ratio of total net expenses
to average net assets
Ratio of total gross
expenses to average net
assets(C)
Ratio of net investment income to
average net assets
Portfolio turnover
rate(D)
Investor (formerly Class A)For the six months ended June 30, 2021 (Unaudited) $ 14�27 0�01 2�87 2�88 — — — $ 17�15 20�18%(E) $ 31,536 1�06%(F) 1�06%(F) 0�07%(F) 5%(E)
For the year ended December 31, 2020 $ 14�64 0�05 (0�34) (0�29) (0�06) (0�02) (0�08) $ 14�27 (2�01)% $ 33,178 1�06% 1�06% 0�41% 52%For the year ended December 31, 2019 $ 11�89 0�05 2�96 3�01 (0�05) (0�21) (0�26) $ 14�64 25�36% $ 31,997 1�06% 1�07% 0�36% 31%For the year ended December 31, 2018 $ 13�66 0�06 (1�49) (1�43) (0�06) (0�28) (0�34) $ 11�89 (10�56)% $ 21,085 1�05% 1�06% 0�43% 20%For the year ended December 31, 2017 $ 12�59 0�04 1�23 1�27 (0�03) (0�17) (0�20) $ 13�66 10�13% $ 25,853 1�07% 1�08% 0�28% 11%For the year ended December 31, 2016 $ 10�71 0�03 1�93 1�96 (0�02) (0�06) (0�08) $ 12�59 18�29% $ 7,403 1�14% 1�14% 0�31% 17%
Class IFor the six months ended June 30, 2021 (Unaudited) $ 14�32 0�03 2�89 2�92 — — — $ 17�24 20�39%(E) $ 218,882 0�77%(F) 0�77%(F) 0�35%(F) 5%(E)
For the year ended December 31, 2020 $ 14�69 0�09 (0�35) (0�26) (0�09) (0�02) (0�11) $ 14�32 (1�76)% $ 194,354 0�77% 0�77% 0�71% 52%For the year ended December 31, 2019 $ 11�92 0�10 2�97 3�07 (0�09) (0�21) (0�30) $ 14�69 25�82% $ 177,536 0�77% 0�78% 0�68% 31%For the year ended December 31, 2018 $ 13�70 0�10 (1�50) (1�40) (0�10) (0�28) (0�38) $ 11�92 (10�31)% $ 55,045 0�76% 0�77% 0�72% 20%For the year ended December 31, 2017 $ 12�62 0�08 1�24 1�32 (0�07) (0�17) (0�24) $ 13�70 10�47% $ 63,298 0�77% 0�79% 0�57% 11%For the year ended December 31, 2016 $ 10�74 0�07 1�92 1�99 (0�05) (0�06) (0�11) $ 12�62 18�56% $ 28,031 0�85% 0�85% 0�67% 17%
Class YFor the six months ended June 30, 2021 (Unaudited) $ 14�36 0�04 2�90 2�94 — — — $ 17�30 20�47%(E) $ 26,345 0�65%(F) 0�65%(F) 0�47%(F) 5%(E)
For the year ended December 31, 2020 $ 14�73 0�10 (0�35) (0�25) (0�10) (0�02) (0�12) $ 14�36 (1�66)% $ 23,248 0�65% 0�65% 0�82% 52%For the year ended December 31, 2019 $ 11�95 0�11 2�98 3�09 (0�10) (0�21) (0�31) $ 14�73 25�91% $ 20,454 0�65% 0�66% 0�74% 31%For the year ended December 31, 2018 $ 13�73 0�12 (1�50) (1�38) (0�12) (0�28) (0�40) $ 11�95 (10�17)% $ 27,761 0�64% 0�65% 0�83% 20%For the year ended December 31, 2017 $ 12�65 0�09 1�24 1�33 (0�08) (0�17) (0�25) $ 13�73 10�51% $ 32,943 0�67% 0�68% 0�65% 11%For the year ended December 31, 2016 $ 10�75 0�08 1�94 2�02 (0�06) (0�06) (0�12) $ 12�65 18�76% $ 23,383 0�75% 0�75% 0�71% 17%
Mid Cap Fund Financial Highlights
Selected data for a share outstanding throughout the periods indicated
(A) Net investment income per share has been calculated using the average daily shares outstanding during the period�
(B) Total returns shown exclude the effect of applicable sales charges for periods prior to June 30, 2021�(C) The Fund’s adviser has contractually agreed to waive fees in the pro-rata amount of the management fee charged
by the underlying Diamond Hill Fund on each Fund’s investment in such other Diamond Hill Fund� If such fee waiver had not occurred, the ratios would have been as indicated�
See accompanying Notes to Financial Statements�
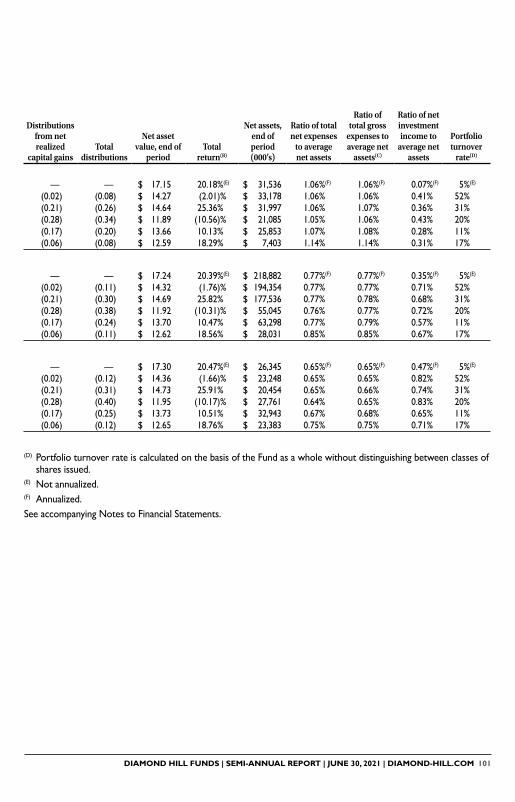
DIAMOND HILL FUNDS | SEMI-ANNUAL REPORT | JUNE 30, 2021 | DIAMOND-HILL.COM 101
Mid Cap Fund
Net asset value,
beginning of period
Net investment income (A)
Net realized and
unrealized gains
(losses) on investments
Total from investment operations
Dividends from net
investment income
Distributions from net realized
capital gainsTotal
distributions
Net asset value, end of
periodTotal
return(B)
Net assets, end of period (000’s)
Ratio of total net expenses
to average net assets
Ratio of total gross
expenses to average net
assets(C)
Ratio of net investment income to
average net assets
Portfolio turnover
rate(D)
Investor (formerly Class A)For the six months ended June 30, 2021 (Unaudited) $ 14�27 0�01 2�87 2�88 — — — $ 17�15 20�18%(E) $ 31,536 1�06%(F) 1�06%(F) 0�07%(F) 5%(E)
For the year ended December 31, 2020 $ 14�64 0�05 (0�34) (0�29) (0�06) (0�02) (0�08) $ 14�27 (2�01)% $ 33,178 1�06% 1�06% 0�41% 52%For the year ended December 31, 2019 $ 11�89 0�05 2�96 3�01 (0�05) (0�21) (0�26) $ 14�64 25�36% $ 31,997 1�06% 1�07% 0�36% 31%For the year ended December 31, 2018 $ 13�66 0�06 (1�49) (1�43) (0�06) (0�28) (0�34) $ 11�89 (10�56)% $ 21,085 1�05% 1�06% 0�43% 20%For the year ended December 31, 2017 $ 12�59 0�04 1�23 1�27 (0�03) (0�17) (0�20) $ 13�66 10�13% $ 25,853 1�07% 1�08% 0�28% 11%For the year ended December 31, 2016 $ 10�71 0�03 1�93 1�96 (0�02) (0�06) (0�08) $ 12�59 18�29% $ 7,403 1�14% 1�14% 0�31% 17%
Class IFor the six months ended June 30, 2021 (Unaudited) $ 14�32 0�03 2�89 2�92 — — — $ 17�24 20�39%(E) $ 218,882 0�77%(F) 0�77%(F) 0�35%(F) 5%(E)
For the year ended December 31, 2020 $ 14�69 0�09 (0�35) (0�26) (0�09) (0�02) (0�11) $ 14�32 (1�76)% $ 194,354 0�77% 0�77% 0�71% 52%For the year ended December 31, 2019 $ 11�92 0�10 2�97 3�07 (0�09) (0�21) (0�30) $ 14�69 25�82% $ 177,536 0�77% 0�78% 0�68% 31%For the year ended December 31, 2018 $ 13�70 0�10 (1�50) (1�40) (0�10) (0�28) (0�38) $ 11�92 (10�31)% $ 55,045 0�76% 0�77% 0�72% 20%For the year ended December 31, 2017 $ 12�62 0�08 1�24 1�32 (0�07) (0�17) (0�24) $ 13�70 10�47% $ 63,298 0�77% 0�79% 0�57% 11%For the year ended December 31, 2016 $ 10�74 0�07 1�92 1�99 (0�05) (0�06) (0�11) $ 12�62 18�56% $ 28,031 0�85% 0�85% 0�67% 17%
Class YFor the six months ended June 30, 2021 (Unaudited) $ 14�36 0�04 2�90 2�94 — — — $ 17�30 20�47%(E) $ 26,345 0�65%(F) 0�65%(F) 0�47%(F) 5%(E)
For the year ended December 31, 2020 $ 14�73 0�10 (0�35) (0�25) (0�10) (0�02) (0�12) $ 14�36 (1�66)% $ 23,248 0�65% 0�65% 0�82% 52%For the year ended December 31, 2019 $ 11�95 0�11 2�98 3�09 (0�10) (0�21) (0�31) $ 14�73 25�91% $ 20,454 0�65% 0�66% 0�74% 31%For the year ended December 31, 2018 $ 13�73 0�12 (1�50) (1�38) (0�12) (0�28) (0�40) $ 11�95 (10�17)% $ 27,761 0�64% 0�65% 0�83% 20%For the year ended December 31, 2017 $ 12�65 0�09 1�24 1�33 (0�08) (0�17) (0�25) $ 13�73 10�51% $ 32,943 0�67% 0�68% 0�65% 11%For the year ended December 31, 2016 $ 10�75 0�08 1�94 2�02 (0�06) (0�06) (0�12) $ 12�65 18�76% $ 23,383 0�75% 0�75% 0�71% 17%
(D) Portfolio turnover rate is calculated on the basis of the Fund as a whole without distinguishing between classes of shares issued�
(E) Not annualized�(F) Annualized�See accompanying Notes to Financial Statements�

102 DIAMOND HILL FUNDS | SEMI-ANNUAL REPORT | JUNE 30, 2021 | DIAMOND-HILL.COM
Large Cap Fund
Net asset value,
beginning of period
Net investment income(A)
Net realized and
unrealized gains
(losses) on investments
Total from investment operations
Dividends from net
investment income
Distributions from net realized
capital gainsTotal
distributions
Net asset value, end of
periodTotal
return(B)
Net assets, end of period
(000,000’s)
Ratio of total net expenses
to average net assets
Ratio of net investment income to
average net assets
Portfolio turnover
rate(C)
Investor (formerly Class A)For the six months ended June 30, 2021 (Unaudited) $ 30�42 0�13 4�47 4�60 — — — $ 35�02 15�12%(D) $ 978 0�96%(E) 0�77%(E) 9%(D)(F)
For the year ended December 31, 2020 $ 28�86 0�28 2�19 2�47 (0�18) (0�73) (0�91) $ 30�42 8�65% $ 763 0�96% 1�04% 33%For the year ended December 31, 2019 $ 22�89 0�28 6�99 7�27 (0�26) (1�04) (1�30) $ 28�86 31�80% $ 1,243 0�97% 1�03% 22%(G)
For the year ended December 31, 2018 $ 26�45 0�25 (2�83) (2�58) (0�26) (0�72) (0�98) $ 22�89 (9�88)% $ 1,031 0�96% 0�95% 29%(F)
For the year ended December 31, 2017 $ 23�06 0�24 4�35 4�59 (0�20) (1�00) (1�20) $ 26�45 19�95% $ 1,347 0�98% 0�96% 18%For the year ended December 31, 2016 $ 21�44 0�25 2�82 3�07 (0�24) (1�21) (1�45) $ 23�06 14�26% $ 1,159 0�99% 1�12% 23%
Class IFor the six months ended June 30, 2021 (Unaudited) $ 30�57 0�18 4�50 4�68 — — — $ 35�25 15�31%(D) $ 7,517 0�67%(E) 1�06%(E) 9%(D)(F)
For the year ended December 31, 2020 $ 29�05 0�36 2�22 2�58 (0�33) (0�73) (1�06) $ 30�57 8�97% $ 5,140 0�67% 1�33% 33%For the year ended December 31, 2019 $ 23�03 0�36 7�04 7�40 (0�34) (1�04) (1�38) $ 29�05 32�18% $ 3,878 0�68% 1�32% 22%(G)
For the year ended December 31, 2018 $ 26�62 0�33 (2�86) (2�53) (0�34) (0�72) (1�06) $ 23�03 (9�63)% $ 2,978 0�67% 1�23% 29%(F)
For the year ended December 31, 2017 $ 23�20 0�32 4�38 4�70 (0�28) (1�00) (1�28) $ 26�62 20�30% $ 3,539 0�68% 1�25% 18%For the year ended December 31, 2016 $ 21�55 0�31 2�86 3�17 (0�31) (1�21) (1�52) $ 23�20 14�63% $ 2,156 0�70% 1�41% 23%
Class YFor the six months ended June 30, 2021 (Unaudited) $ 30�59 0�20 4�50 4�70 — — — $ 35�29 15�36%(D) $ 2,906 0�55%(E) 1�18%(E) 9%(D)(F)
For the year ended December 31, 2020 $ 29�07 0�40 2�21 2�61 (0�36) (0�73) (1�09) $ 30�59 9�07% $ 2,340 0�55% 1�45% 33%For the year ended December 31, 2019 $ 23�04 0�40 7�05 7�45 (0�38) (1�04) (1�42) $ 29�07 32�34% $ 1,568 0�56% 1�44% 22%(G)
For the year ended December 31, 2018 $ 26�64 0�36 (2�87) (2�51) (0�37) (0�72) (1�09) $ 23�04 (9�53)% $ 992 0�55% 1�35% 29%(F)
For the year ended December 31, 2017 $ 23�21 0�35 4�38 4�73 (0�30) (1�00) (1�30) $ 26�64 20�42% $ 845 0�58% 1�36% 18%For the year ended December 31, 2016 $ 21�56 0�34 2�85 3�19 (0�33) (1�21) (1�54) $ 23�21 14�74% $ 667 0�60% 1�49% 23%
Large Cap Fund Financial Highlights
Selected data for a share outstanding throughout the periods indicated
(A) Net investment income per share has been calculated using the average daily shares outstanding during the period�
(B) Total returns shown exclude the effect of applicable sales charges for periods prior to June 30, 2021�(C) Portfolio turnover rate is calculated on the basis of the Fund as a whole without distinguishing between classes of
shares issued�See accompanying Notes to Financial Statements�

DIAMOND HILL FUNDS | SEMI-ANNUAL REPORT | JUNE 30, 2021 | DIAMOND-HILL.COM 103
Large Cap Fund
Net asset value,
beginning of period
Net investment income(A)
Net realized and
unrealized gains
(losses) on investments
Total from investment operations
Dividends from net
investment income
Distributions from net realized
capital gainsTotal
distributions
Net asset value, end of
periodTotal
return(B)
Net assets, end of period
(000,000’s)
Ratio of total net expenses
to average net assets
Ratio of net investment income to
average net assets
Portfolio turnover
rate(C)
Investor (formerly Class A)For the six months ended June 30, 2021 (Unaudited) $ 30�42 0�13 4�47 4�60 — — — $ 35�02 15�12%(D) $ 978 0�96%(E) 0�77%(E) 9%(D)(F)
For the year ended December 31, 2020 $ 28�86 0�28 2�19 2�47 (0�18) (0�73) (0�91) $ 30�42 8�65% $ 763 0�96% 1�04% 33%For the year ended December 31, 2019 $ 22�89 0�28 6�99 7�27 (0�26) (1�04) (1�30) $ 28�86 31�80% $ 1,243 0�97% 1�03% 22%(G)
For the year ended December 31, 2018 $ 26�45 0�25 (2�83) (2�58) (0�26) (0�72) (0�98) $ 22�89 (9�88)% $ 1,031 0�96% 0�95% 29%(F)
For the year ended December 31, 2017 $ 23�06 0�24 4�35 4�59 (0�20) (1�00) (1�20) $ 26�45 19�95% $ 1,347 0�98% 0�96% 18%For the year ended December 31, 2016 $ 21�44 0�25 2�82 3�07 (0�24) (1�21) (1�45) $ 23�06 14�26% $ 1,159 0�99% 1�12% 23%
Class IFor the six months ended June 30, 2021 (Unaudited) $ 30�57 0�18 4�50 4�68 — — — $ 35�25 15�31%(D) $ 7,517 0�67%(E) 1�06%(E) 9%(D)(F)
For the year ended December 31, 2020 $ 29�05 0�36 2�22 2�58 (0�33) (0�73) (1�06) $ 30�57 8�97% $ 5,140 0�67% 1�33% 33%For the year ended December 31, 2019 $ 23�03 0�36 7�04 7�40 (0�34) (1�04) (1�38) $ 29�05 32�18% $ 3,878 0�68% 1�32% 22%(G)
For the year ended December 31, 2018 $ 26�62 0�33 (2�86) (2�53) (0�34) (0�72) (1�06) $ 23�03 (9�63)% $ 2,978 0�67% 1�23% 29%(F)
For the year ended December 31, 2017 $ 23�20 0�32 4�38 4�70 (0�28) (1�00) (1�28) $ 26�62 20�30% $ 3,539 0�68% 1�25% 18%For the year ended December 31, 2016 $ 21�55 0�31 2�86 3�17 (0�31) (1�21) (1�52) $ 23�20 14�63% $ 2,156 0�70% 1�41% 23%
Class YFor the six months ended June 30, 2021 (Unaudited) $ 30�59 0�20 4�50 4�70 — — — $ 35�29 15�36%(D) $ 2,906 0�55%(E) 1�18%(E) 9%(D)(F)
For the year ended December 31, 2020 $ 29�07 0�40 2�21 2�61 (0�36) (0�73) (1�09) $ 30�59 9�07% $ 2,340 0�55% 1�45% 33%For the year ended December 31, 2019 $ 23�04 0�40 7�05 7�45 (0�38) (1�04) (1�42) $ 29�07 32�34% $ 1,568 0�56% 1�44% 22%(G)
For the year ended December 31, 2018 $ 26�64 0�36 (2�87) (2�51) (0�37) (0�72) (1�09) $ 23�04 (9�53)% $ 992 0�55% 1�35% 29%(F)
For the year ended December 31, 2017 $ 23�21 0�35 4�38 4�73 (0�30) (1�00) (1�30) $ 26�64 20�42% $ 845 0�58% 1�36% 18%For the year ended December 31, 2016 $ 21�56 0�34 2�85 3�19 (0�33) (1�21) (1�54) $ 23�21 14�74% $ 667 0�60% 1�49% 23%
(D) Not annualized�(E) Annualized�(F) Portfolio turnover does not include redemptions in-kind�(G) Portfolio turnover does not include in-kind subscriptions�See accompanying Notes to Financial Statements�
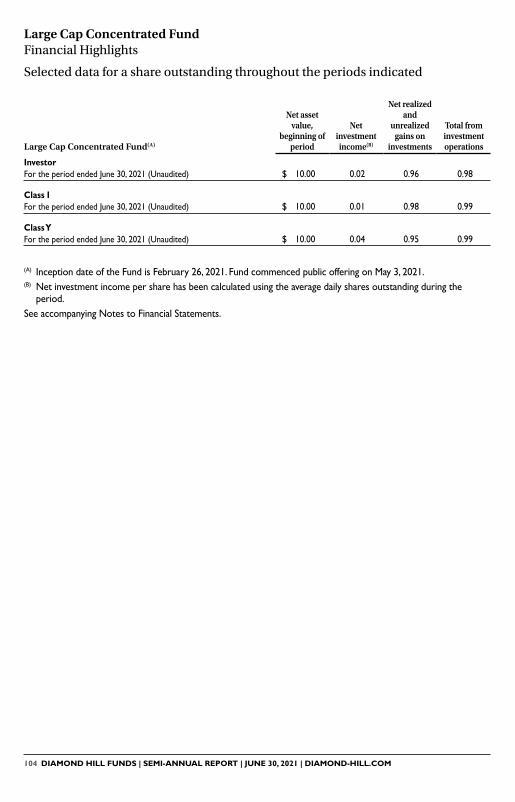
104 DIAMOND HILL FUNDS | SEMI-ANNUAL REPORT | JUNE 30, 2021 | DIAMOND-HILL.COM
Large Cap Concentrated Fund(A)
Net asset value,
beginning of period
Net investment income(B)
Net realized and
unrealized gains on
investments
Total from investment operations
Net asset value, end of
periodTotal
return
Net assets, end of period (000’s)
Ratio of total net expenses
to average net assets
Ratio of net investment income to
average net assets
Portfolio turnover
rate(C)
InvestorFor the period ended June 30, 2021 (Unaudited) $ 10�00 0�02 0�96 0�98 $ 10�98 9�80%(D) $ 22 0�96%(E) 0�44%(E) 8%(D)
Class IFor the period ended June 30, 2021 (Unaudited) $ 10�00 0�01 0�98 0�99 $ 10�99 9�90%(D) $ 1,722 0�67%(E) 0�13%(E) 8%(D)
Class YFor the period ended June 30, 2021 (Unaudited) $ 10�00 0�04 0�95 0�99 $ 10�99 9�90%(D) $ 12,251 0�55%(E) 0�77%(E) 8%(D)
Large Cap Concentrated Fund Financial Highlights
Selected data for a share outstanding throughout the periods indicated
(A) Inception date of the Fund is February 26, 2021� Fund commenced public offering on May 3, 2021�(B) Net investment income per share has been calculated using the average daily shares outstanding during the
period�See accompanying Notes to Financial Statements�

DIAMOND HILL FUNDS | SEMI-ANNUAL REPORT | JUNE 30, 2021 | DIAMOND-HILL.COM 105
Large Cap Concentrated Fund(A)
Net asset value,
beginning of period
Net investment income(B)
Net realized and
unrealized gains on
investments
Total from investment operations
Net asset value, end of
periodTotal
return
Net assets, end of period (000’s)
Ratio of total net expenses
to average net assets
Ratio of net investment income to
average net assets
Portfolio turnover
rate(C)
InvestorFor the period ended June 30, 2021 (Unaudited) $ 10�00 0�02 0�96 0�98 $ 10�98 9�80%(D) $ 22 0�96%(E) 0�44%(E) 8%(D)
Class IFor the period ended June 30, 2021 (Unaudited) $ 10�00 0�01 0�98 0�99 $ 10�99 9�90%(D) $ 1,722 0�67%(E) 0�13%(E) 8%(D)
Class YFor the period ended June 30, 2021 (Unaudited) $ 10�00 0�04 0�95 0�99 $ 10�99 9�90%(D) $ 12,251 0�55%(E) 0�77%(E) 8%(D)
(C) Portfolio turnover rate is calculated on the basis of the Fund as a whole without distinguishing between classes of shares issued�
(D) Not annualized�(E) Annualized�See accompanying Notes to Financial Statements�
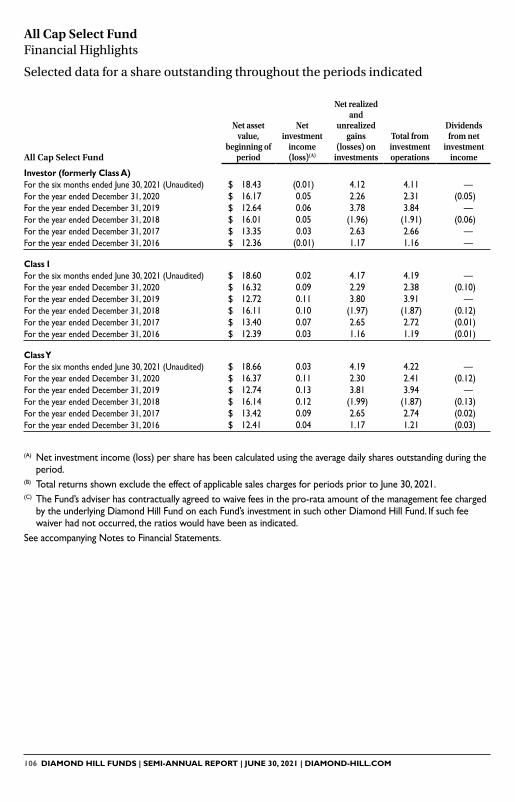
106 DIAMOND HILL FUNDS | SEMI-ANNUAL REPORT | JUNE 30, 2021 | DIAMOND-HILL.COM
All Cap Select Fund
Net asset value,
beginning of period
Net investment
income (loss)(A)
Net realized and
unrealized gains
(losses) on investments
Total from investment operations
Dividends from net
investment income
Distributions from net realized
capital gainsTotal
distributions
Net asset value, end of
periodTotal
return(B)
Net assets, end of period (000’s)
Ratio of total net expenses
to average net assets
Ratio of total gross
expenses to average net
assets(C)
Ratio of net investment
income (loss) to
average net assets
Portfolio turnover
rate(D)
Investor (formerly Class A)For the six months ended June 30, 2021 (Unaudited) $ 18�43 (0�01) 4�12 4�11 — — — $ 22�54 22�30%(E) $ 16,059 1�16%(F) 1�16%(F) (0�11)%(F) 23%(E)
For the year ended December 31, 2020 $ 16�17 0�05 2�26 2�31 (0�05) — (0�05) $ 18�43 14�30% $ 10,207 1�16% 1�16% 0�33% 76%For the year ended December 31, 2019 $ 12�64 0�06 3�78 3�84 — (0�31) (0�31) $ 16�17 30�41% $ 11,049 1�17% 1�17% 0�46% 45%For the year ended December 31, 2018 $ 16�01 0�05 (1�96) (1�91) (0�06) (1�40) (1�46) $ 12�64 (12�31)% $ 8,963 1�16% 1�16% 0�29% 84%For the year ended December 31, 2017 $ 13�35 0�03 2�63 2�66 — — — $ 16�01 19�93% $ 13,480 1�17% 1�18% 0�21% 52%For the year ended December 31, 2016 $ 12�36 (0�01) 1�17 1�16 — (0�17) (0�17) $ 13�35 9�37% $ 14,963 1�19% 1�19% (0�09)% 70%
Class IFor the six months ended June 30, 2021 (Unaudited) $ 18�60 0�02 4�17 4�19 — — — $ 22�79 22�53%(E) $ 199,604 0�87%(F) 0�87%(F) 0�18%(F) 23%(E)
For the year ended December 31, 2020 $ 16�32 0�09 2�29 2�38 (0�10) — (0�10) $ 18�60 14�57% $ 171,263 0�87% 0�87% 0�62% 76%For the year ended December 31, 2019 $ 12�72 0�11 3�80 3�91 — (0�31) (0�31) $ 16�32 30�77% $ 152,591 0�88% 0�88% 0�75% 45%For the year ended December 31, 2018 $ 16�11 0�10 (1�97) (1�87) (0�12) (1�40) (1�52) $ 12�72 (12�02)% $ 114,571 0�87% 0�87% 0�60% 84%For the year ended December 31, 2017 $ 13�40 0�07 2�65 2�72 (0�01) — (0�01) $ 16�11 20�33% $ 136,233 0�87% 0�88% 0�52% 52%For the year ended December 31, 2016 $ 12�39 0�03 1�16 1�19 (0�01) (0�17) (0�18) $ 13�40 9�62% $ 93,192 0�90% 0�90% 0�24% 70%
Class YFor the six months ended June 30, 2021 (Unaudited) $ 18�66 0�03 4�19 4�22 — — — $ 22�88 22�62%(E) $ 144,058 0�75%(F) 0�75%(F) 0�31%(F) 23%(E)
For the year ended December 31, 2020 $ 16�37 0�11 2�30 2�41 (0�12) — (0�12) $ 18�66 14�70% $ 141,244 0�75% 0�75% 0�74% 76%For the year ended December 31, 2019 $ 12�74 0�13 3�81 3�94 — (0�31) (0�31) $ 16�37 30�96% $ 103,963 0�76% 0�76% 0�86% 45%For the year ended December 31, 2018 $ 16�14 0�12 (1�99) (1�87) (0�13) (1�40) (1�53) $ 12�74 (11�95)% $ 65,218 0�75% 0�75% 0�73% 84%For the year ended December 31, 2017 $ 13�42 0�09 2�65 2�74 (0�02) — (0�02) $ 16�14 20�45% $ 21,628 0�77% 0�78% 0�61% 52%For the year ended December 31, 2016 $ 12�41 0�04 1�17 1�21 (0�03) (0�17) (0�20) $ 13�42 9�72% $ 18,456 0�80% 0�80% 0�36% 70%
All Cap Select Fund Financial Highlights
Selected data for a share outstanding throughout the periods indicated
(A) Net investment income (loss) per share has been calculated using the average daily shares outstanding during the period�
(B) Total returns shown exclude the effect of applicable sales charges for periods prior to June 30, 2021�(C) The Fund’s adviser has contractually agreed to waive fees in the pro-rata amount of the management fee charged
by the underlying Diamond Hill Fund on each Fund’s investment in such other Diamond Hill Fund� If such fee waiver had not occurred, the ratios would have been as indicated�
See accompanying Notes to Financial Statements�

DIAMOND HILL FUNDS | SEMI-ANNUAL REPORT | JUNE 30, 2021 | DIAMOND-HILL.COM 107
All Cap Select Fund
Net asset value,
beginning of period
Net investment
income (loss)(A)
Net realized and
unrealized gains
(losses) on investments
Total from investment operations
Dividends from net
investment income
Distributions from net realized
capital gainsTotal
distributions
Net asset value, end of
periodTotal
return(B)
Net assets, end of period (000’s)
Ratio of total net expenses
to average net assets
Ratio of total gross
expenses to average net
assets(C)
Ratio of net investment
income (loss) to
average net assets
Portfolio turnover
rate(D)
Investor (formerly Class A)For the six months ended June 30, 2021 (Unaudited) $ 18�43 (0�01) 4�12 4�11 — — — $ 22�54 22�30%(E) $ 16,059 1�16%(F) 1�16%(F) (0�11)%(F) 23%(E)
For the year ended December 31, 2020 $ 16�17 0�05 2�26 2�31 (0�05) — (0�05) $ 18�43 14�30% $ 10,207 1�16% 1�16% 0�33% 76%For the year ended December 31, 2019 $ 12�64 0�06 3�78 3�84 — (0�31) (0�31) $ 16�17 30�41% $ 11,049 1�17% 1�17% 0�46% 45%For the year ended December 31, 2018 $ 16�01 0�05 (1�96) (1�91) (0�06) (1�40) (1�46) $ 12�64 (12�31)% $ 8,963 1�16% 1�16% 0�29% 84%For the year ended December 31, 2017 $ 13�35 0�03 2�63 2�66 — — — $ 16�01 19�93% $ 13,480 1�17% 1�18% 0�21% 52%For the year ended December 31, 2016 $ 12�36 (0�01) 1�17 1�16 — (0�17) (0�17) $ 13�35 9�37% $ 14,963 1�19% 1�19% (0�09)% 70%
Class IFor the six months ended June 30, 2021 (Unaudited) $ 18�60 0�02 4�17 4�19 — — — $ 22�79 22�53%(E) $ 199,604 0�87%(F) 0�87%(F) 0�18%(F) 23%(E)
For the year ended December 31, 2020 $ 16�32 0�09 2�29 2�38 (0�10) — (0�10) $ 18�60 14�57% $ 171,263 0�87% 0�87% 0�62% 76%For the year ended December 31, 2019 $ 12�72 0�11 3�80 3�91 — (0�31) (0�31) $ 16�32 30�77% $ 152,591 0�88% 0�88% 0�75% 45%For the year ended December 31, 2018 $ 16�11 0�10 (1�97) (1�87) (0�12) (1�40) (1�52) $ 12�72 (12�02)% $ 114,571 0�87% 0�87% 0�60% 84%For the year ended December 31, 2017 $ 13�40 0�07 2�65 2�72 (0�01) — (0�01) $ 16�11 20�33% $ 136,233 0�87% 0�88% 0�52% 52%For the year ended December 31, 2016 $ 12�39 0�03 1�16 1�19 (0�01) (0�17) (0�18) $ 13�40 9�62% $ 93,192 0�90% 0�90% 0�24% 70%
Class YFor the six months ended June 30, 2021 (Unaudited) $ 18�66 0�03 4�19 4�22 — — — $ 22�88 22�62%(E) $ 144,058 0�75%(F) 0�75%(F) 0�31%(F) 23%(E)
For the year ended December 31, 2020 $ 16�37 0�11 2�30 2�41 (0�12) — (0�12) $ 18�66 14�70% $ 141,244 0�75% 0�75% 0�74% 76%For the year ended December 31, 2019 $ 12�74 0�13 3�81 3�94 — (0�31) (0�31) $ 16�37 30�96% $ 103,963 0�76% 0�76% 0�86% 45%For the year ended December 31, 2018 $ 16�14 0�12 (1�99) (1�87) (0�13) (1�40) (1�53) $ 12�74 (11�95)% $ 65,218 0�75% 0�75% 0�73% 84%For the year ended December 31, 2017 $ 13�42 0�09 2�65 2�74 (0�02) — (0�02) $ 16�14 20�45% $ 21,628 0�77% 0�78% 0�61% 52%For the year ended December 31, 2016 $ 12�41 0�04 1�17 1�21 (0�03) (0�17) (0�20) $ 13�42 9�72% $ 18,456 0�80% 0�80% 0�36% 70%
(D) Portfolio turnover rate is calculated on the basis of the Fund as a whole without distinguishing between classes of shares issued�
(E) Not annualized�(F) Annualized�See accompanying Notes to Financial Statements�

108 DIAMOND HILL FUNDS | SEMI-ANNUAL REPORT | JUNE 30, 2021 | DIAMOND-HILL.COM
Long-Short Fund
Net asset value,
beginning of period
Net investment
income (loss)(A)
Net realized and
unrealized gains
(losses) on investments
Total from investment operations
Dividends from net
investment income
Distributions from net realized
capital gainsTotal
distributions
Net asset value, end of
periodTotal
return(B)
Net assets, end of period
(000,000’s)
Ratio of total net expenses
to average net assets(C)
Ratio of total gross
expenses to average net
assets(D)
Ratio of net investment
income (loss) to
average net assets
Portfolio turnover
rate(E)
Investor (formerly Class A)For the six months ended June 30, 2021 (Unaudited) $ 25�89 (0�04) 3�45 3�41 — — — $ 29�30 13�17%(F) $ 175 1�86%(G) 1�87%(G) (0�30)%(G) 12%(F)
For the year ended December 31, 2020 $ 26�29 0�02 (0�17) (0�15) (0�05) (0�20) (0�25) $ 25�89 (0�55)% $ 162 1�81% 1�82% 0�09% 65%(H)
For the year ended December 31, 2019 $ 22�78 0�13 5�04 5�17 (0�17) (1�49) (1�66) $ 26�29 22�74% $ 235 1�85% 1�86% 0�51% 54%(H)
For the year ended December 31, 2018 $ 25�76 0�10 (1�96) (1�86) (0�07) (1�05) (1�12) $ 22�78 (7�30)% $ 189 1�72% 1�73% 0�38% 64%(H)
For the year ended December 31, 2017 $ 24�91 (0�05) 1�45 1�40 — (0�55) (0�55) $ 25�76 5�65% $ 358 1�95% 1�96% (0�22)% 43%(H)
For the year ended December 31, 2016 $ 23�36 (0�09) 2�49 2�40 — (0�85) (0�85) $ 24�91 10�26% $ 460 2�06% 2�06% (0�20)% 45%
Class IFor the six months ended June 30, 2021 (Unaudited) $ 26�58 (0�00)(I) 3�54 3�54 — — — $ 30�12 13�32%(F) $ 1,816 1�57%(G) 1�58%(G) (0�01)%(G) 12%(F)
For the year ended December 31, 2020 $ 26�98 0�09 (0�17) (0�08) (0�12) (0�20) (0�32) $ 26�58 (0�27)% $ 1,794 1�52% 1�53% 0�39% 65%(H)
For the year ended December 31, 2019 $ 23�32 0�22 5�16 5�38 (0�23) (1�49) (1�72) $ 26�98 23�11% $ 2,960 1�56% 1�57% 0�84% 54%(H)
For the year ended December 31, 2018 $ 26�39 0�18 (2�01) (1�83) (0�19) (1�05) (1�24) $ 23�32 (7�04)% $ 3,111 1�43% 1�44% 0�68% 64%(H)
For the year ended December 31, 2017 $ 25�43 0�02 1�50 1�52 (0�01) (0�55) (0�56) $ 26�39 5�99% $ 4,033 1�65% 1�66% 0�09% 43%(H)
For the year ended December 31, 2016 $ 23�77 (0�02) 2�53 2�51 — (0�85) (0�85) $ 25�43 10�55% $ 3,590 1�76% 1�76% (0�09)% 45%
Class YFor the six months ended June 30, 2021 (Unaudited) $ 26�69 0�02 3�56 3�58 — — — $ 30�27 13�41%(F) $ 67 1�45%(G) 1�46%(G) 0�12%(G) 12%(F)
For the year ended December 31, 2020 $ 27�10 0�14 (0�20) (0�06) (0�15) (0�20) (0�35) $ 26�69 (0�19)% $ 75 1�40% 1�41% 0�57% 65%(H)
For the year ended December 31, 2019 $ 23�42 0�25 5�18 5�43 (0�26) (1�49) (1�75) $ 27�10 23�23% $ 292 1�44% 1�45% 0�93% 54%(H)
For the year ended December 31, 2018 $ 26�49 0�21 (2�01) (1�80) (0�22) (1�05) (1�27) $ 23�42 (6�89)% $ 214 1�31% 1�32% 0�80% 64%(H)
For the year ended December 31, 2017 $ 25�53 0�05 1�49 1�54 (0�03) (0�55) (0�58) $ 26�49 6�07% $ 261 1�55% 1�56% 0�19% 43%(H)
For the year ended December 31, 2016 $ 23�83 0�01 2�54 2�55 — (0�85) (0�85) $ 25�53 10�69% $ 228 1�67% 1�67% 0�02% 45%
Long-Short Fund Financial Highlights
Selected data for a share outstanding throughout the periods indicated
(A) Net investment income (loss) per share has been calculated using the average daily shares outstanding during the period�
(B) Total returns shown exclude the effect of applicable sales charges for periods prior to June 30, 2021�(C) This Fund invests in short positions and as such incurs certain expenses and fees� If such expenses and fees had
not occurred, the ratios of total expenses to average net assets would have been 1�48% for Investor, 1�19% for Class I, and 1�07% for Class Y�
(D) The Fund’s adviser has contractually agreed to waive fees in the pro-rata amount of the management fee charged by the underlying Diamond Hill Fund on each Fund’s investment in such other Diamond Hill Fund� If such fee waiver had not occurred, the ratios would have been as indicated�
See accompanying Notes to Financial Statements�

DIAMOND HILL FUNDS | SEMI-ANNUAL REPORT | JUNE 30, 2021 | DIAMOND-HILL.COM 109
Long-Short Fund
Net asset value,
beginning of period
Net investment
income (loss)(A)
Net realized and
unrealized gains
(losses) on investments
Total from investment operations
Dividends from net
investment income
Distributions from net realized
capital gainsTotal
distributions
Net asset value, end of
periodTotal
return(B)
Net assets, end of period
(000,000’s)
Ratio of total net expenses
to average net assets(C)
Ratio of total gross
expenses to average net
assets(D)
Ratio of net investment
income (loss) to
average net assets
Portfolio turnover
rate(E)
Investor (formerly Class A)For the six months ended June 30, 2021 (Unaudited) $ 25�89 (0�04) 3�45 3�41 — — — $ 29�30 13�17%(F) $ 175 1�86%(G) 1�87%(G) (0�30)%(G) 12%(F)
For the year ended December 31, 2020 $ 26�29 0�02 (0�17) (0�15) (0�05) (0�20) (0�25) $ 25�89 (0�55)% $ 162 1�81% 1�82% 0�09% 65%(H)
For the year ended December 31, 2019 $ 22�78 0�13 5�04 5�17 (0�17) (1�49) (1�66) $ 26�29 22�74% $ 235 1�85% 1�86% 0�51% 54%(H)
For the year ended December 31, 2018 $ 25�76 0�10 (1�96) (1�86) (0�07) (1�05) (1�12) $ 22�78 (7�30)% $ 189 1�72% 1�73% 0�38% 64%(H)
For the year ended December 31, 2017 $ 24�91 (0�05) 1�45 1�40 — (0�55) (0�55) $ 25�76 5�65% $ 358 1�95% 1�96% (0�22)% 43%(H)
For the year ended December 31, 2016 $ 23�36 (0�09) 2�49 2�40 — (0�85) (0�85) $ 24�91 10�26% $ 460 2�06% 2�06% (0�20)% 45%
Class IFor the six months ended June 30, 2021 (Unaudited) $ 26�58 (0�00)(I) 3�54 3�54 — — — $ 30�12 13�32%(F) $ 1,816 1�57%(G) 1�58%(G) (0�01)%(G) 12%(F)
For the year ended December 31, 2020 $ 26�98 0�09 (0�17) (0�08) (0�12) (0�20) (0�32) $ 26�58 (0�27)% $ 1,794 1�52% 1�53% 0�39% 65%(H)
For the year ended December 31, 2019 $ 23�32 0�22 5�16 5�38 (0�23) (1�49) (1�72) $ 26�98 23�11% $ 2,960 1�56% 1�57% 0�84% 54%(H)
For the year ended December 31, 2018 $ 26�39 0�18 (2�01) (1�83) (0�19) (1�05) (1�24) $ 23�32 (7�04)% $ 3,111 1�43% 1�44% 0�68% 64%(H)
For the year ended December 31, 2017 $ 25�43 0�02 1�50 1�52 (0�01) (0�55) (0�56) $ 26�39 5�99% $ 4,033 1�65% 1�66% 0�09% 43%(H)
For the year ended December 31, 2016 $ 23�77 (0�02) 2�53 2�51 — (0�85) (0�85) $ 25�43 10�55% $ 3,590 1�76% 1�76% (0�09)% 45%
Class YFor the six months ended June 30, 2021 (Unaudited) $ 26�69 0�02 3�56 3�58 — — — $ 30�27 13�41%(F) $ 67 1�45%(G) 1�46%(G) 0�12%(G) 12%(F)
For the year ended December 31, 2020 $ 27�10 0�14 (0�20) (0�06) (0�15) (0�20) (0�35) $ 26�69 (0�19)% $ 75 1�40% 1�41% 0�57% 65%(H)
For the year ended December 31, 2019 $ 23�42 0�25 5�18 5�43 (0�26) (1�49) (1�75) $ 27�10 23�23% $ 292 1�44% 1�45% 0�93% 54%(H)
For the year ended December 31, 2018 $ 26�49 0�21 (2�01) (1�80) (0�22) (1�05) (1�27) $ 23�42 (6�89)% $ 214 1�31% 1�32% 0�80% 64%(H)
For the year ended December 31, 2017 $ 25�53 0�05 1�49 1�54 (0�03) (0�55) (0�58) $ 26�49 6�07% $ 261 1�55% 1�56% 0�19% 43%(H)
For the year ended December 31, 2016 $ 23�83 0�01 2�54 2�55 — (0�85) (0�85) $ 25�53 10�69% $ 228 1�67% 1�67% 0�02% 45%
(E) Portfolio turnover rate is calculated on the basis of the Fund as a whole without distinguishing between classes of shares issued�
(F) Not annualized�(G) Annualized�(H) The portfolio turnover rate for 2020, 2019, 2018 and 2017 would have been 47%, 42%, 51% and 32%, respectively,
if the absolute value of securities sold short liability was included in the denominator of the calculation�(I) Amount is less than $0�005�See accompanying Notes to Financial Statements�

110 DIAMOND HILL FUNDS | SEMI-ANNUAL REPORT | JUNE 30, 2021 | DIAMOND-HILL.COM
Global Fund(A)
Net asset value,
beginning of period
Net investment income(B)
Net realized and
unrealized gains
(losses) on investments
Total from investment operations
Dividends from net
investment income
Distributions from net realized
capital gainsTotal
distributions
Net asset value, end of
periodTotal
return(C)
Net assets, end of period (000’s)
Ratio of total net expenses
to average net assets
Ratio of net investment income to
average net assets
Portfolio turnover
rate(D)
Investor (formerly Class A)For the six months ended June 30, 2021 (Unaudited) $ 15�16 0�07 1�62 1�69 — — — $ 16�85 11�15%(E) $ 126 1�13%(F) 0�89%(F) 23%(E)
For the year ended December 31, 2020 $ 15�05 0�08 0�12 0�20 (0�09) — (0�09) $ 15�16 1�35% $ 160 1�13% 0�59% 110%For the year ended December 31, 2019 $ 11�67 0�16 3�34 3�50 (0�12) — (0�12) $ 15�05 29�96% $ 111 1�15% 1�18% 29%For the year ended December 31, 2018 $ 14�42 0�11 (2�14) (2�03) (0�05) (0�67) (0�72) $ 11�67 (14�91)% $ 66 1�18% 0�86% 84%
Class IFor the six months ended June 30, 2021 (Unaudited) $ 15�23 0�10 1�61 1�71 — — — $ 16�94 11�23%(E) $ 2,178 0�84%(F) 1�20%(F) 23%(E)
For the year ended December 31, 2020 $ 15�08 0�10 0�15 0�25 (0�10) — (0�10) $ 15�23 1�66% $ 2,218 0�84% 0�78% 110%For the year ended December 31, 2019 $ 11�69 0�15 3�40 3�55 (0�16) — (0�16) $ 15�08 30�34% $ 6,216 0�86% 1�10% 29%For the year ended December 31, 2018 $ 14�42 0�15 (2�14) (1�99) (0�07) (0�67) (0�74) $ 11�69 (14�66)% $ 4,440 0�89% 1�09% 84%
Class YFor the six months ended June 30, 2021 (Unaudited) $ 15�23 0�11 1�61 1�72 — — — $ 16�95 11�29%(E) $ 14,632 0�72%(F) 1�33%(F) 23%(E)
For the year ended December 31, 2020 $ 15�10 0�12 0�15 0�27 (0�14) — (0�14) $ 15�23 1�77% $ 13,777 0�72% 0�95% 110%For the year ended December 31, 2019 $ 11�70 0�19 3�38 3�57 (0�17) — (0�17) $ 15�10 30�54% $ 15,528 0�74% 1�37% 29%For the year ended December 31, 2018 $ 14�42 0�16 (2�14) (1�98) (0�07) (0�67) (0�74) $ 11�70 (14�55)% $ 10,214 0�77% 1�24% 84%
Global Fund Financial Highlights
Selected data for a share outstanding throughout the periods indicated
(A) Inception date of the Fund is December 29, 2017� Fund commenced public offering on January 2, 2018�(B) Net investment income per share has been calculated using the average daily shares outstanding during the
period�(C) Total returns shown exclude the effect of applicable sales charges for periods prior to June 30, 2021�See accompanying Notes to Financial Statements�
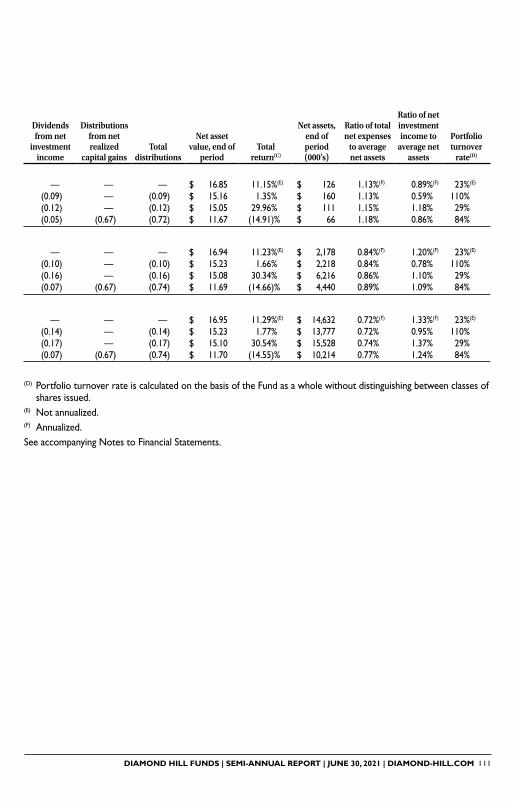
DIAMOND HILL FUNDS | SEMI-ANNUAL REPORT | JUNE 30, 2021 | DIAMOND-HILL.COM 111
Global Fund(A)
Net asset value,
beginning of period
Net investment income(B)
Net realized and
unrealized gains
(losses) on investments
Total from investment operations
Dividends from net
investment income
Distributions from net realized
capital gainsTotal
distributions
Net asset value, end of
periodTotal
return(C)
Net assets, end of period (000’s)
Ratio of total net expenses
to average net assets
Ratio of net investment income to
average net assets
Portfolio turnover
rate(D)
Investor (formerly Class A)For the six months ended June 30, 2021 (Unaudited) $ 15�16 0�07 1�62 1�69 — — — $ 16�85 11�15%(E) $ 126 1�13%(F) 0�89%(F) 23%(E)
For the year ended December 31, 2020 $ 15�05 0�08 0�12 0�20 (0�09) — (0�09) $ 15�16 1�35% $ 160 1�13% 0�59% 110%For the year ended December 31, 2019 $ 11�67 0�16 3�34 3�50 (0�12) — (0�12) $ 15�05 29�96% $ 111 1�15% 1�18% 29%For the year ended December 31, 2018 $ 14�42 0�11 (2�14) (2�03) (0�05) (0�67) (0�72) $ 11�67 (14�91)% $ 66 1�18% 0�86% 84%
Class IFor the six months ended June 30, 2021 (Unaudited) $ 15�23 0�10 1�61 1�71 — — — $ 16�94 11�23%(E) $ 2,178 0�84%(F) 1�20%(F) 23%(E)
For the year ended December 31, 2020 $ 15�08 0�10 0�15 0�25 (0�10) — (0�10) $ 15�23 1�66% $ 2,218 0�84% 0�78% 110%For the year ended December 31, 2019 $ 11�69 0�15 3�40 3�55 (0�16) — (0�16) $ 15�08 30�34% $ 6,216 0�86% 1�10% 29%For the year ended December 31, 2018 $ 14�42 0�15 (2�14) (1�99) (0�07) (0�67) (0�74) $ 11�69 (14�66)% $ 4,440 0�89% 1�09% 84%
Class YFor the six months ended June 30, 2021 (Unaudited) $ 15�23 0�11 1�61 1�72 — — — $ 16�95 11�29%(E) $ 14,632 0�72%(F) 1�33%(F) 23%(E)
For the year ended December 31, 2020 $ 15�10 0�12 0�15 0�27 (0�14) — (0�14) $ 15�23 1�77% $ 13,777 0�72% 0�95% 110%For the year ended December 31, 2019 $ 11�70 0�19 3�38 3�57 (0�17) — (0�17) $ 15�10 30�54% $ 15,528 0�74% 1�37% 29%For the year ended December 31, 2018 $ 14�42 0�16 (2�14) (1�98) (0�07) (0�67) (0�74) $ 11�70 (14�55)% $ 10,214 0�77% 1�24% 84%
(D) Portfolio turnover rate is calculated on the basis of the Fund as a whole without distinguishing between classes of shares issued�
(E) Not annualized�(F) Annualized�See accompanying Notes to Financial Statements�
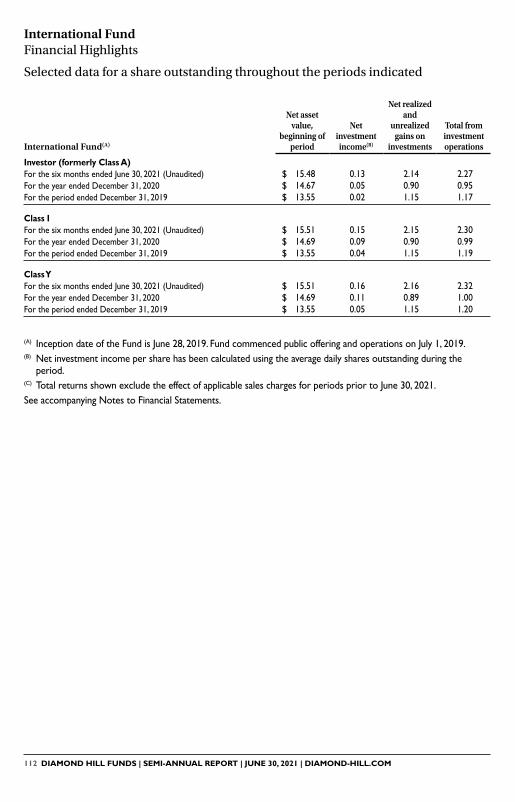
112 DIAMOND HILL FUNDS | SEMI-ANNUAL REPORT | JUNE 30, 2021 | DIAMOND-HILL.COM
International Fund(A)
Net asset value,
beginning of period
Net investment income(B)
Net realized and
unrealized gains on
investments
Total from investment operations
Dividends from net
investment income
Distributions from net realized
capital gainsTotal
distributions
Net asset value, end of
periodTotal
return(C)
Net assets, end of period (000’s)
Ratio of total net expenses
to average net assets
Ratio of net investment income to
average net assets
Portfolio turnover
rate(D)
Investor (formerly Class A)For the six months ended June 30, 2021 (Unaudited) $ 15�48 0�13 2�14 2�27 — — — $ 17�75 14�66%(E) $ 413 1�14%(F) 1�50%(F) 23%(E)
For the year ended December 31, 2020 $ 14�67 0�05 0�90 0�95 (0�06) (0�08) (0�14) $ 15�48 6�48% $ 338 1�14% 0�43% 49%For the period ended December 31, 2019 $ 13�55 0�02 1�15 1�17 (0�04) (0�01) (0�05) $ 14�67 8�64%(E) $ 45 1�21%(F) 0�25%(F) 8%(E)
Class IFor the six months ended June 30, 2021 (Unaudited) $ 15�51 0�15 2�15 2�30 — — — $ 17�81 14�83%(E) $ 4,879 0�85%(F) 1�75%(F) 23%(E)
For the year ended December 31, 2020 $ 14�69 0�09 0�90 0�99 (0�09) (0�08) (0�17) $ 15�51 6�74% $ 3,913 0�85% 0�74% 49%For the period ended December 31, 2019 $ 13�55 0�04 1�15 1�19 (0�04) (0�01) (0�05) $ 14�69 8�80%(E) $ 3,828 0�92%(F) 0�61%(F) 8%(E)
Class YFor the six months ended June 30, 2021 (Unaudited) $ 15�51 0�16 2�16 2�32 — — — $ 17�83 14�96%(E) $ 15,587 0�73%(F) 1�86%(F) 23%(E)
For the year ended December 31, 2020 $ 14�69 0�11 0�89 1�00 (0�10) (0�08) (0�18) $ 15�51 6�81% $ 12,616 0�73% 0�87% 49%For the period ended December 31, 2019 $ 13�55 0�05 1�15 1�20 (0�05) (0�01) (0�06) $ 14�69 8�85%(E) $ 9,616 0�80%(F) 0�70%(F) 8%(E)
International Fund Financial Highlights
Selected data for a share outstanding throughout the periods indicated
(A) Inception date of the Fund is June 28, 2019� Fund commenced public offering and operations on July 1, 2019�(B) Net investment income per share has been calculated using the average daily shares outstanding during the
period�(C) Total returns shown exclude the effect of applicable sales charges for periods prior to June 30, 2021�See accompanying Notes to Financial Statements�
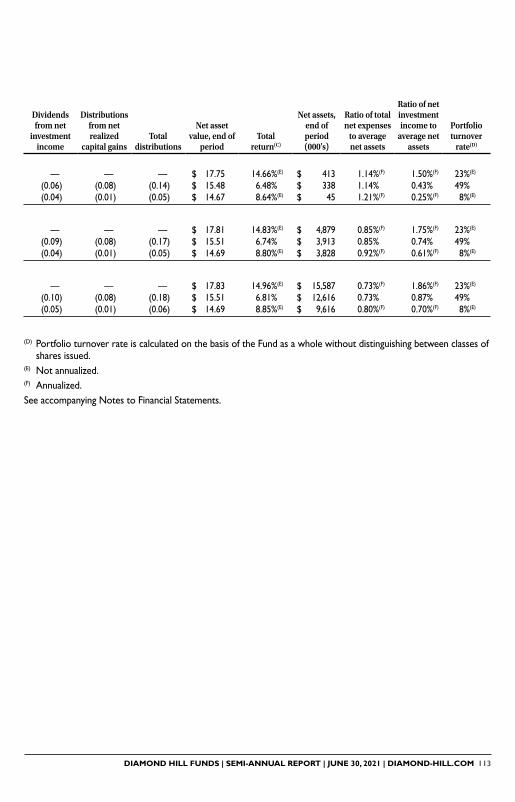
DIAMOND HILL FUNDS | SEMI-ANNUAL REPORT | JUNE 30, 2021 | DIAMOND-HILL.COM 113
International Fund(A)
Net asset value,
beginning of period
Net investment income(B)
Net realized and
unrealized gains on
investments
Total from investment operations
Dividends from net
investment income
Distributions from net realized
capital gainsTotal
distributions
Net asset value, end of
periodTotal
return(C)
Net assets, end of period (000’s)
Ratio of total net expenses
to average net assets
Ratio of net investment income to
average net assets
Portfolio turnover
rate(D)
Investor (formerly Class A)For the six months ended June 30, 2021 (Unaudited) $ 15�48 0�13 2�14 2�27 — — — $ 17�75 14�66%(E) $ 413 1�14%(F) 1�50%(F) 23%(E)
For the year ended December 31, 2020 $ 14�67 0�05 0�90 0�95 (0�06) (0�08) (0�14) $ 15�48 6�48% $ 338 1�14% 0�43% 49%For the period ended December 31, 2019 $ 13�55 0�02 1�15 1�17 (0�04) (0�01) (0�05) $ 14�67 8�64%(E) $ 45 1�21%(F) 0�25%(F) 8%(E)
Class IFor the six months ended June 30, 2021 (Unaudited) $ 15�51 0�15 2�15 2�30 — — — $ 17�81 14�83%(E) $ 4,879 0�85%(F) 1�75%(F) 23%(E)
For the year ended December 31, 2020 $ 14�69 0�09 0�90 0�99 (0�09) (0�08) (0�17) $ 15�51 6�74% $ 3,913 0�85% 0�74% 49%For the period ended December 31, 2019 $ 13�55 0�04 1�15 1�19 (0�04) (0�01) (0�05) $ 14�69 8�80%(E) $ 3,828 0�92%(F) 0�61%(F) 8%(E)
Class YFor the six months ended June 30, 2021 (Unaudited) $ 15�51 0�16 2�16 2�32 — — — $ 17�83 14�96%(E) $ 15,587 0�73%(F) 1�86%(F) 23%(E)
For the year ended December 31, 2020 $ 14�69 0�11 0�89 1�00 (0�10) (0�08) (0�18) $ 15�51 6�81% $ 12,616 0�73% 0�87% 49%For the period ended December 31, 2019 $ 13�55 0�05 1�15 1�20 (0�05) (0�01) (0�06) $ 14�69 8�85%(E) $ 9,616 0�80%(F) 0�70%(F) 8%(E)
(D) Portfolio turnover rate is calculated on the basis of the Fund as a whole without distinguishing between classes of shares issued�
(E) Not annualized�(F) Annualized�See accompanying Notes to Financial Statements�

114 DIAMOND HILL FUNDS | SEMI-ANNUAL REPORT | JUNE 30, 2021 | DIAMOND-HILL.COM
Short Duration Securitized Bond Fund(A)
Net asset value,
beginning of period
Net investment income(B)
Net realized and
unrealized gains
(losses) on investments
Total from investment operations
Dividends from net
investment income
Distributions from net realized
capital gainsTotal
distributions
Net asset value, end of
periodTotal
return(C)
Net assets, end of period (000’s)
Ratio of total net expenses
to average net assets
Ratio of net investment income to
average net assets
Portfolio turnover
rate(D)
Investor (formerly Class A)For the six months ended June 30, 2021 (Unaudited) $ 10�09 0�12 0�10 0�22 (0�13) — (0�13) $ 10�18 2�15%(E) $ 43,417 0�81%(F) 2�43%(F) 30%(E)
For the year ended December 31, 2020 $ 10�11 0�26 0�02 0�28 (0�30) — (0�30) $ 10�09 2�87% $ 47,059 0�82% 2�68% 72%For the year ended December 31, 2019 $ 10�05 0�38 0�06 0�44 (0�38) (0�00)(G) (0�38) $ 10�11 4�44% $ 55,727 0�82% 3�72% 54%For the year ended December 31, 2018 $ 10�11 0�33 (0�04) 0�29 (0�34) (0�01) (0�35) $ 10�05 2�88% $ 18,789 0�81% 3�30% 67%For the year ended December 31, 2017 $ 10�04 0�30 0�09 0�39 (0�31) (0�01) (0�32) $ 10�11 3�97% $ 20,511 0�83% 3�03% 82%For the period ended December 31, 2016 $ 10�00 0�09 0�03 0�12 (0�08) — (0�08) $ 10�04 1�19%(E) $ 222 0�83%(F) 1�12%(F) 19%(E)
Class IFor the six months ended June 30, 2021 (Unaudited) $ 10�09 0�14 0�09 0�23 (0�14) — (0�14) $ 10�18 2�31%(E) $ 1,148,112 0�52%(F) 2�70%(F) 30%(E)
For the year ended December 31, 2020 $ 10�12 0�28 0�02 0�30 (0�33) — (0�33) $ 10�09 3�08% $ 897,232 0�53% 2�93% 72%For the year ended December 31, 2019 $ 10�05 0�41 0�07 0�48 (0�41) (0�00)(G) (0�41) $ 10�12 4�85% $ 525,994 0�53% 4�00% 54%For the year ended December 31, 2018 $ 10�11 0�36 (0�04) 0�32 (0�37) (0�01) (0�38) $ 10�05 3�18% $ 308,341 0�52% 3�62% 67%For the year ended December 31, 2017 $ 10�03 0�33 0�10 0�43 (0�34) (0�01) (0�35) $ 10�11 4�33% $ 61,136 0�53% 3�29% 82%For the period ended December 31, 2016 $ 10�00 0�10 0�03 0�13 (0�10) — (0�10) $ 10�03 1�26%(E) $ 14,707 0�53%(F) 1�32%(F) 19%(E)
Class YFor the six months ended June 30, 2021 (Unaudited) $ 10�10 0�14 0�09 0�23 (0�15) — 0�15 $ 10�18 2�27%(E) $ 153,487 0�40%(F) 2�86%(F) 30%(E)
For the year ended December 31, 2020 $ 10�12 0�30 0�02 0�32 (0�34) — (0�34) $ 10�10 3�29% $ 188,175 0�41% 3�09% 72%For the year ended December 31, 2019 $ 10�06 0�42 0�06 0�48 (0�42) (0�00)(G) (0�42) $ 10�12 4�84% $ 226,938 0�41% 4�09% 54%For the year ended December 31, 2018 $ 10�11 0�38 (0�04) 0�34 (0�38) (0�01) (0�39) $ 10�06 3�38% $ 252,137 0�40% 3�72% 67%For the year ended December 31, 2017 $ 10�03 0�34 0�10 0�44 (0�35) (0�01) (0�36) $ 10�11 4�43% $ 231,290 0�43% 3�33% 82%For the period ended December 31, 2016 $ 10�00 0�11 0�02 0�13 (0�10) — (0�10) $ 10�03 1�29%(E) $ 182,527 0�44%(F) 1�25%(F) 19%(E)
Short Duration Securitized Bond Fund Financial Highlights
Selected data for a share outstanding throughout the periods indicated
(A) Inception date of the Fund is July 5, 2016� Fund commenced operations on July 5, 2016�(B) Net investment income per share has been calculated using the average daily shares outstanding during the
period�(C) Total returns shown exclude the effect of applicable sales charges for periods prior to June 30, 2021�See accompanying Notes to Financial Statements�

DIAMOND HILL FUNDS | SEMI-ANNUAL REPORT | JUNE 30, 2021 | DIAMOND-HILL.COM 115
Short Duration Securitized Bond Fund(A)
Net asset value,
beginning of period
Net investment income(B)
Net realized and
unrealized gains
(losses) on investments
Total from investment operations
Dividends from net
investment income
Distributions from net realized
capital gainsTotal
distributions
Net asset value, end of
periodTotal
return(C)
Net assets, end of period (000’s)
Ratio of total net expenses
to average net assets
Ratio of net investment income to
average net assets
Portfolio turnover
rate(D)
Investor (formerly Class A)For the six months ended June 30, 2021 (Unaudited) $ 10�09 0�12 0�10 0�22 (0�13) — (0�13) $ 10�18 2�15%(E) $ 43,417 0�81%(F) 2�43%(F) 30%(E)
For the year ended December 31, 2020 $ 10�11 0�26 0�02 0�28 (0�30) — (0�30) $ 10�09 2�87% $ 47,059 0�82% 2�68% 72%For the year ended December 31, 2019 $ 10�05 0�38 0�06 0�44 (0�38) (0�00)(G) (0�38) $ 10�11 4�44% $ 55,727 0�82% 3�72% 54%For the year ended December 31, 2018 $ 10�11 0�33 (0�04) 0�29 (0�34) (0�01) (0�35) $ 10�05 2�88% $ 18,789 0�81% 3�30% 67%For the year ended December 31, 2017 $ 10�04 0�30 0�09 0�39 (0�31) (0�01) (0�32) $ 10�11 3�97% $ 20,511 0�83% 3�03% 82%For the period ended December 31, 2016 $ 10�00 0�09 0�03 0�12 (0�08) — (0�08) $ 10�04 1�19%(E) $ 222 0�83%(F) 1�12%(F) 19%(E)
Class IFor the six months ended June 30, 2021 (Unaudited) $ 10�09 0�14 0�09 0�23 (0�14) — (0�14) $ 10�18 2�31%(E) $ 1,148,112 0�52%(F) 2�70%(F) 30%(E)
For the year ended December 31, 2020 $ 10�12 0�28 0�02 0�30 (0�33) — (0�33) $ 10�09 3�08% $ 897,232 0�53% 2�93% 72%For the year ended December 31, 2019 $ 10�05 0�41 0�07 0�48 (0�41) (0�00)(G) (0�41) $ 10�12 4�85% $ 525,994 0�53% 4�00% 54%For the year ended December 31, 2018 $ 10�11 0�36 (0�04) 0�32 (0�37) (0�01) (0�38) $ 10�05 3�18% $ 308,341 0�52% 3�62% 67%For the year ended December 31, 2017 $ 10�03 0�33 0�10 0�43 (0�34) (0�01) (0�35) $ 10�11 4�33% $ 61,136 0�53% 3�29% 82%For the period ended December 31, 2016 $ 10�00 0�10 0�03 0�13 (0�10) — (0�10) $ 10�03 1�26%(E) $ 14,707 0�53%(F) 1�32%(F) 19%(E)
Class YFor the six months ended June 30, 2021 (Unaudited) $ 10�10 0�14 0�09 0�23 (0�15) — 0�15 $ 10�18 2�27%(E) $ 153,487 0�40%(F) 2�86%(F) 30%(E)
For the year ended December 31, 2020 $ 10�12 0�30 0�02 0�32 (0�34) — (0�34) $ 10�10 3�29% $ 188,175 0�41% 3�09% 72%For the year ended December 31, 2019 $ 10�06 0�42 0�06 0�48 (0�42) (0�00)(G) (0�42) $ 10�12 4�84% $ 226,938 0�41% 4�09% 54%For the year ended December 31, 2018 $ 10�11 0�38 (0�04) 0�34 (0�38) (0�01) (0�39) $ 10�06 3�38% $ 252,137 0�40% 3�72% 67%For the year ended December 31, 2017 $ 10�03 0�34 0�10 0�44 (0�35) (0�01) (0�36) $ 10�11 4�43% $ 231,290 0�43% 3�33% 82%For the period ended December 31, 2016 $ 10�00 0�11 0�02 0�13 (0�10) — (0�10) $ 10�03 1�29%(E) $ 182,527 0�44%(F) 1�25%(F) 19%(E)
(D) Portfolio turnover rate is calculated on the basis of the Fund as a whole without distinguishing between classes of shares issued�
(E) Not annualized�(F) Annualized�(G) Amount is less than $0�005�See accompanying Notes to Financial Statements�
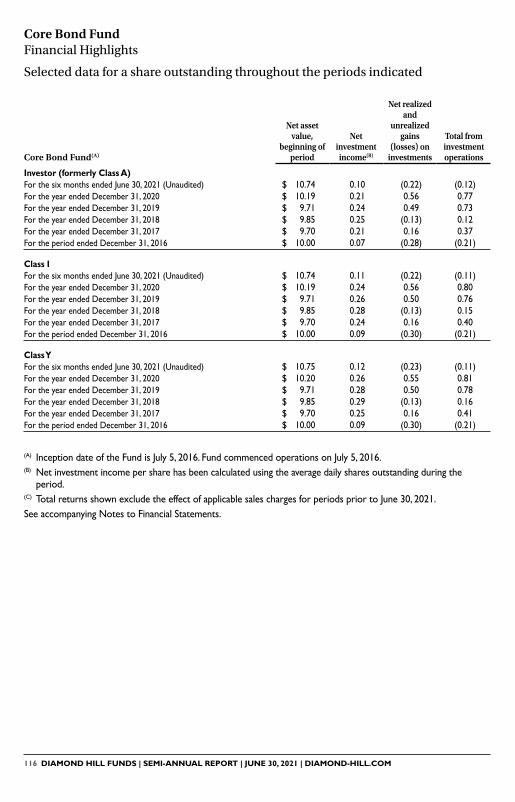
116 DIAMOND HILL FUNDS | SEMI-ANNUAL REPORT | JUNE 30, 2021 | DIAMOND-HILL.COM
Core Bond Fund(A)
Net asset value,
beginning of period
Net investment income(B)
Net realized and
unrealized gains
(losses) on investments
Total from investment operations
Dividends from net
investment income
Distributions from net realized
capital gainsTotal
distributions
Net asset value, end of
periodTotal
return(C)
Net assets, end of period (000’s)
Ratio of total gross
expenses to average net
assets
Ratio of net investment income to
average net assets
Portfolio turnover
rate(D)
Investor (formerly Class A)For the six months ended June 30, 2021 (Unaudited) $ 10�74 0�10 (0�22) (0�12) (0�12) — (0�12) $ 10�50 (1�12)%(E) $ 32,953 0�76%(F) 1�85%(F) 13%(E)
For the year ended December 31, 2020 $ 10�19 0�21 0�56 0�77 (0�22) — (0�22) $ 10�74 7�60% $ 17,024 0�76% 1�98% 28%For the year ended December 31, 2019 $ 9�71 0�24 0�49 0�73 (0�25) — (0�25) $ 10�19 7�63% $ 3,599 0�77% 2�43% 29%For the year ended December 31, 2018 $ 9�85 0�25 (0�13) 0�12 (0�26) — (0�26) $ 9�71 1�28% $ 2,976 0�76% 2�60% 25%For the year ended December 31, 2017 $ 9�70 0�21 0�16 0�37 (0�22) — (0�22) $ 9�85 3�85% $ 3,480 0�78% 2�10% 35%For the period ended December 31, 2016 $ 10�00 0�07 (0�28) (0�21) (0�09) — (0�09) $ 9�70 (2�28)%(E) $ 2,183 0�78%(F) 0�87%(F) 8%(E)
Class IFor the six months ended June 30, 2021 (Unaudited) $ 10�74 0�11 (0�22) (0�11) (0�13) — (0�13) $ 10�50 (0�99)%(E) $ 299,711 0�47%(F) 2�16%(F) 13%(E)
For the year ended December 31, 2020 $ 10�19 0�24 0�56 0�80 (0�25) — (0�25) $ 10�74 7�94% $ 260,365 0�47% 2�28% 28%For the year ended December 31, 2019 $ 9�71 0�26 0�50 0�76 (0�28) — (0�28) $ 10�19 7�93% $ 66,174 0�48% 2�61% 29%For the year ended December 31, 2018 $ 9�85 0�28 (0�13) 0�15 (0�29) — (0�29) $ 9�71 1�59% $ 14,574 0�47% 2�92% 25%For the year ended December 31, 2017 $ 9�70 0�24 0�16 0�40 (0�25) — (0�25) $ 9�85 4�17% $ 9,604 0�48% 2�40% 35%For the period ended December 31, 2016 $ 10�00 0�09 (0�30) (0�21) (0�09) — (0�09) $ 9�70 (2�14)%(E) $ 8,033 0�49%(F) 1�02%(F) 8%(E)
Class YFor the six months ended June 30, 2021 (Unaudited) $ 10�75 0�12 (0�23) (0�11) (0�14) — (0�14) $ 10�50 (1�01)%(E) $ 62,611 0�35%(F) 2�28%(F) 13%(E)
For the year ended December 31, 2020 $ 10�20 0�26 0�55 0�81 (0�26) — (0�26) $ 10�75 8�04% $ 59,856 0�35% 2�46% 28%For the year ended December 31, 2019 $ 9�71 0�28 0�50 0�78 (0�29) — (0�29) $ 10�20 8�15% $ 52,275 0�36% 2�83% 29%For the year ended December 31, 2018 $ 9�85 0�29 (0�13) 0�16 (0�30) — (0�30) $ 9�71 1�69% $ 37,713 0�35% 3�03% 25%For the year ended December 31, 2017 $ 9�70 0�25 0�16 0�41 (0�26) — (0�26) $ 9�85 4�22% $ 30,740 0�38% 2�49% 35%For the period ended December 31, 2016 $ 10�00 0�09 (0�30) (0�21) (0�09) — (0�09) $ 9�70 (2�11)%(E) $ 29,468 0�39%(F) 1�00%(F) 8%(E)
Core Bond Fund Financial Highlights
Selected data for a share outstanding throughout the periods indicated
(A) Inception date of the Fund is July 5, 2016� Fund commenced operations on July 5, 2016�(B) Net investment income per share has been calculated using the average daily shares outstanding during the
period�(C) Total returns shown exclude the effect of applicable sales charges for periods prior to June 30, 2021�See accompanying Notes to Financial Statements�

DIAMOND HILL FUNDS | SEMI-ANNUAL REPORT | JUNE 30, 2021 | DIAMOND-HILL.COM 117
Core Bond Fund(A)
Net asset value,
beginning of period
Net investment income(B)
Net realized and
unrealized gains
(losses) on investments
Total from investment operations
Dividends from net
investment income
Distributions from net realized
capital gainsTotal
distributions
Net asset value, end of
periodTotal
return(C)
Net assets, end of period (000’s)
Ratio of total gross
expenses to average net
assets
Ratio of net investment income to
average net assets
Portfolio turnover
rate(D)
Investor (formerly Class A)For the six months ended June 30, 2021 (Unaudited) $ 10�74 0�10 (0�22) (0�12) (0�12) — (0�12) $ 10�50 (1�12)%(E) $ 32,953 0�76%(F) 1�85%(F) 13%(E)
For the year ended December 31, 2020 $ 10�19 0�21 0�56 0�77 (0�22) — (0�22) $ 10�74 7�60% $ 17,024 0�76% 1�98% 28%For the year ended December 31, 2019 $ 9�71 0�24 0�49 0�73 (0�25) — (0�25) $ 10�19 7�63% $ 3,599 0�77% 2�43% 29%For the year ended December 31, 2018 $ 9�85 0�25 (0�13) 0�12 (0�26) — (0�26) $ 9�71 1�28% $ 2,976 0�76% 2�60% 25%For the year ended December 31, 2017 $ 9�70 0�21 0�16 0�37 (0�22) — (0�22) $ 9�85 3�85% $ 3,480 0�78% 2�10% 35%For the period ended December 31, 2016 $ 10�00 0�07 (0�28) (0�21) (0�09) — (0�09) $ 9�70 (2�28)%(E) $ 2,183 0�78%(F) 0�87%(F) 8%(E)
Class IFor the six months ended June 30, 2021 (Unaudited) $ 10�74 0�11 (0�22) (0�11) (0�13) — (0�13) $ 10�50 (0�99)%(E) $ 299,711 0�47%(F) 2�16%(F) 13%(E)
For the year ended December 31, 2020 $ 10�19 0�24 0�56 0�80 (0�25) — (0�25) $ 10�74 7�94% $ 260,365 0�47% 2�28% 28%For the year ended December 31, 2019 $ 9�71 0�26 0�50 0�76 (0�28) — (0�28) $ 10�19 7�93% $ 66,174 0�48% 2�61% 29%For the year ended December 31, 2018 $ 9�85 0�28 (0�13) 0�15 (0�29) — (0�29) $ 9�71 1�59% $ 14,574 0�47% 2�92% 25%For the year ended December 31, 2017 $ 9�70 0�24 0�16 0�40 (0�25) — (0�25) $ 9�85 4�17% $ 9,604 0�48% 2�40% 35%For the period ended December 31, 2016 $ 10�00 0�09 (0�30) (0�21) (0�09) — (0�09) $ 9�70 (2�14)%(E) $ 8,033 0�49%(F) 1�02%(F) 8%(E)
Class YFor the six months ended June 30, 2021 (Unaudited) $ 10�75 0�12 (0�23) (0�11) (0�14) — (0�14) $ 10�50 (1�01)%(E) $ 62,611 0�35%(F) 2�28%(F) 13%(E)
For the year ended December 31, 2020 $ 10�20 0�26 0�55 0�81 (0�26) — (0�26) $ 10�75 8�04% $ 59,856 0�35% 2�46% 28%For the year ended December 31, 2019 $ 9�71 0�28 0�50 0�78 (0�29) — (0�29) $ 10�20 8�15% $ 52,275 0�36% 2�83% 29%For the year ended December 31, 2018 $ 9�85 0�29 (0�13) 0�16 (0�30) — (0�30) $ 9�71 1�69% $ 37,713 0�35% 3�03% 25%For the year ended December 31, 2017 $ 9�70 0�25 0�16 0�41 (0�26) — (0�26) $ 9�85 4�22% $ 30,740 0�38% 2�49% 35%For the period ended December 31, 2016 $ 10�00 0�09 (0�30) (0�21) (0�09) — (0�09) $ 9�70 (2�11)%(E) $ 29,468 0�39%(F) 1�00%(F) 8%(E)
(D) Portfolio turnover rate is calculated on the basis of the Fund as a whole without distinguishing between classes of shares issued�
(E) Not annualized�(F) Annualized�See accompanying Notes to Financial Statements�
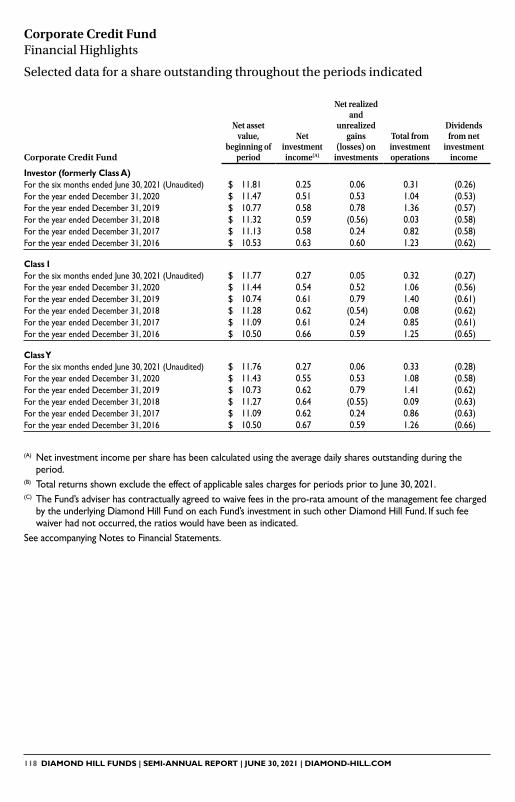
118 DIAMOND HILL FUNDS | SEMI-ANNUAL REPORT | JUNE 30, 2021 | DIAMOND-HILL.COM
Corporate Credit Fund
Net asset value,
beginning of period
Net investment income(A)
Net realized and
unrealized gains
(losses) on investments
Total from investment operations
Dividends from net
investment income
Distributions from net realized
capital gainsTotal
distributions
Net asset value, end of
periodTotal
return(B)
Net assets, end of period (000’s)
Ratio of total net expenses
to average net assets
Ratio of total gross
expenses to average net
assets(C)
Ratio of net investment income to
average net assets
Portfolio turnover
rate(D)
Investor (formerly Class A)For the six months ended June 30, 2021 (Unaudited) $ 11�81 0�25 0�06 0�31 (0�26) — (0�26) $ 11�86 2�62%(E) $ 219,416 0�91%(F) 0�91%(F) 4�28%(F) 73%(E)
For the year ended December 31, 2020 $ 11�47 0�51 0�53 1�04 (0�53) (0�17) (0�70) $ 11�81 9�49% $ 161,659 0�91% 0�91% 4�51% 173%For the year ended December 31, 2019 $ 10�77 0�58 0�78 1�36 (0�57) (0�09) (0�66) $ 11�47 12�85% $ 120,014 0�90% 0�92% 5�05% 132%For the year ended December 31, 2018 $ 11�32 0�59 (0�56) 0�03 (0�58) — (0�58) $ 10�77 0�25% $ 69,363 0�90% 0�91% 5�30% 112%For the year ended December 31, 2017 $ 11�13 0�58 0�24 0�82 (0�58) (0�05) (0�63) $ 11�32 7�56% $ 64,204 0�92% 0�93% 5�07% 83%For the year ended December 31, 2016 $ 10�53 0�63 0�60 1�23 (0�62) (0�01) (0�63) $ 11�13 11�94% $ 71,075 0�93% 0�93% 5�72% 119%
Class IFor the six months ended June 30, 2021 (Unaudited) $ 11�77 0�27 0�05 0�32 (0�27) — (0�27) $ 11�82 2�79%(E) $ 1,942,577 0�62%(F) 0�62%(F) 4�56%(F) 73%(E)
For the year ended December 31, 2020 $ 11�44 0�54 0�52 1�06 (0�56) (0�17) (0�73) $ 11�77 9�74% $ 1,724,397 0�62% 0�62% 4�79% 173%For the year ended December 31, 2019 $ 10�74 0�61 0�79 1�40 (0�61) (0�09) (0�70) $ 11�44 13�20% $ 911,514 0�61% 0�63% 5�36% 132%For the year ended December 31, 2018 $ 11�28 0�62 (0�54) 0�08 (0�62) — (0�62) $ 10�74 0�64% $ 622,887 0�61% 0�62% 5�59% 112%For the year ended December 31, 2017 $ 11�09 0�61 0�24 0�85 (0�61) (0�05) (0�66) $ 11�28 7�87% $ 536,203 0�62% 0�63% 5�39% 83%For the year ended December 31, 2016 $ 10�50 0�66 0�59 1�25 (0�65) (0�01) (0�66) $ 11�09 12�21% $ 411,465 0�64% 0�64% 6�00% 119%
Class YFor the six months ended June 30, 2021 (Unaudited) $ 11�76 0�27 0�06 0�33 (0�28) — (0�28) $ 11�81 2�85%(E) $ 103,752 0�50%(F) 0�50%(F) 4�68%(F) 73%(E)
For the year ended December 31, 2020 $ 11�43 0�55 0�53 1�08 (0�58) (0�17) (0�75) $ 11�76 9�88% $ 104,552 0�50% 0�50% 4�91% 173%For the year ended December 31, 2019 $ 10�73 0�62 0�79 1�41 (0�62) (0�09) (0�71) $ 11�43 13�35% $ 82,516 0�49% 0�51% 5�43% 132%For the year ended December 31, 2018 $ 11�27 0�64 (0�55) 0�09 (0�63) — (0�63) $ 10�73 0�75% $ 26,221 0�49% 0�50% 5�71% 112%For the year ended December 31, 2017 $ 11�09 0�62 0�24 0�86 (0�63) (0�05) (0�68) $ 11�27 7�89% $ 25,309 0�52% 0�53% 5�49% 83%For the year ended December 31, 2016 $ 10�50 0�67 0�59 1�26 (0�66) (0�01) (0�67) $ 11�09 12�34% $ 21,310 0�54% 0�54% 6�33% 119%
Corporate Credit Fund Financial Highlights
Selected data for a share outstanding throughout the periods indicated
(A) Net investment income per share has been calculated using the average daily shares outstanding during the period�
(B) Total returns shown exclude the effect of applicable sales charges for periods prior to June 30, 2021�(C) The Fund’s adviser has contractually agreed to waive fees in the pro-rata amount of the management fee charged
by the underlying Diamond Hill Fund on each Fund’s investment in such other Diamond Hill Fund� If such fee waiver had not occurred, the ratios would have been as indicated�
See accompanying Notes to Financial Statements�

DIAMOND HILL FUNDS | SEMI-ANNUAL REPORT | JUNE 30, 2021 | DIAMOND-HILL.COM 119
Corporate Credit Fund
Net asset value,
beginning of period
Net investment income(A)
Net realized and
unrealized gains
(losses) on investments
Total from investment operations
Dividends from net
investment income
Distributions from net realized
capital gainsTotal
distributions
Net asset value, end of
periodTotal
return(B)
Net assets, end of period (000’s)
Ratio of total net expenses
to average net assets
Ratio of total gross
expenses to average net
assets(C)
Ratio of net investment income to
average net assets
Portfolio turnover
rate(D)
Investor (formerly Class A)For the six months ended June 30, 2021 (Unaudited) $ 11�81 0�25 0�06 0�31 (0�26) — (0�26) $ 11�86 2�62%(E) $ 219,416 0�91%(F) 0�91%(F) 4�28%(F) 73%(E)
For the year ended December 31, 2020 $ 11�47 0�51 0�53 1�04 (0�53) (0�17) (0�70) $ 11�81 9�49% $ 161,659 0�91% 0�91% 4�51% 173%For the year ended December 31, 2019 $ 10�77 0�58 0�78 1�36 (0�57) (0�09) (0�66) $ 11�47 12�85% $ 120,014 0�90% 0�92% 5�05% 132%For the year ended December 31, 2018 $ 11�32 0�59 (0�56) 0�03 (0�58) — (0�58) $ 10�77 0�25% $ 69,363 0�90% 0�91% 5�30% 112%For the year ended December 31, 2017 $ 11�13 0�58 0�24 0�82 (0�58) (0�05) (0�63) $ 11�32 7�56% $ 64,204 0�92% 0�93% 5�07% 83%For the year ended December 31, 2016 $ 10�53 0�63 0�60 1�23 (0�62) (0�01) (0�63) $ 11�13 11�94% $ 71,075 0�93% 0�93% 5�72% 119%
Class IFor the six months ended June 30, 2021 (Unaudited) $ 11�77 0�27 0�05 0�32 (0�27) — (0�27) $ 11�82 2�79%(E) $ 1,942,577 0�62%(F) 0�62%(F) 4�56%(F) 73%(E)
For the year ended December 31, 2020 $ 11�44 0�54 0�52 1�06 (0�56) (0�17) (0�73) $ 11�77 9�74% $ 1,724,397 0�62% 0�62% 4�79% 173%For the year ended December 31, 2019 $ 10�74 0�61 0�79 1�40 (0�61) (0�09) (0�70) $ 11�44 13�20% $ 911,514 0�61% 0�63% 5�36% 132%For the year ended December 31, 2018 $ 11�28 0�62 (0�54) 0�08 (0�62) — (0�62) $ 10�74 0�64% $ 622,887 0�61% 0�62% 5�59% 112%For the year ended December 31, 2017 $ 11�09 0�61 0�24 0�85 (0�61) (0�05) (0�66) $ 11�28 7�87% $ 536,203 0�62% 0�63% 5�39% 83%For the year ended December 31, 2016 $ 10�50 0�66 0�59 1�25 (0�65) (0�01) (0�66) $ 11�09 12�21% $ 411,465 0�64% 0�64% 6�00% 119%
Class YFor the six months ended June 30, 2021 (Unaudited) $ 11�76 0�27 0�06 0�33 (0�28) — (0�28) $ 11�81 2�85%(E) $ 103,752 0�50%(F) 0�50%(F) 4�68%(F) 73%(E)
For the year ended December 31, 2020 $ 11�43 0�55 0�53 1�08 (0�58) (0�17) (0�75) $ 11�76 9�88% $ 104,552 0�50% 0�50% 4�91% 173%For the year ended December 31, 2019 $ 10�73 0�62 0�79 1�41 (0�62) (0�09) (0�71) $ 11�43 13�35% $ 82,516 0�49% 0�51% 5�43% 132%For the year ended December 31, 2018 $ 11�27 0�64 (0�55) 0�09 (0�63) — (0�63) $ 10�73 0�75% $ 26,221 0�49% 0�50% 5�71% 112%For the year ended December 31, 2017 $ 11�09 0�62 0�24 0�86 (0�63) (0�05) (0�68) $ 11�27 7�89% $ 25,309 0�52% 0�53% 5�49% 83%For the year ended December 31, 2016 $ 10�50 0�67 0�59 1�26 (0�66) (0�01) (0�67) $ 11�09 12�34% $ 21,310 0�54% 0�54% 6�33% 119%
(D) Portfolio turnover rate is calculated on the basis of the Fund as a whole without distinguishing between classes of shares issued�
(E) Not annualized�(F) Annualized�See accompanying Notes to Financial Statements�

120 DIAMOND HILL FUNDS | SEMI-ANNUAL REPORT | JUNE 30, 2021 | DIAMOND-HILL.COM
High Yield Fund Financial Highlights
Selected data for a share outstanding throughout the periods indicated
High Yield Fund(A)
Net asset value,
beginning of period
Net investment income(B)
Net realized and
unrealized gains
(losses) on investments
Total from investment operations
Dividends from net
investment income
Distributions from net realized
capital gainsTotal
distributions
Net asset value, end of
periodTotal
return(C)
Net assets, end of period (000’s)
Ratio of total net expenses
to average net assets
Ratio of net investment income to
average net assets
Portfolio turnover
rate(D)
Investor (formerly Class A)For the six months ended June 30, 2021 (Unaudited) $ 11�40 0�28 0�15 0�43 (0�29) — (0�29) $ 11�54 3�78%(E) $ 77,937 0�96%(F) 4�89%(F) 71%(E)
For the year ended December 31, 2020 $ 11�02 0�60 0�81 1�41 (0�58) (0�45) (1�03) $ 11�40 13�40% $ 39,496 0�96% 5�46% 186%For the year ended December 31, 2019 $ 10�22 0�60 0�91 1�51 (0�60) (0�11) (0�71) $ 11�02 15�04% $ 18,004 0�97% 5�49% 164%For the year ended December 31, 2018 $ 10�77 0�62 (0�51) 0�11 (0�61) (0�05) (0�66) $ 10�22 0�97% $ 1,674 0�96% 5�81% 145%For the year ended December 31, 2017 $ 10�65 0�65 0�38 1�03 (0�65) (0�26) (0�91) $ 10�77 9�96% $ 296 0�99% 5�89% 137%For the year ended December 31, 2016 $ 10�14 0�70 0�71 1�41 (0�66) (0�24) (0�90) $ 10�65 14�29% $ 185 0�99% 6�51% 123%
Class IFor the six months ended June 30, 2021 (Unaudited) $ 11�40 0�30 0�15 0�45 (0�30) — (0�30) $ 11�55 4�01%(E) $ 1,020,851 0�67%(F) 5�18%(F) 71%(E)
For the year ended December 31, 2020 $ 11�03 0�64 0�80 1�44 (0�62) (0�45) (1�07) $ 11�40 13�62% $ 651,836 0�67% 5�81% 186%For the year ended December 31, 2019 $ 10�22 0�63 0�91 1�54 (0�62) (0�11) (0�73) $ 11�03 15�44% $ 96,563 0�68% 5�79% 164%For the year ended December 31, 2018 $ 10�78 0�65 (0�52) 0�13 (0�64) (0�05) (0�69) $ 10�22 1�16% $ 23,499 0�67% 6�10% 145%For the year ended December 31, 2017 $ 10�65 0�68 0�39 1�07 (0�68) (0�26) (0�94) $ 10�78 10�36% $ 14,185 0�69% 6�23% 137%For the year ended December 31, 2016 $ 10�14 0�73 0�71 1�44 (0�69) (0�24) (0�93) $ 10�65 14�62% $ 23,989 0�70% 6�80% 123%
Class YFor the six months ended June 30, 2021 (Unaudited) $ 11�42 0�31 0�14 0�45 (0�31) — (0�31) $ 11�56 3�96%(E) $ 48,729 0�55%(F) 5�31%(F) 71%(E)
For the year ended December 31, 2020 $ 11�03 0�64 0�83 1�47 (0�63) (0�45) (1�08) $ 11�42 13�92% $ 32,171 0�55% 5�74% 186%For the year ended December 31, 2019 $ 10�22 0�65 0�91 1�56 (0�64) (0�11) (0�75) $ 11�03 15�56% $ 20,190 0�56% 5�99% 164%For the year ended December 31, 2018 $ 10�78 0�67 (0�53) 0�14 (0�65) (0�05) (0�70) $ 10�22 1�27% $ 29,274 0�55% 6�23% 145%For the year ended December 31, 2017 $ 10�65 0�69 0�40 1�09 (0�70) (0�26) (0�96) $ 10�78 10�48% $ 16,623 0�59% 6�28% 137%For the year ended December 31, 2016 $ 10�14 0�74 0�71 1�45 (0�70) (0�24) (0�94) $ 10�65 14�73% $ 7,752 0�60% 7�07% 123%
(A) Inception date of the Fund is December 31, 2015� Fund commenced public offering and operations on January 4, 2016�
(B) Net investment income per share has been calculated using the average daily shares outstanding during the period�
(C) Total returns shown exclude the effect of applicable sales charges for periods prior to June 30, 2021�See accompanying Notes to Financial Statements�

DIAMOND HILL FUNDS | SEMI-ANNUAL REPORT | JUNE 30, 2021 | DIAMOND-HILL.COM 121
High Yield Fund(A)
Net asset value,
beginning of period
Net investment income(B)
Net realized and
unrealized gains
(losses) on investments
Total from investment operations
Dividends from net
investment income
Distributions from net realized
capital gainsTotal
distributions
Net asset value, end of
periodTotal
return(C)
Net assets, end of period (000’s)
Ratio of total net expenses
to average net assets
Ratio of net investment income to
average net assets
Portfolio turnover
rate(D)
Investor (formerly Class A)For the six months ended June 30, 2021 (Unaudited) $ 11�40 0�28 0�15 0�43 (0�29) — (0�29) $ 11�54 3�78%(E) $ 77,937 0�96%(F) 4�89%(F) 71%(E)
For the year ended December 31, 2020 $ 11�02 0�60 0�81 1�41 (0�58) (0�45) (1�03) $ 11�40 13�40% $ 39,496 0�96% 5�46% 186%For the year ended December 31, 2019 $ 10�22 0�60 0�91 1�51 (0�60) (0�11) (0�71) $ 11�02 15�04% $ 18,004 0�97% 5�49% 164%For the year ended December 31, 2018 $ 10�77 0�62 (0�51) 0�11 (0�61) (0�05) (0�66) $ 10�22 0�97% $ 1,674 0�96% 5�81% 145%For the year ended December 31, 2017 $ 10�65 0�65 0�38 1�03 (0�65) (0�26) (0�91) $ 10�77 9�96% $ 296 0�99% 5�89% 137%For the year ended December 31, 2016 $ 10�14 0�70 0�71 1�41 (0�66) (0�24) (0�90) $ 10�65 14�29% $ 185 0�99% 6�51% 123%
Class IFor the six months ended June 30, 2021 (Unaudited) $ 11�40 0�30 0�15 0�45 (0�30) — (0�30) $ 11�55 4�01%(E) $ 1,020,851 0�67%(F) 5�18%(F) 71%(E)
For the year ended December 31, 2020 $ 11�03 0�64 0�80 1�44 (0�62) (0�45) (1�07) $ 11�40 13�62% $ 651,836 0�67% 5�81% 186%For the year ended December 31, 2019 $ 10�22 0�63 0�91 1�54 (0�62) (0�11) (0�73) $ 11�03 15�44% $ 96,563 0�68% 5�79% 164%For the year ended December 31, 2018 $ 10�78 0�65 (0�52) 0�13 (0�64) (0�05) (0�69) $ 10�22 1�16% $ 23,499 0�67% 6�10% 145%For the year ended December 31, 2017 $ 10�65 0�68 0�39 1�07 (0�68) (0�26) (0�94) $ 10�78 10�36% $ 14,185 0�69% 6�23% 137%For the year ended December 31, 2016 $ 10�14 0�73 0�71 1�44 (0�69) (0�24) (0�93) $ 10�65 14�62% $ 23,989 0�70% 6�80% 123%
Class YFor the six months ended June 30, 2021 (Unaudited) $ 11�42 0�31 0�14 0�45 (0�31) — (0�31) $ 11�56 3�96%(E) $ 48,729 0�55%(F) 5�31%(F) 71%(E)
For the year ended December 31, 2020 $ 11�03 0�64 0�83 1�47 (0�63) (0�45) (1�08) $ 11�42 13�92% $ 32,171 0�55% 5�74% 186%For the year ended December 31, 2019 $ 10�22 0�65 0�91 1�56 (0�64) (0�11) (0�75) $ 11�03 15�56% $ 20,190 0�56% 5�99% 164%For the year ended December 31, 2018 $ 10�78 0�67 (0�53) 0�14 (0�65) (0�05) (0�70) $ 10�22 1�27% $ 29,274 0�55% 6�23% 145%For the year ended December 31, 2017 $ 10�65 0�69 0�40 1�09 (0�70) (0�26) (0�96) $ 10�78 10�48% $ 16,623 0�59% 6�28% 137%For the year ended December 31, 2016 $ 10�14 0�74 0�71 1�45 (0�70) (0�24) (0�94) $ 10�65 14�73% $ 7,752 0�60% 7�07% 123%
(D) Portfolio turnover rate is calculated on the basis of the Fund as a whole without distinguishing between classes of shares issued�
(E) Not annualized�(F) Annualized�See accompanying Notes to Financial Statements�

122 DIAMOND HILL FUNDS | SEMI-ANNUAL REPORT | JUNE 30, 2021 | DIAMOND-HILL.COM
Diamond Hill Funds Notes to Financial Statements June 30, 2021 (Unaudited)
Organization
The Diamond Hill Small Cap Fund (“Small Cap Fund”), Diamond Hill Small-Mid Cap Fund (“Small-Mid Cap Fund”), Diamond Hill Mid Cap Fund (“Mid Cap Fund”), Diamond Hill Large Cap Fund (“Large Cap Fund”), Diamond Hill Large Cap Concentrated Fund (“Large Cap Concentrated Fund”), Diamond Hill All Cap Select Fund (“All Cap Select Fund”), Diamond Hill Long-Short Fund (“Long-Short Fund”), Diamond Hill Global Fund (“Global Fund”), Diamond Hill International Fund (“International Fund”), Diamond Hill Short Duration Securitized Bond Fund (“Short Duration Fund”), Diamond Hill Core Bond Fund (“Core Bond Fund”), Diamond Hill Corporate Credit Fund (“Corporate Credit Fund”) and Diamond Hill High Yield Fund (“High Yield Fund”) are each a diversified series, except for All Cap Select Fund and Large Cap Concentrated Fund which are non-diversified, of the Diamond Hill Funds (the “Trust”) (each a “Fund” and collectively the “Funds”). The Trust is registered under the Investment Company Act of 1940, as amended (the “1940 Act”), as an open-end management company. Each Fund follows accounting and reporting guidance under Financial Accounting Standards Board (“FASB”) Accounting Standards Codification Topic 946, “Financial Services – Investment Companies.”
The shareholders of the Diamond Hill Research Opportunities Fund (“Research Opportunities Fund”) approved an Agreement and Plan of Reorganization providing for the transfer of all assets and liabilities of the Research Opportunities Fund to the Long-Short Fund. The tax-free reorganization took place on October 23, 2020.
The following is a summary of shares outstanding, net assets, NAV per share and unrealized appreciation immediately before and after the reorganization.
Before ReorganizationAfter
Reorganization
Research Opportunities
FundLong-Short
FundLong-Short
Fund
Class AShares 243,462 6,253,187 6,479,452Net Assets $ 5,435,645 $ 150,222,454 $ 155,658,099Net Asset Value $ 22�33 $ 24�02 $ 24�02
Class CShares 36,823 1,118,057 1,154,420Net Assets $ 762,183 $ 23,434,970 $ 24,197,153Net Asset Value $ 20�70 $ 20�96 $ 20�96
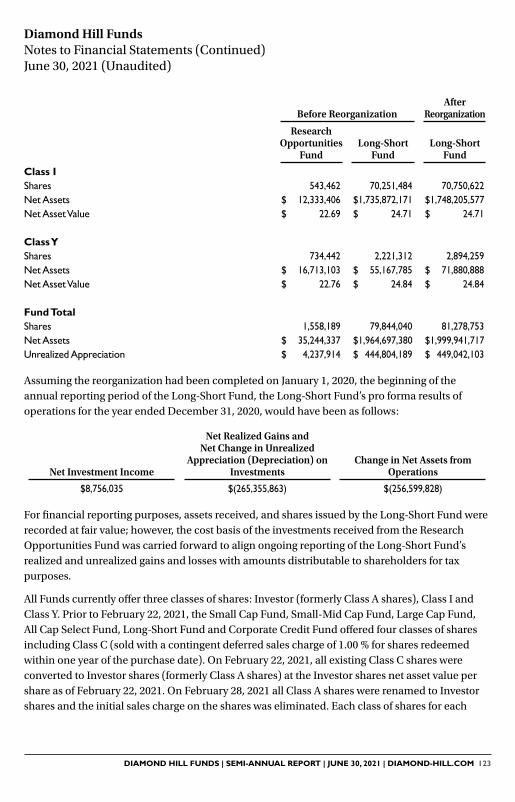
DIAMOND HILL FUNDS | SEMI-ANNUAL REPORT | JUNE 30, 2021 | DIAMOND-HILL.COM 123
Diamond Hill Funds Notes to Financial Statements (Continued) June 30, 2021 (Unaudited)
Before ReorganizationAfter
Reorganization
Research Opportunities
FundLong-Short
FundLong-Short
Fund
Class IShares 543,462 70,251,484 70,750,622Net Assets $ 12,333,406 $ 1,735,872,171 $ 1,748,205,577Net Asset Value $ 22�69 $ 24�71 $ 24�71
Class YShares 734,442 2,221,312 2,894,259Net Assets $ 16,713,103 $ 55,167,785 $ 71,880,888Net Asset Value $ 22�76 $ 24�84 $ 24�84
Fund TotalShares 1,558,189 79,844,040 81,278,753Net Assets $ 35,244,337 $ 1,964,697,380 $ 1,999,941,717Unrealized Appreciation $ 4,237,914 $ 444,804,189 $ 449,042,103
Assuming the reorganization had been completed on January 1, 2020, the beginning of the annual reporting period of the Long-Short Fund, the Long-Short Fund’s pro forma results of operations for the year ended December 31, 2020, would have been as follows:
Net Investment Income
Net Realized Gains and Net Change in Unrealized
Appreciation (Depreciation) on Investments
Change in Net Assets from Operations
$8,756,035 $(265,355,863) $(256,599,828)
For financial reporting purposes, assets received, and shares issued by the Long-Short Fund were recorded at fair value; however, the cost basis of the investments received from the Research Opportunities Fund was carried forward to align ongoing reporting of the Long-Short Fund’s realized and unrealized gains and losses with amounts distributable to shareholders for tax purposes.
All Funds currently offer three classes of shares: Investor (formerly Class A shares), Class I and Class Y. Prior to February 22, 2021, the Small Cap Fund, Small-Mid Cap Fund, Large Cap Fund, All Cap Select Fund, Long-Short Fund and Corporate Credit Fund offered four classes of shares including Class C (sold with a contingent deferred sales charge of 1.00 % for shares redeemed within one year of the purchase date). On February 22, 2021, all existing Class C shares were converted to Investor shares (formerly Class A shares) at the Investor shares net asset value per share as of February 22, 2021. On February 28, 2021 all Class A shares were renamed to Investor shares and the initial sales charge on the shares was eliminated. Each class of shares for each
124 DIAMOND HILL FUNDS | SEMI-ANNUAL REPORT | JUNE 30, 2021 | DIAMOND-HILL.COM
Diamond Hill Funds Notes to Financial Statements (Continued) June 30, 2021 (Unaudited)
Fund has identical rights and privileges except with respect to distribution (12b-1) and service fees, voting rights on matters affecting a single class of shares, exchange privileges of each class of shares.
New Accounting Pronouncement
In March 2020, the FASB issued Accounting Standards Update No. 2020-04 (“ASU 2020-04”), “Reference Rate Reform (Topic 848): Facilitation of the Effects of Reference Rate Reform on Financial Reporting”. ASU 2020-04 provides optional temporary financial reporting relief from the effect of certain types of contract modifications due to the planned discontinuation of the London Interbank Offered Rate (“LIBOR”) and other interbank -offered based reference rates at the end of 2021. ASU 2020-04 is effective for certain reference rate-related contract modifications that occur during the period March 12, 2020 through December 31, 2022. The Funds will consider this optional guidance prospectively, if applicable.
Significant Accounting Policies
The following is a summary of the Funds’ significant accounting policies:
Estimates — The financial statements are prepared in conformity with accounting principles generally accepted in the United States of America (“GAAP”), which requires management to make estimates and assumptions that affect the reported amounts of assets and liabilities and disclosure of contingent assets and liabilities at the date of the financial statements and the reported amounts of income and expenses during the reporting period. Actual results could differ from those estimates.
Security valuation — The Funds record their investments at fair value. Fair value is defined as the price that would be received to sell an asset or paid to transfer a liability in an orderly transaction between market participants at the measurement date. The valuation techniques used by the Funds maximize the use of observable inputs and minimize the use of unobservable inputs in determining fair value. These inputs are summarized in the three broad levels listed below:
• Level 1 — quoted prices in active markets for identical securities
• Level 2 — other significant observable inputs (including quoted prices for similar securities, interest rates, prepayment speeds, credit risk, etc.)
• Level 3 — significant unobservable inputs (including the Funds’ own assumptions in determining the fair value of investments)
Listed securities for which market quotations are readily available are valued at the closing prices as determined by the primary exchange where the securities are traded. Unlisted securities or listed securities for which the latest sales prices are not readily available are valued at the closing bid (long positions) or ask (short positions) price in the principal market where such securities
DIAMOND HILL FUNDS | SEMI-ANNUAL REPORT | JUNE 30, 2021 | DIAMOND-HILL.COM 125
Diamond Hill Funds Notes to Financial Statements (Continued) June 30, 2021 (Unaudited)
are normally traded. Investments in other open-end investment companies are valued at their reported NAV per share. In each of these situations, valuations are typically categorized as Level 1 in the fair value hierarchy.
Debt securities are valued on the basis of valuations provided by dealers or by an independent pricing service which take into account appropriate factors such as trading activity (i.e., market transactions for normal, institutional-size trading units of similar securities), readily available market quotations (including broker quotes), yield, quality, coupon rate, maturity, type of issue, trading characteristic, call features, credit ratings and other data. Short-term debt investments of sufficient credit quality maturing in less than 61 days may be valued at amortized cost, if amortized cost is determined to approximate fair value. In each of these situations, valuations are typically categorized as Level 2 in the fair value hierarchy.
Securities for which market quotations are not readily available (e.g., an approved pricing service does not provide a price, a price becomes stale, or an event occurs that materially affects the furnished price) are valued by the Valuation & Liquidity Committee. In these cases, the Valuation & Liquidity Committee, established and appointed by the Board of Trustees, determines in good faith, subject to Trust procedures, the fair value of portfolio securities held by a Fund (“good faith fair valuation”). When a good faith fair valuation of a security is required, consideration is generally given to a number of factors, including, but not limited to the following: dealer quotes, published analyses by dealers or analysts of the situation at issue, transactions implicitly valuing the security (such as a merger, tender offer, etc.), the value of other securities or contracts which derive their value from the security at issue, and the implications (whether negative or positive) of the circumstances which have caused trading in the security to halt. Depending on the source and relative significance of the valuation inputs in these instances, the valuations for these securities may be classified as Level 2 or Level 3 in the fair value hierarchy.
In accordance with procedures adopted by the Trust’s Board of Trustees, fair value pricing may be used if events materially affecting the value of foreign equity securities occur between the time the exchange on which they are traded closes and the time the Funds’ NAVs are calculated. The Funds use a systematic valuation model, provided daily by an independent third party, to fair value their international equity securities. These valuations are considered as Level 2 in the fair value hierarchy.
Changes in valuation techniques may result in transfers in or out of an assigned level within the disclosure hierarchy.
The inputs or methodology used for valuing securities are not necessarily an indication of the risks associated with investing in those securities. For example, short-term debt securities of sufficient credit quality maturing in less than 61 days may be valued using amortized cost in accordance with rules under the 1940 Act. Generally, amortized cost approximates the current

126 DIAMOND HILL FUNDS | SEMI-ANNUAL REPORT | JUNE 30, 2021 | DIAMOND-HILL.COM
Diamond Hill Funds Notes to Financial Statements (Continued) June 30, 2021 (Unaudited)
fair value of a security, but since the value is not obtained from a quoted price in an active market, such securities are reflected as Level 2. The following is a summary of the Funds’ investments and the inputs used to value the investments as of June 30, 2021:
Level 1 - Quoted Prices
Level 2 - Other
Significant Observable
Inputs
Level 3 - Significant
Unobservable Inputs Total
Investments in Securities (Assets)Small Cap Fund
Common Stocks* $ 561,523,594 $ — $ — $ 561,523,594Registered Investment Companies 54,322,112 — — 54,322,112
Total $ 615,845,706 $ — $ — $ 615,845,706Small-Mid Cap Fund
Common Stocks* $ 2,037,547,046 $ — $ — $ 2,037,547,046Registered Investment Companies 229,670,003 — — 229,670,003
Total $ 2,267,217,049 $ — $ — $ 2,267,217,049Mid Cap Fund
Common Stocks* $ 260,272,665 $ — $ — $ 260,272,665Registered Investment Companies 16,484,674 — — 16,484,674
Total $ 276,757,339 $ — $ — $ 276,757,339Large Cap Fund
Common Stocks* $ 11,194,558,257 $ — $ — $ 11,194,558,257Registered Investment Companies 215,227,177 — — 215,227,177
Total $ 11,409,785,434 $ — $ — $ 11,409,785,434Large Cap Concentrated Fund
Common Stocks* $ 13,447,908 $ — $ — $ 13,447,908Registered Investment Companies 548,345 — — 548,345
Total $ 13,996,253 $ — $ — $ 13,996,253All Cap Select Fund
Common Stocks* $ 352,557,414 $ — $ — $ 352,557,414Registered Investment Companies 7,998,363 — — 7,998,363
Total $ 360,555,777 $ — $ — $ 360,555,777Long-Short Fund
Common Stocks* $ 1,850,996,470 $ — $ — $ 1,850,996,470Registered Investment Companies 588,512,290 — — 588,512,290
Total $ 2,439,508,760 $ — $ — $ 2,439,508,760Global Fund
Common Stocks $ 11,086,597 $ 5,418,025 $ — $ 16,504,622Registered Investment Companies 552,486 — — 552,486
Total $ 11,639,083 $ 5,418,025 $ — $ 17,057,108
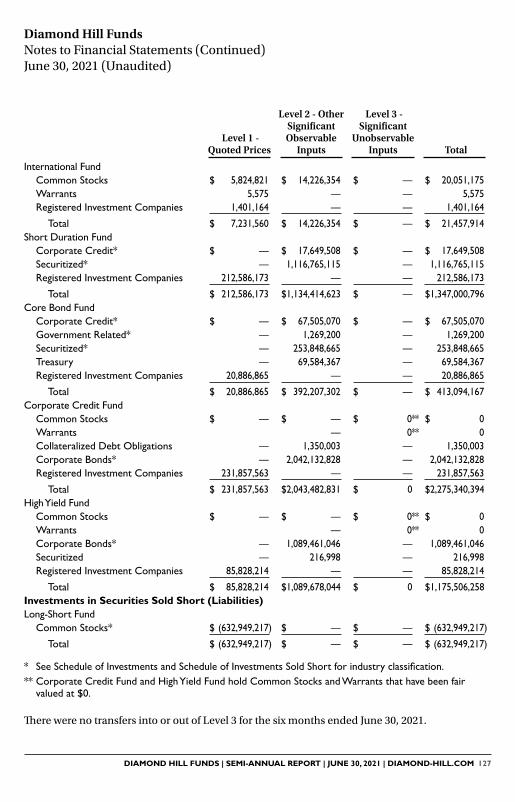
DIAMOND HILL FUNDS | SEMI-ANNUAL REPORT | JUNE 30, 2021 | DIAMOND-HILL.COM 127
Diamond Hill Funds Notes to Financial Statements (Continued) June 30, 2021 (Unaudited)
Level 1 - Quoted Prices
Level 2 - Other
Significant Observable
Inputs
Level 3 - Significant
Unobservable Inputs Total
International FundCommon Stocks $ 5,824,821 $ 14,226,354 $ — $ 20,051,175Warrants 5,575 — — 5,575Registered Investment Companies 1,401,164 — — 1,401,164
Total $ 7,231,560 $ 14,226,354 $ — $ 21,457,914Short Duration Fund
Corporate Credit* $ — $ 17,649,508 $ — $ 17,649,508Securitized* — 1,116,765,115 — 1,116,765,115Registered Investment Companies 212,586,173 — — 212,586,173
Total $ 212,586,173 $ 1,134,414,623 $ — $ 1,347,000,796Core Bond Fund
Corporate Credit* $ — $ 67,505,070 $ — $ 67,505,070Government Related* — 1,269,200 — 1,269,200Securitized* — 253,848,665 — 253,848,665Treasury — 69,584,367 — 69,584,367Registered Investment Companies 20,886,865 — — 20,886,865
Total $ 20,886,865 $ 392,207,302 $ — $ 413,094,167Corporate Credit Fund
Common Stocks $ — $ — $ 0** $ 0Warrants — 0** 0Collateralized Debt Obligations — 1,350,003 — 1,350,003Corporate Bonds* — 2,042,132,828 — 2,042,132,828Registered Investment Companies 231,857,563 — — 231,857,563
Total $ 231,857,563 $ 2,043,482,831 $ 0 $ 2,275,340,394High Yield Fund
Common Stocks $ — $ — $ 0** $ 0Warrants — 0** 0Corporate Bonds* — 1,089,461,046 — 1,089,461,046Securitized — 216,998 — 216,998Registered Investment Companies 85,828,214 — — 85,828,214
Total $ 85,828,214 $ 1,089,678,044 $ 0 $ 1,175,506,258Investments in Securities Sold Short (Liabilities)Long-Short Fund
Common Stocks* $ (632,949,217) $ — $ — $ (632,949,217)
Total $ (632,949,217) $ — $ — $ (632,949,217)
* SeeScheduleofInvestmentsandScheduleofInvestmentsSoldShortforindustryclassification.** Corporate Credit Fund and High Yield Fund hold Common Stocks and Warrants that have been fair
valued at $0�
There were no transfers into or out of Level 3 for the six months ended June 30, 2021.
128 DIAMOND HILL FUNDS | SEMI-ANNUAL REPORT | JUNE 30, 2021 | DIAMOND-HILL.COM
Short sales — The Long-Short Fund, Global Fund, International Fund, Corporate Credit Fund and High Yield Fund are permitted to make short sales of securities. Short sales are effective when it is believed that the price of a particular security will decline and involves the sale of a security that the Fund does not own in hope of purchasing the same security at a later date at a lower price. To make delivery to the buyer, a Fund must borrow the security, and the Fund is obligated to return the security to the lender, which is accomplished by a later purchase of the security by the Fund. Cash received from short sales and other liquid securities are maintained by the custodian and are used as collateral. Cash collateral is shown as “Cash deposits with custodian for securities sold short” on the Statements of Assets & Liabilities and “Segregated Cash With Custodian” on the Schedules of Investments. Liquid securities pledged as collateral are noted on the Schedules of Investments.
A Fund will incur a loss as a result of a short sale if the price of the security increases between the date of the short sale and the date on which the Fund purchases the security to replace the borrowed security. Although a Fund’s gain is limited to the amount at which it sold a security short, its potential loss is not limited. The use of short sales may cause a Fund to have higher expenses (specifically dividend expenses) than those of other equity mutual funds. Short sales are speculative transactions and involve special risks, including greater reliance on the ability of the Funds’ investment adviser, Diamond Hill Capital Management, Inc. (“DHCM”), to accurately anticipate the future value of a security.
A Fund may also incur stock loan fees which represent the cost of borrowing securities used for short sale transactions. A Fund may also earn rebates as an element of the custodian arrangement, which are recorded as an offset to stock loan fees on short sales transactions. The stock loan fees on short sales are recognized on the Statements of Operations. In the event that rebates exceed the stock loan fees on short sales, the net rebates are recognized as a component of investment income on the Statements of Operations.
Securities lending — Under the terms of the securities lending agreement with State Street Bank and Trust Company (“State Street”), State Street is authorized to loan securities on behalf of the Funds to approved borrowers. The contractual maturity of securities lending transactions is on an overnight and continuous basis. In exchange, the Funds receive cash and/or U.S. Treasury and government agency securities as collateral in the amount of at least 100% of the value of the securities loaned. Any collateral shortfalls due to changes in security market prices are adjusted the next business day. The cash collateral is invested in short-term instruments as noted in each Fund’s Schedule of Investments. Although risk is mitigated by the collateral, the Funds could experience a delay in recovering their securities and possible loss of income or value if the borrower fails to return them. The agreement indemnifies the Funds from losses incurred in the event of a borrower’s material default of the terms and conditions of the borrower agreement. The agreement provides that after predetermined rebates to borrowers, the Funds each retain a portion of their respective net securities lending income and pay State Street the remaining portion. The Funds manage credit exposure arising from these lending transactions by, in appropriate circumstances, entering into a master netting agreement and collateral agreement
Diamond Hill Funds Notes to Financial Statements (Continued) June 30, 2021 (Unaudited)
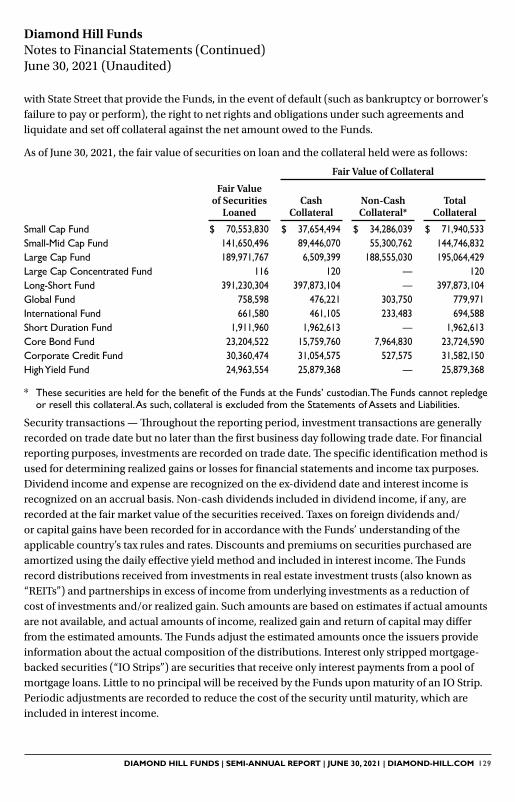
DIAMOND HILL FUNDS | SEMI-ANNUAL REPORT | JUNE 30, 2021 | DIAMOND-HILL.COM 129
with State Street that provide the Funds, in the event of default (such as bankruptcy or borrower’s failure to pay or perform), the right to net rights and obligations under such agreements and liquidate and set off collateral against the net amount owed to the Funds.
As of June 30, 2021, the fair value of securities on loan and the collateral held were as follows:
Fair Value of Collateral
Fair Value of Securities
Loaned Cash
Collateral Non-Cash Collateral*
Total Collateral
Small Cap Fund $ 70,553,830 $ 37,654,494 $ 34,286,039 $ 71,940,533Small-Mid Cap Fund 141,650,496 89,446,070 55,300,762 144,746,832Large Cap Fund 189,971,767 6,509,399 188,555,030 195,064,429Large Cap Concentrated Fund 116 120 — 120Long-Short Fund 391,230,304 397,873,104 — 397,873,104Global Fund 758,598 476,221 303,750 779,971International Fund 661,580 461,105 233,483 694,588Short Duration Fund 1,911,960 1,962,613 — 1,962,613Core Bond Fund 23,204,522 15,759,760 7,964,830 23,724,590Corporate Credit Fund 30,360,474 31,054,575 527,575 31,582,150High Yield Fund 24,963,554 25,879,368 — 25,879,368
* ThesesecuritiesareheldforthebenefitoftheFundsattheFunds’custodian.TheFundscannotrepledgeor resell this collateral� As such, collateral is excluded from the Statements of Assets and Liabilities�
Security transactions — Throughout the reporting period, investment transactions are generally recorded on trade date but no later than the first business day following trade date. For financial reporting purposes, investments are recorded on trade date. The specific identification method is used for determining realized gains or losses for financial statements and income tax purposes. Dividend income and expense are recognized on the ex-dividend date and interest income is recognized on an accrual basis. Non-cash dividends included in dividend income, if any, are recorded at the fair market value of the securities received. Taxes on foreign dividends and/or capital gains have been recorded for in accordance with the Funds’ understanding of the applicable country’s tax rules and rates. Discounts and premiums on securities purchased are amortized using the daily effective yield method and included in interest income. The Funds record distributions received from investments in real estate investment trusts (also known as “REITs”) and partnerships in excess of income from underlying investments as a reduction of cost of investments and/or realized gain. Such amounts are based on estimates if actual amounts are not available, and actual amounts of income, realized gain and return of capital may differ from the estimated amounts. The Funds adjust the estimated amounts once the issuers provide information about the actual composition of the distributions. Interest only stripped mortgage-backed securities (“IO Strips”) are securities that receive only interest payments from a pool of mortgage loans. Little to no principal will be received by the Funds upon maturity of an IO Strip. Periodic adjustments are recorded to reduce the cost of the security until maturity, which are included in interest income.
Diamond Hill Funds Notes to Financial Statements (Continued) June 30, 2021 (Unaudited)

130 DIAMOND HILL FUNDS | SEMI-ANNUAL REPORT | JUNE 30, 2021 | DIAMOND-HILL.COM
Share valuation — The NAV per share of each class of shares of each Fund is calculated daily by dividing the total value of a Fund’s assets attributable to that class, less liabilities attributable to that class, by the number of shares of that class outstanding.
Income taxes — The Funds may be subject to taxes imposed by countries in which they invest. Such taxes are generally based on income and/or capital gains earned or repatriated. Taxes are accrued and applied to net investment income, net realized gains and unrealized appreciation as such income and/or gains are earned.
Each Fund has complied and intends to continue to comply with the requirements of the Internal Revenue Code that are applicable to regulated investment companies and to distribute substantially all of its taxable net investment income and any net realized capital gains to its shareholders.
The Funds recognize tax benefits or expenses of uncertain tax positions only when the position is “more likely than not” to be sustained assuming examination by tax authorities. Management of the Funds has reviewed tax positions taken in tax years that remain subject to examination by all major tax jurisdictions, including federal (i.e., the previous three tax year ends and the interim tax period since then, as applicable), and has concluded that no provision for unrecognized tax benefits or expenses is required in these financial statements and does not expect this to change over the next twelve months. The Funds recognize interest and penalties, if any, related to unrecognized tax benefits as income tax expense on the Statements of Operations. During the six months ended June 30, 2021, the Funds did not incur any interest or penalties.
Distributions to shareholders — Dividends from net investment income are declared and paid monthly for the Short Duration Fund, Core Bond Fund, Corporate Credit Fund and High Yield Fund. Dividends from net investment income are declared and paid on an annual basis for the Small Cap Fund, Small-Mid Cap Fund, Mid Cap Fund, Large Cap Fund, Large Cap Concentrated Fund, All Cap Select Fund, Long-Short Fund, Global Fund and International Fund. Dividends are declared separately for each class. No class has preferential dividend rights; differences in per share rates are due to differences in the expenses of each class. Net realized capital gains, if any, are distributed at least annually. Distributions from net investment income and from net capital gains are determined in accordance with U.S. income tax regulations, which may differ from GAAP. These differences are primarily due to differing treatments for paydown gains and losses on mortgage-backed securities and deferrals of certain losses. Permanent book and tax basis differences are reclassified among the components of net assets. Certain Funds may utilize earnings and profits distributed to shareholders on redemption of shares as part of the dividends paid deduction for income tax purposes.
Allocations — Investment income earned, realized capital gains and losses, and unrealized appreciation and depreciation are allocated daily to each class of shares of a Fund based upon its proportionate share of total net assets of the Fund. Class specific expenses are charged directly to the class incurring the expense. Common expenses, which are not attributable to a specific class,
Diamond Hill Funds Notes to Financial Statements (Continued) June 30, 2021 (Unaudited)
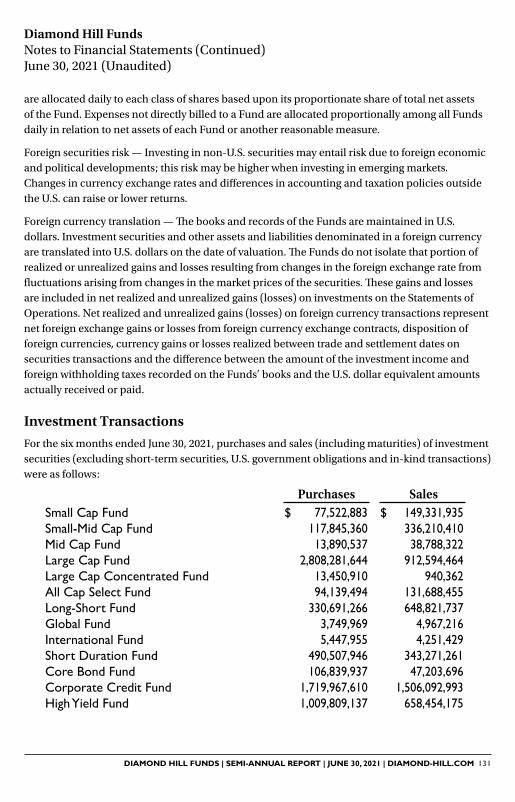
DIAMOND HILL FUNDS | SEMI-ANNUAL REPORT | JUNE 30, 2021 | DIAMOND-HILL.COM 131
are allocated daily to each class of shares based upon its proportionate share of total net assets of the Fund. Expenses not directly billed to a Fund are allocated proportionally among all Funds daily in relation to net assets of each Fund or another reasonable measure.
Foreign securities risk — Investing in non-U.S. securities may entail risk due to foreign economic and political developments; this risk may be higher when investing in emerging markets. Changes in currency exchange rates and differences in accounting and taxation policies outside the U.S. can raise or lower returns.
Foreign currency translation — The books and records of the Funds are maintained in U.S. dollars. Investment securities and other assets and liabilities denominated in a foreign currency are translated into U.S. dollars on the date of valuation. The Funds do not isolate that portion of realized or unrealized gains and losses resulting from changes in the foreign exchange rate from fluctuations arising from changes in the market prices of the securities. These gains and losses are included in net realized and unrealized gains (losses) on investments on the Statements of Operations. Net realized and unrealized gains (losses) on foreign currency transactions represent net foreign exchange gains or losses from foreign currency exchange contracts, disposition of foreign currencies, currency gains or losses realized between trade and settlement dates on securities transactions and the difference between the amount of the investment income and foreign withholding taxes recorded on the Funds’ books and the U.S. dollar equivalent amounts actually received or paid.
Investment Transactions
For the six months ended June 30, 2021, purchases and sales (including maturities) of investment securities (excluding short-term securities, U.S. government obligations and in-kind transactions) were as follows:
Purchases Sales Small Cap Fund $ 77,522,883 $ 149,331,935Small-Mid Cap Fund 117,845,360 336,210,410Mid Cap Fund 13,890,537 38,788,322Large Cap Fund 2,808,281,644 912,594,464Large Cap Concentrated Fund 13,450,910 940,362All Cap Select Fund 94,139,494 131,688,455Long-Short Fund 330,691,266 648,821,737Global Fund 3,749,969 4,967,216International Fund 5,447,955 4,251,429Short Duration Fund 490,507,946 343,271,261Core Bond Fund 106,839,937 47,203,696Corporate Credit Fund 1,719,967,610 1,506,092,993High Yield Fund 1,009,809,137 658,454,175
Diamond Hill Funds Notes to Financial Statements (Continued) June 30, 2021 (Unaudited)
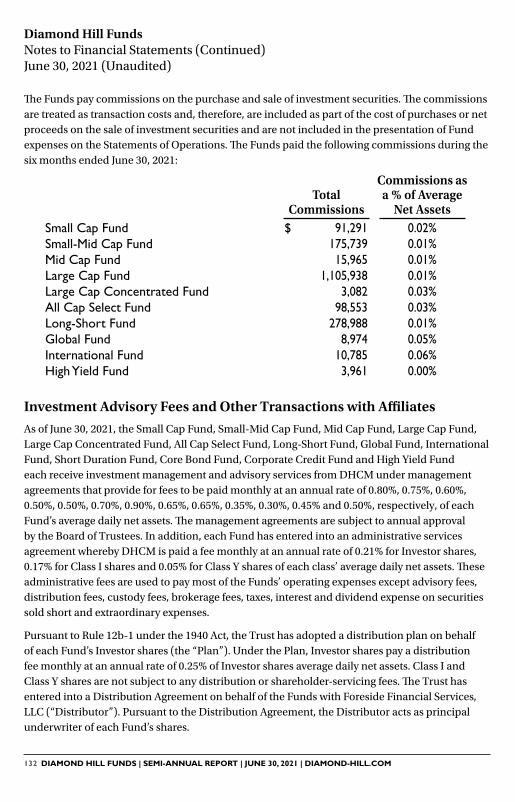
132 DIAMOND HILL FUNDS | SEMI-ANNUAL REPORT | JUNE 30, 2021 | DIAMOND-HILL.COM
The Funds pay commissions on the purchase and sale of investment securities. The commissions are treated as transaction costs and, therefore, are included as part of the cost of purchases or net proceeds on the sale of investment securities and are not included in the presentation of Fund expenses on the Statements of Operations. The Funds paid the following commissions during the six months ended June 30, 2021:
Total Commissions
Commissions as a % of Average
Net Assets Small Cap Fund $ 91,291 0�02%Small-Mid Cap Fund 175,739 0�01%Mid Cap Fund 15,965 0�01%Large Cap Fund 1,105,938 0�01%Large Cap Concentrated Fund 3,082 0�03%All Cap Select Fund 98,553 0�03%Long-Short Fund 278,988 0�01%Global Fund 8,974 0�05%International Fund 10,785 0�06%High Yield Fund 3,961 0�00%
Investment Advisory Fees and Other Transactions with Affiliates
As of June 30, 2021, the Small Cap Fund, Small-Mid Cap Fund, Mid Cap Fund, Large Cap Fund, Large Cap Concentrated Fund, All Cap Select Fund, Long-Short Fund, Global Fund, International Fund, Short Duration Fund, Core Bond Fund, Corporate Credit Fund and High Yield Fund each receive investment management and advisory services from DHCM under management agreements that provide for fees to be paid monthly at an annual rate of 0.80%, 0.75%, 0.60%, 0.50%, 0.50%, 0.70%, 0.90%, 0.65%, 0.65%, 0.35%, 0.30%, 0.45% and 0.50%, respectively, of each Fund’s average daily net assets. The management agreements are subject to annual approval by the Board of Trustees. In addition, each Fund has entered into an administrative services agreement whereby DHCM is paid a fee monthly at an annual rate of 0.21% for Investor shares, 0.17% for Class I shares and 0.05% for Class Y shares of each class’ average daily net assets. These administrative fees are used to pay most of the Funds’ operating expenses except advisory fees, distribution fees, custody fees, brokerage fees, taxes, interest and dividend expense on securities sold short and extraordinary expenses.
Pursuant to Rule 12b-1 under the 1940 Act, the Trust has adopted a distribution plan on behalf of each Fund’s Investor shares (the “Plan”). Under the Plan, Investor shares pay a distribution fee monthly at an annual rate of 0.25% of Investor shares average daily net assets. Class I and Class Y shares are not subject to any distribution or shareholder-servicing fees. The Trust has entered into a Distribution Agreement on behalf of the Funds with Foreside Financial Services, LLC (“Distributor”). Pursuant to the Distribution Agreement, the Distributor acts as principal underwriter of each Fund’s shares.
Diamond Hill Funds Notes to Financial Statements (Continued) June 30, 2021 (Unaudited)
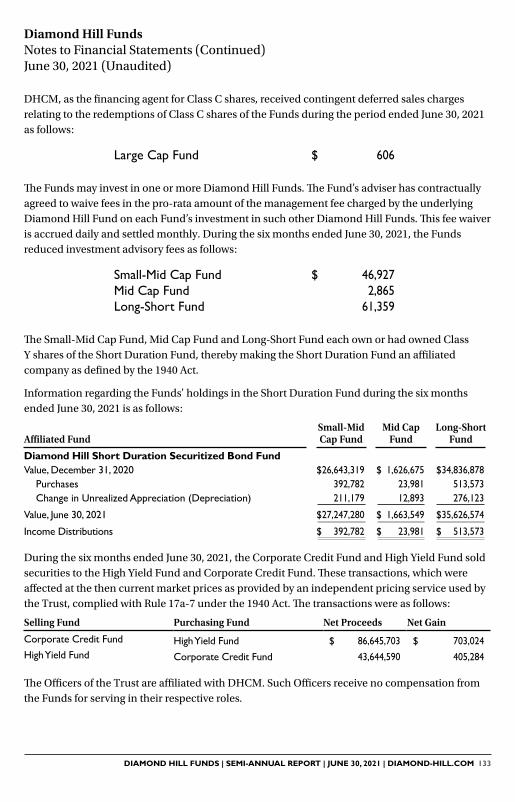
DIAMOND HILL FUNDS | SEMI-ANNUAL REPORT | JUNE 30, 2021 | DIAMOND-HILL.COM 133
DHCM, as the financing agent for Class C shares, received contingent deferred sales charges relating to the redemptions of Class C shares of the Funds during the period ended June 30, 2021 as follows:
Large Cap Fund $ 606
The Funds may invest in one or more Diamond Hill Funds. The Fund’s adviser has contractually agreed to waive fees in the pro-rata amount of the management fee charged by the underlying Diamond Hill Fund on each Fund’s investment in such other Diamond Hill Funds. This fee waiver is accrued daily and settled monthly. During the six months ended June 30, 2021, the Funds reduced investment advisory fees as follows:
Small-Mid Cap Fund $ 46,927Mid Cap Fund 2,865Long-Short Fund 61,359
The Small-Mid Cap Fund, Mid Cap Fund and Long-Short Fund each own or had owned Class Y shares of the Short Duration Fund, thereby making the Short Duration Fund an affiliated company as defined by the 1940 Act.
Information regarding the Funds’ holdings in the Short Duration Fund during the six months ended June 30, 2021 is as follows:
Affiliated FundSmall-Mid Cap Fund
Mid Cap Fund
Long-Short Fund
Diamond Hill Short Duration Securitized Bond FundValue, December 31, 2020 $ 26,643,319 $ 1,626,675 $ 34,836,878
Purchases 392,782 23,981 513,573Change in Unrealized Appreciation (Depreciation) 211,179 12,893 276,123
Value, June 30, 2021 $ 27,247,280 $ 1,663,549 $ 35,626,574
Income Distributions $ 392,782 $ 23,981 $ 513,573
During the six months ended June 30, 2021, the Corporate Credit Fund and High Yield Fund sold securities to the High Yield Fund and Corporate Credit Fund. These transactions, which were affected at the then current market prices as provided by an independent pricing service used by the Trust, complied with Rule 17a-7 under the 1940 Act. The transactions were as follows:
Selling Fund Purchasing Fund Net Proceeds Net Gain
Corporate Credit Fund High Yield Fund $ 86,645,703 $ 703,024High Yield Fund Corporate Credit Fund 43,644,590 405,284
The Officers of the Trust are affiliated with DHCM. Such Officers receive no compensation from the Funds for serving in their respective roles.
Diamond Hill Funds Notes to Financial Statements (Continued) June 30, 2021 (Unaudited)

134 DIAMOND HILL FUNDS | SEMI-ANNUAL REPORT | JUNE 30, 2021 | DIAMOND-HILL.COM
Trustee Fees
The Independent Trustees are compensated for their services to the Funds by DHCM as part of the administration services agreement. The Independent Trustees were paid $231,000 in fees during the six months ended June 30, 2021. In addition, DHCM reimburses Trustees for out-of-pocket expenses incurred in conjunction with attendance of meetings.
Commitments and Contingencies
The Funds indemnify the Trust’s Officers and Trustees for certain liabilities that might arise from their performance of their duties to the Funds. Additionally, in the normal course of business, the Funds enter into contracts that contain a variety of representations and warranties and which provide general indemnifications. The Funds’ maximum exposure under these arrangements is unknown, as this would involve future claims that may be made against the Funds that have not yet occurred. However, based on experience, the Funds expect the risk of loss to be remote.
Federal Tax Information
The amount and character of income and capital gain distributions paid by the Funds are determined in accordance with Federal income tax regulations, which may differ from GAAP.
The tax character of distributions paid during the year or period ended December 31, 2020 was as follows:
Small Cap Fund
Small-Mid Cap Fund
Mid Cap Fund
Distributions paid from:Ordinary income $ 2,925,606 $ 13,930,483 $ 1,495,087Long-term capital gains — 786,910 376,407
Total distributions $ 2,925,606 $ 14,717,393 $ 1,871,494
Large Cap Fund
All Cap Select Fund
Long-Short Fund
Distributions paid from:Ordinary income $ 86,692,884 $ 1,790,659 $ 8,842,071Long-term capital gains 192,809,037 — 15,843,708
Total distributions $ 279,501,921 $ 1,790,659 $ 24,685,779
Global Fund
International Fund
Short Duration
Fund
Distributions paid from:Ordinary income $ 139,065 $ 109,630 $ 30,109,298Long-term capital gains — 79,270 —
Total distributions $ 139,065 $ 188,900 $ 30,109,298
Diamond Hill Funds Notes to Financial Statements (Continued) June 30, 2021 (Unaudited)

DIAMOND HILL FUNDS | SEMI-ANNUAL REPORT | JUNE 30, 2021 | DIAMOND-HILL.COM 135
Core Bond Fund
Corporate Credit Fund
High Yield Fund
Distributions paid from:Ordinary income $ 5,006,585 $ 97,728,597 $ 49,580,749Long-term capital gains — 803,265 34,875
Total distributions $ 5,006,585 $ 98,531,862 $ 49,615,624
The following information is computed on a tax basis for each item as of December 31, 2020:
Small Cap Fund
Small-Mid Cap Fund Mid Cap Fund
Large Cap Fund
Net unrealized appreciation on portfolio investments $ 215,708,815 $ 362,391,359 $ 33,805,619 $ 2,380,251,740
Undistributed ordinary income 55,253 278,200 — —Undistributed capital gains 6,856,758 — — 89,107,124Accumulated capital and other losses — (3,354,892) (12,325,192) —
Distributable earnings $ 222,620,826 $ 359,314,667 $ 21,480,427 $ 2,469,358,864
All Cap Select Fund
Long-Short Fund Global Fund
International Fund
Net unrealized appreciation on portfolio investments $ 87,833,932 $ 589,800,245 $ 2,749,567 $ 2,612,062
Undistributed ordinary income 1,678,766 — 48,971 868Undistributed capital gains — 15,269,684 — —Accumulated capital and other losses (54,851) — (2,142,237) (199,756)
Distributable earnings $ 89,457,847 $ 605,069,929 $ 656,301 $ 2,413,174
Short Duration Fund
Core Bond Fund
Corporate Credit Fund
High Yield Fund
Net unrealized appreciation on portfolio investments $ 15,991,832 $ 9,708,335 $ 60,805,275 $ 30,855,658
Undistributed ordinary income — 102,427 15,248,246 6,667,795Undistributed capital gains — — — 280,992Accumulated capital and other losses (7,264,788) — — —
Distributable earnings $ 8,727,044 $ 9,810,762 $ 76,053,521 $ 37,804,445
Diamond Hill Funds Notes to Financial Statements (Continued) June 30, 2021 (Unaudited)

136 DIAMOND HILL FUNDS | SEMI-ANNUAL REPORT | JUNE 30, 2021 | DIAMOND-HILL.COM
As of June 30, 2021, the Funds’ federal tax cost of portfolio investments and net unrealized appreciation (depreciation) on portfolio investments including short sales, where applicable, were as follows:
Small Cap Fund
Small-Mid Cap Fund Mid Cap Fund
Large Cap Fund
Tax cost of portfolio investments $ 374,587,141 $ 1,589,546,380 $ 200,676,216 $ 8,013,363,664
Gross unrealized appreciation 246,318,238 712,839,860 81,399,902 3,482,797,925Gross unrealized depreciation (5,059,673) (35,169,191) (5,318,779) (86,376,155)
Net unrealized appreciation on portfolio investments $ 241,258,565 $ 677,670,669 $ 76,081,123 $ 3,396,421,770
Large Cap Concentrated
Fund All Cap
Select FundLong-Short
Fund Global Fund
Tax cost of portfolio investments $ 13,113,365 $ 237,601,241 $ 1,125,959,171 $ 14,118,390
Gross unrealized appreciation 1,069,253 123,753,906 827,241,671 3,012,567Gross unrealized depreciation (186,365) (799,370) (146,641,299) (73,849)
Net unrealized appreciation on portfolio investments $ 882,888 $ 122,954,536 $ 680,600,372 $ 2,938,718
International Fund
Short Duration Fund
Core Bond Fund
Corporate Credit Fund
Tax cost of portfolio investments $ 18,198,468 $ 1,325,672,890 $ 411,099,550 $ 2,245,520,925
Gross unrealized appreciation 3,795,869 33,108,859 8,526,263 48,579,163Gross unrealized depreciation (536,423) (11,780,953) (6,531,646) (18,759,694)
Net unrealized appreciation on portfolio investments $ 3,259,446 $ 21,327,906 $ 1,994,617 $ 29,819,469
High Yield Fund
Tax cost of portfolio investments $ 1,151,237,509
Gross unrealized appreciation 28,579,968Gross unrealized depreciation (4,311,219)
Net unrealized appreciation on portfolio investments $ 24,268,749
The difference between book basis and tax basis net unrealized appreciation (depreciation) is attributable primarily to the tax deferral of losses on wash sales and unreversed inclusions of Passive Foreign Investment Companies.
For the latest tax year ended December 31, 2020, the following Funds have capital loss carry forwards (“CLCFs”) as summarized below.
Diamond Hill Funds Notes to Financial Statements (Continued) June 30, 2021 (Unaudited)
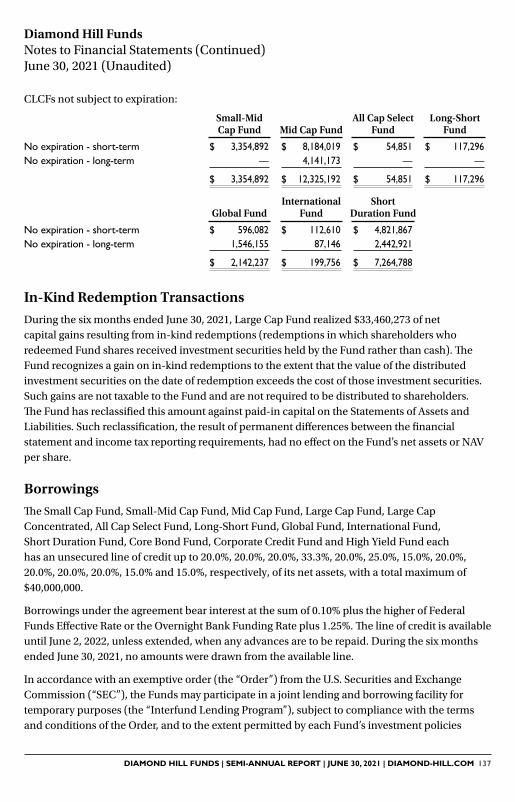
DIAMOND HILL FUNDS | SEMI-ANNUAL REPORT | JUNE 30, 2021 | DIAMOND-HILL.COM 137
CLCFs not subject to expiration:
Small-Mid Cap Fund Mid Cap Fund
All Cap Select Fund
Long-Short Fund
No expiration - short-term $ 3,354,892 $ 8,184,019 $ 54,851 $ 117,296No expiration - long-term — 4,141,173 — —
$ 3,354,892 $ 12,325,192 $ 54,851 $ 117,296
Global FundInternational
FundShort
Duration Fund
No expiration - short-term $ 596,082 $ 112,610 $ 4,821,867No expiration - long-term 1,546,155 87,146 2,442,921
$ 2,142,237 $ 199,756 $ 7,264,788
In-Kind Redemption Transactions
During the six months ended June 30, 2021, Large Cap Fund realized $33,460,273 of net capital gains resulting from in-kind redemptions (redemptions in which shareholders who redeemed Fund shares received investment securities held by the Fund rather than cash). The Fund recognizes a gain on in-kind redemptions to the extent that the value of the distributed investment securities on the date of redemption exceeds the cost of those investment securities. Such gains are not taxable to the Fund and are not required to be distributed to shareholders. The Fund has reclassified this amount against paid-in capital on the Statements of Assets and Liabilities. Such reclassification, the result of permanent differences between the financial statement and income tax reporting requirements, had no effect on the Fund’s net assets or NAV per share.
Borrowings
The Small Cap Fund, Small-Mid Cap Fund, Mid Cap Fund, Large Cap Fund, Large Cap Concentrated, All Cap Select Fund, Long-Short Fund, Global Fund, International Fund, Short Duration Fund, Core Bond Fund, Corporate Credit Fund and High Yield Fund each has an unsecured line of credit up to 20.0%, 20.0%, 20.0%, 33.3%, 20.0%, 25.0%, 15.0%, 20.0%, 20.0%, 20.0%, 20.0%, 15.0% and 15.0%, respectively, of its net assets, with a total maximum of $40,000,000.
Borrowings under the agreement bear interest at the sum of 0.10% plus the higher of Federal Funds Effective Rate or the Overnight Bank Funding Rate plus 1.25%. The line of credit is available until June 2, 2022, unless extended, when any advances are to be repaid. During the six months ended June 30, 2021, no amounts were drawn from the available line.
In accordance with an exemptive order (the “Order”) from the U.S. Securities and Exchange Commission (“SEC”), the Funds may participate in a joint lending and borrowing facility for temporary purposes (the “Interfund Lending Program”), subject to compliance with the terms and conditions of the Order, and to the extent permitted by each Fund’s investment policies
Diamond Hill Funds Notes to Financial Statements (Continued) June 30, 2021 (Unaudited)

138 DIAMOND HILL FUNDS | SEMI-ANNUAL REPORT | JUNE 30, 2021 | DIAMOND-HILL.COM
and restrictions. A lending fund may lend in aggregate up to 15% of its net assets, but may not lend more than 5% of its net assets to any one borrowing fund through the Interfund Lending Program. A borrowing fund may not borrow through the Interfund Lending Program or from any other source more than 33 1/3% of its total assets (or any lower threshold provided for by the fund’s investment restrictions). If a borrowing fund’s total outstanding borrowings exceed 10% of its total assets, each of its outstanding interfund loans will be subject to collateralization of at least 102% of the outstanding principal value of the loan. All interfund loans are for temporary or emergency purposes and the interest rate to be charged will be the average of the highest current overnight repurchase agreement rate available to a lending fund and the bank loan rate, as calculated according to a formula established by the Board. During the six months ended June 30, 2021, none of the Funds participated in the Interfund Lending Program.
Other Matters
The global spread of novel coronavirus disease (COVID-19) was declared a pandemic by the World Health Organization. This pandemic has resulted in significant disruptions to economies and markets, adversely impacting individual companies, sectors, industries, currencies, interest and inflation rates, credit ratings, and investor sentiment. COVID-19 has caused volatility, severe market dislocations and liquidity constraints in many markets, including markets for the securities the Funds hold, and may adversely affect the Funds’ investments and operations. The duration and extent of COVID-19 over the long-term cannot be reasonably estimated at this time. There have been no comparable recent events that provide guidance as to the effect the spread of COVID-19 as a global pandemic may have on the Funds’ financial performance. In addition, COVID-19 and governmental responses to COVID-19 may negatively impact the capabilities of the Funds’ service providers and disrupt the Funds’ operations. This pandemic may result in substantial market volatility and may adversely impact the prices and liquidity of a Fund’s investments. Management continues to monitor and evaluate this situation.
Subsequent Events
The Funds evaluated events from June 30, 2021 through the date that these financial statements were issued. There were no subsequent events to report that would have a material impact on the Funds’ financial statements except for the following:
On February 3, 2021, DHCM announced that it has entered into a definitive agreement to enable Brandywine Global Investment Management, LLC (“Brandywine Global”), a specialist investment manager and subsidiary of Franklin Resources, Inc., to acquire the business of the Corporate Credit and High Yield Funds. The transaction closed on July 30, 2021. Accordingly, on July 30, 2021, the Diamond Hill Corporate Credit Fund was reorganized into the BrandywineGLOBAL – Corporate Credit Fund and the Diamond Hill High Yield Fund was reorganized into the BrandywineGLOBAL – High Yield Fund, and the Diamond Hill Corporate Credit Fund and the Diamond Hill High Yield Fund were terminated. Portfolio managers John McClain and Bill Zox joined Brandywine Global as part of the transaction. Please see “Results of Special Meetings of Shareholders” for more information.
Diamond Hill Funds Notes to Financial Statements (Continued) June 30, 2021 (Unaudited)

DIAMOND HILL FUNDS | SEMI-ANNUAL REPORT | JUNE 30, 2021 | DIAMOND-HILL.COM 139
Proxy Voting
The investment adviser is responsible for exercising the voting rights associated with the securities purchased and held by the Funds. A description of the policies and procedures that the adviser uses in fulfilling this responsibility and information regarding how those proxies were voted during the twelve-month period ended June 30 are available without charge upon request by calling toll free number 1-888-226-5595, or through the Funds’ website, or on the Securities and Exchange Commission’s (“Commission”) website at www.sec.gov.
Portfolio Disclosure
The Trust files a complete listing of portfolio holdings for each Fund as of the end of the first and third quarters of each fiscal year on Part F to Form N-PORT. The complete listing is available on the Commission’s website. Monthly portfolio holdings are also available on www.diamond-hill.com.
Results of Special Meetings of Shareholders
On February 3, 2021, DHCM announced that it had entered into a definitive agreement to enable Brandywine Global Investment Management, LLC (“Brandywine Global”), a specialist investment manager and subsidiary of Franklin Resources, Inc., to acquire the business of the Corporate Credit and High Yield Funds.
A Special Meeting of Shareholders of the Diamond Hill Corporate Credit Fund was held on June 11, 2021, for the purpose of voting on the following:
To consider and vote upon the Agreement and Plan of Reorganization, providing for: (i) the acquisition by the BrandywineGLOBAL – Corporate Credit Fund, of all of the assets and liabilities of Diamond Hill Corporate Credit Fund, in exchange for shares of BrandywineGLOBAL - Corporate Credit Fund to be distributed to the shareholders of Diamond Hill Corporate Credit Fund; and (ii) the subsequent termination of Diamond Hill Corporate Credit Fund.
The voting results were as follows:
Total Shares Outstanding Shares Voted % of Voted % of Total
Diamond Hill Corporate Credit Fund 182,300,049 99,713,751 54�70%Shares Voted For 96,398,652 96�67% 52�88%Shares Voted Against 914,554 0�92% 0�50%Shares Abstained 2,400,545 2�41% 1�32%
Diamond Hill Funds Other Items June 30, 2021 (Unaudited)
140 DIAMOND HILL FUNDS | SEMI-ANNUAL REPORT | JUNE 30, 2021 | DIAMOND-HILL.COM
A Special Meeting of Shareholders of the Diamond Hill High Yield Fund was held on June 29, 2021, for the purpose of voting on the following:
To consider and vote upon the Agreement and Plan of Reorganization, providing for: (i) the acquisition by the BrandywineGLOBAL – High Yield Fund, of all of the assets and liabilities of Diamond Hill High Yield Fund, in exchange for shares of BrandywineGLOBAL – High Yield Fund to be distributed to the shareholders of Diamond Hill High Yield Fund; and (ii) the subsequent termination of Diamond Hill High Yield Fund.
The voting results were as follows:
Total Shares Outstanding Shares Voted % of Voted % of Total
Diamond Hill High Yield Fund 84,315,860 44,911,793 53�27%Shares Voted For 40,721,680 90�67% 48�30%Shares Voted Against 1,232,236 2�74% 1�46%Shares Abstained 2,957,877 6�59% 3�51%
Accordingly, on July 30, 2021, the Diamond Hill Corporate Credit Fund was reorganized into the BrandwineGLOBAL – Corporate Credit Fund and the Diamond Hill High Yield Fund was reorganized into the BrandywineGLOBAL – High Yield Fund, and the Diamond Hill Corporate Credit Fund and the Diamond Hill High Yield Fund were terminated.
Trustee Approval of Investment Advisory Agreement
Initial Approval of Management Agreement for the Diamond Hill Large Cap Concentrated Fund
The Board of Trustees of Diamond Hill Funds (the “Trust”) requested and the Adviser provided a broad range of information in connection with its consideration of approval of the Amended and Restated Investment Management Agreement (“Management Agreement”) between the Trust and Diamond Hill Capital Management, Inc. (the “Adviser”), for the Diamond Hill Large Cap Concentrated Fund (“Large Cap Concentrated Fund”), a newly organized series of the Trust. The Board reviewed the information at a regularly scheduled meeting on February 11, 2021 and by a unanimous vote approved the Management Agreement. The Board had previously renewed the Management Agreement for all series of the Trust on August 20, 2020. In concluding to approve the Management Agreement for the Large Cap Concentrated Fund, the Board discussed the following factors:
a) Nature, Extent and Quality of Services. The Trustees considered the nature, extent and quality of the services provided by the Adviser under the Management Agreement, including a review of the services provided thereunder and the Adviser’s capabilities and mission to serve its clients through a disciplined intrinsic-value-based approach to investment that aligns the Adviser’s interests with those of its clients. The Trustees noted the qualifications of the investment staff and other key personnel of the Adviser and that the Adviser continues to invest significant resources in human capital to attract and retain top talent. The Trustees noted
Diamond Hill Funds Other Items June 30, 2021 (Unaudited) (Continued)
DIAMOND HILL FUNDS | SEMI-ANNUAL REPORT | JUNE 30, 2021 | DIAMOND-HILL.COM 141
that the proposed portfolio managers for the Large Cap Concentrated Fund had extensive experience in managing a large cap concentrated strategy. The Trustees also reviewed the Adviser’s succession plan for key investment and management staff. In addition, the Trustees reviewed information related to the compensation structure for portfolio managers and other key investment personnel. Finally, the Trustees noted that the Adviser provides administrative services to the Trust under an Amended and Restated Administrative, Fund Accounting and Transfer Agency Services Agreement (“Administration Agreement”). Taking this information into account, the Board expressed its satisfaction with the quality of services provided by the Adviser.
b) Investment Performance of the Fund. In evaluating performance, the Trustees reviewed the Adviser’s composite large cap concentrated strategy performance information and noted the composite outperformed the Russell 1000 Value Index and the Diamond Hill Large Cap Fund’s Class I shares over all time periods.
c) Reasonableness of Investment Advisory Fees. The Trustees noted that the contractual fee rate under the Management Agreement was below both the average and median rates of the Morningstar Large Value Category.
d) Reasonableness of Total Expenses. The Trustees noted that the estimated total expenses of each class of shares of the Large Cap Concentrated Fund was below the average and median total expenses of the Morningstar Large Value Category.
e) Profitability. The Trustees considered the profitability of the Adviser’s future relationship with the Large Cap Concentrated Fund. The Adviser discussed the level of assets the Large Cap Concentrated Fund will need to reach before becoming profitable. As such, the Adviser represented that the Large Cap Concentrated Fund will likely not generate a profit until a performance track record has been established and asset growth begins to increase in line with expectations which is about 3 – 5 years. The Trustees noted that the Adviser is also the administrator to the Large Cap Concentrated Fund and the Trustees had previously reviewed a separate profitability analysis relating to the administrative services provided to all funds of the Trust. The Trustees concluded that the profit margin under the Administration Agreement represented a fair and entrepreneurial profit for serving as administrator to the Funds.
f) Economies of Scale. The Trustees had previously reviewed the potential extent to which economies of scale would be realized as each of the other funds in the Trust grow and whether fee levels reflect these economies of scale for the benefit of Fund shareholders. They noted that while many advisory firms reduce fees as assets under management increase with predetermined break points, the Adviser has adopted a different strategy. The Trustees considered that rather than instituting break points, the Adviser has targeted its advisory fees to correspond to its mission to add value, meaning that rather than charging a lower fee on assets above a certain level, the Adviser prefers to close a strategy to new investors so that it
Diamond Hill Funds Other Items June 30, 2021 (Unaudited) (Continued)

142 DIAMOND HILL FUNDS | SEMI-ANNUAL REPORT | JUNE 30, 2021 | DIAMOND-HILL.COM
can efficiently manage the Fund’s assets and attempt to fulfill its responsibility to add value to existing investors. The Trustees noted that two of the Funds are currently closed to most new investors.
g) Ancillary Benefits. The Trustees noted that as administrator to the Funds the Adviser is expected to earn fees from the Funds for providing administrative services.
In their deliberations, there was a comprehensive consideration of each of the factors above in connection with the Large Cap Concentrated Fund, and the Trustees, all of whom qualify as Independent Trustees under the 1940 Act, concluded the compensation to be received by the Adviser from the Large Cap Concentrated Fund was in the best interests of the Large Cap Concentrated Fund and its shareholders.
Diamond Hill Funds Other Items June 30, 2021 (Unaudited) (Continued)
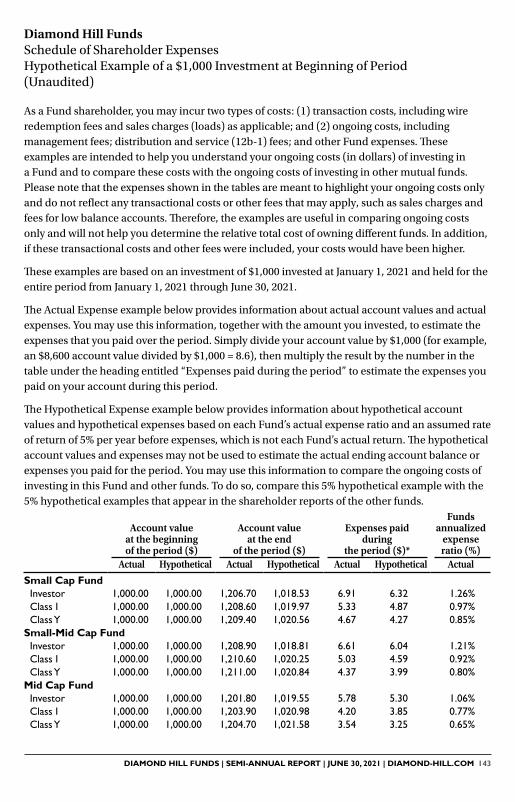
DIAMOND HILL FUNDS | SEMI-ANNUAL REPORT | JUNE 30, 2021 | DIAMOND-HILL.COM 143
Diamond Hill Funds Schedule of Shareholder Expenses Hypothetical Example of a $1,000 Investment at Beginning of Period (Unaudited)
As a Fund shareholder, you may incur two types of costs: (1) transaction costs, including wire redemption fees and sales charges (loads) as applicable; and (2) ongoing costs, including management fees; distribution and service (12b-1) fees; and other Fund expenses. These examples are intended to help you understand your ongoing costs (in dollars) of investing in a Fund and to compare these costs with the ongoing costs of investing in other mutual funds. Please note that the expenses shown in the tables are meant to highlight your ongoing costs only and do not reflect any transactional costs or other fees that may apply, such as sales charges and fees for low balance accounts. Therefore, the examples are useful in comparing ongoing costs only and will not help you determine the relative total cost of owning different funds. In addition, if these transactional costs and other fees were included, your costs would have been higher.
These examples are based on an investment of $1,000 invested at January 1, 2021 and held for the entire period from January 1, 2021 through June 30, 2021.
The Actual Expense example below provides information about actual account values and actual expenses. You may use this information, together with the amount you invested, to estimate the expenses that you paid over the period. Simply divide your account value by $1,000 (for example, an $8,600 account value divided by $1,000 = 8.6), then multiply the result by the number in the table under the heading entitled “Expenses paid during the period” to estimate the expenses you paid on your account during this period.
The Hypothetical Expense example below provides information about hypothetical account values and hypothetical expenses based on each Fund’s actual expense ratio and an assumed rate of return of 5% per year before expenses, which is not each Fund’s actual return. The hypothetical account values and expenses may not be used to estimate the actual ending account balance or expenses you paid for the period. You may use this information to compare the ongoing costs of investing in this Fund and other funds. To do so, compare this 5% hypothetical example with the 5% hypothetical examples that appear in the shareholder reports of the other funds.
Account value at the beginning of the period ($)
Account value at the end
of the period ($)
Expenses paid during
the period ($)*
Funds annualized
expense ratio (%)
Actual Hypothetical Actual Hypothetical Actual Hypothetical Actual
Small Cap FundInvestor 1,000�00 1,000�00 1,206�70 1,018�53 6�91 6�32 1�26%Class I 1,000�00 1,000�00 1,208�60 1,019�97 5�33 4�87 0�97%Class Y 1,000�00 1,000�00 1,209�40 1,020�56 4�67 4�27 0�85%
Small-Mid Cap FundInvestor 1,000�00 1,000�00 1,208�90 1,018�81 6�61 6�04 1�21%Class I 1,000�00 1,000�00 1,210�60 1,020�25 5�03 4�59 0�92%Class Y 1,000�00 1,000�00 1,211�00 1,020�84 4�37 3�99 0�80%
Mid Cap FundInvestor 1,000�00 1,000�00 1,201�80 1,019�55 5�78 5�30 1�06%Class I 1,000�00 1,000�00 1,203�90 1,020�98 4�20 3�85 0�77%Class Y 1,000�00 1,000�00 1,204�70 1,021�58 3�54 3�25 0�65%

144 DIAMOND HILL FUNDS | SEMI-ANNUAL REPORT | JUNE 30, 2021 | DIAMOND-HILL.COM
Diamond Hill Funds Schedule of Shareholder Expenses Hypothetical Example of a $1,000 Investment at Beginning of Period (Unaudited) (Continued)
Account value at the beginning of the period ($)
Account value at the end
of the period ($)
Expenses paid during
the period ($)*
Funds annualized
expense ratio (%)
Actual Hypothetical Actual Hypothetical Actual Hypothetical Actual
Large Cap FundInvestor 1,000�00 1,000�00 1,151�20 1,020�03 5�12 4�81 0�96%Class I 1,000�00 1,000�00 1,153�10 1,021�47 3�58 3�36 0�67%Class Y 1,000�00 1,000�00 1,153�60 1,022�06 2�94 2�76 0�55%
Large Cap Concentrated Fund **Investor 1,000�00 1,000�00 1,098�00 1,020�04 3�44 4�80 0�96%Class I 1,000�00 1,000�00 1,099�00 1,021�48 2�40 3�35 0�67%Class Y 1,000�00 1,000�00 1,099�00 1,022�08 1�97 2�75 0�55%
All Cap Select FundInvestor 1,000�00 1,000�00 1,223�00 1,019�04 6�40 5�81 1�16%Class I 1,000�00 1,000�00 1,225�30 1,020�47 4�81 4�37 0�87%Class Y 1,000�00 1,000�00 1,226�20 1,021�06 4�15 3�77 0�75%
Long-Short FundInvestor 1,000�00 1,000�00 1,131�70 1,015�58 9�82 9�28 1�86%Class I 1,000�00 1,000�00 1,133�20 1,017�02 8�29 7�84 1�57%Class Y 1,000�00 1,000�00 1,134�10 1,017�62 7�66 7�24 1�45%
Global FundInvestor 1,000�00 1,000�00 1,111�50 1,019�20 5�91 5�65 1�13%Class I 1,000�00 1,000�00 1,112�30 1,020�64 4�39 4�20 0�84%Class Y 1,000�00 1,000�00 1,112�90 1,021�23 3�76 3�60 0�72%
International FundInvestor 1,000�00 1,000�00 1,146�60 1,019�15 6�06 5�70 1�14%Class I 1,000�00 1,000�00 1,148�30 1,020�59 4�52 4�25 0�85%Class Y 1,000�00 1,000�00 1,149�60 1,021�18 3�88 3�65 0�73%
Short Duration Fund Investor 1,000�00 1,000�00 1,021�50 1,020�78 4�06 4�06 0�81%Class I 1,000�00 1,000�00 1,023�10 1,022�22 2�61 2�61 0�52%Class Y 1,000�00 1,000�00 1,022�70 1,022�81 2�01 2�01 0�40%
Core Bond Fund Investor 1,000�00 1,000�00 988�80 1,021�03 3�74 3�80 0�76%Class I 1,000�00 1,000�00 990�10 1,022�46 2�32 2�36 0�47%Class Y 1,000�00 1,000�00 989�90 1,023�06 1�73 1�76 0�35%

DIAMOND HILL FUNDS | SEMI-ANNUAL REPORT | JUNE 30, 2021 | DIAMOND-HILL.COM 145
Account value at the beginning of the period ($)
Account value at the end
of the period ($)
Expenses paid during
the period ($)*
Funds annualized
expense ratio (%)
Actual Hypothetical Actual Hypothetical Actual Hypothetical Actual
Corporate Credit FundInvestor 1,000�00 1,000�00 1,026�20 1,020�27 4�58 4�57 0�91%Class I 1,000�00 1,000�00 1,027�90 1,021�71 3�13 3�12 0�62%Class Y 1,000�00 1,000�00 1,028�50 1,022�30 2�53 2�52 0�50%
High Yield FundInvestor 1,000�00 1,000�00 1,037�80 1,020�04 4�85 4�81 0�96%Class I 1,000�00 1,000�00 1,040�10 1,021�47 3�39 3�36 0�67%Class Y 1,000�00 1,000�00 1,039�60 1,022�06 2�79 2�76 0�55%
* Expenses are equal to the Fund’s annualized net expense ratio, multiplied by the average account value overtheperiod,multipliedbythenumberofdaysinthemostrecentfiscalhalf-yeardividedbythenumberofdaysinthefiscalyear(toreflecttheone-halfyearperiod).
** Actual expenses for Large Cap Concentrated Fund are equal to the Fund’s annualized net expense ratio, multipliedbytheaverageaccountvalueovertheperiod,multipliedby125/365(toreflecttheperiodsinceinception)�
You can find more information about the Fund’s expenses, including annual expense ratios for historical periods in the Financial Highlights section of this report. For additional information on operating expenses and other shareholder costs, please refer to the Fund’s prospectus. The prospectus presents hypothetical shareholder costs over various time periods based upon a $10,000 investment and a return of 5% a year. The standardized example, which appears in all mutual fund prospectuses, may be useful to you in comparing the costs of investing in different funds.
Diamond Hill Funds Schedule of Shareholder Expenses Hypothetical Example of a $1,000 Investment at Beginning of Period (Unaudited) (Continued)
146 DIAMOND HILL FUNDS | SEMI-ANNUAL REPORT | JUNE 30, 2021 | DIAMOND-HILL.COM
Diamond Hill Funds Operation and Effectiveness of the Funds’ Liquidity Risk Management Program (Unaudited)
The Securities and Exchange Commission adopted Rule 22e-4 under the Investment Company Act of 1940, as amended (the “Liquidity Rule”), to promote effective liquidity risk management throughout the open-end investment company industry, thereby reducing the risk that funds will be unable to meet their redemption obligations and mitigating dilution of the interests of fund shareholders.
The Diamond Hill Funds Board of Trustees (the “Board”) met on May 20, 2021 (the
“Meeting”) to review the liquidity risk management program (the “Program”) applicable to the Diamond Hill Funds (each, a “Fund”), pursuant to the Liquidity Rule. The Board has appointed the Diamond Hill Capital Management, Inc. Valuation & Liquidity Committee (the “Committee”) as the program administrator for the Program. At the Meeting, the Committee provided the Board with a report that addressed the operation of the Program and assessed its adequacy and effectiveness of implementation, and any material changes to the Program (the “Report”). The Report covered the period from April 1, 2020 through March 31, 2021 (the “Program Reporting Period”).
The Report described the Program’s liquidity classification methodology for categorizing a Fund’s investments into one of four liquidity buckets: Highly Liquid, Moderately Liquid, Less Liquid and Illiquid. These classifications are reported to the SEC on Form N-PORT.
The Report noted that the Program complied with the key factors for consideration under the Liquidity Rule for assessing, managing and periodically reviewing a Fund’s liquidity risk, as follows:
A. The Fund’s investment strategy and liquidity of portfolio investments during both normal and reasonably foreseeable stressed conditions: During the Program Reporting Period, the Committee reviewed whether each Fund’s strategy is appropriate for an open-end fund structure. The Committee also factored a Fund’s concentration in an issuer into the liquidity analysis by taking issuer position sizes into account.
B. Short-term and long-term cash flow projections during both normal and reasonably foreseeable stressed conditions: During the Program Reporting Period, the Committee reviewed historical gross redemption activity and used this information as a component to establish each Fund’s reasonably anticipated trading size (“RATS”). The Committee also considered a Fund’s shareholder ownership concentration, a Fund’s distribution channels, and the likelihood of advance notice for large redemptions.
C. Holdings of cash and cash equivalents, as well as borrowing arrangements: The Committee considered the terms of the credit facility applicable to the Funds, the financial health of the institution providing the facility and the fact that the credit facility is shared among multiple Funds. The Committee also considered other types of borrowing available to the Funds, such as the ability to use interfund lending. Each Fund has adopted an in-kind redemption policy which may be utilized to meet larger redemption requests.

DIAMOND HILL FUNDS | SEMI-ANNUAL REPORT | JUNE 30, 2021 | DIAMOND-HILL.COM 147
Diamond Hill Funds Operation and Effectiveness of the Funds’ Liquidity Risk Management Program (Unaudited) (Continued)
There were no material changes to the Program during the Program Reporting Period. The Report provided to the Board stated that the Committee concluded that based on the operation of the functions, as described in the Report, the Program is operating as intended and is effective in implementing the requirements of the Liquidity Rule.

148 DIAMOND HILL FUNDS | SEMI-ANNUAL REPORT | JUNE 30, 2021 | DIAMOND-HILL.COM
(Page intentionally left blank)

DIAMOND HILL FUNDS | SEMI-ANNUAL REPORT | JUNE 30, 2021 | DIAMOND-HILL.COM 149
(Page intentionally left blank)

INVESTMENT ADVISER: DIAMOND HILL CAPITAL MANAGEMENT, INC� DISTRIBUTOR: FORESIDE FINANCIAL SERVICES, LLC (MEMBER FINRA)
DIAMOND-HILL.COM | 855.255.8955 | 325 JOHN H. MCCONNELL BLVD | SUITE 200 | COLUMBUS, OHIO | 43215
DH-SAR063021
Related Documents


